Embed Size (px)
Citation preview
lable at ScienceDirect
Renewable Energy 85 (2016) 610e619
Contents lists avai
Renewable Energy
journal homepage: www.elsevier .com/locate/renene
Socio-economic impacts of a local bioenergy-based developmentstrategy e The case of Pielinen Karelia, Finland
Olli Lehtonen a, Lasse Okkonen b, *
a Natural Resources Institute Finland, Rural Policy and Research, Helsinki, Finlandb Karelia University of Applied Sciences, Energy and Environmental Technology, Joensuu, Finland
a r t i c l e i n f o
Article history:Received 7 February 2014Received in revised form6 May 2015Accepted 4 July 2015Available online 17 July 2015
Keywords:Socio-economic impactsRegional inputeoutput modellingBioenergyPlace-based development
* Corresponding author.E-mail addresses: [email protected] (O. Lehton
(L. Okkonen).
http://dx.doi.org/10.1016/j.renene.2015.07.0060960-1481/© 2015 Elsevier Ltd. All rights reserved.
a b s t r a c t
The regional bioeconomy has great importance for generating socio-economic impacts, especially insparsely populated resource peripheries. The benefits include increased employment and income andimproved security of supply. In this study, the modified regional inputeoutput model of North Karelia,Finland is applied for analysing the socio-economic impacts of a bioenergy-based local developmentstrategy. The results indicate significant socio-economic benefits of a local development strategy basedon bioenergy. This benefit is corroborated by approximately 12 million euros in annual income impactsand 280 personnel working years in the district. New stimuli in a currently declining municipality couldpotentially break negative path dependency. New bioenergy and bioeconomic developments arepromising solutions for the construction of place-based regional development in resource peripheries.
© 2015 Elsevier Ltd. All rights reserved.
1. Introduction
In the current phase of regional development in many sparselypopulated European regions, economic stimuli are welcomed inrural settings [1e3]. Investing in the bioeconomy by offering jobsalso “ties up” people in the sparsely populated regions withpersistent, negative net migration rates and increases the possi-bilities for resource utilisation in the future [2]. From theperspective of regional development, the bioeconomy is importantas it can establish new production systems across stagnating ruralregions whose populations are dispersed [4e7]. Increased in-vestments and improved utilisation of resources could slow downthe decline happening in extensive rural areas by providing jobsand offering higher incomes, thereby helping to achieve a morevital demographic structure and better provision of services. Abioeconomy is well suited to peripheral areas because the in-dustries entering new regions tend to relate to pre-existing in-dustries [8]. However, the socioeconomic impacts are widelyunknown as is the possibility of bioeconomic investments trans-forming negative areal development paths into positive ones.
The uneven development of regions has led to widespread
en), [email protected]
regional differences in Finland between rural and urban areas. Forexample, the descriptive analysis about the balance of net migra-tion and unemployment levels has indicated that net migration hasnot been able to equalise unemployment differences betweengrowing university regions and municipalities in the eastern andnorthern parts of Finland, resulting in persistent regional differ-ences in unemployment [9,10]. When the local workforce is notparticularly mobile, studies have shown that creating local jobopportunities appears to be the best way to increase employmentamong disadvantaged workers [11e13]; however, more research isneeded to identify successful local development strategies, as wellas an assessment of the impacts on regions and their developmentpaths. One possibility is locally promoted entrepreneurship andsmall business development, which has proved to be promising inrural and lagging regions [14,15]. Other studies have highlightedthe role of external shocks as a solution for prevailing negative lock-in in rural regions [6,8,16].
The referred place-based argument suggests that developmentstrategies should, therefore, focus on mechanisms that build onlocal capabilities and promote innovative ideas through the inter-action of local and general knowledge and endogenous and exog-enous actors in the design and delivery of public policies [17]. Place-appropriate development policy recognises that rural areas havedifferent amenities and face different challenges [12,18e21]. Itsstarting point is that if a development policy fails to recognise thesechanging local potentials, it makes a passive contribution to rural

O. Lehtonen, L. Okkonen / Renewable Energy 85 (2016) 610e619 611
decline [22]. Rural areas have many assets that are highly valuedwithin the contemporary global economy, such as access to re-sources, natural amenities, a high quality of life, and inexpensiveland [22]. However, studies evaluating the effectiveness and suc-cess of local municipal development strategies, in terms of socio-economic conditions, are missing.
The aim of this paper is to study the socioeconomic impactsrelated to place-based development strategy in the bioeconomy,focusing on a large-scale biochar factory and its associated in-dustries. The analysis focuses on the impacts of the developmentstrategy on the incomes and employment in a small peripheralmunicipality in Pielinen Karelia, Finland. The analysed develop-ment strategy of the bioeconomy is an example of place-basedpolicy, including local actors and the knowledge of industrial her-itage and processing, as well as global investments that supportlocal natural resource utilisationwith new technology. In this paperwe seek to answer what sort of impact does the income andemployment development strategy have on the municipality andits sub-region, and what are the possibilities of the local develop-ment strategy changing the current paths of regional developmentin the study area. With these questions we assess the success of thedevelopment strategy and discuss its pros and cons. We focus ouranalysis on the municipality of Nurmes, which is a small traditionalindustrial town in the resource periphery challenged by the nega-tive lock-in of local development.
In the following chapters, we describe the development pro-cesses and the development strategy of the study area. Next, wepresent a technical description of the biochar factory and the in-vestment data and procedure for calculating the socioeconomicimpacts of the development strategy. We subsequently present theresults of the analysis, and in the final section, we discuss the re-sults of the study and indicate their theoretical, methodological,and practical implications.
2. Study area: sparsely populated peripheral region
The case study area is located in North Karelia � one of 19 re-gions in Finland with an approximate size two-thirds of that ofBelgium. North Karelia is located in a coniferous zone in the east-ernmost part of the country; its resource assets are highly based onforest resources as forests cover approximately 85% (1.5 mil. ha) ofthe land area. The annual cutting in 2011 for round wood was 4.766million m3, whereas the maximum sustainable cutting was 5.75million m3, indicating that there are nearly 1 million m3 of unusedforest resources in the region upon which to build new bio-economic investments [23]. Pine (Pinus sylvestris) is the dominanttree. In addition, spruce (Picea abies) and birches (B. pendula and B.pubescens) are common. Characterized by its abundant forest re-sources North Karelia is an example of a resource-dependent NUTS3-level region in northern Europe, increasingly supported by state-led innovation policy and various regional policy projects. It is alsoan example of a single-nodal region where positive developmenthas primarily concentrated around the growing Joensuu region.Three quarters of the region's 165,000 inhabitants are concentratedin the regional capital, Joensuu, and its vicinity. While the popu-lation of Joensuu has grown to 75,000 inhabitants, all the otherurban areas and rural municipalities outside Joensuu have laggedbehind [2,24]. The growth of the Joensuu area is connected with itssuccess, including the generation and attraction of enterprises, thegrowth of the university and its spin-offs and globalisation im-pulses experienced by industries. The regional centre is also sup-ported by urban and innovation policies. Metal products aremanufactured in Joensuu, including, for example, forest machinery,locks and locking systems.
The municipality of Nurmes belongs to a sub-region of Pielinen
Karelia. It is categorised as a resource periphery because its eco-nomic base is still dependent on the processing of local naturalresources such as agriculture, forestry, mining, and themanufacturing of wood and food products. The economic structureof Pielinen Karelia is strongly dependent on primary and secondaryindustries as approximately 20% of the jobs are in primary in-dustries and 16% of the jobs are in secondary industries. In theJoensuu region the corresponding proportions are 5 and 17%,respectively [25]. The strengths of Nurmes include the metal andwood industries and the food product industry as well as thetourism industry around Lake Pielinen and its attractions. Nurmesis located approximately 125 km north of Joensuu, and it is char-acterised by declining employment and a high unemployment rate.The negative development in Nurmes indicates that the localeconomy has not benefited from the growing Joensuu regionwherethe number of jobs increased in the period 2007e2012 by 2102jobs. No data are available regarding the connectedness of thePielinen Karelia economy to the Joensuu region, but internationalstudies have shown that spill-over effects are geographicallylimited and their potential extends 80 km from the centre [26],even though the impact and strength of spill-overs vary by industry[27].
2.1. Regional development processes in the study region
The study region, Pielinen Karelia, is a typical example of aresource periphery confronting various simultaneously occurringdevelopment problems: depopulation, declining employment andhigh unemployment. Depopulation has been severe in PielinenKarelia. Since 2000, the population has decreased by 16.5%,numbering 23,381 inhabitants in 2011. In the municipality ofNurmes the population decrease was 14.5%, and the total popula-tion in 2011 was 8,359 inhabitants. Another negative feature of thedwindling population is that, simultaneously, the population isgetting older. In Pielinen Karelia, due to selective out migration, theproportion of individuals older than 64 years, compared to the totalpopulation, has increased since 2000 from 20.5 % to 29.4 % in 2013[28]. The root of the negative out migration is the high local un-employment rates, which were higher than in the Joensuu region.In 2011, the unemployment rates were 17.9% in Pielinen Karelia and16.9% in Nurmes, whereas in the Joensuu region, the unemploy-ment rate was 14.0% [25]. The higher unemployment rates are alsoreflected in the lower income levels. In 2011, the average income ofPielinen Karelia was 28,823 euros, which was 11.6% smaller than inthe Joensuu region, where the average income was 32,607 euros.
The high unemployment rates reflect the problems of thedeclining economy in Pielinen Karelia, which lost 108 jobs during2007e2012. The declining trajectory is related to the rationalisationof the primary industries in agriculture (166 jobs lost in the period2007e2012) and the maturation of traditional industries related tonatural resource utilisation, such as the production of sawn timberand its refinement (192 jobs lost) [25,29]. Depopulation also seemsto be a reason for the decline of employment in some service in-dustries: construction (56 jobs lost), wholesale and retail trade (60jobs lost) and education (34 jobs lost) [25]. However, simulta-neously, some industries have grown. Most of this growth has beenin the area of health and social work, which has increased thenumber of jobs as a result of an aging population (160 jobs gained).Compared with the growing Joensuu region, the obstacles to pos-itive development in Pielinen Karelia are related to a lack of anagglomeration of economies, no growth-exposed economic struc-ture and few young and educated workers oriented to entrepre-neurship [29]. The replacement of jobs has been low because theselocal disadvantages have led to a low competitiveness, which doesnot support the renewal of the economic structure. In statistical
O. Lehtonen, L. Okkonen / Renewable Energy 85 (2016) 610e619612
simulations, Pielinen Karelia had comparable growth probabilitieswith the growing Joensuu region only when new jobs were basedon natural amenities [29]. The employment statistics support thesimulation results as the number of jobs in Pielinen Karelia hasgrown in forestry (72 jobs added) and in hotels and restaurants (57jobs added) [25].
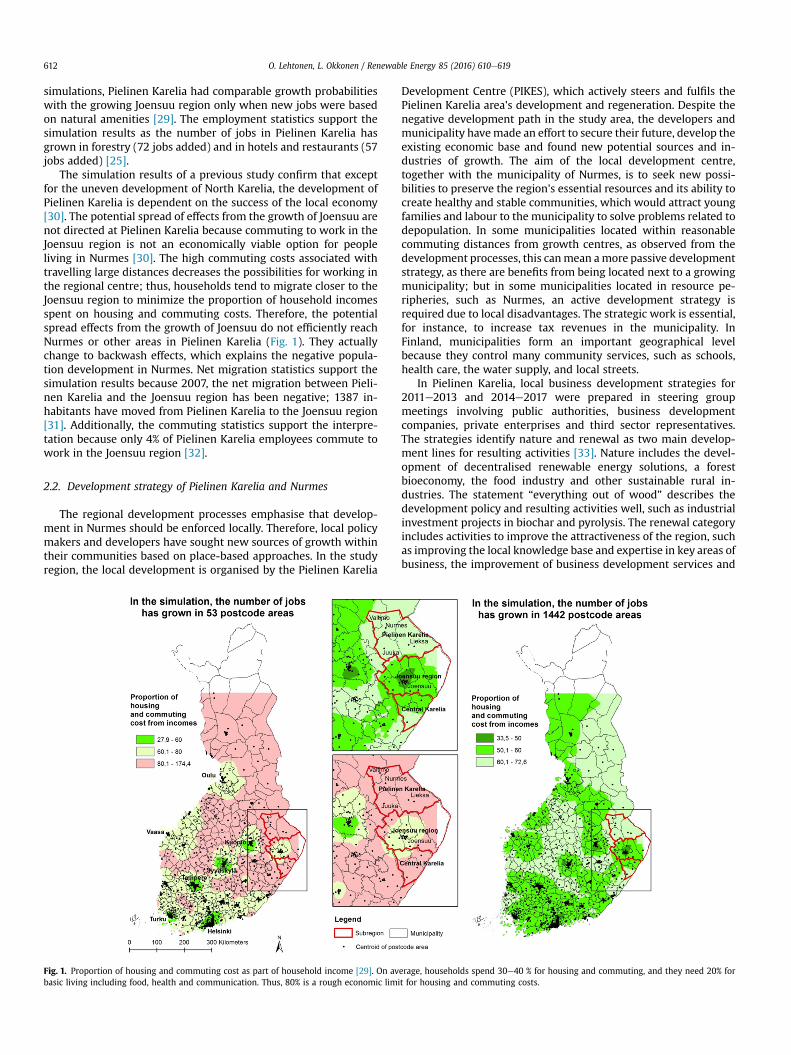
The simulation results of a previous study confirm that exceptfor the uneven development of North Karelia, the development ofPielinen Karelia is dependent on the success of the local economy[30]. The potential spread of effects from the growth of Joensuu arenot directed at Pielinen Karelia because commuting to work in theJoensuu region is not an economically viable option for peopleliving in Nurmes [30]. The high commuting costs associated withtravelling large distances decreases the possibilities for working inthe regional centre; thus, households tend to migrate closer to theJoensuu region to minimize the proportion of household incomesspent on housing and commuting costs. Therefore, the potentialspread effects from the growth of Joensuu do not efficiently reachNurmes or other areas in Pielinen Karelia (Fig. 1). They actuallychange to backwash effects, which explains the negative popula-tion development in Nurmes. Net migration statistics support thesimulation results because 2007, the net migration between Pieli-nen Karelia and the Joensuu region has been negative; 1387 in-habitants have moved from Pielinen Karelia to the Joensuu region[31]. Additionally, the commuting statistics support the interpre-tation because only 4% of Pielinen Karelia employees commute towork in the Joensuu region [32].
2.2. Development strategy of Pielinen Karelia and Nurmes
The regional development processes emphasise that develop-ment in Nurmes should be enforced locally. Therefore, local policymakers and developers have sought new sources of growth withintheir communities based on place-based approaches. In the studyregion, the local development is organised by the Pielinen Karelia
Fig. 1. Proportion of housing and commuting cost as part of household income [29]. On avbasic living including food, health and communication. Thus, 80% is a rough economic limi
Development Centre (PIKES), which actively steers and fulfils thePielinen Karelia area's development and regeneration. Despite thenegative development path in the study area, the developers andmunicipality havemade an effort to secure their future, develop theexisting economic base and found new potential sources and in-dustries of growth. The aim of the local development centre,together with the municipality of Nurmes, is to seek new possi-bilities to preserve the region's essential resources and its ability tocreate healthy and stable communities, which would attract youngfamilies and labour to the municipality to solve problems related todepopulation. In some municipalities located within reasonablecommuting distances from growth centres, as observed from thedevelopment processes, this canmean amore passive developmentstrategy, as there are benefits from being located next to a growingmunicipality; but in some municipalities located in resource pe-ripheries, such as Nurmes, an active development strategy isrequired due to local disadvantages. The strategic work is essential,for instance, to increase tax revenues in the municipality. InFinland, municipalities form an important geographical levelbecause they control many community services, such as schools,health care, the water supply, and local streets.
In Pielinen Karelia, local business development strategies for2011e2013 and 2014e2017 were prepared in steering groupmeetings involving public authorities, business developmentcompanies, private enterprises and third sector representatives.The strategies identify nature and renewal as two main develop-ment lines for resulting activities [33]. Nature includes the devel-opment of decentralised renewable energy solutions, a forestbioeconomy, the food industry and other sustainable rural in-dustries. The statement “everything out of wood” describes thedevelopment policy and resulting activities well, such as industrialinvestment projects in biochar and pyrolysis. The renewal categoryincludes activities to improve the attractiveness of the region, suchas improving the local knowledge base and expertise in key areas ofbusiness, the improvement of business development services and
erage, households spend 30e40 % for housing and commuting, and they need 20% fort for housing and commuting costs.
O. Lehtonen, L. Okkonen / Renewable Energy 85 (2016) 610e619 613
the strategic planning of new tailored industrial areas. The devel-opment strategy includes a number of development activities, bothpublic and private, and it acknowledges that industrial develop-ment is a driver of structural change in the process of economicdevelopment.
In our study area, the municipality of Nurmes, activitiesincluded those supported by the public European Agricultural Fundfor Rural Development (EAFRD), co-financed project Pielinen Kar-elia Bioenergy Networks and Flows (2011e2014), and EuropeanRegional Development Fund (ERDF) projects Grow Green Nurmes(2013e2014) and Industrial Symbioses (2015e2017). The first ac-tivity focused on the generation of new business in decentralisedrenewables, such as farm-scale combined heat and power andbiogas. The second was a spin-off of the first: an industrial-areadevelopment project in the town of Nurmes to support the estab-lishment of a large-scale biochar factory, nearby terminal opera-tions and processing industries. The development work continuesin the Industrial Symbioses project including activities to supportthe development of new industrial areas. The public developmentprojects provide expertise and planning support for the privateinvestments, which are forecasted to be approximately 40 millioneuros in the Nurmes area by 2016. In addition, the neighbouringmunicipality of Lieksa has plans for similar development projects,such as a fast pyrolysis plant using forest industry by-products.
In Nurmes, projects are based on both local advantages (such asbiomass resources and transportation connections) and attractionpolicies (available industrial sites, development funding and sup-port in planning processes) that seek new tax income andemployment. There is evidence that attraction policies ofteninclude considerable local development costs, and benefits canflow outside the region [34]. In the planning phase, the risk ofproject failure and the associated costs of land-use planning andapplying permissions remains largely with the local authority. Inaddition, stand-alone biorefineries can be vulnerable to marketfluctuations, such as the price of fossil fuel oil or charcoal. InNurmes, risks are identified and reduced by utilising externalregional development funds in planning, considering opportunitiesfor increased local ownership and contracting, and through novelupgrading processes that result in intermediate products (biocharand fluids) suitable for multiple final material and energy products.In this study, we focus on the forthcoming investments in theNurmes area to elucidate the potential socio-economic impacts ofthe municipality's development strategy.
2.3. Characteristics of the biochar industry in Nurmes
Renewable energy-related investments included in the analysesfocus primarily on the planned industrial area of Pitk€am€aki, Nurmes.The biochar production plant will be based on a slow pyrolysis pro-cess, with four steps of pyrolysis reactors and condensing units, and aheating rate that increases from 110 �C to 600 �C. The products arebiochar (32% of dry matter), bio-oil and other distillates (30e32 % ofdry matter) and non-condensing gases used as process energy [35].When operating at full scale, the plant will use upto 550,000 m3 ofenergy solids and round wood annually and produce up to 100,000tons of biochar and 95,000 tons of liquid products. The factory in-cludes an integrated 2 MWe combined heat and power (chp) plantbased on woodchips producing process energy and also heat andpower for the new industrial area. The industrial system includes awood fuel terminal delivering up to 50,000 m3 of woodchips, a railterminal and a wood material drying company. Investments alsoinclude two decentralised small-scale systems outside the Pitk€am€akiindustrial area: a farm-scale 140 kW (100 kW for heat and 40 kW forpower) chp-system based on woodchips and a locally manufacturedwooden villa and cottages with energy efficient structures and
renewable energy solutions.The background study for the Pitk€am€aki industrial area [35]
presents the estimated raw material base for biochar and bio-oilproduction in Nurmes. The raw materials include both roundwood (approximately 30%) and small-diameter energy wood fromthe thinnings (approximately 70%), with a diameter at breast height(dbh) varying between 2 and 28 cm [35]. Most of the raw material(energy wood) can be considered as surplus to the current con-sumption, primarily in the municipal district heating. However, theround wood that is greater than 16 cm dbh has a competing marketin the pulp mills, the nearest of which is located in Uimaharju,approximately 100 km south-east of Nurmes. According to [36] theraw material potential from Pielinen Karelia (Nurmes, Lieksa andValtimo) is approximately 150,000m3 and the potential fromNorthKarelia is 350,000 m3. In addition, significant raw material poten-tials are identified from the neighbouring regions of Nothern Savo(150,000 m3) and Kainuu, where the closure of a Kajaani paper millin 2008 reduced the use of round wood by approximately200,000 m3/a. The projected new demand is mostly based on thesurplus of rawmaterials and compensates for the earlier reductionsin pulp production capacity. Therefore, the resulting employmentand income impacts can be considered positive for the regionaldevelopment.
3. Data and methods for analysing the socioeconomicimpacts of the municipal development strategy
3.1. Investments related to the development strategy
The development strategy data for the socio-economic impactmodelling were gathered directly from the companies preparingthe investments in the area. The data include investment budgetsspecified in detail, organised by sectors. The investments aredetailed, allowing for an estimate of the shares of local investmentsand investments outside the North Karelia region. In conventionaloperations, such as land and house construction, the local invest-ment rate was approximately 80%, and in more advanced opera-tions (installations and production technologies) it wasapproximately 35%. These estimates came from the involvedcompanies and the authors. The companies also provided estimateson the annual use of raw materials and other primary purchases.The annual turnovers were based on production volumes and es-timates by company representatives. The infrastructure investmentdata were provided by Nurmes' planning department.
Table 1 includes the estimated investments related to themunicipal development strategy by industries and scenarios. Thescenarios depict the impact of the different production volumes ofthe biochar factory based on 175,000 m3, 350,000 m3 and525,000 m3 of forest raw-material use. The total investments in theconstruction phase vary between the scenarios from 11.183 to12.290 million euros. The impacts of the annual production on theregional economy are higher, as the increase in final demand variesbetween scenarios from 16.060 to 35.206 million euros (Table 1).
3.2. Modified inputeoutput model for socio-economic impacts
The socio-economic impacts related to the collected empiricalinvestments weremodelled with a modified regional inputeoutputmodel, which is a useful tool for elucidating the structure of theeconomy in terms of the flows of goods and services and for ana-lysing the impacts of changes in final demand [37]. The publicationof regional inputeoutput figures for 30 industries [38] made itpossible to evaluate the economic importance of the developmentstrategy investments and their annual impacts on employment andincomes in the North Karelia region. The economic model is based

Table 1Investments of the municipal development strategy by industry (million V).
Industry Scenario A Scenario B Scenario C
Investments of starting phaseManufacture of machinery and equipment 1.610 2.123 2.637Basic metals and metal products 0.091 0.091 0.091Manufacture of office machinery and computers 0.080 0.120 0.160Construction 5.815 5.815 5.815Site preparation 3.123 3.123 3.123Manufacture of wood and wood and cork products, except furniture,
and manufacture of articles from straw and plaiting materials0.149 0.149 0.149
Wholesale and retail trade 0.012 0.012 0.012Electricity, gas and heat supply 0.302 0.302 0.302Total investments 11.183 11.736 12.290Annual increase in final demandForestry and logging 6.139 10.899 16.339Electricity, gas and heat supply 9.000 13.500 18.000Manufacture of transport equipment 0.360 0.360 0.360Coke, refined petroleum products, chemicals, chemical products,
rubber and plastic products0.461 0.461 0.461
Hotels and restaurants 0.100 0.100 0.100Total 16.060 25.320 35.260
O. Lehtonen, L. Okkonen / Renewable Energy 85 (2016) 610e619614
on regional statistics, but most of the socioeconomic impact isconcentrated on Nurmes. The regional inputeoutput model forNorth Karelia is constructed from the relevant inputeoutput sta-tistics [38]. The base year of the regional inputeoutput tables inFinland is 2002. The vectors for gross outputs and final demand inthe region in 2010 were updated from the Regional Accounting[39], whereas the input coefficients describe the economic struc-ture as it was in 2002. The employment data are also updated for2010 [39].
The regional inputeoutput table was revised by dividing theconstruction sector into two sectors: house construction and sitepreparation, including energy and heat production as one sectorand households as another sector in the table. The inputeoutputcoefficients for site preparation were estimated using a simplelocation quotient (SLQ) technique [40]. Because it was difficult toacquire any exact data regarding biochar production processes, forsimplicity, we assumed that the production of biochar, apart fromfuel, would result in other inputs of energy production that aresimilar to those required by the already existing electricity, steamand hot water supply industries. This may be a rough assumption,but the coefficients are the best-available estimates because theproduction process has similarities with the burning of forest res-idues, and the operation and maintenance costs would not be verydifferent from those of existing plants. Household consumptionwas already included in the regional inputeoutput table producedby Statistics Finland, and the household income rowwas calculatedby taking the sum of wages, salaries and entrepreneur and capitalincomes in each sector. Entrepreneur and capital incomes wereestimated from the databases of Statistics Finland [41] and theFinnish Forest Research Institute [42]. Income transfers betweenhouseholds were estimated from national accounts [43]. Data onincome transfers from outside the households were obtained fromthe Social Insurance Institution of Finland [44]. The process ofconstructing the household row followed earlier studies [45].
Finally, a new input coefficient matrix, including the householdconsumption (hc) and income coefficient (hi) vectors and a scalarcross-term for transfers between households (h), was constitutedas
A ¼�A hchi h
�; (1)
and the augmented inputeoutput model was
x ¼�I � A
��1y; (2)
where the term A is an n$n matrix of input coefficients for n in-dustries; ðI � AÞ�1 is known as the Leontief inverse; the vector y isthe final demand for the output of each industry; and x is thecolumn vector of gross outputs for each industry. The revised inputcoefficient matrix (A) for 2002 consists of 33 industries.
The deployment of a Nurmes development strategy may havepositive effects on the regional labour market by, first, introducingdirect employment and, second, by supporting related industriesand the employment therein (e.g., the forestry and local/regionalrenewable energy technology providers, installers and serviceproviders) [46]. The multipliers used to estimate the income andemployment impacts are so-called type II multipliers that measuredirect, indirect and induced effects [47]. Direct impacts are theinitial, immediate economic activities generated by the project ordevelopment. Indirect impacts are changes in production,employment and income occurring in other businesses or in-dustries in the region that supply inputs to the project industry.Induced impacts are the effects of household spending in the localeconomy as the result of direct and indirect effects from economicactivity. Because households are included in the model and areassumed to generate demand for regional products, the multipliersare higher and more comprehensive than the coefficients of atraditional inputeoutput model containing only industries withouthouseholds. In the results section, for simplicity, the presentedindirect effects on employment and incomes include indirect andinduced effects.
4. Results: socio-economic impact of the developmentstrategy in Pielinen Karelia
4.1. Development strategy impact on income
The socioeconomic impacts related to the development strategywere analysed in two stages: first, impacts of the investments andsecondly, annual impacts of the new production. The income im-pacts indicate howmuch household incomes would increase in theregion due to the development strategy. Table 2 presents the in-come impacts of investments by industries. The total impacts of theinvestments related to the strategy vary from 6.7 to 7.2 millioneuros depending on the capacity of the biochar factory in scenarios
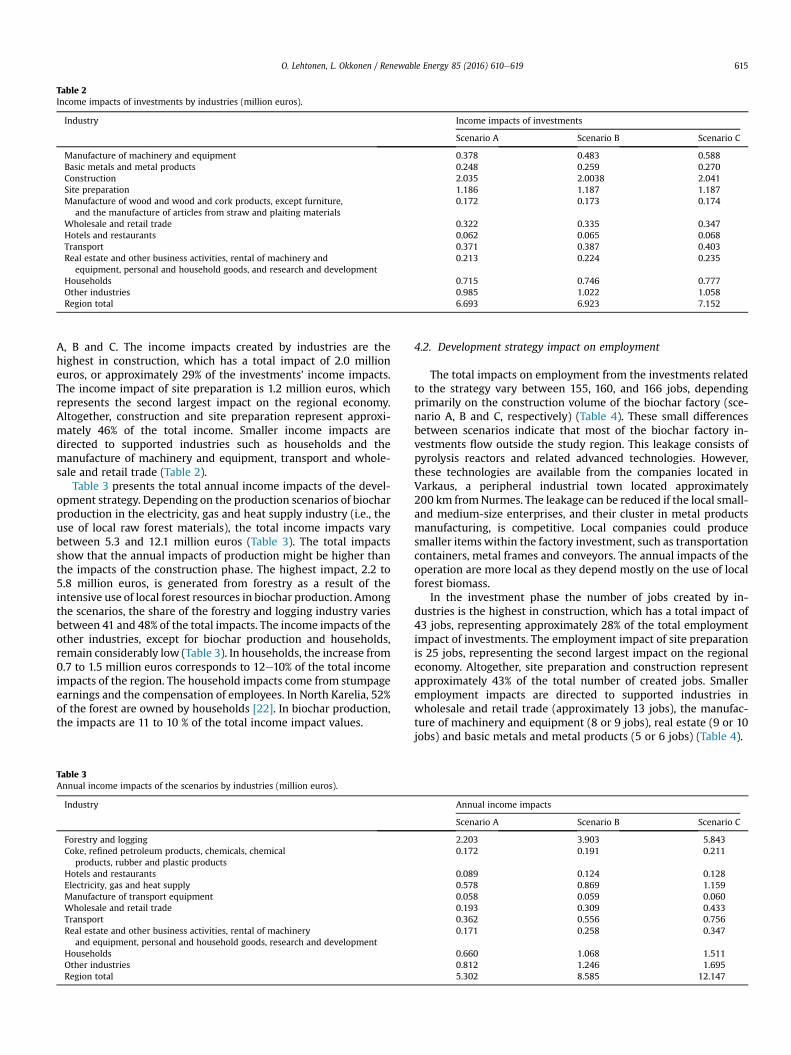
Table 2Income impacts of investments by industries (million euros).
Industry Income impacts of investments
Scenario A Scenario B Scenario C
Manufacture of machinery and equipment 0.378 0.483 0.588Basic metals and metal products 0.248 0.259 0.270Construction 2.035 2.0038 2.041Site preparation 1.186 1.187 1.187Manufacture of wood and wood and cork products, except furniture,
and the manufacture of articles from straw and plaiting materials0.172 0.173 0.174
Wholesale and retail trade 0.322 0.335 0.347Hotels and restaurants 0.062 0.065 0.068Transport 0.371 0.387 0.403Real estate and other business activities, rental of machinery and
equipment, personal and household goods, and research and development0.213 0.224 0.235
Households 0.715 0.746 0.777Other industries 0.985 1.022 1.058Region total 6.693 6.923 7.152
O. Lehtonen, L. Okkonen / Renewable Energy 85 (2016) 610e619 615
A, B and C. The income impacts created by industries are thehighest in construction, which has a total impact of 2.0 millioneuros, or approximately 29% of the investments' income impacts.The income impact of site preparation is 1.2 million euros, whichrepresents the second largest impact on the regional economy.Altogether, construction and site preparation represent approxi-mately 46% of the total income. Smaller income impacts aredirected to supported industries such as households and themanufacture of machinery and equipment, transport and whole-sale and retail trade (Table 2).
Table 3 presents the total annual income impacts of the devel-opment strategy. Depending on the production scenarios of biocharproduction in the electricity, gas and heat supply industry (i.e., theuse of local raw forest materials), the total income impacts varybetween 5.3 and 12.1 million euros (Table 3). The total impactsshow that the annual impacts of production might be higher thanthe impacts of the construction phase. The highest impact, 2.2 to5.8 million euros, is generated from forestry as a result of theintensive use of local forest resources in biochar production. Amongthe scenarios, the share of the forestry and logging industry variesbetween 41 and 48% of the total impacts. The income impacts of theother industries, except for biochar production and households,remain considerably low (Table 3). In households, the increase from0.7 to 1.5 million euros corresponds to 12e10% of the total incomeimpacts of the region. The household impacts come from stumpageearnings and the compensation of employees. In North Karelia, 52%of the forest are owned by households [22]. In biochar production,the impacts are 11 to 10 % of the total income impact values.
Table 3Annual income impacts of the scenarios by industries (million euros).
Industry
Forestry and loggingCoke, refined petroleum products, chemicals, chemical
products, rubber and plastic productsHotels and restaurantsElectricity, gas and heat supplyManufacture of transport equipmentWholesale and retail tradeTransportReal estate and other business activities, rental of machinery
and equipment, personal and household goods, research and developmentHouseholdsOther industriesRegion total
4.2. Development strategy impact on employment
The total impacts on employment from the investments relatedto the strategy vary between 155, 160, and 166 jobs, dependingprimarily on the construction volume of the biochar factory (sce-nario A, B and C, respectively) (Table 4). These small differencesbetween scenarios indicate that most of the biochar factory in-vestments flow outside the study region. This leakage consists ofpyrolysis reactors and related advanced technologies. However,these technologies are available from the companies located inVarkaus, a peripheral industrial town located approximately200 km fromNurmes. The leakage can be reduced if the local small-and medium-size enterprises, and their cluster in metal productsmanufacturing, is competitive. Local companies could producesmaller items within the factory investment, such as transportationcontainers, metal frames and conveyors. The annual impacts of theoperation are more local as they depend mostly on the use of localforest biomass.
In the investment phase the number of jobs created by in-dustries is the highest in construction, which has a total impact of43 jobs, representing approximately 28% of the total employmentimpact of investments. The employment impact of site preparationis 25 jobs, representing the second largest impact on the regionaleconomy. Altogether, site preparation and construction representapproximately 43% of the total number of created jobs. Smalleremployment impacts are directed to supported industries inwholesale and retail trade (approximately 13 jobs), the manufac-ture of machinery and equipment (8 or 9 jobs), real estate (9 or 10jobs) and basic metals and metal products (5 or 6 jobs) (Table 4).
Annual income impacts
Scenario A Scenario B Scenario C
2.203 3.903 5.8430.172 0.191 0.211
0.089 0.124 0.1280.578 0.869 1.1590.058 0.059 0.0600.193 0.309 0.4330.362 0.556 0.7560.171 0.258 0.347
0.660 1.068 1.5110.812 1.246 1.6955.302 8.585 12.147
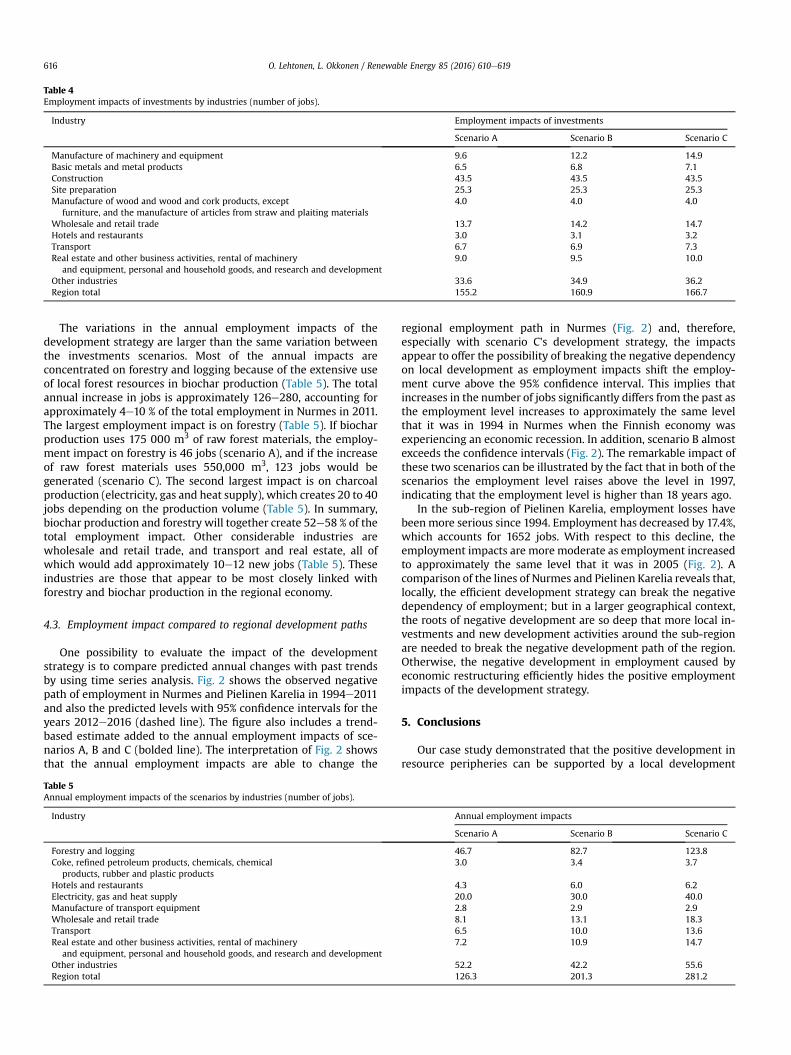
Table 4Employment impacts of investments by industries (number of jobs).
Industry Employment impacts of investments
Scenario A Scenario B Scenario C
Manufacture of machinery and equipment 9.6 12.2 14.9Basic metals and metal products 6.5 6.8 7.1Construction 43.5 43.5 43.5Site preparation 25.3 25.3 25.3Manufacture of wood and wood and cork products, except
furniture, and the manufacture of articles from straw and plaiting materials4.0 4.0 4.0
Wholesale and retail trade 13.7 14.2 14.7Hotels and restaurants 3.0 3.1 3.2Transport 6.7 6.9 7.3Real estate and other business activities, rental of machinery
and equipment, personal and household goods, and research and development9.0 9.5 10.0
Other industries 33.6 34.9 36.2Region total 155.2 160.9 166.7
O. Lehtonen, L. Okkonen / Renewable Energy 85 (2016) 610e619616
The variations in the annual employment impacts of thedevelopment strategy are larger than the same variation betweenthe investments scenarios. Most of the annual impacts areconcentrated on forestry and logging because of the extensive useof local forest resources in biochar production (Table 5). The totalannual increase in jobs is approximately 126e280, accounting forapproximately 4e10 % of the total employment in Nurmes in 2011.The largest employment impact is on forestry (Table 5). If biocharproduction uses 175 000 m3 of raw forest materials, the employ-ment impact on forestry is 46 jobs (scenario A), and if the increaseof raw forest materials uses 550,000 m3, 123 jobs would begenerated (scenario C). The second largest impact is on charcoalproduction (electricity, gas and heat supply), which creates 20 to 40jobs depending on the production volume (Table 5). In summary,biochar production and forestry will together create 52e58 % of thetotal employment impact. Other considerable industries arewholesale and retail trade, and transport and real estate, all ofwhich would add approximately 10e12 new jobs (Table 5). Theseindustries are those that appear to be most closely linked withforestry and biochar production in the regional economy.
4.3. Employment impact compared to regional development paths
One possibility to evaluate the impact of the developmentstrategy is to compare predicted annual changes with past trendsby using time series analysis. Fig. 2 shows the observed negativepath of employment in Nurmes and Pielinen Karelia in 1994e2011and also the predicted levels with 95% confidence intervals for theyears 2012e2016 (dashed line). The figure also includes a trend-based estimate added to the annual employment impacts of sce-narios A, B and C (bolded line). The interpretation of Fig. 2 showsthat the annual employment impacts are able to change the
Table 5Annual employment impacts of the scenarios by industries (number of jobs).
Industry
Forestry and loggingCoke, refined petroleum products, chemicals, chemical
products, rubber and plastic productsHotels and restaurantsElectricity, gas and heat supplyManufacture of transport equipmentWholesale and retail tradeTransportReal estate and other business activities, rental of machinery
and equipment, personal and household goods, and research and developmentOther industriesRegion total
regional employment path in Nurmes (Fig. 2) and, therefore,especially with scenario C's development strategy, the impactsappear to offer the possibility of breaking the negative dependencyon local development as employment impacts shift the employ-ment curve above the 95% confidence interval. This implies thatincreases in the number of jobs significantly differs from the past asthe employment level increases to approximately the same levelthat it was in 1994 in Nurmes when the Finnish economy wasexperiencing an economic recession. In addition, scenario B almostexceeds the confidence intervals (Fig. 2). The remarkable impact ofthese two scenarios can be illustrated by the fact that in both of thescenarios the employment level raises above the level in 1997,indicating that the employment level is higher than 18 years ago.
In the sub-region of Pielinen Karelia, employment losses havebeenmore serious since 1994. Employment has decreased by 17.4%,which accounts for 1652 jobs. With respect to this decline, theemployment impacts are more moderate as employment increasedto approximately the same level that it was in 2005 (Fig. 2). Acomparison of the lines of Nurmes and Pielinen Karelia reveals that,locally, the efficient development strategy can break the negativedependency of employment; but in a larger geographical context,the roots of negative development are so deep that more local in-vestments and new development activities around the sub-regionare needed to break the negative development path of the region.Otherwise, the negative development in employment caused byeconomic restructuring efficiently hides the positive employmentimpacts of the development strategy.
5. Conclusions
Our case study demonstrated that the positive development inresource peripheries can be supported by a local development
Annual employment impacts
Scenario A Scenario B Scenario C
46.7 82.7 123.83.0 3.4 3.7
4.3 6.0 6.220.0 30.0 40.02.8 2.9 2.98.1 13.1 18.36.5 10.0 13.67.2 10.9 14.7
52.2 42.2 55.6126.3 201.3 281.2
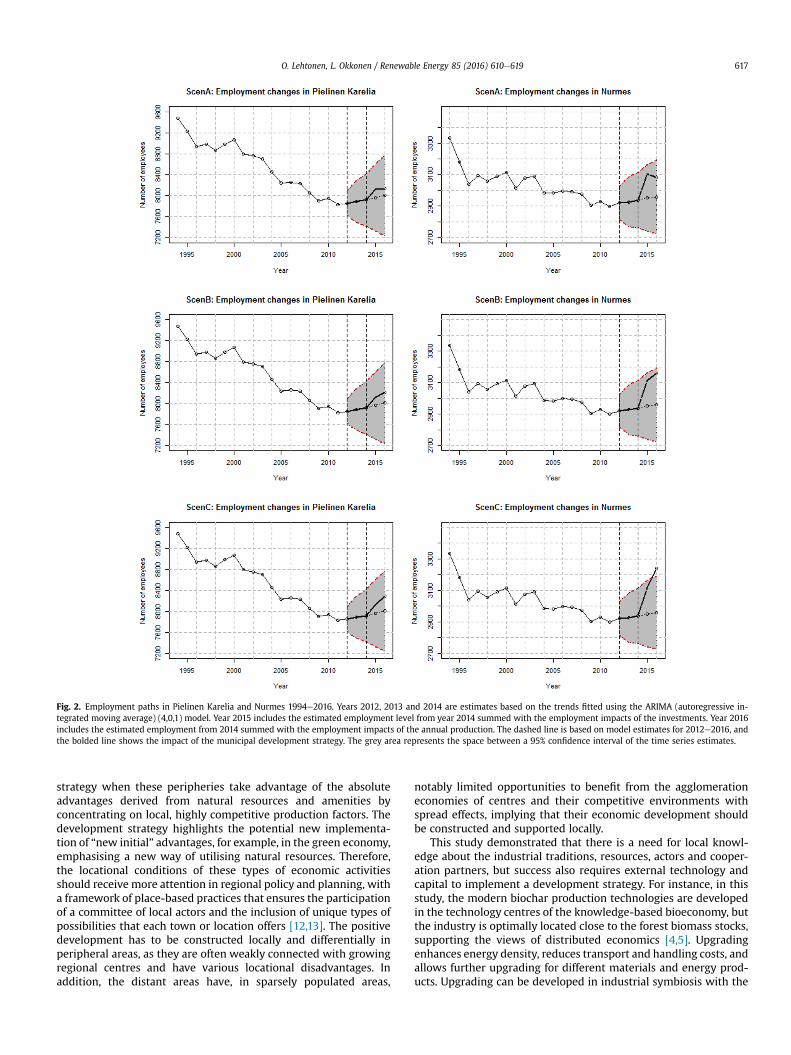
Fig. 2. Employment paths in Pielinen Karelia and Nurmes 1994e2016. Years 2012, 2013 and 2014 are estimates based on the trends fitted using the ARIMA (autoregressive in-tegrated moving average) (4,0,1) model. Year 2015 includes the estimated employment level from year 2014 summed with the employment impacts of the investments. Year 2016includes the estimated employment from 2014 summed with the employment impacts of the annual production. The dashed line is based on model estimates for 2012e2016, andthe bolded line shows the impact of the municipal development strategy. The grey area represents the space between a 95% confidence interval of the time series estimates.
O. Lehtonen, L. Okkonen / Renewable Energy 85 (2016) 610e619 617
strategy when these peripheries take advantage of the absoluteadvantages derived from natural resources and amenities byconcentrating on local, highly competitive production factors. Thedevelopment strategy highlights the potential new implementa-tion of “new initial” advantages, for example, in the green economy,emphasising a new way of utilising natural resources. Therefore,the locational conditions of these types of economic activitiesshould receive more attention in regional policy and planning, witha framework of place-based practices that ensures the participationof a committee of local actors and the inclusion of unique types ofpossibilities that each town or location offers [12,13]. The positivedevelopment has to be constructed locally and differentially inperipheral areas, as they are often weakly connected with growingregional centres and have various locational disadvantages. Inaddition, the distant areas have, in sparsely populated areas,
notably limited opportunities to benefit from the agglomerationeconomies of centres and their competitive environments withspread effects, implying that their economic development shouldbe constructed and supported locally.
This study demonstrated that there is a need for local knowl-edge about the industrial traditions, resources, actors and cooper-ation partners, but success also requires external technology andcapital to implement a development strategy. For instance, in thisstudy, the modern biochar production technologies are developedin the technology centres of the knowledge-based bioeconomy, butthe industry is optimally located close to the forest biomass stocks,supporting the views of distributed economics [4,5]. Upgradingenhances energy density, reduces transport and handling costs, andallows further upgrading for different materials and energy prod-ucts. Upgrading can be developed in industrial symbiosis with the
O. Lehtonen, L. Okkonen / Renewable Energy 85 (2016) 610e619618
production plant, if there are required factors for knowledge-intensive production.
The dependency of a renewal of the local economy from theexternal actors in the resource periphery was evident from the factthat a high proportion of the development strategy's investmentsleaked outside the region. The results proved that the growth inresource peripheries cannot exist only in the endogenous startingpoints as regions have many development disadvantages andstructural problems but also a dependence on the imported tech-nologies. However, most of the socioeconomic impacts of produc-tion are directed and induced in the local economy; therefore, theintensive use of local resources with new technology can creategrowth in the resource periphery and diversify the economicstructure. The development strategy would generate approxi-mately 12 million euros in annual income in the region, and theannual employment impacts varied between 126 and 281 jobs,depending on the volume of biochar production.
At the local level, the estimated socioeconomic impacts of thedevelopment strategy were significant as they can positively redi-rect the development trajectories of employment and break the95% confidence interval of the trend estimates in the future. Thus,the local development strategy in Nurmes, focusing diversificationinto a new and related industry, was able to put an end to thenegative development path that had persisted since themid-1990s.Without new investments and upgrades in industrial production,the resource periphery would suffer negative regional lock-in withincreasing depopulation, declining employment and increasingunemployment. This lock-in does not inhibit new paths but definesopportunities and limits possibilities for new paths, keeping thenegative path in the region alive [6,7].
This paper showed that the modelling of socio-economic im-pacts of bioenergy solutions at the local level is challenging becauseof the aggregated regional model and its sensitivity. Therefore, thepresented results of the socioeconomic impacts concerning thedevelopment strategy are indicative. However, the results offeredestimates for regional planners and confirmed that new localbioeconomic-related strategies are noteworthy in supporting thedevelopment of the earlier industrial towns in sparsely populatedregions. The strategy has the potential to succeed because in-vestments in the bioeconomy relate to pre-existing forest in-dustries in the region [8]. The revitalisation and enhancement of aregion's industrial base on the forest industry could change thedirection of the industrial trajectory in Nurmes and, therefore, thedevelopment of the resource dominant industrial town could alsochange its direction.
Acknowledgements
This study is co-financed by the European Agricultural Fund forRural Development, EAFRD project (111.2), Pielinen Karelia Bio-energy Networks and Flows (2011e2014).
References
[1] M. Whitley, A. Zervos, M. Timmer, F. Butera, Meeting the Targets and PuttingRenewables to Work, Directorate General for Energy and Transport, Energyfor Sustainable Development, Corsham, 2004.
[2] O. Lehtonen, M. Tykkyl€ainen, The emerging shortage of labour in forestry in aremote coniferous region: a brake on the massive use of biofuels, in:K. Andersson, E. Eklund, M. Lehtola, P. Salmi (Eds.), Beyond the RuraleUrbanDivide, Emerald, Bingley, 2008, pp. 25e55.
[3] L. Okkonen, From exogenous to endogenous development in Scottish forestry:the feasibility of small-scale wood energy enterprise, J. Environ. Plan. Manag.51 (2008) 221e232.
[4] A. Johansson, P. Kisch, M. Mirata, Distributed economiesda new engine forinnovation, J. Clean. Prod. 13 (2005) 971e979.
[5] M. Mirata, H. Nilsson, J. Kuisma, Production systems aligned with distributedeconomies: examples from energy and biomass sectors, J. Clean. Prod. 13
(2005) 981e991.[6] M. Tonts, N. Argent, P. Plummer, Evolutionary perspectives on rural Australia,
Geogr. Res. 50 (2012) 291e303.[7] M. Tonts, P. Plummer, N. Argent, Path dependence, resilience and the evolu-
tion of new rural economies: perspectives from rural Western Australia,J. Rural Stud. 36 (2014) 362e375.
[8] F. Neffke, M. Henning, R. Boschma, How do regions diversify over time? In-dustry relatedness and the development of new growth paths in regions,Econ. Geogr. 87 (2011) 237e265.
[9] O. Lehtonen, M. Tykkyl€ainen, Regional formations and pulse of migration inFinland, 1980e2006, Terra 121 (2009) 119e137.
[10] O. Lehtonen, M. Tykkyl€ainen, Self-reinforcing spatial clusters of migration andsocio-economic conditions in Finland in 1998e2006, J. Rural Stud. 26 (2010)361e373.
[11] M. Partridge, D.S. Rickman, Place-based policy and rural poverty: insightsfrom the urban spatial mismatch literature, Camb. J. Reg. Econ. Soc. 1 (2008)131e156.
[12] R.M. Blank, Poverty, policy, and place: how poverty and policies to alleviatepoverty are shaped by local characteristics, Int. Reg. Sci. Rev. 28 (2005)441e464.
[13] M. Betz, M. Partridge, Country road take me home: migration patterns inappalachian America and place-based policy, Int. Reg. Sci. Rev. 36 (2013)267e295.
[14] S. Goetz, A. Rupasingha, Determinants of growth in non-farm proprietordensities in the US, 1990e2000, Small Bus. Econ. 32 (2009) 425e438.
[15] H. Stephens, M. Partridge, Do entrepreneurs enhance economic growth inlagging regions? Growth Change 42 (2011) 431e465.
[16] H. Bathelt, J.S. Boggs, Towards a reconceptualization of regional developmentpaths: is Leipzig's media cluster a continuation of or a rupture with the past?Econ. Geogr. 79 (2003) 265e293.
[17] D. Rodrik, Growth strategies, in: P. Aghion, S.N. Durlauf (Eds.), Handbook ofEconomic Growth, Elsevier Academic Press, North Holland, 2005, pp.967e1014.
[18] F. Barca, P. McCann, A. Rodriguez-Pose, The case for regional developmentintervention: place-based versus place-neutral approaches, J. Reg. Sci. 52(2012) 134e152.
[19] G. Hewings, New goals for new rural policies, Int. Reg. Sci. Rev. 24 (2001)146e160.
[20] E.G. Irwin, A.M. Isserman, M. Kilkenny, M. Partridge, A century of research onrural development and regional issues, Am. J. Agric. Econ. 92 (2010) 522e553.
[21] M. Kilkenny, Urban/regional economics and rural development, J. Reg. Sci. 50(2010) 449e470.
[22] S. Markey, G. Halseth, D. Manson, Challenging the inevitability of ruraldecline: advancing the policy of place in northern British Columbia, J. RuralStud. 24 (2008) 409e421.
[23] FFRI (Finnish Forest Research Institute), Finnish Statistical Yearbooks ofForestry, Finnish Forest Research Institute, Helsinki, 2012.
[24] O. Lehtonen, M. Tykkyl€ainen, Spatial divergence in living standards during aneconomic growth phase in the periphery: a case study of North Karelia, Fennia189 (2011) 47e62.
[25] Official Statistics of Finland (OSF): Regional Account (e-publication). StatisticsFinland: Helsinki. (referred: 15.12.2014). Access method: http://www.tilastokeskus.fi/til/altp/index_en.html.
[26] L. Anselin, A. Varga, Z. Arcs, Local geographical spillovers between universityresearch and high technology innovations, J. Urban Econ. 42 (1997) 422e448.
[27] L. Anselin, A. Varga, Z. Arcs, Geographical spillovers and university research: aspatial econometric perspective, Growth Change 31 (2003) 501e515.
[28] Official Statistics of Finland (OSF): Population structure (e-publication). Sta-tistics Finland: Helsinki. (referred: 16.12.2014). Access method: http://www.stat.fi/til/vaerak/index_en.html.
[29] O. Lehtonen, M. Tykkyl€ainen, Spatial processes of job growth in EasternFinland, 1994e2003, Terra 124 (2012) 85e105.
[30] O. Lehtonen, O. Wuori, T. Muilu, Comparing the extend of the spread effects:rural-urban commuting in the Finnish working regions, J. Geogr. Inf. System 7(2015) 29e42.
[31] Official Statistics of Finland (OSF): Migration (e-publication). StatisticsFinland: Helsinki. (referred: 15.12.2014). Access method: http://www.tilastokeskus.fi/til/muutl/tau_en.html.
[32] Official Statistics of Finland (OSF): Employment (e-publication). StatisticsFinland: Helsinki. (referred: 15.12.2014). Access method: http://www.tilastokeskus.fi/til/tyokay/index_en.html.
[33] Pielisen Karjalan kehitt€amiskeskus, Pielisen Karjalan Elinkeinostrategia2014e2017, Nurmes, 2010 (referred 10.3.2015). Access method: http://www.pikes.fi/.
[34] N. Leigh, E.J. Blakely, Planning Local Economic Development. Theory andPractice, fifth ed., Sage Publications, USA, 2013.
[35] Grow Green Nurmes, Nurmeksen bioteollisuushankkeen ymp€arist€ovaikutus-ten arviointiohjelma, 2014 (referred 10.3.2015) Access method: http://www.nurmes.fi/yva-ohjelma.
[36] A. Saatsi, J. Ylinen, N. Huikuri, L. Okkonen, R. Prinz, Biojalostamon sijoittu-misselvitys Nurmekseen (Biorefinery location plan for nurmes), in: N. Huikuri,L. Okkonen (Eds.), Bioenergiaa Pielisen Karjalaan. Pielisen Karjalan bio-energiaverkostot ja-virrat osana Pohjois-Karjalan energiaomavaraisuutta-hankkeen vuosiraportti 2012, Pohjois-Karjalan ammattikorkeakoulu, Joensuu,2012.

O. Lehtonen, L. Okkonen / Renewable Energy 85 (2016) 610e619 619
[37] W. Leontief, Inputeoutput Economics, Oxford University Press, New York,1966.
[38] Statistics Finland, Regional Inputeoutput Tables, Description of Statistics,Helsinki, 2006 (referred 10.3.2015). Access method: http://www.stat.fi/.
[39] Statistics Finland, Regional Accounts of Production and Employment, Helsinki,2013 (referred 10.3.2015). Access method: http://www.stat.fi/.
[40] W. Schaffer, K. Chu, Nonsurvey techniques for constructing regional interin-dustry models, Pap. Proc. Reg. Sci. Assoc. 23 (1969) 83e101.
[41] Statistics Finland, Regional Household Accounts, Helsinki, 2007 (referred10.3.2015). Access method: http://www.stat.fi/.
[42] Finnish Statistical Yearbook of Forestry 2007, Finnish Forest Research Insti-tute; Vammalan Kirjapaino, Vammala, 2007.
[43] Statistics Finland, Annual National Accounts, Helsinki, 2007 (referred10.3.2015). Access method: http://www.stat.fi/.
[44] P. Laine, Social Security Benefits for Households in North Karelia, Unpublishedstatistics, 2007.
[45] T. Rimler, M. Kurttila, M. Pesonen, K. Koljonen, Economic impacts of alter-native timber cutting scenarios in Finland: an inputeoutput analysis, For.Policy Econ. 1 (2000) 301e313.
[46] J. Domac, K. Richards, S. Risovic, Socio-economic drivers in implementingbioenergy projects, Biomass Bioenergy 28 (2005) 97e106.
[47] R. Miller, P. Blair, Inputeoutput Analysis. Foundations and Extensions, Pren-tice-Hall, Englewood Cliffs, 1985.