Embed Size (px)
Citation preview
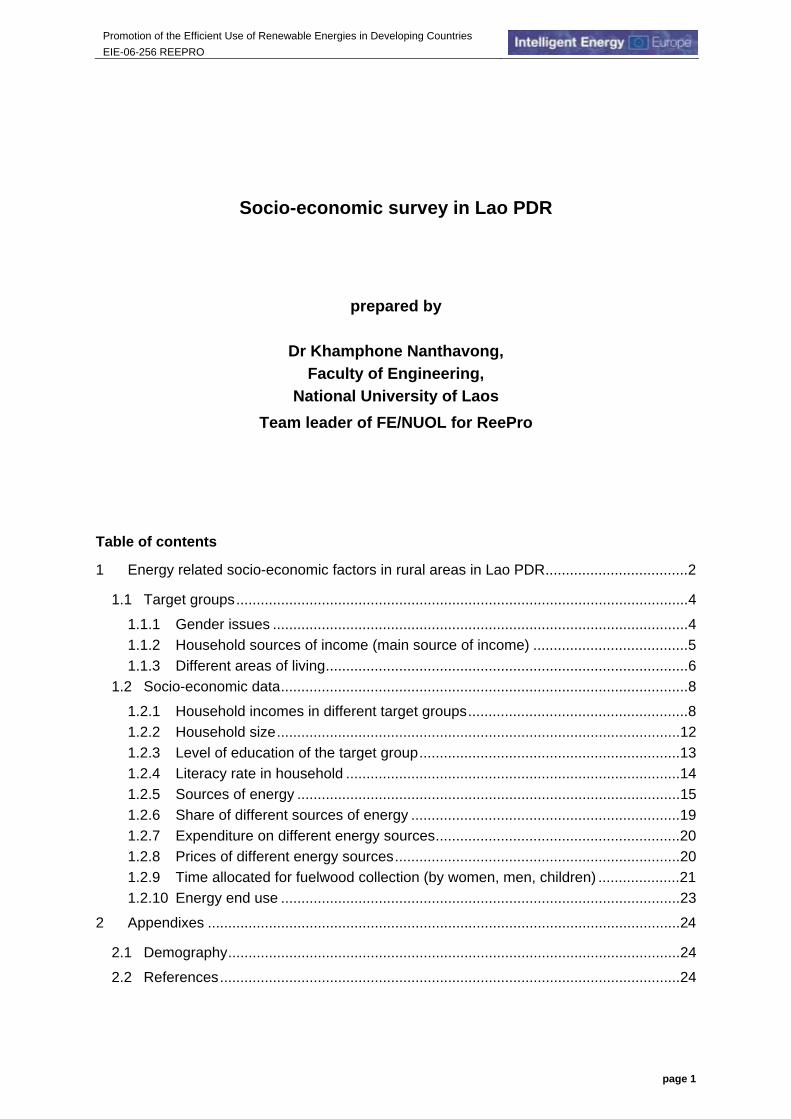
Promotion of the Efficient Use of Renewable Energies in Developing Countries EIE-06-256 REEPRO
page 1
Socio-economic survey in Lao PDR
prepared by
Dr Khamphone Nanthavong, Faculty of Engineering,
National University of Laos Team leader of FE/NUOL for ReePro
Table of contents
1 Energy related socio-economic factors in rural areas in Lao PDR...................................2
1.1 Target groups...............................................................................................................4 1.1.1 Gender issues ......................................................................................................4 1.1.2 Household sources of income (main source of income) ......................................5 1.1.3 Different areas of living.........................................................................................6
1.2 Socio-economic data....................................................................................................8 1.2.1 Household incomes in different target groups......................................................8 1.2.2 Household size...................................................................................................12 1.2.3 Level of education of the target group................................................................13 1.2.4 Literacy rate in household ..................................................................................14 1.2.5 Sources of energy ..............................................................................................15 1.2.6 Share of different sources of energy ..................................................................19 1.2.7 Expenditure on different energy sources............................................................20 1.2.8 Prices of different energy sources......................................................................20 1.2.9 Time allocated for fuelwood collection (by women, men, children) ....................21 1.2.10 Energy end use ..................................................................................................23
2 Appendixes ....................................................................................................................24
2.1 Demography...............................................................................................................24 2.2 References.................................................................................................................24
Promotion of the Efficient Use of Renewable Energies in Developing Countries EIE-06-256 REEPRO
page 2
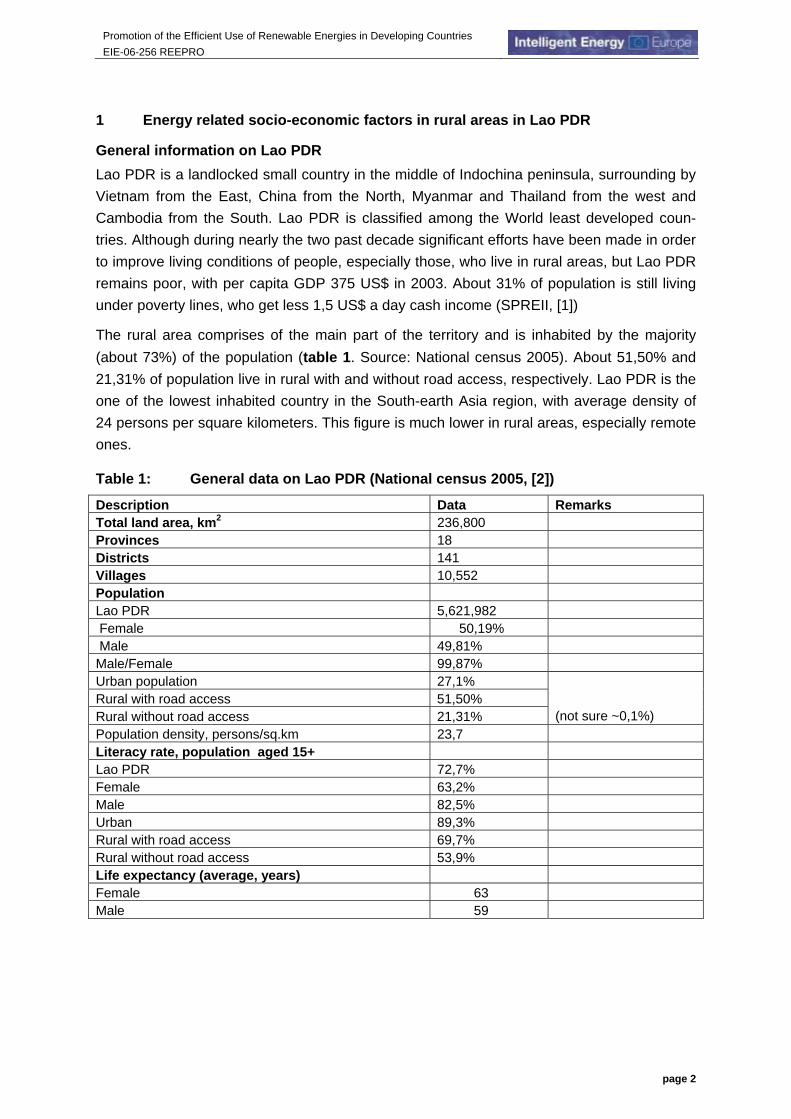
1 Energy related socio-economic factors in rural areas in Lao PDR
General information on Lao PDR Lao PDR is a landlocked small country in the middle of Indochina peninsula, surrounding by Vietnam from the East, China from the North, Myanmar and Thailand from the west and Cambodia from the South. Lao PDR is classified among the World least developed coun-tries. Although during nearly the two past decade significant efforts have been made in order to improve living conditions of people, especially those, who live in rural areas, but Lao PDR remains poor, with per capita GDP 375 US$ in 2003. About 31% of population is still living under poverty lines, who get less 1,5 US$ a day cash income (SPREII, [1])
The rural area comprises of the main part of the territory and is inhabited by the majority (about 73%) of the population (table 1. Source: National census 2005). About 51,50% and 21,31% of population live in rural with and without road access, respectively. Lao PDR is the one of the lowest inhabited country in the South-earth Asia region, with average density of 24 persons per square kilometers. This figure is much lower in rural areas, especially remote ones.
Table 1: General data on Lao PDR (National census 2005, [2])
Description Data Remarks Total land area, km2 236,800 Provinces 18 Districts 141 Villages 10,552 Population Lao PDR 5,621,982 Female 50,19% Male 49,81% Male/Female 99,87% Urban population 27,1% Rural with road access 51,50% Rural without road access 21,31% (not sure ~0,1%) Population density, persons/sq.km 23,7 Literacy rate, population aged 15+ Lao PDR 72,7% Female 63,2% Male 82,5% Urban 89,3% Rural with road access 69,7% Rural without road access 53,9% Life expectancy (average, years) Female 63 Male 59
Promotion of the Efficient Use of Renewable Energies in Developing Countries EIE-06-256 REEPRO
page 3
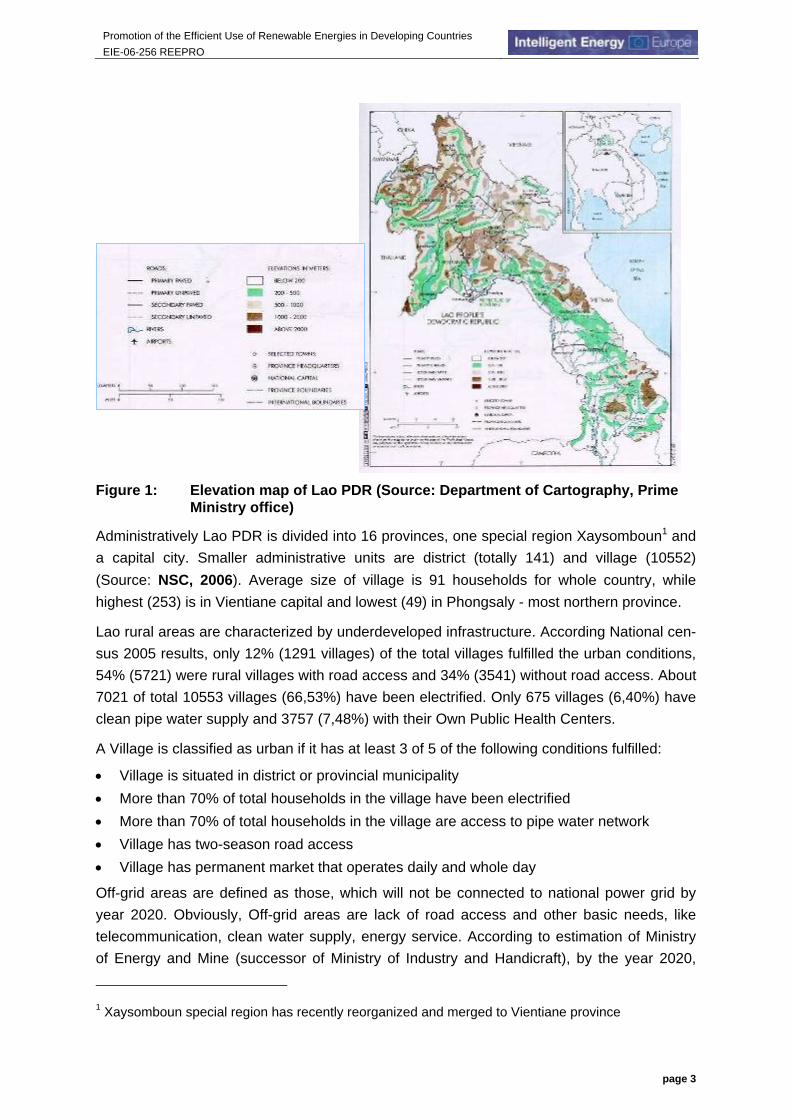
Figure 1: Elevation map of Lao PDR (Source: Department of Cartography, Prime Ministry office)
Administratively Lao PDR is divided into 16 provinces, one special region Xaysomboun1 and a capital city. Smaller administrative units are district (totally 141) and village (10552) (Source: NSC, 2006). Average size of village is 91 households for whole country, while highest (253) is in Vientiane capital and lowest (49) in Phongsaly - most northern province.
Lao rural areas are characterized by underdeveloped infrastructure. According National cen-sus 2005 results, only 12% (1291 villages) of the total villages fulfilled the urban conditions, 54% (5721) were rural villages with road access and 34% (3541) without road access. About 7021 of total 10553 villages (66,53%) have been electrified. Only 675 villages (6,40%) have clean pipe water supply and 3757 (7,48%) with their Own Public Health Centers.
A Village is classified as urban if it has at least 3 of 5 of the following conditions fulfilled:
• Village is situated in district or provincial municipality • More than 70% of total households in the village have been electrified • More than 70% of total households in the village are access to pipe water network • Village has two-season road access • Village has permanent market that operates daily and whole day
Off-grid areas are defined as those, which will not be connected to national power grid by year 2020. Obviously, Off-grid areas are lack of road access and other basic needs, like telecommunication, clean water supply, energy service. According to estimation of Ministry of Energy and Mine (successor of Ministry of Industry and Handicraft), by the year 2020,
1 Xaysomboun special region has recently reorganized and merged to Vientiane province
Promotion of the Efficient Use of Renewable Energies in Developing Countries EIE-06-256 REEPRO
page 4
75% of rural households will be electrified by grid connection and 15%, or about 150.000 households - by off-grid option (solar home systems, pico hydros, diesel gen-set, battery charging station).
1.1 Target groups
The targets groups are classified by the following factors:
1.1.1 Gender issues
Percentage of female in Lao PDR is 50.19%, which are slightly different in cases of urban, rural with and without road access, 49.9, 50.2 and 50.7 %, respectively (Table 2). About 71% of rural women, aged 10+ are occupied in economic sphere (men- 69.52%), while only 28% - in non-economic sphere, comparing to 29.38% for rural men (Table 3). Lesser unem-ployment rate (about 0.3%) for aged 10+ rural women in economic sphere, comparing to urban figure (2.2%) (NSC 2006)
Thus, Lao women play critical roles in agriculture and other economic activities, and are pri-marily responsible for maintaining their families’ food security and health. Female farmers are counted for 85.4% of total economically active women-employees (versus 78.3% for men-farmers) (NSC 2006). The Government recognizes that it will not be able to realise the goals of reducing poverty and improving national education, health and population indicators without the active participation of all women, particularly poor and ethnic minority women (NPGES [4]).
Therefore, the Government is taking concrete steps in all key economic sectors and through national programmes to: support poor women’s economic activities; improve their access to basic services such as education and health and productive resources; involve them in local decision-making, and; generally take their needs into account in developing national policy.
Promoting gender equality is an important national goal, as reflected in Articles 22 and 24 of the 1991 Constitution, in numerous international commitments (e.g., the Convention on the Elimination of All Forms of Discrimination Against Women) and in the recently established National Commission for the Advancement of Women – Lao PDR (NCAW-Lao). Ensuring equal access to basic services and productive resources is a matter of equity (fundamental fairness), efficiency (poor women are a valuable resource) and effectiveness (women’s sup-port is needed to implement national policies on shifting cultivation, opium production, edu-cation, health and population). Under the guidance of the new NCAW-Lao, it is expected that all ministries will develop strategies and action plans to promote gender equality at national, provincial, district and village levels2.
2Guidelines have been developed for a National Gender Action Plan to integrate the gender strategies and action plans of ministries, agencies and mass organisations. The development of such a national plan will be guided and co-ordinated by the NCAW-Lao.
Promotion of the Efficient Use of Renewable Energies in Developing Countries EIE-06-256 REEPRO
page 5
Women in Lao PDR, as the same as in the other least developed countries, play an impor-tant role in family comfort and prosperity. Often women are the main cash earners for house-hold use, by performing various income generating activities. In this concern, better energy service would help creating more opportunities for women to earn more money for family. Such micro (family-sized) enterprises, as rural food processing, handicrafts making, restau-rants, etc would be created if better energy services were available and accessible for them.
Usually, lack of education and economic opportunities pushes women into the informal sec-tor and small-scale enterprises (GRID, 2004 [3]). As seen from table 2, high percentage of women (71%) occupies unpaid jobs (usually daily family chores), comparing to 29% for men. Women entrepreneurs have limited education and experiences. They usually lack ac-cess to education or training due to, in one hand, traditional customs do not allow women to leave home for work far away from their village; on the other hand, traditional gender roles of women are to take responsibilities and care within the households, and thus, lack opportuni-ties for improving them selves.
Gender issues: “Over 85% of Lao Women are farmers- Women generally rise daily between 3-4 AM to grind rice, prepare the meal and do other chores before they go to the field. During rainy seasons they spend everyday from dawn to dusk. On their return they collect firewood. In the eve-ning, woman will prepare food, tend and bathe the children, and socialize. If they have extra time, they engage on handicraft making” (Source: ADB, Northern Master Plan Study, 2002)
1.1.2 Household sources of income (main source of income)
Target groups in rural off-grid areas in Lao PDR probably can be classified by the source of income, as followed:
• Agriculture and Forestry (farmers, animal breeder, gardener, fishermen, and combination of these jobs)
• Non-agriculture jobs (small shop keeper, craftsmen, service provider, rural restaurant) • Non economic sphere jobs (governmental employees) • Other: no-income people: unemployed, elderly, children, disabled people
Occupation
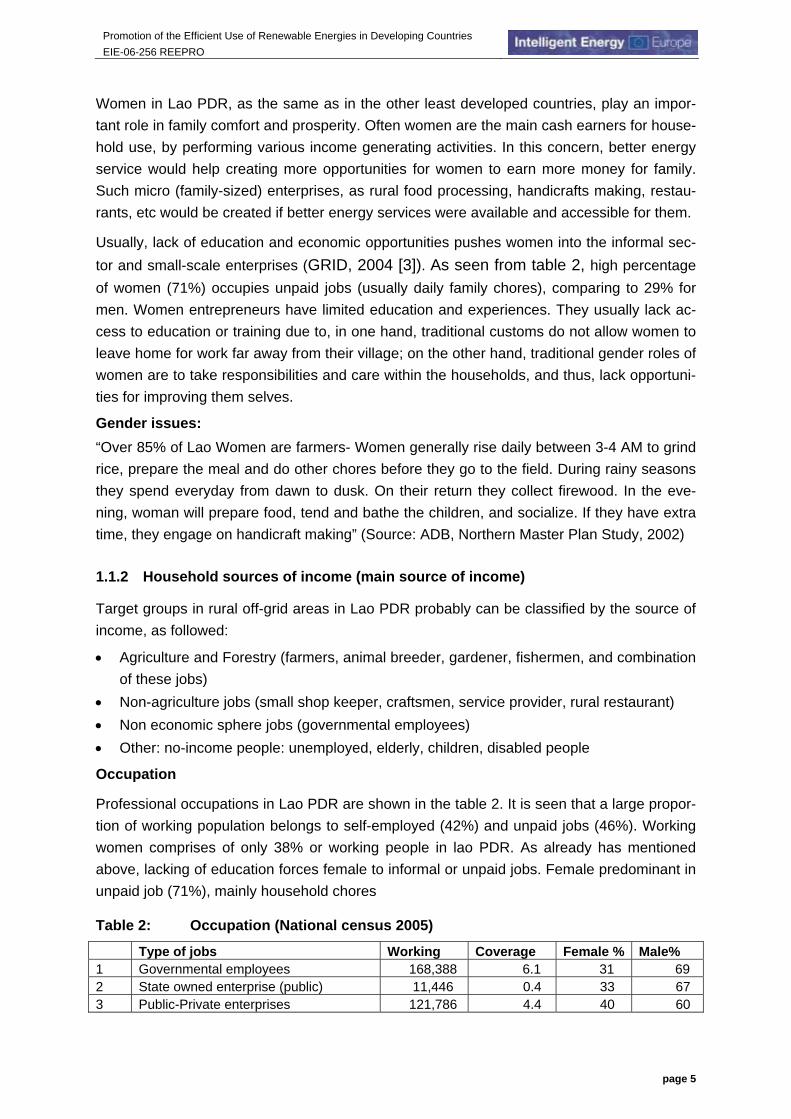
Professional occupations in Lao PDR are shown in the table 2. It is seen that a large propor-tion of working population belongs to self-employed (42%) and unpaid jobs (46%). Working women comprises of only 38% or working people in lao PDR. As already has mentioned above, lacking of education forces female to informal or unpaid jobs. Female predominant in unpaid job (71%), mainly household chores
Table 2: Occupation (National census 2005)
Type of jobs Working Coverage Female % Male% 1 Governmental employees 168,388 6.1 31 69 2 State owned enterprise (public) 11,446 0.4 33 67 3 Public-Private enterprises 121,786 4.4 40 60
Promotion of the Efficient Use of Renewable Energies in Developing Countries EIE-06-256 REEPRO
page 6
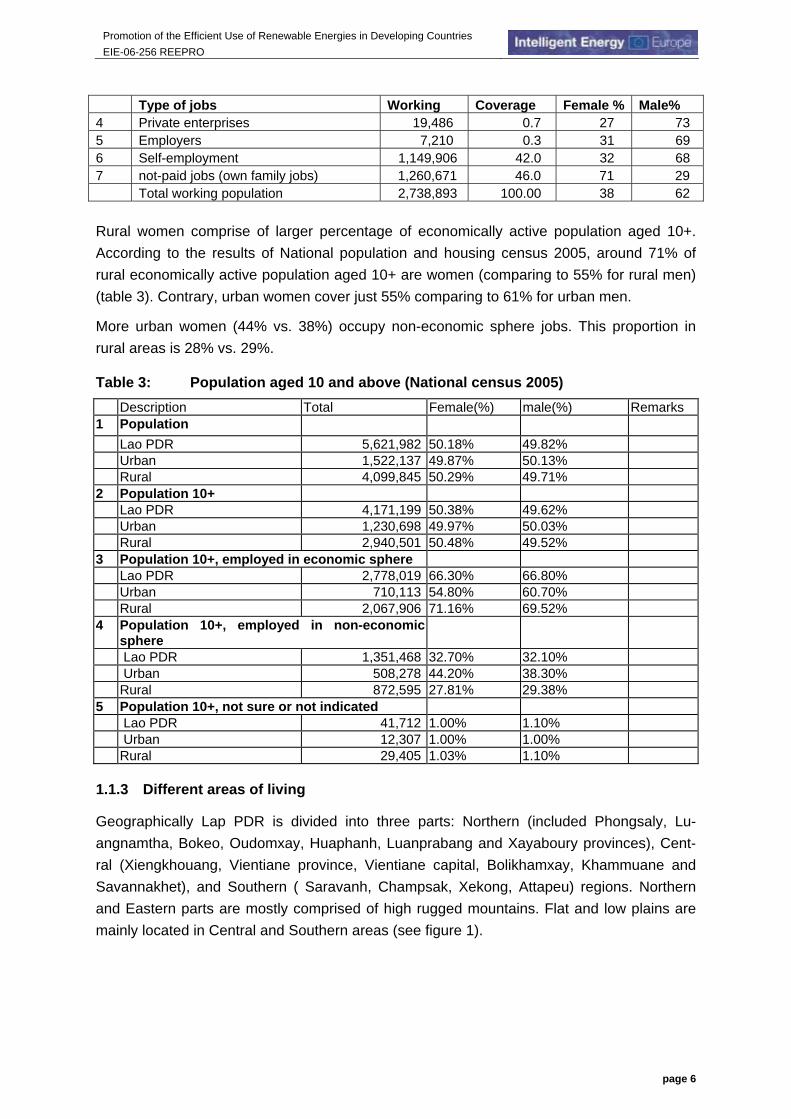
Type of jobs Working Coverage Female % Male% 4 Private enterprises 19,486 0.7 27 73 5 Employers 7,210 0.3 31 69 6 Self-employment 1,149,906 42.0 32 68 7 not-paid jobs (own family jobs) 1,260,671 46.0 71 29 Total working population 2,738,893 100.00 38 62 Rural women comprise of larger percentage of economically active population aged 10+. According to the results of National population and housing census 2005, around 71% of rural economically active population aged 10+ are women (comparing to 55% for rural men) (table 3). Contrary, urban women cover just 55% comparing to 61% for urban men.
More urban women (44% vs. 38%) occupy non-economic sphere jobs. This proportion in rural areas is 28% vs. 29%.
Table 3: Population aged 10 and above (National census 2005) Description Total Female(%) male(%) Remarks 1 Population Lao PDR 5,621,982 50.18% 49.82% Urban 1,522,137 49.87% 50.13% Rural 4,099,845 50.29% 49.71% 2 Population 10+ Lao PDR 4,171,199 50.38% 49.62% Urban 1,230,698 49.97% 50.03% Rural 2,940,501 50.48% 49.52% 3 Population 10+, employed in economic sphere Lao PDR 2,778,019 66.30% 66.80% Urban 710,113 54.80% 60.70% Rural 2,067,906 71.16% 69.52% 4 Population 10+, employed in non-economic
sphere
Lao PDR 1,351,468 32.70% 32.10% Urban 508,278 44.20% 38.30% Rural 872,595 27.81% 29.38% 5 Population 10+, not sure or not indicated Lao PDR 41,712 1.00% 1.10% Urban 12,307 1.00% 1.00% Rural 29,405 1.03% 1.10%
1.1.3 Different areas of living
Geographically Lap PDR is divided into three parts: Northern (included Phongsaly, Lu-angnamtha, Bokeo, Oudomxay, Huaphanh, Luanprabang and Xayaboury provinces), Cent-ral (Xiengkhouang, Vientiane province, Vientiane capital, Bolikhamxay, Khammuane and Savannakhet), and Southern ( Saravanh, Champsak, Xekong, Attapeu) regions. Northern and Eastern parts are mostly comprised of high rugged mountains. Flat and low plains are mainly located in Central and Southern areas (see figure 1).
Promotion of the Efficient Use of Renewable Energies in Developing Countries EIE-06-256 REEPRO
page 7
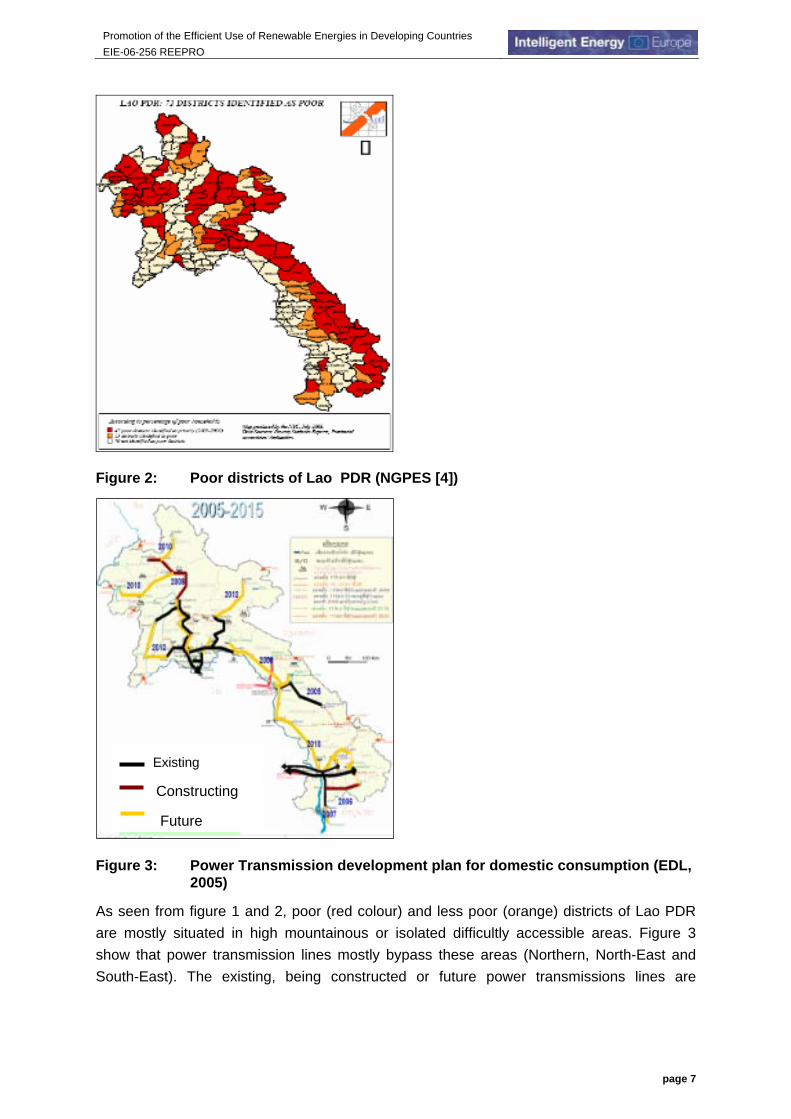
Figure 2: Poor districts of Lao PDR (NGPES [4])
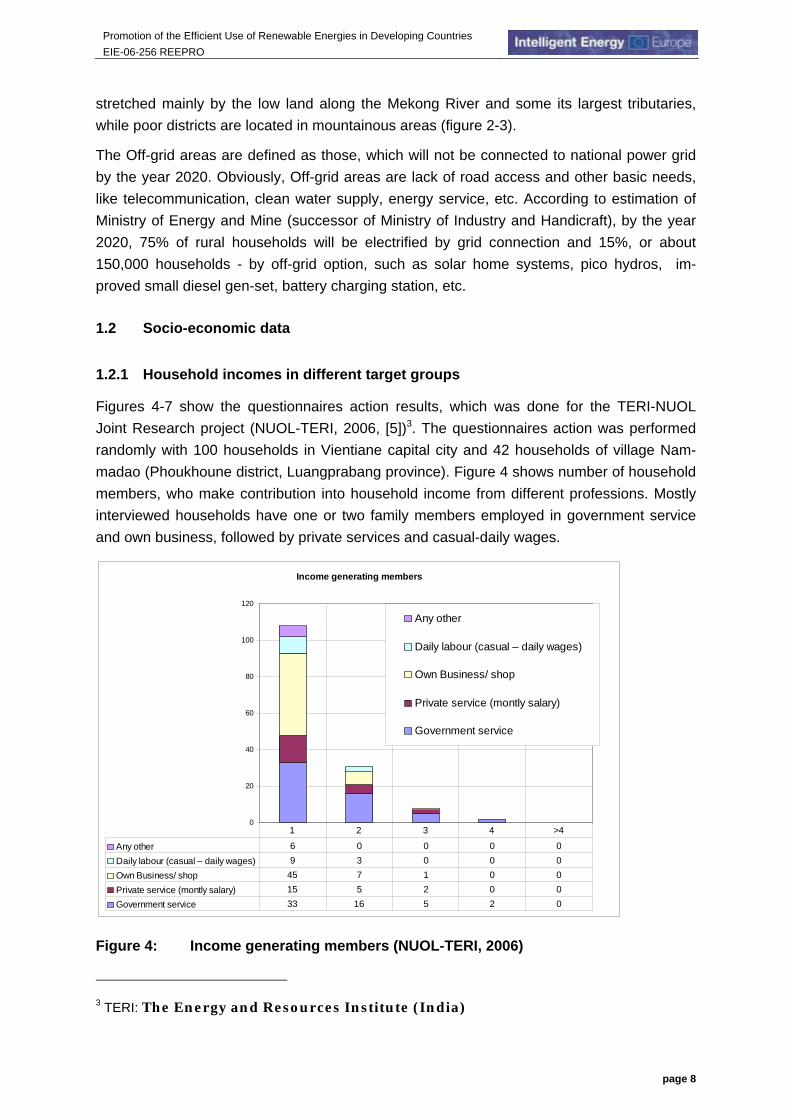
Figure 3: Power Transmission development plan for domestic consumption (EDL, 2005)
As seen from figure 1 and 2, poor (red colour) and less poor (orange) districts of Lao PDR are mostly situated in high mountainous or isolated difficultly accessible areas. Figure 3 show that power transmission lines mostly bypass these areas (Northern, North-East and South-East). The existing, being constructed or future power transmissions lines are
Existing
Constructing
Future
Promotion of the Efficient Use of Renewable Energies in Developing Countries EIE-06-256 REEPRO
page 8
stretched mainly by the low land along the Mekong River and some its largest tributaries, while poor districts are located in mountainous areas (figure 2-3).
The Off-grid areas are defined as those, which will not be connected to national power grid by the year 2020. Obviously, Off-grid areas are lack of road access and other basic needs, like telecommunication, clean water supply, energy service, etc. According to estimation of Ministry of Energy and Mine (successor of Ministry of Industry and Handicraft), by the year 2020, 75% of rural households will be electrified by grid connection and 15%, or about 150,000 households - by off-grid option, such as solar home systems, pico hydros, im-proved small diesel gen-set, battery charging station, etc.
1.2 Socio-economic data
1.2.1 Household incomes in different target groups
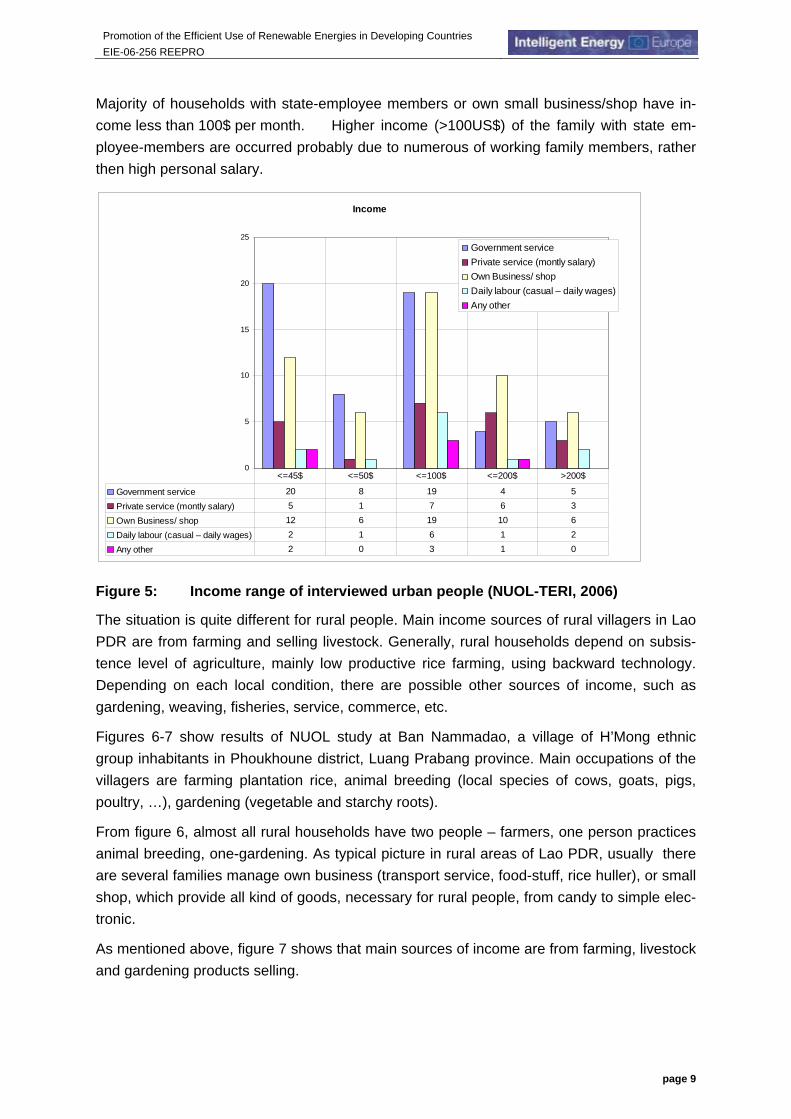
Figures 4-7 show the questionnaires action results, which was done for the TERI-NUOL Joint Research project (NUOL-TERI, 2006, [5])3. The questionnaires action was performed randomly with 100 households in Vientiane capital city and 42 households of village Nam-madao (Phoukhoune district, Luangprabang province). Figure 4 shows number of household members, who make contribution into household income from different professions. Mostly interviewed households have one or two family members employed in government service and own business, followed by private services and casual-daily wages.
Income generating members
0
20
40
60
80
100
120
Any other
Daily labour (casual – daily wages)
Own Business/ shop
Private service (montly salary)
Government service
Any other 6 0 0 0 0Daily labour (casual – daily wages) 9 3 0 0 0Own Business/ shop 45 7 1 0 0Private service (montly salary) 15 5 2 0 0Government service 33 16 5 2 0
1 2 3 4 >4
Figure 4: Income generating members (NUOL-TERI, 2006)
3 TERI: The Energy and Resources Institute (India)
Promotion of the Efficient Use of Renewable Energies in Developing Countries EIE-06-256 REEPRO
page 9
Majority of households with state-employee members or own small business/shop have in-come less than 100$ per month. Higher income (>100US$) of the family with state em-ployee-members are occurred probably due to numerous of working family members, rather then high personal salary.
Income
0
5
10
15
20
25Government servicePrivate service (montly salary)Own Business/ shopDaily labour (casual – daily wages)Any other
Government service 20 8 19 4 5
Private service (montly salary) 5 1 7 6 3
Own Business/ shop 12 6 19 10 6
Daily labour (casual – daily wages) 2 1 6 1 2
Any other 2 0 3 1 0
<=45$ <=50$ <=100$ <=200$ >200$
Figure 5: Income range of interviewed urban people (NUOL-TERI, 2006)
The situation is quite different for rural people. Main income sources of rural villagers in Lao PDR are from farming and selling livestock. Generally, rural households depend on subsis-tence level of agriculture, mainly low productive rice farming, using backward technology. Depending on each local condition, there are possible other sources of income, such as gardening, weaving, fisheries, service, commerce, etc.
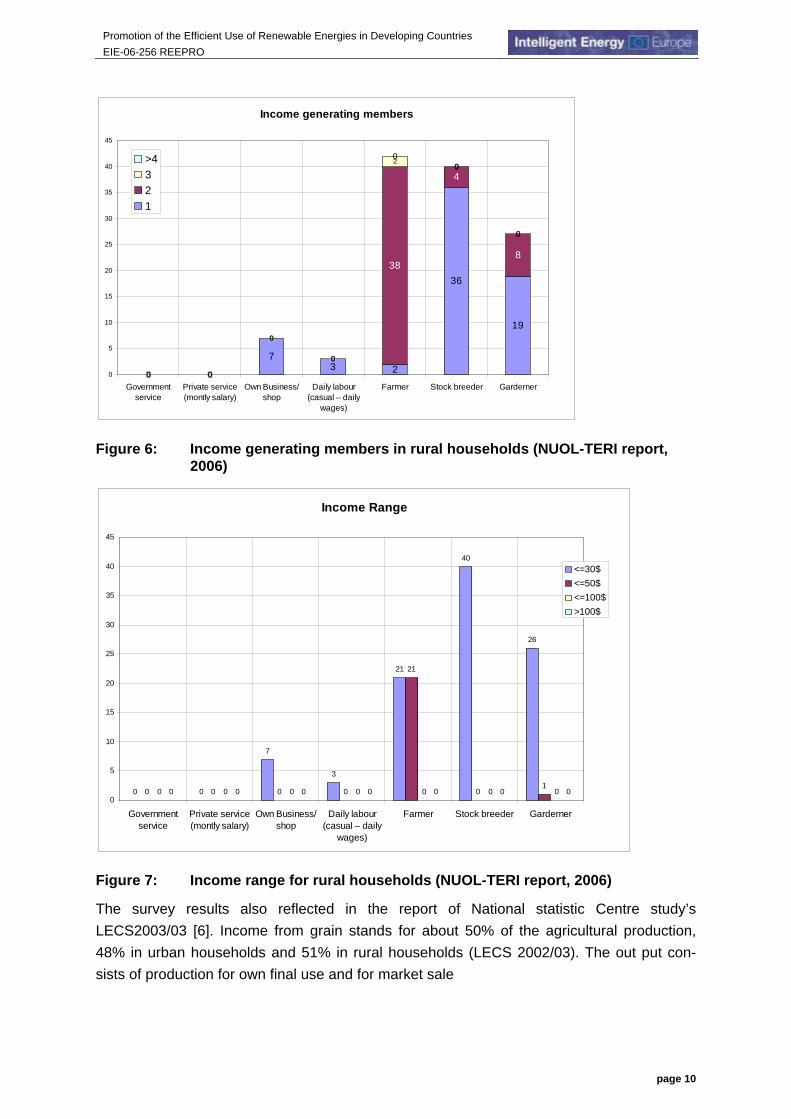
Figures 6-7 show results of NUOL study at Ban Nammadao, a village of H’Mong ethnic group inhabitants in Phoukhoune district, Luang Prabang province. Main occupations of the villagers are farming plantation rice, animal breeding (local species of cows, goats, pigs, poultry, …), gardening (vegetable and starchy roots).
From figure 6, almost all rural households have two people – farmers, one person practices animal breeding, one-gardening. As typical picture in rural areas of Lao PDR, usually there are several families manage own business (transport service, food-stuff, rice huller), or small shop, which provide all kind of goods, necessary for rural people, from candy to simple elec-tronic.
As mentioned above, figure 7 shows that main sources of income are from farming, livestock and gardening products selling.
Promotion of the Efficient Use of Renewable Energies in Developing Countries EIE-06-256 REEPRO
page 10
Income generating members
0 0
73 2
36
19
0 0
0
0
38
4
8
0 0
0
0
20
0
0 0
0
0
00
0
0
5
10
15
20
25
30
35
40
45
Governmentservice
Private service(montly salary)
Own Business/shop
Daily labour(casual – daily
wages)
Farmer Stock breeder Garderner
>4321
Figure 6: Income generating members in rural households (NUOL-TERI report, 2006)
Income Range
0 0
7
3
21
40
26
0 0 0 0
21
01
0 0 0 0 0 0 00 0 0 0 0 0 00
5
10
15
20
25
30
35
40
45
Governmentservice
Private service(montly salary)
Own Business/shop
Daily labour(casual – daily
wages)
Farmer Stock breeder Garderner
<=30$<=50$<=100$>100$
Figure 7: Income range for rural households (NUOL-TERI report, 2006)
The survey results also reflected in the report of National statistic Centre study’s LECS2003/03 [6]. Income from grain stands for about 50% of the agricultural production, 48% in urban households and 51% in rural households (LECS 2002/03). The out put con-sists of production for own final use and for market sale
Promotion of the Efficient Use of Renewable Energies in Developing Countries EIE-06-256 REEPRO
page 11
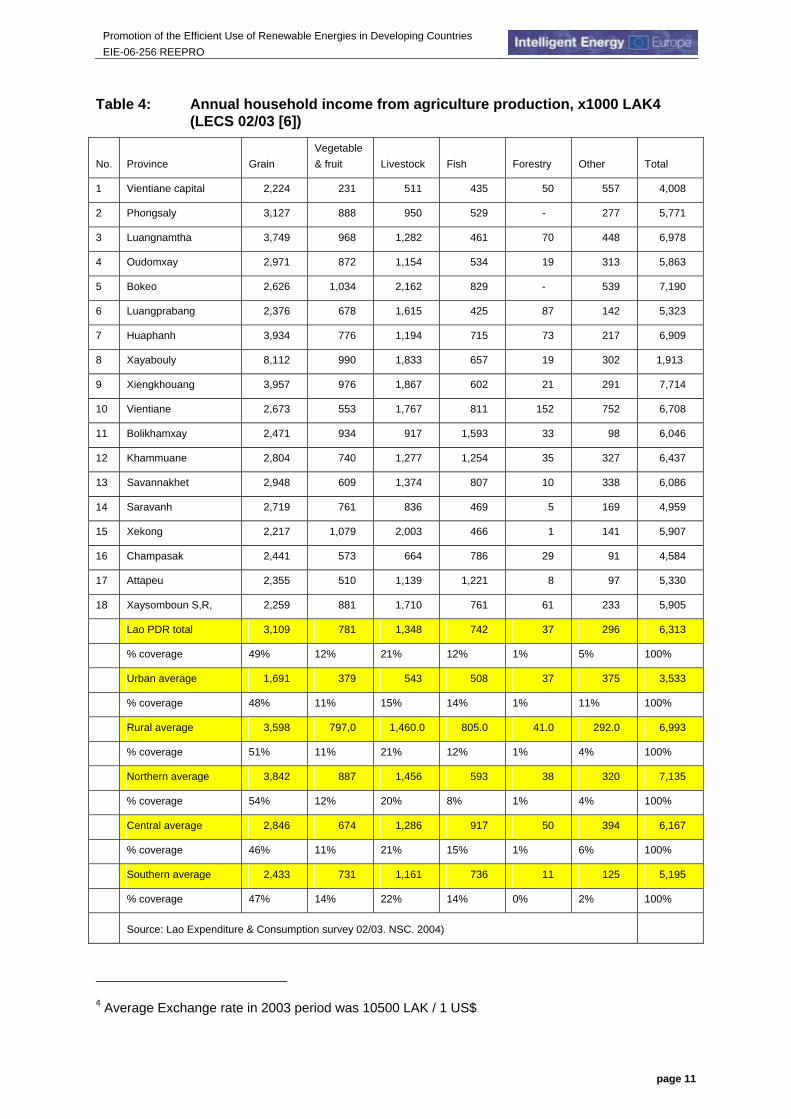
Table 4: Annual household income from agriculture production, x1000 LAK4 (LECS 02/03 [6])
No. Province Grain Vegetable& fruit Livestock Fish Forestry Other Total
1 Vientiane capital 2,224 231 511 435 50 557 4,008
2 Phongsaly 3,127 888 950 529 - 277 5,771
3 Luangnamtha 3,749 968 1,282 461 70 448 6,978
4 Oudomxay 2,971 872 1,154 534 19 313 5,863
5 Bokeo 2,626 1,034 2,162 829 - 539 7,190
6 Luangprabang 2,376 678 1,615 425 87 142 5,323
7 Huaphanh 3,934 776 1,194 715 73 217 6,909
8 Xayabouly 8,112 990 1,833 657 19 302 1,913
9 Xiengkhouang 3,957 976 1,867 602 21 291 7,714
10 Vientiane 2,673 553 1,767 811 152 752 6,708
11 Bolikhamxay 2,471 934 917 1,593 33 98 6,046
12 Khammuane 2,804 740 1,277 1,254 35 327 6,437
13 Savannakhet 2,948 609 1,374 807 10 338 6,086
14 Saravanh 2,719 761 836 469 5 169 4,959
15 Xekong 2,217 1,079 2,003 466 1 141 5,907
16 Champasak 2,441 573 664 786 29 91 4,584
17 Attapeu 2,355 510 1,139 1,221 8 97 5,330
18 Xaysomboun S,R, 2,259 881 1,710 761 61 233 5,905
Lao PDR total 3,109 781 1,348 742 37 296 6,313
% coverage 49% 12% 21% 12% 1% 5% 100%
Urban average 1,691 379 543 508 37 375 3,533
% coverage 48% 11% 15% 14% 1% 11% 100%
Rural average 3,598 797,0 1,460.0 805.0 41.0 292.0 6,993
% coverage 51% 11% 21% 12% 1% 4% 100%
Northern average 3,842 887 1,456 593 38 320 7,135
% coverage 54% 12% 20% 8% 1% 4% 100%
Central average 2,846 674 1,286 917 50 394 6,167
% coverage 46% 11% 21% 15% 1% 6% 100%
Southern average 2,433 731 1,161 736 11 125 5,195
% coverage 47% 14% 22% 14% 0% 2% 100%
Source: Lao Expenditure & Consumption survey 02/03. NSC. 2004)
4 Average Exchange rate in 2003 period was 10500 LAK / 1 US$
Promotion of the Efficient Use of Renewable Energies in Developing Countries EIE-06-256 REEPRO
page 12
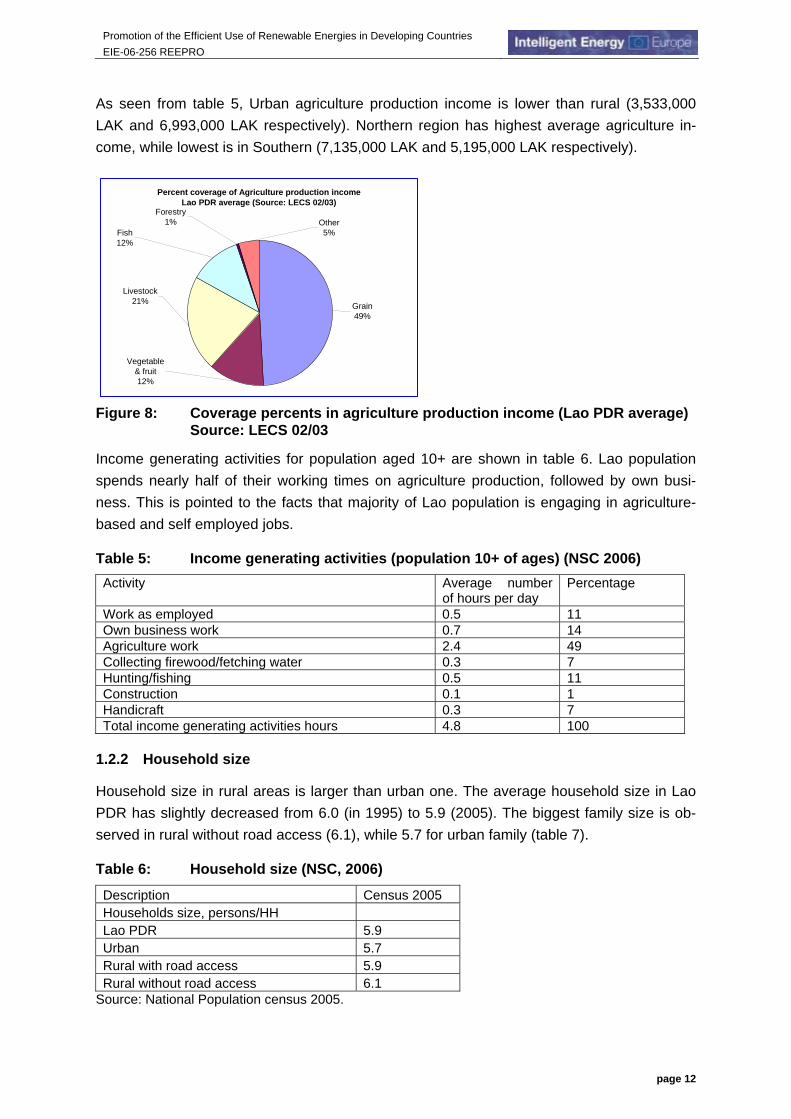
As seen from table 5, Urban agriculture production income is lower than rural (3,533,000 LAK and 6,993,000 LAK respectively). Northern region has highest average agriculture in-come, while lowest is in Southern (7,135,000 LAK and 5,195,000 LAK respectively).
Figure 8: Coverage percents in agriculture production income (Lao PDR average) Source: LECS 02/03
Income generating activities for population aged 10+ are shown in table 6. Lao population spends nearly half of their working times on agriculture production, followed by own busi-ness. This is pointed to the facts that majority of Lao population is engaging in agriculture-based and self employed jobs.
Table 5: Income generating activities (population 10+ of ages) (NSC 2006) Activity Average number
of hours per day Percentage
Work as employed 0.5 11 Own business work 0.7 14 Agriculture work 2.4 49 Collecting firewood/fetching water 0.3 7 Hunting/fishing 0.5 11 Construction 0.1 1 Handicraft 0.3 7 Total income generating activities hours 4.8 100
1.2.2 Household size
Household size in rural areas is larger than urban one. The average household size in Lao PDR has slightly decreased from 6.0 (in 1995) to 5.9 (2005). The biggest family size is ob-served in rural without road access (6.1), while 5.7 for urban family (table 7).
Table 6: Household size (NSC, 2006)
Description Census 2005 Households size, persons/HH Lao PDR 5.9 Urban 5.7 Rural with road access 5.9 Rural without road access 6.1
Source: National Population census 2005.
Percent coverage of Agriculture production incomeLao PDR average (Source: LECS 02/03)
Grain49%
Vegetable& fruit12%
Livestock21%
Fish12%
Forestry 1% Other
5%
Promotion of the Efficient Use of Renewable Energies in Developing Countries EIE-06-256 REEPRO
page 13
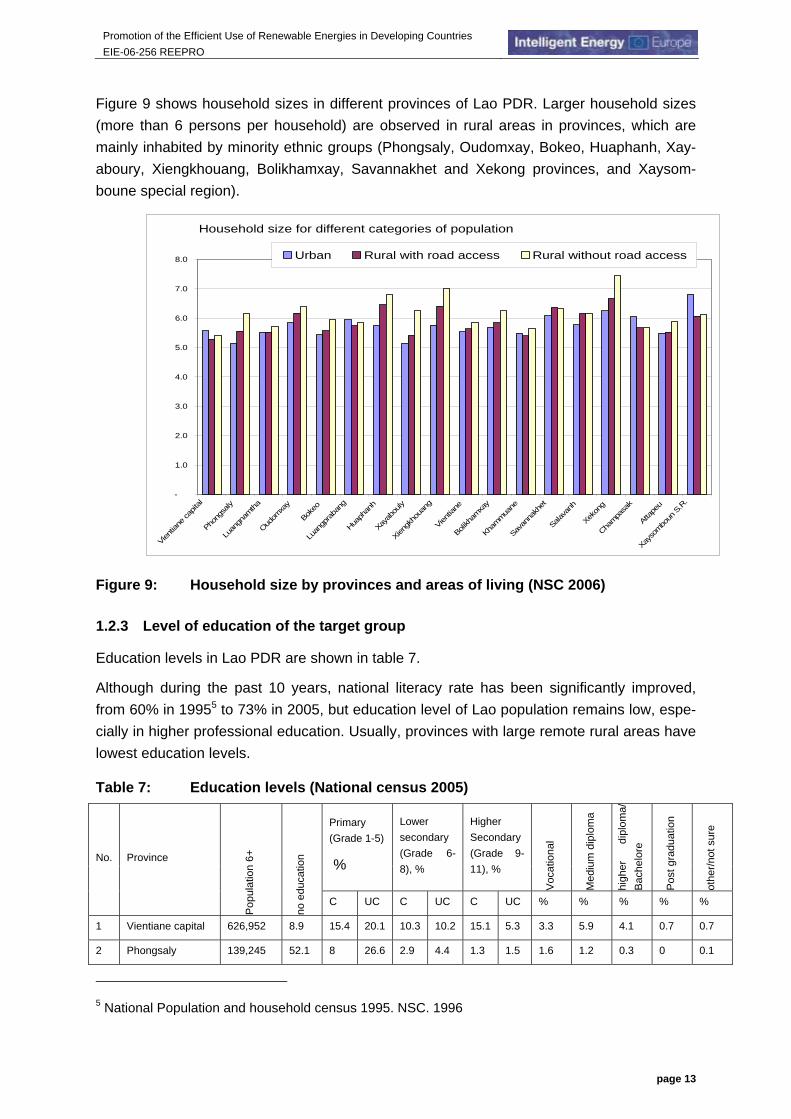
Figure 9 shows household sizes in different provinces of Lao PDR. Larger household sizes (more than 6 persons per household) are observed in rural areas in provinces, which are mainly inhabited by minority ethnic groups (Phongsaly, Oudomxay, Bokeo, Huaphanh, Xay-aboury, Xiengkhouang, Bolikhamxay, Savannakhet and Xekong provinces, and Xaysom-boune special region).
Household size for different categories of population
-
1.0
2.0
3.0
4.0
5.0
6.0
7.0
8.0
Vientia
ne ca
pital
Phong
saly
Luan
gnam
tha
Oudom
xay
Bokeo
Luan
gpra
bang
Huaph
anh
Xayab
ouly
Xiengk
houa
ng
Vientia
ne
Bolikh
amxa
y
Khammua
ne
Sava
nnak
het
Salava
nh
Xekon
g
Champa
sak
Attap
eu
Xayso
mboun
S.R
.
Urban Rural with road access Rural without road access
Figure 9: Household size by provinces and areas of living (NSC 2006)
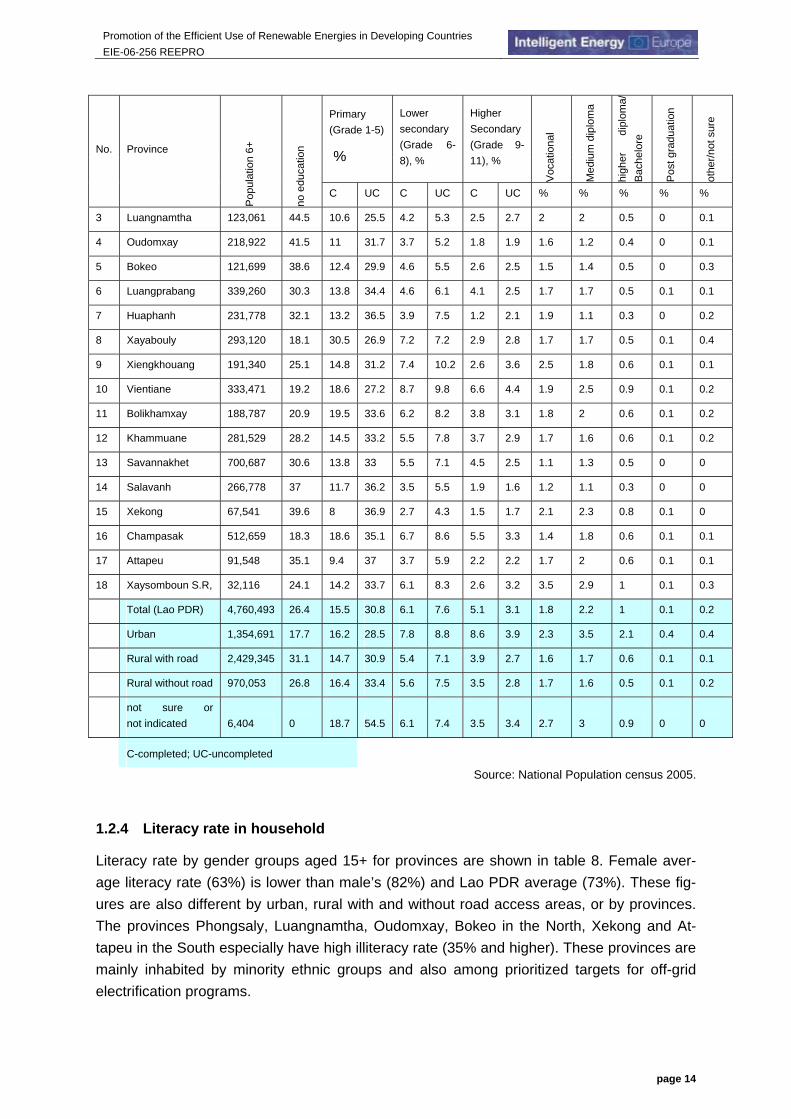
1.2.3 Level of education of the target group
Education levels in Lao PDR are shown in table 7.
Although during the past 10 years, national literacy rate has been significantly improved, from 60% in 19955 to 73% in 2005, but education level of Lao population remains low, espe-cially in higher professional education. Usually, provinces with large remote rural areas have lowest education levels.
Table 7: Education levels (National census 2005)
Primary (Grade 1-5)
%
Lower secondary (Grade 6-8), %
Higher Secondary(Grade 9-11), %
Voc
atio
nal
Med
ium
dip
lom
a
high
er
dipl
oma/
Bac
helo
re
Pos
t gra
duat
ion
othe
r/not
sur
e
No. Province
Pop
ulat
ion
6+
no e
duca
tion
C UC C UC C UC % % % % %
1 Vientiane capital 626,952 8.9 15.4 20.1 10.3 10.2 15.1 5.3 3.3 5.9 4.1 0.7 0.7
2 Phongsaly 139,245 52.1 8 26.6 2.9 4.4 1.3 1.5 1.6 1.2 0.3 0 0.1
5 National Population and household census 1995. NSC. 1996
Promotion of the Efficient Use of Renewable Energies in Developing Countries EIE-06-256 REEPRO
page 14
Primary (Grade 1-5)
%
Lower secondary (Grade 6-8), %
Higher Secondary(Grade 9-11), %
Voc
atio
nal
Med
ium
dip
lom
a
high
er
dipl
oma/
Bac
helo
re
Pos
t gra
duat
ion
othe
r/not
sur
e
No. Province
Pop
ulat
ion
6+
no e
duca
tion
C UC C UC C UC % % % % %
3 Luangnamtha 123,061 44.5 10.6 25.5 4.2 5.3 2.5 2.7 2 2 0.5 0 0.1
4 Oudomxay 218,922 41.5 11 31.7 3.7 5.2 1.8 1.9 1.6 1.2 0.4 0 0.1
5 Bokeo 121,699 38.6 12.4 29.9 4.6 5.5 2.6 2.5 1.5 1.4 0.5 0 0.3
6 Luangprabang 339,260 30.3 13.8 34.4 4.6 6.1 4.1 2.5 1.7 1.7 0.5 0.1 0.1
7 Huaphanh 231,778 32.1 13.2 36.5 3.9 7.5 1.2 2.1 1.9 1.1 0.3 0 0.2
8 Xayabouly 293,120 18.1 30.5 26.9 7.2 7.2 2.9 2.8 1.7 1.7 0.5 0.1 0.4
9 Xiengkhouang 191,340 25.1 14.8 31.2 7.4 10.2 2.6 3.6 2.5 1.8 0.6 0.1 0.1
10 Vientiane 333,471 19.2 18.6 27.2 8.7 9.8 6.6 4.4 1.9 2.5 0.9 0.1 0.2
11 Bolikhamxay 188,787 20.9 19.5 33.6 6.2 8.2 3.8 3.1 1.8 2 0.6 0.1 0.2
12 Khammuane 281,529 28.2 14.5 33.2 5.5 7.8 3.7 2.9 1.7 1.6 0.6 0.1 0.2
13 Savannakhet 700,687 30.6 13.8 33 5.5 7.1 4.5 2.5 1.1 1.3 0.5 0 0
14 Salavanh 266,778 37 11.7 36.2 3.5 5.5 1.9 1.6 1.2 1.1 0.3 0 0
15 Xekong 67,541 39.6 8 36.9 2.7 4.3 1.5 1.7 2.1 2.3 0.8 0.1 0
16 Champasak 512,659 18.3 18.6 35.1 6.7 8.6 5.5 3.3 1.4 1.8 0.6 0.1 0.1
17 Attapeu 91,548 35.1 9.4 37 3.7 5.9 2.2 2.2 1.7 2 0.6 0.1 0.1
18 Xaysomboun S.R, 32,116 24.1 14.2 33.7 6.1 8.3 2.6 3.2 3.5 2.9 1 0.1 0.3
Total (Lao PDR) 4,760,493 26.4 15.5 30.8 6.1 7.6 5.1 3.1 1.8 2.2 1 0.1 0.2
Urban 1,354,691 17.7 16.2 28.5 7.8 8.8 8.6 3.9 2.3 3.5 2.1 0.4 0.4
Rural with road 2,429,345 31.1 14.7 30.9 5.4 7.1 3.9 2.7 1.6 1.7 0.6 0.1 0.1
Rural without road 970,053 26.8 16.4 33.4 5.6 7.5 3.5 2.8 1.7 1.6 0.5 0.1 0.2
not sure or not indicated 6,404 0 18.7 54.5 6.1 7.4 3.5 3.4 2.7 3 0.9 0 0
C-completed; UC-uncompleted
Source: National Population census 2005.
1.2.4 Literacy rate in household
Literacy rate by gender groups aged 15+ for provinces are shown in table 8. Female aver-age literacy rate (63%) is lower than male’s (82%) and Lao PDR average (73%). These fig-ures are also different by urban, rural with and without road access areas, or by provinces. The provinces Phongsaly, Luangnamtha, Oudomxay, Bokeo in the North, Xekong and At-tapeu in the South especially have high illiteracy rate (35% and higher). These provinces are mainly inhabited by minority ethnic groups and also among prioritized targets for off-grid electrification programs.
Promotion of the Efficient Use of Renewable Energies in Developing Countries EIE-06-256 REEPRO
page 15
Table 8: Literacy rate for population aged 15+ (National census 2005) No. Province Population 15+ Female
% Male %
Totally %
1 Vientiane capital 626,952 88.1 95.3 91.7 2 Phongsaly 139,245 33.6 52.9 43.1 3 Luangnamtha 123,061 38.8 63.1 50.6 4 Oudomxay 218,922 39.5 72.8 55.9 5 Bokeo 121,699 44.5 72.3 58.1 6 Luangprabang 339,260 55.1 79.5 67.2 7 Huaphanh 231,778 51.1 78.3 64.7 8 Xayabouly 293,120 73.9 86.9 80.4 9 Xiengkhouang 191,340 61.8 83.7 72.7 10 Vientiane 333,471 70.8 88.3 79.7 11 Bolikhamxay 188,787 68.1 86.2 77.2 12 Khammuane 281,529 59.6 81.1 69.9 13 Savannakhet 700,687 59.2 78.5 68.5 14 Salavanh 266,778 49.4 74.9 61.6 15 Xekong 67,541 48.1 76.0 61.7 16 Champasak 512,659 74.0 89.9 81.8 17 Attapeu 91,548 51.8 77.4 63.9 18 Xaysomboun S.R. 32,116 58.5 84.8 72.6
Total (Lao PDR) 4,760,493 63.2 82.0 72.7 Urban 1,354,691 84.5 94.2 89.3 Rural with road access 2,429,345 59.0 80.8 69.7 Rural without road access 970,053 41.1 67.6 53.9
Source: National census 2005.
1.2.5 Sources of energy
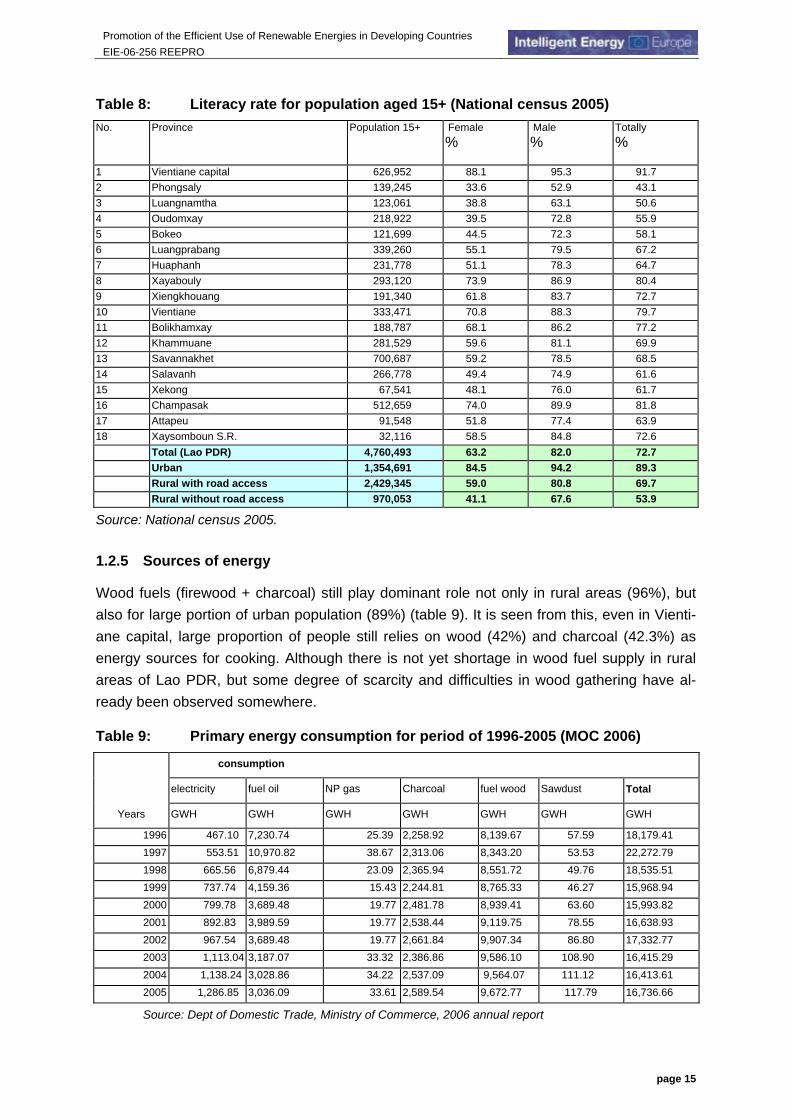
Wood fuels (firewood + charcoal) still play dominant role not only in rural areas (96%), but also for large portion of urban population (89%) (table 9). It is seen from this, even in Vienti-ane capital, large proportion of people still relies on wood (42%) and charcoal (42.3%) as energy sources for cooking. Although there is not yet shortage in wood fuel supply in rural areas of Lao PDR, but some degree of scarcity and difficulties in wood gathering have al-ready been observed somewhere.
Table 9: Primary energy consumption for period of 1996-2005 (MOC 2006)
consumption
electricity fuel oil NP gas Charcoal fuel wood Sawdust Total
Years GWH GWH GWH GWH GWH GWH GWH
1996 467.10 7,230.74 25.39 2,258.92 8,139.67 57.59 18,179.41 1997 553.51 10,970.82 38.67 2,313.06 8,343.20 53.53 22,272.79 1998 665.56 6,879.44 23.09 2,365.94 8,551.72 49.76 18,535.51 1999 737.74 4,159.36 15.43 2,244.81 8,765.33 46.27 15,968.94 2000 799.78 3,689.48 19.77 2,481.78 8,939.41 63.60 15,993.82 2001 892.83 3,989.59 19.77 2,538.44 9,119.75 78.55 16,638.93 2002 967.54 3,689.48 19.77 2,661.84 9,907.34 86.80 17,332.77 2003 1,113.04 3,187.07 33.32 2,386.86 9,586.10 108.90 16,415.29 2004 1,138.24 3,028.86 34.22 2,537.09 9,564.07 111.12 16,413.61 2005 1,286.85 3,036.09 33.61 2,589.54 9,672.77 117.79 16,736.66
Source: Dept of Domestic Trade, Ministry of Commerce, 2006 annual report
Promotion of the Efficient Use of Renewable Energies in Developing Countries EIE-06-256 REEPRO
page 16
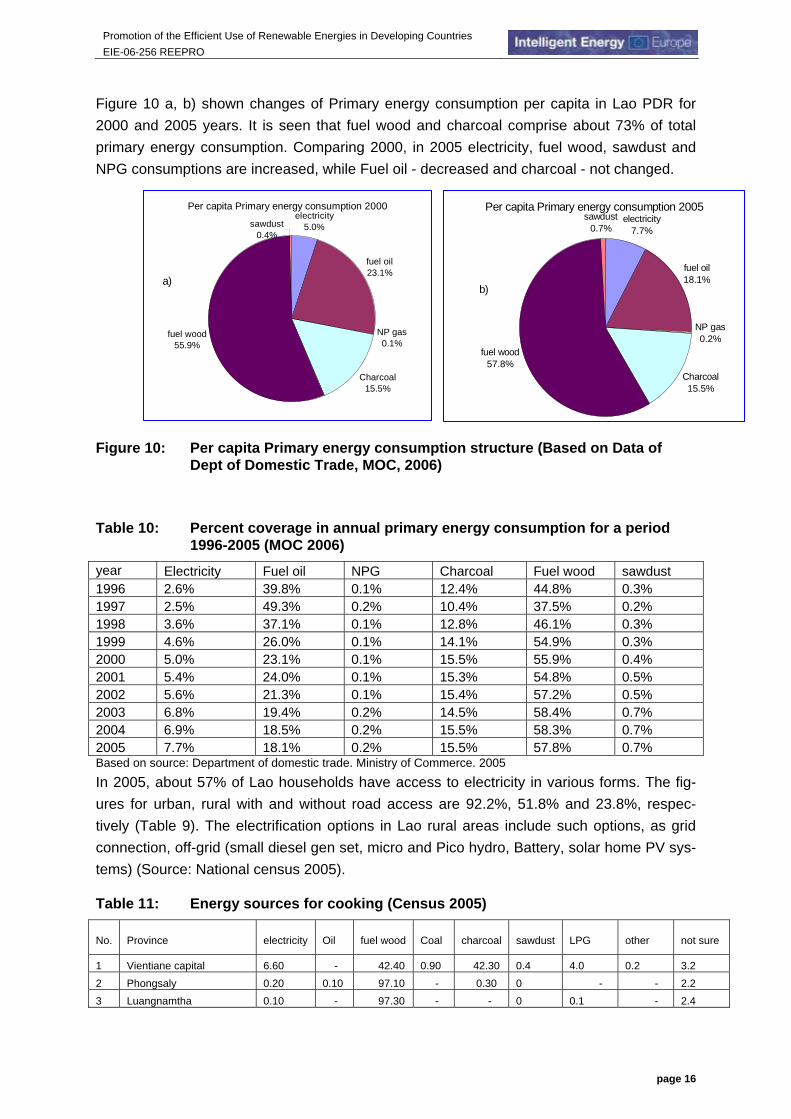
Figure 10 a, b) shown changes of Primary energy consumption per capita in Lao PDR for 2000 and 2005 years. It is seen that fuel wood and charcoal comprise about 73% of total primary energy consumption. Comparing 2000, in 2005 electricity, fuel wood, sawdust and NPG consumptions are increased, while Fuel oil - decreased and charcoal - not changed.
Figure 10: Per capita Primary energy consumption structure (Based on Data of Dept of Domestic Trade, MOC, 2006)
Table 10: Percent coverage in annual primary energy consumption for a period 1996-2005 (MOC 2006)
year Electricity Fuel oil NPG Charcoal Fuel wood sawdust 1996 2.6% 39.8% 0.1% 12.4% 44.8% 0.3% 1997 2.5% 49.3% 0.2% 10.4% 37.5% 0.2% 1998 3.6% 37.1% 0.1% 12.8% 46.1% 0.3% 1999 4.6% 26.0% 0.1% 14.1% 54.9% 0.3% 2000 5.0% 23.1% 0.1% 15.5% 55.9% 0.4% 2001 5.4% 24.0% 0.1% 15.3% 54.8% 0.5% 2002 5.6% 21.3% 0.1% 15.4% 57.2% 0.5% 2003 6.8% 19.4% 0.2% 14.5% 58.4% 0.7% 2004 6.9% 18.5% 0.2% 15.5% 58.3% 0.7% 2005 7.7% 18.1% 0.2% 15.5% 57.8% 0.7% Based on source: Department of domestic trade. Ministry of Commerce. 2005
In 2005, about 57% of Lao households have access to electricity in various forms. The fig-ures for urban, rural with and without road access are 92.2%, 51.8% and 23.8%, respec-tively (Table 9). The electrification options in Lao rural areas include such options, as grid connection, off-grid (small diesel gen set, micro and Pico hydro, Battery, solar home PV sys-tems) (Source: National census 2005).
Table 11: Energy sources for cooking (Census 2005)
No. Province electricity Oil fuel wood Coal charcoal sawdust LPG other not sure
1 Vientiane capital 6.60 - 42.40 0.90 42.30 0.4 4.0 0.2 3.2 2 Phongsaly 0.20 0.10 97.10 - 0.30 0 - - 2.2 3 Luangnamtha 0.10 - 97.30 - - 0 0.1 - 2.4
Per capita Primary energy consumption 2005electricity
7.7%
fuel oil18.1%
NP gas0.2%
Charcoal15.5%
fuel wood57.8%
sawdust0.7%
b)
Per capita Primary energy consumption 2000electricity
5.0%
NP gas0.1%
Charcoal15.5%
fuel wood55.9%
sawdust0.4%
fuel oil23.1%
a)
Promotion of the Efficient Use of Renewable Energies in Developing Countries EIE-06-256 REEPRO
page 17
No. Province electricity Oil fuel wood Coal charcoal sawdust LPG other not sure
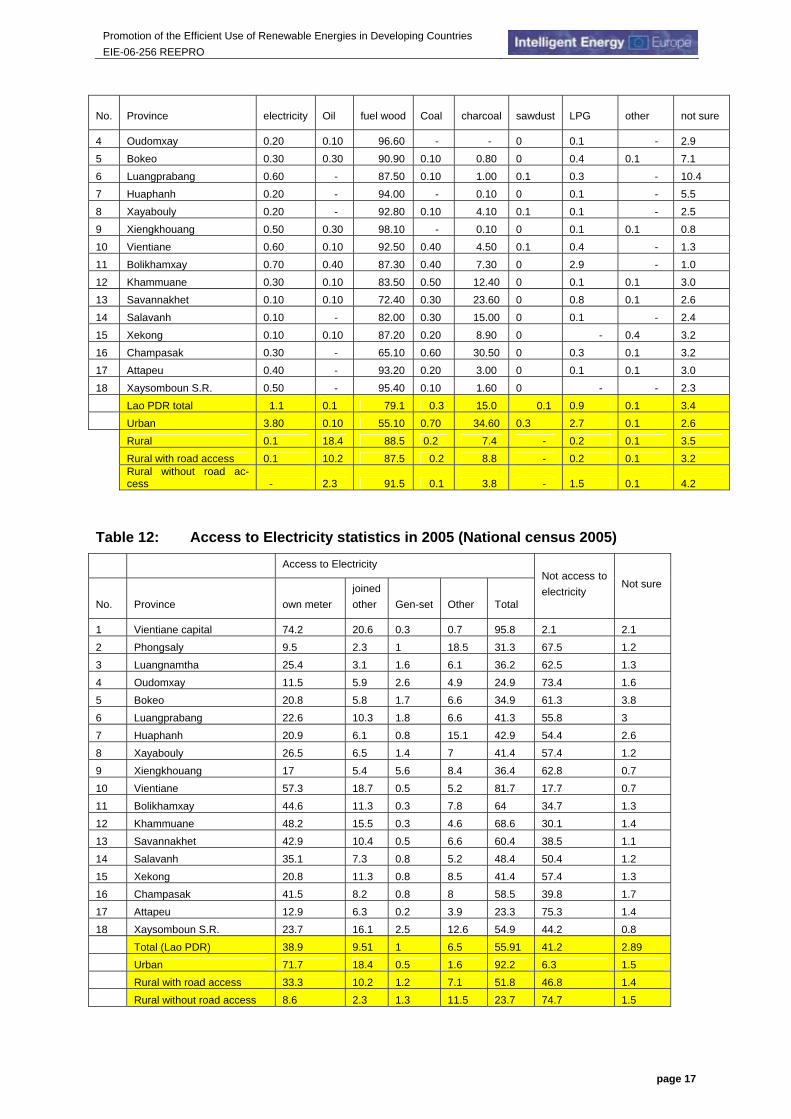
4 Oudomxay 0.20 0.10 96.60 - - 0 0.1 - 2.9 5 Bokeo 0.30 0.30 90.90 0.10 0.80 0 0.4 0.1 7.1 6 Luangprabang 0.60 - 87.50 0.10 1.00 0.1 0.3 - 10.4 7 Huaphanh 0.20 - 94.00 - 0.10 0 0.1 - 5.5 8 Xayabouly 0.20 - 92.80 0.10 4.10 0.1 0.1 - 2.5 9 Xiengkhouang 0.50 0.30 98.10 - 0.10 0 0.1 0.1 0.8 10 Vientiane 0.60 0.10 92.50 0.40 4.50 0.1 0.4 - 1.3 11 Bolikhamxay 0.70 0.40 87.30 0.40 7.30 0 2.9 - 1.0 12 Khammuane 0.30 0.10 83.50 0.50 12.40 0 0.1 0.1 3.0 13 Savannakhet 0.10 0.10 72.40 0.30 23.60 0 0.8 0.1 2.6 14 Salavanh 0.10 - 82.00 0.30 15.00 0 0.1 - 2.4 15 Xekong 0.10 0.10 87.20 0.20 8.90 0 - 0.4 3.2 16 Champasak 0.30 - 65.10 0.60 30.50 0 0.3 0.1 3.2 17 Attapeu 0.40 - 93.20 0.20 3.00 0 0.1 0.1 3.0 18 Xaysomboun S.R. 0.50 - 95.40 0.10 1.60 0 - - 2.3 Lao PDR total 1.1 0.1 79.1 0.3 15.0 0.1 0.9 0.1 3.4 Urban 3.80 0.10 55.10 0.70 34.60 0.3 2.7 0.1 2.6 Rural 0.1 18.4 88.5 0.2 7.4 - 0.2 0.1 3.5 Rural with road access 0.1 10.2 87.5 0.2 8.8 - 0.2 0.1 3.2
Rural without road ac-cess - 2.3 91.5 0.1 3.8 - 1.5 0.1 4.2
Table 12: Access to Electricity statistics in 2005 (National census 2005)
Access to Electricity
No. Province own meter joined other Gen-set Other Total
Not access to electricity Not sure
1 Vientiane capital 74.2 20.6 0.3 0.7 95.8 2.1 2.1 2 Phongsaly 9.5 2.3 1 18.5 31.3 67.5 1.2 3 Luangnamtha 25.4 3.1 1.6 6.1 36.2 62.5 1.3 4 Oudomxay 11.5 5.9 2.6 4.9 24.9 73.4 1.6 5 Bokeo 20.8 5.8 1.7 6.6 34.9 61.3 3.8 6 Luangprabang 22.6 10.3 1.8 6.6 41.3 55.8 3 7 Huaphanh 20.9 6.1 0.8 15.1 42.9 54.4 2.6 8 Xayabouly 26.5 6.5 1.4 7 41.4 57.4 1.2 9 Xiengkhouang 17 5.4 5.6 8.4 36.4 62.8 0.7 10 Vientiane 57.3 18.7 0.5 5.2 81.7 17.7 0.7 11 Bolikhamxay 44.6 11.3 0.3 7.8 64 34.7 1.3 12 Khammuane 48.2 15.5 0.3 4.6 68.6 30.1 1.4 13 Savannakhet 42.9 10.4 0.5 6.6 60.4 38.5 1.1 14 Salavanh 35.1 7.3 0.8 5.2 48.4 50.4 1.2 15 Xekong 20.8 11.3 0.8 8.5 41.4 57.4 1.3 16 Champasak 41.5 8.2 0.8 8 58.5 39.8 1.7 17 Attapeu 12.9 6.3 0.2 3.9 23.3 75.3 1.4 18 Xaysomboun S.R. 23.7 16.1 2.5 12.6 54.9 44.2 0.8 Total (Lao PDR) 38.9 9.51 1 6.5 55.91 41.2 2.89 Urban 71.7 18.4 0.5 1.6 92.2 6.3 1.5 Rural with road access 33.3 10.2 1.2 7.1 51.8 46.8 1.4 Rural without road access 8.6 2.3 1.3 11.5 23.7 74.7 1.5
Promotion of the Efficient Use of Renewable Energies in Developing Countries EIE-06-256 REEPRO
page 18
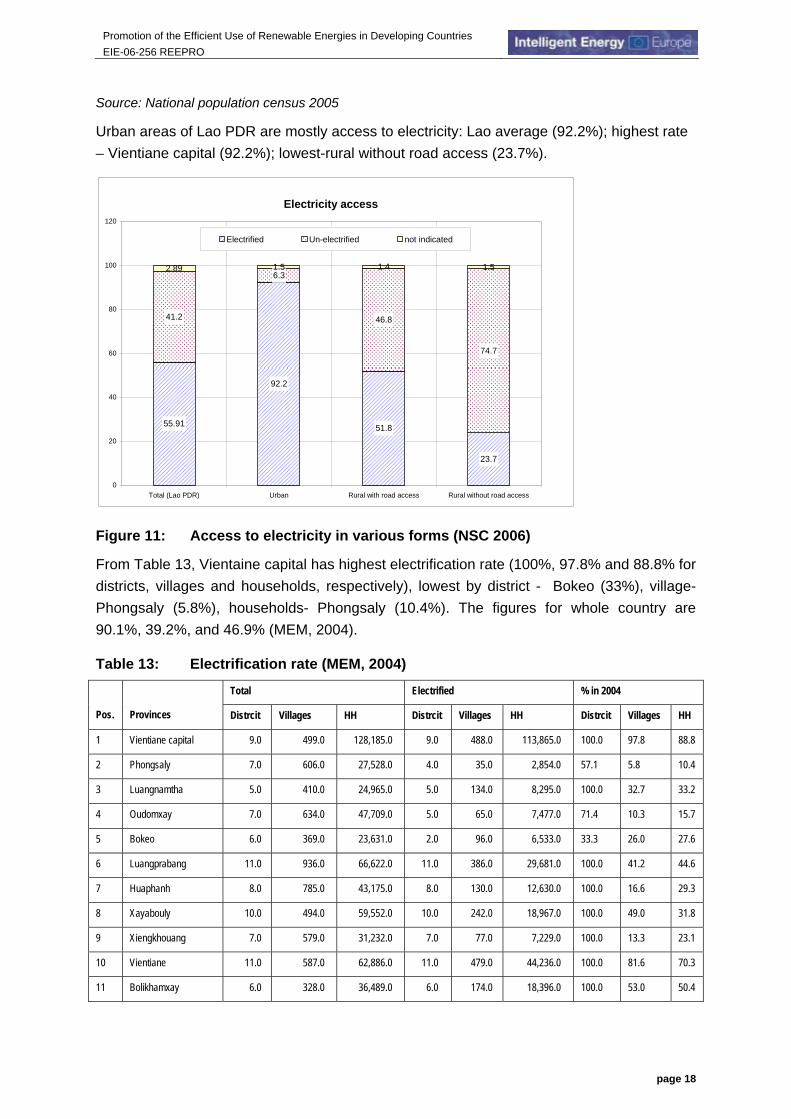
Source: National population census 2005
Urban areas of Lao PDR are mostly access to electricity: Lao average (92.2%); highest rate – Vientiane capital (92.2%); lowest-rural without road access (23.7%).
Electricity access
55.91
92.2
51.8
23.7
41.2
6.3
46.8
74.7
2.89 1.5 1.4 1.5
0
20
40
60
80
100
120
Total (Lao PDR) Urban Rural with road access Rural without road access
Electrified Un-electrified not indicated
Figure 11: Access to electricity in various forms (NSC 2006)
From Table 13, Vientaine capital has highest electrification rate (100%, 97.8% and 88.8% for districts, villages and households, respectively), lowest by district - Bokeo (33%), village- Phongsaly (5.8%), households- Phongsaly (10.4%). The figures for whole country are 90.1%, 39.2%, and 46.9% (MEM, 2004).
Table 13: Electrification rate (MEM, 2004)
Total Electrified % in 2004 Pos. Provinces Distrcit Villages HH Distrcit Villages HH Distrcit Villages HH
1 Vientiane capital 9.0 499.0 128,185.0 9.0 488.0 113,865.0 100.0 97.8 88.8
2 Phongsaly 7.0 606.0 27,528.0 4.0 35.0 2,854.0 57.1 5.8 10.4
3 Luangnamtha 5.0 410.0 24,965.0 5.0 134.0 8,295.0 100.0 32.7 33.2
4 Oudomxay 7.0 634.0 47,709.0 5.0 65.0 7,477.0 71.4 10.3 15.7
5 Bokeo 6.0 369.0 23,631.0 2.0 96.0 6,533.0 33.3 26.0 27.6
6 Luangprabang 11.0 936.0 66,622.0 11.0 386.0 29,681.0 100.0 41.2 44.6
7 Huaphanh 8.0 785.0 43,175.0 8.0 130.0 12,630.0 100.0 16.6 29.3
8 Xayabouly 10.0 494.0 59,552.0 10.0 242.0 18,967.0 100.0 49.0 31.8
9 Xiengkhouang 7.0 579.0 31,232.0 7.0 77.0 7,229.0 100.0 13.3 23.1
10 Vientiane 11.0 587.0 62,886.0 11.0 479.0 44,236.0 100.0 81.6 70.3
11 Bolikhamxay 6.0 328.0 36,489.0 6.0 174.0 18,396.0 100.0 53.0 50.4
Promotion of the Efficient Use of Renewable Energies in Developing Countries EIE-06-256 REEPRO
page 19
Total Electrified % in 2004 Pos. Provinces Distrcit Villages HH Distrcit Villages HH Distrcit Villages HH
12 Khammuane 9.0 804.0 60,929.0 9.0 474.0 34,467.0 100.0 59.0 56.6
13 Savannakhet 15.0 1,545.0 132,560.0 14.0 631.0 67,796.0 93.3 40.8 51.1
14 Salavanh 8.0 724.0 51,810.0 7.0 264.0 19,622.0 87.5 36.5 37.9
15 Xekong 4.0 262.0 11,267.0 3.0 34.0 3,543.0 75.0 13.0 31.4
16 Champasak 10.0 924.0 100,346.0 10.0 453.0 37,680.0 100.0 49.0 37.6
17 Attapeu 5.0 210.0 18,432.0 3.0 36.0 2,717.0 60.0 17.1 14.7
18 Xaysomboun S.R. 3.0 85.0 5,664.0 3.0 31.0 1,661.0 100.0 36.5% 29.3
Total (Lao PDR) 141.0 10,781.0 932,982.0 127.0 4,229.0 437,649.0 90.1 39.2 46.9
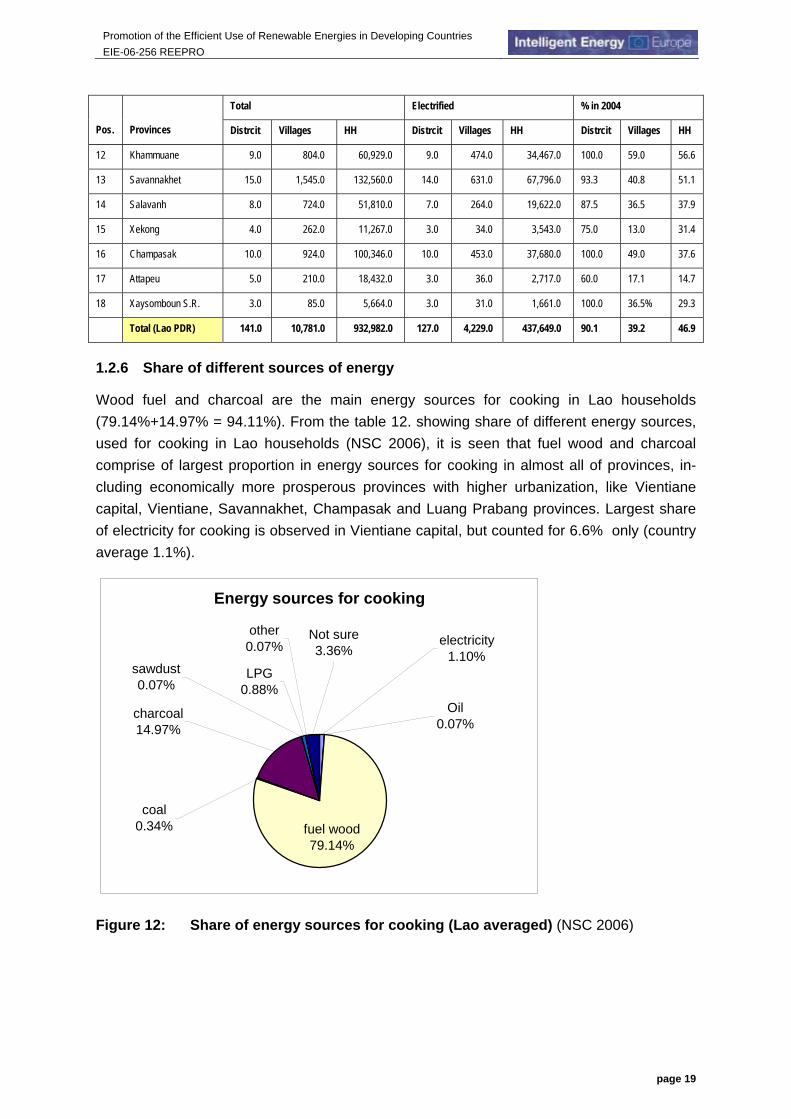
1.2.6 Share of different sources of energy
Wood fuel and charcoal are the main energy sources for cooking in Lao households (79.14%+14.97% = 94.11%). From the table 12. showing share of different energy sources, used for cooking in Lao households (NSC 2006), it is seen that fuel wood and charcoal comprise of largest proportion in energy sources for cooking in almost all of provinces, in-cluding economically more prosperous provinces with higher urbanization, like Vientiane capital, Vientiane, Savannakhet, Champasak and Luang Prabang provinces. Largest share of electricity for cooking is observed in Vientiane capital, but counted for 6.6% only (country average 1.1%).
Energy sources for cooking
LPG0.88%
other 0.07%
Not sure3.36%
sawdust0.07%
charcoal14.97%
coal0.34%
electricity1.10%
Oil0.07%
fuel wood79.14%
Figure 12: Share of energy sources for cooking (Lao averaged) (NSC 2006)
Promotion of the Efficient Use of Renewable Energies in Developing Countries EIE-06-256 REEPRO
page 20
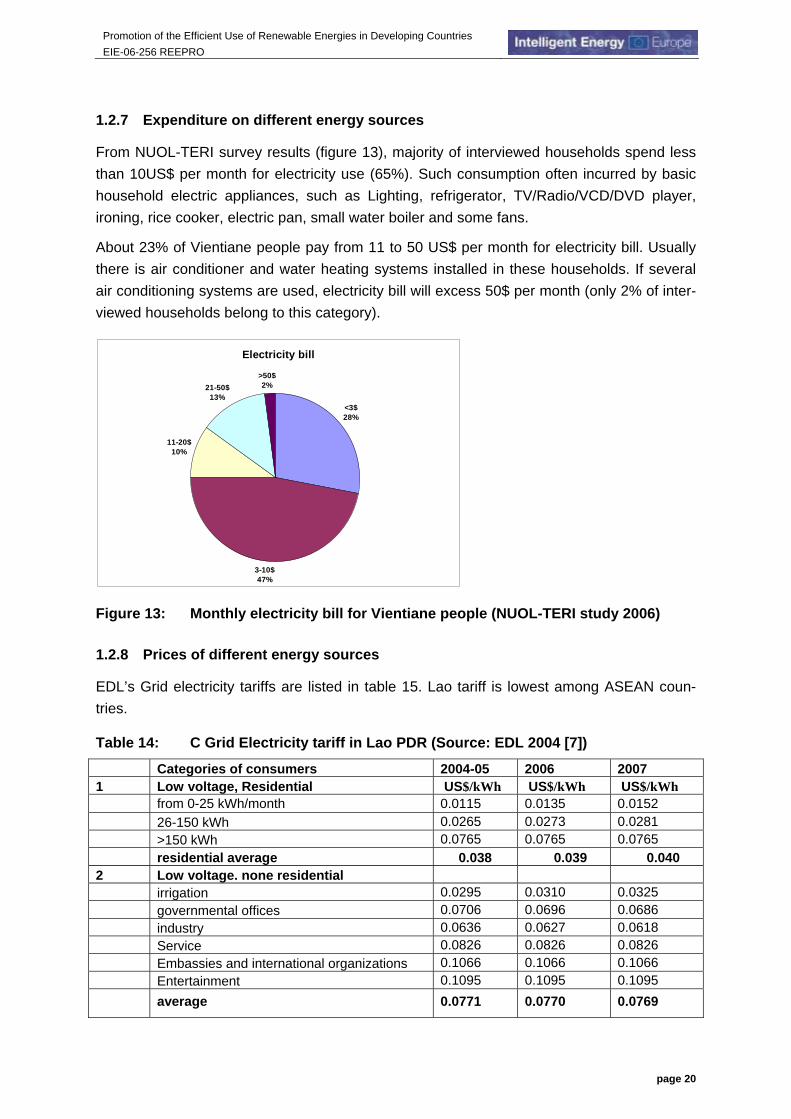
1.2.7 Expenditure on different energy sources
From NUOL-TERI survey results (figure 13), majority of interviewed households spend less than 10US$ per month for electricity use (65%). Such consumption often incurred by basic household electric appliances, such as Lighting, refrigerator, TV/Radio/VCD/DVD player, ironing, rice cooker, electric pan, small water boiler and some fans.
About 23% of Vientiane people pay from 11 to 50 US$ per month for electricity bill. Usually there is air conditioner and water heating systems installed in these households. If several air conditioning systems are used, electricity bill will excess 50$ per month (only 2% of inter-viewed households belong to this category).
Electricity bill
<3$28%
3-10$47%
11-20$10%
21-50$13%
>50$2%
Figure 13: Monthly electricity bill for Vientiane people (NUOL-TERI study 2006)
1.2.8 Prices of different energy sources
EDL’s Grid electricity tariffs are listed in table 15. Lao tariff is lowest among ASEAN coun-tries.
Table 14: C Grid Electricity tariff in Lao PDR (Source: EDL 2004 [7])
Categories of consumers 2004-05 2006 2007 1 Low voltage, Residential US$/kWh US$/kWh US$/kWh from 0-25 kWh/month 0.0115 0.0135 0.0152 26-150 kWh 0.0265 0.0273 0.0281 >150 kWh 0.0765 0.0765 0.0765 residential average 0.038 0.039 0.040 2 Low voltage. none residential irrigation 0.0295 0.0310 0.0325 governmental offices 0.0706 0.0696 0.0686 industry 0.0636 0.0627 0.0618 Service 0.0826 0.0826 0.0826 Embassies and international organizations 0.1066 0.1066 0.1066 Entertainment 0.1095 0.1095 0.1095 average 0.0771 0.0770 0.0769
Promotion of the Efficient Use of Renewable Energies in Developing Countries EIE-06-256 REEPRO
page 21
Categories of consumers 2004-05 2006 2007 3 Medium Voltage, none-residential Irrigation 0.0251 0.0263 0.0276 Industry 0.0541 0.0533 0.0526 Governmental Office 0.0600 0.0592 0.0583 General business 0.0702 0.0702 0.0702 Average 0.0524 0.0523 0.0522 Source: EDL annual report 2005.
As a tradition, wood fuel in rural areas are for free. People collect the wood from the sur-rounding community production forests or from plantation clearance. Some times, rural peo-ple collect fuel wood and then sell to urban people in district or provincial centres, of course, by negligible low prices. Table 14 shows household expenditure for some energy sources in rural areas of Lao PDR.
Table 15: C Household expenditure for energy sources (Ghimire et al, 2003) Type of fuel Consumption per
household per monthPrice per unit Expenditure per year
Wood 25 to 35 Free available Free or up to 6 US$Charcoal 25 to 40 kg 0.02-0.04 US$/kg 6.00-19.2 US$
Kerosene 2 to 4 L 0.40-0.50 US$/L 9.6-19.2 US$
As seen from table 17, showing results of two national censuses 1995 and 2005, use of biomass for cooking has decreased (-15%), while coal and LPG significantly increased (275% and 400% respectively). Use electricity also decreased (-50%). The reasons of de-creasing use of electricity would be: (1) people turned to use more efficient electric appli-ances for cooking (such as microwave, saving and accumulating water boiler and rice cooker, (2) raised awareness on energy saving; (3) electric appliances are more accessible and available, (4) better living conditions
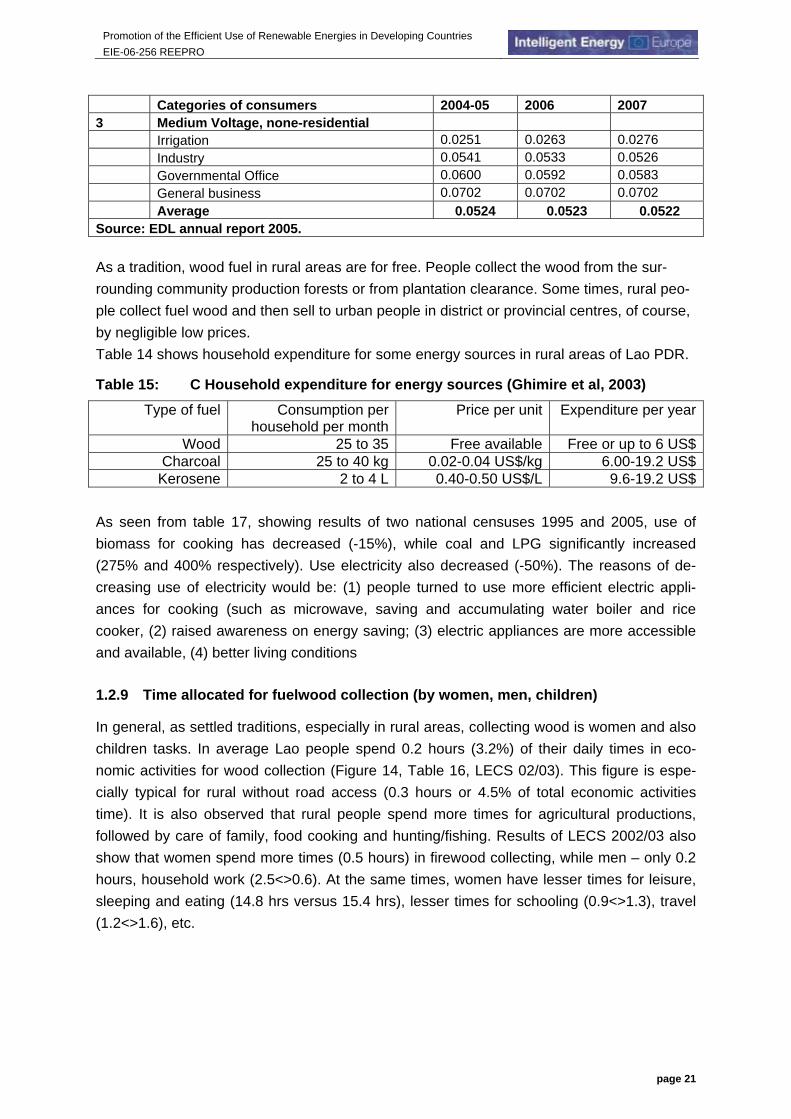
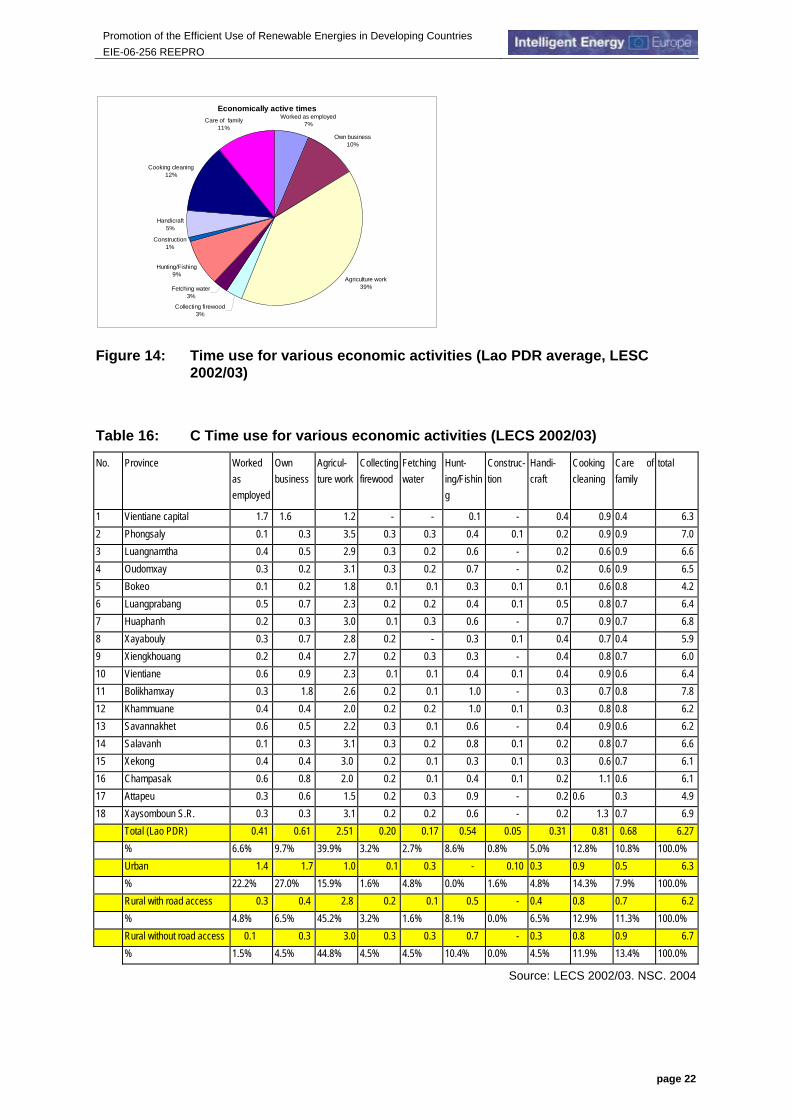
1.2.9 Time allocated for fuelwood collection (by women, men, children)
In general, as settled traditions, especially in rural areas, collecting wood is women and also children tasks. In average Lao people spend 0.2 hours (3.2%) of their daily times in eco-nomic activities for wood collection (Figure 14, Table 16, LECS 02/03). This figure is espe-cially typical for rural without road access (0.3 hours or 4.5% of total economic activities time). It is also observed that rural people spend more times for agricultural productions, followed by care of family, food cooking and hunting/fishing. Results of LECS 2002/03 also show that women spend more times (0.5 hours) in firewood collecting, while men – only 0.2 hours, household work (2.5<>0.6). At the same times, women have lesser times for leisure, sleeping and eating (14.8 hrs versus 15.4 hrs), lesser times for schooling (0.9<>1.3), travel (1.2<>1.6), etc.
Promotion of the Efficient Use of Renewable Energies in Developing Countries EIE-06-256 REEPRO
page 22
Economically active timesWorked as employed
7%
Own business10%
Agriculture work39%
Collecting firewood3%
Fetching water3%
Hunting/Fishing9%
Construction1%
Handicraft5%
Cooking cleaning12%
Care of family11%
Figure 14: Time use for various economic activities (Lao PDR average, LESC 2002/03)
Table 16: C Time use for various economic activities (LECS 2002/03)
No. Province Worked as employed
Own business
Agricul-ture work
Collecting firewood
Fetching water
Hunt-ing/Fishing
Construc-tion
Handi-craft
Cooking cleaning
Care of family
total
1 Vientiane capital 1.7 1.6 1.2 - - 0.1 - 0.4 0.9 0.4 6.3 2 Phongsaly 0.1 0.3 3.5 0.3 0.3 0.4 0.1 0.2 0.9 0.9 7.0 3 Luangnamtha 0.4 0.5 2.9 0.3 0.2 0.6 - 0.2 0.6 0.9 6.6 4 Oudomxay 0.3 0.2 3.1 0.3 0.2 0.7 - 0.2 0.6 0.9 6.5 5 Bokeo 0.1 0.2 1.8 0.1 0.1 0.3 0.1 0.1 0.6 0.8 4.2 6 Luangprabang 0.5 0.7 2.3 0.2 0.2 0.4 0.1 0.5 0.8 0.7 6.4 7 Huaphanh 0.2 0.3 3.0 0.1 0.3 0.6 - 0.7 0.9 0.7 6.8 8 Xayabouly 0.3 0.7 2.8 0.2 - 0.3 0.1 0.4 0.7 0.4 5.9 9 Xiengkhouang 0.2 0.4 2.7 0.2 0.3 0.3 - 0.4 0.8 0.7 6.0 10 Vientiane 0.6 0.9 2.3 0.1 0.1 0.4 0.1 0.4 0.9 0.6 6.4 11 Bolikhamxay 0.3 1.8 2.6 0.2 0.1 1.0 - 0.3 0.7 0.8 7.8 12 Khammuane 0.4 0.4 2.0 0.2 0.2 1.0 0.1 0.3 0.8 0.8 6.2 13 Savannakhet 0.6 0.5 2.2 0.3 0.1 0.6 - 0.4 0.9 0.6 6.2 14 Salavanh 0.1 0.3 3.1 0.3 0.2 0.8 0.1 0.2 0.8 0.7 6.6 15 Xekong 0.4 0.4 3.0 0.2 0.1 0.3 0.1 0.3 0.6 0.7 6.1 16 Champasak 0.6 0.8 2.0 0.2 0.1 0.4 0.1 0.2 1.1 0.6 6.1 17 Attapeu 0.3 0.6 1.5 0.2 0.3 0.9 - 0.2 0.6 0.3 4.9 18 Xaysomboun S.R. 0.3 0.3 3.1 0.2 0.2 0.6 - 0.2 1.3 0.7 6.9
Total (Lao PDR) 0.41 0.61 2.51 0.20 0.17 0.54 0.05 0.31 0.81 0.68 6.27 % 6.6% 9.7% 39.9% 3.2% 2.7% 8.6% 0.8% 5.0% 12.8% 10.8% 100.0% Urban 1.4 1.7 1.0 0.1 0.3 - 0.10 0.3 0.9 0.5 6.3 % 22.2% 27.0% 15.9% 1.6% 4.8% 0.0% 1.6% 4.8% 14.3% 7.9% 100.0% Rural with road access 0.3 0.4 2.8 0.2 0.1 0.5 - 0.4 0.8 0.7 6.2 % 4.8% 6.5% 45.2% 3.2% 1.6% 8.1% 0.0% 6.5% 12.9% 11.3% 100.0% Rural without road access 0.1 0.3 3.0 0.3 0.3 0.7 - 0.3 0.8 0.9 6.7 % 1.5% 4.5% 44.8% 4.5% 4.5% 10.4% 0.0% 4.5% 11.9% 13.4% 100.0%
Source: LECS 2002/03. NSC. 2004
Promotion of the Efficient Use of Renewable Energies in Developing Countries EIE-06-256 REEPRO
page 23
1.2.10 Energy end use
• Cooking: mainly fire wood, charcoal, electricity (urban area), coal (briqquette coal), LPG (see table 15)
• Lighting: In rural areas, energy sources for lighting are comprised mainly of kerosene, battery (e.g., car battery, dry cell), candle, firewood,
• Motive power: mini - tractor, mini truck, small diesel engine, motorbike, water wheel (pumping, rice hulling, etc)
• Water heating: fire wood, electricity (for electrified areas), solar water heating (popular in Northern provinces, equipment is imported from China)
• Space heating: firewood, charcoal, natural solar heating, • TV, radio, phone, other entertainment: grid electricity (central grid or community mini
grid), solar home system, small diesel gen-set, Pico hydros, car batteries (usually get charged in nearby electrified villages or from gen-set, or Pico hydros),
• Refrigeration: use if electrified areas only. Solar refrigerator are available in Lao market, but quite expensive and usually used for vaccine storage and purchased by donated / grant money only.
• Air conditioning, fans. In some electrified areas, fans are used. But Air conditioning usu-ally is not applied due to power available, house stile, etc.
• Productive activities. Typical productive activities in rural areas of Lao PDR: 1) rice huller (mostly driven by small diesel gen-set, some where also water wheel); 2) small carpentry tools (diesel gen-set, pico hydros); 3) Irrigation pump (usually run by diesel engine of mini tractor); 4) fodder grinder/mixer (small diesel),
Promotion of the Efficient Use of Renewable Energies in Developing Countries EIE-06-256 REEPRO
page 24
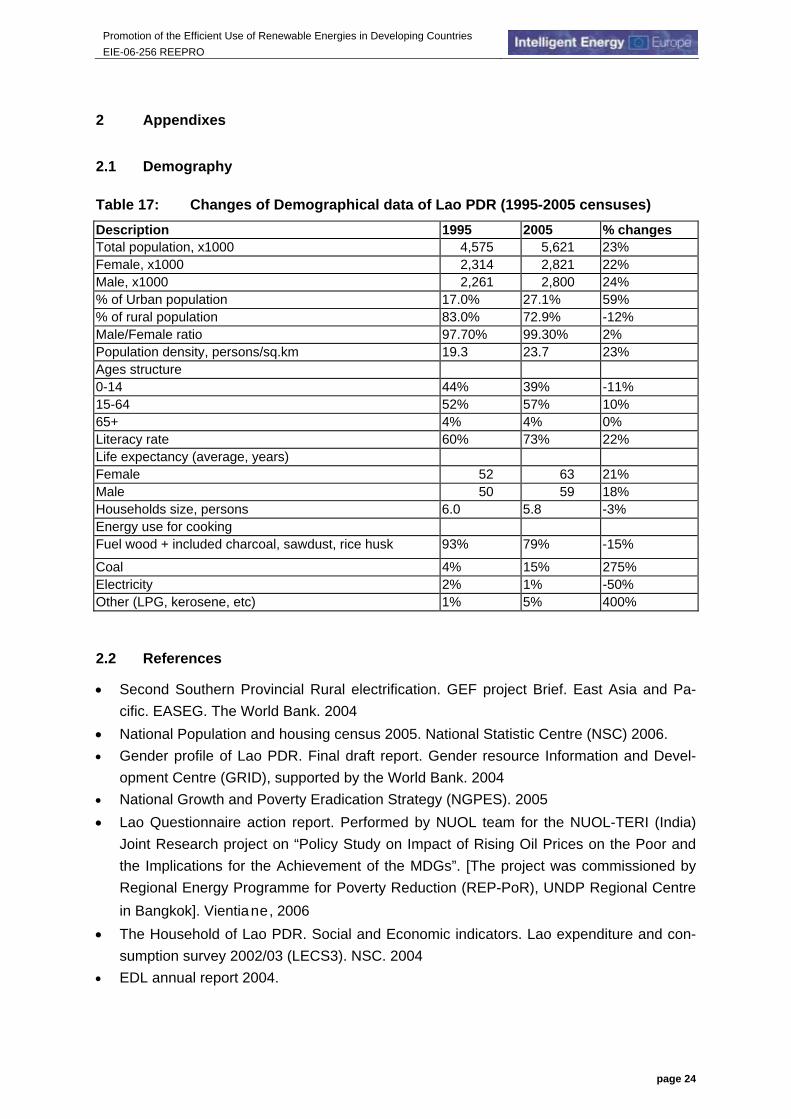
2 Appendixes
2.1 Demography
Table 17: Changes of Demographical data of Lao PDR (1995-2005 censuses) Description 1995 2005 % changes Total population, x1000 4,575 5,621 23% Female, x1000 2,314 2,821 22% Male, x1000 2,261 2,800 24% % of Urban population 17.0% 27.1% 59% % of rural population 83.0% 72.9% -12% Male/Female ratio 97.70% 99.30% 2% Population density, persons/sq.km 19.3 23.7 23% Ages structure 0-14 44% 39% -11% 15-64 52% 57% 10% 65+ 4% 4% 0% Literacy rate 60% 73% 22% Life expectancy (average, years) Female 52 63 21% Male 50 59 18% Households size, persons 6.0 5.8 -3% Energy use for cooking Fuel wood + included charcoal, sawdust, rice husk 93% 79% -15%
Coal 4% 15% 275% Electricity 2% 1% -50% Other (LPG, kerosene, etc) 1% 5% 400%
2.2 References
• Second Southern Provincial Rural electrification. GEF project Brief. East Asia and Pa-cific. EASEG. The World Bank. 2004
• National Population and housing census 2005. National Statistic Centre (NSC) 2006. • Gender profile of Lao PDR. Final draft report. Gender resource Information and Devel-
opment Centre (GRID), supported by the World Bank. 2004 • National Growth and Poverty Eradication Strategy (NGPES). 2005
• Lao Questionnaire action report. Performed by NUOL team for the NUOL-TERI (India) Joint Research project on “Policy Study on Impact of Rising Oil Prices on the Poor and the Implications for the Achievement of the MDGs”. [The project was commissioned by Regional Energy Programme for Poverty Reduction (REP-PoR), UNDP Regional Centre in Bangkok]. Vientiane, 2006
• The Household of Lao PDR. Social and Economic indicators. Lao expenditure and con-sumption survey 2002/03 (LECS3). NSC. 2004
• EDL annual report 2004.