Embed Size (px)
Citation preview
Socioeconomic Indicators Report
THE SACRAMENTO SAN JOAQUIN DELTAM. Anne VisserCatherine BrinkleyJessica Zlotnicki
January 2019
Suggested Citation: Visser, M.A.; Brinkley, C.; Zlotnicki, J. (2018) Socioeconomic Indicators Report: The Sacramento-San Joaquin Delta. Sacramento, CA: The Delta Protection Commission.


TABLE OF CONTENTS ABOUT THIS REPORT 1 THE SACRAMENTO-SAN JOAQUIN DELTA 3 KEY FINDINGS 7
POPULATION 10 Population by Age Groups 11 Primary and Secondary Level Education Completion 12 School District Poverty 13
JOBS AND THE ECONOMY 14 Unemployment Rate 15 Median Household Income 16 Median Individual Earnings 17 Average Commute Time 17
WORKING LANDS 18 Production by Land use 19 Trends in Production 20 Land Conversion 22 Land Cover 24 Fishing and Hunting Licenses 26 State Park Use Data 27
HOUSING AND ROADS 28 Median Home Value 29 Homeownership 30 Homeowner and Rental Vacancy Rates 31 Overcrowded Housing 31 Road Pavement Conditions 32
EDUCATION 34 Enrollment Characteristics 35 Cost-adjusted Revenues Per Pupil 36 High School Graduation Rate 37
APPENDIX A 38

2
ABOUT THIS REPORT The Socioeconomic Indicators Report provides a quantitative snapshot for benchmarking policy progress in the Sacramento-San Joaquin River Delta region (the Delta. The Delta contains historic, economic, cultural, natural, and agricultural resources that benefit both the residents and visitors who enjoy the region. The State’s goals for the Delta to provide a reliable water supply for California and protect, restore, and enhance the Delta ecosystem are to be achieved in a manner that protects and enhances the unique cultural, recreational, natural resource, and agricultural values of the Delta as an evolving place (Public Resources Code section 29702 and California Water Code section 85054). Policies in the Delta are focused on protecting agriculture, increasing agricultural economic vitality, and ensuring environmental health, while continuing to provide high-quality amenities to its residents and visitors.
This policy focus is rooted in the unique history and geography of the region. Over half a million people live in the Delta, which encompasses 740,000 acres. Nestled between the highly urbanized San Francisco Bay Area and the metropolitan areas of Stockton and Sacramento, the Delta is an important agricultural area and waterway for the Golden State. Formed by the confluence of the state’s largest rivers, the Delta provides drinking water for millions of Californians and filters over 50% of all California runoff. The majority of the Delta’s total land area comprises active farms, with 75% on prime agricultural soils. By comparison, only 18 percent of the state’s agricultural land is classified as prime farmland. The Delta supports a $30 billion agricultural economy1, and the diverse microclimates of the region provide habitats for wildlife, migratory birds, and numerous fish species. Over 1,000 miles of levees encircle the Delta providing protection for farms, cities, schools, and people.
HOW TO USE THIS REPORT The data presented here offer a set of statistical indicators that can be replicated on a continual basis to monitor and track the socioeconomic health and vitality of the Delta region. The Delta leaders and residents join many communities across America in a concerted effort to take stock of resources and improve quality of life. The indicators combine measures of physical and human capital, revealing characteristics particular to the Delta as a whole along with social characteristics particular to the specific communities. The set of indicators outlined in this report were selected through an iterative process with policymaker and community stakeholders of the Delta region.
1. http://www.calwater. ca.gov/calfed/ newsroom/Levees.html
1

This report uses a regional framework to assess socio-economic well-being. This means it incorporates data from multiple jurisdictions to fit the broader unit of analysis of the Delta. A regional approach is important because the drivers of change and the resulting patterns are not limited to individual communities, but instead are best understood and acted upon in ways that span multiple jurisdictions. In this case, the scale of analysis—the Delta Region—matches the scale of action of the Delta Protection Commission. The indicators selected do not present the entire picture of conditions or issues within the Delta, but they serve as a guide for further research and dialogue. As with any effort of this nature, the data should be used and approached with an understanding that in the future there may be more information available to create a more complete analysis. The indicators assemble publicly available data gathered every year. Five year averages2 are reported where appropriate to improve accuracy in reporting trends. Where possible and meaningful, Delta indicators have been compared to indicators of the State of California and the San Joaquin Valley, another rural/peri-rural and primarily agricultural area. Such comparisons offer context for the Delta findings. Future iterations can track these indicators over time and use these baseline indicators to measure progress to specific policy goals. Future research should track these indicators in consideration with decennial Census data in order to track population growth and turnover in the Delta as it relates to the indicators reported here.
Based on the information, analysis, and structure provided in this report, individual communities may also wish to develop indicators specific to their geography and concerns within the Delta. This report can serve as a guide for developing an indicator-based assessment of smaller communities. The impact of policies implemented or modified can also be assessed based on the indica tors over time.
WHAT MAKES A GOOD INDICATOR? Good indicators are:
1. Clear and understandable, easy tocommunicate in concept, value, andimportance
2. Can be tracked over time, arestatistically measured at regularintervals, and come from a reliablesource
3. Can be verified by triangulatingmultiple sources
4. Measure an outcome rather than aninput
5. Gauge policy efficacy by providing abenchmark to track progress overtime
6. Spatially specific and can allowcomparison to similar regions ofinterest
2. Researchers rely on data collected annually. To improve accuracy or reporting on trends, researchers use five-year averages from American Community Survey (2011–2015). Some data points are median, (eg. median household income), but in this report researchers use the five-year average of median household income, a data point that is collected every year.
2

4
WHAT ARE INDICATORS? Socioeconomic indicators are powerful tools for monitoring and tracking overall quality of life and policy benchmarks. Indicators can help communities and regional public agencies monitor conditions by providing baseline measures against which policy interventions and socioeconomic change can be measured. These tools help to answer some basic questions such as: what are the primary challenges facing communities and regions, and in what ways are they doing well? How well is the economy functioning and where are its key areas of growth? What is the quality of life in the region, and is it improving? What are the implications of current land use and resource policies on the future of the region?
THE SACRAMENTO SAN JOAQUIN DELTA REGION The Delta is defined by its natural and cultural features and the regional boundaries do not neatly follow jurisdictional boundaries such as county lines. The Delta constitutes parts of six counties: Sacramento, San Joaquin, Yolo, Solano, Contra Costa, and Alameda. Political boundaries often form the units of analysis for public data collection, making it difficult to delineate Delta-specific trends from those of adjacent large, urban areas. This report seeks to overcome some of these obstacles in benchmarking policy by providing indicators tailored to the Delta region’s specific boundaries.
While the majority of the region has a rural character comprised of farms and small towns, the edges of the Delta are more urban with higher density developments and residents who commute for employment. The Delta Protection Act of 1992 delineates between a primary and secondary zone within the legal confines of the Delta.
The primary zone encompasses much of the agriculturally focused land, while the secondary zone is more urban-influenced and includes the Delta’s cities and the majority of the Delta’s population.
Policy efforts in the region have been aimed at preserving working farms and clean waterways, particularly in the primary zone. Policies to encourage infill development have also been promoted, particularly in the secondary zone. Given these realities we provide separate analyses of the indicators for the primary and secondary zones in the Delta.
3

4

6
SELECTING AND IDENTIFYING INDICATORS FOR THE DELTA The set of indicators included in this report were identified through an iterative process between UC Davis researchers, stakeholders in the Delta, and the staff of the Delta Protection Commission. During the months of May-August 2016 the research team met with Delta Protection Commission staff and Commission members to review suggested indicators for the region. Based upon these meetings, and substantial feedback from a public presentation of these indicators at the Delta Protection Commission meeting in November 2016, 22 indicators were identified across six categories to be included in the final report.
The final set of indicators was selected with an understanding that they are not an exhaustive measure of socioeconomic conditions in the region. However, given the challenges of the Delta geography these indicators are the best available and most reliable data to provide a comprehensive understanding of the socioeconomic conditions in the region which can be tracked over time.
The 22 indicators included in this statistical snapshot are displayed on page 6.
A detailed description of the data sources for each indicator is included in Appendix A.
Each indicator is explored in detail in the remaining sections of this report.
5

CATEGORY INDICATORS
POPULATION• Population by Age Group• Primary and Secondary Education Levels• School District Poverty
JOBS AND THE ECONOMY
• Unemployment Rate• Median Household Income• Median Individual Earnings• Average Commute Time
WORKING LANDS
• Production by Land Use• Trends in Production• Land Conversion• Land-Cover• Fishing and Hunting Licenses• Park Use
HOUSING AND ROADS
• Median Home Value• Homeownership• Owner and Renter Vacancy Rates• Overcrowded Housing• Pavement Conditions
EDUCATION • Enrollment Characteristics• Cost-adjusted Revenues per Pupil• High School Graduation Rate
6

8
KEY FINDINGSThe Delta has a cyclical economy based in the agriculture and tourism industries. Over two-thirds of the land-cover in the primary zone, and nearly half of the secondary zone are dedicated to active farming. The Delta’s working lands also support a large share of the state’s hunting, with over 12% of hunting licenses issued in Delta-specific zip codes. These economic sectors are affected by global market changes. Total acres of the Delta’s working lands have stayed steady during a recovering economy and housing market, a good indicator that current farmland protection policies are effective.
The Delta’s combination of scenic farmland, high-demand recreational areas and affordable housing near major urban hubs contributes to a high quality of life in the Delta. Life quality for Delta residents is bolstered by school districts which outperform the state average, despite higher childhood poverty rates. High homeownership rates compared to the state also show a long-term community commitment to the Delta and a willingness to invest in its future success.
Labor market dynamics in the region reveal a need to support the Delta’s economic base with infrastructure investments
• Agricultural-based economies like the Delta tend to have higher unemploymentrates than other areas. Unemployment in the Delta remains higher than theunemployment rate in California, but comparable to that of other agricultural-based regions in the state.
• Median household income levels between the primary and secondary zonesindicate two distinct standards of living within the region. Median householdincome in the primary zone is nearly 1/3 less than the median household incomeof the secondary zone.
• Agriculture and tourism are the primary backbones of the Delta’s economy.These industries are cyclical in nature and vulnerable to economic shocks andenvironmental changes (such as recessions and droughts). Monitoring thesesocioeconomic indicators can provide information on how the Delta fares inrelation to state-level trends.
7

• A well-research understanding of how the Delta fares in relation to California'sbroader economic and environmental conditions may also help support timelyinfrastructure investments. While the majority of Delta highways surveyed are ingood condition, nearly a quarter are considered distressed and in need of repairs.Investments at the nexus of waterway infrastructure, wildlife habitat quality, andtourism will likely benefit Delta residents, visitors and the state more broadly.Future reports can add to this understanding as new data becomes available onroads, docks, energy infrastructure, campsites and park visitation.
Agriculture in the region is changing, bringing new opportunities and challenges • The amount of acreage devoted to farming in the primary and secondary zoneremained steady over the course of this study (2011-2015). However, the specifictypes of farming is changing.
• The primary crop by acreage in the Delta is alfalfa, covering 17% of the primaryzone and 12% of the secondary zone. It remains important to support thedominant production paradigm in addition to the aforementioned trends towardmore permanent tree and vine crops.
• Similar to broader state trends, agricultural production in the Delta is shifting awayfrom commodity crops to permanent crops such as trees and vines. This transitionmarks a longer-term land-use commitment and higher investment, but one thatalso typically yields higher economic returns. If trends continue, this may haveramifications for the conservation values involved in habitat management, andwater management. Permanent high value crops may not be eligible for federalinsurance and will cost more in recovery.
• Changes in types of production will also change the seasonal demands on theagricultural workforce, potentially making way for longer seasons of employmentand the need for permanent housing options near work sites.
• The proliferation of wineries and orchards produces secondary benefits ofattracting agricultural tourism, particularly with added on-farm event space.These developments present economic development opportunities while alsoincreasing usage and traffic along Delta roads.
8

10
Economic development and population growth should be tracked as both are affecting many aspects of the region’s economy, and current and future workforce
• Median household income should be monitored over time alongside unemploymentand population changes. This will help to identify income (and job polarization),and any sources of downward pressure or demographic changes that may driveincreasing wage and income disparities in the region.
• Housing is relatively affordable, but also in high demand. Delta housing pricesare roughly half the median prices of the state. Homeownership is higher thanthe state average- particularly in the secondary zone- where the number ofhomes that are vacant and/or listed for sale is five times less than the stateaverage.3 Growth in the housing market will need to be watched with continuedattention to farmland conversion.
• One-third of the total Delta population is under the age of 19, compared to only5% of the population aged over 75. This future workforce presents an incredibleeconomic opportunity if it can be trained and retained in the Delta.
• The Delta's high-quality schools may also drive future housing demand. Deltaschools are well-funded on a per-pupil basis, compared to the state average. Anddespite higher rates of children living in poverty, Delta high schools have higherrates of high school graduation.
3. https://www.citylab.com/ equity/2018/07/vacancy-americas-other-housing-crisis/565901/
9

POPULATION
A large youth population will remain a primary challenge and opportunity for the Delta Region • In 2015, youth under the age of 19 accounted for almost 1/3 of the population of
the Delta region, while those individuals ages 75 and older accounted for only 5%.
• Upwards of 20% of school-aged population in the Delta lived in poverty in 2015.
• 83.8% of adult Delta residents have at least a High School (or equivalent) degree.This is higher than the state average of 81.8%.
• Of the population of Delta residents aged 25 or older, only 8.4% have less than a9th-grade education level.
10

12
POPULATION BY AGE GROUPS
Definition This indicator shows the breakdown of the population residing in a region. The indicator includes the following age groups: individuals under 5 years of age; individuals 5-17 years of age; individuals 18-24 years of age; individuals 25-44 years of age; individuals 45-64 years of age; and those ages 65 and older. The information is gathered from the American Community Survey and is collected every five years.
Why is this indicator important? This indicator gives a snapshot of the composition of the Delta population. It allows for an understanding of what portion of the population is of working age, the size of the aging community, and how many young people are being raised in the region.
How is the Delta doing? American Community Survey five-year population estimates show that 582,884 individuals lived in the Delta from 2011-2015 The secondary zone had a total of 573,483 residents. The primary zone had a total of 9,401 residents.2
2. Researchers rely on data collected annually. To improve accuracy or reporting on trends, researchers use five-year averages from American Community Survey (2011–2015). Some data points are median, (eg. median household income), but in this report researchers use the five-year average of median household income, a data point that is collected every year.
Population by Age 2011–2015
Primary Zone Secondary Zone Delta
Source: American Community Survey Age in Years
Percen
tage of P
opulation
16%
14%
12%
10%
8%
6%
4%
2%
0%
11

PRIMARY AND SECONDARY LEVEL EDUCATION COMPLETION
Definition The secondary level education rate reports the percentage of residents aged 25 and older in an area that have completed a high school or equivalent level of education. The primary education completion rate reports the percentage of residents aged 25 and older in an area that have completed up to a primary (elementary) education level of schooling. The information is gathered from the American Community Survey and is collected annually.
Why are these indicators important? These indicators offer insight into the human capital available in a local labor market. Completion of a high school education is often considered to be linked to higher rates of labor market participation and increased labor market competitiveness. In contrast, the completion of primary/elementary education alone often correlates with holding low-wage and low-skill jobs.
How is the Delta doing? Over the five-year period from period 2011-2015, the American Community Survey provided the mean population over a 5-year time period to provide additional accuracy. According to the results, the average of 83.8% of the Delta residents aged 25 and older had at least a high school education. The high school completion rate in the primary zone was 78.6% and the secondary zone 83.8%. Overall, the Delta region has a higher rate of secondary education completion than the state of California at 81.8%. 8.4% of Delta residents report having only an elementary school level of education. 10.4% of residents living in the primary zone and 8.3% of residents living in the secondary zone report having less than a 9th grade education level.
12

14
SCHOOL DISTRICT POVERTY
Definition The school district poverty rate is calculated as the number of children ages 5 to 17 who live in families with income below the poverty line as the share of the total number of children ages 5 to 17 in a school district. School district poverty rates are used to determine Title 1 status in California (qualifying for free and reduced cost meals and other programs). This data comes from Small Area Income and Poverty Estimates produced by the school districts annually.
Why is this indicator important? Levels of school district poverty are important indicators of socioeconomic opportunity and educational access. School districts with a higher proportion of low income students are eligible to receive increased federal funding, as well as provide for additional educational and well-being needs of students.
Tracking levels of school district poverty over the long term can help inform educational policy planning and initiatives necessary to support changing economic conditions that may affect the education of young people in the region.
How is the Delta doing? In 2015, the school district poverty rate for districts that fell within the boundaries of the Delta was 20.54%. This means 1 in every 5 children in this age range live in poverty poverty. This level of school district poverty is similar to statewide level rate at 19.88%.
13

JOBS AND THE ECONOMY
The Delta’s economy is strong, but may benefit from diversification • In 2015, the Delta had an average unemployment rate of 12.2%. This rate is higher
than the state average at 9.9% but comparable to other agriculture-based regions inthe state like the San Joaquin Valley (12.1%).
• The secondary zone had a higher unemployment rate (12.4%) than the primary zone(10.9%).
• Median household income is slightly lower in the Delta when compared to the statemedian ($59,844 vs. $61,818). However, the Delta region has higher medianhousehold incomes than other agricultural based economies like the San Joaquin Valley($49,880), which is likely driven by higher wages paid to workers in the Delta region.
• Delta residents travel an average of 35 minutes to get to work, which indicates thatresidents are more likely to work outside of the communities in which they reside.This commute time is longer than that for residents of California as a whole (28minutes).
14

16
UNEMPLOYMENT RATE
Definition The number of employed individuals and the size of the labor force are estimated by a survey of households conducted by the US Census Bureau. The information is updated annually. Unemployment rates measure the percentage of individuals ages 16 and older in an area who are actively seeking work but who are not employed or self-employed on a full or part-time basis.
Why is this indicator important? Unemployment rates are one of the most common ways to measure the economic health of a region. High unemployment means that there is saturation in the labor market - that is, that there are more workers seeking work than there are jobs available. High unemployment rates can also generate competition for existing jobs and lead to lower overall wages in a region. At the individual level, unemployment can affect household incomes and well-being which can in turn have negative spillover effects into the community and impact the larger economy as a whole.
How is the Delta doing? Over the time period 2011-2015, the average unemployment rate for the Delta region was 12.4%. The unemployment rate was slightly higher for the secondary zone (12.4%) than the primary zone (10.9%). Compared to the state of California as a whole, the Delta had a higher unemployment rate (12.4%). Local economies based on agriculture and tourism tend to have cyclical employment and thus higher rates of unemployment than other regions that have a more diverse economic base.
Unemployment 2011–2015 14.00%
0.00% 2.00%
4.00% 6.00% 8.00%
12.00%
10.00%
Delta Primary Zone Secondary Zone California San Joaquin Valley
Source: American Community Survey 5 year estimates 2011–2015
15

MEDIAN HOUSEHOLD INCOME
Definition Median household income is the number that divides all household incomes in an area into two equal groups. Half of this group has incomes above this amount, and the other half has incomes below. A household consists of all the people who occupy a housing unit. Income includes wages in addition to dividends and interest accrued by all household heads. The data is from the American Community Survey and is updated annually.
Why is this indicator important? Median household income is an indicator of a region’s standard of living. The median is less influenced by outliers (like small highly wealthy populations) than per capita income. As such, median household income is a useful measure of regional prosperity.
How is the Delta doing? From 2011-2015, the median household income in the Delta Region was $59,844. The median household income is nearly 30% greater in the secondary zone than in the primary zone ($60,539 vs. $40,347). Household median incomes in the region are lower than the state household median of $61,818.
Median Household Income 2011–2015
$70,000
$60,000
$50,000
$40,000
$30,000
$20,000
$10,000
$-Delta Primary Zone Secondary Zone California San Joaquin Valley
Source: American Community Survey 2011–2015
16

18
MEDIAN INDIVIDUAL EARNINGS
Definition Individual earnings is a measure of all income earned by an individual (including wages, salary, social security payments, pensions, child support, public assistance, annuities, money derived from rental properties, interest, and dividends). The median earnings of individuals is the number at which half of the individuals earn above this number, and half earn below. Median individual earnings are different than median household income as household income includes incomes from multiple individuals and does not account for earnings from dividends and interest. This data comes from the American Community Survey which is updated annually.
Why is this indicator important? Individual earnings is an important measure of socioeconomic status and both reflects and drives overall regional economic strength.
How is the Delta doing? Over the years 2011-2015 median earnings for individuals living in the Delta region was $31,023. This median is comparable to the median earnings in the state of California ($31,069). Median earnings of individuals in the primary zone were lower than those in the secondary zone ($24,606 vs. $31,069)
AVERAGE COMMUTE TIME
Definition Average commute time refers to the total number of minutes a person spends commuting to work. Travel time includes time spent waiting for public transportation, picking up passengers in carpools, and time spent in other activities related to getting to work. It also includes commute times for workers who travel between counties for residence and work. This data comes from the American Community Survey which is updated annually by the US Census Bureau.
Why is this indicator important? The amount of time it takes to get to work affects a worker's ability to secure employment. Living in more rural counties is often identified as a difficult and contributing factor to higher unemployment rates due to lack of local jobs and long commute times. The indicator also reveals commute times for Delta residents who travel within the Delta region for work.
How is the Delta doing? Delta residents commute on average 35 minutes to work. Delta residents in the secondary zone commute on average 36 minutes to work. The average commute time in the primary zone is substantially lower at 11 minutes. The average commute time of Delta residents is longer than the average for California residents as a whole. (35 minutes vs. 28 minutes).
17

WORKING LANDS
Agriculture in the region is changing, mirroring broader trends in California
• The predominant land use in the Delta continues to be farming, with land inproduction constituting 70% and 50% of the primary and secondary zonesrespectively in 2015. Fallowed land is also considered an agricultural use and isin addition to these percentages.
• Most urban development occurs in the secondary zone, which is in accordance withstate policy objectives. In 2015, developed land (land units with at least 20% ofimpervious surface) made up 3% of the primary zone and 34% of the secondary zone.
• From 2011-2015, less land was devoted to annual crops such as corn and alfalfaas fields are increasingly converted to permanent crops such as vineyards andalmonds. These crops yield higher values per acre than commodity crops, makingconversion to urban land-uses less likely.
• Farming continues to be the primary land use within the primary zone. Thesecondary zone, however, is facing greater urban development. Other non-urban land-uses are remaining stable.
• The Delta remains a popular venue for hunting and fishing and 12% of the state’shunting and 8% of the state’s fishing licenses are sold in the region.
18

20
PRODUCTION BY LAND USE
Definition Agricultural land use refers to the number of acres devoted to particular crops. Data are derived from the National Agricultural Statistics Service CropScape satellite imagery, which covers over 300 distinct land-covers in the Delta. Satellite imagery is collected and interpreted annually by the United States Department of Agriculture. We use CropScape to match the 2011-2015 year range of other indicators. While California has state-specific data through the Farmland Mapping and Monitoring Program (FMMP), data for comparable years are not readily available. In addition, CropScape allows users to select a specific geography for analysis, thus allowing the primary zone and secondary zone boundaries to be utilized.
Why is this indicator important? Knowing the largest crops by acreage in the Delta can help predict which crop services and supporting industries will be needed in future years based on the existing agricultural base.
How is the Delta doing? A total of 333,000 acres were in active production in the primary zone in 2015. In the primary zone, the top five crops by total land-cover in 2015 were alfalfa (25% of the total area in active production in the primary zone, 84,000 acres), corn (21%, 71,000 acres), grapes (11%, 38,000 acres), tomatoes (10%, 33,000 acres) and wheat (6%, 21,000 acres). A diverse array of 49 other crop types make up the remaining 20% of the primary zone land area under cultivation, accounting for 65,000 acres.
A total of 120,000 acres were in active production in the secondary zone. In the secondary zone, the top five agricultural land-uses by total land-cover are alfalfa (25% of the total area in active production in the secondary zone, 30,000 acres), grass pasture (12%, 14,000 acres), tomatoes (9.5%, 11,300 acres), wheat (9%, 10,700 acres), and grapes (7%, 8,300 acres). Fifty-two other crops make up the remaining 38% of the secondary zone land area, accounting for 45,000 acres.
Delta agricultural land use patterns align with the state of California where the largest crops by total land-cover in 2015 were almonds, alfalfa, grapes, rice, and wheat.
19

TRENDS IN PRODUCTION Definition The indicator focuses specifically on agricultural trends occurring in land cover changes by acreage. The data is derived from the annually-produced National Agricultural Statistics Service CropScape satellite imagery, which covers over 300 distinct land coverages in the Delta. Here, we compare 2011 and 2015 land coverage.
Why is this indicator important? Tracking the dynamics of specific crops by land cover gives an understanding of production trends. Because different crop types have different water requirements, conservation values, and long-term socioeconomic impacts, such information can help identify suitable policies for environmental protection, water planning, crop insurance, and agricultural economic supports through processing and marketing infrastructure.
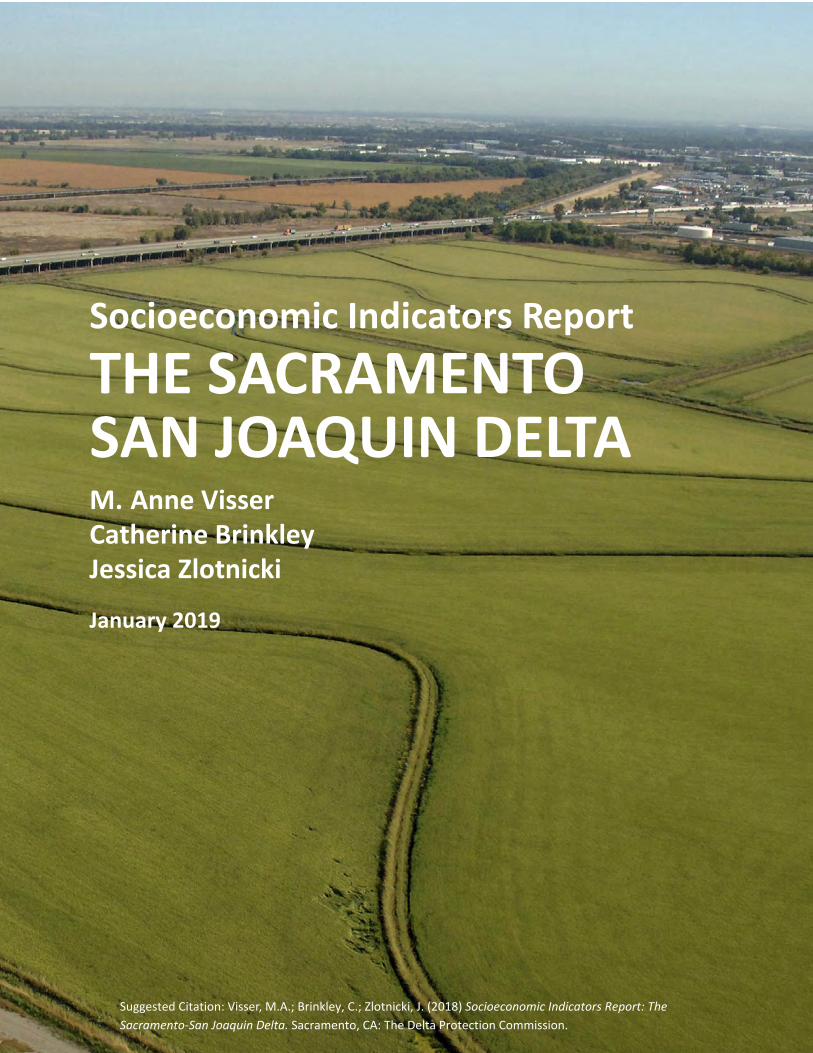
How is the Delta doing? Similar to the rest of California, the Delta is following a trend toward higher-return specialty agricultural products. Alfalfa, tomatoes, and grapes represent not only some of the largest crops by acreage in the primary zone, but also are among the top five upwardly-trending crops along with grass hay and triticale, which have increased since 2011 by 9,800 acres and 6,000 acres, respectively. Land used for corn, wheat, safflower, asparagus, and sunflowers is being converted to other uses.
In the secondary zone, grapes, tomatoes, almonds, hay, and a double crop of oats and corn show the largest acre increases in production from 2011 to 2015. Land in a single crop of corn, wheat, and safflower, and pasture land are being transitioned to other uses.
Statewide, the largest crop declines by acre were for grass/pasture, cotton, rice, wheat, and corn, while the largest increases in acreage from 2011-2015 were in grapes, almonds, walnuts, oranges, and alfalfa.
20

22
Primary Zone Crop Acreage: Expansion and Reduction 2011–2015
Secondary Zone Crop Acreage: Expansion and Reduction 2011–2015
Source: National Agricultural Statistical Service
-2,400 -4,000
Corn-23,200 Wheat Safflower Asparagus
-9,000
Sunflowers -1,000Triticale 6,000 Tomatoes 6,300 Hay9,800 Grapes 13,500 Alfalfa 16,500
Acres
2,800
2,600
1,600
1,100
-1,500
-2,600
-2,700
-3,000
-7,000 Corn
Wheat
Double Crop Wheat/Corn
Grass/Pasture
Safflower
Walnuts
Double Crop Oat/Corn
Hay
Almonds
Grapes 5,200
Acres
21

LAND CONVERSION
Definition Farmland conversion measures the amount of land in crops or fallowed that is converted to low, medium and high density developed land. “Developed land” includes lands with varying percentages of impermeable surfaces, but generally means land with at least 20% impermeable surfaces (i.e. asphalt or a building covering the ground). It is worth noting that some “developed land” includes features that would not generally be viewed as urban land, such as rural roads, farm and ranch headquarters, and equipment yards.
Farmland conversion is calculated with NASS data specific to the primary and secondary zones with 30-meter resolution. A transition in land use category from farmland to fallow/idle cropland or a NASS category called "developed/open Space" is not calculated as this land frequently reverts back to production. As defined by NASS, "infill" is the re-categorization of “developed land” based on an increase in impervious surface area coverage. Conversion of wetlands, forest, and barren lands to urban development constitutes the "other" category.
Why is this indicator important? Conversion of farmland into “developed land” indicates social and economic change that may present significant challenges to the agricultural sector of a region. It is important to note that in California, the 2011-2015 period was marked by the lingering effects of the recession including a continued stagnation in housing development projects. Dynamics in the Delta provide a comparison to broader state trends.
22

24
How is the Delta Doing? In both the primary and secondary zones, the predominant pattern of development is the continued intensification of “developed land.” When considering changes in development patterns, NASS data shows that from 2011-2015, the primary zone converted less than 0.03% (180 acres) of its total acreage from non-urban to urban uses. The majority of conversions occurred as non-agricultural intensification of land already in urban use (910 acres). The secondary zone converted 0.3% (800 acres) of its non-urbanized land to more urban uses during the same time period. Most urbanization occurred as intensification in urban areas with greater than 20% impervious surface (6770 acres). It should be noted that the secondary zone contains less farmland acreage in total, resulting in a higher farmland conversion by percentage. The amount of farmland converted to more intensive urban uses in the secondary zone from 2011-2015 accounts for less than one percent of the total farmland (0.3%, 324 acres).
Land Conversion to Development 2011–2015 Primary Secondary
8000
7000
6000
5000
4000
3000
2000
1000
0 Crop Fallow Infill Other
Source: National Agricultural Statistical Service
23
Acres

LAND-COVER
Definition This indicator tracks acreage of farmland, developed land, and other land use categories. The data is derived from the US Department of Agriculture National Agricultural Statistics Service CropScape satellite imagery and is updated annually. Developed land constitutes areas with greater than 20% impervious surface. Farmland is land that is actively devoted to crop production. “Other” captures all other categories of land that are not developed or farmland, and includes wetlands, barren lands, meadows, and forested areas.
Why is this indicator important? The Delta is largely an agricultural region that has prioritized land conservation efforts. Knowing how much land is devoted to agricultural and urban uses helps monitor policy priorities to support active farming communities and wildlife habitat.
How is the Delta doing? Farmland shows a slight increase from 2011-2015 as land is reclaimed from other uses signifying continued farming viability. Land devoted to active production accounted for 70% (333,000 acres) of the primary zone in 2015. From 2011 to 2015, 21,000 acres entered crop production in the primary zone, partly explained by a decrease in fallow/idle farmland (-16,400 acres from 2011-2015). Idle or fallow land made up 9% (44,500 acres) of the land cover in the primary zone in 2015. Other land-uses constitute waterways, barren land, forests, and wetlands, accounting for 98,100 acres in 2011 (18%). In 2015, developed land made up 3% of the primary zone (14,200 acres).
Land devoted to active production accounted for 48% (120,000 acres) of the secondary zone in 2015. From 2011 to 2015, an added 1,200 acres was fallowed, while land in agricultural production decreased by 300 acres. Idle or fallow land made up 11% (27,000 acres) of the land cover in the secondary zone in 2015. In 2015, developed land made up 34% (83,600 acres) of the secondary zone. Because land is often fallowed in anticipation of development or because fluctuations in agricultural markets do not make planting and harvesting profitable for certain crops, future reports should monitor the relationship between urban development, agricultural production, and fallowed/idled land.
24

26
Primary Zone Land-use Changes 2011–2015
Secondary Zone Land-use Changes 2011–2015
Acres
Acres
2015
350,000
300,000
250,000
200,000
150,000
100,000
50,000
0 Urban Crop Other Fallow/Idle
2011 2015
350,000
300,000
250,000
200,000
150,000
100,000
50,000
0 Urban Crop Other Fallow/Idle
Source: National Agricultural Statistical Service
25
2011

FISHING AND HUNTING LICENSES
Definition This indicator is the total number of fishing and hunting licenses sold in the Delta region. This data comes from the California Department of Fish and Wildlife License Statistics which is updated every year. Data is collected by zip code. Some zip codes fall into both the primary and secondary zones of the Delta, and are denoted P/S. Only data specific to the primary zone is included with the primary zone data. Data that straddles the secondary zone and areas outside the Delta are omitted. Therefore, the numbers presented are an underestimation of the number of licenses sold in the region.
Why is this indicator important? Sport fishing and hunting are popular activities for tourists and local residents in the Delta. They are also a strong component of the area’s tourism economy. Increases in fishing and hunting licenses can also serve as proxies for environmental quality, where good quality is indicated by the capacity for more fish and game to be supported in the region.
How is the Delta doing? In 2015, hunting licenses sold in the Delta region accounted for over 12% of the total licenses in California. Over 2/3 of the hunting licenses sold in the region were sold in the secondary zone. In the same year, sales of fishing licenses in the Delta accounted for 8% of the total licenses in the state of California. The majority of fishing licenses were sold in the secondary zone. It is worth noting that not all licenses are sold to Delta residents; many may be sold to visitors.
Hunting: Primary zone: 77,994 Secondary zone: 170,348 Zip codes in both P/S: 48,520 12% of total licenses in CA
Fishing: Primary zone: 11,694 Secondary zone: 95,356 Zip codes in both P/S: 65,520 8% of total licenses in CA
26

28
STATE PARK USE DATA
Definition Park use rate is the total number of paid and unpaid day and overnight visitors that utilize state parks in the Delta. This data comes from the California State Park System Statistical Report which is updated every year. While there are 3 state parks in the Delta (Brannan Island, Delta Meadows, and Franks Tract), only data from Delta Meadows and Brannan Island is reported here.
Why is this indicator important? The number of visitors to the Delta state parks is an indicator of the region’s tourism value. However, higher rates of visitor traffic can also have an impact on road conditions and environmental quality.
How is the Delta doing? In 2015, Delta Meadows recorded having 6,884 day use visitors. This averages out to about 132 visitors per week. Brannan Island reported 52,991 day use visitors, averaging about 827 visitors per week to this popular state park.
27

HOUSING AND ROADS
Housing in the Delta remains affordable and could be leveraged to support socio-economic development
• For the time period 2011-2015, median home values in the Delta were 64% of themedian price for the state of California.
• High rates of homeownership combined with less overcrowding than the state ofCalifornia indicate a thriving housing market consisting of communities with long-term vested interest in the future of the Delta.
• Low homeowner vacancy rates indicate high demand for home ownership. Thissuggests that the housing market is competitive.
• Any new growth in the population of the Delta may require attention to updatingand adding infrastructure such as roads while not promoting new developmenton prime agricultural soils.
28

30
MEDIAN HOME VALUE
Definition Housing unit value is an estimate of how much an individual’s house would sell for if it were for sale. Median home value is the number that divides the housing unit values of a given area into two halves. One half whose housing unit value is above this number, and another half whose housing unit value is below this number. The information is gathered from the American Community Survey and is updated annually.
Why is this indicator important? Median housing unit value allows for an understanding of housing affordability. Home values impact the level of construction jobs and activity in the region. It can also affect consumer spending and is an important factor in influencing household wealth. High housing values can be good for homeowners, but they also present barriers for those seeking to purchase a home. Using the median housing unit value is a good indicator of home prices since it is minimally influenced by outliers (such as a few very expensive or very inexpensive homes).
How is the Delta doing? The median housing unit value in the Delta from 2011-2015 was $246,297. Housing unit values are lower in the secondary zone than in the primary zone ($242,257 vs. $351,350). This value is lower than the median housing value of the state of California ($385,500) suggesting that the Delta region offers a relatively affordable housing market.2
2. Researchers rely on data collected annually. To improve accuracy or reporting on trends, researchers use five-year averages from American Community Survey (2011–2015). Some data points are median, (eg. median household income), but in this report researchers use the five-year average of median, a data point that is collected every year.
29

HOMEOWNERSHIP
Definition The homeownership rate measures the percentage of housing units in which the owner or co-owners resides. Homeownership rates do not include housing units that are rented or occupied without payment of rent; such homes are classified as renter-occupied. The information is gathered from the American Community Survey and is updated annually.
Why is this indicator important? Knowing how many housing units are occupied by the owner versus a renter can indicate the stability of the housing market and recovery from a recession. It can also provide a means to track the extent to which regional housing markets move between renter and owner-occupied markets.
How is the Delta doing? Researchers took the average of the medians (or data over 5 years) and combined it with the median taken from all the overall data points for robustness. In 2015, 59.5% of the housing units in the Delta are owner occupied. Homeownership rates are slightly higher in the primary zone (62.9%) than in the secondary zone (59.3%). However, both zones and regions indicate higher homeownership rates and lower renter occupied rates than the state of California as a whole.
Home Rental and Ownership 2011–2015
Owner-occupied Renter-occupied
70%
60%
50%
40%
30%
20%
10%
0% Delta Primary Zone Secondary Zone Central California
Valley
Source: American Community Survey
30

32
HOMEOWNER AND RENTAL VACANCY RATES Definition The homeowner vacancy rate is the proportion of the homeowner inventory that is vacant and/or listed as “for sale”. The rental vacancy rate is the proportion of the rental inventory that is vacant and/or listed as “for rent”. The information is gathered from the American Community Survey and is collected annually.
Why is this indicator important? Vacancy rates are important for determining the overall health of a housing market. A healthy vacancy rate is considered 5% for both homeowner and rental vacancy. Often, vacancy rates fluctuate more than sales or rental prices.
How is the Delta doing? From 2011-2015, the average Delta rental vacancy rate was 4.2%. Rates of rental vacancy are relatively similar for the primary and secondary zones (4.5% and 4.2% respectively). When compared to California as a whole, the rental vacancy rate in the Delta is similar to the state average.
In the same year, the homeowner vacancy rate for the Delta was 1.3%. The homeowner vacancy rate was lower in the primary z one than in the secondary zone (0.25% vs. 1.3%) potentially reflecting a greater demand in the owne r market.
OVERCROWDED HOUSING Definition The US Department of Housing and Urban De velopment defines housing overcrowding as more than one persons-per-room. Occupants per room is obtained by dividing the reported number of current residents in each occupied housing unit by the number of rooms in the unit. The information is gathered from the American Community Survey and is collected annually.
Why is this indicator important? Overcrowded housing units can be a sign of an overly expensive housing market or one with restricted supply. Crowded housing is also thought to affect economic and health outcomes for children.
How is the Delta doing? From 2011-2015 the average housing overcrowding rate in the Delta was 5.6%. This was slightly higher in the primary zone at 5.7% than in the secondary zone at 4.4%. However, housing overcrowding in the region remains substantially lower than the state housing overcrowding percentage (8.2%)
31

ROAD PAVEMENT CONDITIONS Definition Road pavement conditions measure the quality of interstates, freeways, and highways maintained by CalTrans in the Delta. Road pavement conditions report the actual number of lane miles that correspond to one of three classifications of road conditions. CalTrans categorizes road pavement conditions based on three “states”. State 1 (green) indicates that there is no distress evident in the pavement of the roadway, and maintenance projects generally undertaken on these roads are preventative. State 2 (yellow) indicates minor surface distress evident in the roadway pavement, and maintenance projects generally undertaken on these roads are corrective. State 3 (red) indicates that pavement conditions are poor and/or show minor structural distress or major structural distress in the pavement. Maintenance projects on roads that are classified as State 3 generally focus on capital preventative maintenance or major rehabilitation/replacement of pavement. The data is collected by the CalTrans Office of Pavement Management and is updated annually. The data on road pavement conditions is from 2016.
Why is this indicator important? Monitoring the pavement conditions of roadways offers an indicator of adequate infrastructure for the Delta. Pavement conditions may affect tourism in the Delta, and affect commuters traveling to and from work.
How is the Delta doing? In 2016, 694.1 lane miles were assessed by CalTrans. A total of 64.40% of the total lane miles in the Delta were classified as State 1 roads (indicating good pavement conditions) and 15.24% of lane miles were classified as State 2. In addition, 21.37% of roads in the Delta region were classified as State 3 indicating poor pavement conditions or roads that showed major structural distress.
Pavement Condition Classification
Total Lane Miles
% Total
State 1 (Green) 440 63.39% State 2 (Yellow) 105 .8 15.24% State 3 (Red) 148.3 21.37%
32

3433

EDUCATION
Delta schools are doing better than schools in the state despite higher levels of poverty
• In the 2013-2014 school year, the average cost-adjusted revenue per pupil in theDelta was $8,160 as compared to $6,781 being spent per-student state-wide. This islargely due to the additional resources available to schools with higher proportions of students from low-income families.
• The majority of students in the Delta identify as Hispanic/Latinx (51%) and non-Hispanic White (41%). The statewide average shows 53.6% of students identifyingas Hispanic/Latinx and 24.6% as non-Hispanic White.
• High school graduation rates in 2015 were 7% higher in the Delta than graduationrates for the state of California.
34

36
ENROLLMENT CHARACTERISTICS
Definition Enrollment characteristics provide information on the race and ethnicity of the school-aged population. Such characteristics include the size and racial/ethnic composition of the population of enrolled students. This is household level data that is collected annually by the National Center for Educational Statistics.
Why is this indicator important? Knowing changing trends in these measures help predict and plan public budgets in relation to school funding.
How is the Delta doing? This report uses data from 12 public schools located within the Delta, serving 2,547 students. The two largest student populations are Hispanic/Latinx youth (51%) and non-Hispanic White youth (41.3%), followed by pupils who are identified as multiracial/multi-ethnic at 3.7%.
Enrollment Characteristics of Selected Delta Schools (n=2,547)
Enrollment Characteristics of California Schools (N=6,235,520)
0.50% Hispanic/Latinx
White 0.60%
3.40% Multiracial/Multiethnic
American Indian
Asian Pacific Islander
Black
Hawaiian/Native Pacific Islander (California Schools only; 0% in Delta schools)Source: National Center for Educational Statistics
The school data used in this section include:
Bates Elementary Clarksburg Elementary D. H. White ElementaryRiver Delta Community Day
Knightsen Elementary Mokelumne High Walnut Grove Elementary River Delta High/Elementary
Riverview MiddleRio Vista HighDelta HighIsleton Elementary
35
51%41.30%
3.70% 1% 2% 2%0%
53.60%
24.60%
11.30%
6%

COST-ADJUSTED REVENUES PER PUPIL Definition The cost-adjusted revenues for pupil measures the amount of revenue schools receive per pupil who attend schools in the district. The data comes from EdBuild and is updated every school year. Data is not available for Liberty Union High School District, located in northeastern Contra Costa County. Because of the differences in jurisdictional boundaries in relation to school districts, it is not possible to break data into primary and secondary zones. The River Delta Unified School District has a large coverage in the primary zone.
Why is this indicator important? The cost-adjusted revenues per pupil are a measure of school district funding available in an area. It allows for an understanding of how much a school district has available to spend on necessary resources. Revenues spent per pupil can also shed light on local economic conditions, such as how well-funded schools are in relation to perceived school quality. In turn, school quality often buttresses robust real estate markets as residents value high quality school districts and pay premium housing costs to gain entry.
How is the Delta doing? In 2013-2014 the average cost-adjusted revenue per pupil for districts within the Delta is $8,160. This is almost 25% higher than the cost adjusted revenue per pupil for California as a whole in the same year ($6,781).
36

38
HIGH SCHOOL GRADUATION RATE
Definition The one-year high school graduation rate is the percentage of high school seniors who graduate from high school. This indicator reports this percentage for those students who attend Delta area high schools (including alternative education high schools). The one-year graduation rate does not capture students who drop out before 12th grade. These data come from the California Department of Education which is updated every year.
Why is this indicator important? High school graduation rates are an important indicator of school quality in the region. It is also an indicator of overall socioeconomic opportunity for young people in a regional economy. Higher rates of high school completion are generally equated with a more educated and competitive workforce, a more knowledgeable and politically engaged citizenry, and higher levels of community health and well-being.
How is the Delta doing? In 2015, 83.2% of high school seniors in California successfully graduated from high school. There are two high schools that serve the Delta primary zone; Delta High School and Rio Vista High School. Their graduation rate is 93.25%.
37

APPENDIX A: DATA SOURCES FOR INDICATORS USED IN THIS REPORT
Category Indicator Source Year Available & Frequency
Geography
Population
Population By Age Groups
American Community
Survey
Updated Annually—Use 5 Year Estimates
Census Tracts available for Primary and
Secondary zones
Primary and Secondary Educational Attainment
American Community
Survey
Updated Annually—Use 5 Year Estimates
Census Tracts available for Primary and
Secondary zones
School District Poverty
Small Area Income and Poverty Estimates
Updated Annually
Census Tracts available for Primary and
Secondary zones
Jobs and the Economy
Unemployment Rate
American Community
Survey
Updated Annually—Use 5 Year Estimates
Census Tracts available for Primary and
Secondary zones
Median Household Income
American Community
Survey
Updated Annually—Use 5 Year Estimates
Census Tracts available for Primary and
Secondary zones
Commute TimeAmerican Community
Survey
Updated Annually—Use 5 Year Estimates
Census Tracts available for Primary and
Secondary zones
Median Individual Earnings
American Community
Survey
Updated Annually—Use 5 Year Estimates
Census Tracts available for Primary and
Secondary zones
38

40
Category Indicator Source Year Available & Frequency
Geography
Working Lands
Production By Land-Use
National Agricultural
Statistics Service —CropScape
Updated Annually
30-meter spatial resolution, available
for Primary & Secondary zones
Production Trends
National Agricultural
Statistics Service —CropScape
Updated Annually
30-meter spatial resolution, available
for Primary & Secondary zones
Land Conversion
National Agricultural
Statistics Service —CropScape
Updated Annually
30-meter spatial resolution, available
for Primary & Secondary zones
Land Cover
National Agricultural
Statistics Service —CropScape
Updated Annually
30-meter spatial resolution, available
for Primary & Secondary zones
Fishing and Hunting Licenses
California Department of Fish and Wildlife
Updated Annually
Zipcode Available for Primary and Secondary zones
Park UseCalifornia State Part System
Statistical Report
Updated Annually
By Park
39

Category Indicator Source Year Available & Frequency
Geography
Housing and Roads
Median Household Value
American Community
Survey
Updated Annually—Use 5 Year Estimates
Census Tracts available for Primary and
Secondary zones
HomeownershipAmerican Community
Survey
Updated Annually—Use 5 Year Estimates
Census Tracts available for Primary and
Secondary zones
Homeowner Vacancy Rate
American Community
Survey
Updated Annually—Use 5 Year Estimates
Census Tracts available for Primary and
Secondary zones
Rental House Vacancy Rate
American Community
Survey
Updated Annually—Use 5 Year Estimates
Census Tracts available for Primary and
Secondary zones
Overcrowded Housing
American Community
Survey
Updated Annually—Use 5 Year Estimates
Census Tracts available for Primary and
Secondary zones
Pavement Conditions
CalTransUpdated
by Demand
Interstates and freeways for total
Delta
40

Category Indicator Source Year Available & Frequency
Geography
Education
Cost-adjusted Revenues per
PupilEd Build
2013–2014 School Year, Annual
By school for portion of entire
Delta
Enrollment Characteristics
National Center for Educational
Statistics
2014–2015 School Year, Annual
By school for portion of entire
Delta
High School Graduation
Ed Build Updated Annually
Available by high school
41