Embed Size (px)
Citation preview
Consolidated Report on
INDICATORS OF AGRICULTURE Quarterly Report : April – June 2015
A.V. Manjunatha
Agricultural Development and Rural Transformation Centre (ADRTC)
INSTITUTE FOR SOCIAL AND ECONOMIC CHANGE Bangalore – 560 072
Quarterly Report: April– June 2015
i
Acknowledgement
The Ministry of Agriculture, Government of India, as well as the National
Institution for Transformation of India, replaced by Planning Commission, intend
to know the agriculture situation in different States using various agricultural
indicators. All the twelve Agro Economic Research Centres (AERCs) spread
across the Country are supposed to collect the required information for the
State under their jurisdiction quarterly and submit the data to the Agricultural
Development and Rural Transformation Centre (ADRTC) of the Institute for
Social and Economic Change (ISEC),Bangalore. The ADRT Centre has to prepare a
consolidated report for all the major States in the country and submit the report
for every quarter of the year. We are grateful to the Ministry of Agriculture,
Government of India, for reposing confidence in the ADRT Centre, and assigning
the responsibility for co-ordination of the study and consolidation of
data/information on agricultural indicators for major States.
We are grateful to Dr. M.R. Narayana, Incharge Director, Institute for
Social and Economic Change (ISEC), Bangalore, for his encouragement and
support for this work. We also thank Ms. Prema Kumari and Mr. Keshav Murthy
for involving in consolidation of the report. We will be failing in our duty if we do
not thank our colleagues from various AERCs for compiling the data from various
sources for the States under their jurisdiction and transmitting the same to
facilitate consolidation of the quarterly reports at ISEC.
A.V. Manjunatha
Quarterly Report: April– June 2015
ii
Table of Contents
Acknowledgement .................................................................................................................. i
List of Figures ....................................................................................................................... iii
1. Average Rainfall .................................................................................................................2
2. Percentage of Districts Received Deficit Rainfall ..............................................................4
3. Area Covered Under Major Crops ....................................................................................5
4. Incidence of Major Pests and Diseases in Principal Crops Sown .....................................9
5. Farm Output Prices of Major Crops .................................................................................9
6. Seed Availability in the Local Market for Major Crops ...................................................9
7. Prevailing Market Price of Seeds of Major Crops ............................................................9
8. Chemical Fertilizer (NPK) Availability in the Local Market ......................................... 10
9. Prevailing Market Prices of Fertilizers ........................................................................... 10
10. Availability of Agricultural Labourers .......................................................................... 11
11. Prevailing Wage Rate for Casual Labourers in Agriculture ........................................ 11
12. Availability of Institutional Credit for Agriculture in the State ................................... 12
13. Electricity Availability for Irrigation Pump sets ........................................................... 13
14. Availability of Farm Machinery for Timely Sowing, Harvesting and Other Operations............................................................................................................................................... 13
15. Availability of Organic Manure, Farm-Yard-Manure, Vermin Compost, Bio Fertilizer ............................................................................................................................... 13
16. Data Constraints ............................................................................................................. 14
Filled in Questionnaires of Different States ........................................................................ 15
Quarterly Report: April– June 2015
iii
List of Figures
Figure 1: State wise Distribution of Actual and Normal Rainfall (in mm) which have received Rainfall in Excess of the Normal……………………………….. 3 Figure 2: State wise Distribution of Actual and Normal Rainfall (in mm) which have received Rainfall Less than Normal……………………………………… 4 Figure 3: Districts Received Deficit Rainfall as per cent to Total Districts of State... 5 Figure 4: Area covered under Major Crops in 2nd quarter of last 4 years as per cent to Targeted Area…………………………………………………………………… 7 Figure 5: State-wise Area covered under Major Crops as per cent to Targeted Area………………………………………………………………………………………. 7 Figure 6: Area covered under Different Crops (Area in lakh hectares)…………….. 8 Figure 7: Prevailing Market Price of Fertilizer (Rs. per Kg)………………………... 11 Figure 8: Prevailing Wage Rate for Casual Labourers in Agriculture (Rs. per day) 12
Quarterly Report: April– June 2015
1
AGRICULTURAL INDICATORS Agriculture and allied sectors are immensely important for the Indian economy. The sector is contributing approximately 13.9 per cent of the nation’s GDP, 11 per cent of its exports and about half of the population still depends on agriculture as its primary source of income (GoI, 2013-14). There has been a constant decline in the share of agriculture and allied sectors in the GDP from 14.6 per cent in 2009-10 to 13.9 per cent in 2013-14 (at constant 2004-05 prices). This declining trend in the GDP of agriculture and allied sectors is not surprising and is expected in a fast growing and changing economy (GoI, 2013-14). Growth rate over the previous year in the total GDP and GDP of agriculture and allied sectors (at 2004-05 prices) witnessed a growth of 9.3 per cent and 5.8 per cent in 2007-08 and this reduced to 4.9 per cent and 4.6 per cent, respectively in 2013-14. The production of food grains increased by 420 per cent in 2013-14 (264.77 million tons) as compared with 1950-51 (50.82 million tons). This increase in the food grain production resulted from productivity gains rather than expansion of cultivated area. The food grains area remained stagnant at approximately 125 million hectares since more than four decades (GoI 2013-14). The Planning Commission, Government of India desired Agricultural Development and Rural Transformation Centre (ADRTC), Institute for Social and Economic Change (ISEC), Bangalore, to undertake this study on “Indicators of Agricultural Performance”. This report is prepared based on the basic agricultural information sent by the Agro-Economic Centers (AERCs) located across India for the second quarter of 2015. The basic information about agricultural situation were collected from twenty two States, viz. Assam, Arunachal Pradesh, Chhattisgarh, Bihar, Gujarat, Haryana, Himachal Pradesh, Jharkhand, Karnataka, Madhya Pradesh, Maharashtra, Manipur, Meghalaya, Mizoram, Nagaland, Punjab, Rajasthan, Tamil Nadu, Tripura, Uttarakhand, Uttar Pradesh and West
Quarterly Report: April– June 2015
2
Bengal. About 15 agriculture related indicators were selected for this study which is given as follows: 1. Average Rainfall 2. Number of districts received deficit rainfall in the State 3. Area covered under major crops 4. Incidence of major pests and diseases in principal crops sown 5. Farm output prices of major crops 6. Seed availability in the local market for major crops 7. Prevailing market price of seed of major crops 8. Chemical fertilizer (NPK) availability in the local market 9. Prevailing market price of fertilizers 10. Availability of agricultural labourers 11. Prevailing wage rate for casual labourers in agriculture 12. Availability of institutional credit for agriculture in the State 13. Electricity availability for irrigation pump sets 14. Availability of farm machinery for timely sowing , harvesting and other operations 15. Availability of organic manure, farmyard manure, vermi compost and bio- fertilizers
1. Average Rainfall The overall rainfall status for 2nd quarter of 2015, as per the data received for 22 states from AERCs, indicated that 10 states received rain in excess of their normal rainfall and the remaining 12 states had rainfall lower than their normal rainfall. The excess rainfall was observed mainly in North-Western part of India comprising Punjab, Haryana, Rajasthan and Gujarat states. All these states had less than the normal rainfall during the corresponding quarter of previous year. However, Gujarat and Rajasthan had received excess rain in 2013 second quarter. All the North-Eastern states of the country had
Quarterly Report: April– June 2015
3
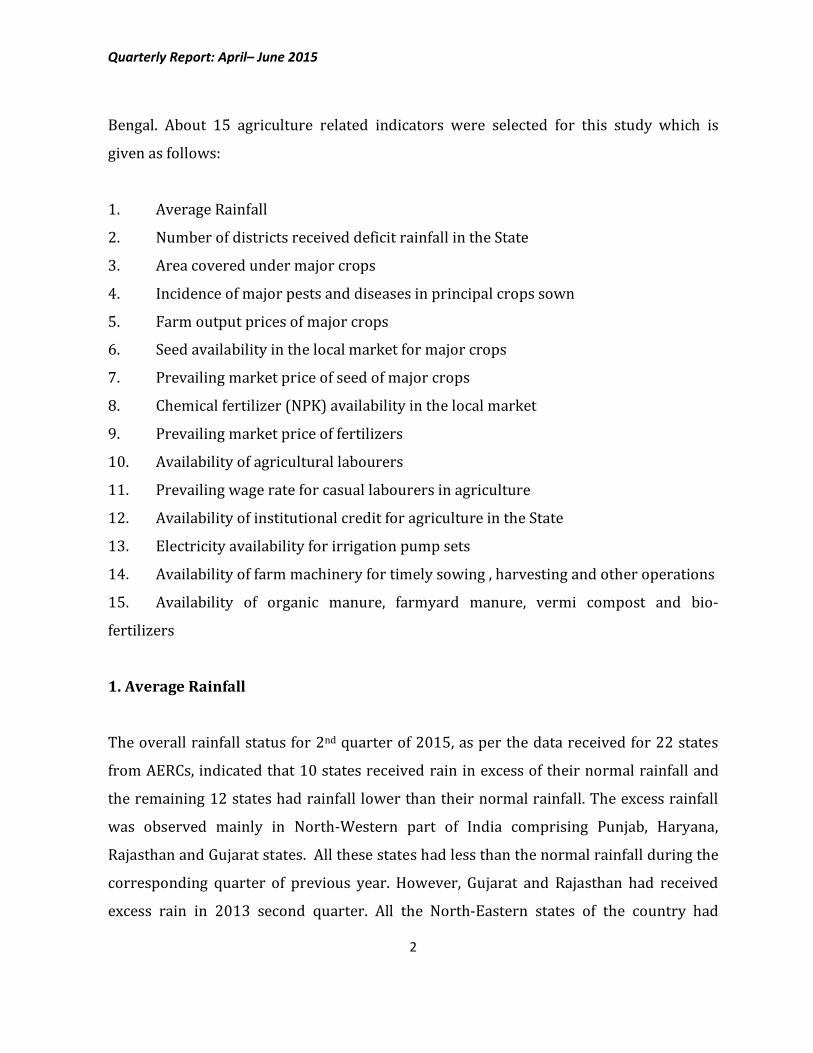
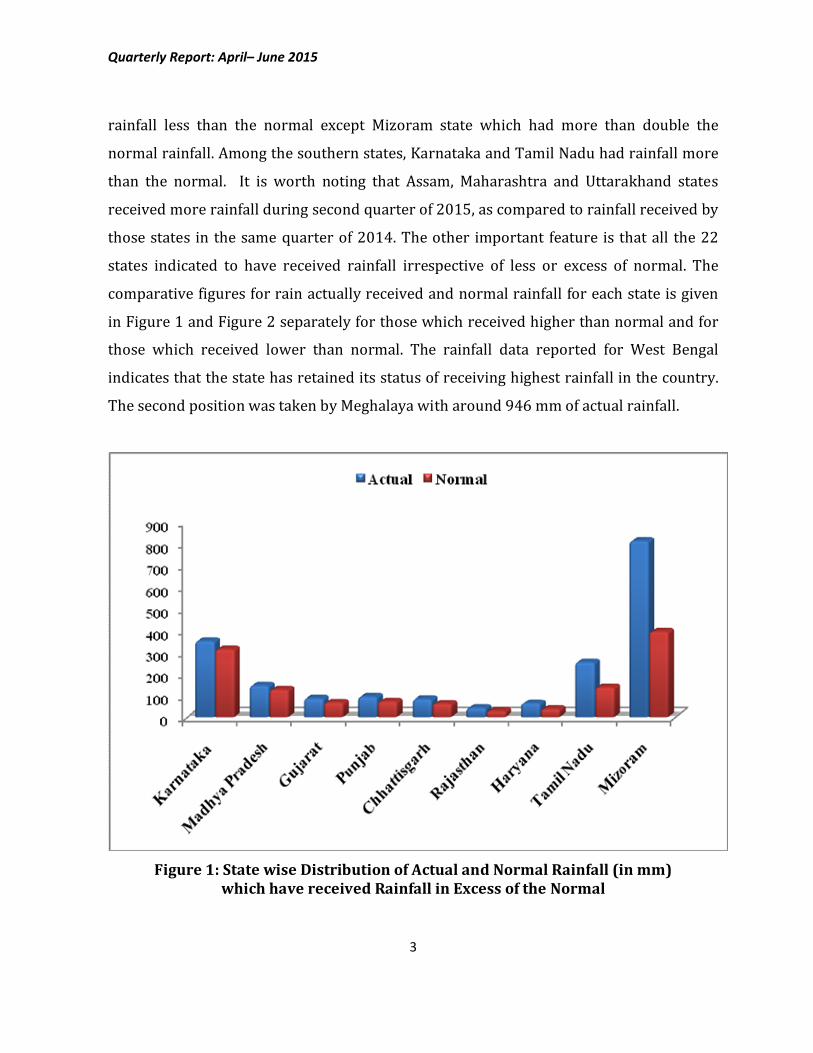
rainfall less than the normal except Mizoram state which had more than double the normal rainfall. Among the southern states, Karnataka and Tamil Nadu had rainfall more than the normal. It is worth noting that Assam, Maharashtra and Uttarakhand states received more rainfall during second quarter of 2015, as compared to rainfall received by those states in the same quarter of 2014. The other important feature is that all the 22 states indicated to have received rainfall irrespective of less or excess of normal. The comparative figures for rain actually received and normal rainfall for each state is given in Figure 1 and Figure 2 separately for those which received higher than normal and for those which received lower than normal. The rainfall data reported for West Bengal indicates that the state has retained its status of receiving highest rainfall in the country. The second position was taken by Meghalaya with around 946 mm of actual rainfall.
Figure 1: State wise Distribution of Actual and Normal Rainfall (in mm)
which have received Rainfall in Excess of the Normal
Quarterly Report: April– June 2015
4
Figure 2: State wise Distribution of Actual and Normal Rainfall (in mm)
which have received Rainfall Less than Normal 2. Percentage of Districts Received Deficit Rainfall
The rainfall data received for 22 states accounted for 545 total numbers of districts existing in the country. Around 21 per cent of these districts did not receive sufficient rainfall and hence they have classified as districts with deficit rainfall. The situation is better than the same quarter of the last year where around 46 per cent of the districts of reported states had deficit rainfall. More than half of the total number districts of Haryana had deficit rainfall. This is despite of receiving more than 73 per cent excess rainfall than the normal. It indicates that all the excess rain received by Haryana state was concentrated only in 10 of its total districts. In case of Maharashtra, except for one district, all the districts had received surplus rainfall. But still, the state had its rainfall less than its normal rainfall. Around 67 per cent of districts in Jharkhand had deficit rainfall during the current season. This is highest as compared to all other states for which data was received. By and large, the per cent of districts receiving deficit rainfall
Quarterly Report: April– June 2015
5
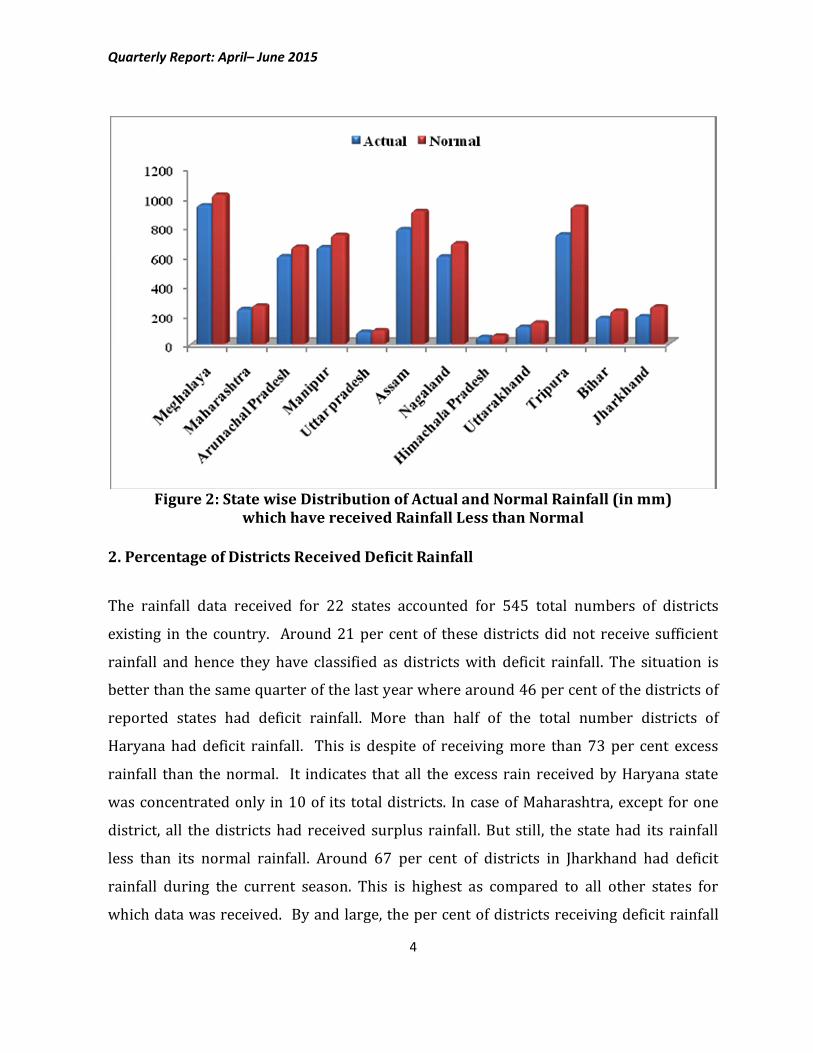
was in direct relation to the extent of excess or less rainfall received by the respective states. There were no districts with deficit rainfall in the states of Chhattisgarh, Mizoram and Himachal Pradesh. Remaining all the 19 states had reported as districts with deficit rainfall. The per cent of districts with deficit rainfall for all the 19 states is represented in Figure 3 in descending order.
Figure 3: Districts Received Deficit Rainfall as per cent to Total Districts of State
3. Area Covered Under Major Crops
Coverage of area under major crops is an important agricultural indicator considered for quarterly report on indicators of agriculture. The proportion of actual area covered under different crops as against their targeted area is taken as basis to measure inter-quarter performance of each state on this indicator. The quarter-on-quarter progress with respect to area coverage of major crops in every state is also a part of this indicator. The data pertaining to area targeted to cover under major crops and area actually
Quarterly Report: April– June 2015
6
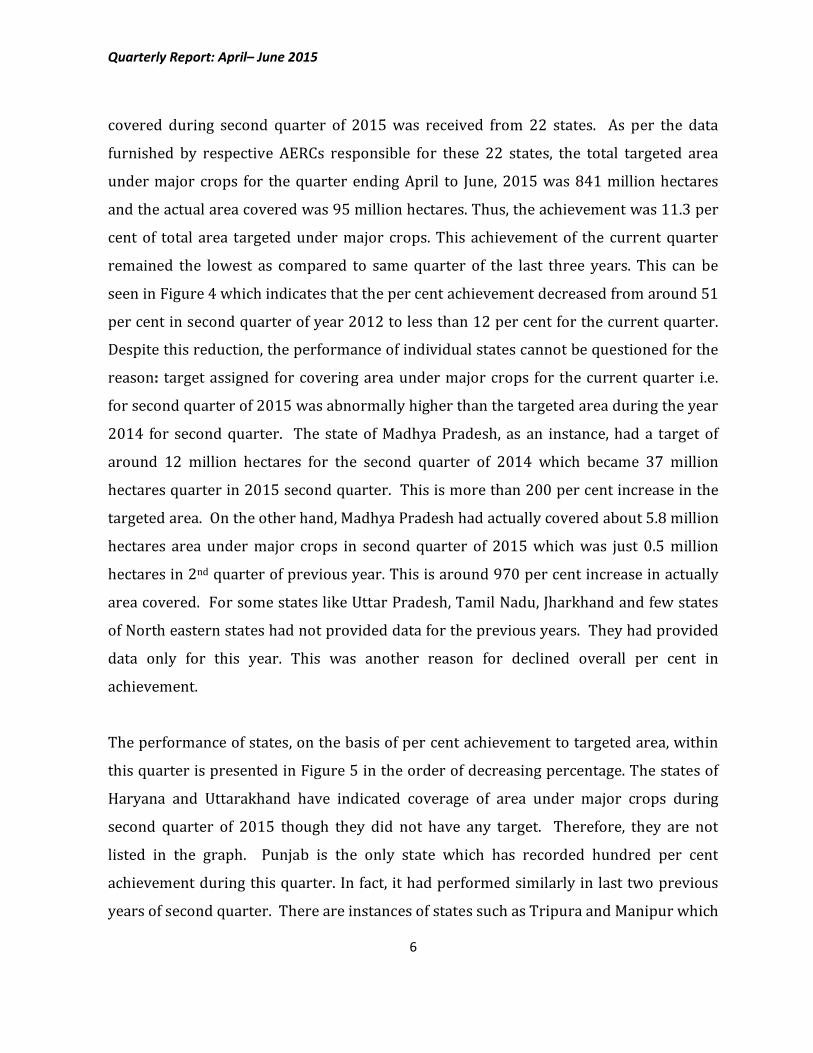
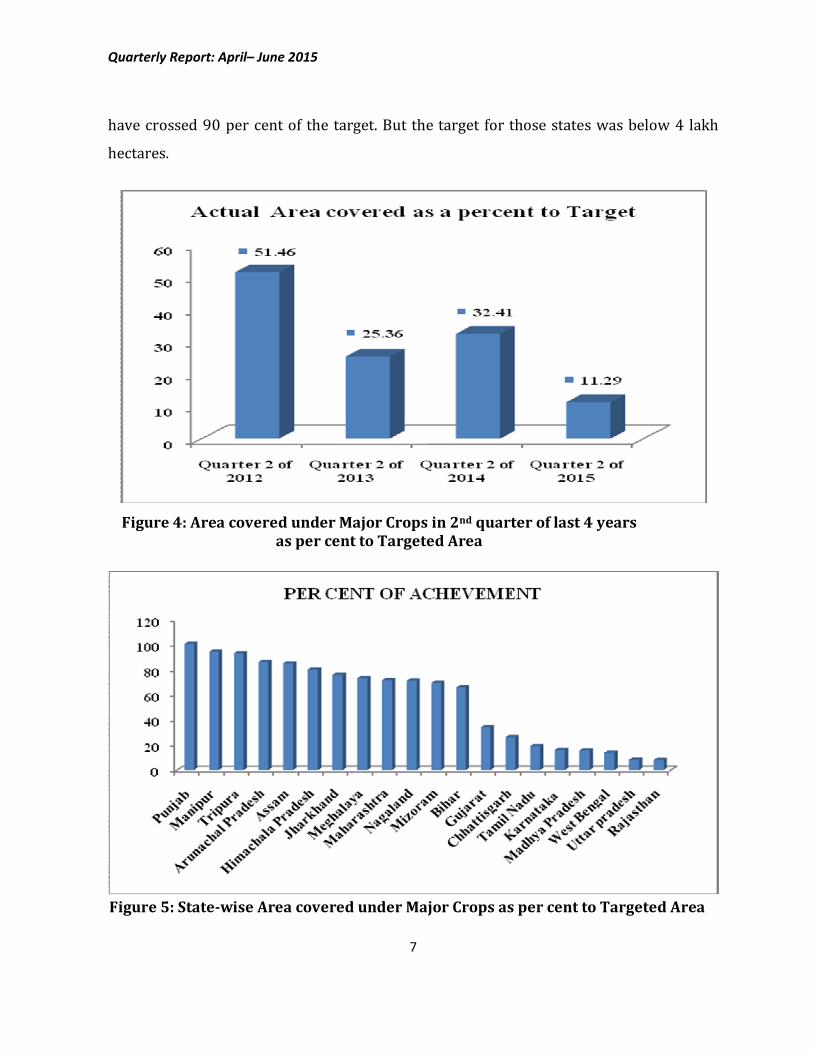
covered during second quarter of 2015 was received from 22 states. As per the data furnished by respective AERCs responsible for these 22 states, the total targeted area under major crops for the quarter ending April to June, 2015 was 841 million hectares and the actual area covered was 95 million hectares. Thus, the achievement was 11.3 per cent of total area targeted under major crops. This achievement of the current quarter remained the lowest as compared to same quarter of the last three years. This can be seen in Figure 4 which indicates that the per cent achievement decreased from around 51 per cent in second quarter of year 2012 to less than 12 per cent for the current quarter. Despite this reduction, the performance of individual states cannot be questioned for the reason: target assigned for covering area under major crops for the current quarter i.e. for second quarter of 2015 was abnormally higher than the targeted area during the year 2014 for second quarter. The state of Madhya Pradesh, as an instance, had a target of around 12 million hectares for the second quarter of 2014 which became 37 million hectares quarter in 2015 second quarter. This is more than 200 per cent increase in the targeted area. On the other hand, Madhya Pradesh had actually covered about 5.8 million hectares area under major crops in second quarter of 2015 which was just 0.5 million hectares in 2nd quarter of previous year. This is around 970 per cent increase in actually area covered. For some states like Uttar Pradesh, Tamil Nadu, Jharkhand and few states of North eastern states had not provided data for the previous years. They had provided data only for this year. This was another reason for declined overall per cent in achievement. The performance of states, on the basis of per cent achievement to targeted area, within this quarter is presented in Figure 5 in the order of decreasing percentage. The states of Haryana and Uttarakhand have indicated coverage of area under major crops during second quarter of 2015 though they did not have any target. Therefore, they are not listed in the graph. Punjab is the only state which has recorded hundred per cent achievement during this quarter. In fact, it had performed similarly in last two previous years of second quarter. There are instances of states such as Tripura and Manipur which
Quarterly Report: April– June 2015
7
have crossed 90 per cent of the target. But the target for those states was below 4 lakh hectares.
Figure 4: Area covered under Major Crops in 2nd quarter of last 4 years
as per cent to Targeted Area
Figure 5: State-wise Area covered under Major Crops as per cent to Targeted Area
Quarterly Report: April– June 2015
8
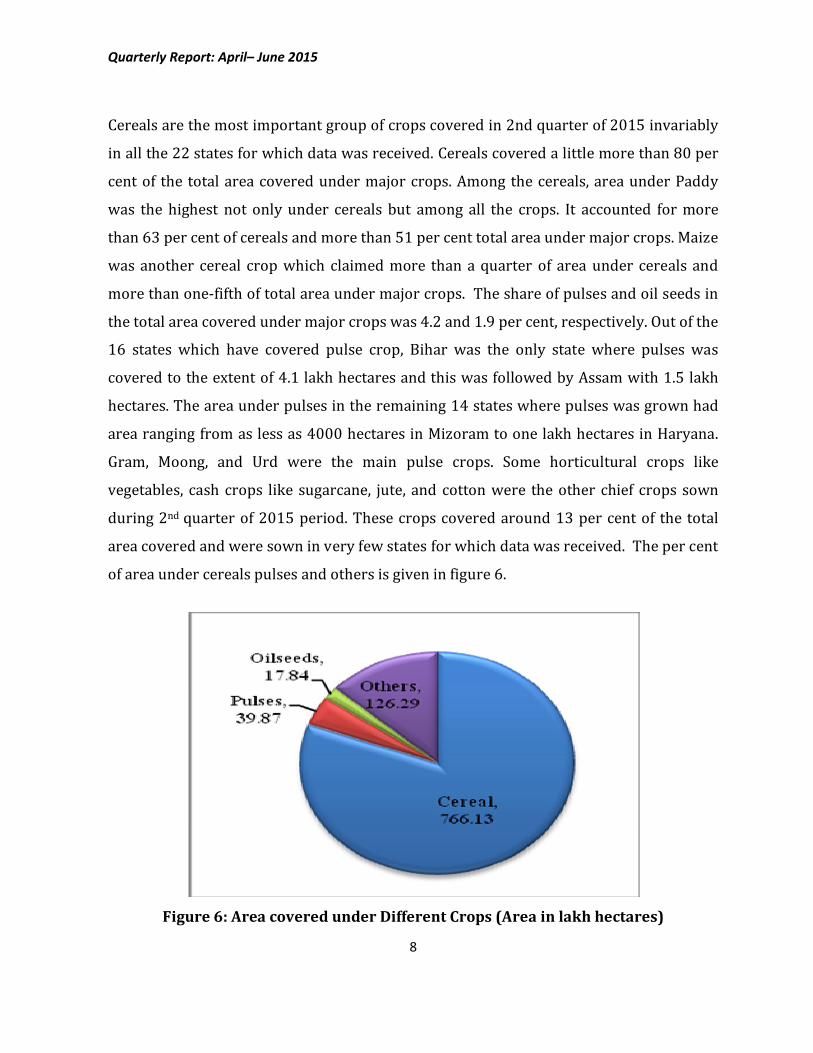
Cereals are the most important group of crops covered in 2nd quarter of 2015 invariably in all the 22 states for which data was received. Cereals covered a little more than 80 per cent of the total area covered under major crops. Among the cereals, area under Paddy was the highest not only under cereals but among all the crops. It accounted for more than 63 per cent of cereals and more than 51 per cent total area under major crops. Maize was another cereal crop which claimed more than a quarter of area under cereals and more than one-fifth of total area under major crops. The share of pulses and oil seeds in the total area covered under major crops was 4.2 and 1.9 per cent, respectively. Out of the 16 states which have covered pulse crop, Bihar was the only state where pulses was covered to the extent of 4.1 lakh hectares and this was followed by Assam with 1.5 lakh hectares. The area under pulses in the remaining 14 states where pulses was grown had area ranging from as less as 4000 hectares in Mizoram to one lakh hectares in Haryana. Gram, Moong, and Urd were the main pulse crops. Some horticultural crops like vegetables, cash crops like sugarcane, jute, and cotton were the other chief crops sown during 2nd quarter of 2015 period. These crops covered around 13 per cent of the total area covered and were sown in very few states for which data was received. The per cent of area under cereals pulses and others is given in figure 6.
Figure 6: Area covered under Different Crops (Area in lakh hectares)
Quarterly Report: April– June 2015
9
4. Incidence of Major Pests and Diseases in Principal Crops Sown
The incidence of major pests and diseases in principal crops were found to be moderate in Assam, Arunachal Pradesh, Manipur, Meghalaya, Mizoram, Nagaland, Tripura, and low in case of Gujarat, Haryana, Karnataka, Punjab, Tamil Nadu, Uttarakhand, Uttar Pradesh and West Bengal. It was strange to note that no attack of pests on principal crops sown was reported for States such as Chhattisgarh, Bihar, Jharkhand, Madhya Pradesh, Maharashtra and Rajasthan.
5. Farm Output Prices of Major Crops
Farm output prices of major crops across the States have shown wide variations. For instance, price of paddy was highest in Jharkhand (Rs. 2300/qtl) and lowest in West Bengal (Rs. 950/qtl). The price of Maize has varied between Rs. 1735/qtl in Chhattisgarh and Rs. 1070/qtl in West Bengal. The price of wheat was highest in Uttarakhand (Rs. 1750/qtl) and lowest in Bihar and Jharkhand (Rs. 1300/qtl).
6. Seed Availability in the Local Market for Major Crops
Seeds are easily available in all the local markets of Chhattisgarh, Bihar, Gujarat, Haryana, Himachal Pradesh, Jharkhand, Karnataka, Madhya Pradesh, Maharashtra, Punjab, Rajasthan, Tamil Nadu, Uttar Pradesh and West Bengal and no shortage has been reported in these States. However, shortage of seeds is reported in States viz., Assam, Arunachal Pradesh, Manipur, Meghalaya, Mizoram, Nagaland, Tripura and Uttarakhand.
7. Prevailing Market Price of Seeds of Major Crops
Market prices of seeds of major crops across the States have shown wide variations. The market price of paddy seeds is comparatively higher in Bihar and Jharkhand (Rs. 250/kg) than in the case of Tripura (Rs. 16/kg). In the case of maize, the lowest market price was
Quarterly Report: April– June 2015
10
reported in West Bengal (Rs. 15/kg) and highest price is noticed in Bihar and Jharkhand (Rs. 275/kg). The highest market price of wheat seeds was reported in Uttarakhand (Rs. 48/kg) and lowest price is noticed in Haryana (Rs. 38/kg).
8. Chemical Fertilizer (NPK) Availability in the Local Market Supply of chemical fertilizers like Urea, SSP, DAP are adequate in the local markets of Chhattisgarh, Bihar, Gujarat, Jharkhand, Karnataka, Madhya Pradesh, Maharashtra, Punjab, Rajasthan, Tamil Nadu, Uttarakhand, Uttar Pradesh and West Bengal. On the contrary the local markets of Assam, Arunachal Pradesh, Haryana, Himachal Pradesh, Manipur, Meghalaya, Mizoram, Nagaland and Tripura are facing scarcity of Chemical Fertilizers.
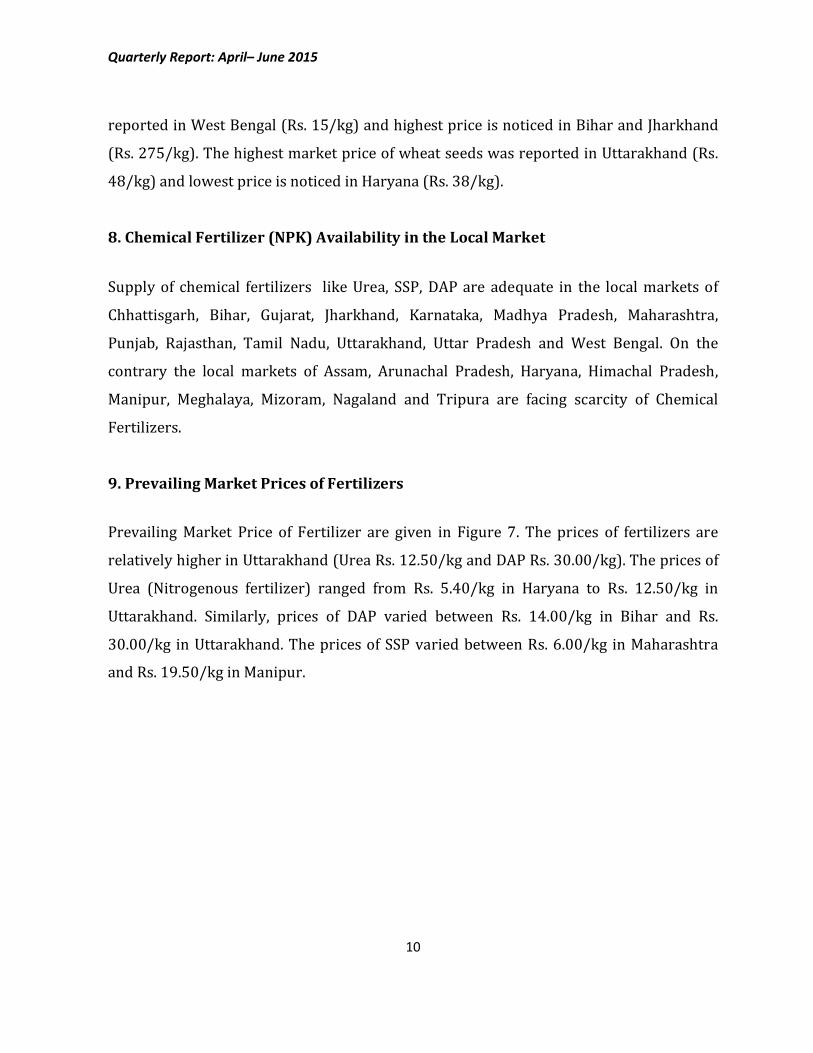
9. Prevailing Market Prices of Fertilizers
Prevailing Market Price of Fertilizer are given in Figure 7. The prices of fertilizers are relatively higher in Uttarakhand (Urea Rs. 12.50/kg and DAP Rs. 30.00/kg). The prices of Urea (Nitrogenous fertilizer) ranged from Rs. 5.40/kg in Haryana to Rs. 12.50/kg in Uttarakhand. Similarly, prices of DAP varied between Rs. 14.00/kg in Bihar and Rs. 30.00/kg in Uttarakhand. The prices of SSP varied between Rs. 6.00/kg in Maharashtra and Rs. 19.50/kg in Manipur.
Quarterly Report: April– June 2015
11
Note: Data not received from Haryana and Uttarakhand for the SSP fertilizer
Figure 7: Prevailing Market Price of Fertilizer (Rs. per Kg)
10. Availability of Agricultural Labourers
In the States of Chhattisgarh, Himachal Pradesh and Tamil Nadu agricultural labourers are easily available. However, shortage of Agricultural labourers reported in Assam, Arunachal Pradesh, Bihar, Gujarat, Haryana, Jharkhand, Karnataka, Madhya Pradesh, Maharashtra, Manipur, Meghalaya, Mizoram, Nagaland, Punjab, Rajasthan, Tripura, Uttarakhand, Uttar Pradesh and West Bengal.
11. Prevailing Wage Rate for Casual Labourers in Agriculture
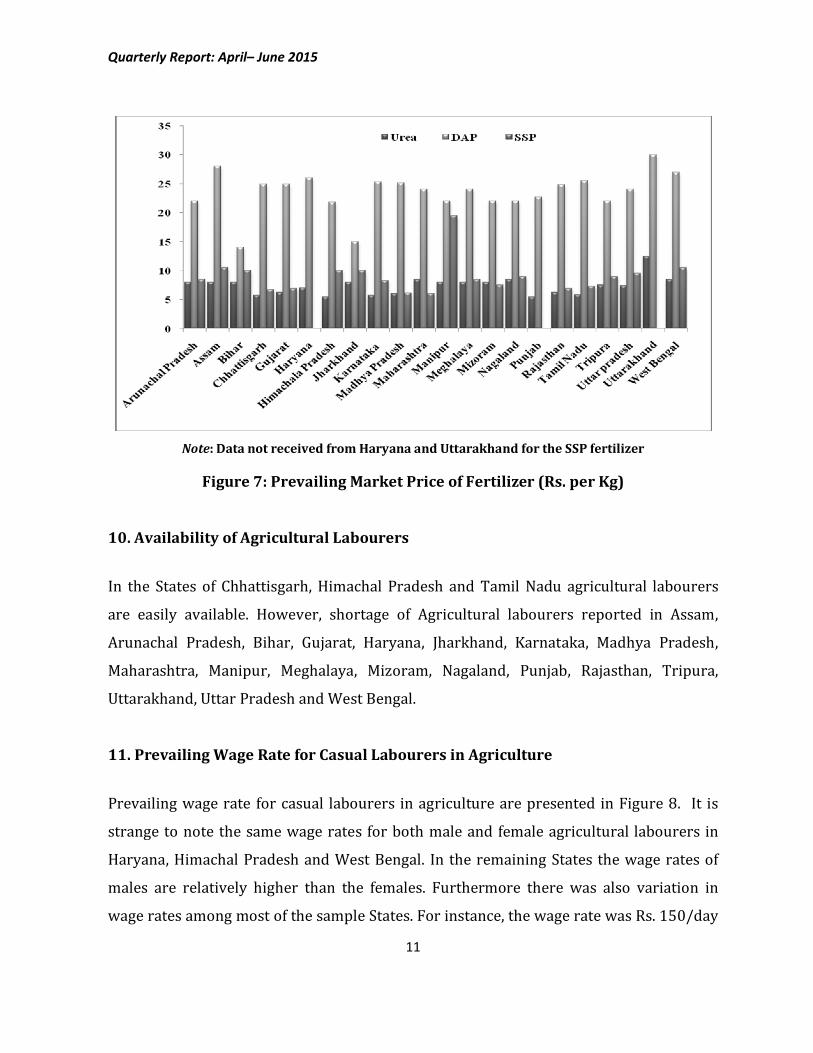
Prevailing wage rate for casual labourers in agriculture are presented in Figure 8. It is strange to note the same wage rates for both male and female agricultural labourers in Haryana, Himachal Pradesh and West Bengal. In the remaining States the wage rates of males are relatively higher than the females. Furthermore there was also variation in wage rates among most of the sample States. For instance, the wage rate was Rs. 150/day
Quarterly Report: April– June 2015
12
in Himachal Pradesh, Rs. 275/day in Haryana and Rs. 235/day in West Bengal for both male and female.
Figure 8: Prevailing Wage Rate for Casual Labourers in Agriculture (Rs. per day)
12. Availability of Institutional Credit for Agriculture in the State
Targets will be fixed annually for the credit disbursement to agricultural sector in India. The information about targets and achievements for most of the States are not available. Only sixteen States have provided the information about targets and achievements of institutional agricultural credit. On the basis of this data, it has been observed that Karnataka has achieved for about 109 per cent of the target flow of institutional credit to agriculture. The achievement was 103 per cent, 93 per cent, 81 per cent, 54 per cent, 52 per cent and 50 per cent of the target in case of Punjab, Madhya Pradesh, Himachal Pradesh, Tripura, Assam and Mizoram respectively. The remaining States viz., West Bengal, Arunachal Pradesh, Manipur, Bihar, Jharkhand, Meghalaya, Nagaland, Uttar Pradesh and Chhattisgarh have achieved less than 50 per cent of the target in the respective States.
Quarterly Report: April– June 2015
13
13. Electricity Availability for Irrigation Pump sets
Out of Twenty two major States, ten States have furnished the data on availability of electricity for agricultural purposes. Results shows that the electricity was available ranging 5 to 6 hrs in Jharkhand, 5 to 8 hrs in Rajasthan and Punjab, 6 to 7 hrs in Bihar, 7 to 8 hrs in Gujarat, 8 to 10 hrs in Uttar Pradesh, 8 hrs in Madhya Pradesh, 4 hrs in Karnataka, 20 hrs in Himachal Pradesh and 24 hrs in Chhattisgarh. On an average, the availability of power was about 10 hours per day. 14. Availability of Farm Machinery for Timely Sowing, Harvesting and Other
Operations
Farm machinery is easily available in the States of Chhattisgarh, Gujarat, Haryana, Himachal Pradesh, Karnataka, Madhya Pradesh, Maharashtra, Punjab, Rajasthan and Uttar Pradesh for timely sowing, harvesting and other operations. Shortage of farm machinery was reported in Assam, Arunachal Pradesh, Bihar, Jharkhand, Manipur, Meghalaya, Mizoram, Nagaland, Tripura, Tamil Nadu, West Bengal and Uttarakhand.
15. Availability of Organic Manure, Farm-Yard-Manure, Vermin Compost, Bio
Fertilizer
The results indicated that the availability of organic manure, farmyard manure, vermi compost and bio-fertilizers are adequate in Chhattisgarh, Gujarat, Karnataka, Maharashtra, Rajasthan, Uttar Pradesh and West Bengal. Whereas it is shortage in Assam, Arunachal Pradesh, Bihar, Haryana, Himachal Pradesh, Jharkhand, Madhya Pradesh, Manipur, Meghalaya, Mizoram, Nagaland, Punjab, Tripura, Tamil Nadu and medium in Uttarakhand.
Quarterly Report: April– June 2015
14
16. Data Constraints
The Ministry of Agriculture, Government of India and National Institution for Transformation of India, replaced by Planning Commission, intended to have quarterly glimpse of State-wise agriculture situation in the Country. For this purpose, all the twelve Agro Economic Research Centres (AERCs) spread across the Country were assigned the task of collecting data on quarterly basis for 15 indicators for the States, under their jurisdiction, and forward it to Agricultural Development and Rural Transformation Centre (ADRTC) of the Institute for Social and Economic Change (ISEC), Bangalore, in a prescribed format. The ADRT Centre, in turn, was to prepare a consolidated report for all the major States in the Country and submit the report for every quarter of the year. For the past several years, the ADRT centre has been consolidating the data received from the AERCs and submitting four quarterly reports for a year to Ministry of Agriculture. Over the years, the ADRT centre encountered certain constraints in submitting report timely in a manner it is most useful to the ministry. Majority of the constraints is related to data collection and its authenticity. Firstly, ADRTC does not receive the data from few AERCs on time. The centre does not receive data from few AERCs even after waiting for a long period. Thereby, the reports get unduly delayed. It is worth mentioning here that the ADRT centre had received data for only 7 states for 1st quarter of 2012 report. The centre received data for 22 states, for the first time, for April to June, 2015 i.e. current quarter. Data for all quarters beginning from 1st quarter of 2012 to 2nd quarter of 2015 was received for the States of Karnataka, Assam and Himachal Pradesh. Secondly, many of the indicators are season specific. Part of every quarter gets spread over to different seasons. As a result, the data furnished by AERCs will not depict true picture of the States. Therefore, the ADRTC proposes to convert the report as a season based.
Quarterly Report: April– June 2015
15
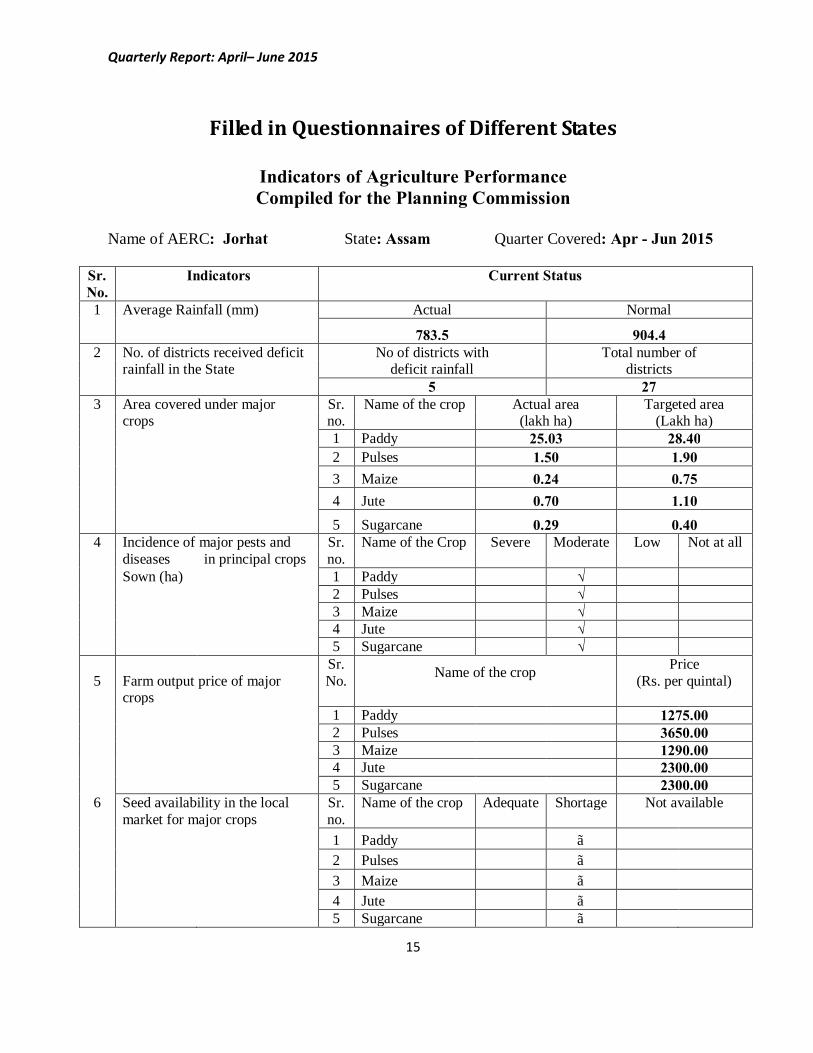
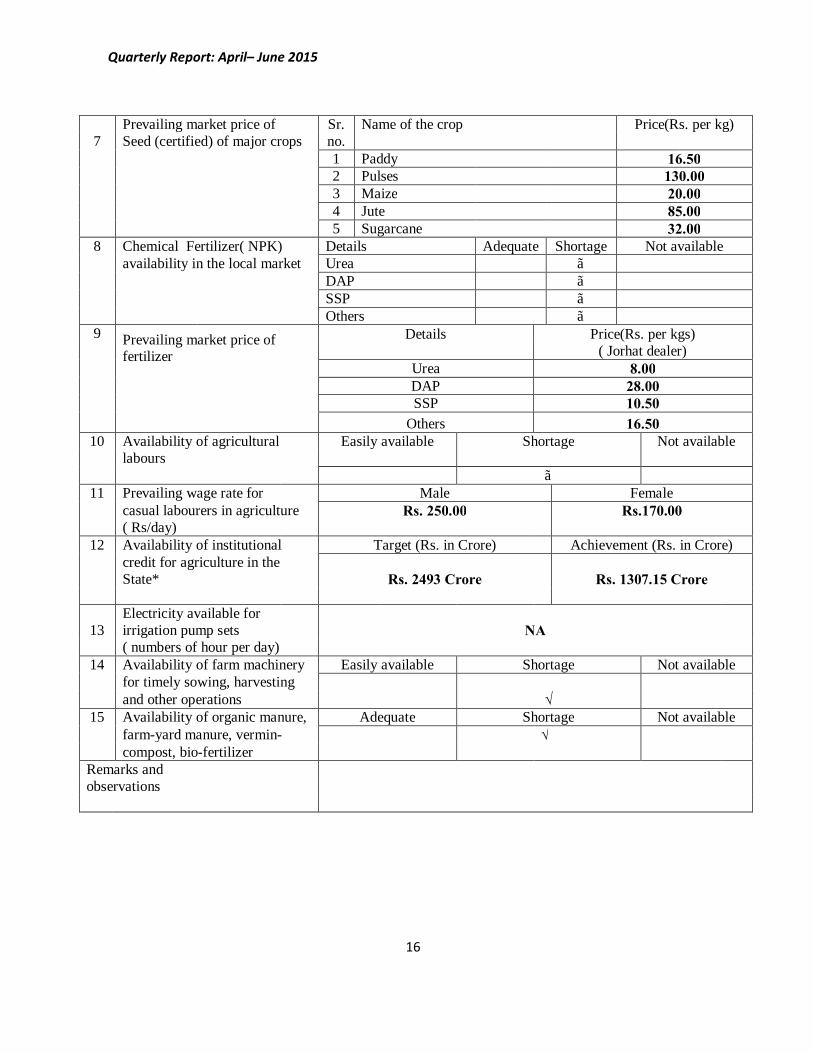
Filled in Questionnaires of Different States
Indicators of Agriculture Performance Compiled for the Planning Commission
Name of AERC: Jorhat State: Assam Quarter Covered: Apr - Jun 2015
Sr. No.
Indicators
Current Status
1 Average Rainfall (mm) Actual Normal
783.5 904.4
2 No. of districts received deficit No of districts with Total number of rainfall in the State deficit rainfall districts 5 27 3 Area covered under major Sr.
no. Name of the crop
Actual area
(lakh ha) Targeted area
(Lakh ha) crops
1 Paddy 25.03 28.40
2 Pulses 1.50 1.90
3 Maize 0.24 0.75
4 Jute 0.70 1.10 5 Sugarcane 0.29 0.40 4 Incidence of major pests and Sr. Name of the Crop Severe Moderate Low Not at all diseases in principal crops no. Sown (ha)
1 Paddy √
2 Pulses
√
3 Maize
√
4 Jute √
5 Sugarcane √
5 Farm output price of major Sr. No. Name of the crop Price
(Rs. per quintal)
crops
1 Paddy 1275.00 2 Pulses
3650.00
3 Maize
1290.00
4 Jute 2300.00 5 Sugarcane 2300.00 6 Seed availability in the local Sr. Name of the crop Adequate Shortage Not available market for major crops no.
1 Paddy √
2 Pulses √
3 Maize
√
4 Jute
√
5 Sugarcane √
Quarterly Report: April– June 2015
16
7 Prevailing market price of Sr. Name of the crop
Price(Rs. per kg) Seed (certified) of major crops no. 1 Paddy 16.50 2 Pulses 130.00
3 Maize
20.00 4 Jute 85.00 5 Sugarcane 32.00 8 Chemical Fertilizer( NPK) Details Adequate Shortage Not available availability in the local market Urea √
DAP √
SSP √ Others √ 9 Prevailing market price of
fertilizer
Details
Price(Rs. per kgs) ( Jorhat dealer)
Urea 8.00 DAP 28.00 SSP 10.50 Others 16.50
10 Availability of agricultural Easily available Shortage Not available labours
√ 11 Prevailing wage rate for Male Female casual labourers in agriculture Rs. 250.00 Rs.170.00 ( Rs/day)
12 Availability of institutional Target (Rs. in Crore) Achievement (Rs. in Crore)
credit for agriculture in the State* Rs. 2493 Crore Rs. 1307.15 Crore
13 Electricity available for irrigation pump sets NA
( numbers of hour per day)
14 Availability of farm machinery Easily available Shortage Not available for timely sowing, harvesting
√ and other operations 15 Availability of organic manure, Adequate Shortage Not available farm-yard manure, vermin-
√
compost, bio-fertilizer Remarks and
observations
Quarterly Report: April– June 2015
17
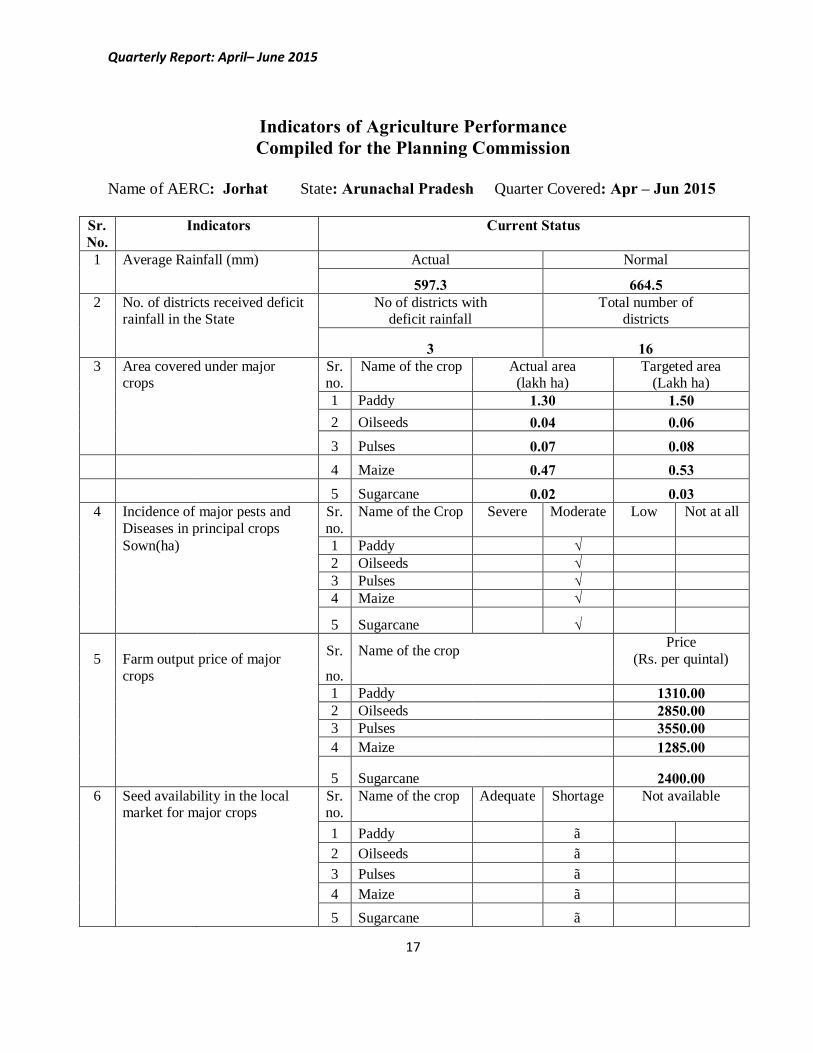
Indicators of Agriculture Performance Compiled for the Planning Commission
Name of AERC: Jorhat State: Arunachal Pradesh Quarter Covered: Apr – Jun 2015
Sr. No.
Indicators
Current Status
1 Average Rainfall (mm) Actual Normal
597.3 664.5 2 No. of districts received deficit No of districts with Total number of rainfall in the State deficit rainfall districts
3 16 3 Area covered under major Sr.
no. Name of the crop
Actual area
(lakh ha) Targeted area
(Lakh ha) crops
1 Paddy 1.30 1.50
2 Oilseeds 0.04 0.06
3 Pulses 0.07 0.08
4 Maize 0.47 0.53
5 Sugarcane 0.02 0.03 4 Incidence of major pests and Sr. Name of the Crop Severe Moderate Low Not at all Diseases in principal crops no. Sown(ha)
1 Paddy √
2 Oilseeds √
3 Pulses
√
4 Maize
√
5 Sugarcane √
5 Farm output price of major Sr. Name of the crop Price (Rs. per quintal)
crops no.
1 Paddy 1310.00 2 Oilseeds 2850.00
3 Pulses
3550.00
4 Maize
1285.00
5 Sugarcane 2400.00 6 Seed availability in the local Sr. Name of the crop Adequate Shortage Not available
market for major crops no.
1 Paddy √
2 Oilseeds
√
3 Pulses
√
4 Maize
√
5 Sugarcane √

Quarterly Report: April– June 2015
18
7 Prevailing market price of Sr. Name of the crop
Price(Rs. per kg)
seed(certified) of major crops no. 1 Paddy 16.50 2 Oilseeds 130.00
3 Pulses
150.00
4 Maize
18.50
5 Sugarcane 31.00 8 Chemical Fertilizer( NPK) Details Adequate Shortage Not available availability in the local market Urea √
DAP √
SSP √ Others √ 9 Prevailing market price of
fertilizer
Details
Price(Rs. per kgs)
Urea 8.00 DAP 22.00 SSP 8.50 Others 15.00 - 18.00
10 Availability of agricultural Easily available Shortage Not available labours
√ 11 Prevailing wage rate for Male Female casual labourers in agriculture Rs. 230.00 Rs. 150.00 ( Rs/day)
12 Availability of institutional Target (Rs. in Crore) Achievement (Rs. in Crore)
credit for agriculture in the State* Rs. 9.59 Crore Rs. 4.27 crore
13 Electricity available for irrigation pump sets NA
( numbers of hour per day)
14 Availability of farm machinery Easily available Shortage Not available for timely sowing, harvesting
√ and other operations 15 Availability of organic manure, Adequate Shortage Not available farm-yard manure, vermin-
√
compost, bio-fertilizer Remarks and
observations
Quarterly Report: April– June 2015
19
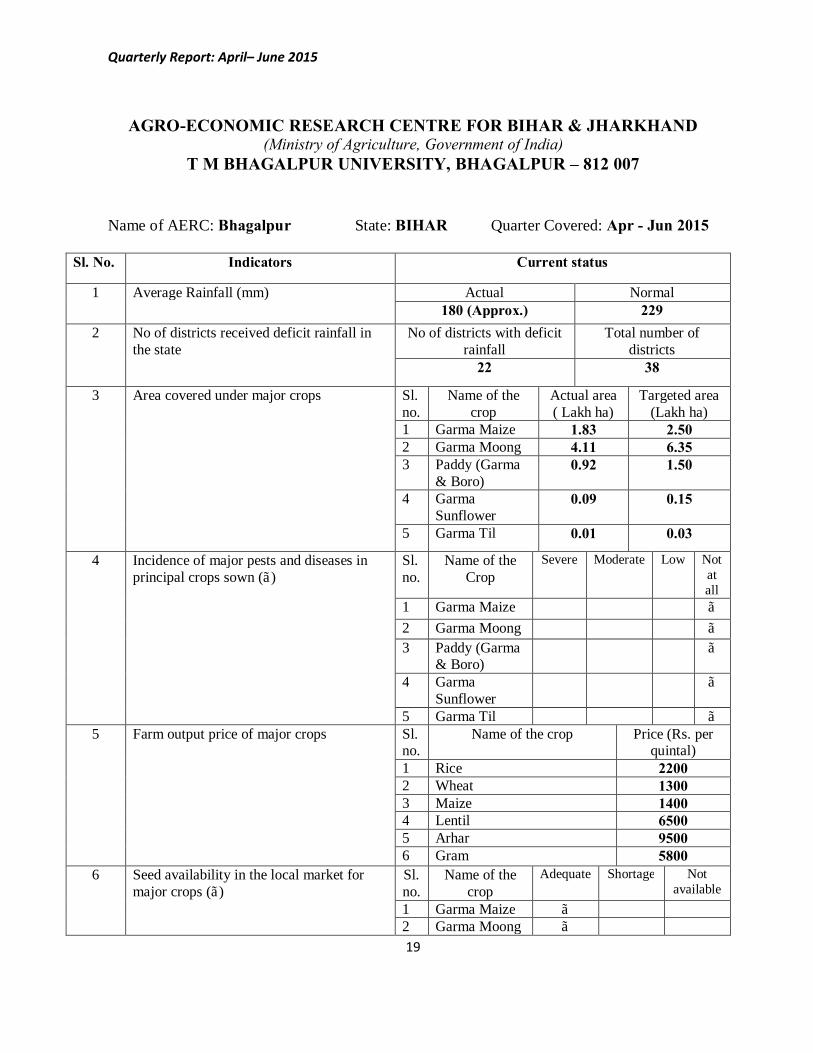
AGRO-ECONOMIC RESEARCH CENTRE FOR BIHAR & JHARKHAND (Ministry of Agriculture, Government of India)
T M BHAGALPUR UNIVERSITY, BHAGALPUR – 812 007 Name of AERC: Bhagalpur State: BIHAR Quarter Covered: Apr - Jun 2015
Sl. No. Indicators Current status
1 Average Rainfall (mm) Actual Normal 180 (Approx.) 229
2 No of districts received deficit rainfall in the state
No of districts with deficit rainfall
Total number of districts
22 38
3 Area covered under major crops Sl. no.
Name of the crop
Actual area ( Lakh ha)
Targeted area (Lakh ha)
1 Garma Maize 1.83 2.50 2 Garma Moong 4.11 6.35 3 Paddy (Garma
& Boro) 0.92 1.50
4 Garma Sunflower
0.09 0.15
5 Garma Til 0.01 0.03
4 Incidence of major pests and diseases in principal crops sown (√)
Sl. no.
Name of the Crop
Severe Moderate Low Not at all
1 Garma Maize √ 2 Garma Moong √ 3 Paddy (Garma
& Boro) √
4 Garma Sunflower
√
5 Garma Til √ 5 Farm output price of major crops Sl.
no. Name of the crop Price (Rs. per
quintal) 1 Rice 2200 2 Wheat 1300 3 Maize 1400 4 Lentil 6500 5 Arhar 9500 6 Gram 5800
6 Seed availability in the local market for major crops (√)
Sl. no.
Name of the crop
Adequate Shortage Not available
1 Garma Maize √ 2 Garma Moong √
Quarterly Report: April– June 2015
20
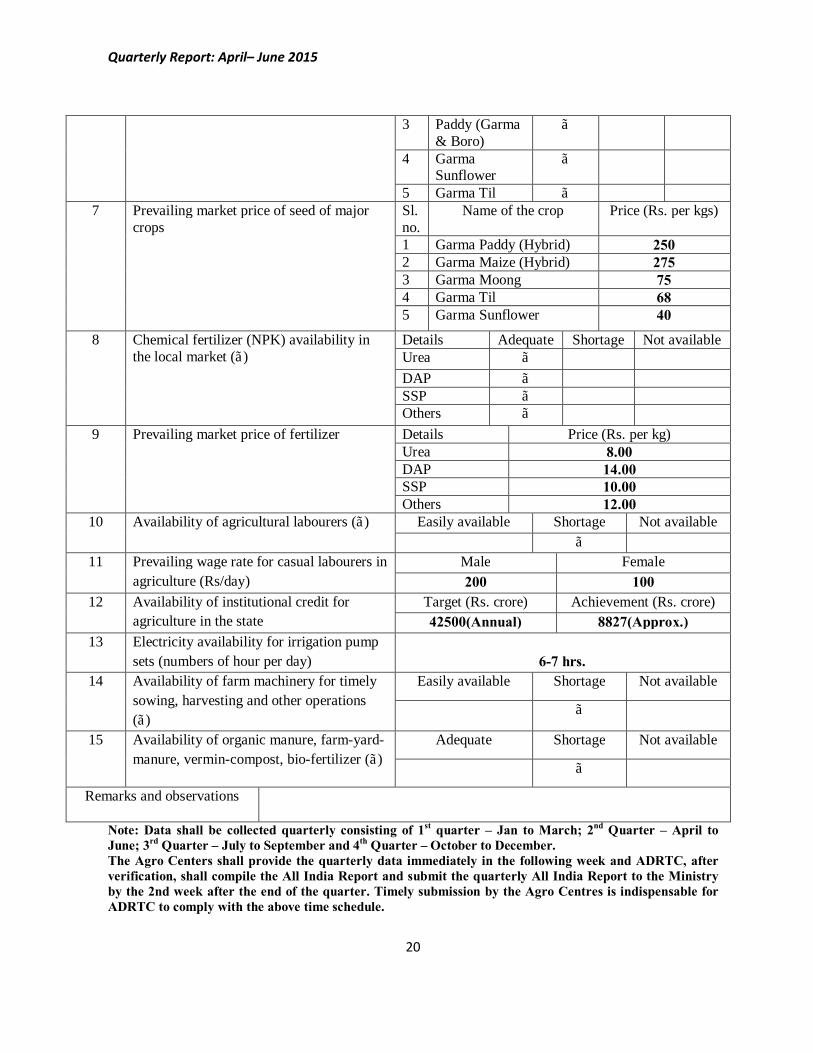
3 Paddy (Garma & Boro)
√
4 Garma Sunflower
√
5 Garma Til √ 7 Prevailing market price of seed of major
crops Sl. no.
Name of the crop Price (Rs. per kgs)
1 Garma Paddy (Hybrid) 250 2 Garma Maize (Hybrid) 275 3 Garma Moong 75 4 Garma Til 68 5 Garma Sunflower 40
8 Chemical fertilizer (NPK) availability in the local market (√)
Details Adequate Shortage Not available Urea √ DAP √ SSP √ Others √
9 Prevailing market price of fertilizer Details Price (Rs. per kg) Urea 8.00 DAP 14.00 SSP 10.00 Others 12.00
10 Availability of agricultural labourers (√) Easily available Shortage Not available √
11 Prevailing wage rate for casual labourers in agriculture (Rs/day)
Male Female 200 100
12 Availability of institutional credit for agriculture in the state
Target (Rs. crore) Achievement (Rs. crore) 42500(Annual) 8827(Approx.)
13 Electricity availability for irrigation pump sets (numbers of hour per day)
6-7 hrs.
14 Availability of farm machinery for timely sowing, harvesting and other operations (√)
Easily available Shortage Not available
√
15 Availability of organic manure, farm-yard-manure, vermin-compost, bio-fertilizer (√)
Adequate Shortage Not available
√
Remarks and observations
Note: Data shall be collected quarterly consisting of 1st quarter – Jan to March; 2nd Quarter – April to June; 3rd Quarter – July to September and 4th Quarter – October to December. The Agro Centers shall provide the quarterly data immediately in the following week and ADRTC, after verification, shall compile the All India Report and submit the quarterly All India Report to the Ministry by the 2nd week after the end of the quarter. Timely submission by the Agro Centres is indispensable for ADRTC to comply with the above time schedule.
Quarterly Report: April– June 2015
21
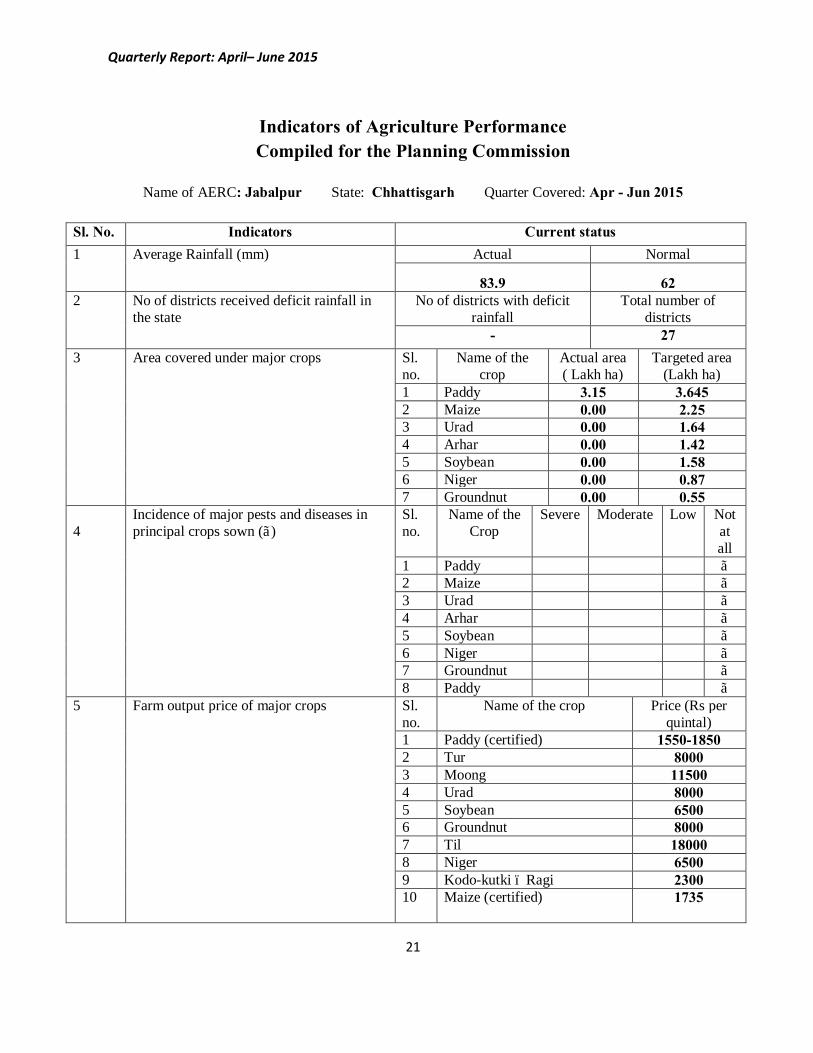
Indicators of Agriculture Performance Compiled for the Planning Commission
Name of AERC: Jabalpur State: Chhattisgarh Quarter Covered: Apr - Jun 2015
Sl. No. Indicators Current status 1 Average Rainfall (mm) Actual Normal
83.9 62 2 No of districts received deficit rainfall in
the state No of districts with deficit
rainfall Total number of
districts - 27
3 Area covered under major crops Sl. no.
Name of the crop
Actual area ( Lakh ha)
Targeted area (Lakh ha)
1 Paddy 3.15 3.645 2 Maize 0.00 2.25 3 Urad 0.00 1.64 4 Arhar 0.00 1.42 5 Soybean 0.00 1.58 6 Niger 0.00 0.87 7 Groundnut 0.00 0.55
4
Incidence of major pests and diseases in principal crops sown (√)
Sl. no.
Name of the Crop
Severe Moderate Low Not at all
1 Paddy √ 2 Maize √ 3 Urad √ 4 Arhar √ 5 Soybean √ 6 Niger √ 7 Groundnut √ 8 Paddy √
5 Farm output price of major crops Sl. no.
Name of the crop Price (Rs per quintal)
1 Paddy (certified) 1550-1850 2 Tur 8000 3 Moong 11500 4 Urad 8000 5 Soybean 6500 6 Groundnut 8000 7 Til 18000 8 Niger 6500 9 Kodo-kutki – Ragi 2300 10 Maize (certified)
1735
Quarterly Report: April– June 2015
22
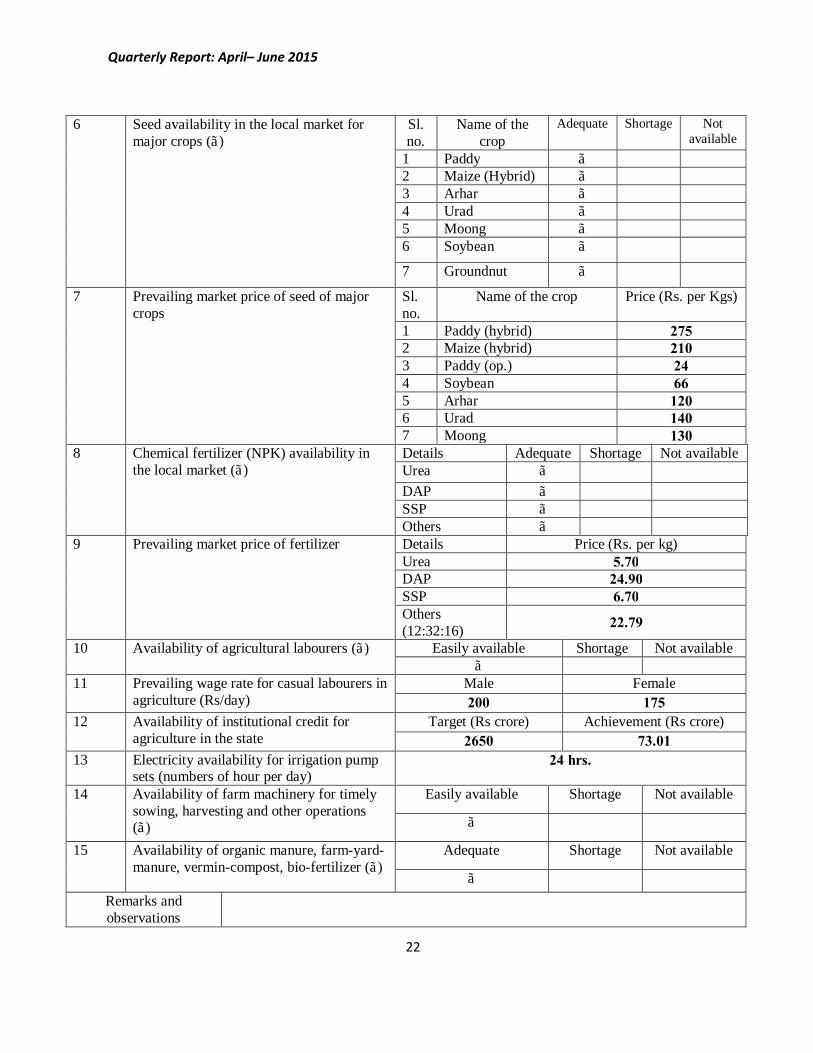
6 Seed availability in the local market for major crops (√)
Sl. no.
Name of the crop
Adequate Shortage Not available
1 Paddy √ 2 Maize (Hybrid) √ 3 Arhar √ 4 Urad √ 5 Moong √ 6 Soybean √
7 Groundnut √
7 Prevailing market price of seed of major crops
Sl. no.
Name of the crop Price (Rs. per Kgs)
1 Paddy (hybrid) 275 2 Maize (hybrid) 210 3 Paddy (op.) 24 4 Soybean 66 5 Arhar 120 6 Urad 140 7 Moong 130
8 Chemical fertilizer (NPK) availability in the local market (√)
Details Adequate Shortage Not available Urea √ DAP √ SSP √ Others √
9 Prevailing market price of fertilizer Details Price (Rs. per kg) Urea 5.70 DAP 24.90 SSP 6.70 Others (12:32:16) 22.79
10 Availability of agricultural labourers (√) Easily available Shortage Not available √
11 Prevailing wage rate for casual labourers in agriculture (Rs/day)
Male Female 200 175
12 Availability of institutional credit for agriculture in the state
Target (Rs crore) Achievement (Rs crore) 2650 73.01
13 Electricity availability for irrigation pump sets (numbers of hour per day)
24 hrs.
14 Availability of farm machinery for timely sowing, harvesting and other operations (√)
Easily available Shortage Not available
√
15 Availability of organic manure, farm-yard-manure, vermin-compost, bio-fertilizer (√)
Adequate Shortage Not available
√ Remarks and observations
Quarterly Report: April– June 2015
23
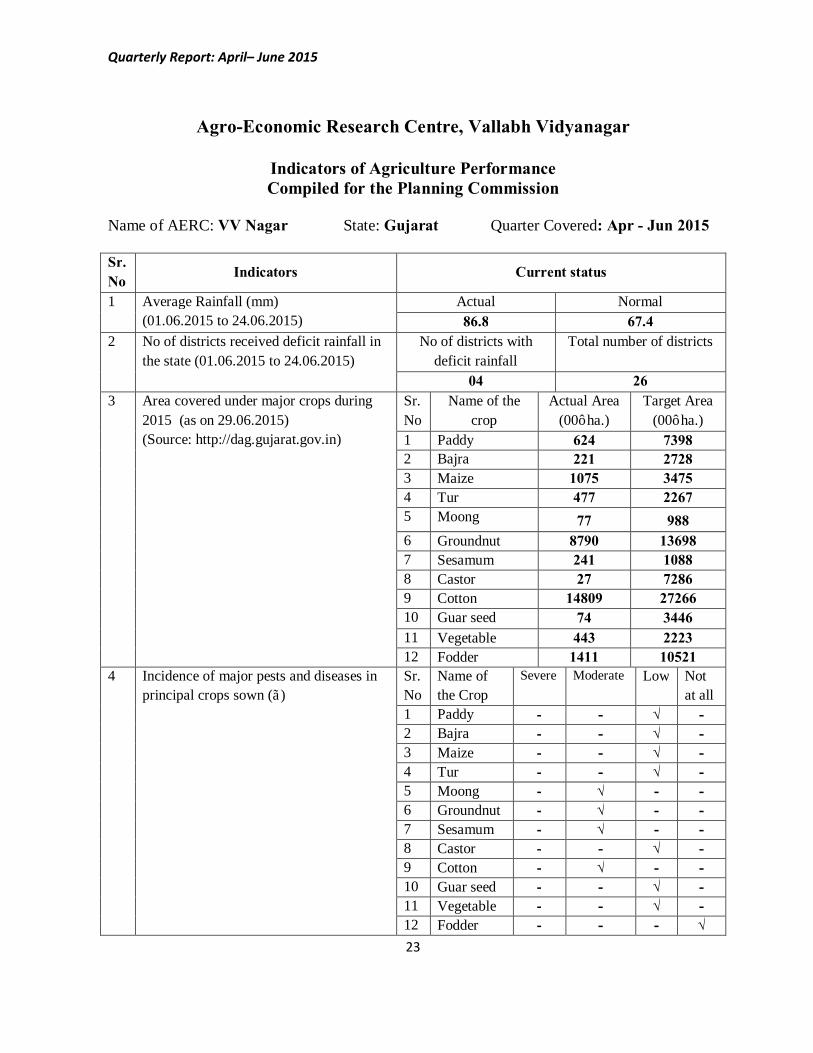
Agro-Economic Research Centre, Vallabh Vidyanagar
Indicators of Agriculture Performance Compiled for the Planning Commission
Name of AERC: VV Nagar State: Gujarat Quarter Covered: Apr - Jun 2015 Sr. No Indicators Current status
1 Average Rainfall (mm) (01.06.2015 to 24.06.2015)
Actual Normal 86.8 67.4
2 No of districts received deficit rainfall in the state (01.06.2015 to 24.06.2015)
No of districts with deficit rainfall
Total number of districts
04 26 3 Area covered under major crops during
2015 (as on 29.06.2015) (Source: http://dag.gujarat.gov.in)
Sr. No
Name of the crop
Actual Area (00’ ha.)
Target Area (00’ ha.)
1 Paddy 624 7398 2 Bajra 221 2728 3 Maize 1075 3475 4 Tur 477 2267 5 Moong 77 988 6 Groundnut 8790 13698 7 Sesamum 241 1088 8 Castor 27 7286 9 Cotton 14809 27266 10 Guar seed 74 3446 11 Vegetable 443 2223 12 Fodder 1411 10521
4 Incidence of major pests and diseases in principal crops sown (√)
Sr. No
Name of the Crop
Severe Moderate Low Not at all
1 Paddy - - √ - 2 Bajra - - √ - 3 Maize - - √ - 4 Tur - - √ - 5 Moong - √ - - 6 Groundnut - √ - - 7 Sesamum - √ - - 8 Castor - - √ - 9 Cotton - √ - - 10 Guar seed - - √ - 11 Vegetable - - √ - 12 Fodder - - - √
Quarterly Report: April– June 2015
24
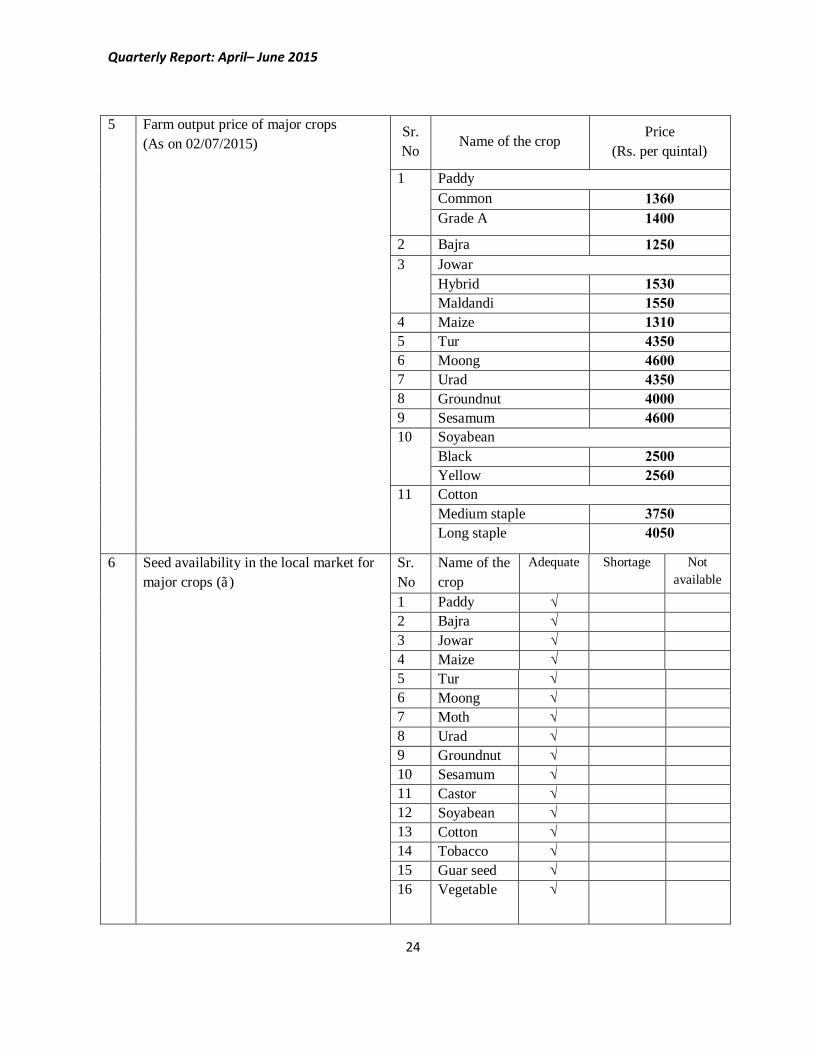
5 Farm output price of major crops (As on 02/07/2015)
Sr. No
Name of the crop Price (Rs. per quintal)
1 Paddy Common 1360 Grade A 1400
2 Bajra 1250 3 Jowar
Hybrid 1530 Maldandi 1550
4 Maize 1310 5 Tur 4350 6 Moong 4600 7 Urad 4350 8 Groundnut 4000 9 Sesamum 4600 10 Soyabean
Black 2500 Yellow 2560
11 Cotton Medium staple 3750 Long staple 4050
6 Seed availability in the local market for major crops (√)
Sr. No
Name of the crop
Adequate Shortage Not available
1 Paddy √ 2 Bajra √ 3 Jowar √ 4 Maize √ 5 Tur √ 6 Moong √ 7 Moth √ 8 Urad √ 9 Groundnut √ 10 Sesamum √ 11 Castor √ 12 Soyabean √ 13 Cotton √ 14 Tobacco √ 15 Guar seed √ 16 Vegetable √
Quarterly Report: April– June 2015
25
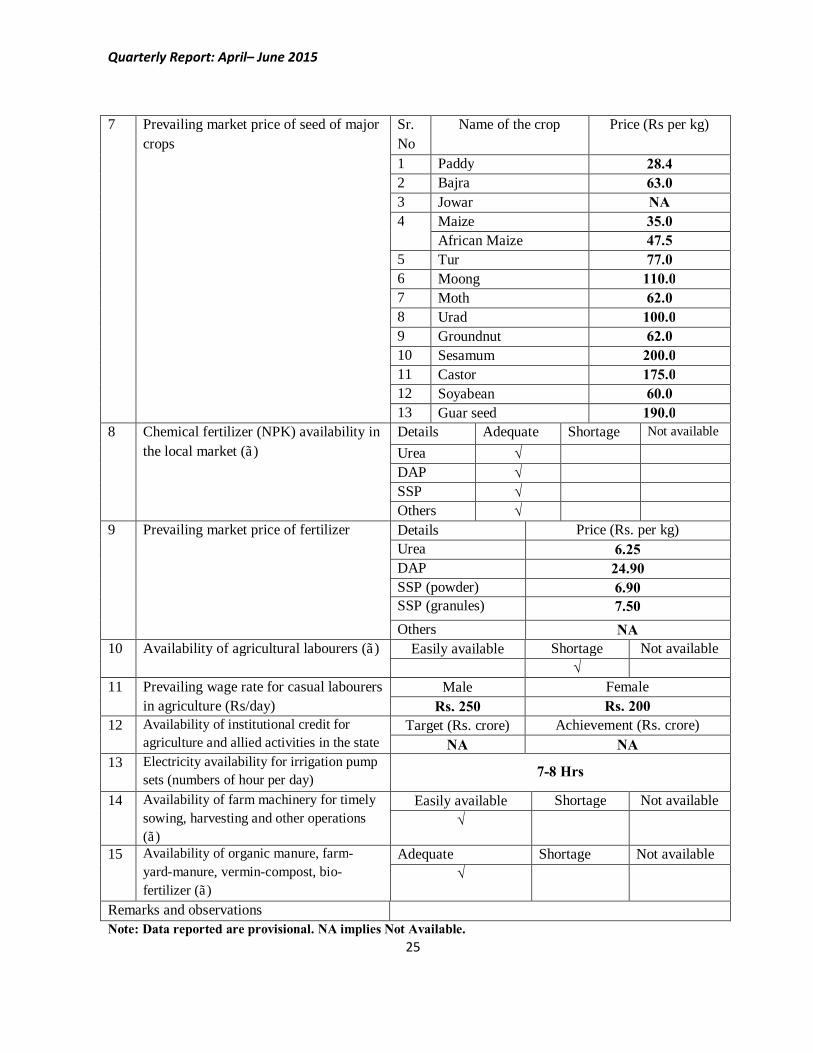
7 Prevailing market price of seed of major crops
Sr. No
Name of the crop Price (Rs per kg)
1 Paddy 28.4 2 Bajra 63.0 3 Jowar NA 4 Maize 35.0
African Maize 47.5 5 Tur 77.0 6 Moong 110.0 7 Moth 62.0 8 Urad 100.0 9 Groundnut 62.0 10 Sesamum 200.0 11 Castor 175.0 12 Soyabean 60.0 13 Guar seed 190.0
8 Chemical fertilizer (NPK) availability in the local market (√)
Details Adequate Shortage Not available
Urea √ DAP √ SSP √ Others √
9 Prevailing market price of fertilizer Details Price (Rs. per kg) Urea 6.25 DAP 24.90 SSP (powder) 6.90 SSP (granules) 7.50 Others NA
10 Availability of agricultural labourers (√) Easily available Shortage Not available √
11 Prevailing wage rate for casual labourers in agriculture (Rs/day)
Male Female Rs. 250 Rs. 200
12 Availability of institutional credit for agriculture and allied activities in the state
Target (Rs. crore) Achievement (Rs. crore) NA NA
13 Electricity availability for irrigation pump sets (numbers of hour per day) 7-8 Hrs
14 Availability of farm machinery for timely sowing, harvesting and other operations (√)
Easily available Shortage Not available √
15 Availability of organic manure, farm-yard-manure, vermin-compost, bio-fertilizer (√)
Adequate Shortage Not available √
Remarks and observations Note: Data reported are provisional. NA implies Not Available.
Quarterly Report: April– June 2015
26
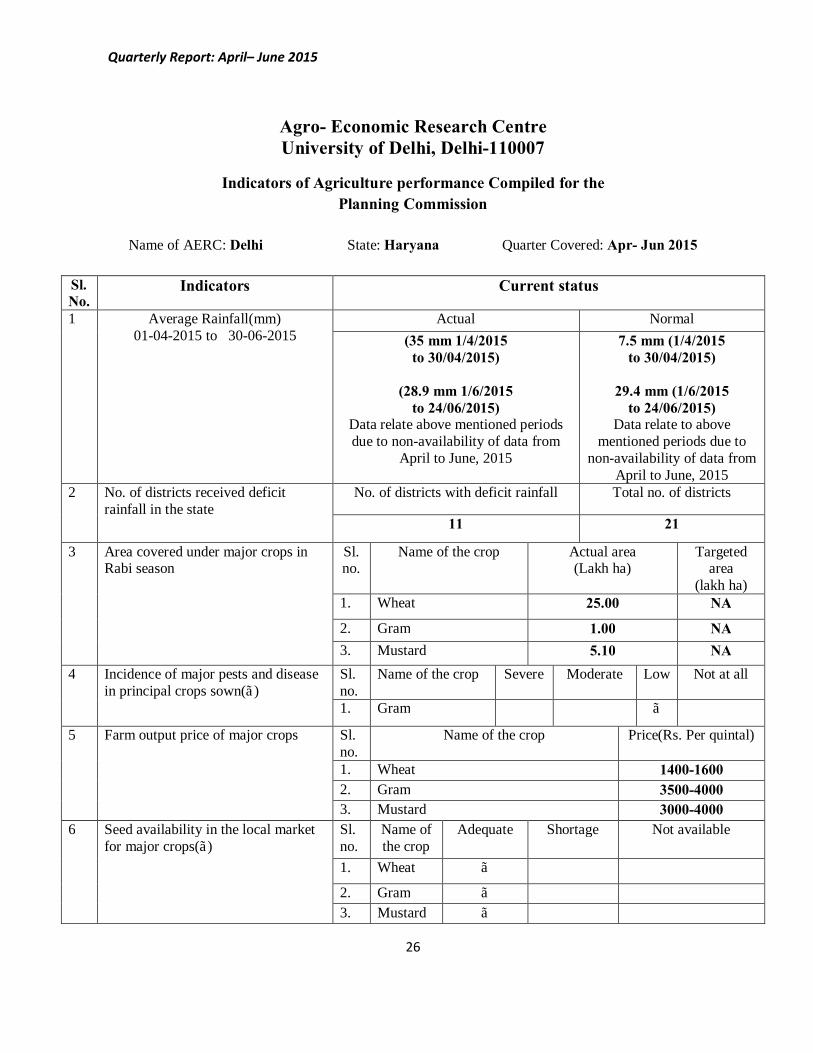
Agro- Economic Research Centre University of Delhi, Delhi-110007
Indicators of Agriculture performance Compiled for the
Planning Commission
Name of AERC: Delhi State: Haryana Quarter Covered: Apr- Jun 2015
Sl. No.
Indicators Current status
1 Average Rainfall(mm) 01-04-2015 to 30-06-2015
Actual Normal (35 mm 1/4/2015
to 30/04/2015)
(28.9 mm 1/6/2015 to 24/06/2015)
Data relate above mentioned periods due to non-availability of data from
April to June, 2015
7.5 mm (1/4/2015 to 30/04/2015)
29.4 mm (1/6/2015
to 24/06/2015) Data relate to above
mentioned periods due to non-availability of data from
April to June, 2015 2 No. of districts received deficit
rainfall in the state No. of districts with deficit rainfall Total no. of districts
11 21
3 Area covered under major crops in Rabi season
Sl. no.
Name of the crop Actual area (Lakh ha)
Targeted area
(lakh ha) 1. Wheat 25.00 NA
2. Gram 1.00 NA 3. Mustard 5.10 NA
4 Incidence of major pests and disease in principal crops sown(√)
Sl. no.
Name of the crop Severe Moderate Low Not at all
1. Gram √
5 Farm output price of major crops Sl. no.
Name of the crop Price(Rs. Per quintal)
1. Wheat 1400-1600 2. Gram 3500-4000 3. Mustard 3000-4000
6 Seed availability in the local market for major crops(√)
Sl. no.
Name of the crop
Adequate Shortage Not available
1. Wheat √
2. Gram √ 3. Mustard √
Quarterly Report: April– June 2015
27
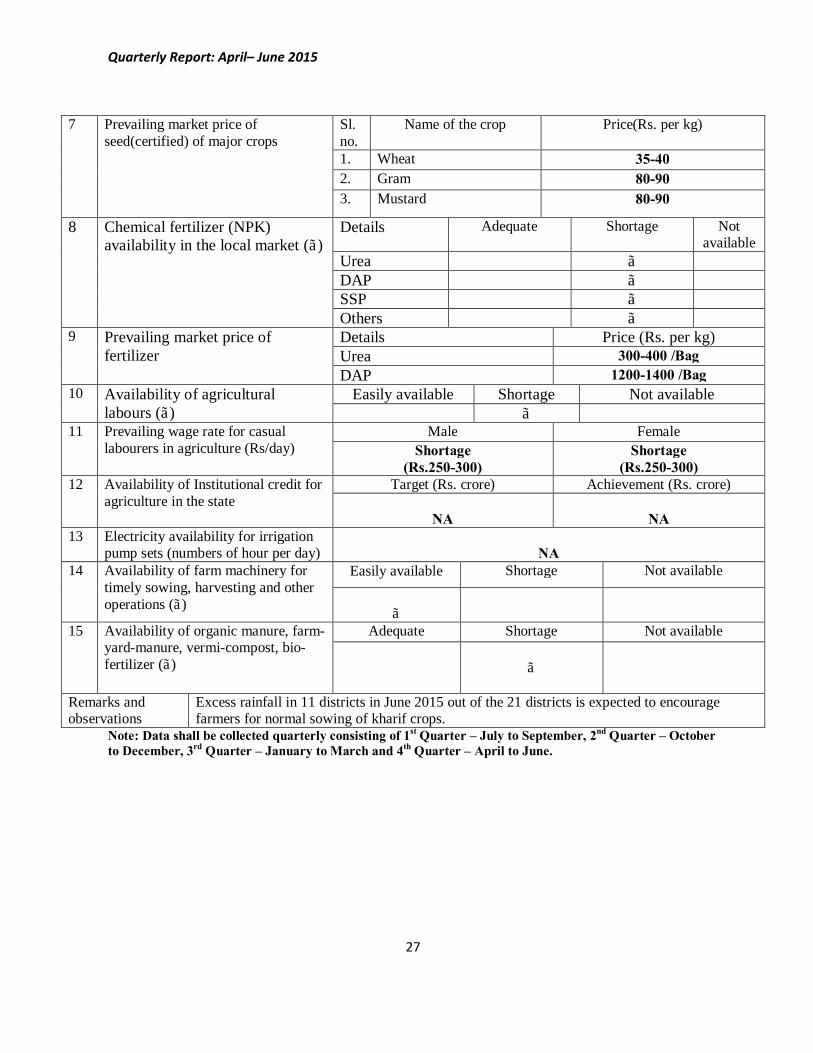
7 Prevailing market price of seed(certified) of major crops
Sl. no.
Name of the crop Price(Rs. per kg)
1. Wheat 35-40 2. Gram 80-90 3. Mustard 80-90
8 Chemical fertilizer (NPK) availability in the local market (√)
Details Adequate Shortage Not available
Urea √ DAP √ SSP √ Others √
9 Prevailing market price of fertilizer
Details Price (Rs. per kg) Urea 300-400 /Bag DAP 1200-1400 /Bag
10 Availability of agricultural labours (√)
Easily available Shortage Not available √
11 Prevailing wage rate for casual labourers in agriculture (Rs/day)
Male Female Shortage
(Rs.250-300) Shortage
(Rs.250-300) 12 Availability of Institutional credit for
agriculture in the state Target (Rs. crore) Achievement (Rs. crore)
NA
NA
13 Electricity availability for irrigation pump sets (numbers of hour per day)
NA
14 Availability of farm machinery for timely sowing, harvesting and other operations (√)
Easily available Shortage Not available
√
15 Availability of organic manure, farm-yard-manure, vermi-compost, bio-fertilizer (√)
Adequate Shortage Not available
√
Remarks and observations
Excess rainfall in 11 districts in June 2015 out of the 21 districts is expected to encourage farmers for normal sowing of kharif crops.
Note: Data shall be collected quarterly consisting of 1st Quarter – July to September, 2nd Quarter – October to December, 3rd Quarter – January to March and 4th Quarter – April to June.
Quarterly Report: April– June 2015
28
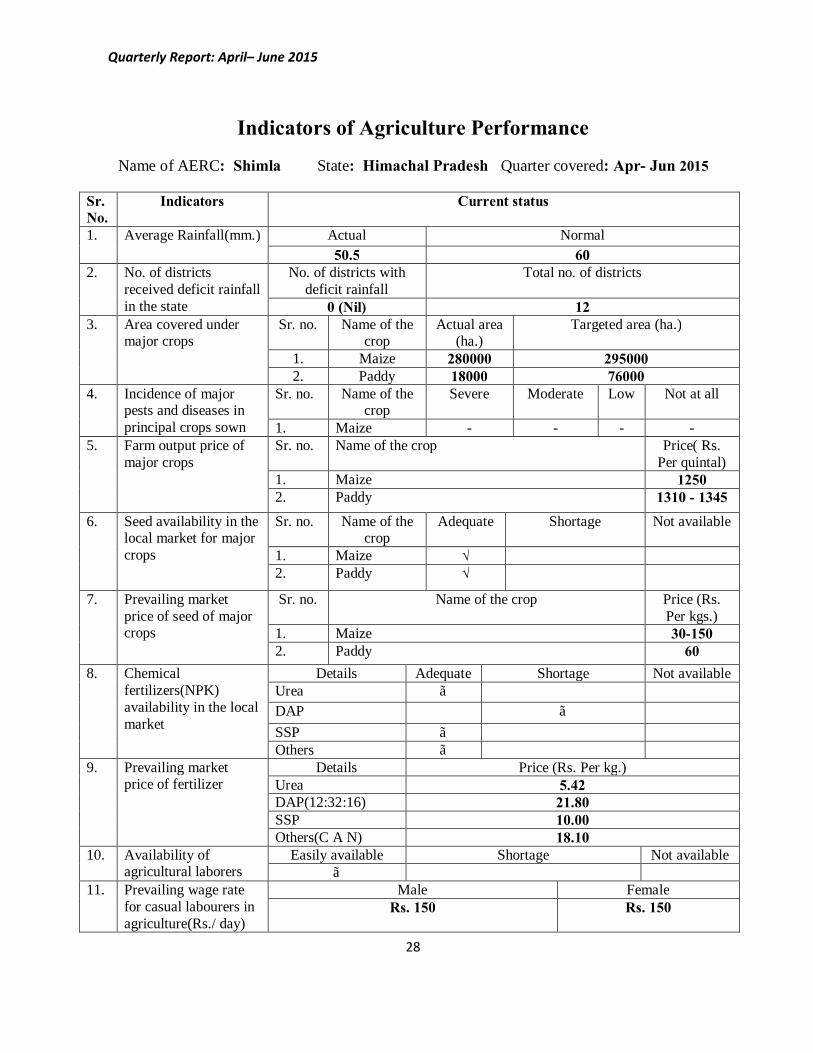
Indicators of Agriculture Performance
Name of AERC: Shimla State: Himachal Pradesh Quarter covered: Apr- Jun 2015
Sr. No.
Indicators Current status
1. Average Rainfall(mm.) Actual Normal 50.5 60
2. No. of districts received deficit rainfall in the state
No. of districts with deficit rainfall
Total no. of districts
0 (Nil) 12 3. Area covered under
major crops Sr. no. Name of the
crop Actual area
(ha.) Targeted area (ha.)
1. Maize 280000 295000 2. Paddy 18000 76000
4. Incidence of major pests and diseases in principal crops sown
Sr. no. Name of the crop
Severe Moderate Low Not at all
1. Maize - - - - 5.
Farm output price of major crops
Sr. no. Name of the crop Price( Rs. Per quintal)
1. Maize 1250 2. Paddy 1310 - 1345
6. Seed availability in the local market for major crops
Sr. no. Name of the crop
Adequate Shortage Not available
1. Maize √ 2. Paddy √
7. Prevailing market price of seed of major crops
Sr. no. Name of the crop Price (Rs. Per kgs.)
1. Maize 30-150 2. Paddy 60
8. Chemical fertilizers(NPK) availability in the local market
Details Adequate Shortage Not available Urea √ DAP √ SSP √ Others √
9. Prevailing market price of fertilizer
Details Price (Rs. Per kg.) Urea 5.42 DAP(12:32:16) 21.80 SSP 10.00 Others(C A N) 18.10
10. Availability of agricultural laborers
Easily available Shortage Not available √
11. Prevailing wage rate for casual labourers in agriculture(Rs./ day)
Male Female Rs. 150 Rs. 150
Quarterly Report: April– June 2015
29
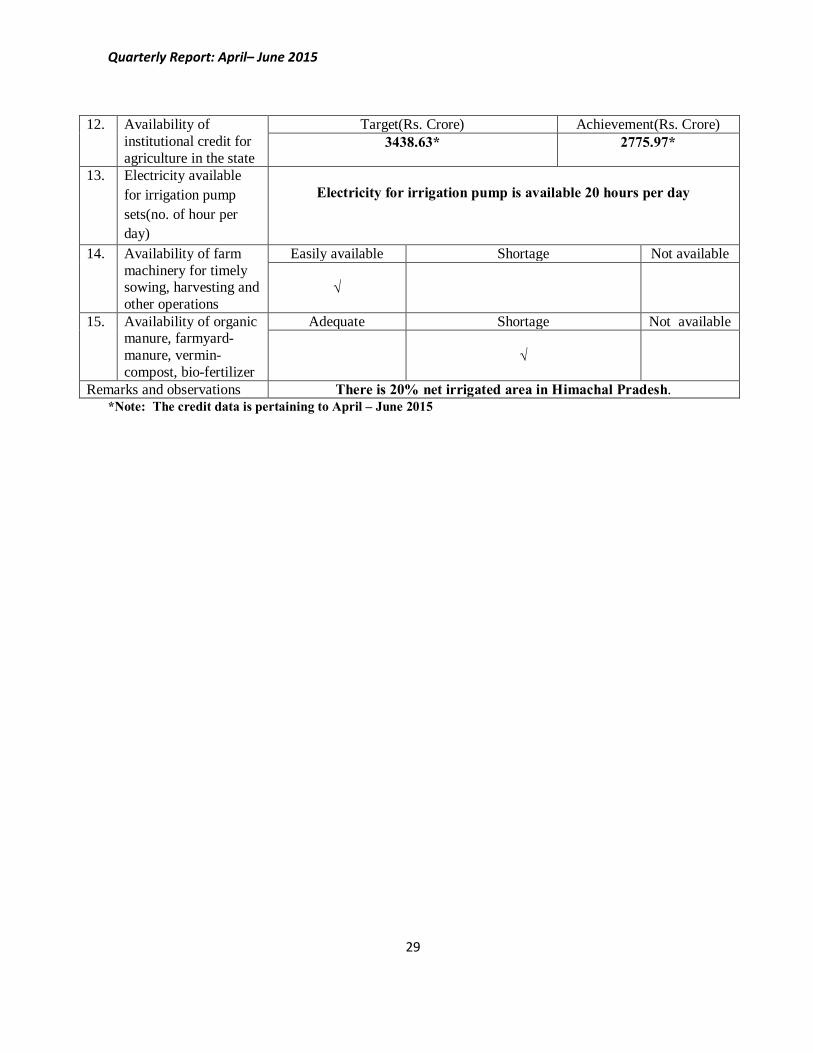
12. Availability of institutional credit for agriculture in the state
Target(Rs. Crore) Achievement(Rs. Crore) 3438.63* 2775.97*
13. Electricity available for irrigation pump sets(no. of hour per day)
Electricity for irrigation pump is available 20 hours per day
14. Availability of farm machinery for timely sowing, harvesting and other operations
Easily available Shortage Not available
√
15. Availability of organic manure, farmyard- manure, vermin-compost, bio-fertilizer
Adequate Shortage Not available
√
Remarks and observations There is 20% net irrigated area in Himachal Pradesh. *Note: The credit data is pertaining to April – June 2015
Quarterly Report: April– June 2015
30
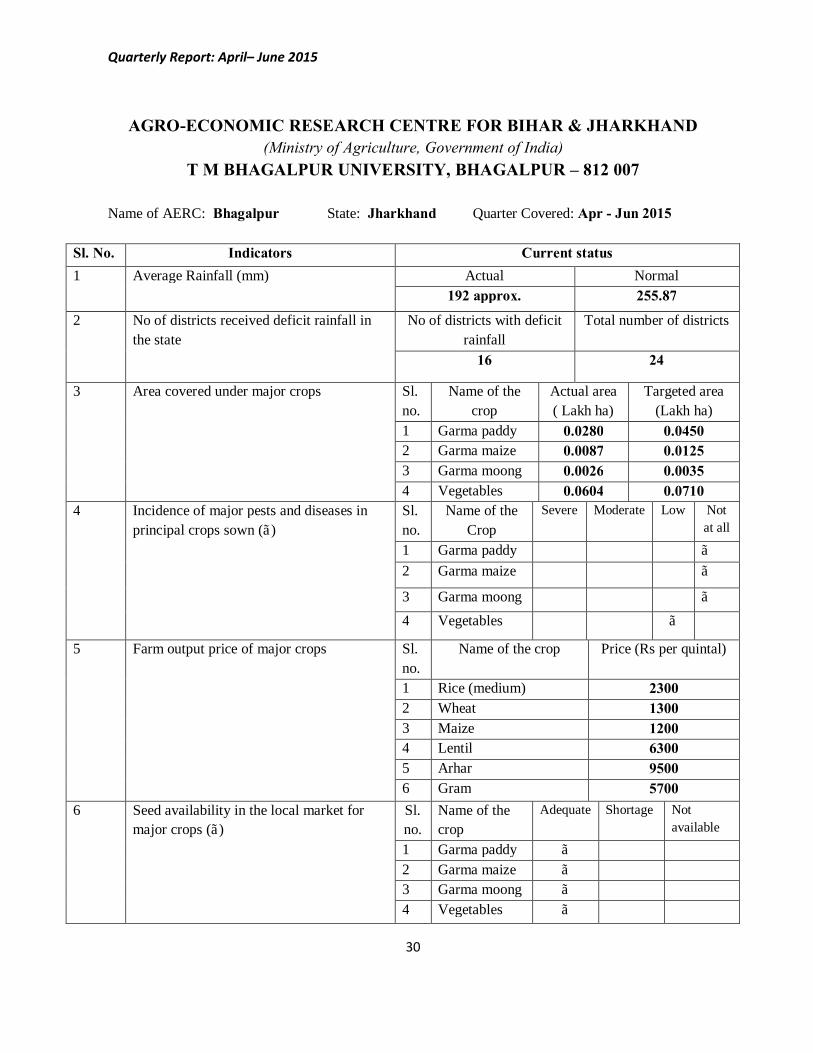
AGRO-ECONOMIC RESEARCH CENTRE FOR BIHAR & JHARKHAND (Ministry of Agriculture, Government of India)
T M BHAGALPUR UNIVERSITY, BHAGALPUR – 812 007
Name of AERC: Bhagalpur State: Jharkhand Quarter Covered: Apr - Jun 2015
Sl. No. Indicators Current status 1 Average Rainfall (mm) Actual Normal
192 approx. 255.87
2 No of districts received deficit rainfall in the state
No of districts with deficit rainfall
Total number of districts
16 24
3 Area covered under major crops Sl. no.
Name of the crop
Actual area ( Lakh ha)
Targeted area (Lakh ha)
1 Garma paddy 0.0280 0.0450 2 Garma maize 0.0087 0.0125 3 Garma moong 0.0026 0.0035 4 Vegetables 0.0604 0.0710
4 Incidence of major pests and diseases in principal crops sown (√)
Sl. no.
Name of the Crop
Severe Moderate Low Not at all
1 Garma paddy √ 2 Garma maize √
3 Garma moong √ 4 Vegetables √
5 Farm output price of major crops Sl. no.
Name of the crop Price (Rs per quintal)
1 Rice (medium) 2300 2 Wheat 1300 3 Maize 1200 4 Lentil 6300 5 Arhar 9500 6 Gram 5700
6 Seed availability in the local market for major crops (√)
Sl. no.
Name of the crop
Adequate Shortage Not available
1 Garma paddy √ 2 Garma maize √ 3 Garma moong √ 4 Vegetables √
Quarterly Report: April– June 2015
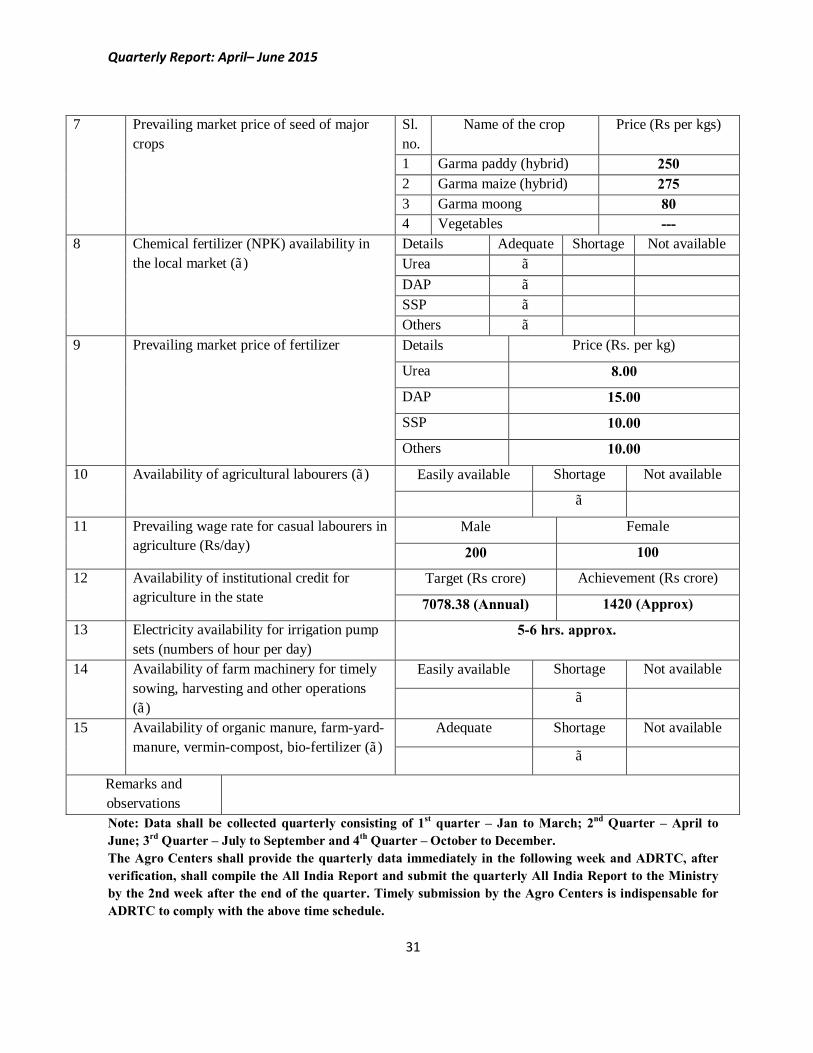
31
7 Prevailing market price of seed of major crops
Sl. no.
Name of the crop Price (Rs per kgs)
1 Garma paddy (hybrid) 250 2 Garma maize (hybrid) 275 3 Garma moong 80 4 Vegetables ---
8 Chemical fertilizer (NPK) availability in the local market (√)
Details Adequate Shortage Not available Urea √ DAP √ SSP √ Others √
9 Prevailing market price of fertilizer Details Price (Rs. per kg)
Urea 8.00
DAP 15.00
SSP 10.00
Others 10.00
10 Availability of agricultural labourers (√) Easily available Shortage Not available
√
11 Prevailing wage rate for casual labourers in agriculture (Rs/day)
Male Female
200 100
12 Availability of institutional credit for agriculture in the state
Target (Rs crore) Achievement (Rs crore)
7078.38 (Annual) 1420 (Approx)
13 Electricity availability for irrigation pump sets (numbers of hour per day)
5-6 hrs. approx.
14 Availability of farm machinery for timely sowing, harvesting and other operations (√)
Easily available Shortage Not available
√
15 Availability of organic manure, farm-yard-manure, vermin-compost, bio-fertilizer (√)
Adequate Shortage Not available
√
Remarks and observations
Note: Data shall be collected quarterly consisting of 1st quarter – Jan to March; 2nd Quarter – April to June; 3rd Quarter – July to September and 4th Quarter – October to December. The Agro Centers shall provide the quarterly data immediately in the following week and ADRTC, after verification, shall compile the All India Report and submit the quarterly All India Report to the Ministry by the 2nd week after the end of the quarter. Timely submission by the Agro Centers is indispensable for ADRTC to comply with the above time schedule.
Quarterly Report: April– June 2015
32
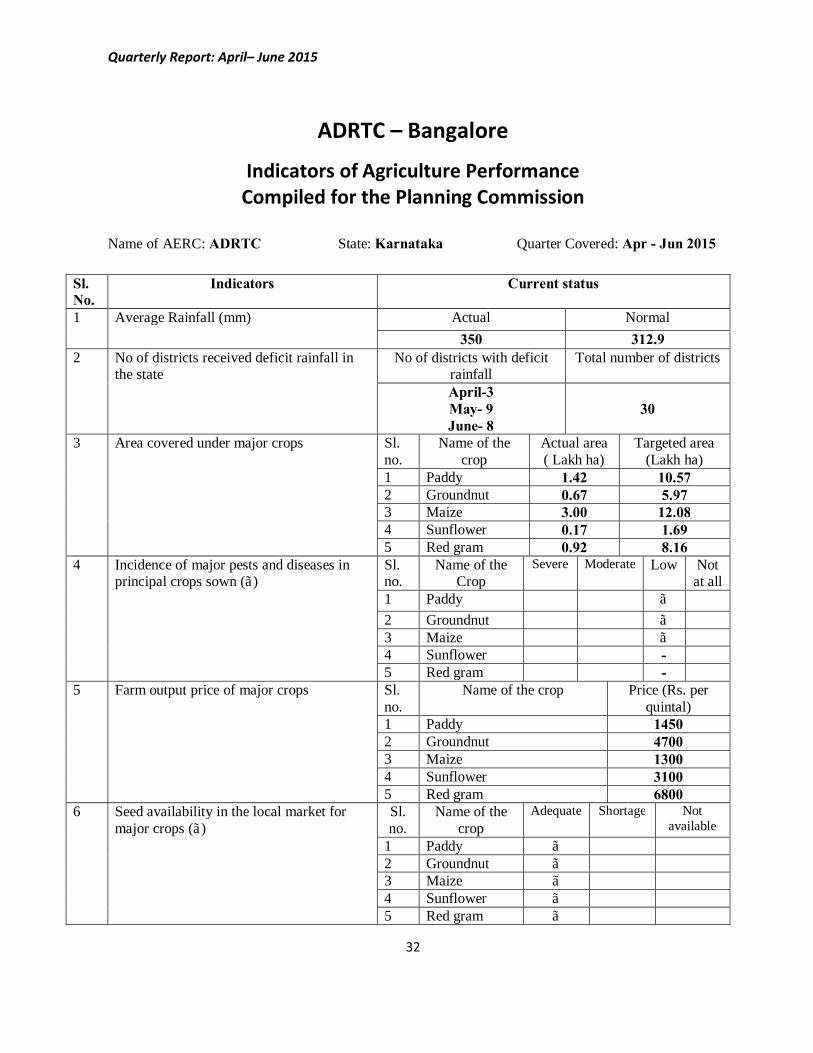
ADRTC – Bangalore
Indicators of Agriculture Performance Compiled for the Planning Commission
Name of AERC: ADRTC State: Karnataka Quarter Covered: Apr - Jun 2015
Sl. No.
Indicators Current status
1 Average Rainfall (mm) Actual Normal 350 312.9
2 No of districts received deficit rainfall in the state
No of districts with deficit rainfall
Total number of districts
April-3 May- 9 June- 8
30
3 Area covered under major crops Sl. no.
Name of the crop
Actual area ( Lakh ha)
Targeted area (Lakh ha)
1 Paddy 1.42 10.57 2 Groundnut 0.67 5.97 3 Maize 3.00 12.08 4 Sunflower 0.17 1.69 5 Red gram 0.92 8.16
4 Incidence of major pests and diseases in principal crops sown (√)
Sl. no.
Name of the Crop
Severe Moderate Low Not at all
1 Paddy √ 2 Groundnut √ 3 Maize √ 4 Sunflower - 5 Red gram -
5 Farm output price of major crops Sl. no.
Name of the crop Price (Rs. per quintal)
1 Paddy 1450 2 Groundnut 4700 3 Maize 1300 4 Sunflower 3100 5 Red gram 6800
6 Seed availability in the local market for major crops (√)
Sl. no.
Name of the crop
Adequate Shortage Not available
1 Paddy √ 2 Groundnut √ 3 Maize √ 4 Sunflower √ 5 Red gram √
Quarterly Report: April– June 2015
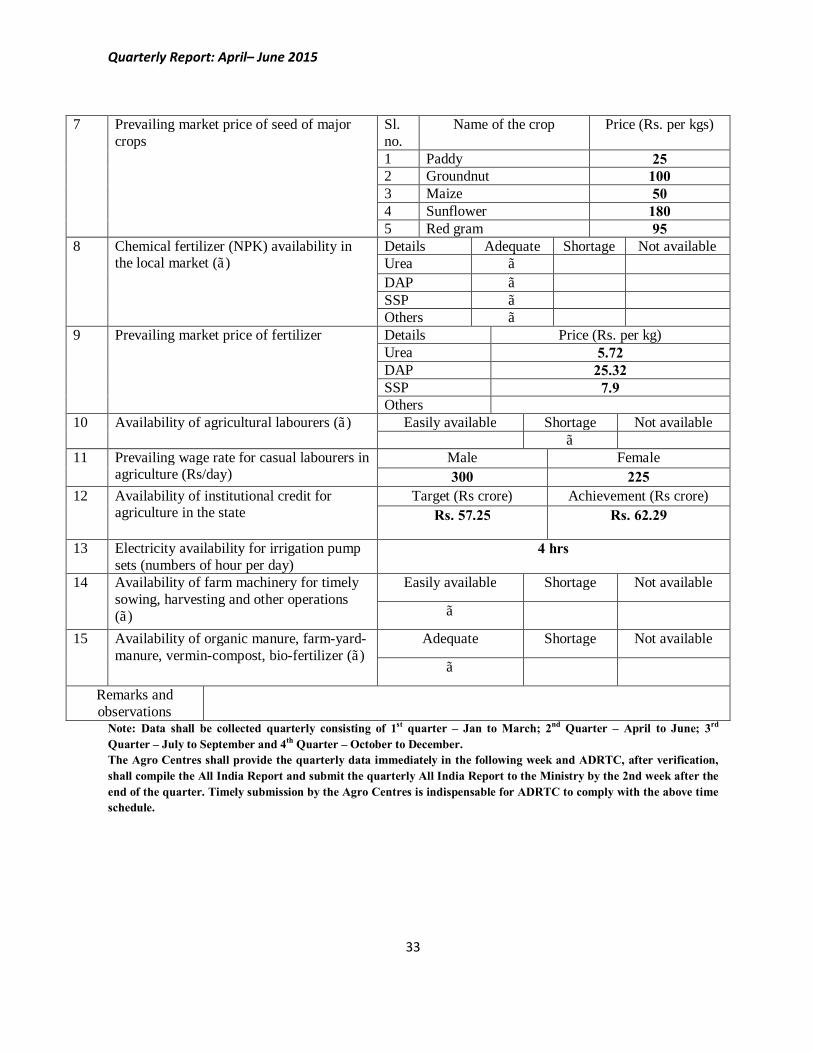
33
7 Prevailing market price of seed of major crops
Sl. no.
Name of the crop Price (Rs. per kgs)
1 Paddy 25 2 Groundnut 100 3 Maize 50 4 Sunflower 180 5 Red gram 95
8 Chemical fertilizer (NPK) availability in the local market (√)
Details Adequate Shortage Not available Urea √ DAP √ SSP √ Others √
9 Prevailing market price of fertilizer Details Price (Rs. per kg) Urea 5.72 DAP 25.32 SSP 7.9 Others
10 Availability of agricultural labourers (√) Easily available Shortage Not available √
11 Prevailing wage rate for casual labourers in agriculture (Rs/day)
Male Female 300 225
12 Availability of institutional credit for agriculture in the state
Target (Rs crore) Achievement (Rs crore) Rs. 57.25 Rs. 62.29
13 Electricity availability for irrigation pump sets (numbers of hour per day)
4 hrs
14 Availability of farm machinery for timely sowing, harvesting and other operations (√)
Easily available Shortage Not available
√
15 Availability of organic manure, farm-yard-manure, vermin-compost, bio-fertilizer (√)
Adequate Shortage Not available
√
Remarks and observations
Note: Data shall be collected quarterly consisting of 1st quarter – Jan to March; 2nd Quarter – April to June; 3rd Quarter – July to September and 4th Quarter – October to December. The Agro Centres shall provide the quarterly data immediately in the following week and ADRTC, after verification, shall compile the All India Report and submit the quarterly All India Report to the Ministry by the 2nd week after the end of the quarter. Timely submission by the Agro Centres is indispensable for ADRTC to comply with the above time schedule.
Quarterly Report: April– June 2015
34
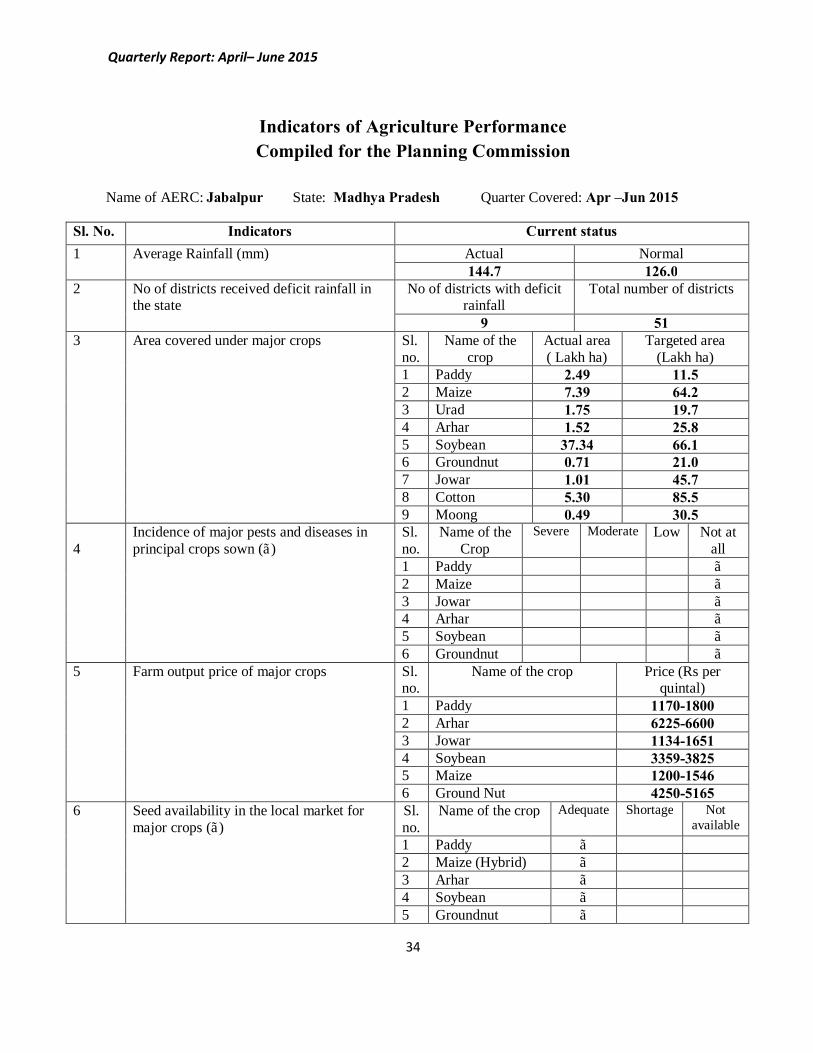
Indicators of Agriculture Performance Compiled for the Planning Commission
Name of AERC: Jabalpur State: Madhya Pradesh Quarter Covered: Apr –Jun 2015
Sl. No. Indicators Current status 1 Average Rainfall (mm) Actual Normal
144.7 126.0 2 No of districts received deficit rainfall in
the state No of districts with deficit
rainfall Total number of districts
9 51 3 Area covered under major crops
Sl. no.
Name of the crop
Actual area ( Lakh ha)
Targeted area (Lakh ha)
1 Paddy 2.49 11.5 2 Maize 7.39 64.2 3 Urad 1.75 19.7 4 Arhar 1.52 25.8 5 Soybean 37.34 66.1 6 Groundnut 0.71 21.0 7 Jowar 1.01 45.7 8 Cotton 5.30 85.5 9 Moong 0.49 30.5
4
Incidence of major pests and diseases in principal crops sown (√)
Sl. no.
Name of the Crop
Severe Moderate Low Not at all
1 Paddy √ 2 Maize √ 3 Jowar √ 4 Arhar √ 5 Soybean √ 6 Groundnut √
5 Farm output price of major crops Sl. no.
Name of the crop Price (Rs per quintal)
1 Paddy 1170-1800 2 Arhar 6225-6600 3 Jowar 1134-1651 4 Soybean 3359-3825 5 Maize 1200-1546 6 Ground Nut 4250-5165
6 Seed availability in the local market for major crops (√)
Sl. no.
Name of the crop Adequate Shortage Not available
1 Paddy √ 2 Maize (Hybrid) √ 3 Arhar √ 4 Soybean √ 5 Groundnut √
Quarterly Report: April– June 2015
35
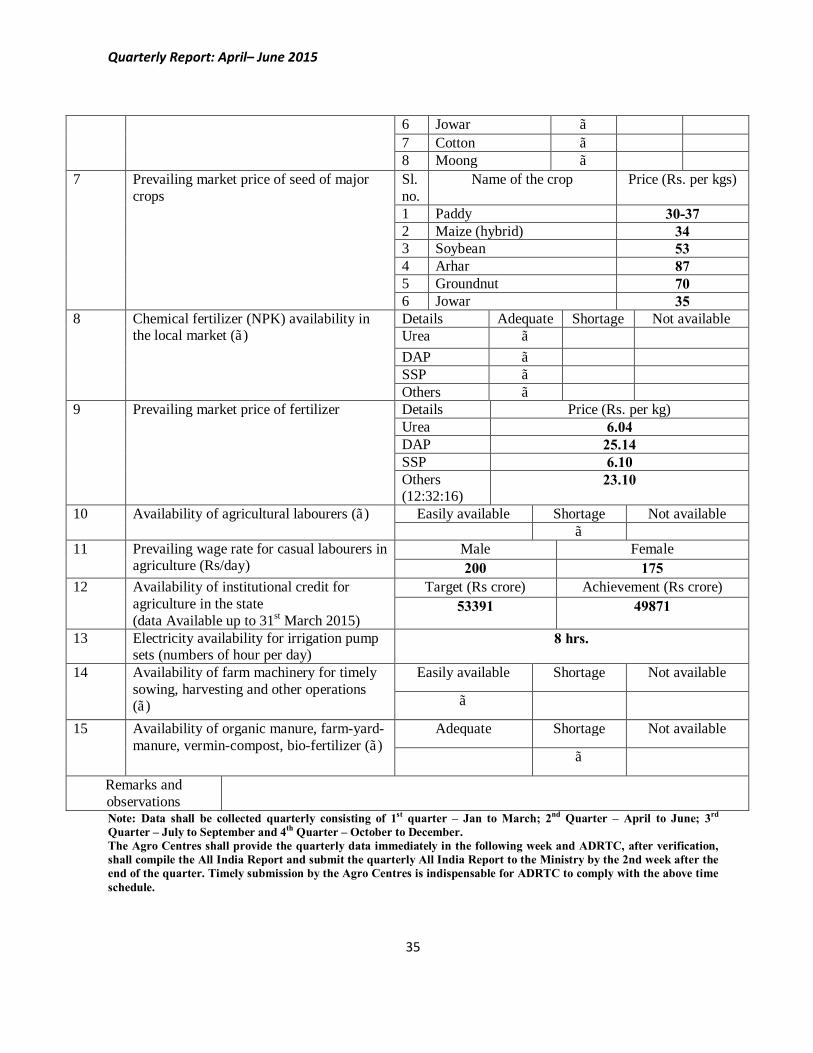
6 Jowar √ 7 Cotton √ 8 Moong √
7 Prevailing market price of seed of major crops
Sl. no.
Name of the crop Price (Rs. per kgs)
1 Paddy 30-37 2 Maize (hybrid) 34 3 Soybean 53 4 Arhar 87 5 Groundnut 70 6 Jowar 35
8 Chemical fertilizer (NPK) availability in the local market (√)
Details Adequate Shortage Not available Urea √ DAP √ SSP √ Others √
9 Prevailing market price of fertilizer Details Price (Rs. per kg) Urea 6.04 DAP 25.14 SSP 6.10 Others (12:32:16)
23.10
10 Availability of agricultural labourers (√) Easily available Shortage Not available √
11 Prevailing wage rate for casual labourers in agriculture (Rs/day)
Male Female 200 175
12 Availability of institutional credit for agriculture in the state (data Available up to 31st March 2015)
Target (Rs crore) Achievement (Rs crore) 53391 49871
13 Electricity availability for irrigation pump sets (numbers of hour per day)
8 hrs.
14 Availability of farm machinery for timely sowing, harvesting and other operations (√)
Easily available Shortage Not available
√
15 Availability of organic manure, farm-yard-manure, vermin-compost, bio-fertilizer (√)
Adequate Shortage Not available
√
Remarks and observations
Note: Data shall be collected quarterly consisting of 1st quarter – Jan to March; 2nd Quarter – April to June; 3rd Quarter – July to September and 4th Quarter – October to December. The Agro Centres shall provide the quarterly data immediately in the following week and ADRTC, after verification, shall compile the All India Report and submit the quarterly All India Report to the Ministry by the 2nd week after the end of the quarter. Timely submission by the Agro Centres is indispensable for ADRTC to comply with the above time schedule.
Quarterly Report: April– June 2015
36
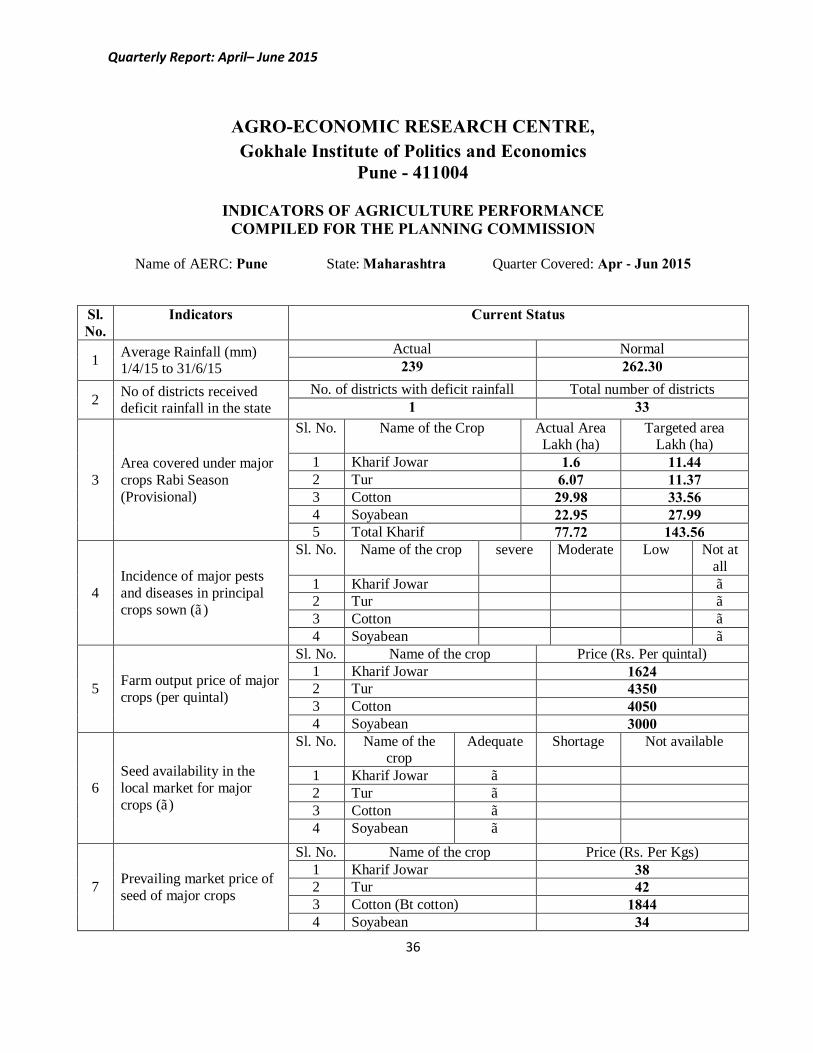
AGRO-ECONOMIC RESEARCH CENTRE, Gokhale Institute of Politics and Economics
Pune - 411004
INDICATORS OF AGRICULTURE PERFORMANCE COMPILED FOR THE PLANNING COMMISSION
Name of AERC: Pune State: Maharashtra Quarter Covered: Apr - Jun 2015
Sl. No.
Indicators Current Status
1 Average Rainfall (mm) 1/4/15 to 31/6/15
Actual Normal 239 262.30
2 No of districts received deficit rainfall in the state
No. of districts with deficit rainfall Total number of districts 1 33
3 Area covered under major crops Rabi Season (Provisional)
Sl. No. Name of the Crop Actual Area Lakh (ha)
Targeted area Lakh (ha)
1 Kharif Jowar 1.6 11.44 2 Tur 6.07 11.37 3 Cotton 29.98 33.56 4 Soyabean 22.95 27.99 5 Total Kharif 77.72 143.56
4 Incidence of major pests and diseases in principal crops sown (√)
Sl. No. Name of the crop severe Moderate Low Not at all
1 Kharif Jowar √ 2 Tur √ 3 Cotton √ 4 Soyabean √
5 Farm output price of major crops (per quintal)
Sl. No. Name of the crop Price (Rs. Per quintal) 1 Kharif Jowar 1624 2 Tur 4350 3 Cotton 4050 4 Soyabean 3000
6 Seed availability in the local market for major crops (√)
Sl. No. Name of the crop
Adequate Shortage Not available
1 Kharif Jowar √ 2 Tur √ 3 Cotton √ 4 Soyabean √
7 Prevailing market price of seed of major crops
Sl. No. Name of the crop Price (Rs. Per Kgs) 1 Kharif Jowar 38 2 Tur 42 3 Cotton (Bt cotton) 1844 4 Soyabean 34
Quarterly Report: April– June 2015
37
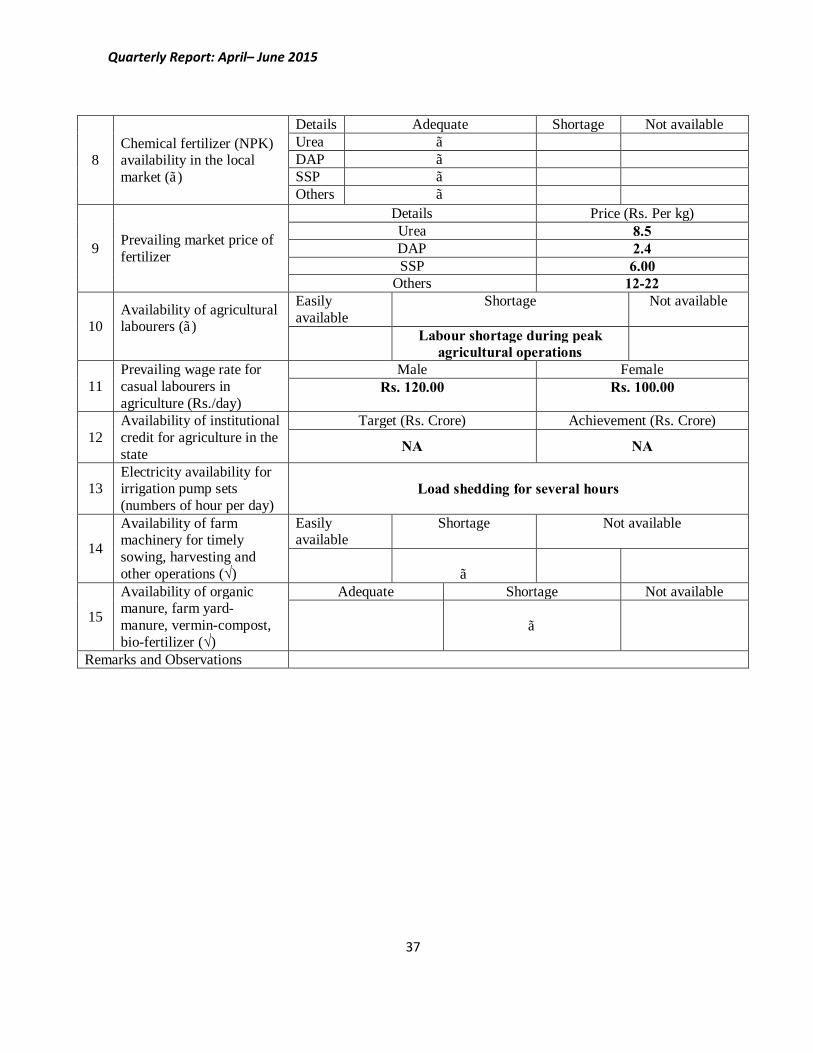
8 Chemical fertilizer (NPK) availability in the local market (√)
Details Adequate Shortage Not available Urea √ DAP √ SSP √ Others √
9 Prevailing market price of fertilizer
Details Price (Rs. Per kg) Urea 8.5 DAP 2.4 SSP 6.00
Others 12-22
10 Availability of agricultural labourers (√)
Easily available
Shortage Not available
Labour shortage during peak agricultural operations
11 Prevailing wage rate for casual labourers in agriculture (Rs./day)
Male Female Rs. 120.00 Rs. 100.00
12 Availability of institutional credit for agriculture in the state
Target (Rs. Crore) Achievement (Rs. Crore)
NA NA
13 Electricity availability for irrigation pump sets (numbers of hour per day)
Load shedding for several hours
14
Availability of farm machinery for timely sowing, harvesting and other operations (√)
Easily available
Shortage Not available
√
15
Availability of organic manure, farm yard-manure, vermin-compost, bio-fertilizer (√)
Adequate Shortage Not available
√
Remarks and Observations
Quarterly Report: April– June 2015
38
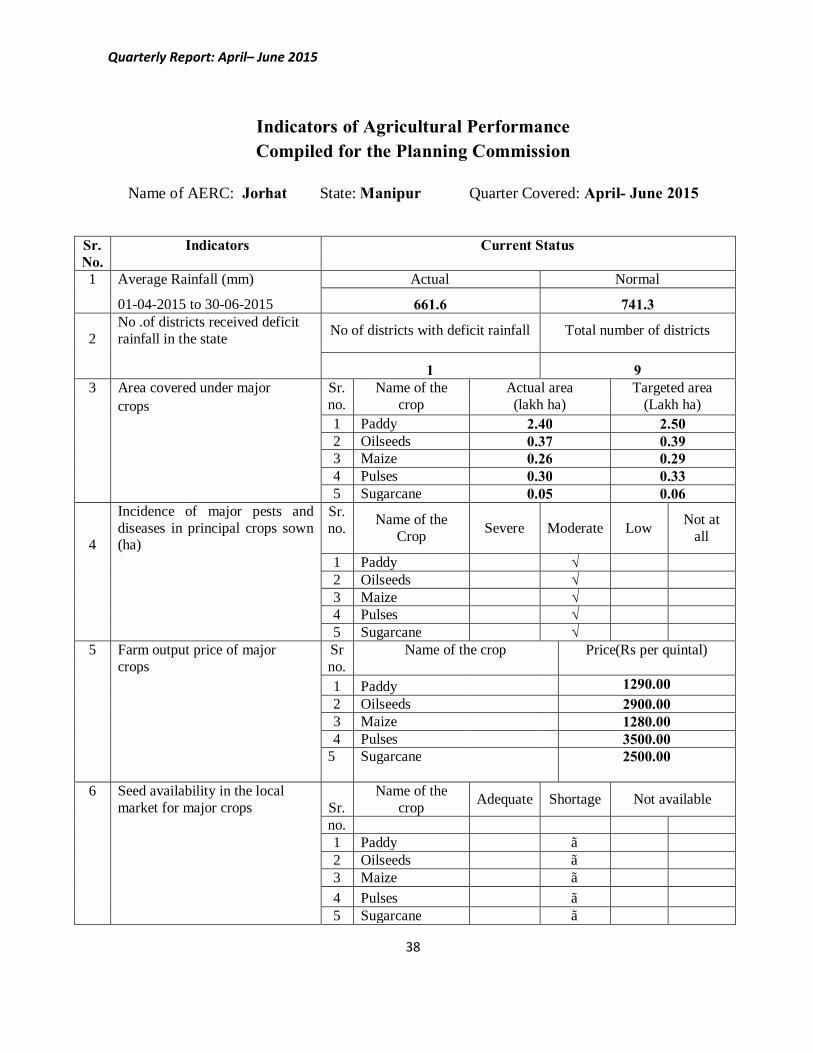
Indicators of Agricultural Performance Compiled for the Planning Commission
Name of AERC: Jorhat State: Manipur Quarter Covered: April- June 2015
Sr. Indicators
Current Status No. 1 Average Rainfall (mm) Actual Normal
01-04-2015 to 30-06-2015 661.6 741.3
2 No .of districts received deficit rainfall in the state No of districts with deficit rainfall Total number of districts
1 9
3 Area covered under major Sr. no.
Name of the crop
Actual area (lakh ha)
Targeted area (Lakh ha)
crops
1 Paddy 2.40 2.50
2 Oilseeds 0.37 0.39
3 Maize 0.26 0.29
4 Pulses 0.30 0.33
5 Sugarcane 0.05 0.06
4
Incidence of major pests and diseases in principal crops sown (ha)
Sr. no. Name of the
Crop Severe Moderate Low Not at all
1 Paddy √
2 Oilseeds
√
3 Maize
√
4 Pulses
√
5 Sugarcane √
5 Farm output price of major Sr Name of the crop Price(Rs per quintal)
crops no.
1 Paddy 1290.00
2 Oilseeds 2900.00
3 Maize
1280.00
4 Pulses
3500.00
5 Sugarcane 2500.00
6
Seed availability in the local market for major crops
Sr. Name of the
crop Adequate Shortage Not available no. 1 Paddy √
2 Oilseeds √
3 Maize
√
4 Pulses
√
5 Sugarcane √
Quarterly Report: April– June 2015
39
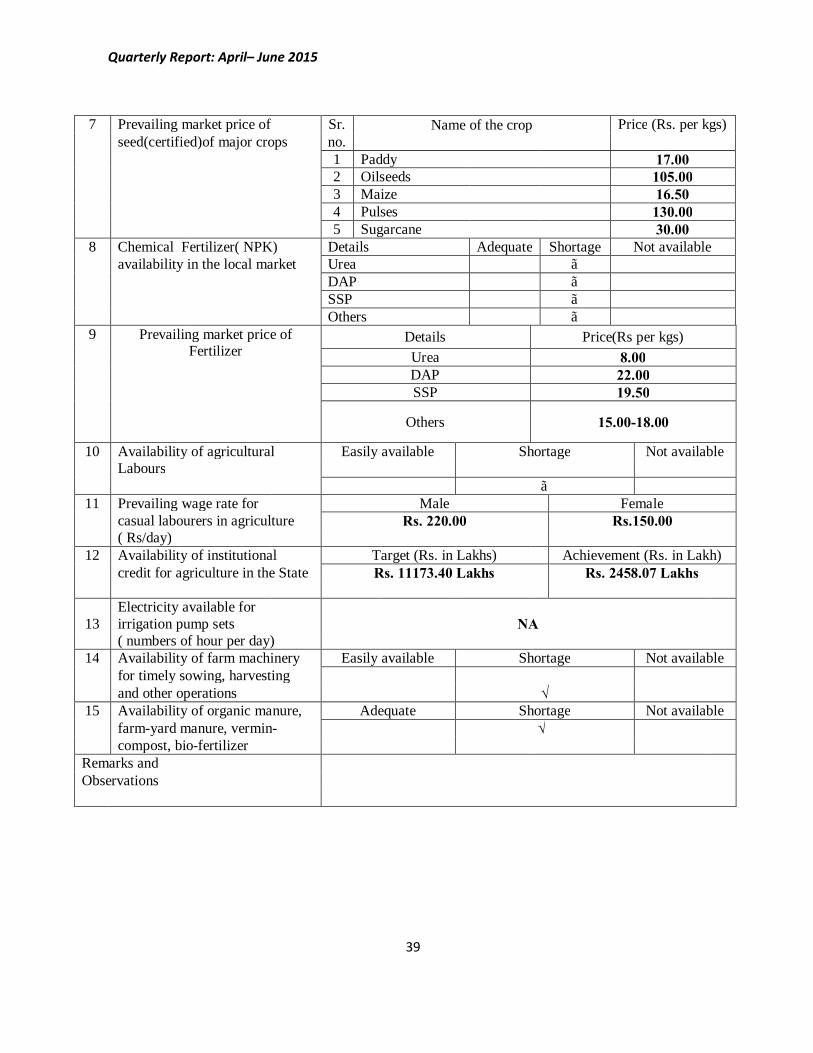
7 Prevailing market price of Sr. Name of the crop
Price (Rs. per kgs)
seed(certified)of major crops no.
1 Paddy 17.00
2 Oilseeds
105.00
3 Maize
16.50
4 Pulses
130.00
5 Sugarcane
30.00 8 Chemical Fertilizer( NPK) Details Adequate Shortage Not available
availability in the local market Urea √
DAP √
SSP √ Others √ 9
Prevailing market price of Fertilizer
Details Price(Rs per kgs) Urea 8.00 DAP 22.00 SSP 19.50
Others 15.00-18.00
10 Availability of agricultural Easily available Shortage Not available Labours
√ 11 Prevailing wage rate for Male Female casual labourers in agriculture Rs. 220.00 Rs.150.00 ( Rs/day)
12 Availability of institutional Target (Rs. in Lakhs) Achievement (Rs. in Lakh) credit for agriculture in the State Rs. 11173.40 Lakhs Rs. 2458.07 Lakhs
13 Electricity available for irrigation pump sets NA
( numbers of hour per day)
14 Availability of farm machinery Easily available Shortage Not available for timely sowing, harvesting
√ and other operations 15 Availability of organic manure, Adequate Shortage Not available farm-yard manure, vermin-
√
compost, bio-fertilizer Remarks and
Observations
Quarterly Report: April– June 2015
40
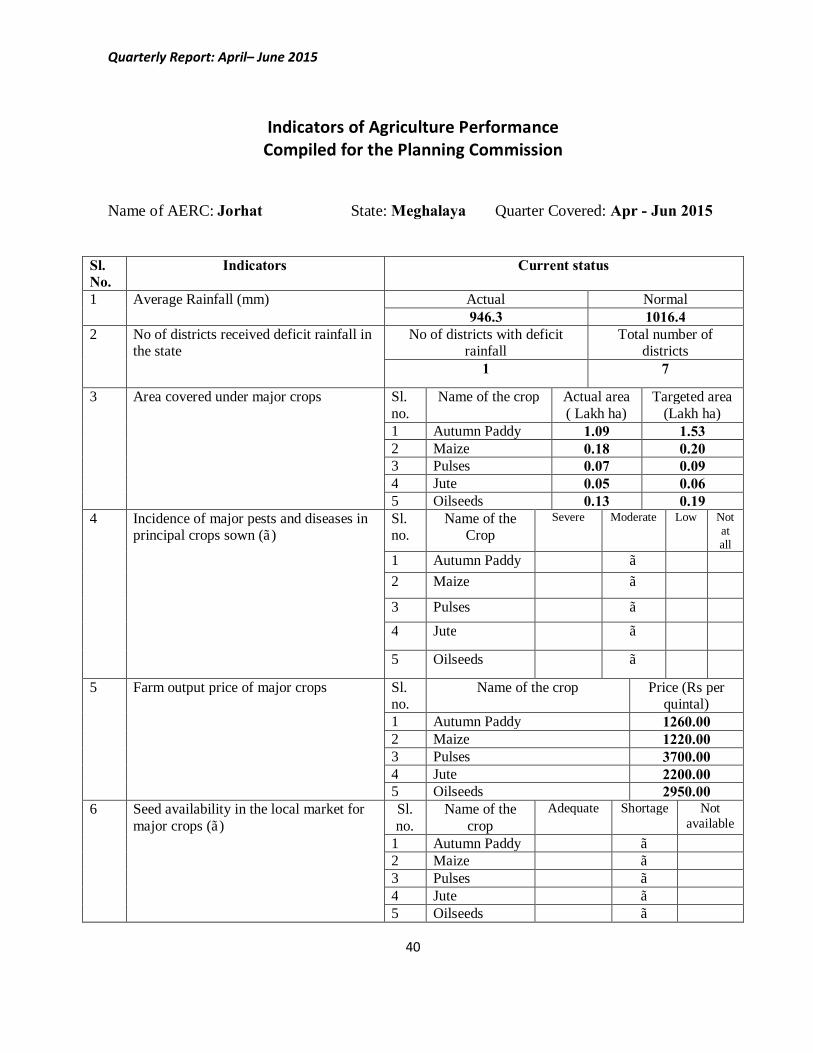
Indicators of Agriculture Performance Compiled for the Planning Commission
Name of AERC: Jorhat State: Meghalaya Quarter Covered: Apr - Jun 2015
Sl. No.
Indicators Current status
1 Average Rainfall (mm)
Actual Normal 946.3 1016.4
2 No of districts received deficit rainfall in the state
No of districts with deficit rainfall
Total number of districts
1 7
3 Area covered under major crops Sl. no.
Name of the crop Actual area ( Lakh ha)
Targeted area (Lakh ha)
1 Autumn Paddy 1.09 1.53 2 Maize 0.18 0.20 3 Pulses 0.07 0.09 4 Jute 0.05 0.06 5 Oilseeds 0.13 0.19
4 Incidence of major pests and diseases in principal crops sown (√)
Sl. no.
Name of the Crop
Severe Moderate Low Not at all
1 Autumn Paddy √ 2 Maize √
3 Pulses √ 4 Jute √
5 Oilseeds √
5 Farm output price of major crops Sl. no.
Name of the crop Price (Rs per quintal)
1 Autumn Paddy 1260.00 2 Maize 1220.00 3 Pulses 3700.00 4 Jute 2200.00 5 Oilseeds 2950.00
6 Seed availability in the local market for major crops (√)
Sl. no.
Name of the crop
Adequate Shortage Not available
1 Autumn Paddy √ 2 Maize √ 3 Pulses √ 4 Jute √ 5 Oilseeds √
Quarterly Report: April– June 2015
41
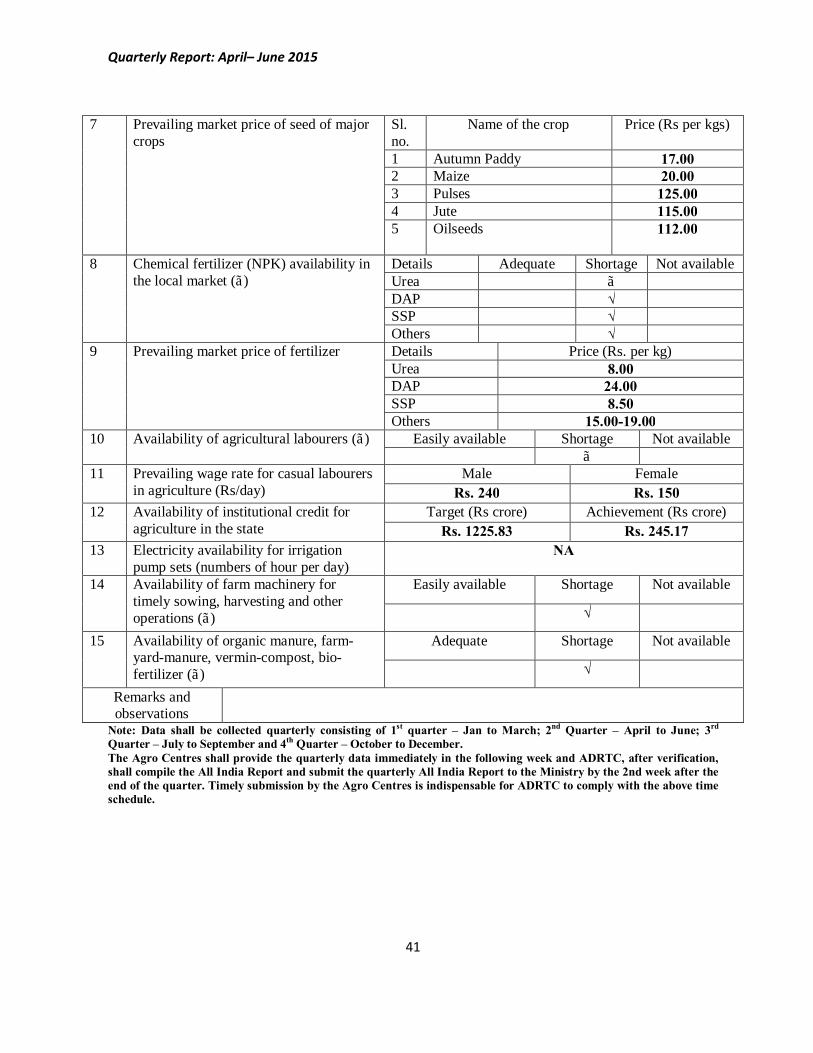
7 Prevailing market price of seed of major crops
Sl. no.
Name of the crop Price (Rs per kgs)
1 Autumn Paddy 17.00 2 Maize 20.00 3 Pulses 125.00 4 Jute 115.00 5 Oilseeds 112.00
8 Chemical fertilizer (NPK) availability in the local market (√)
Details Adequate Shortage Not available Urea √ DAP √ SSP √ Others √
9 Prevailing market price of fertilizer Details Price (Rs. per kg) Urea 8.00 DAP 24.00 SSP 8.50 Others 15.00-19.00
10 Availability of agricultural labourers (√) Easily available Shortage Not available √
11 Prevailing wage rate for casual labourers in agriculture (Rs/day)
Male Female Rs. 240 Rs. 150
12 Availability of institutional credit for agriculture in the state
Target (Rs crore) Achievement (Rs crore) Rs. 1225.83 Rs. 245.17
13 Electricity availability for irrigation pump sets (numbers of hour per day)
NA
14 Availability of farm machinery for timely sowing, harvesting and other operations (√)
Easily available Shortage Not available
√
15 Availability of organic manure, farm-yard-manure, vermin-compost, bio-fertilizer (√)
Adequate Shortage Not available
√
Remarks and observations
Note: Data shall be collected quarterly consisting of 1st quarter – Jan to March; 2nd Quarter – April to June; 3rd Quarter – July to September and 4th Quarter – October to December. The Agro Centres shall provide the quarterly data immediately in the following week and ADRTC, after verification, shall compile the All India Report and submit the quarterly All India Report to the Ministry by the 2nd week after the end of the quarter. Timely submission by the Agro Centres is indispensable for ADRTC to comply with the above time schedule.
Quarterly Report: April– June 2015
42
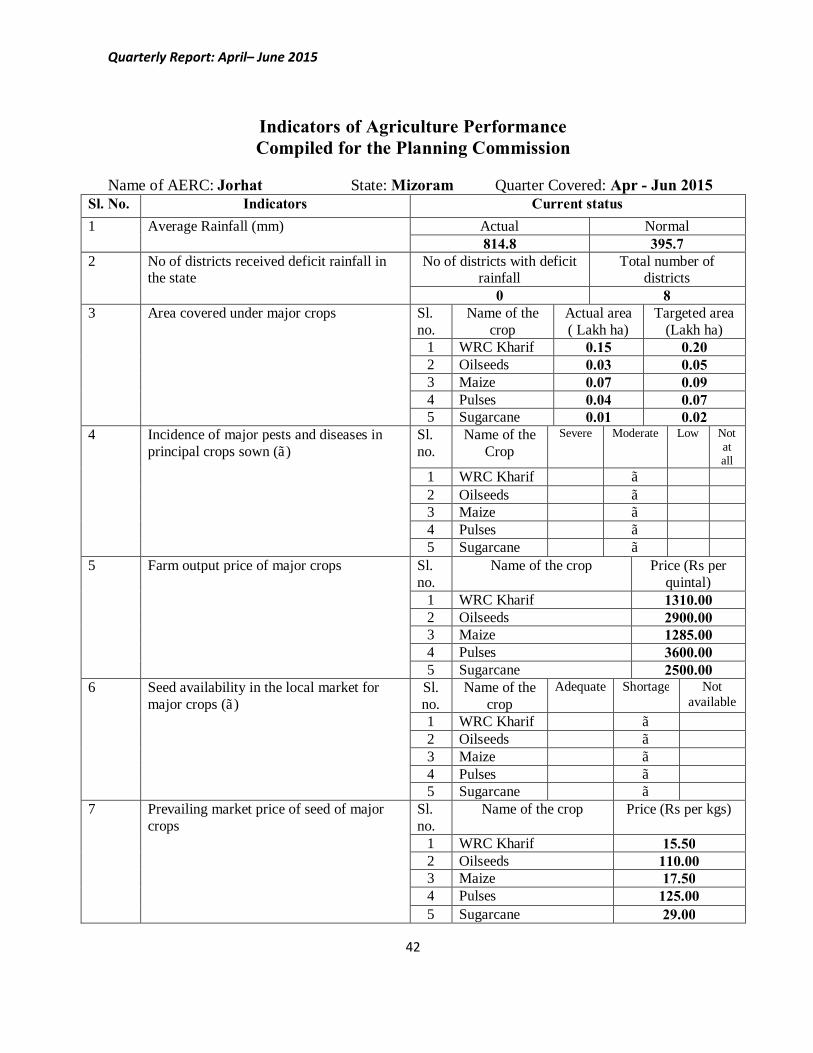
Indicators of Agriculture Performance Compiled for the Planning Commission
Name of AERC: Jorhat State: Mizoram Quarter Covered: Apr - Jun 2015
Sl. No. Indicators Current status 1 Average Rainfall (mm)
Actual Normal 814.8 395.7
2 No of districts received deficit rainfall in the state
No of districts with deficit rainfall
Total number of districts
0 8 3 Area covered under major crops Sl.
no. Name of the
crop Actual area ( Lakh ha)
Targeted area (Lakh ha)
1 WRC Kharif 0.15 0.20 2 Oilseeds 0.03 0.05 3 Maize 0.07 0.09 4 Pulses 0.04 0.07 5 Sugarcane 0.01 0.02
4 Incidence of major pests and diseases in principal crops sown (√)
Sl. no.
Name of the Crop
Severe Moderate Low Not at all
1 WRC Kharif √ 2 Oilseeds √ 3 Maize √ 4 Pulses √ 5 Sugarcane √
5 Farm output price of major crops Sl. no.
Name of the crop Price (Rs per quintal)
1 WRC Kharif 1310.00 2 Oilseeds 2900.00 3 Maize 1285.00 4 Pulses 3600.00 5 Sugarcane 2500.00
6 Seed availability in the local market for major crops (√)
Sl. no.
Name of the crop
Adequate Shortage Not available
1 WRC Kharif √ 2 Oilseeds √ 3 Maize √ 4 Pulses √ 5 Sugarcane √
7 Prevailing market price of seed of major crops
Sl. no.
Name of the crop Price (Rs per kgs)
1 WRC Kharif 15.50 2 Oilseeds 110.00 3 Maize 17.50 4 Pulses 125.00 5 Sugarcane 29.00
Quarterly Report: April– June 2015
43
8 Chemical fertilizer (NPK) availability in the local market (√)
Details Adequate Shortage Not available Urea √ DAP √ SSP √ Others √
9 Prevailing market price of fertilizer Details Price (Rs. per kg) Urea 8.00 DAP 22.00 SSP 7.50 Others 15.00-19.50
10 Availability of agricultural labourers (√) Easily available Shortage Not available √
11 Prevailing wage rate for casual labourers in agriculture (Rs/day)
Male Female Rs. 250 Rs. 200
12 Availability of institutional credit for agriculture in the state
Target (Rs. crore) Achievement (Rs. crore) Rs. 310.14 Rs. 155.07
13 Electricity availability for irrigation pump sets (numbers of hour per day)
NA
14 Availability of farm machinery for timely sowing, harvesting and other operations (√)
Easily available Shortage Not available
√
15 Availability of organic manure, farm-yard-manure, vermin-compost, bio-fertilizer (√)
Adequate Shortage Not available
√
Remarks and observations
Note: Data shall be collected quarterly consisting of 1st quarter – Jan to March; 2nd Quarter – April to June; 3rd Quarter – July to September and 4th Quarter – October to December. The Agro Centres shall provide the quarterly data immediately in the following week and ADRTC, after verification, shall compile the All India Report and submit the quarterly All India Report to the Ministry by the 2nd week after the end of the quarter. Timely submission by the Agro Centres is indispensable for ADRTC to comply with the above time schedule.
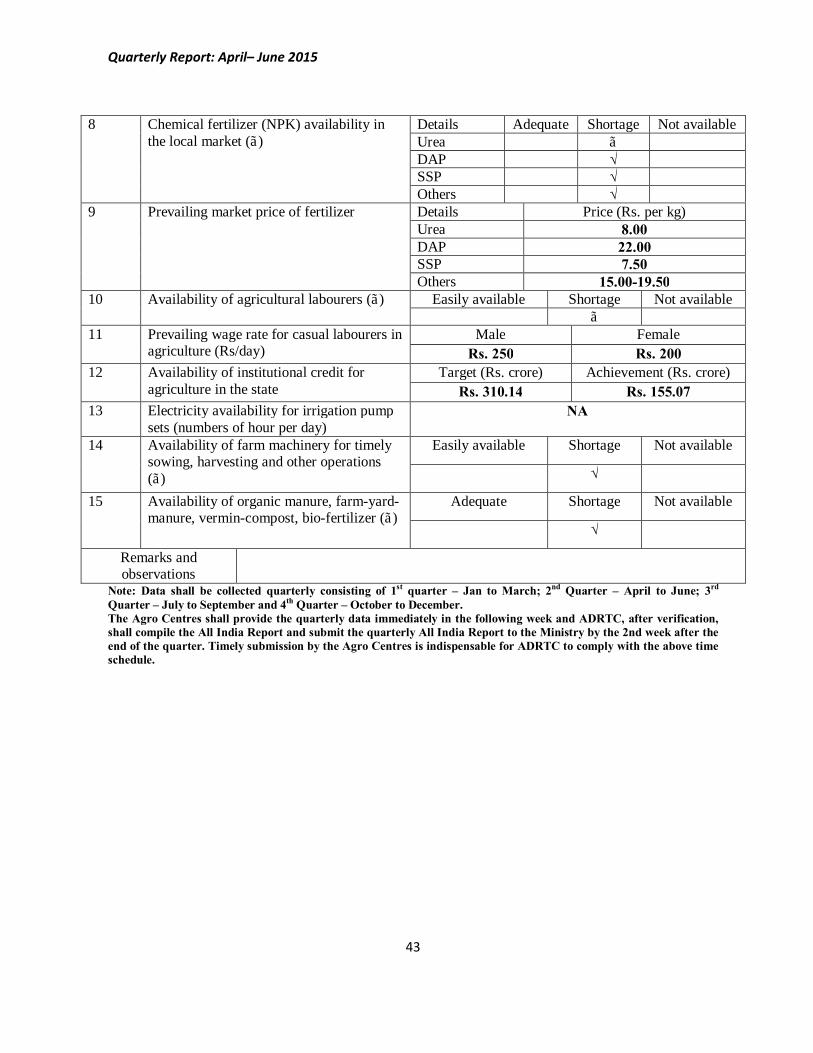
Quarterly Report: April– June 2015
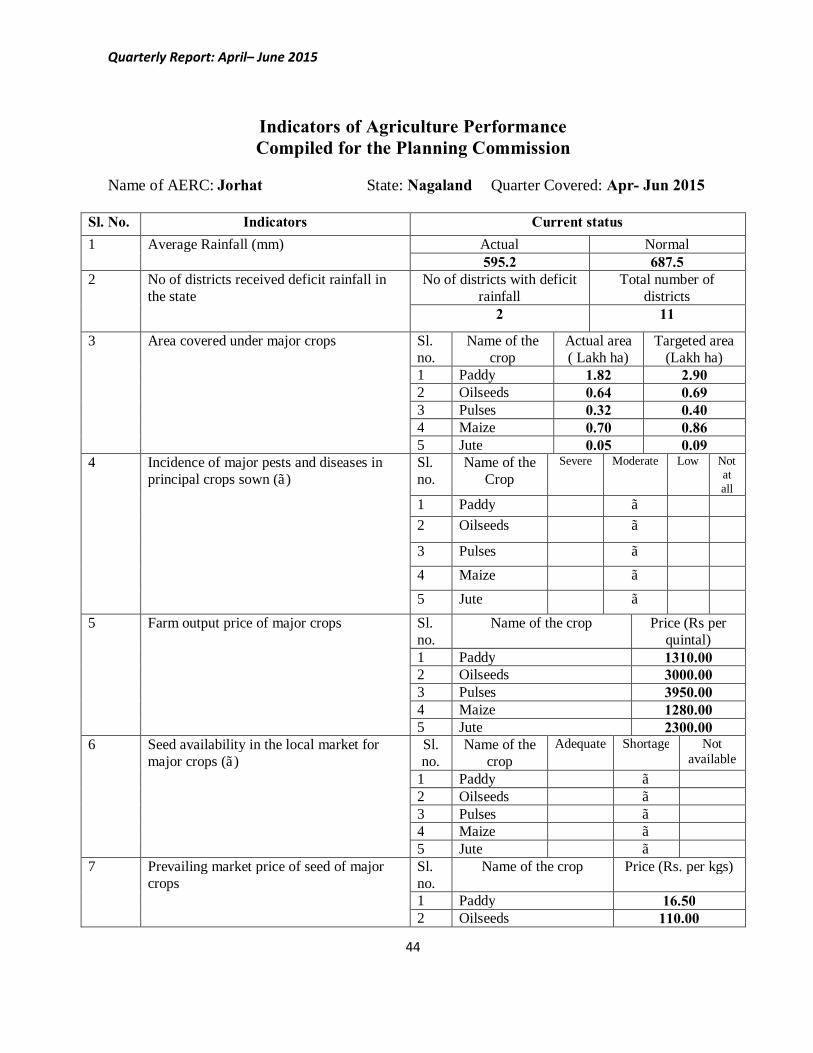
44
Indicators of Agriculture Performance Compiled for the Planning Commission
Name of AERC: Jorhat State: Nagaland Quarter Covered: Apr- Jun 2015
Sl. No. Indicators Current status 1 Average Rainfall (mm)
Actual Normal 595.2 687.5
2 No of districts received deficit rainfall in the state
No of districts with deficit rainfall
Total number of districts
2 11
3 Area covered under major crops Sl. no.
Name of the crop
Actual area ( Lakh ha)
Targeted area (Lakh ha)
1 Paddy 1.82 2.90 2 Oilseeds 0.64 0.69 3 Pulses 0.32 0.40 4 Maize 0.70 0.86 5 Jute 0.05 0.09
4 Incidence of major pests and diseases in principal crops sown (√)
Sl. no.
Name of the Crop
Severe Moderate Low Not at all
1 Paddy √ 2 Oilseeds √
3 Pulses √ 4 Maize √ 5 Jute √
5 Farm output price of major crops Sl. no.
Name of the crop Price (Rs per quintal)
1 Paddy 1310.00 2 Oilseeds 3000.00 3 Pulses 3950.00 4 Maize 1280.00 5 Jute 2300.00
6 Seed availability in the local market for major crops (√)
Sl. no.
Name of the crop
Adequate Shortage Not available
1 Paddy √ 2 Oilseeds √ 3 Pulses √ 4 Maize √ 5 Jute √
7 Prevailing market price of seed of major crops
Sl. no.
Name of the crop Price (Rs. per kgs)
1 Paddy 16.50 2 Oilseeds 110.00
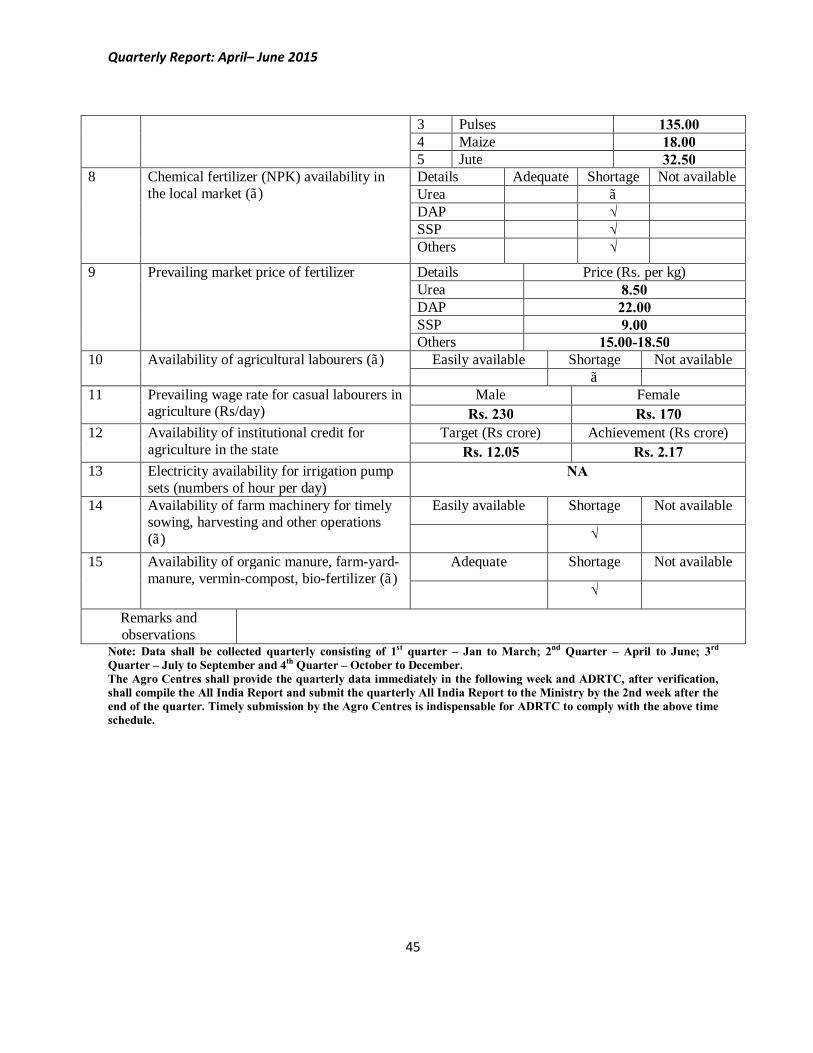
Quarterly Report: April– June 2015
45
3 Pulses 135.00 4 Maize 18.00 5 Jute 32.50
8 Chemical fertilizer (NPK) availability in the local market (√)
Details Adequate Shortage Not available Urea √ DAP √ SSP √ Others √
9 Prevailing market price of fertilizer Details Price (Rs. per kg) Urea 8.50 DAP 22.00 SSP 9.00 Others 15.00-18.50
10 Availability of agricultural labourers (√) Easily available Shortage Not available √
11 Prevailing wage rate for casual labourers in agriculture (Rs/day)
Male Female Rs. 230 Rs. 170
12 Availability of institutional credit for agriculture in the state
Target (Rs crore) Achievement (Rs crore) Rs. 12.05 Rs. 2.17
13 Electricity availability for irrigation pump sets (numbers of hour per day)
NA
14 Availability of farm machinery for timely sowing, harvesting and other operations (√)
Easily available Shortage Not available
√
15 Availability of organic manure, farm-yard-manure, vermin-compost, bio-fertilizer (√)
Adequate Shortage Not available
√
Remarks and observations
Note: Data shall be collected quarterly consisting of 1st quarter – Jan to March; 2nd Quarter – April to June; 3rd Quarter – July to September and 4th Quarter – October to December. The Agro Centres shall provide the quarterly data immediately in the following week and ADRTC, after verification, shall compile the All India Report and submit the quarterly All India Report to the Ministry by the 2nd week after the end of the quarter. Timely submission by the Agro Centres is indispensable for ADRTC to comply with the above time schedule.
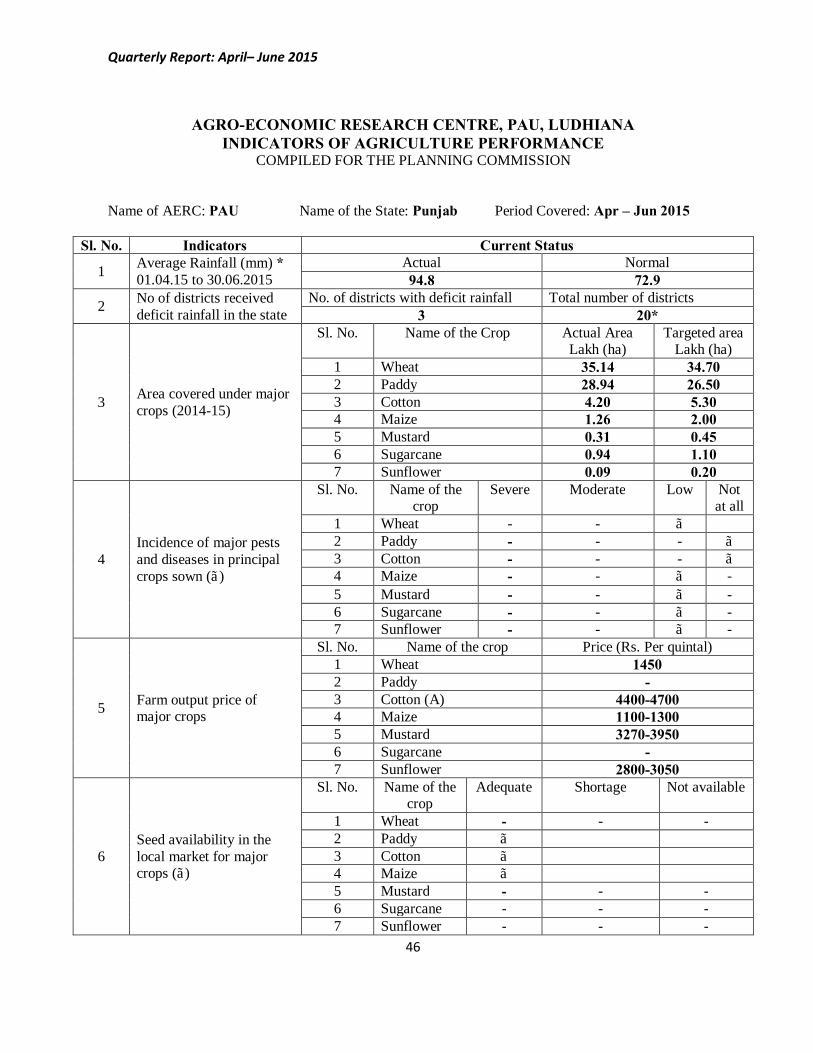
Quarterly Report: April– June 2015
46
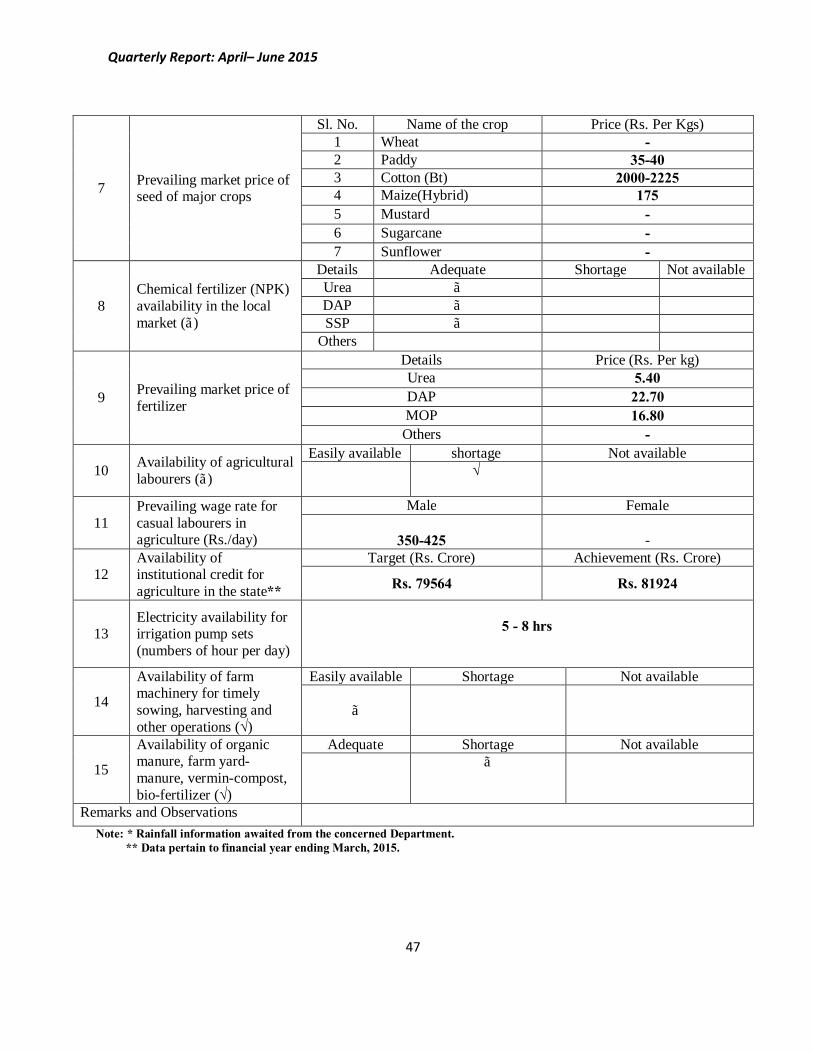
AGRO-ECONOMIC RESEARCH CENTRE, PAU, LUDHIANA INDICATORS OF AGRICULTURE PERFORMANCE
COMPILED FOR THE PLANNING COMMISSION Name of AERC: PAU Name of the State: Punjab Period Covered: Apr – Jun 2015
Sl. No. Indicators Current Status
1 Average Rainfall (mm) * 01.04.15 to 30.06.2015
Actual Normal 94.8 72.9
2 No of districts received deficit rainfall in the state
No. of districts with deficit rainfall Total number of districts 3 20*
3 Area covered under major crops (2014-15)
Sl. No. Name of the Crop Actual Area Lakh (ha)
Targeted area Lakh (ha)
1 Wheat 35.14 34.70 2 Paddy 28.94 26.50 3 Cotton 4.20 5.30 4 Maize 1.26 2.00 5 Mustard 0.31 0.45 6 Sugarcane 0.94 1.10 7 Sunflower 0.09 0.20
4 Incidence of major pests and diseases in principal crops sown (√)
Sl. No. Name of the crop
Severe Moderate Low Not at all
1 Wheat - - √ 2 Paddy - - - √ 3 Cotton - - - √ 4 Maize - - √ - 5 Mustard - - √ - 6 Sugarcane - - √ - 7 Sunflower - - √ -
5 Farm output price of major crops
Sl. No. Name of the crop Price (Rs. Per quintal) 1 Wheat 1450 2 Paddy - 3 Cotton (A) 4400-4700 4 Maize 1100-1300 5 Mustard 3270-3950 6 Sugarcane - 7 Sunflower 2800-3050
6 Seed availability in the local market for major crops (√)
Sl. No. Name of the crop
Adequate Shortage Not available
1 Wheat - - - 2 Paddy √ 3 Cotton √ 4 Maize √ 5 Mustard - - - 6 Sugarcane - - - 7 Sunflower - - -
Quarterly Report: April– June 2015
47
7 Prevailing market price of seed of major crops
Sl. No. Name of the crop Price (Rs. Per Kgs) 1 Wheat - 2 Paddy 35-40 3 Cotton (Bt) 2000-2225 4 Maize(Hybrid) 175 5 Mustard - 6 Sugarcane - 7 Sunflower -
8 Chemical fertilizer (NPK) availability in the local market (√)
Details Adequate Shortage Not available Urea √ DAP √ SSP √
Others
9 Prevailing market price of fertilizer
Details Price (Rs. Per kg) Urea 5.40 DAP 22.70 MOP 16.80 Others -
10 Availability of agricultural labourers (√)
Easily available shortage Not available √
11 Prevailing wage rate for casual labourers in agriculture (Rs./day)
Male Female
350-425 -
12 Availability of institutional credit for agriculture in the state**
Target (Rs. Crore) Achievement (Rs. Crore)
Rs. 79564 Rs. 81924
13 Electricity availability for irrigation pump sets (numbers of hour per day)
5 - 8 hrs
14
Availability of farm machinery for timely sowing, harvesting and other operations (√)
Easily available Shortage Not available
√
15
Availability of organic manure, farm yard-manure, vermin-compost, bio-fertilizer (√)
Adequate Shortage Not available
√
Remarks and Observations Note: * Rainfall information awaited from the concerned Department. ** Data pertain to financial year ending March, 2015.
Quarterly Report: April– June 2015
48
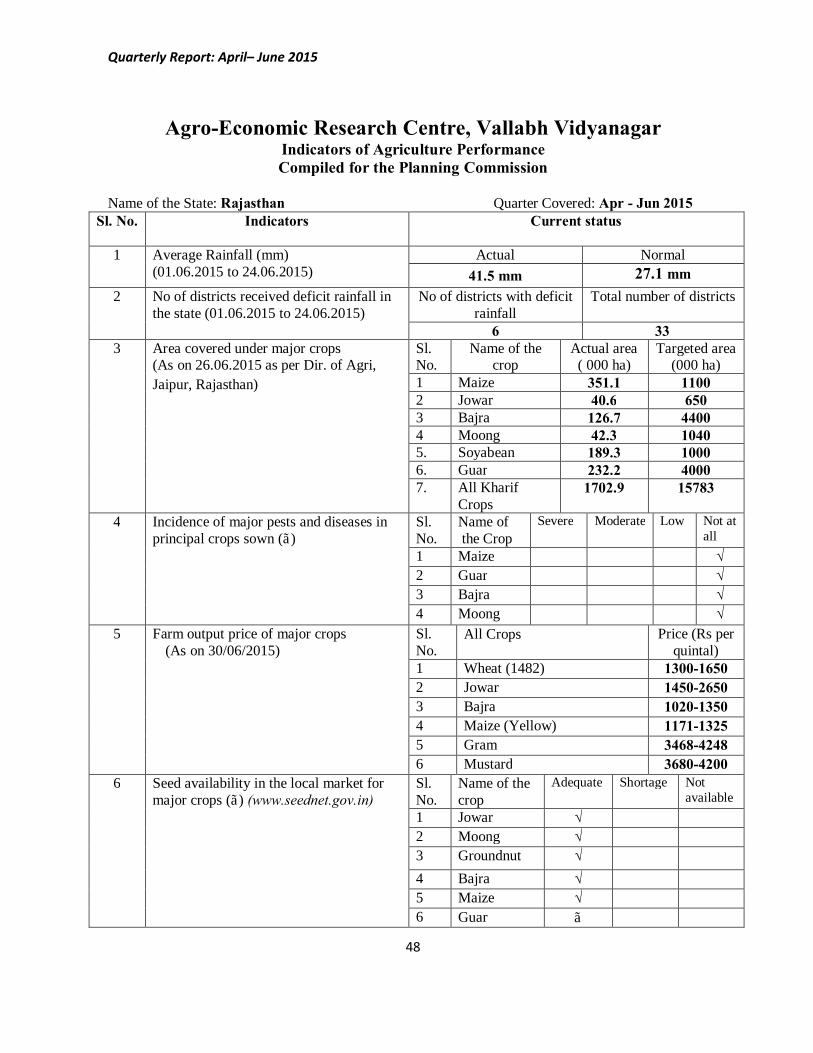
Agro-Economic Research Centre, Vallabh Vidyanagar Indicators of Agriculture Performance Compiled for the Planning Commission
Name of the State: Rajasthan Quarter Covered: Apr - Jun 2015
Sl. No. Indicators
Current status
1 Average Rainfall (mm) (01.06.2015 to 24.06.2015)
Actual Normal 41.5 mm 27.1 mm
2 No of districts received deficit rainfall in the state (01.06.2015 to 24.06.2015)
No of districts with deficit rainfall
Total number of districts
6 33 3 Area covered under major crops
(As on 26.06.2015 as per Dir. of Agri, Jaipur, Rajasthan)
Sl. No.
Name of the crop
Actual area ( 000 ha)
Targeted area (000 ha)
1 Maize 351.1 1100 2 Jowar 40.6 650 3 Bajra 126.7 4400 4 Moong 42.3 1040 5. Soyabean 189.3 1000 6. Guar 232.2 4000 7. All Kharif
Crops 1702.9 15783
4 Incidence of major pests and diseases in principal crops sown (√)
Sl. No.
Name of the Crop
Severe Moderate Low Not at all
1 Maize √ 2 Guar √ 3 Bajra √ 4 Moong √
5
Farm output price of major crops (As on 30/06/2015)
Sl. No.
All Crops Price (Rs per quintal)
1 Wheat (1482) 1300-1650 2 Jowar 1450-2650 3 Bajra 1020-1350 4 Maize (Yellow) 1171-1325 5 Gram 3468-4248 6 Mustard 3680-4200
6 Seed availability in the local market for major crops (√) (www.seednet.gov.in)
Sl. No.
Name of the crop
Adequate Shortage Not available
1 Jowar √ 2 Moong √ 3 Groundnut √ 4 Bajra √ 5 Maize √ 6 Guar √
Quarterly Report: April– June 2015
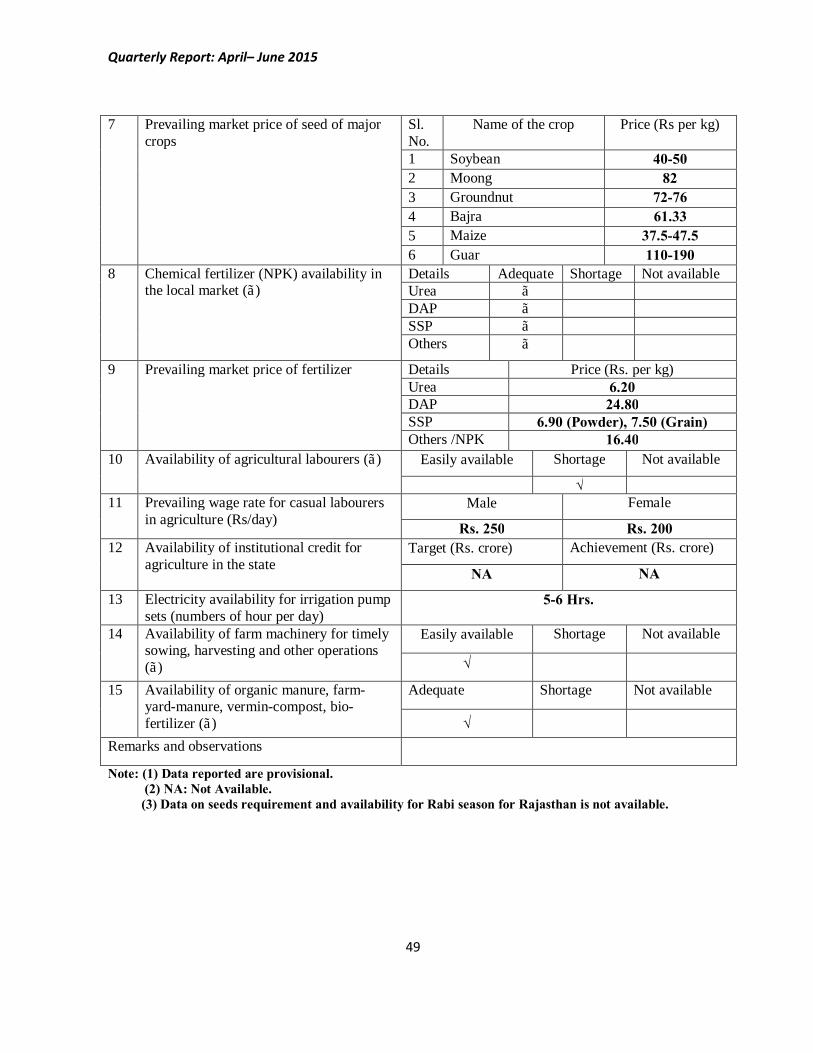
49
7 Prevailing market price of seed of major crops
Sl. No.
Name of the crop Price (Rs per kg)
1 Soybean 40-50 2 Moong 82 3 Groundnut 72-76 4 Bajra 61.33 5 Maize 37.5-47.5 6 Guar 110-190
8 Chemical fertilizer (NPK) availability in the local market (√)
Details Adequate Shortage Not available Urea √ DAP √ SSP √ Others √
9 Prevailing market price of fertilizer Details Price (Rs. per kg) Urea 6.20 DAP 24.80 SSP 6.90 (Powder), 7.50 (Grain) Others /NPK 16.40
10 Availability of agricultural labourers (√) Easily available Shortage Not available
√ 11 Prevailing wage rate for casual labourers
in agriculture (Rs/day) Male Female
Rs. 250 Rs. 200 12 Availability of institutional credit for
agriculture in the state Target (Rs. crore) Achievement (Rs. crore)
NA NA
13 Electricity availability for irrigation pump sets (numbers of hour per day)
5-6 Hrs.
14 Availability of farm machinery for timely sowing, harvesting and other operations (√)
Easily available Shortage Not available
√
15 Availability of organic manure, farm-yard-manure, vermin-compost, bio-fertilizer (√)
Adequate Shortage Not available
√
Remarks and observations
Note: (1) Data reported are provisional. (2) NA: Not Available. (3) Data on seeds requirement and availability for Rabi season for Rajasthan is not available.
Quarterly Report: April– June 2015
50
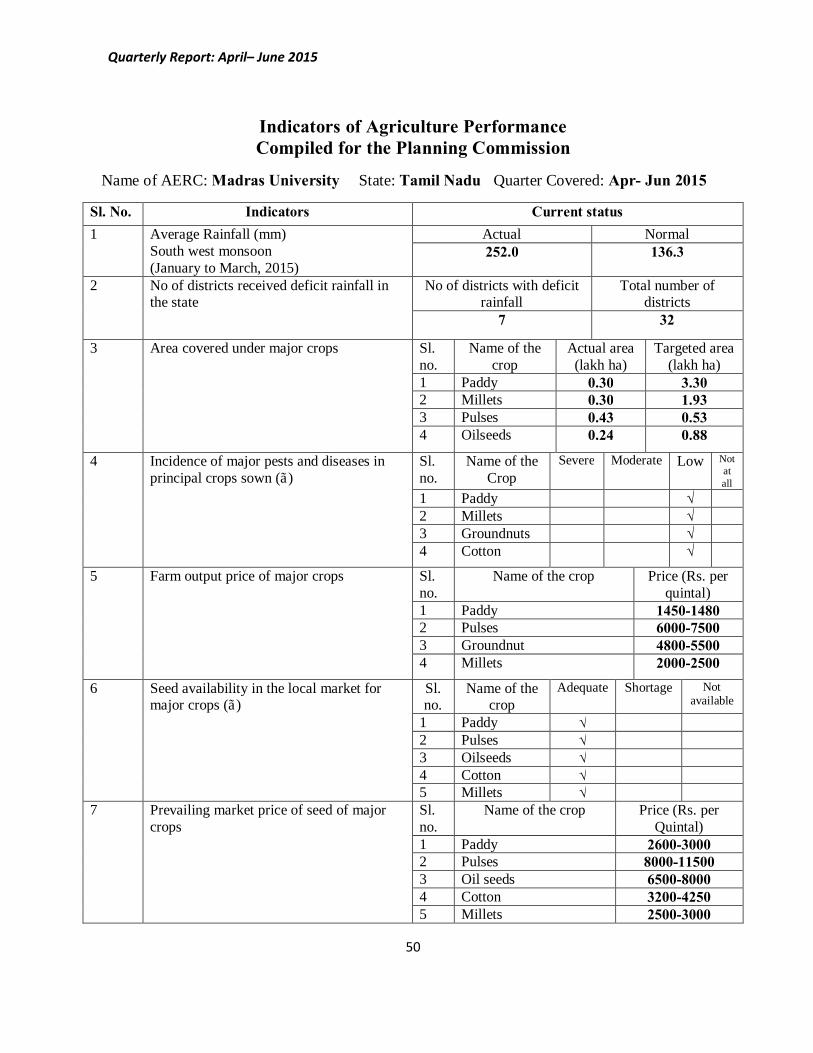
Indicators of Agriculture Performance Compiled for the Planning Commission
Name of AERC: Madras University State: Tamil Nadu Quarter Covered: Apr- Jun 2015
Sl. No. Indicators Current status 1 Average Rainfall (mm)
South west monsoon (January to March, 2015)
Actual Normal 252.0 136.3
2 No of districts received deficit rainfall in the state
No of districts with deficit rainfall
Total number of districts
7 32
3 Area covered under major crops Sl. no.
Name of the crop
Actual area (lakh ha)
Targeted area (lakh ha)
1 Paddy 0.30 3.30 2 Millets 0.30 1.93 3 Pulses 0.43 0.53 4 Oilseeds 0.24 0.88
4 Incidence of major pests and diseases in principal crops sown (√)
Sl. no.
Name of the Crop
Severe Moderate Low Not at all
1 Paddy √ 2 Millets √ 3 Groundnuts √ 4 Cotton √
5 Farm output price of major crops Sl. no.
Name of the crop Price (Rs. per quintal)
1 Paddy 1450-1480 2 Pulses 6000-7500 3 Groundnut 4800-5500 4 Millets 2000-2500
6 Seed availability in the local market for major crops (√)
Sl. no.
Name of the crop
Adequate Shortage Not available
1 Paddy √ 2 Pulses √ 3 Oilseeds √ 4 Cotton √ 5 Millets √
7 Prevailing market price of seed of major crops
Sl. no.
Name of the crop Price (Rs. per Quintal)
1 Paddy 2600-3000 2 Pulses 8000-11500 3 Oil seeds 6500-8000 4 Cotton 3200-4250 5 Millets 2500-3000
Quarterly Report: April– June 2015
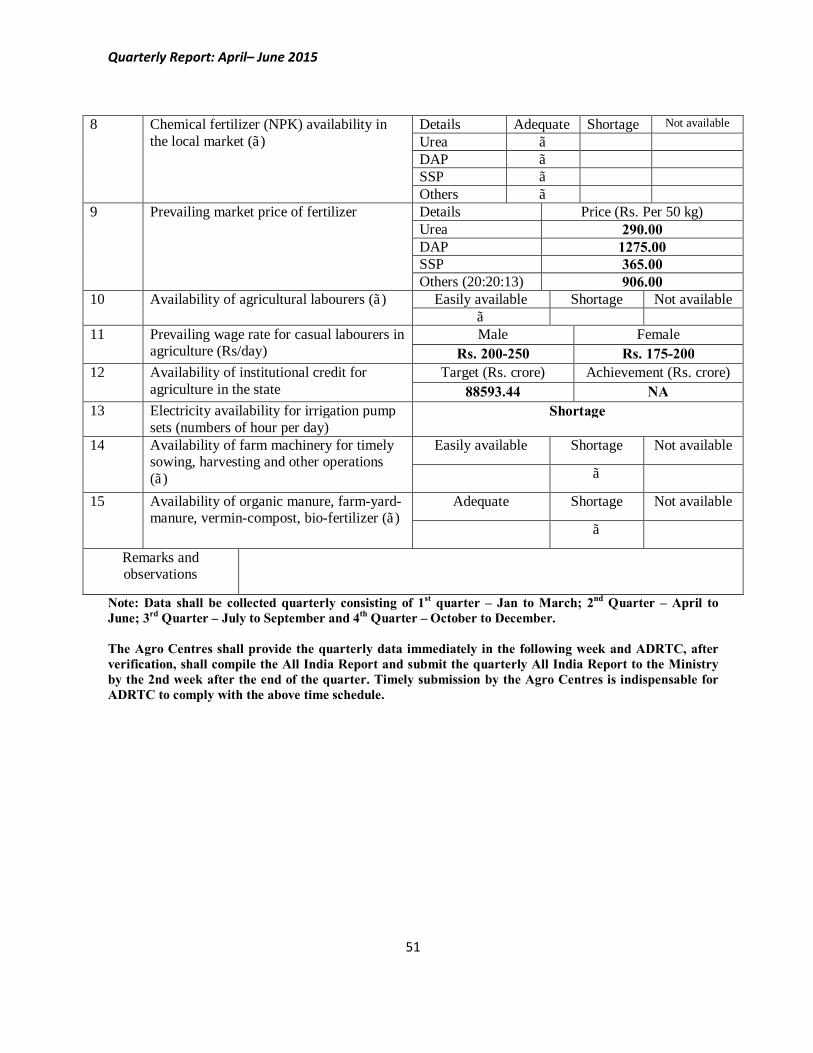
51
8 Chemical fertilizer (NPK) availability in the local market (√)
Details Adequate Shortage Not available Urea √ DAP √ SSP √ Others √
9 Prevailing market price of fertilizer Details Price (Rs. Per 50 kg) Urea 290.00 DAP 1275.00 SSP 365.00 Others (20:20:13) 906.00
10 Availability of agricultural labourers (√) Easily available Shortage Not available √
11 Prevailing wage rate for casual labourers in agriculture (Rs/day)
Male Female Rs. 200-250 Rs. 175-200
12 Availability of institutional credit for agriculture in the state
Target (Rs. crore) Achievement (Rs. crore) 88593.44 NA
13 Electricity availability for irrigation pump sets (numbers of hour per day)
Shortage
14 Availability of farm machinery for timely sowing, harvesting and other operations (√)
Easily available Shortage Not available
√
15 Availability of organic manure, farm-yard-manure, vermin-compost, bio-fertilizer (√)
Adequate Shortage Not available
√
Remarks and observations
Note: Data shall be collected quarterly consisting of 1st quarter – Jan to March; 2nd Quarter – April to June; 3rd Quarter – July to September and 4th Quarter – October to December. The Agro Centres shall provide the quarterly data immediately in the following week and ADRTC, after verification, shall compile the All India Report and submit the quarterly All India Report to the Ministry by the 2nd week after the end of the quarter. Timely submission by the Agro Centres is indispensable for ADRTC to comply with the above time schedule.
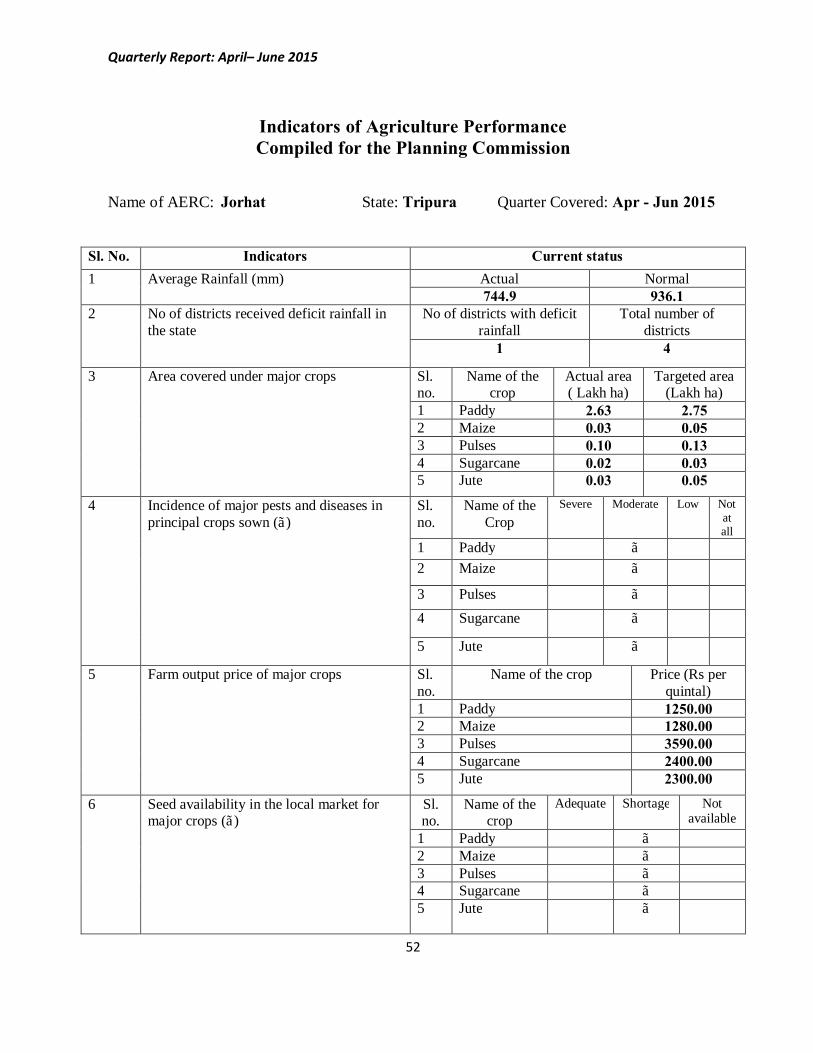
Quarterly Report: April– June 2015
52
Indicators of Agriculture Performance Compiled for the Planning Commission
Name of AERC: Jorhat State: Tripura Quarter Covered: Apr - Jun 2015
Sl. No. Indicators Current status 1 Average Rainfall (mm)
Actual Normal 744.9 936.1
2 No of districts received deficit rainfall in the state
No of districts with deficit rainfall
Total number of districts
1 4
3 Area covered under major crops Sl. no.
Name of the crop
Actual area ( Lakh ha)
Targeted area (Lakh ha)
1 Paddy 2.63 2.75 2 Maize 0.03 0.05 3 Pulses 0.10 0.13 4 Sugarcane 0.02 0.03 5 Jute 0.03 0.05
4 Incidence of major pests and diseases in principal crops sown (√)
Sl. no.
Name of the Crop
Severe Moderate Low Not at all
1 Paddy √ 2 Maize √
3 Pulses √ 4 Sugarcane √
5 Jute √
5 Farm output price of major crops Sl. no.
Name of the crop Price (Rs per quintal)
1 Paddy 1250.00 2 Maize 1280.00 3 Pulses 3590.00 4 Sugarcane 2400.00 5 Jute 2300.00
6 Seed availability in the local market for major crops (√)
Sl. no.
Name of the crop
Adequate Shortage Not available
1 Paddy √ 2 Maize √ 3 Pulses √ 4 Sugarcane √ 5 Jute
√
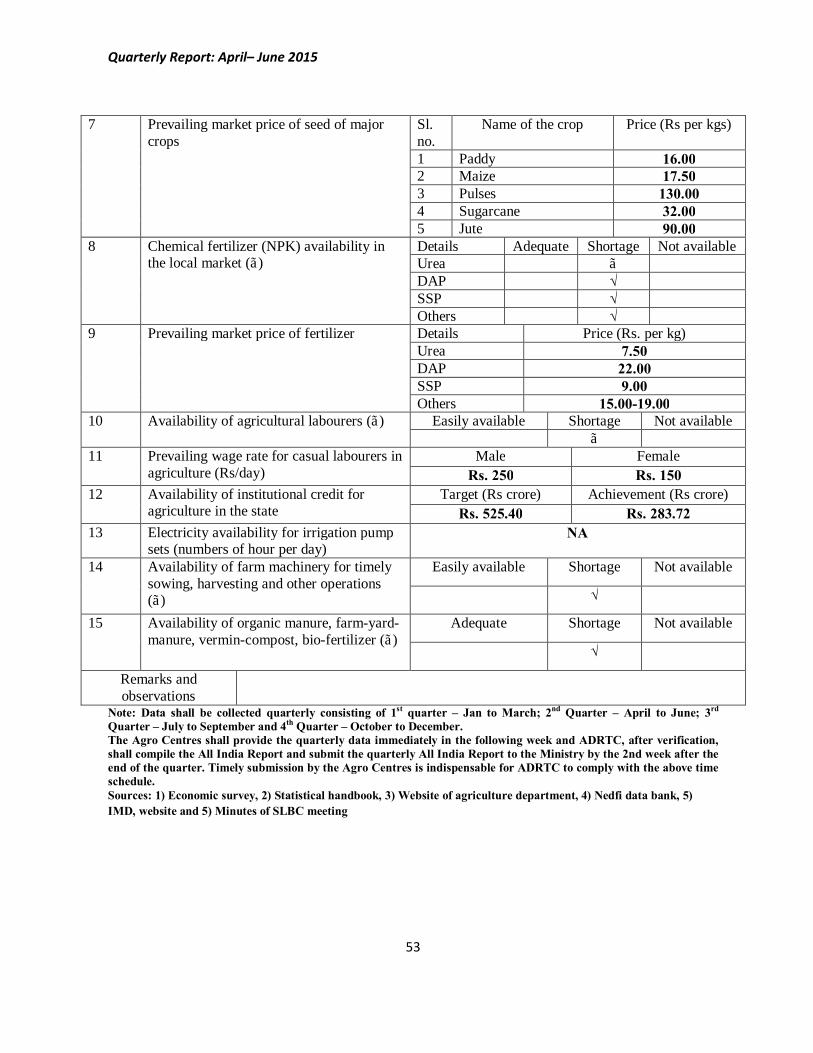
Quarterly Report: April– June 2015
53
7 Prevailing market price of seed of major crops
Sl. no.
Name of the crop Price (Rs per kgs)
1 Paddy 16.00 2 Maize 17.50 3 Pulses 130.00 4 Sugarcane 32.00 5 Jute 90.00
8 Chemical fertilizer (NPK) availability in the local market (√)
Details Adequate Shortage Not available Urea √ DAP √ SSP √ Others √
9 Prevailing market price of fertilizer Details Price (Rs. per kg) Urea 7.50 DAP 22.00 SSP 9.00 Others 15.00-19.00
10 Availability of agricultural labourers (√) Easily available Shortage Not available √
11 Prevailing wage rate for casual labourers in agriculture (Rs/day)
Male Female Rs. 250 Rs. 150
12 Availability of institutional credit for agriculture in the state
Target (Rs crore) Achievement (Rs crore) Rs. 525.40 Rs. 283.72
13 Electricity availability for irrigation pump sets (numbers of hour per day)
NA
14 Availability of farm machinery for timely sowing, harvesting and other operations (√)
Easily available Shortage Not available
√
15 Availability of organic manure, farm-yard-manure, vermin-compost, bio-fertilizer (√)
Adequate Shortage Not available
√
Remarks and observations
Note: Data shall be collected quarterly consisting of 1st quarter – Jan to March; 2nd Quarter – April to June; 3rd Quarter – July to September and 4th Quarter – October to December. The Agro Centres shall provide the quarterly data immediately in the following week and ADRTC, after verification, shall compile the All India Report and submit the quarterly All India Report to the Ministry by the 2nd week after the end of the quarter. Timely submission by the Agro Centres is indispensable for ADRTC to comply with the above time schedule. Sources: 1) Economic survey, 2) Statistical handbook, 3) Website of agriculture department, 4) Nedfi data bank, 5) IMD, website and 5) Minutes of SLBC meeting
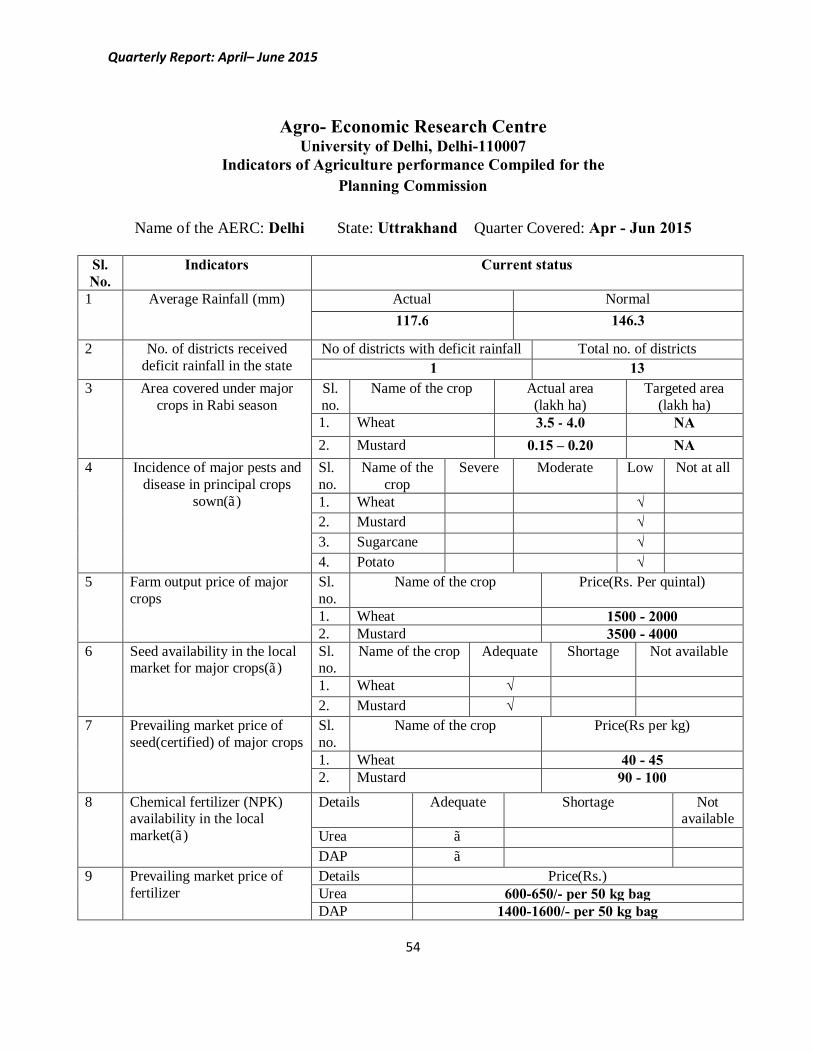
Quarterly Report: April– June 2015
54
Agro- Economic Research Centre University of Delhi, Delhi-110007
Indicators of Agriculture performance Compiled for the Planning Commission
Name of the AERC: Delhi State: Uttrakhand Quarter Covered: Apr - Jun 2015
Sl. No.
Indicators Current status
1 Average Rainfall (mm)
Actual Normal 117.6 146.3
2 No. of districts received deficit rainfall in the state
No of districts with deficit rainfall Total no. of districts 1 13
3 Area covered under major crops in Rabi season
Sl. no.
Name of the crop Actual area (lakh ha)
Targeted area (lakh ha)
1. Wheat 3.5 - 4.0 NA 2. Mustard 0.15 – 0.20 NA
4 Incidence of major pests and disease in principal crops
sown(√)
Sl. no.
Name of the crop
Severe Moderate Low Not at all
1. Wheat √ 2. Mustard √ 3. Sugarcane √ 4. Potato √
5 Farm output price of major crops
Sl. no.
Name of the crop Price(Rs. Per quintal)
1. Wheat 1500 - 2000 2. Mustard 3500 - 4000
6 Seed availability in the local market for major crops(√)
Sl. no.
Name of the crop Adequate Shortage Not available
1. Wheat √ 2. Mustard √
7 Prevailing market price of seed(certified) of major crops
Sl. no.
Name of the crop Price(Rs per kg)
1. Wheat 40 - 45 2. Mustard 90 - 100
8
Chemical fertilizer (NPK) availability in the local market(√)
Details Adequate Shortage Not available
Urea √ DAP √
9 Prevailing market price of fertilizer
Details Price(Rs.) Urea 600-650/- per 50 kg bag DAP 1400-1600/- per 50 kg bag
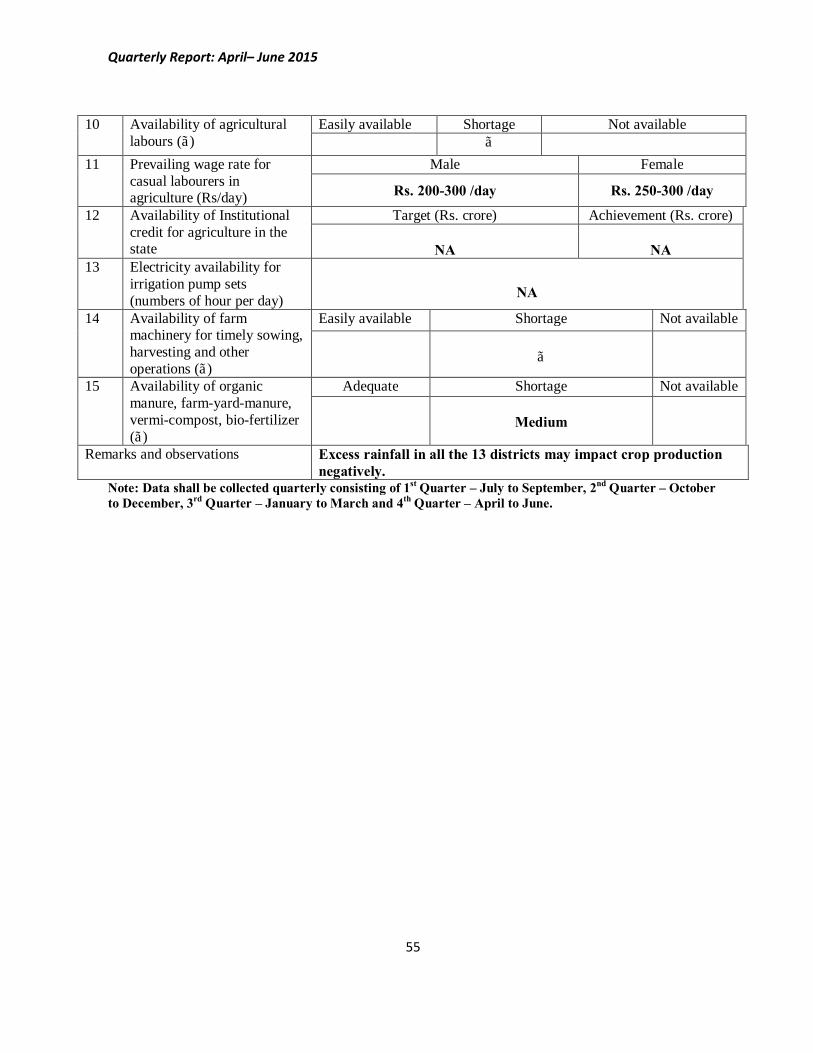
Quarterly Report: April– June 2015
55
10 Availability of agricultural labours (√)
Easily available Shortage Not available √
11 Prevailing wage rate for casual labourers in agriculture (Rs/day)
Male Female
Rs. 200-300 /day Rs. 250-300 /day
12 Availability of Institutional credit for agriculture in the state
Target (Rs. crore) Achievement (Rs. crore)
NA
NA 13 Electricity availability for
irrigation pump sets (numbers of hour per day)
NA
14 Availability of farm machinery for timely sowing, harvesting and other operations (√)
Easily available Shortage Not available
√
15 Availability of organic manure, farm-yard-manure, vermi-compost, bio-fertilizer (√)
Adequate Shortage Not available
Medium
Remarks and observations Excess rainfall in all the 13 districts may impact crop production negatively.
Note: Data shall be collected quarterly consisting of 1st Quarter – July to September, 2nd Quarter – October to December, 3rd Quarter – January to March and 4th Quarter – April to June.
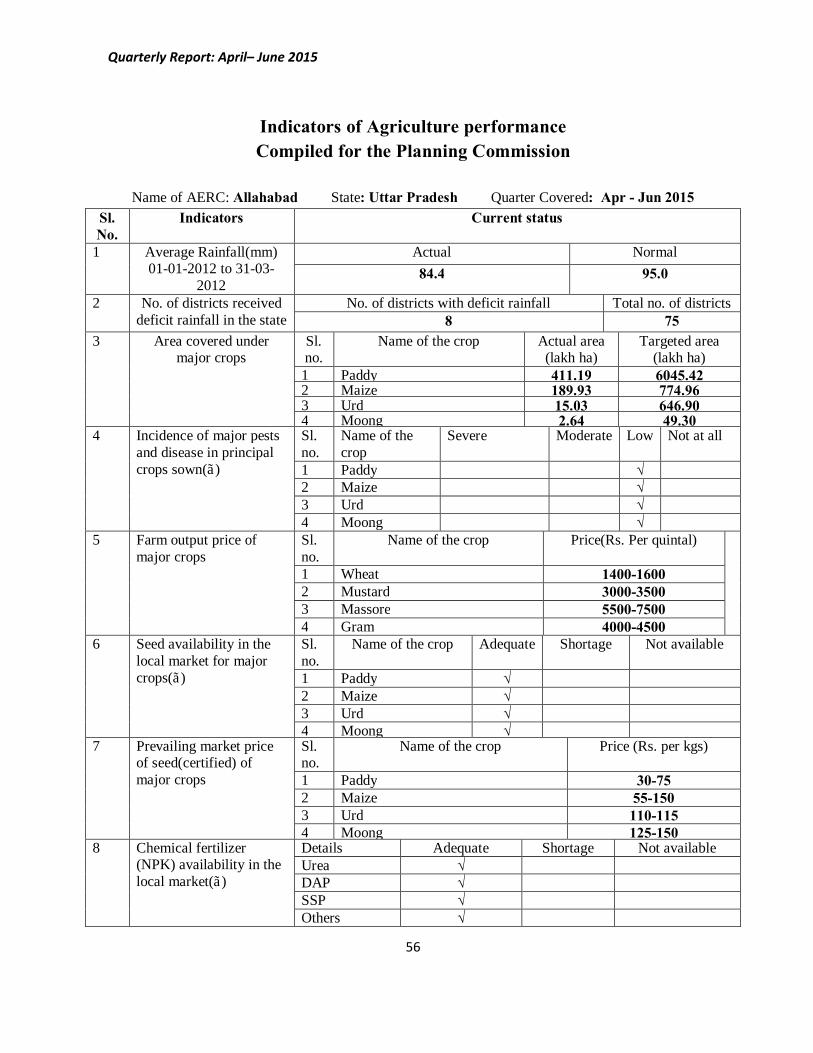
Quarterly Report: April– June 2015
56
Indicators of Agriculture performance Compiled for the Planning Commission
Name of AERC: Allahabad State: Uttar Pradesh Quarter Covered: Apr - Jun 2015
Sl. No.
Indicators Current status
1 Average Rainfall(mm) 01-01-2012 to 31-03-
2012
Actual Normal 84.4 95.0
2 No. of districts received deficit rainfall in the state
No. of districts with deficit rainfall Total no. of districts 8 75
3 Area covered under major crops
Sl. no.
Name of the crop Actual area (lakh ha)
Targeted area (lakh ha)
1 Paddy 411.19 6045.42 2 Maize 189.93 774.96 3 Urd 15.03 646.90 4 Moong 2.64 49.30
4 Incidence of major pests and disease in principal crops sown(√)
Sl. no.
Name of the crop
Severe Moderate Low Not at all
1 Paddy √ 2 Maize √ 3 Urd √ 4 Moong √
5 Farm output price of major crops
Sl. no.
Name of the crop Price(Rs. Per quintal)
1 Wheat 1400-1600 2 Mustard 3000-3500 3 Massore 5500-7500 4 Gram 4000-4500
6 Seed availability in the local market for major crops(√)
Sl. no.
Name of the crop Adequate Shortage Not available
1 Paddy √ 2 Maize √ 3 Urd √ 4 Moong √
7 Prevailing market price of seed(certified) of major crops
Sl. no.
Name of the crop Price (Rs. per kgs)
1 Paddy 30-75 2 Maize 55-150 3 Urd 110-115 4 Moong 125-150
8 Chemical fertilizer (NPK) availability in the local market(√)
Details Adequate Shortage Not available Urea √ DAP √ SSP √ Others √
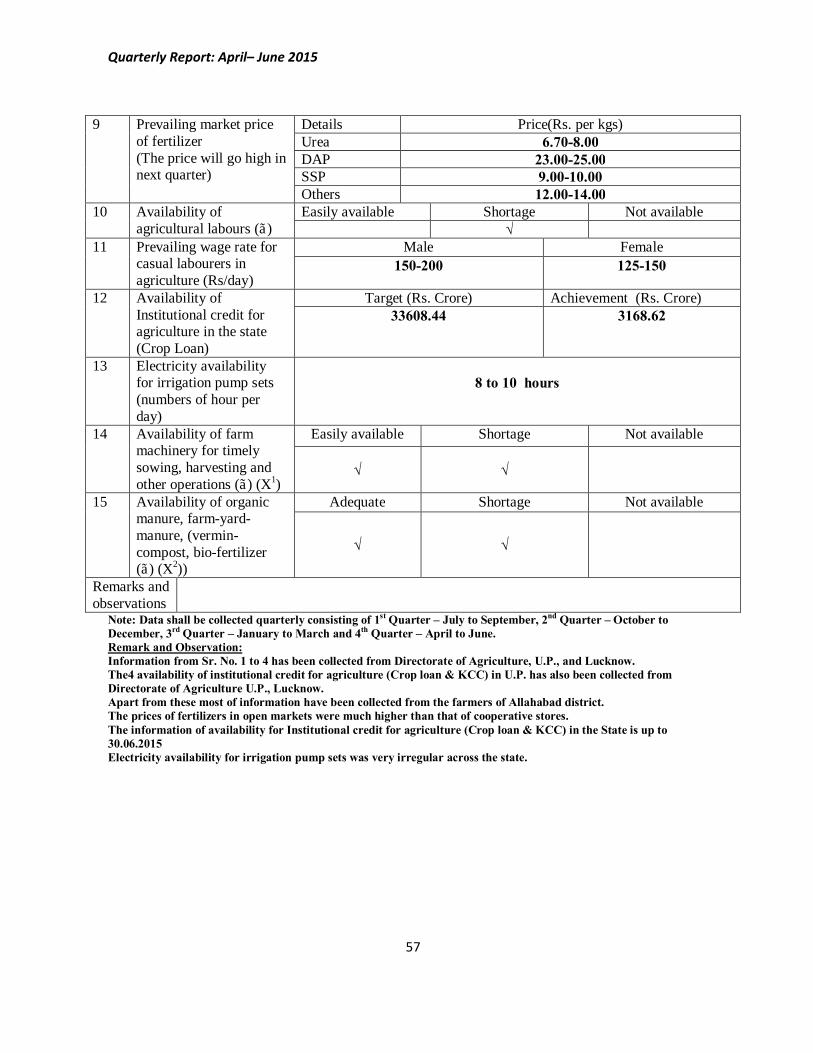
Quarterly Report: April– June 2015
57
9 Prevailing market price of fertilizer (The price will go high in next quarter)
Details Price(Rs. per kgs) Urea 6.70-8.00 DAP 23.00-25.00 SSP 9.00-10.00 Others 12.00-14.00
10 Availability of agricultural labours (√)
Easily available Shortage Not available √
11 Prevailing wage rate for casual labourers in agriculture (Rs/day)
Male Female 150-200 125-150
12 Availability of Institutional credit for agriculture in the state (Crop Loan)
Target (Rs. Crore) Achievement (Rs. Crore) 33608.44 3168.62
13 Electricity availability for irrigation pump sets (numbers of hour per day)
8 to 10 hours
14 Availability of farm machinery for timely sowing, harvesting and other operations (√) (X1)
Easily available Shortage Not available
√ √
15 Availability of organic manure, farm-yard-manure, (vermin-compost, bio-fertilizer (√) (X2))
Adequate Shortage Not available
√ √
Remarks and observations
Note: Data shall be collected quarterly consisting of 1st Quarter – July to September, 2nd Quarter – October to December, 3rd Quarter – January to March and 4th Quarter – April to June. Remark and Observation: Information from Sr. No. 1 to 4 has been collected from Directorate of Agriculture, U.P., and Lucknow. The4 availability of institutional credit for agriculture (Crop loan & KCC) in U.P. has also been collected from Directorate of Agriculture U.P., Lucknow. Apart from these most of information have been collected from the farmers of Allahabad district. The prices of fertilizers in open markets were much higher than that of cooperative stores. The information of availability for Institutional credit for agriculture (Crop loan & KCC) in the State is up to 30.06.2015 Electricity availability for irrigation pump sets was very irregular across the state.
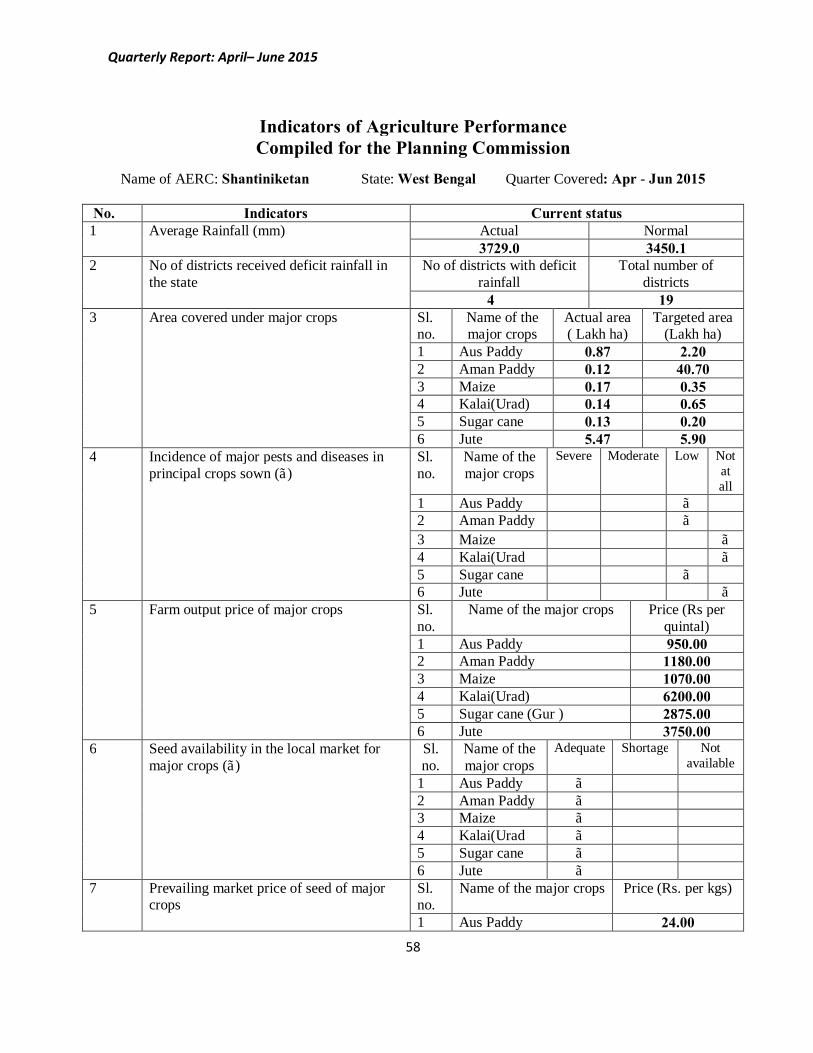
Quarterly Report: April– June 2015
58
Indicators of Agriculture Performance Compiled for the Planning Commission
Name of AERC: Shantiniketan State: West Bengal Quarter Covered: Apr - Jun 2015
No. Indicators Current status 1 Average Rainfall (mm) Actual Normal
3729.0 3450.1 2 No of districts received deficit rainfall in
the state No of districts with deficit
rainfall Total number of
districts 4 19
3 Area covered under major crops Sl. no.
Name of the major crops
Actual area ( Lakh ha)
Targeted area (Lakh ha)
1 Aus Paddy 0.87 2.20 2 Aman Paddy 0.12 40.70 3 Maize 0.17 0.35 4 Kalai(Urad) 0.14 0.65 5 Sugar cane 0.13 0.20 6 Jute 5.47 5.90
4 Incidence of major pests and diseases in principal crops sown (√)
Sl. no.
Name of the major crops
Severe Moderate Low Not at all
1 Aus Paddy √ 2 Aman Paddy √ 3 Maize √ 4 Kalai(Urad √ 5 Sugar cane √ 6 Jute √
5 Farm output price of major crops Sl. no.
Name of the major crops Price (Rs per quintal)
1 Aus Paddy 950.00 2 Aman Paddy 1180.00 3 Maize 1070.00 4 Kalai(Urad) 6200.00 5 Sugar cane (Gur ) 2875.00 6 Jute 3750.00
6 Seed availability in the local market for major crops (√)
Sl. no.
Name of the major crops
Adequate Shortage Not available
1 Aus Paddy √ 2 Aman Paddy √ 3 Maize √ 4 Kalai(Urad √ 5 Sugar cane √ 6 Jute √
7 Prevailing market price of seed of major crops
Sl. no.
Name of the major crops Price (Rs. per kgs)
1 Aus Paddy 24.00
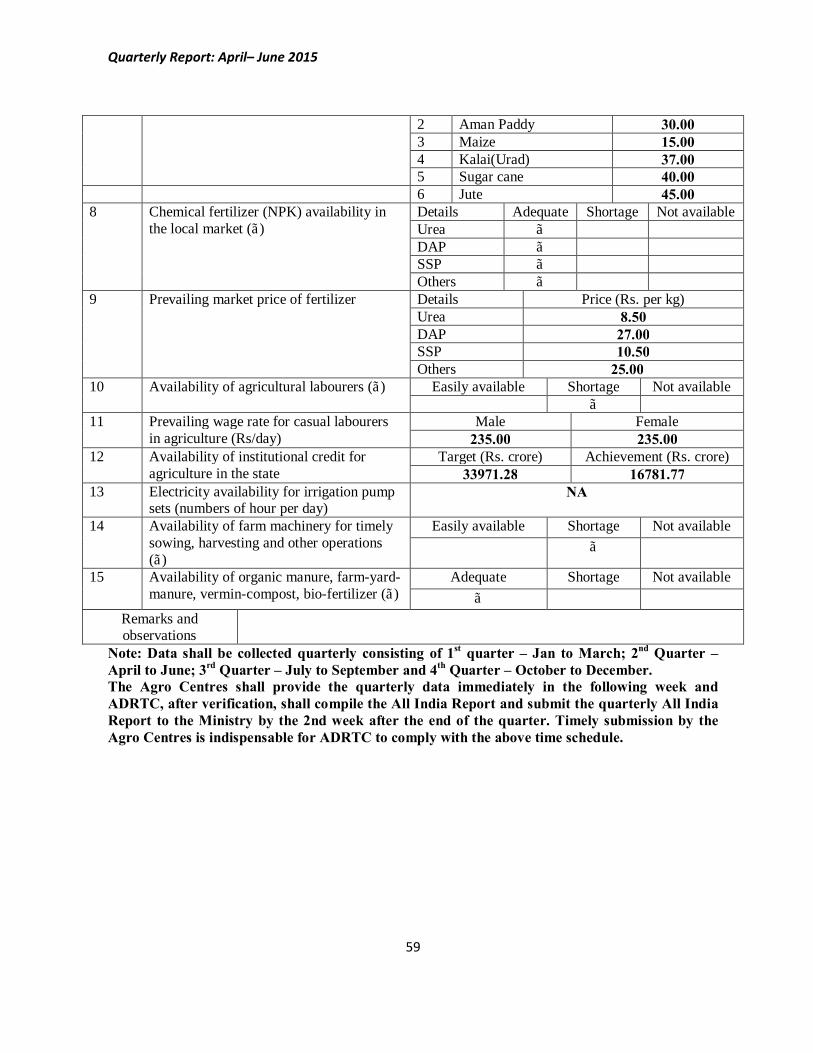
Quarterly Report: April– June 2015
59
2 Aman Paddy 30.00 3 Maize 15.00 4 Kalai(Urad) 37.00 5 Sugar cane 40.00
6 Jute 45.00 8 Chemical fertilizer (NPK) availability in
the local market (√) Details Adequate Shortage Not available Urea √ DAP √ SSP √ Others √
9 Prevailing market price of fertilizer Details Price (Rs. per kg) Urea 8.50 DAP 27.00 SSP 10.50 Others 25.00
10 Availability of agricultural labourers (√) Easily available Shortage Not available √
11 Prevailing wage rate for casual labourers in agriculture (Rs/day)
Male Female 235.00 235.00
12 Availability of institutional credit for agriculture in the state
Target (Rs. crore) Achievement (Rs. crore) 33971.28 16781.77
13 Electricity availability for irrigation pump sets (numbers of hour per day)
NA
14 Availability of farm machinery for timely sowing, harvesting and other operations (√)
Easily available Shortage Not available √
15 Availability of organic manure, farm-yard-manure, vermin-compost, bio-fertilizer (√)
Adequate Shortage Not available √
Remarks and observations
Note: Data shall be collected quarterly consisting of 1st quarter – Jan to March; 2nd Quarter – April to June; 3rd Quarter – July to September and 4th Quarter – October to December. The Agro Centres shall provide the quarterly data immediately in the following week and ADRTC, after verification, shall compile the All India Report and submit the quarterly All India Report to the Ministry by the 2nd week after the end of the quarter. Timely submission by the Agro Centres is indispensable for ADRTC to comply with the above time schedule.
Quarterly Report: April– June 2015
60
INSTITUTE FOR SOCIAL AND ECONOMIC CHANGE
Dr. V.K.R.V. Rao Road, Nagarabhavi, Bangalore – 560 072. INDIA Ph. : 91-80-23215468, 23215519 Fax: 91-080-23217008 E-mail : [email protected] Web : http://www.isec.ac.in
Bangalore – 560 072