Embed Size (px)
Citation preview

1
P.F. LemkinLECB, CCR, NCI/FCRDCmail: [email protected]
[This document is under construction]
Revised: 05-16-2002
Software DesignSoftware Designof the MicroArray Explorerof the MicroArray Explorer
Data Mining ToolData Mining Tool
Home: http://www.lecb.ncifcrf.gov/MAExplorer
Open Source: http://MAExplorer.SourceForge.net/
Java MAExplorer program design issuesJava MAExplorer program design issues1. Overview2. Design decisions, Client-centric vs. Server-Centric3. MAExplorer GUI (graphical user interface)4. Web database I/O5. Genes and Gene lists6. Gene data filter7. Multiple plot windows8. Other plot window implementations9. Reports & access to other Web databases10. Synchronizing windows11. Dumping text and plot windows to .txt and .gif files12. Saving and Restoring the MAExplorer state13. Miscellaneous classes14. MAEPlugin design15. MaeJavaAPI design16. Examples (links): MAExplorer menu organization
2
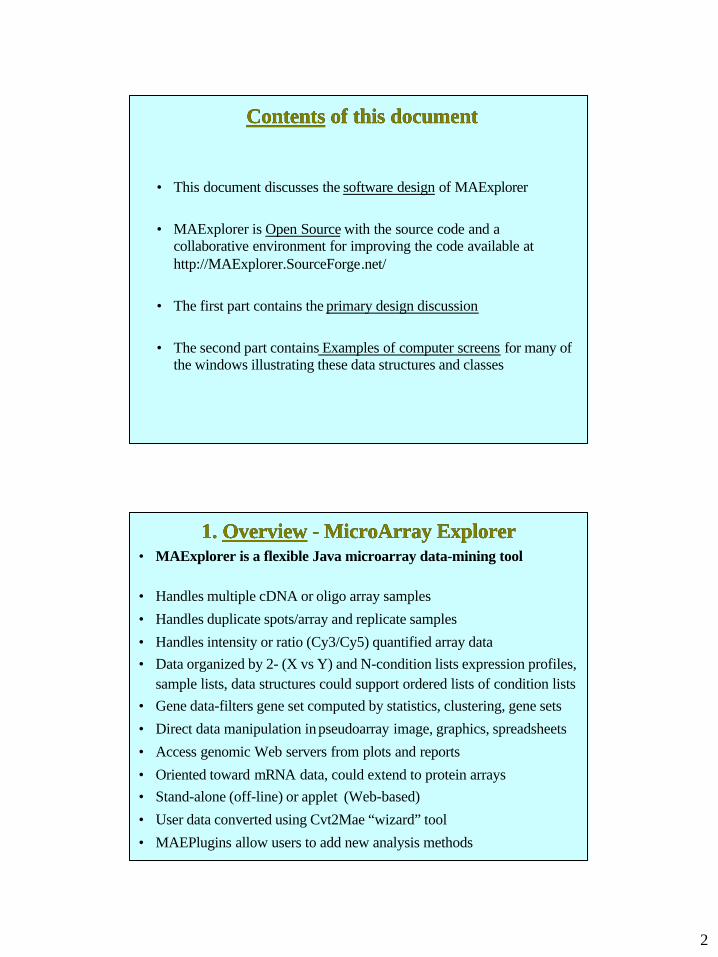
ContentsContents of this document of this document
• This document discusses the software design of MAExplorer
• MAExplorer is Open Source with the source code and acollaborative environment for improving the code available athttp://MAExplorer.SourceForge.net/
• The first part contains the primary design discussion
• The second part contains Examples of computer screens for many ofthe windows illustrating these data structures and classes
1. 1. OverviewOverview - MicroArray Explorer - MicroArray Explorer• MAExplorer is a flexible Java microarray data-mining tool
• Handles multiple cDNA or oligo array samples
• Handles duplicate spots/array and replicate samples
• Handles intensity or ratio (Cy3/Cy5) quantified array data• Data organized by 2- (X vs Y) and N-condition lists expression profiles,
sample lists, data structures could support ordered lists of condition lists• Gene data-filters gene set computed by statistics, clustering, gene sets
• Direct data manipulation in pseudoarray image, graphics, spreadsheets
• Access genomic Web servers from plots and reports
• Oriented toward mRNA data, could extend to protein arrays• Stand-alone (off-line) or applet (Web-based)
• User data converted using Cvt2Mae “wizard” tool
• MAEPlugins allow users to add new analysis methods
3
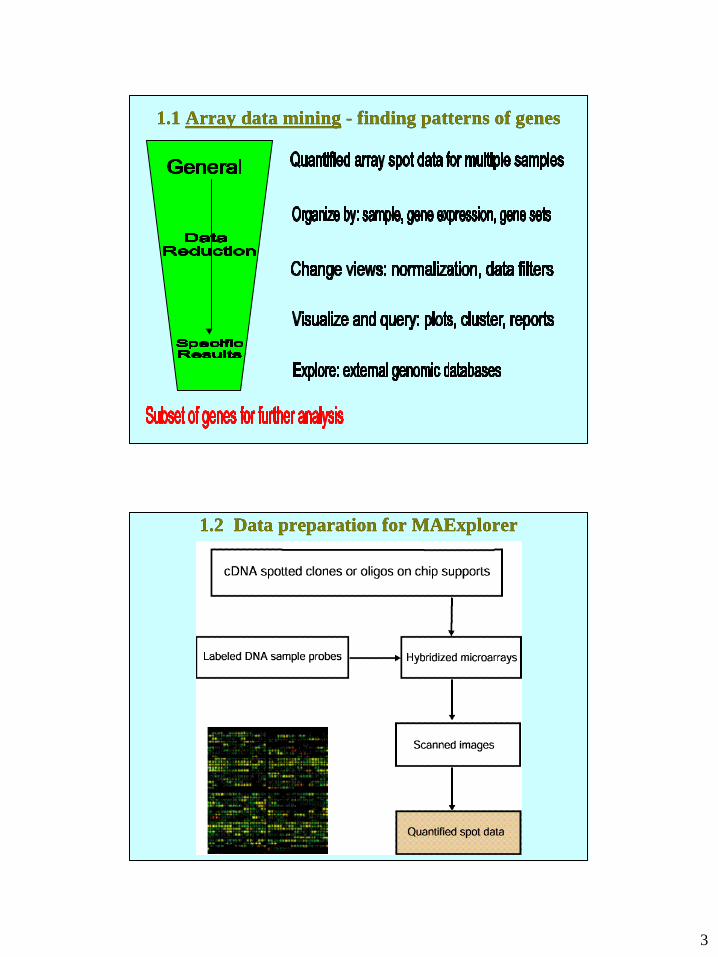
1.1 1.1 Array data miningArray data mining - finding patterns of genes - finding patterns of genes
1.2 Data preparation for MAExplorer1.2 Data preparation for MAExplorer
4
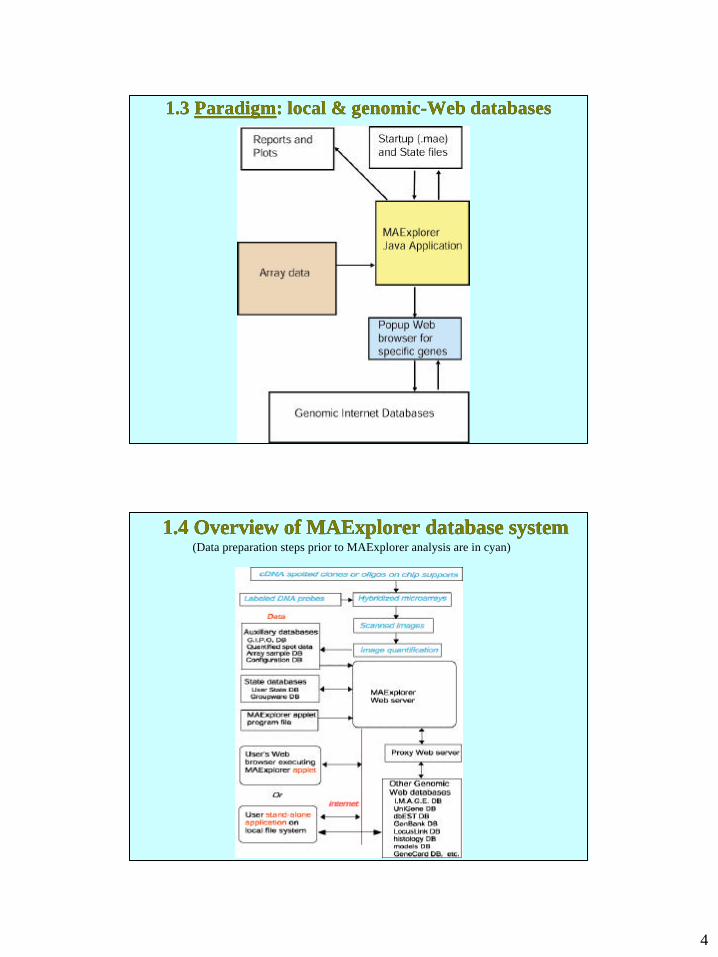
1.3 1.3 ParadigmParadigm: local & genomic-Web databases: local & genomic-Web databases
1.4 Overview of MAExplorer database system1.4 Overview of MAExplorer database system(Data preparation steps prior to MAExplorer analysis are in cyan)
5
1.5 MAExplorer analysis environment1.5 MAExplorer analysis environment
• Stand-alone Java application for user data
• Download MAExplorer program from Web site
• Installers: Windows, MacOS/-X, Solaris, Linux, Unix, etc.
• Documentation, tutorials, MGAP demo database on Web site
• Cvt2Mae “wizard” tool converts user data for use withMAExplorer
• May download data from NCI/CIT mAdb microarray dataserver RDBMS for direct use with MAExplorer
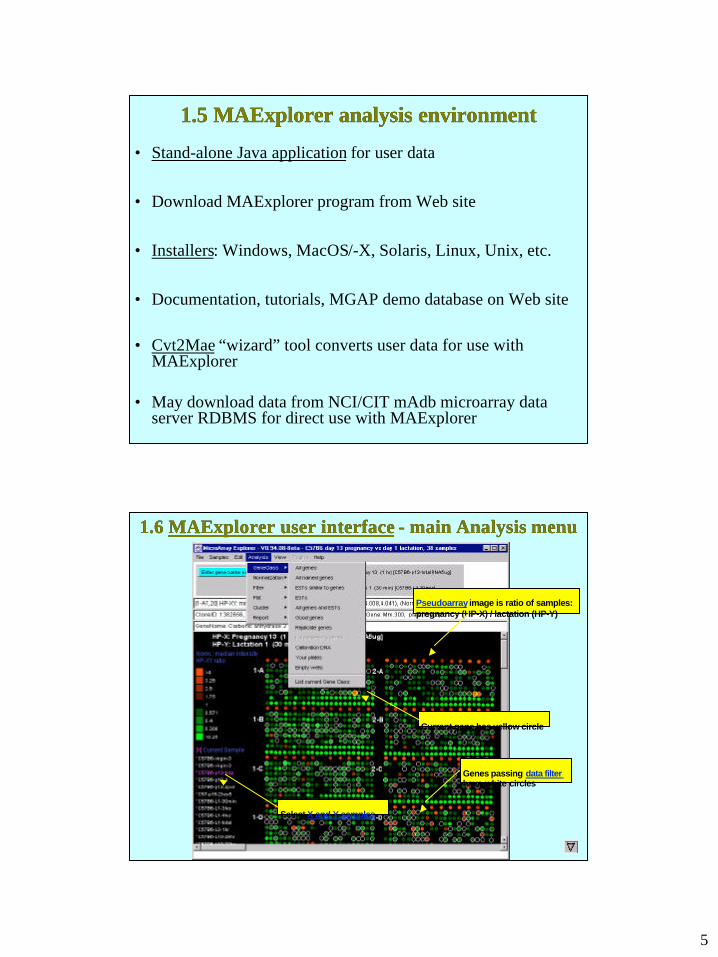
1.6 1.6 MAExplorer user interfaceMAExplorer user interface - main Analysis menu - main Analysis menu
Pseudoarray image is ratio of samples:pregnancy (HP-X) / lactation (HP-Y)
Genes passing data filterhave white circles
Current gene has yellow circle
Select X and Y samples
6
1.7 1.7 Data conversionData conversion “Wizard” for MAExplorer “Wizard” for MAExplorer
• Cvt2Mae “Wizard” converts commercial and user-defined arrayformats (e.g. Affymetrix, GenePix, Scanalyze, etc)
• Users may create and save Array Layout descriptions for subsequentconversions
• Conversion generates a MAExplorer project directory tree of files thatare ready to analyze
• After MAExplorer installed, click on project’s MAE/Start.mae file tostart analysis
• See Cvt2Mae home page for details on operation
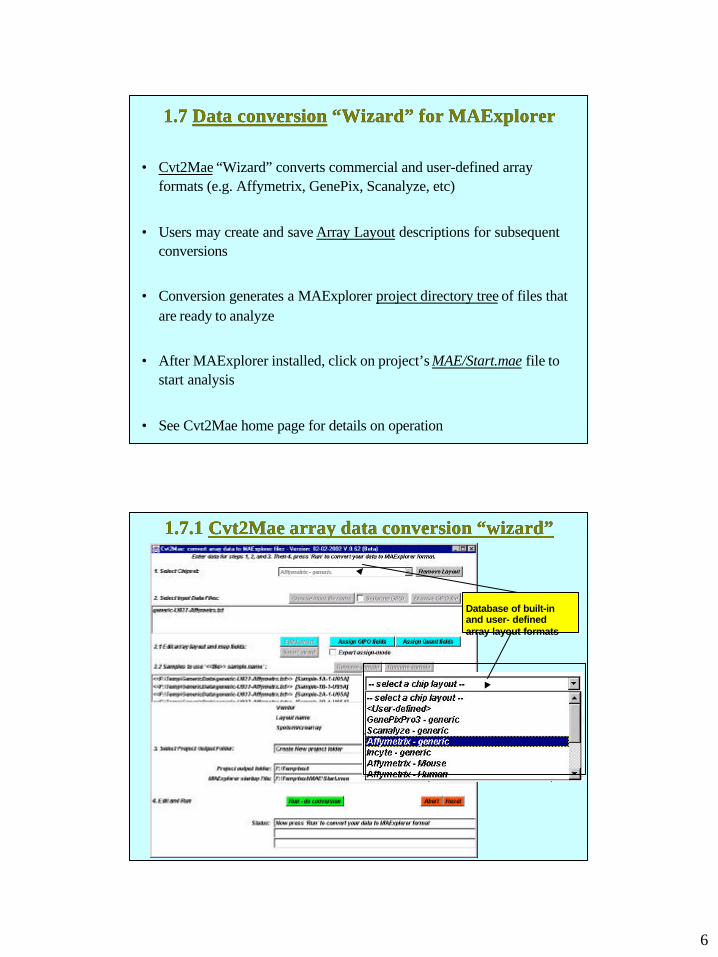
1.7.1 1.7.1 Cvt2Mae array data conversion “wizard”Cvt2Mae array data conversion “wizard”
Database of built-inand user- definedarray layout formats
7
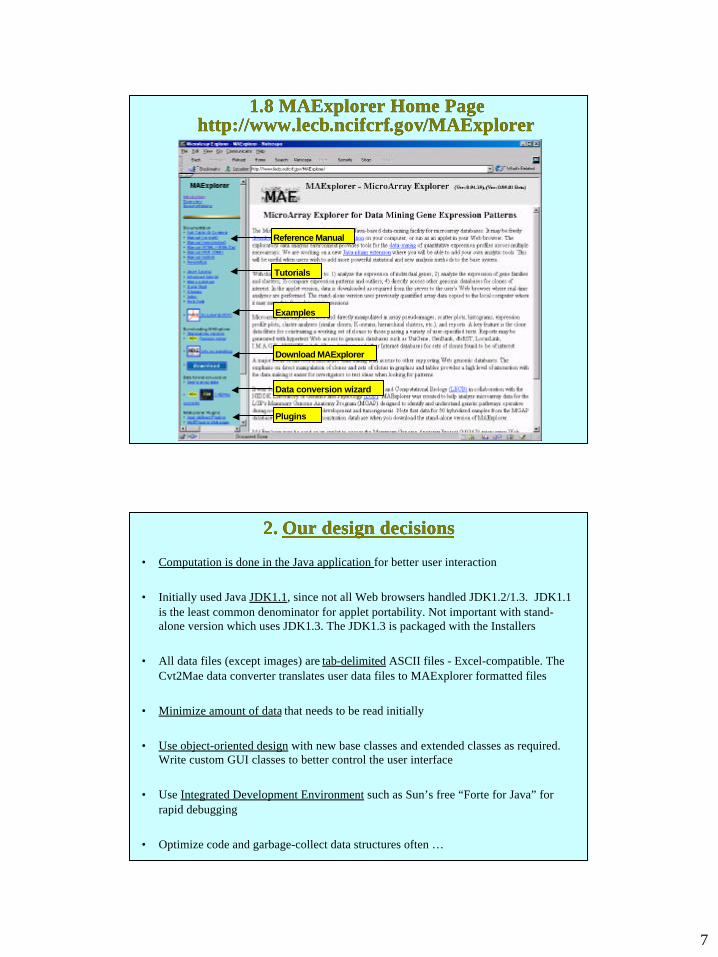
1.8 MAExplorer Home Page1.8 MAExplorer Home Pagehttp://www.http://www.lecblecb..ncifcrfncifcrf..govgov/MAExplorer/MAExplorer
Reference Manual
Tutorials
Download MAExplorer
Data conversion wizard
Plugins
Examples
2. 2. Our design decisionsOur design decisions
• Computation is done in the Java application for better user interaction
• Initially used Java JDK1.1, since not all Web browsers handled JDK1.2/1.3. JDK1.1is the least common denominator for applet portability. Not important with stand-alone version which uses JDK1.3. The JDK1.3 is packaged with the Installers
• All data files (except images) are tab-delimited ASCII files - Excel-compatible. TheCvt2Mae data converter translates user data files to MAExplorer formatted files
• Minimize amount of data that needs to be read initially
• Use object-oriented design with new base classes and extended classes as required.Write custom GUI classes to better control the user interface
• Use Integrated Development Environment such as Sun’s free “Forte for Java” forrapid debugging
• Optimize code and garbage-collect data structures often …
8
2.1 2.1 Client-CentricClient-Centric computations - computations -advantages/disadvantagesadvantages/disadvantages
Client-centric approach uses stand-alone programs
+ Java runs on all operating systems as either stand-alone or browser applets
+ handles rapid response required for direct manipulation on desktop computers
+ stand-alone version may be restarted quickly from local or cached data
+ size limitations are not a problem with stand-alone Java applications
+ Java plug-ins allows prototyping new analysis methods by any group of users
+ easy to build large stable stand-alone programs handling very large data sets
- for applet version, slow startup since program & data downloaded when run
- difficult to build large stable Web-applets handling very large data sets
- for stand-alone application, must be installed on client's computer
2.2 2.2 Server-CentricServer-Centric (CGI or Applet) computations - (CGI or Applet) computations -advantages/disadvantagesadvantages/disadvantages
Server-centric approach uses mix of HTML, CGI, Java Applets
+ may have better resources for very large data sets but with dependence onserver
+ faster startup than full applet since minimal GUI required and little data isdownloaded
+ easier to prototype and distribute new functionality using centralized CGI orservlets
- susceptible to Internet traffic bandwidth problems for large numbers of users - susceptible to server-load dependencies for large numbers of users - difficult to get very rapid response for direct manipulation for data mining
9
2.3 The MAExplorer 2.3 The MAExplorer projectproject
• A database resides in a project directory which contains all samples the user maywish to analyze
• Multiple MAExplorer projects may exist on a local disk (or Web server) - eachhaving a standard project directory tree (shown in next slide)
• A projects database file (maeProjects.txt) in the stand-alone installation directorytracks the names of these projects and disk location and last active database
• The (File | Database | Open file DB) menu command specifies a particulardatabase startup file within a project directory
• MAExplorer is started by opening a .mae startup file that specifies the subset ofsamples to use (Note: .mae is the file extension - not the complete file name!)
• Clicking on a .mae file (e.g. in Windows) will start MAExplorer on that database
2.3.1 MAExplorer 2.3.1 MAExplorer Project DirectoryProject Directory Tree Tree
/Cache - (optional) cached data saved from initial download from Web DB server
/Config - project databases for Configuration DB, GIPO DB, Samples DB files
/MAE - set of .mae stand-alone startup files for subsets of the project samples
/Plugins - (optional) set of MAEPlugins written by the user. [Normally, it checks the /Plugins directory in the MAExplorer installation directory]
/Quant - quantified spot data files for each hybridized sample
/Report - (optional) directory where text and GIF files are saved by user with SaveAs Report and SaveAs GIF commands
/State - (optional) the GeneBitSets (.cbs) and SampleSets (.hpl) “SaveAs DB” files
10
2.3.2 2.3.2 Required project directoriesRequired project directories• All data files (except images) are tab-delimited files
• The .mae startup file is a physical file on a local disk or a Web server virtual CGIfile in the MAE/ directory
• There may be any number of .mae startup files. They all end with “.mae”
• Each .mae startup file points may point to a specific configuration file
• The Config/ directory contains: 1. Configuration database file describing the array architecture and other DB files 2. Samples database file listing all of the samples available in the database 3. GIPO (Gene In Plate Order) print table database file mapping spot position to
geneomic information through a spot identifier
• The Quant/ directory contains quantified spot data files for each hybridized samplethat includes channel(s) intensity and background, good spot flags (QualCheck),spot identifier
2.3.3 Optional/Generated project directories2.3.3 Optional/Generated project directories• The Cache/ directory can be used to saving all data files downloaded from a Web server
to avoid returning to the server when accessing that data in subsequent data miningsessions
• The State/ directory is used for saving the named gene sets (.cbs files) that are sharedbetween all startup files.
• The State/ directory is also used for saving the named lists of hybridized samples (.hpl)files that are shared between all startup files
• When saving a data mining session using (File | Database | SaveAs … DB) menucommand, the named gene sets and sample lists are written to the State/ directory as .cbsand .hpl files
• Saving the database also writes the complete state into a .mae startup file that overidesthe configuration file data the next time MAExplorer is started
• The Report/ directory is used for saving text reports as .txt files and all plots as .gif files
11
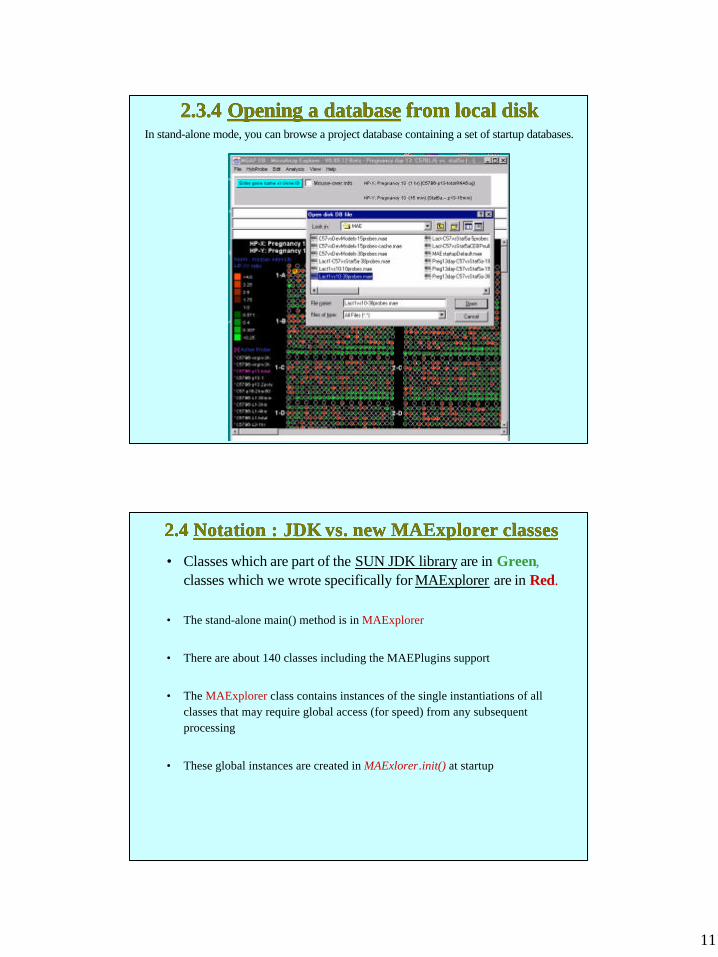
2.3.4 2.3.4 Opening a databaseOpening a database from local disk from local diskIn stand-alone mode, you can browse a project database containing a set of startup databases.
2.4 2.4 Notation : JDK Notation : JDK vsvs. new MAExplorer classes. new MAExplorer classes
• Classes which are part of the SUN JDK library are in Green,classes which we wrote specifically for MAExplorer are in Red.
• The stand-alone main() method is in MAExplorer
• There are about 140 classes including the MAEPlugins support
• The MAExplorer class contains instances of the single instantiations of allclasses that may require global access (for speed) from any subsequentprocessing
• These global instances are created in MAExlorer.init() at startup
12
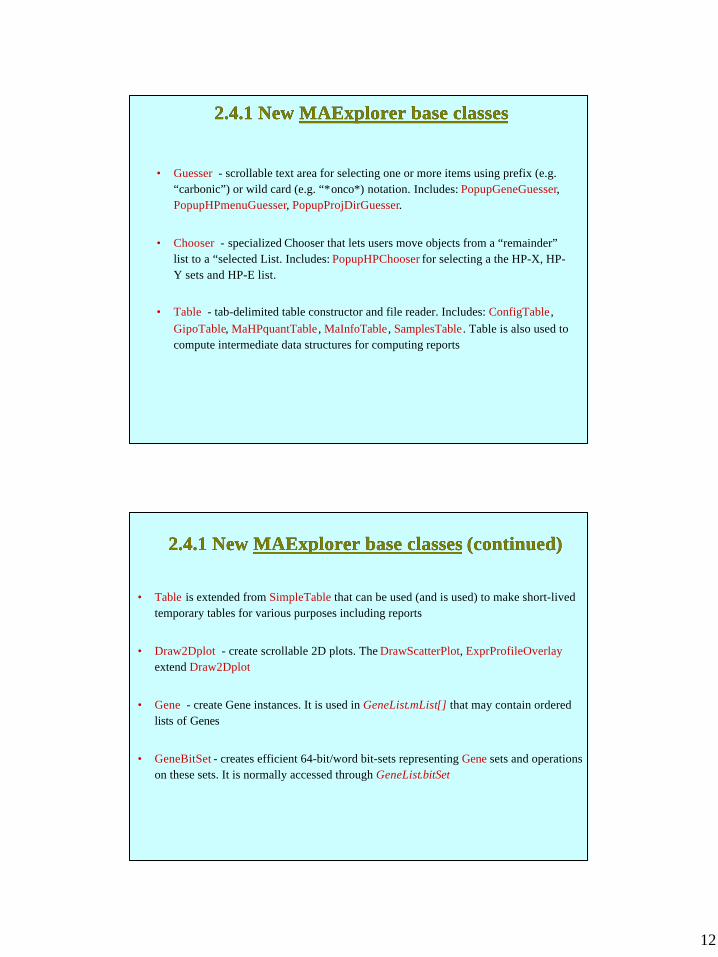
2.4.1 New 2.4.1 New MAExplorer base classesMAExplorer base classes
• Guesser - scrollable text area for selecting one or more items using prefix (e.g.“carbonic”) or wild card (e.g. “*onco*) notation. Includes: PopupGeneGuesser,PopupHPmenuGuesser, PopupProjDirGuesser.
• Chooser - specialized Chooser that lets users move objects from a “remainder”list to a “selected List. Includes: PopupHPChooser for selecting a the HP-X, HP-Y sets and HP-E list.
• Table - tab-delimited table constructor and file reader. Includes: ConfigTable,GipoTable, MaHPquantTable, MaInfoTable, SamplesTable. Table is also used tocompute intermediate data structures for computing reports
2.4.1 New 2.4.1 New MAExplorer base classesMAExplorer base classes (continued) (continued)
• Table is extended from SimpleTable that can be used (and is used) to make short-livedtemporary tables for various purposes including reports
• Draw2Dplot - create scrollable 2D plots. The DrawScatterPlot, ExprProfileOverlayextend Draw2Dplot
• Gene - create Gene instances. It is used in GeneList.mList[] that may contain orderedlists of Genes
• GeneBitSet - creates efficient 64-bit/word bit-sets representing Gene sets and operationson these sets. It is normally accessed through GeneList.bitSet
13
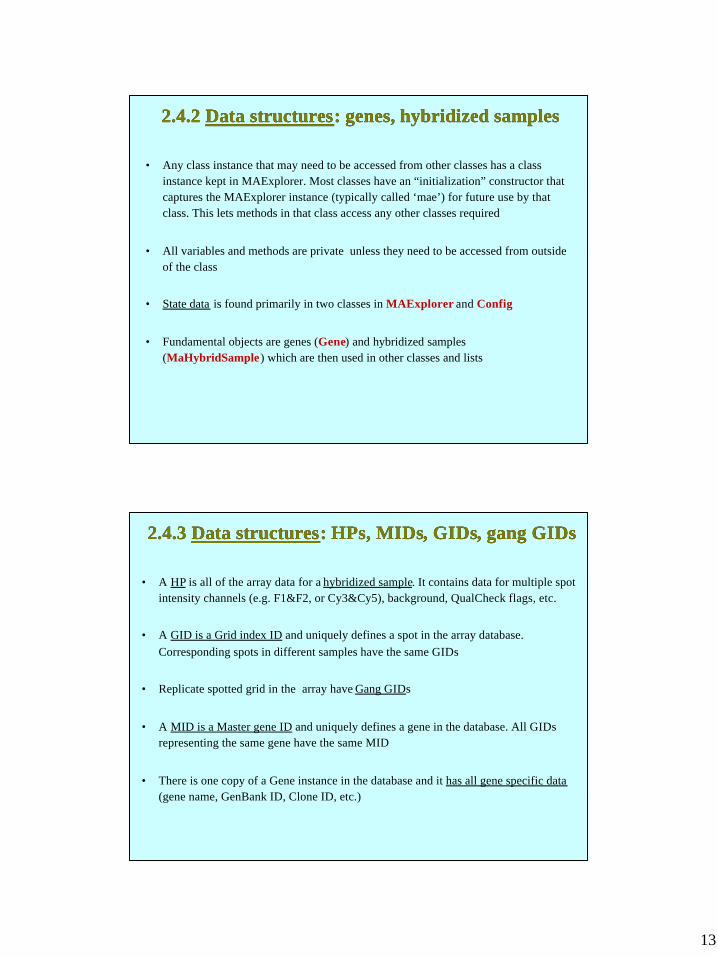
2.4.2 2.4.2 Data structuresData structures: genes, hybridized samples: genes, hybridized samples
• Any class instance that may need to be accessed from other classes has a classinstance kept in MAExplorer. Most classes have an “initialization” constructor thatcaptures the MAExplorer instance (typically called ‘mae’) for future use by thatclass. This lets methods in that class access any other classes required
• All variables and methods are private unless they need to be accessed from outsideof the class
• State data is found primarily in two classes in MAExplorer and Config
• Fundamental objects are genes (Gene) and hybridized samples(MaHybridSample) which are then used in other classes and lists
2.4.3 2.4.3 Data structuresData structures: : HPsHPs,, MIDs MIDs, , GIDsGIDs, gang , gang GIDsGIDs
• A HP is all of the array data for a hybridized sample. It contains data for multiple spotintensity channels (e.g. F1&F2, or Cy3&Cy5), background, QualCheck flags, etc.
• A GID is a Grid index ID and uniquely defines a spot in the array database.Corresponding spots in different samples have the same GIDs
• Replicate spotted grid in the array have Gang GIDs
• A MID is a Master gene ID and uniquely defines a gene in the database. All GIDsrepresenting the same gene have the same MID
• There is one copy of a Gene instance in the database and it has all gene specific data(gene name, GenBank ID, Clone ID, etc.)
14
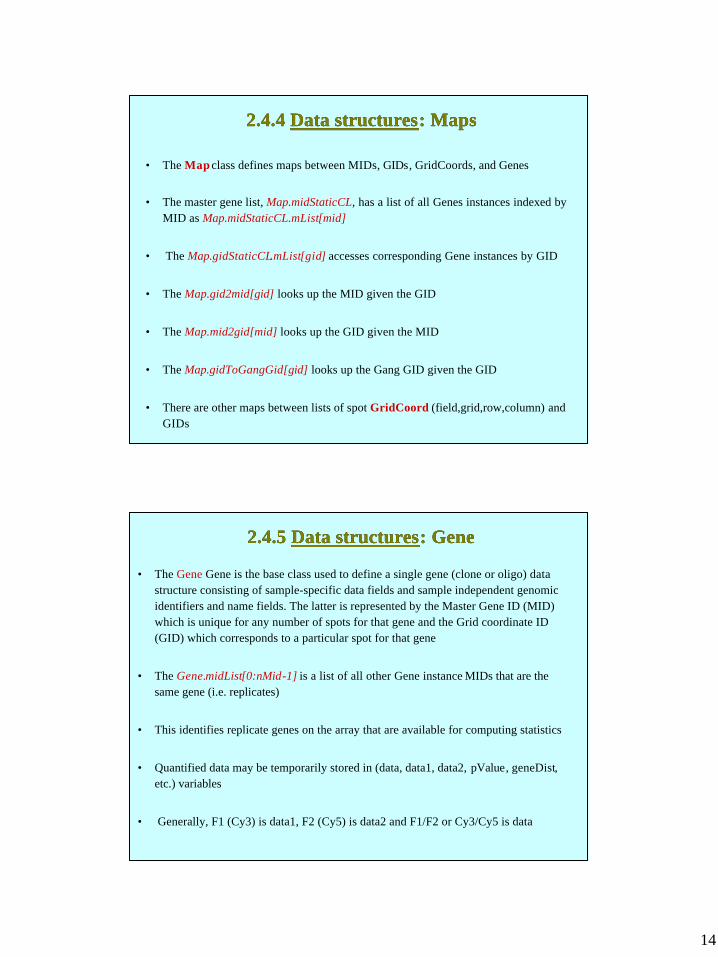
2.4.4 2.4.4 Data structuresData structures: Maps: Maps
• The Map class defines maps between MIDs, GIDs, GridCoords, and Genes
• The master gene list, Map.midStaticCL, has a list of all Genes instances indexed byMID as Map.midStaticCL.mList[mid]
• The Map.gidStaticCL.mList[gid] accesses corresponding Gene instances by GID
• The Map.gid2mid[gid] looks up the MID given the GID
• The Map.mid2gid[mid] looks up the GID given the MID
• The Map.gidToGangGid[gid] looks up the Gang GID given the GID
• There are other maps between lists of spot GridCoord (field,grid,row,column) andGIDs
2.4.5 2.4.5 Data structuresData structures: Gene: Gene
• The Gene Gene is the base class used to define a single gene (clone or oligo) datastructure consisting of sample-specific data fields and sample independent genomicidentifiers and name fields. The latter is represented by the Master Gene ID (MID)which is unique for any number of spots for that gene and the Grid coordinate ID(GID) which corresponds to a particular spot for that gene
• The Gene.midList[0:nMid-1] is a list of all other Gene instance MIDs that are thesame gene (i.e. replicates)
• This identifies replicate genes on the array that are available for computing statistics
• Quantified data may be temporarily stored in (data, data1, data2, pValue, geneDist,etc.) variables
• Generally, F1 (Cy3) is data1, F2 (Cy5) is data2 and F1/F2 or Cy3/Cy5 is data
15
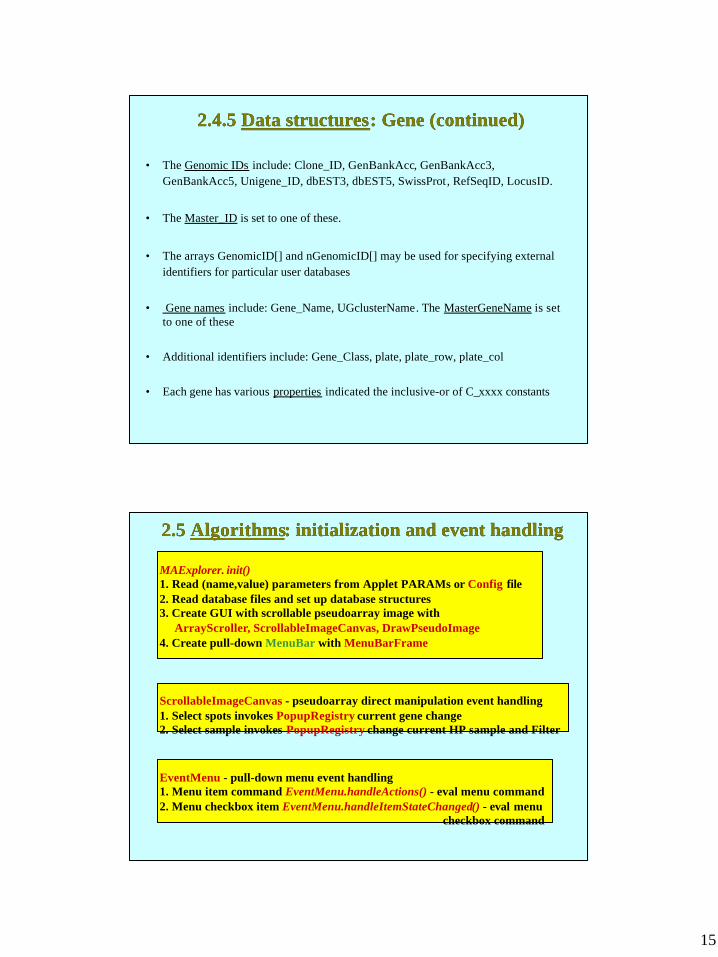
2.4.5 2.4.5 Data structuresData structures: Gene (continued): Gene (continued)
• The Genomic IDs include: Clone_ID, GenBankAcc, GenBankAcc3,GenBankAcc5, Unigene_ID, dbEST3, dbEST5, SwissProt, RefSeqID, LocusID.
• The Master_ID is set to one of these.
• The arrays GenomicID[] and nGenomicID[] may be used for specifying externalidentifiers for particular user databases
• Gene names include: Gene_Name, UGclusterName. The MasterGeneName is setto one of these
• Additional identifiers include: Gene_Class, plate, plate_row, plate_col
• Each gene has various properties indicated the inclusive-or of C_xxxx constants
2.5 2.5 AlgorithmsAlgorithms: initialization and event handling: initialization and event handling
MAExplorer. init()1. Read (name,value) parameters from Applet PARAMs or Config file2. Read database files and set up database structures3. Create GUI with scrollable pseudoarray image with ArrayScroller, ScrollableImageCanvas, DrawPseudoImage4. Create pull-down MenuBar with MenuBarFrame
EventMenu - pull-down menu event handling1. Menu item command EventMenu.handleActions() - eval menu command2. Menu checkbox item EventMenu.handleItemStateChanged() - eval menu checkbox command
ScrollableImageCanvas - pseudoarray direct manipulation event handling1. Select spots invokes PopupRegistry current gene change 2. Select sample invokes PopupRegistry change current HP sample and Filter
16
2.6 2.6 Startup (name,value) ParametersStartup (name,value) Parameters::..mae mae file or Applet file or Applet PARAMsPARAMs
• The Config class contains many of the state variables (MAExplorer containsmost of the rest)
• The parameters are set in the Config class using the GetParam class to get(Name,Value) data definitions if they exist. They are defined in an overidehierarchy:
• 1) Parameters are initially defined by reading the Config file using theConfigTable class. If they are not defined, then either the variables are notdefined or use hardwired values
• 2.a) These are overidden using <APPLET> PARAM values if they exist whenusing an applet, or
• 2.s) They are overidden using (Name,Value) data from the .mae startup filewhen used in stand-alone mode
2.7 2.7 Data structuresData structures: hybridized samples (HP): hybridized samples (HP)
• The MaHybridSample class contains the un-normalized data for a particularsample read by MAExplorer. It uses a one-time instance of MaHPquantTableclass to read and parse the .quant data file
• The SampleSets class contains the working HP-X, HP-Y and HP-E lists ofMaMybridSample instances used by the data Filter. It also contains the menusample names (parsed from SamplesTable class by StageNames class)
• The HPxyData class contains the the current HP-X and HP-Y sample sets datafor a particular gene MID including the statistics for each set for use incomputations on a single gene across X-Y samples
• New set statistics are computed for a new MID using HPxyData.updateData()
17
2.7.1 2.7.1 Data structuresData structures: sample condition sets: sample condition sets
• The Condition class contains named lists of named hybridized samples
• These may be copied to the SampleSets data structure working lists for theHP-X set, HP-Y set and HP-E list
• It also contains ordered lists of Conditions that could be used with expressionlists of averaged samples
2.8 2.8 Data structuresData structures: spot data for genes: spot data for genes
• The SpotData is a data-only class holds the raw and normalized data copiedfrom a single Gene for a single sample
• The SpotData instance is loaded using the MaHybridSample.get…Data()methods. There are a number of different methods
• The SpotFeature class methods computes a pretty-print string summary line or3 lines for data for a single Gene for one HP, HP-(X,-Y), HP-(X,Y) ‘sets’, orHP-E
• This summary line is modified for single channel (F1 or F2) and (Cy3 or Cy5)intensity data or ratio data (Cy3/Cy5), HP-X/HP-Y etc. taking thenormalization mode into account
18
2.8.1 2.8.1 Data structuresData structures: lists of spot data for genes: lists of spot data for genes
• Arrays of a specific sample HP (F1,F2) (I.e. Cy3, Cy5) gene spot datapassing the data Filter are loaded using the MaHybridSample.getF1F2data()method
• Arrays of single HP-(X,Y) samples data passing the data Filter are accessedusing the CompositeDatabase.getHP_XandYdata() methods
• Arrays of sets of HP-(X,Y) data passing the data Filter are accessed using theCompositeDatabase.getHP_XandYsetData() method
2.9 2.9 Data structuresData structures: expression profile: expression profile
• The ExprProfile class contains the expression profile data structure for asingle gene
• Data may be changed using ExprProfile.updateData()
• The samples (HP1, …, HPn) used in the expression profile are defined by theHP-E list of samples with n = |HP-E|
• For intensity data from each sample j (j=1:n) for gene g (g=1:maxGenes) itcomputes: mean(j,g), stdDev(j,g), CV(j,g)
• Then ExprProfile instances serve as the data structure basis for otherexpression profile plot classes (ExprProfilePlot, ExprProfilePanel,ExprProfileScrollPane, ExprProfileCanvas, ExprProfileOverlay)
19
3. 3. MAExplorer GUIMAExplorer GUI: Graphical User Interface: Graphical User Interface• The initial GUI is created during startup using the MenuBarFrame class that is
a separate popup frame
• It creates the pull-down menu created by the class that is an instance of aMenuBar may is attached. This lets us use cascading menus for a reasonablyeasy to use look and feel
• The EventMenu class handles all events from the pull-down menu. It is themain dispatching area for calling the actual functionality to service theseevents
• Note: The instances of menu checkboxes are defined in MenuBarFrame butare used in EventMenu
• The MenuBarFrame also creates a control panel for buttons and messages atthe top
• Messages are written into status areas by the Util.showMsg() methods
3.1 3.1 MAExplorer GUIMAExplorer GUI: status messages and logging: status messages and logging
• Messages are written into status areas by the Util.showMsg() methods into thethree status lines at the top of the GUI
• If command history logging is enabled, then commands (from both the menuselections and clicking on genes etc.) are logged into a popup log window byUtil.saveCmdHistory()
• If message logging is enabled, then all messages that go to the status lines asare logged into a popup log window by Util.saveMsgHistory()
• The command history and message logging text may be saved into log files
20
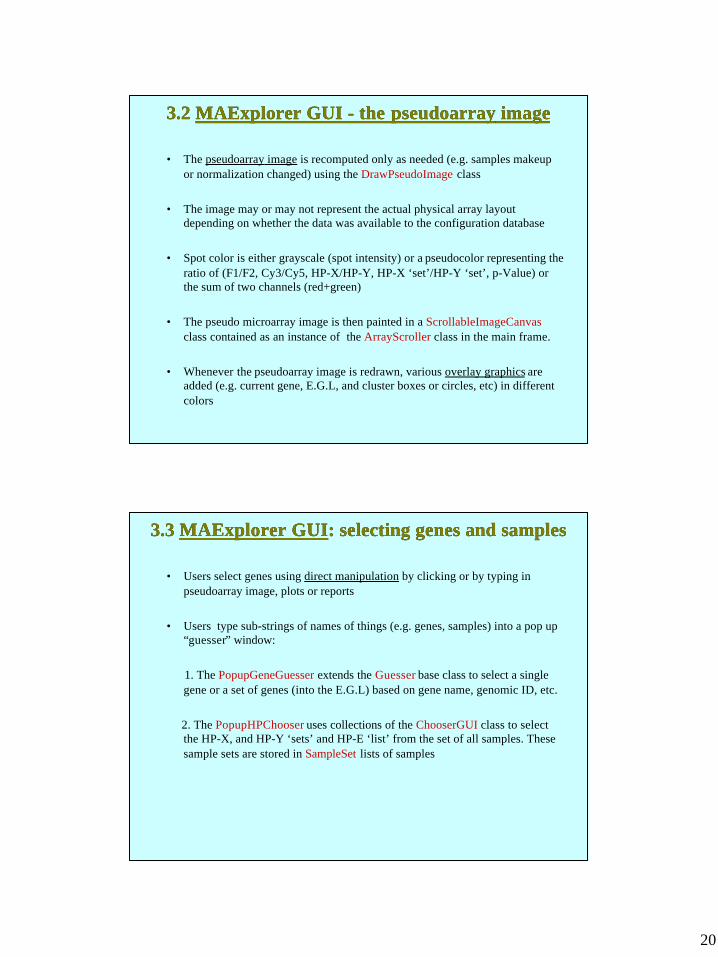
3.2 3.2 MAExplorer GUI - theMAExplorer GUI - the pseudoarray pseudoarray image image
• The pseudoarray image is recomputed only as needed (e.g. samples makeupor normalization changed) using the DrawPseudoImage class
• The image may or may not represent the actual physical array layoutdepending on whether the data was available to the configuration database
• Spot color is either grayscale (spot intensity) or a pseudocolor representing theratio of (F1/F2, Cy3/Cy5, HP-X/HP-Y, HP-X ‘set’/HP-Y ‘set’, p-Value) orthe sum of two channels (red+green)
• The pseudo microarray image is then painted in a ScrollableImageCanvasclass contained as an instance of the ArrayScroller class in the main frame.
• Whenever the pseudoarray image is redrawn, various overlay graphics areadded (e.g. current gene, E.G.L, and cluster boxes or circles, etc) in differentcolors
3.3 3.3 MAExplorer GUIMAExplorer GUI: selecting genes and samples: selecting genes and samples
• Users select genes using direct manipulation by clicking or by typing inpseudoarray image, plots or reports
• Users type sub-strings of names of things (e.g. genes, samples) into a pop up“guesser” window:
1. The PopupGeneGuesser extends the Guesser base class to select a singlegene or a set of genes (into the E.G.L) based on gene name, genomic ID, etc.
2. The PopupHPChooser uses collections of the ChooserGUI class to selectthe HP-X, and HP-Y ‘sets’ and HP-E ‘list’ from the set of all samples. Thesesample sets are stored in SampleSet lists of samples
21
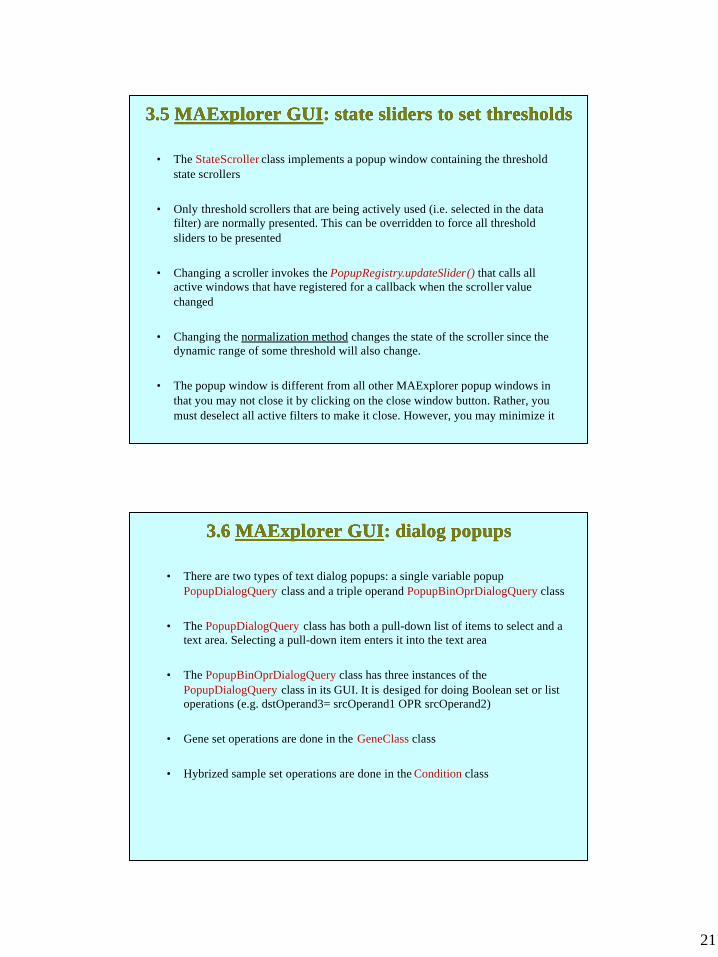
3.5 3.5 MAExplorer GUIMAExplorer GUI: state sliders to set thresholds: state sliders to set thresholds
• The StateScroller class implements a popup window containing the thresholdstate scrollers
• Only threshold scrollers that are being actively used (i.e. selected in the datafilter) are normally presented. This can be overridden to force all thresholdsliders to be presented
• Changing a scroller invokes the PopupRegistry.updateSlider() that calls allactive windows that have registered for a callback when the scroller valuechanged
• Changing the normalization method changes the state of the scroller since thedynamic range of some threshold will also change.
• The popup window is different from all other MAExplorer popup windows inthat you may not close it by clicking on the close window button. Rather, youmust deselect all active filters to make it close. However, you may minimize it
3.6 3.6 MAExplorer GUIMAExplorer GUI: dialog : dialog popupspopups
• There are two types of text dialog popups: a single variable popupPopupDialogQuery class and a triple operand PopupBinOprDialogQuery class
• The PopupDialogQuery class has both a pull-down list of items to select and atext area. Selecting a pull-down item enters it into the text area
• The PopupBinOprDialogQuery class has three instances of thePopupDialogQuery class in its GUI. It is desiged for doing Boolean set or listoperations (e.g. dstOperand3= srcOperand1 OPR srcOperand2)
• Gene set operations are done in the GeneClass class
• Hybrized sample set operations are done in the Condition class
22
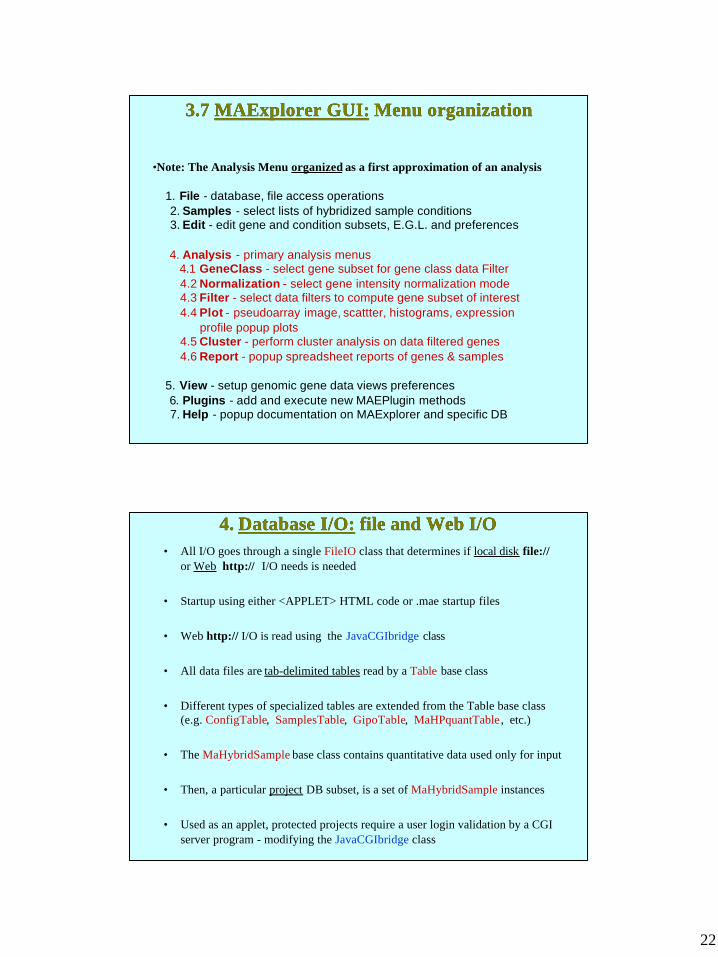
3.7 3.7 MAExplorer GUI:MAExplorer GUI: Menu organization Menu organization
•Note: The Analysis Menu organized as a first approximation of an analysis
1. File - database, file access operations 2. Samples - select lists of hybridized sample conditions 3. Edit - edit gene and condition subsets, E.G.L. and preferences
4. Analysis - primary analysis menus 4.1 GeneClass - select gene subset for gene class data Filter 4.2 Normalization - select gene intensity normalization mode 4.3 Filter - select data filters to compute gene subset of interest 4.4 Plot - pseudoarray image, scattter, histograms, expression profile popup plots 4.5 Cluster - perform cluster analysis on data filtered genes 4.6 Report - popup spreadsheet reports of genes & samples
5. View - setup genomic gene data views preferences 6. Plugins - add and execute new MAEPlugin methods 7. Help - popup documentation on MAExplorer and specific DB
4. 4. Database I/O:Database I/O: file and Web I/O file and Web I/O• All I/O goes through a single FileIO class that determines if local disk file://
or Web http:// I/O needs is needed
• Startup using either <APPLET> HTML code or .mae startup files
• Web http:// I/O is read using the JavaCGIbridge class
• All data files are tab-delimited tables read by a Table base class
• Different types of specialized tables are extended from the Table base class(e.g. ConfigTable, SamplesTable, GipoTable, MaHPquantTable, etc.)
• The MaHybridSample base class contains quantitative data used only for input
• Then, a particular project DB subset, is a set of MaHybridSample instances
• Used as an applet, protected projects require a user login validation by a CGIserver program - modifying the JavaCGIbridge class
23
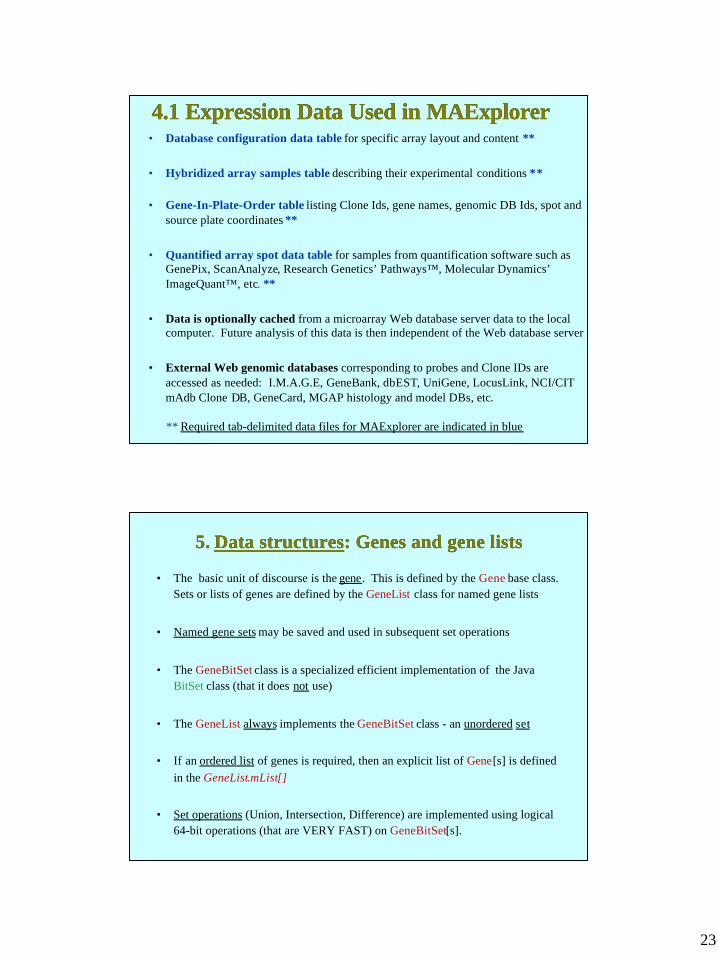
4.1 Expression Data Used in MAExplorer4.1 Expression Data Used in MAExplorer• Database configuration data table for specific array layout and content **
• Hybridized array samples table describing their experimental conditions **
• Gene-In-Plate-Order table listing Clone Ids, gene names, genomic DB Ids, spot andsource plate coordinates **
• Quantified array spot data table for samples from quantification software such asGenePix, ScanAnalyze, Research Genetics’ Pathways™, Molecular Dynamics’ImageQuant™, etc. **
• Data is optionally cached from a microarray Web database server data to the localcomputer. Future analysis of this data is then independent of the Web database server
• External Web genomic databases corresponding to probes and Clone IDs areaccessed as needed: I.M.A.G.E, GeneBank, dbEST, UniGene, LocusLink, NCI/CITmAdb Clone DB, GeneCard, MGAP histology and model DBs, etc.
** Required tab-delimited data files for MAExplorer are indicated in blue
5. 5. Data structuresData structures: Genes and gene lists: Genes and gene lists
• The basic unit of discourse is the gene. This is defined by the Gene base class.Sets or lists of genes are defined by the GeneList class for named gene lists
• Named gene sets may be saved and used in subsequent set operations
• The GeneBitSet class is a specialized efficient implementation of the JavaBitSet class (that it does not use)
• The GeneList always implements the GeneBitSet class - an unordered set
• If an ordered list of genes is required, then an explicit list of Gene[s] is definedin the GeneList.mList[]
• Set operations (Union, Intersection, Difference) are implemented using logical64-bit operations (that are VERY FAST) on GeneBitSet[s].
24
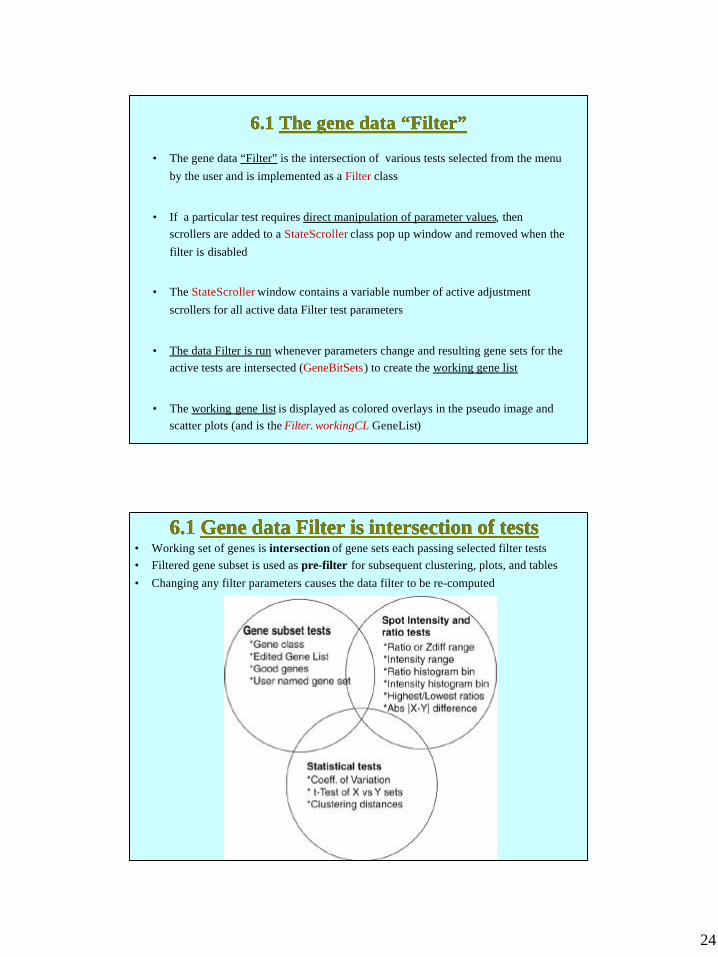
6.1 6.1 The gene data “Filter”The gene data “Filter”
• The gene data “Filter” is the intersection of various tests selected from the menuby the user and is implemented as a Filter class
• If a particular test requires direct manipulation of parameter values, thenscrollers are added to a StateScroller class pop up window and removed when thefilter is disabled
• The StateScroller window contains a variable number of active adjustmentscrollers for all active data Filter test parameters
• The data Filter is run whenever parameters change and resulting gene sets for theactive tests are intersected (GeneBitSets) to create the working gene list
• The working gene list is displayed as colored overlays in the pseudo image andscatter plots (and is the Filter. workingCL GeneList)
6.1 6.1 Gene data Filter is intersection of testsGene data Filter is intersection of tests• Working set of genes is intersection of gene sets each passing selected filter tests• Filtered gene subset is used as pre-filter for subsequent clustering, plots, and tables• Changing any filter parameters causes the data filter to be re-computed
25
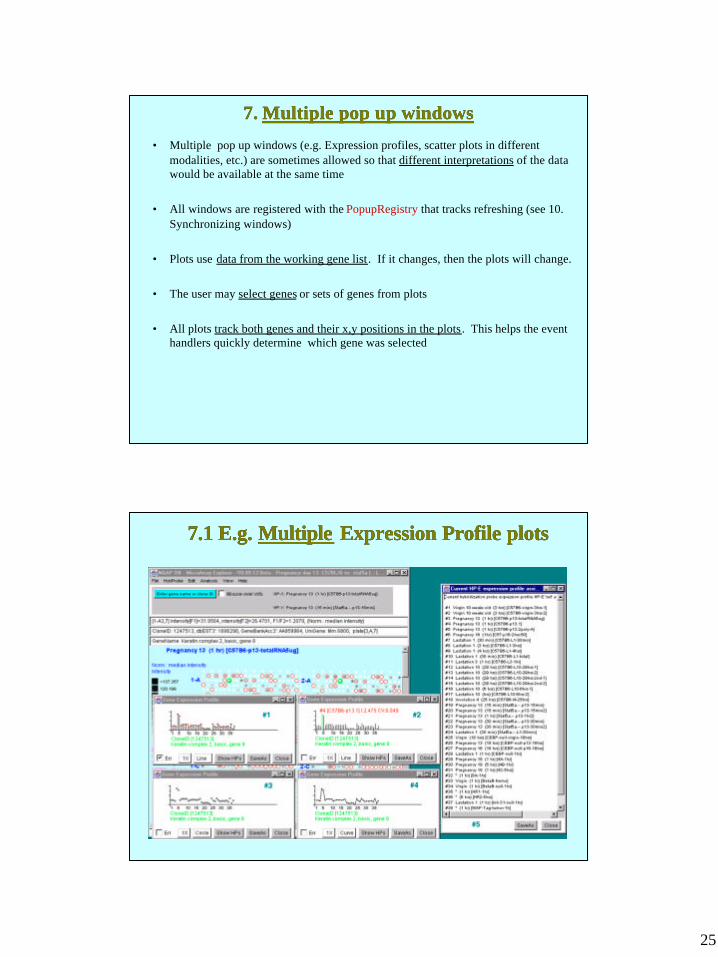
7. 7. Multiple pop up windowsMultiple pop up windows
• Multiple pop up windows (e.g. Expression profiles, scatter plots in differentmodalities, etc.) are sometimes allowed so that different interpretations of the datawould be available at the same time
• All windows are registered with the PopupRegistry that tracks refreshing (see 10.Synchronizing windows)
• Plots use data from the working gene list . If it changes, then the plots will change.
• The user may select genes or sets of genes from plots
• All plots track both genes and their x,y positions in the plots. This helps the eventhandlers quickly determine which gene was selected
7.1 E.g. 7.1 E.g. MultipleMultiple Expression Profile plots Expression Profile plots
26
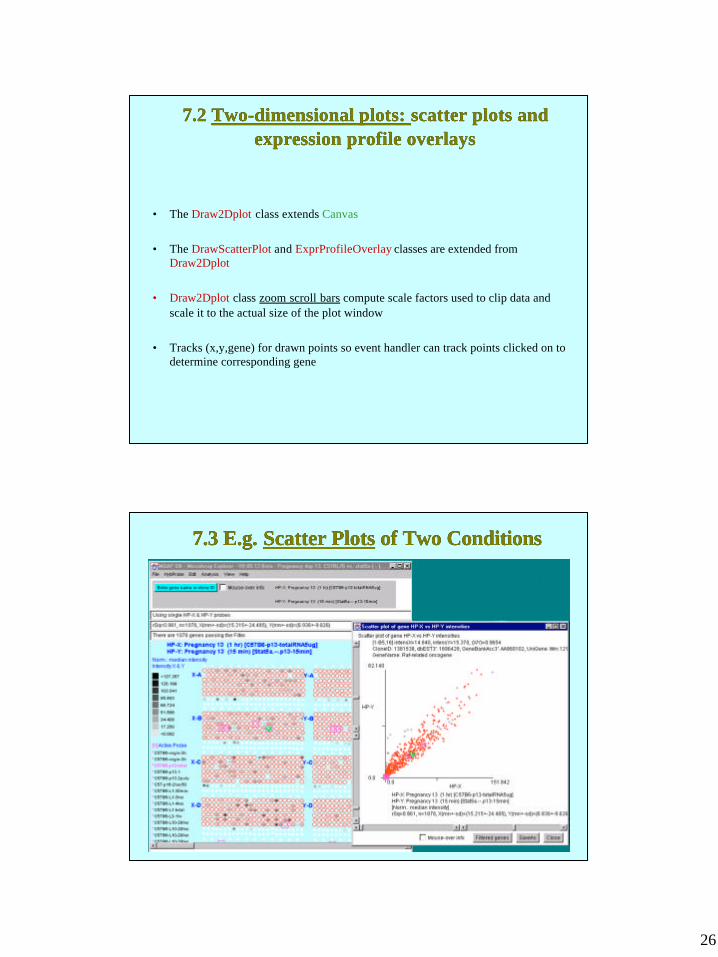
7.2 7.2 Two-dimensional plots: Two-dimensional plots: scatter plots andscatter plots andexpression profile overlaysexpression profile overlays
• The Draw2Dplot class extends Canvas
• The DrawScatterPlot and ExprProfileOverlay classes are extended fromDraw2Dplot
• Draw2Dplot class zoom scroll bars compute scale factors used to clip data andscale it to the actual size of the plot window
• Tracks (x,y,gene) for drawn points so event handler can track points clicked on todetermine corresponding gene
7.3 E.g. 7.3 E.g. Scatter PlotsScatter Plots of Two Conditions of Two Conditions
27
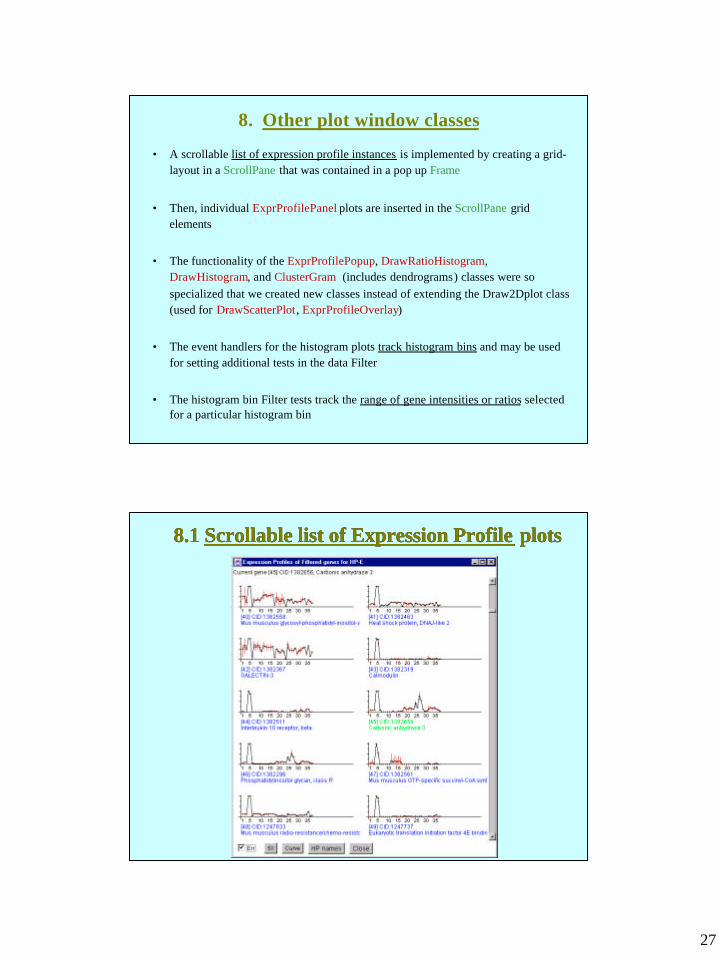
8. Other plot window classes
• A scrollable list of expression profile instances is implemented by creating a grid-layout in a ScrollPane that was contained in a pop up Frame
• Then, individual ExprProfilePanel plots are inserted in the ScrollPane gridelements
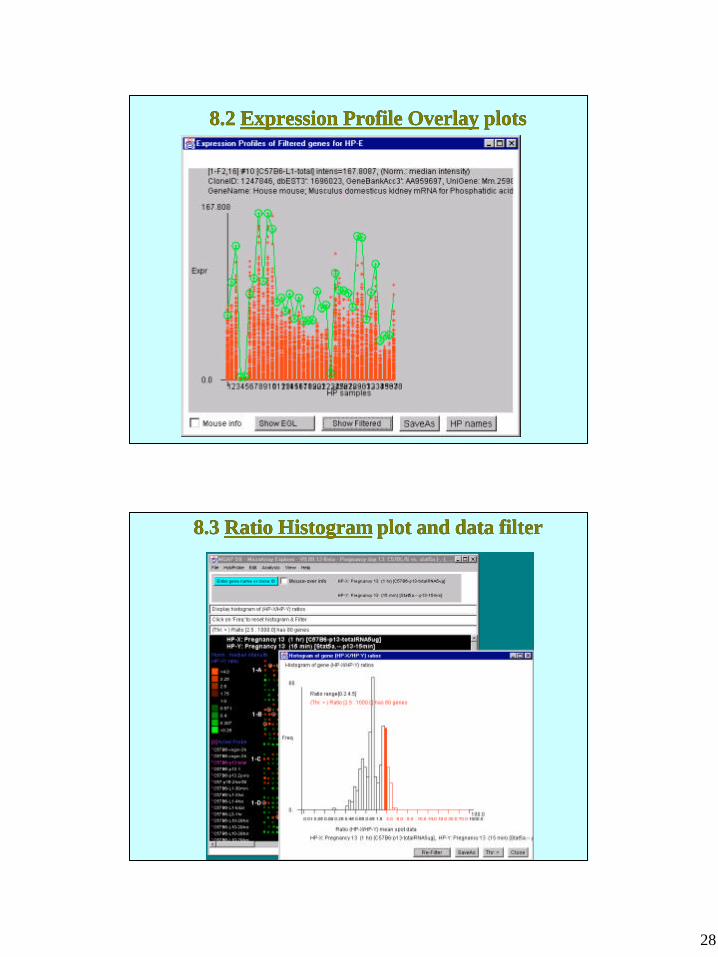
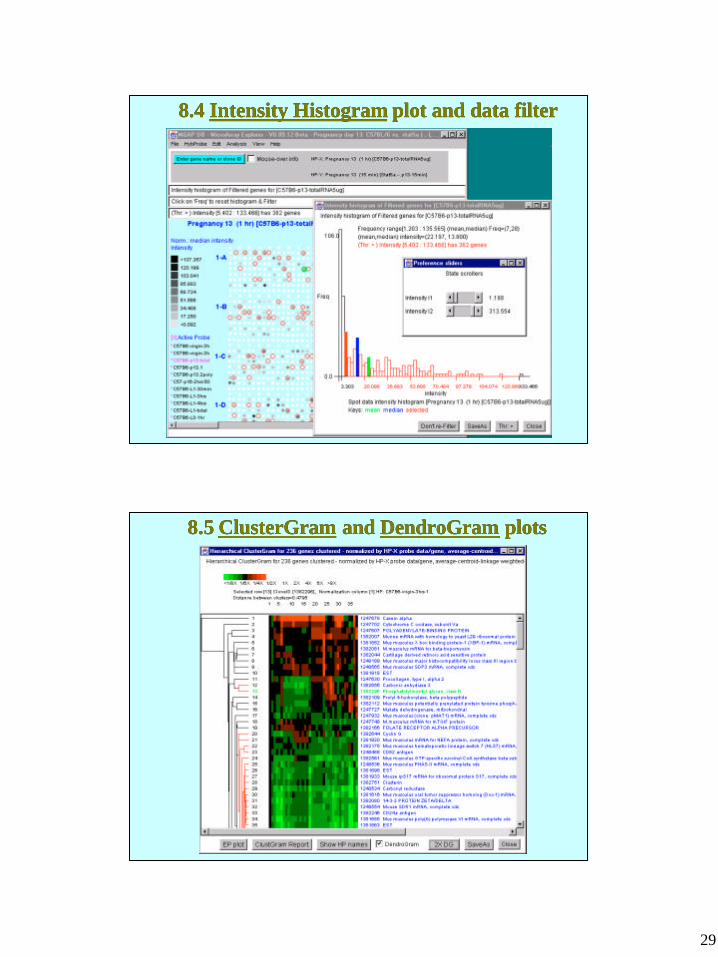
• The functionality of the ExprProfilePopup, DrawRatioHistogram,DrawHistogram, and ClusterGram (includes dendrograms) classes were sospecialized that we created new classes instead of extending the Draw2Dplot class(used for DrawScatterPlot, ExprProfileOverlay)
• The event handlers for the histogram plots track histogram bins and may be usedfor setting additional tests in the data Filter
• The histogram bin Filter tests track the range of gene intensities or ratios selectedfor a particular histogram bin
8.1 8.1 Scrollable list of Expression ProfileScrollable list of Expression Profile plots plots
28
8.2 8.2 Expression Profile OverlayExpression Profile Overlay plots plots
8.3 8.3 Ratio HistogramRatio Histogram plot and data filter plot and data filter
29
8.4 8.4 Intensity HistogramIntensity Histogram plot and data filter plot and data filter
8.58.5 ClusterGramClusterGram and and DendroGramDendroGram plots plots
30
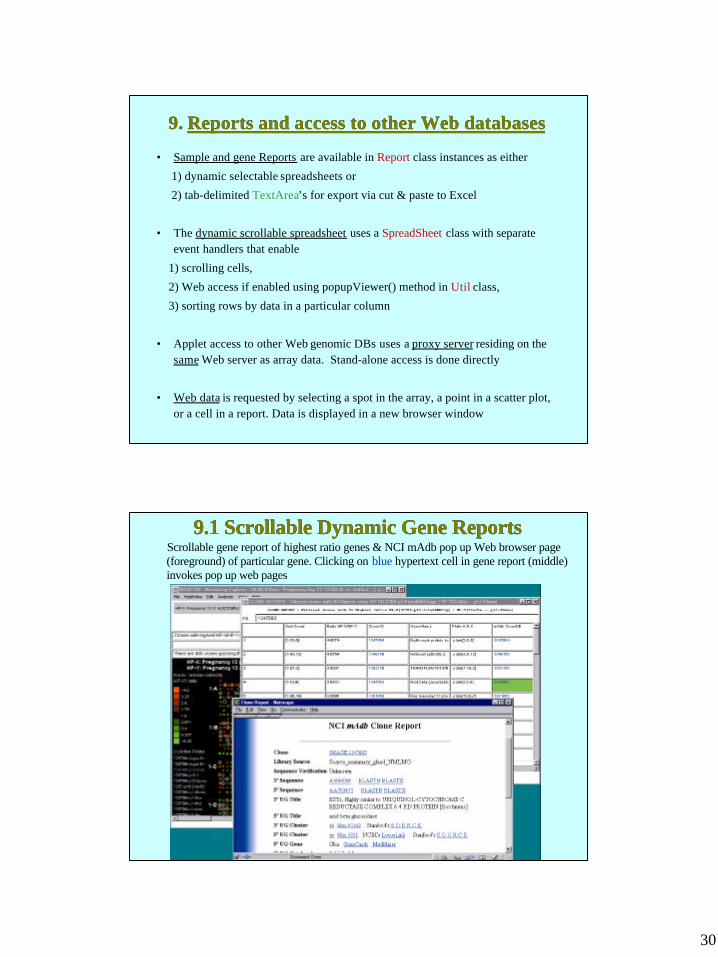
9. 9. Reports and access to other Web databasesReports and access to other Web databases
• Sample and gene Reports are available in Report class instances as either
1) dynamic selectable spreadsheets or
2) tab-delimited TextArea’s for export via cut & paste to Excel
• The dynamic scrollable spreadsheet uses a SpreadSheet class with separateevent handlers that enable
1) scrolling cells,
2) Web access if enabled using popupViewer() method in Util class,
3) sorting rows by data in a particular column
• Applet access to other Web genomic DBs uses a proxy server residing on thesame Web server as array data. Stand-alone access is done directly
• Web data is requested by selecting a spot in the array, a point in a scatter plot,or a cell in a report. Data is displayed in a new browser window
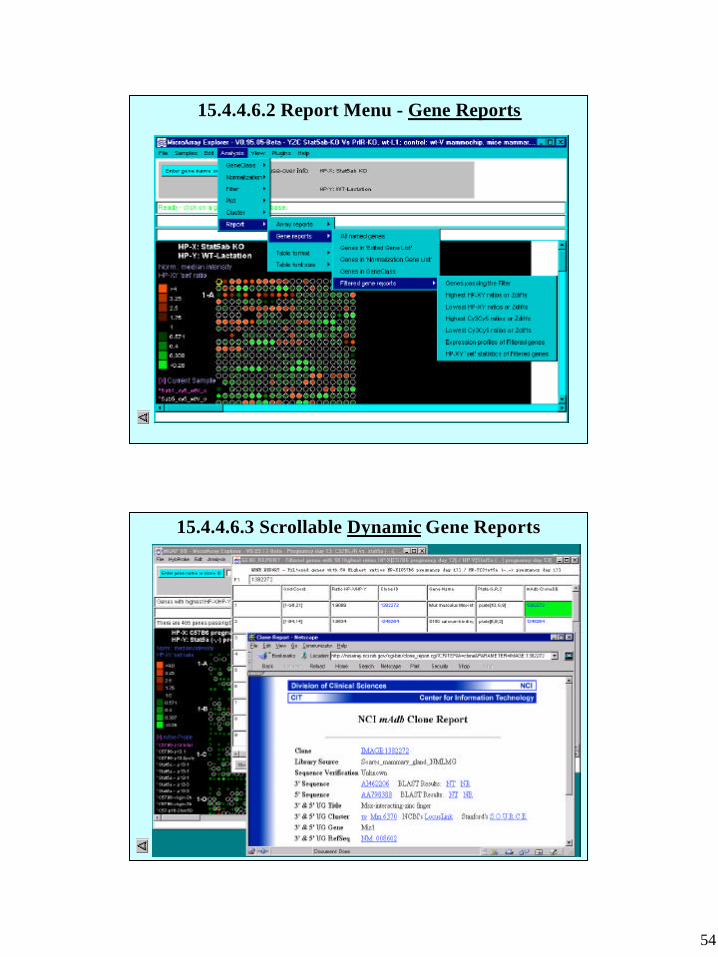
9.1 Scrollable Dynamic Gene Reports9.1 Scrollable Dynamic Gene Reports Scrollable gene report of highest ratio genes & NCI mAdb pop up Web browser page
(foreground) of particular gene. Clicking on blue hypertext cell in gene report (middle)invokes pop up web pages
31
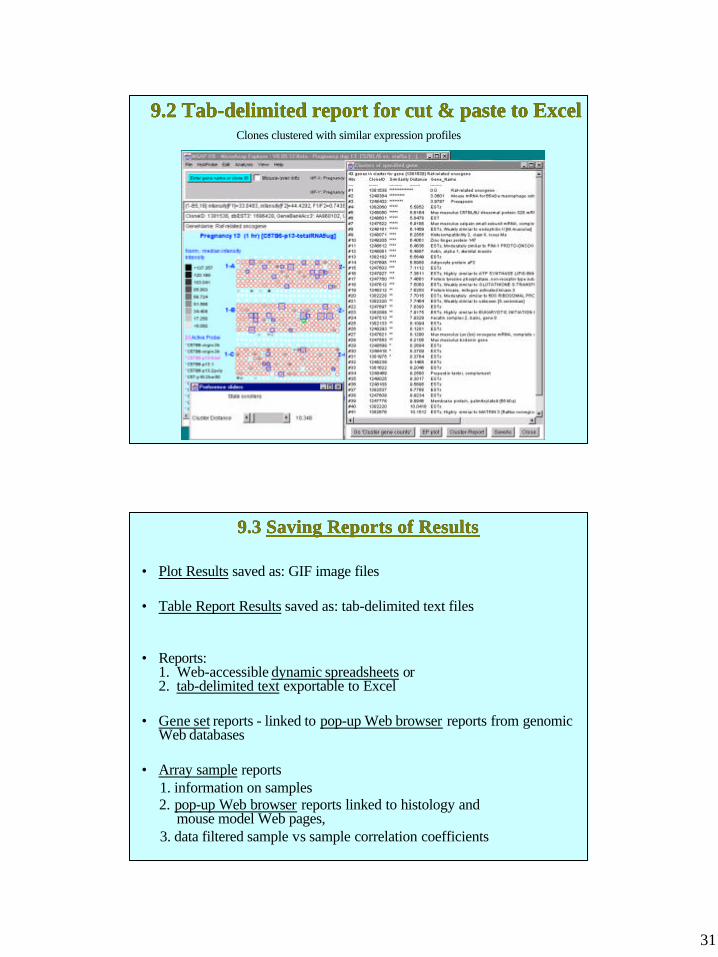
9.2 Tab-delimited report for cut & paste to Excel9.2 Tab-delimited report for cut & paste to ExcelClones clustered with similar expression profiles
9.3 9.3 Saving Reports of ResultsSaving Reports of Results
• Plot Results saved as: GIF image files
• Table Report Results saved as: tab-delimited text files
• Reports:1. Web-accessible dynamic spreadsheets or2. tab-delimited text exportable to Excel
• Gene set reports - linked to pop-up Web browser reports from genomicWeb databases
• Array sample reports 1. information on samples 2. pop-up Web browser reports linked to histology and
mouse model Web pages, 3. data filtered sample vs sample correlation coefficients
32
10. 10. Synchronizing WindowsSynchronizing Windows
• Direct manipulation of data in plots and reports is synchronized to highlightthe same current gene and Filtered genes if they are changed in any of thesewindows
• E.g. selecting (clicking on) a gene in the pseudo array image, scatter plots andgene report windows, will change it in the other visible windows
• The PopupRegistry class is used to register all windows when they arecreated, refresh them when the system state changes (normalization, Filter,current clone, E.G.L, etc.), and remove them when the user is finished withthem
• The system state changes if the current gene, current cluster, or Filter changes.The popup registry is called and in turn notifies all relevant plots and reportsthat the state has changed so they can update themselves if needed
10.1 10.1 PopupRegistryPopupRegistry plot types and callbacks plot types and callbacks
• Types of windows that may be registered with the PopupRegistry: 1. ShowPlotPopup for plot popups 2. ShowSpreadsheetPopup for dynamic spreadsheet report popups 3. ShowStringPopup for String report popups 4. ShowExprProfilesPopup for expression profile Expression Profile popups 5. MAEPluginUpdateListener for active MAEPlugins 6. Object also for active Popup Window Object's Object
• Types of callback methods available for registered popup windows 1. updateCurGene(mid) if the current gene has changed to mid 2. updateFilter(gene list) if data filter has changed the working gene list 3. updateSlider() if any threshold slider has changed 4. updateLabels() if any label names (eg. Class names,etc) have changed
33
11. Saving text & plot windows to .11. Saving text & plot windows to .txttxt & . & .gifgif files files• Text popup windows are written out in stand-alone mode as tab-delimited .txt
files when servicing SaveAs commands. Data is written usingFileIO.writeFileToDisk()
• Later, tab-delimited text files may be read into Excel
• The WriteGifEncoder class is used to convert repainted Images to Gifencoded .gif files in stand-alone mode when servicing “SaveAs” commands inplot windows
• All .txt and .gif files saved by the user doing a “SaveAs” command are savedin the /Report directory
12. 12. MAExplorer stateMAExplorer state: Saving and Restoring: Saving and Restoring
• The UpdateState class is used to read and write state information filesincluding: .mae state startup files, .cbs GeneBitSet files, .hpl SampleSet files
• All .mae files are saved in the /MAE directory
• All .cbs and .hpl files are saved in the /State directory
• The UpdateState.readMAEstartupFile() method is used to read the specified.mae startup file. This overides (Name,Value) pairs setup initially through theConfig class
• When (File | Databases | SaveAs … DB) is invoked, it writes out the currentstate with UpdateState.writeMAEstartupFile() method. This puts the names ofthe current .cbs and .hpl files in the .mae file - not the data itself. Then itwrites out the .cbs and .hpl files
34
13. 13. Miscellaneous ClassesMiscellaneous Classes
• The MathMAE class contains various specialized math functions
• The Statistics class contains various specialized statistics and probabilityfunctions (t-test, etc)
• The SortMAE class contains various sorting methods specific for MAExplorer
• The Util class contains various utility methods uses in multiple modules fordata structure conversion, display, string conversion, colormap conversion,etc.
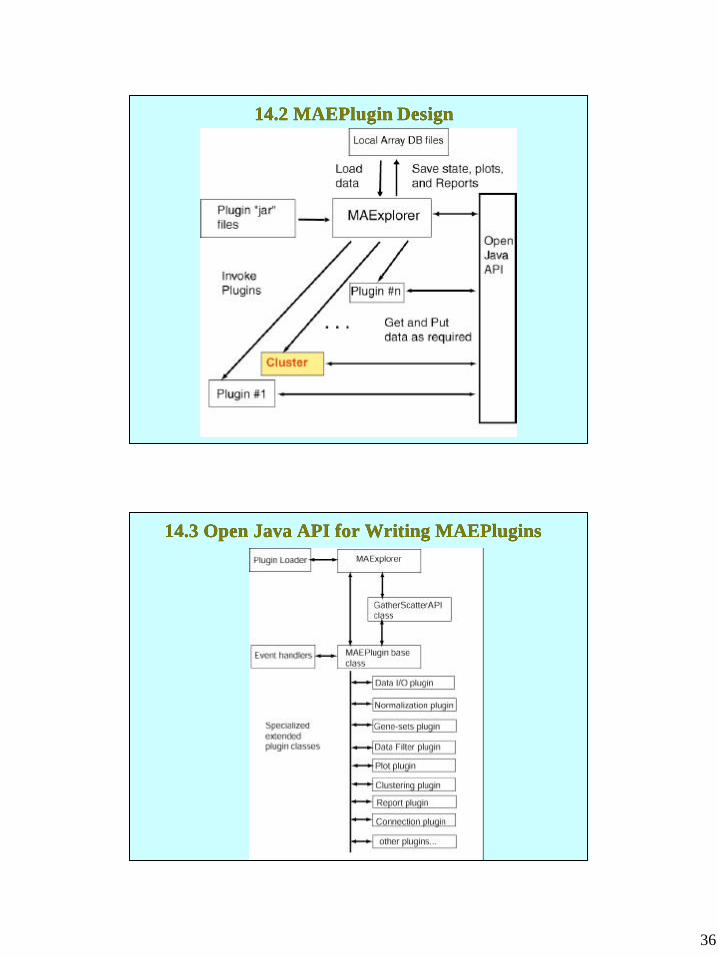
14. 14. MAEPluginMAEPlugin Paradigm Paradigm
• Plugins are installed and dynamically loaded when MAExplorer startsor when it is running using the MAEPlugin class and package
• Plugins are invoked from pull-down menus
• Client-server plugins may invoke MAExplorer from other programs orvice versa
• Plugins may access any MAExplorer data structures, but in a portablestructured way using the MaeJavaAPI and MJAxxxx classes (OpenJava API)
• Plugins may provide their own GUI interfaces or save data back intoMAExplorer and use it’s plot and report capabilities
35
14.1 MAEPlugin Extensions for MAExplorer14.1 MAEPlugin Extensions for MAExplorer
• Java plugins allow investigators to extend capabilities of coreMAExplorer program to new analysis methods
• Web site contents: Open Java API, Java open-source examples, donatedplugins & links will be published and freely available
• MAEPlugin types: normalization, metrics, Filters, PCA, clustering,client-server, functional genomic analysis of cluster results, etc.
• MAEPlugins will have three types of implementations:1. Using 100% Java code2. Access local programs written in any language (e.g. ‘R’)3. Web-CGI or client-server to specialized genomic DBs
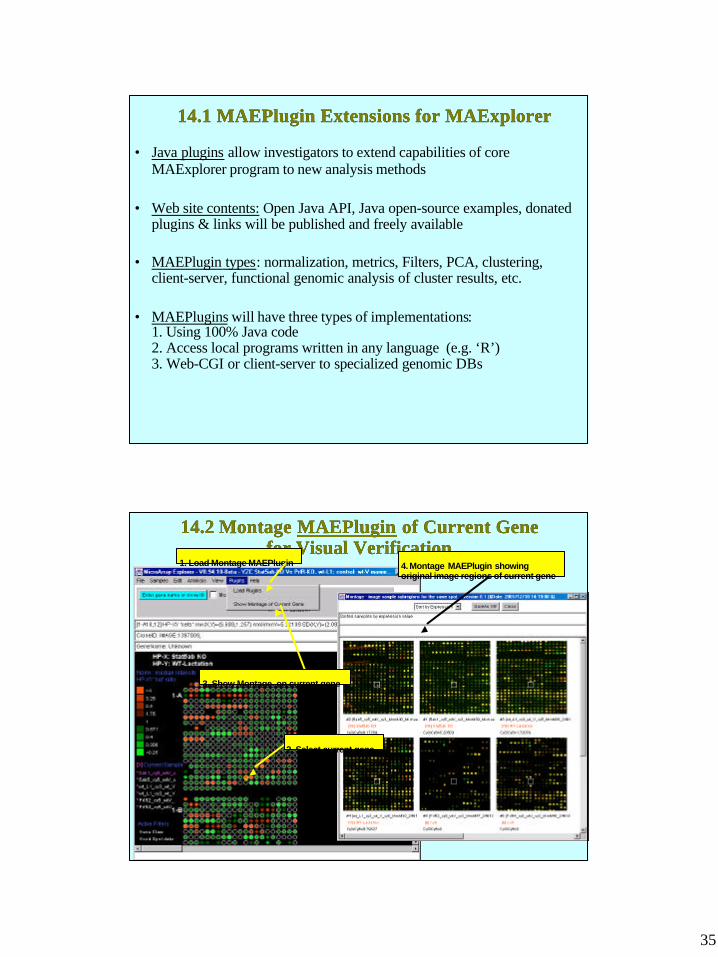
14.2 Montage 14.2 Montage MAEPluginMAEPlugin of Current Gene of Current Genefor Visual Verificationfor Visual Verification
1. Load Montage MAEPlugin
2. Select current gene
3. Show Montage on current gene
4. Montage MAEPlugin showingoriginal image regions of current gene
36
14.2 14.2 MAEPluginMAEPlugin Design Design
14.3 Open Java API for Writing MAEPlugins14.3 Open Java API for Writing MAEPlugins
37
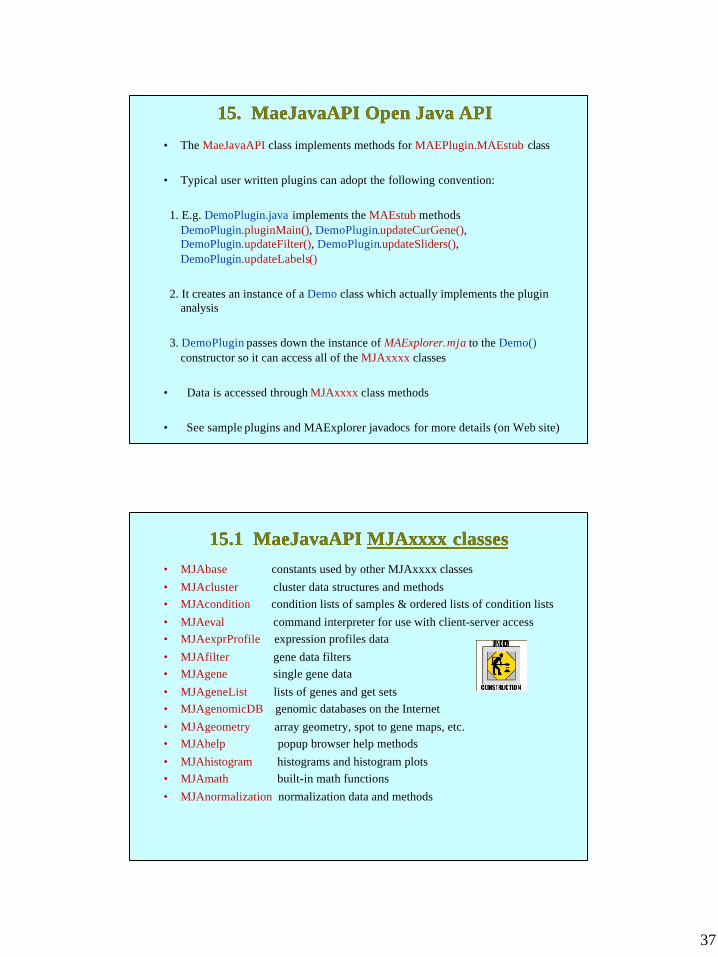
15. 15. MaeJavaAPI MaeJavaAPI Open Java APIOpen Java API
• The MaeJavaAPI class implements methods for MAEPlugin.MAEstub class
• Typical user written plugins can adopt the following convention:
1. E.g. DemoPlugin.java implements the MAEstub methodsDemoPlugin.pluginMain(), DemoPlugin.updateCurGene(),DemoPlugin.updateFilter(), DemoPlugin.updateSliders(),DemoPlugin.updateLabels()
2. It creates an instance of a Demo class which actually implements the pluginanalysis
3. DemoPlugin passes down the instance of MAExplorer.mja to the Demo()constructor so it can access all of the MJAxxxx classes
• Data is accessed through MJAxxxx class methods
• See sample plugins and MAExplorer javadocs for more details (on Web site)
• MJAbase constants used by other MJAxxxx classes• MJAcluster cluster data structures and methods• MJAcondition condition lists of samples & ordered lists of condition lists• MJAeval command interpreter for use with client-server access• MJAexprProfile expression profiles data• MJAfilter gene data filters• MJAgene single gene data• MJAgeneList lists of genes and get sets• MJAgenomicDB genomic databases on the Internet• MJAgeometry array geometry, spot to gene maps, etc.• MJAhelp popup browser help methods• MJAhistogram histograms and histogram plots• MJAmath built-in math functions• MJAnormalization normalization data and methods
15.1 15.1 MaeJavaAPI MaeJavaAPI MJAxxxxMJAxxxx classes classes
38
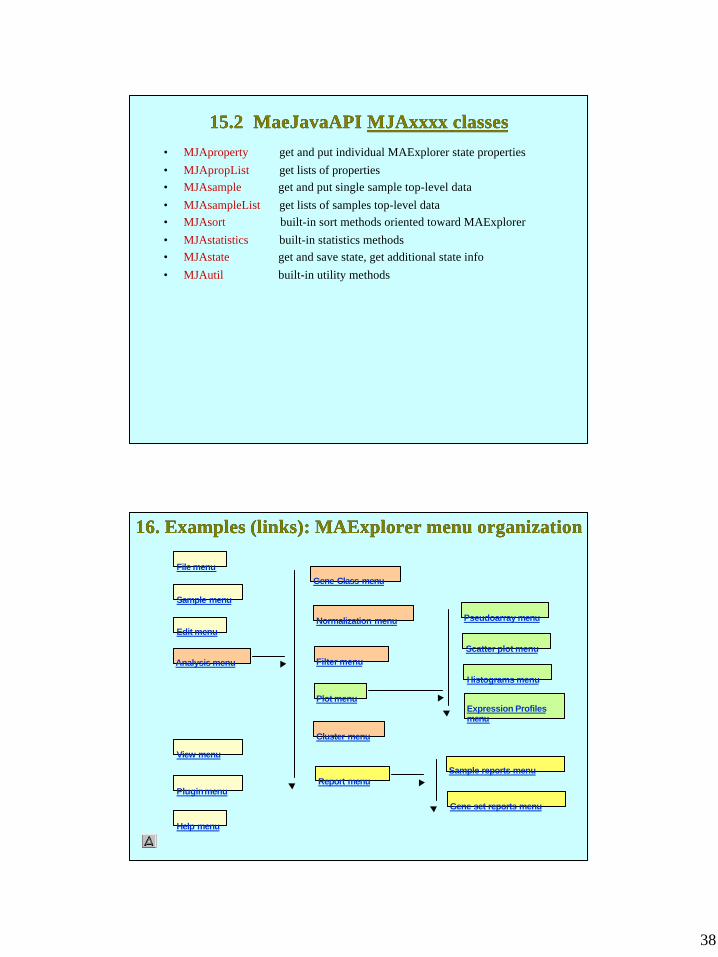
15.2 15.2 MaeJavaAPI MaeJavaAPI MJAxxxx MJAxxxx classesclasses• MJAproperty get and put individual MAExplorer state properties• MJApropList get lists of properties• MJAsample get and put single sample top-level data• MJAsampleList get lists of samples top-level data• MJAsort built-in sort methods oriented toward MAExplorer• MJAstatistics built-in statistics methods• MJAstate get and save state, get additional state info• MJAutil built-in utility methods
16. Examples (links): MAExplorer menu organization16. Examples (links): MAExplorer menu organization
File menu
Gene Class menu
Sample menu
Edit menu
Analysis menu
View menu
Plugin menu
Plot menu
Help menu
Normalization menu
Cluster menu
Pseudoarray menu
Report menu
Scatter plot menu
Histograms menu
Expression Profilesmenu
Sample reports menu
Gene set reports menu
Filter menu
39
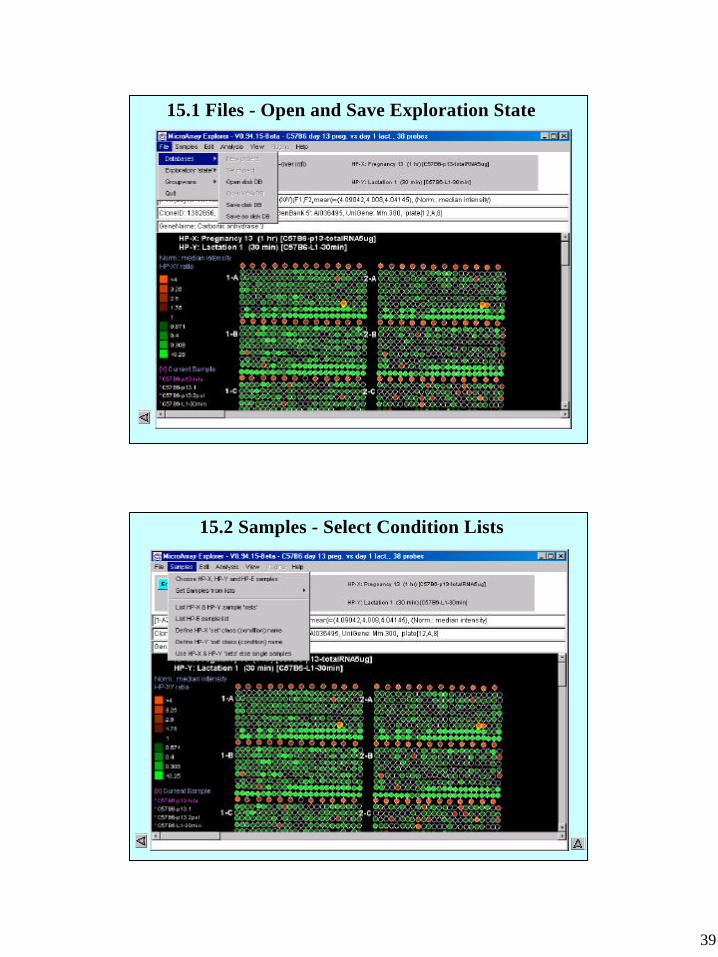
15.1 Files - Open and Save Exploration State15.1 Files - Open and Save Exploration State
15.2 Samples - Select Condition Lists
40
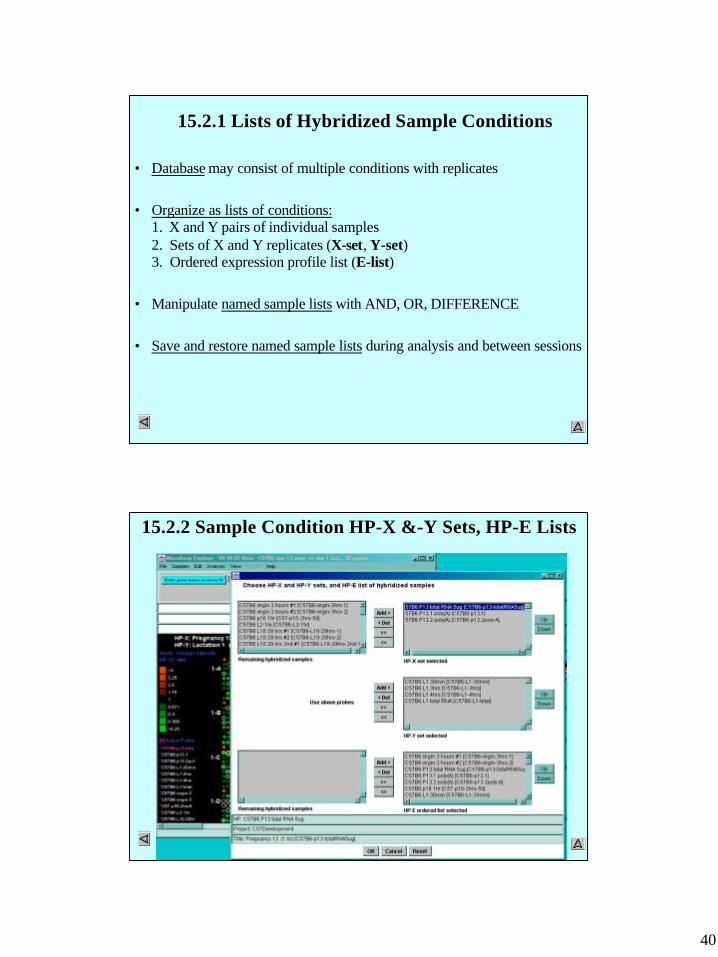
15.2.1 Lists of Hybridized Sample Conditions
• Database may consist of multiple conditions with replicates
• Organize as lists of conditions:1. X and Y pairs of individual samples2. Sets of X and Y replicates (X-set, Y-set)3. Ordered expression profile list (E-list)
• Manipulate named sample lists with AND, OR, DIFFERENCE
• Save and restore named sample lists during analysis and between sessions
15.2.2 Sample Condition HP-X &-Y Sets, HP-E Lists
41
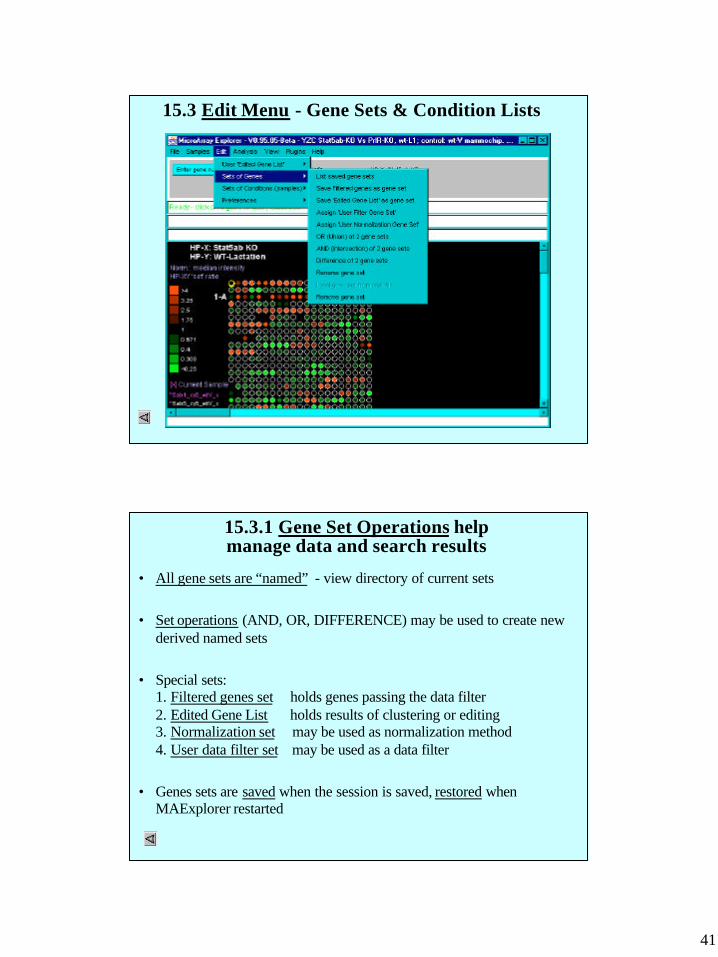
15.3 Edit Menu - Gene Sets & Condition Lists
15.3.1 Gene Set Operations helpmanage data and search results
• All gene sets are “named” - view directory of current sets
• Set operations (AND, OR, DIFFERENCE) may be used to create newderived named sets
• Special sets:1. Filtered genes set holds genes passing the data filter2. Edited Gene List holds results of clustering or editing3. Normalization set may be used as normalization method4. User data filter set may be used as a data filter
• Genes sets are saved when the session is saved, restored whenMAExplorer restarted
42
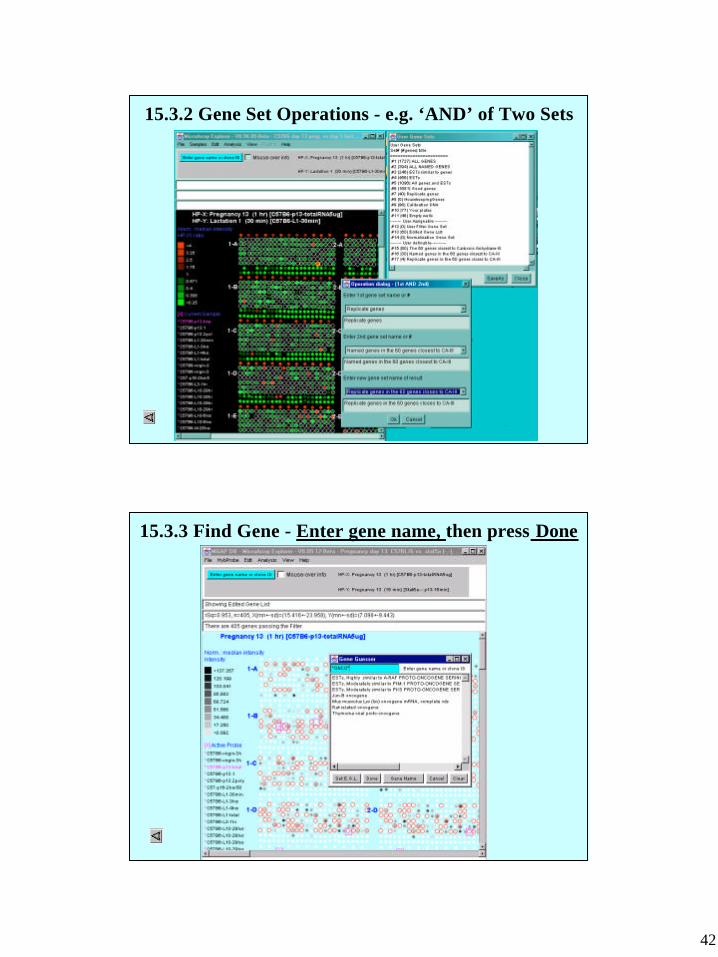
15.3.2 Gene Set Operations - e.g. ‘AND’ of Two Sets
15.3.3 Find Gene - Enter gene name, then press Done
43
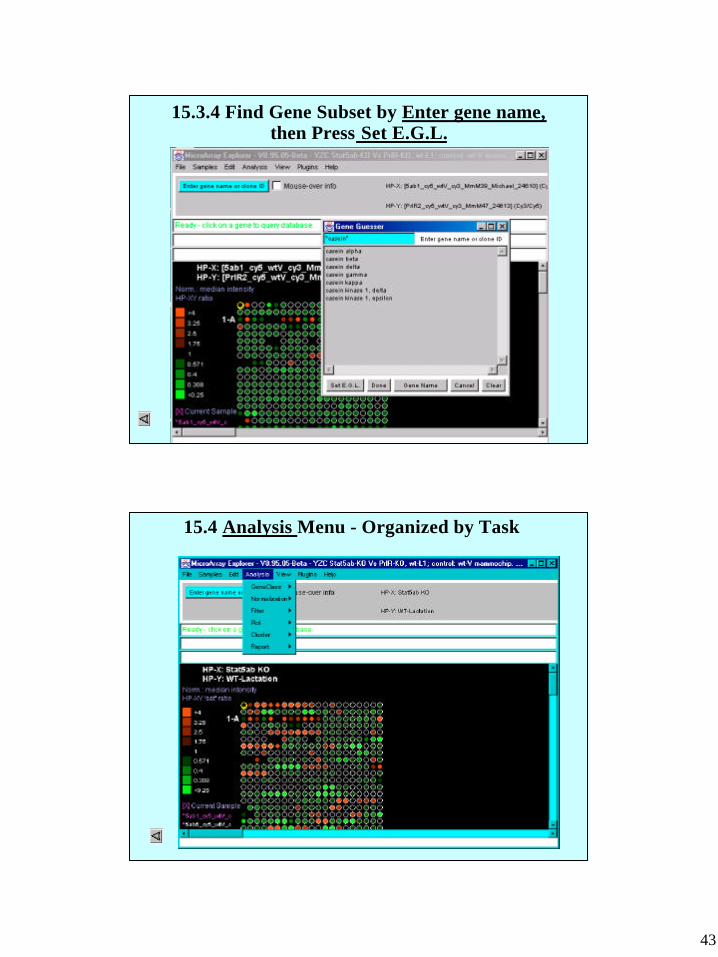
15.3.4 Find Gene Subset by Enter gene name,then Press Set E.G.L.
15.4 Analysis Menu - Organized by Task
44
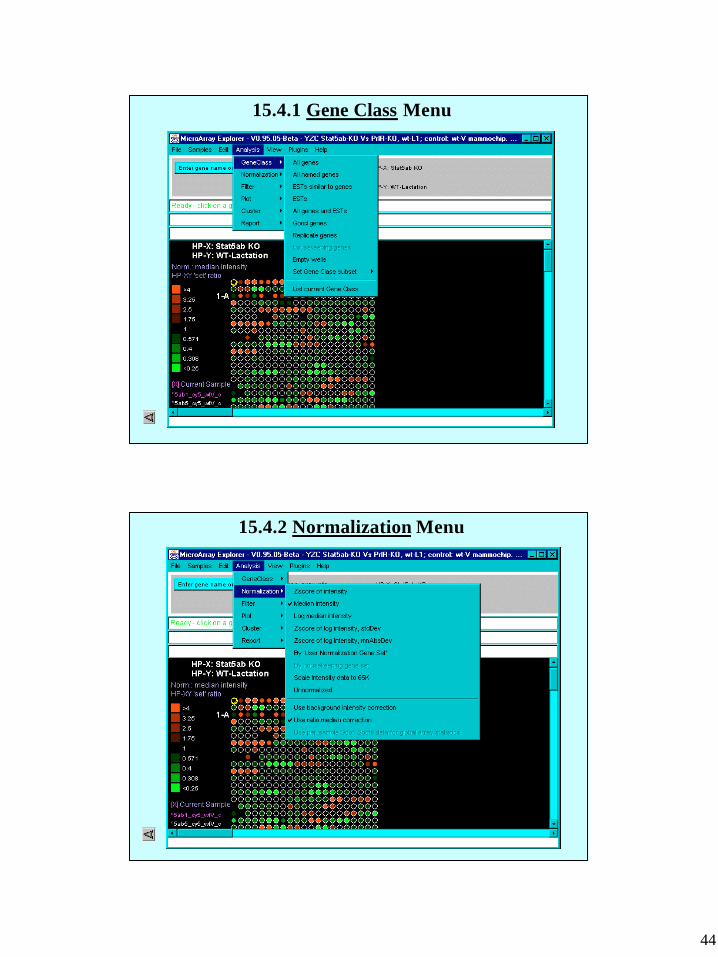
15.4.1 Gene Class Menu
15.4.2 Normalization Menu
45
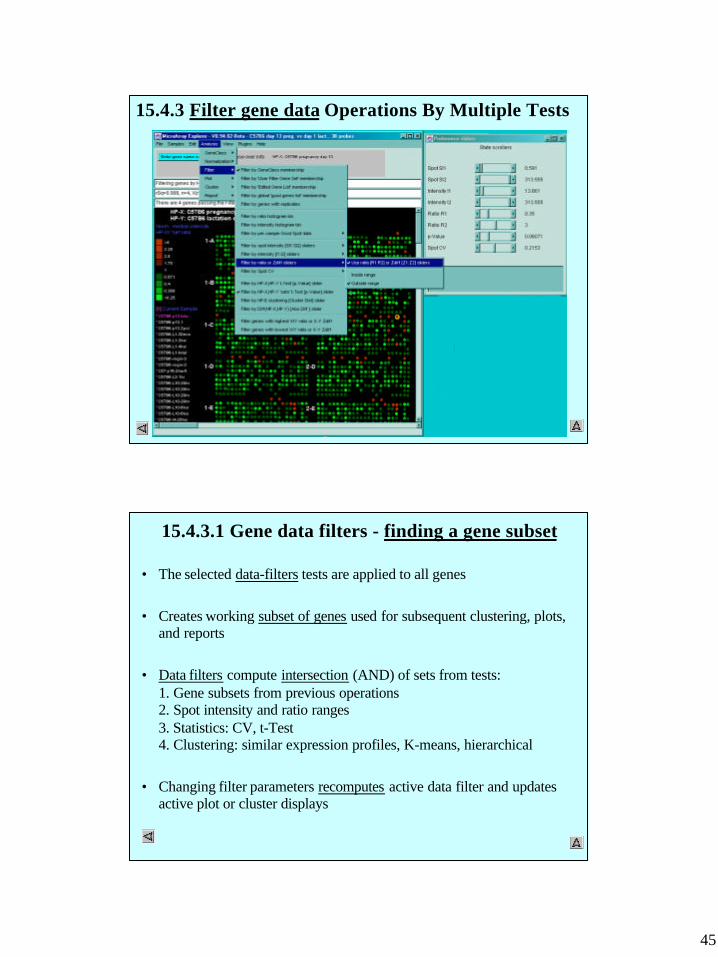
15.4.3 Filter gene data Operations By Multiple Tests
15.4.3.1 Gene data filters - finding a gene subset
• The selected data-filters tests are applied to all genes
• Creates working subset of genes used for subsequent clustering, plots,and reports
• Data filters compute intersection (AND) of sets from tests:1. Gene subsets from previous operations2. Spot intensity and ratio ranges3. Statistics: CV, t-Test4. Clustering: similar expression profiles, K-means, hierarchical
• Changing filter parameters recomputes active data filter and updatesactive plot or cluster displays
46
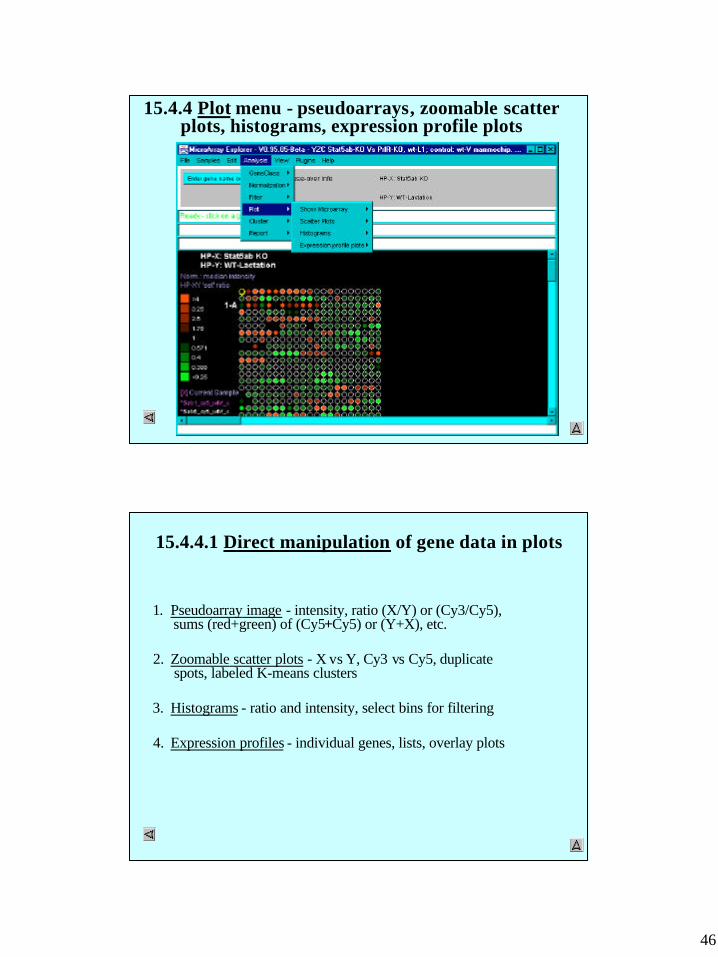
15.4.4 Plot menu - pseudoarrays, zoomable scatterplots, histograms, expression profile plots
15.4.4.1 Direct manipulation of gene data in plots
1. Pseudoarray image - intensity, ratio (X/Y) or (Cy3/Cy5), sums (red+green) of (Cy5+Cy5) or (Y+X), etc.
2. Zoomable scatter plots - X vs Y, Cy3 vs Cy5, duplicate spots, labeled K-means clusters
3. Histograms - ratio and intensity, select bins for filtering
4. Expression profiles - individual genes, lists, overlay plots
47
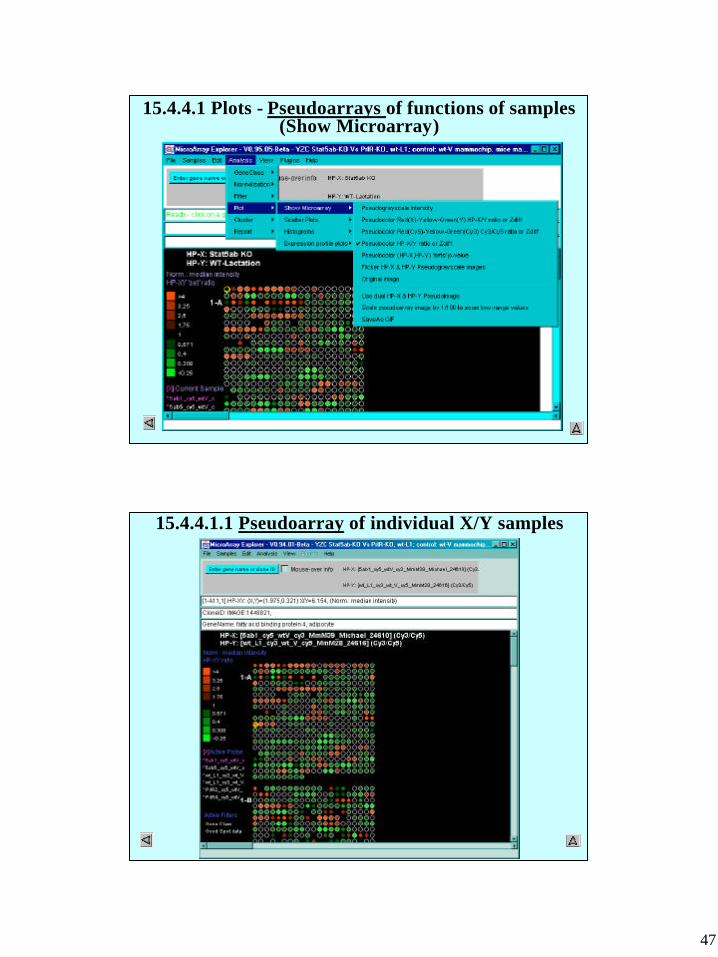
15.4.4.1 Plots - Pseudoarrays of functions of samples(Show Microarray)
15.4.4.1.1 Pseudoarray of individual X/Y samples
48
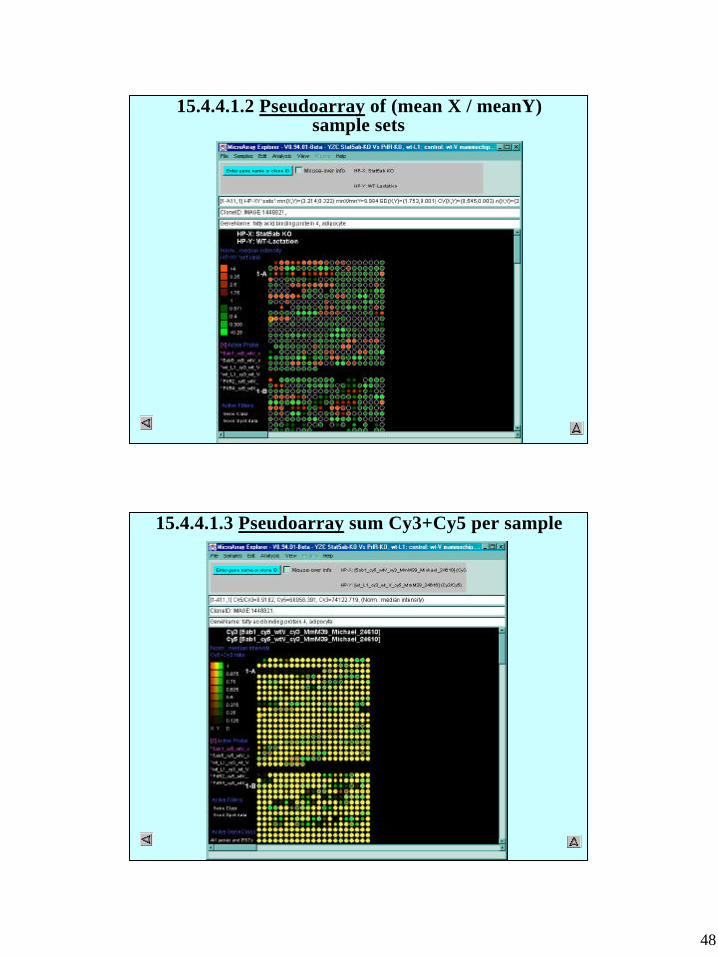
15.4.4.1.2 Pseudoarray of (mean X / meanY)sample sets
15.4.4.1.3 Pseudoarray sum Cy3+Cy5 per sample
49
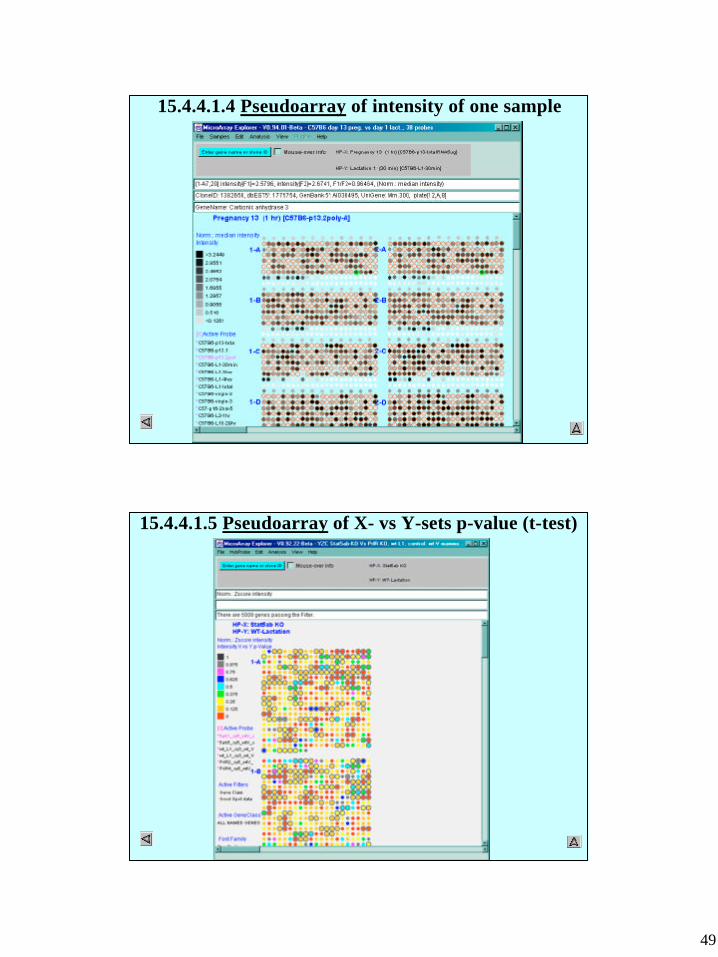
15.4.4.1.4 Pseudoarray of intensity of one sample
15.4.4.1.5 Pseudoarray of X- vs Y-sets p-value (t-test)
50
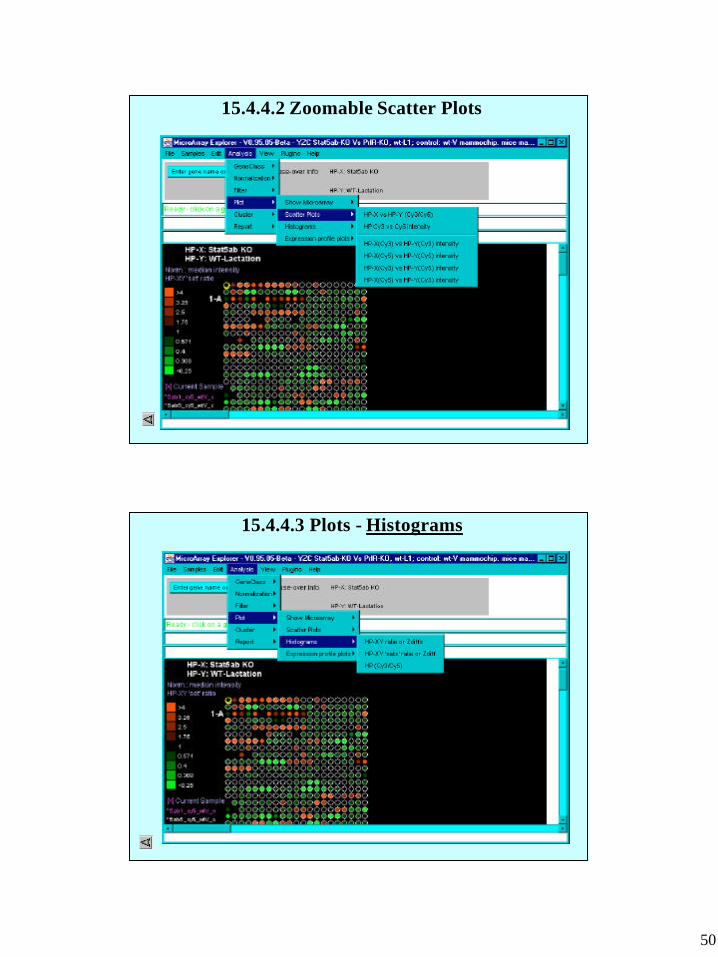
15.4.4.2 Zoomable Scatter Plots
15.4.4.3 Plots - Histograms
51
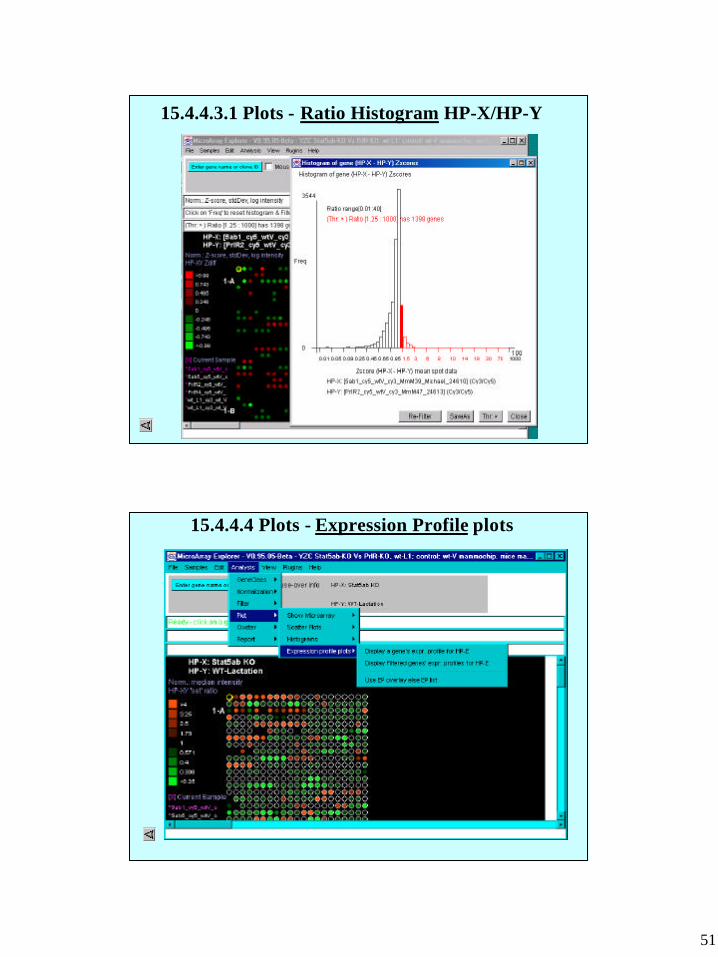
15.4.4.3.1 Plots - Ratio Histogram HP-X/HP-Y
15.4.4.4 Plots - Expression Profile plots
52
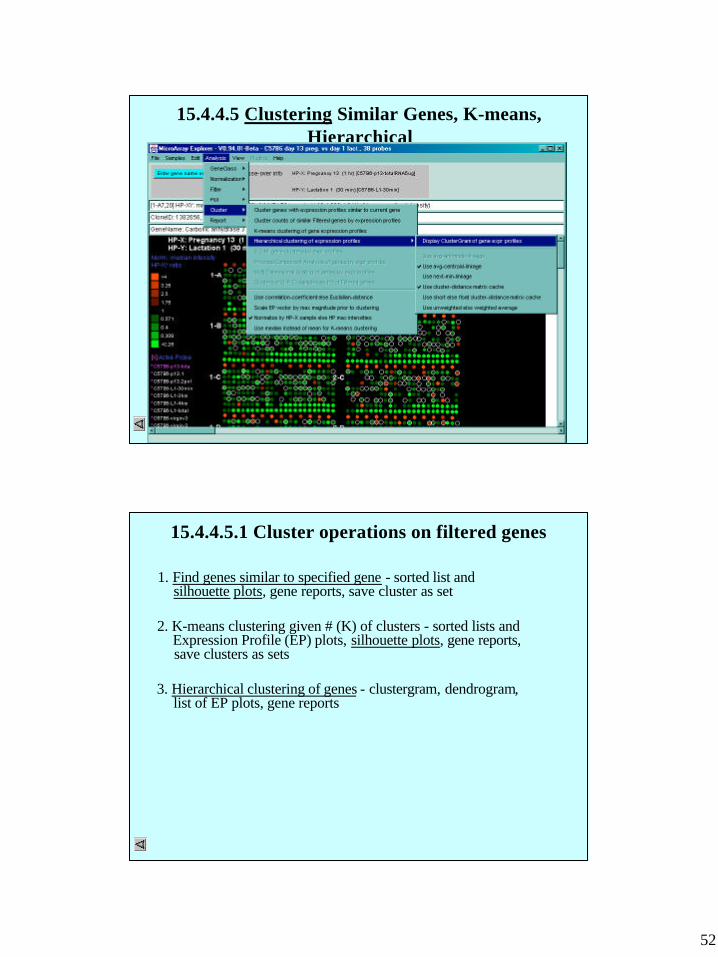
15.4.4.5 Clustering Similar Genes, K-means,Hierarchical
15.4.4.5.1 Cluster operations on filtered genes
1. Find genes similar to specified gene - sorted list and silhouette plots, gene reports, save cluster as set
2. K-means clustering given # (K) of clusters - sorted lists and Expression Profile (EP) plots, silhouette plots, gene reports, save clusters as sets
3. Hierarchical clustering of genes - clustergram, dendrogram, list of EP plots, gene reports
53
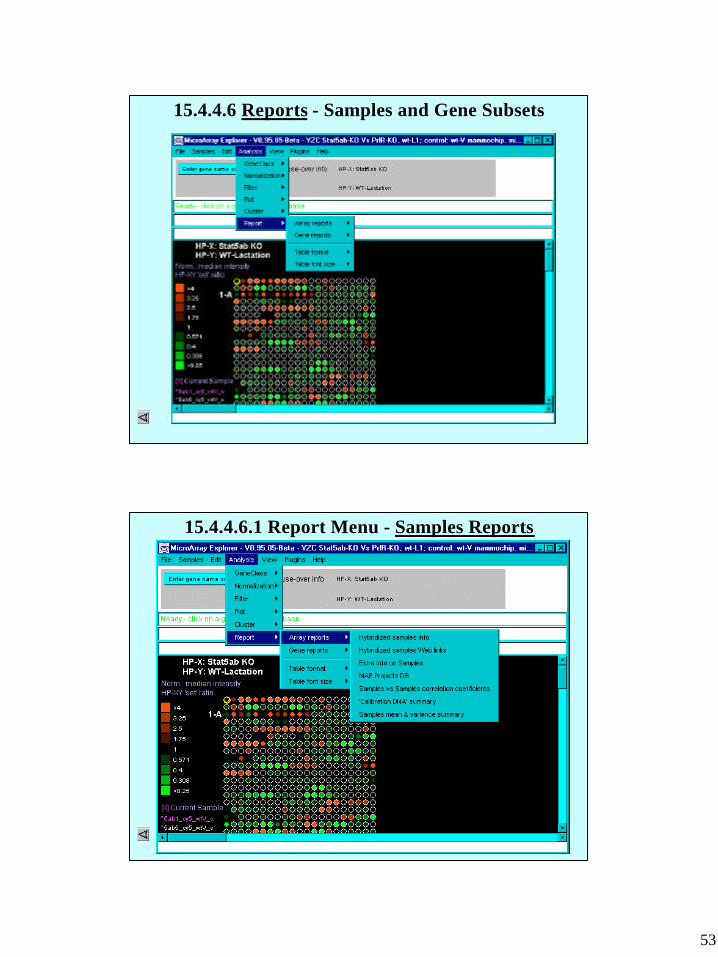
15.4.4.6 Reports - Samples and Gene Subsets
15.4.4.6.1 Report Menu - Samples Reports
54
15.4.4.6.2 Report Menu - Gene Reports
15.4.4.6.3 Scrollable Scrollable DynamicDynamic Gene Reports Gene Reports
55
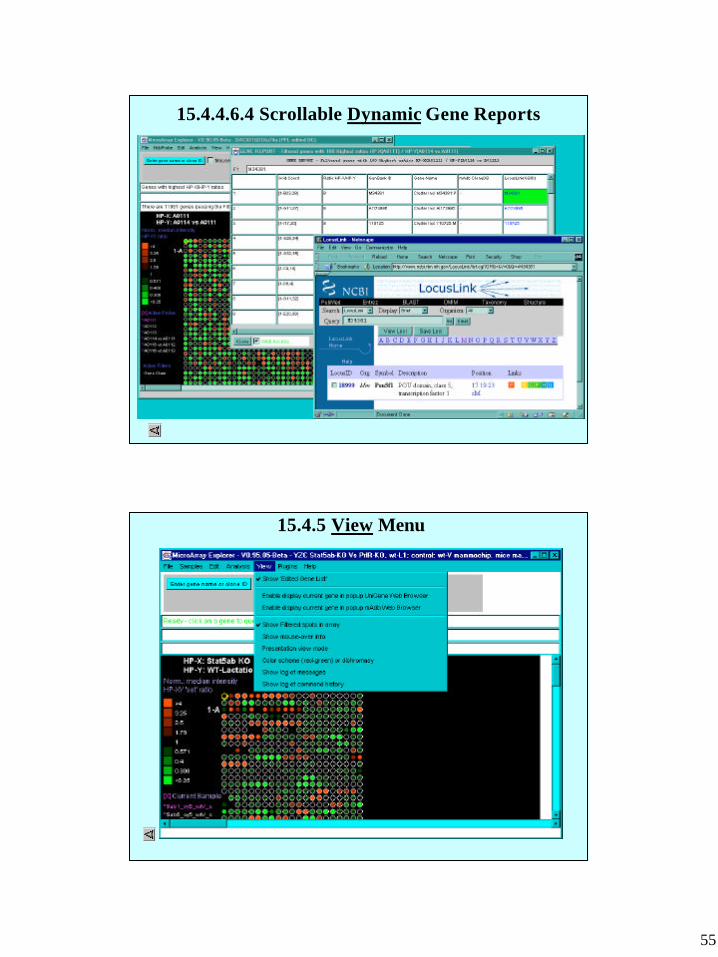
15.4.4.6.4 Scrollable Dynamic Gene Reports
15.4.5 View Menu
56
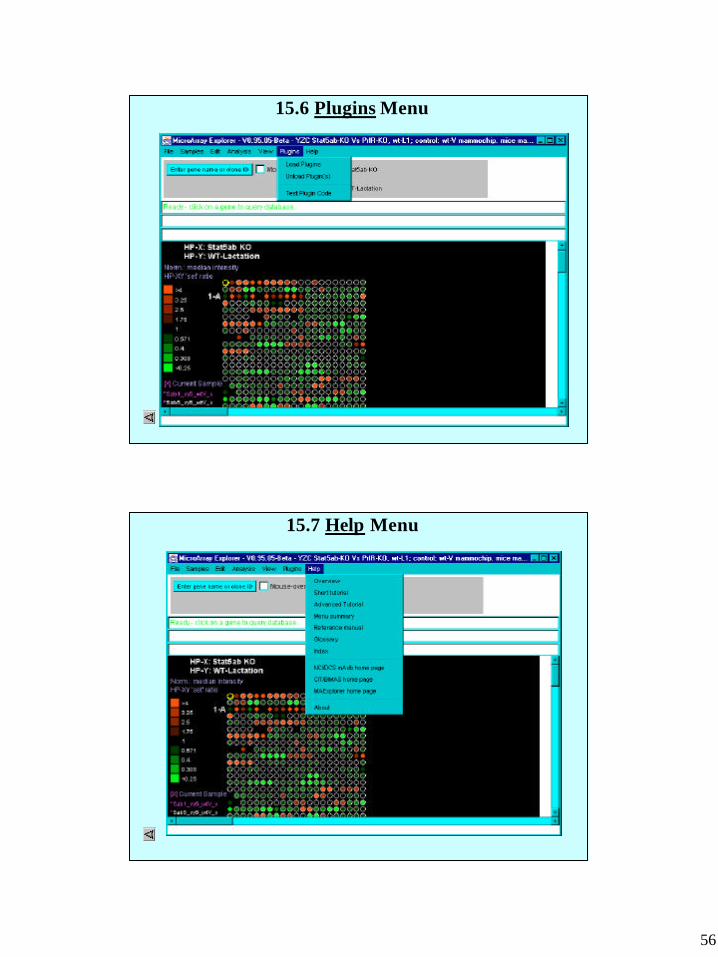
15.6 Plugins Menu
15.7 Help Menu