Embed Size (px)
Citation preview

Software Manual and Training guide
For version 3.4
Please note that this documentation is preliminary and subject to change without notice.
The latest version of this document can be obtained via TOP-SET® Governors (e-mail
[email protected]) or via an Investigator 3 Value Added Reseller.
The Incident Investigation and Analysis tool

1
1 1 Contents
1 CONTENTS ...................................................................................................................................................... 1
2 LIST OF FIGURES ............................................................................................................................................. 3
3 INSTALLATION INSTRUCTIONS ................................................................................................................... 4
3.1 INSTALLATION .................................................................................................................................................................................. 4
To install the software: ....................................................................................................................................................................... 4
3.2 INSTALLATION REFERENCES ............................................................................................................................................................. 5
3.3 ACTIVATION ...................................................................................................................................................................................... 6
3.4 NETWORK INSTALLATION ................................................................................................................................................................ 8
4 METHODS USED IN INVESTIGATOR 3 ......................................................................................................... 9
4.1 TOP-SET® INCIDENT INVESTIGATION METHODOLOGY .......................................................................................................... 10 Step 1. Planning .............................................................................................................................................................................................. 10 Step 2. Storyboard ......................................................................................................................................................................................... 11 Step 3. Analysis ............................................................................................................................................................................................... 11 Step 4. Reporting ........................................................................................................................................................................................... 11
4.2 THE TRIPOD INCIDENT ANALYSIS METHOD ................................................................................................................................. 12
5 INTRODUCING INVESTIGATOR 3 ............................................................................................................... 13
6 TOP MENUS & TOOLBARS .......................................................................................................................... 16
6.1 TOP MENUS .................................................................................................................................................................................... 16
6.2 TOOLBARS ....................................................................................................................................................................................... 17
Preview & Export and Report Toolbar ........................................................................................................................................ 18
7 INCIDENT DETAILS ................................................................................................................................ 20
7.1 BASIC INFORMATION TAB ............................................................................................................................................................. 20
Titling Information: ............................................................................................................................................................................ 21
Incident Details: .................................................................................................................................................................................. 21
Type and Severity: .............................................................................................................................................................................. 21
7.2 DETAILED INFORMATION TAB....................................................................................................................................................... 22
What Happened? ................................................................................................................................................................................ 22
What Were the Consequences? ..................................................................................................................................................... 22
Detailed Description of Incident: ................................................................................................................................................... 22
7.3 PEOPLE INVOLVED TAB .................................................................................................................................................................. 23
Investigation Team: ........................................................................................................................................................................... 23
People Involved: .................................................................................................................................................................................. 23
Attachments ......................................................................................................................................................................................... 24 Adding Notes: .................................................................................................................................................................................................... 24 Adding images and other attachments: ................................................................................................................................................... 24
8 TERMS OF REFERENCE ......................................................................................................................... 26

2
9 REPORT INTRODUCTION ...................................................................................................................... 28
9.1 REPORT INTRODUCTION ................................................................................................................................................................ 28
9.2 METHOD OF WORK ....................................................................................................................................................................... 29
10 PLAN INVESTIGATION .................................................................................................................... 30
10.1 INVESTIGATION PLANNER ............................................................................................................................................................. 30
10.2 PLANNING / ACTION LIST ............................................................................................................................................................. 32
11 DEVELOP THE STORYBOARD .......................................................................................................... 35
11.1 OVERVIEW & ATTACHMENTS ....................................................................................................................................................... 37
12 IDENTIFY THE IMMEDIATE CAUSES ................................................................................................ 38
13 THE ANALYSIS DIAGRAMS ............................................................................................................ 39
13.1 ROOT CAUSE DIAGRAM ................................................................................................................................................................ 39
Building a Root Cause Diagram ................................................................................................................................................... 40
Layout options ..................................................................................................................................................................................... 41
Presentation options .......................................................................................................................................................................... 41
Right-click options .............................................................................................................................................................................. 42
13.2 TRIPOD METHOD DIAGRAM ......................................................................................................................................................... 43
To start your Tripod Diagram: ....................................................................................................................................................... 44
To add a Barrier and Causation path: ........................................................................................................................................ 44
To add a BRF code to a Latent Failure: ....................................................................................................................................... 44
Layout options ..................................................................................................................................................................................... 45
Presentation options .......................................................................................................................................................................... 45
Right-click options .............................................................................................................................................................................. 46 General ................................................................................................................................................................................................................. 46 Event/Hazard/Object ....................................................................................................................................................................................... 47 Barriers ................................................................................................................................................................................................................. 47
13.3 ANALYSIS DIAGRAM WINDOWS ................................................................................................................................................... 47
13.3.1 Item Properties (Figure 13-6 Properties window): ................................................................................................ 47
13.3.2 Overview (Figure 13-7 Overview window): ............................................................................................................. 48
13.3.3 Attachments (Figure 13-8 Attachments window): ............................................................................................... 48 Adding Notes: .................................................................................................................................................................................................... 48 Adding images and other attachments: ................................................................................................................................................... 48
14 RECOMMENDATIONS & EXECUTIVE SUMMARY ........................................................................... 50
14.1 RECOMMENDATIONS ..................................................................................................................................................................... 50
To group the Recommendations table (e.g. by person responsible): ............................................................................... 51
To filter the Recommendations table: ......................................................................................................................................... 51
14.2 EXECUTIVE SUMMARY ................................................................................................................................................................... 52
15 REPORT ............................................................................................................................................... 54
15.1 LAYOUT OF THE REPORT .................................................................................................................................................................... 55
15.2 EXPORTING THE REPORT .................................................................................................................................................................... 55
HOW TO INSTALL INVESTIGATOR 3 – MSI ....................................................................................................... 57
HOW TO INSTALL INVESTIGATOR 3 – ZIP ........................................................................................................ 61
3
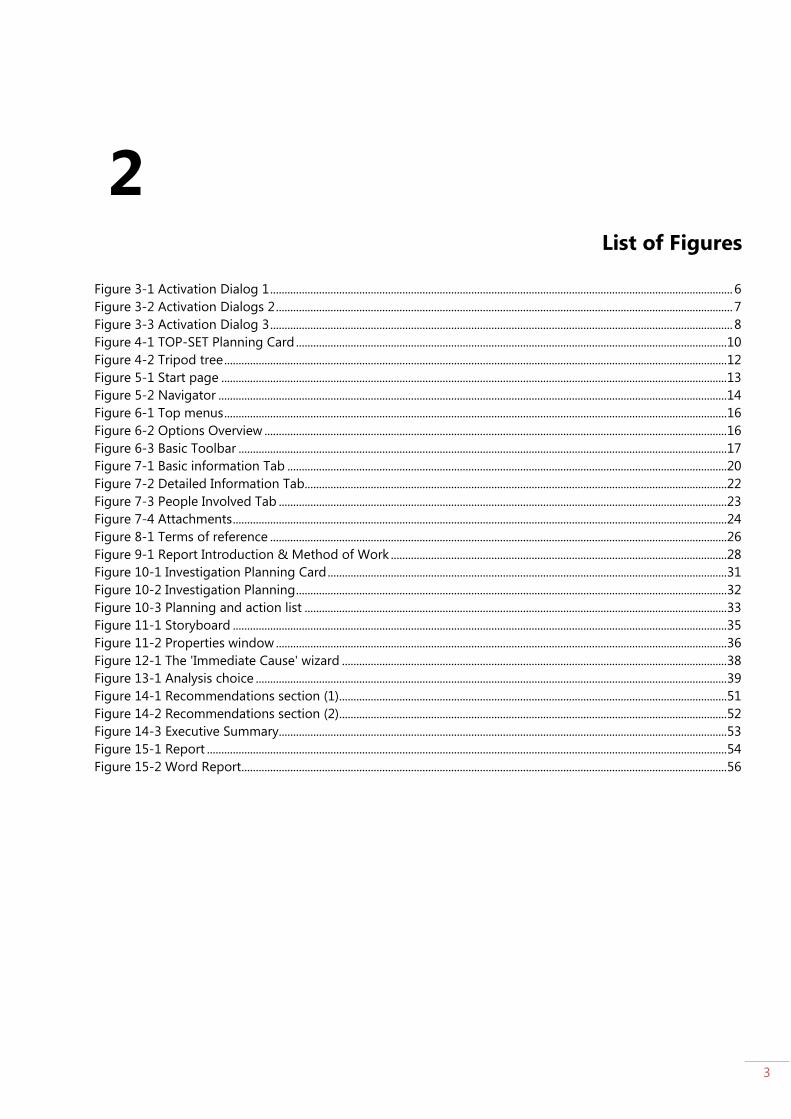
2 2 List of Figures
Figure 3-1 Activation Dialog 1 ................................................................................................................................................................. 6
Figure 3-2 Activation Dialogs 2 ............................................................................................................................................................... 7
Figure 3-3 Activation Dialog 3 ................................................................................................................................................................. 8
Figure 4-1 TOP-SET Planning Card ...................................................................................................................................................... 10
Figure 4-2 Tripod tree ............................................................................................................................................................................... 12
Figure 5-1 Start page ................................................................................................................................................................................ 13
Figure 5-2 Navigator ................................................................................................................................................................................. 14
Figure 6-1 Top menus ............................................................................................................................................................................... 16
Figure 6-2 Options Overview ................................................................................................................................................................. 16
Figure 6-3 Basic Toolbar .......................................................................................................................................................................... 17
Figure 7-1 Basic information Tab ......................................................................................................................................................... 20
Figure 7-2 Detailed Information Tab ................................................................................................................................................... 22
Figure 7-3 People Involved Tab ............................................................................................................................................................ 23
Figure 7-4 Attachments ............................................................................................................................................................................ 24
Figure 8-1 Terms of reference ............................................................................................................................................................... 26
Figure 9-1 Report Introduction & Method of Work ..................................................................................................................... 28
Figure 10-1 Investigation Planning Card ........................................................................................................................................... 31
Figure 10-2 Investigation Planning ...................................................................................................................................................... 32
Figure 10-3 Planning and action list ................................................................................................................................................... 33
Figure 11-1 Storyboard ............................................................................................................................................................................ 35
Figure 11-2 Properties window ............................................................................................................................................................. 36
Figure 12-1 The 'Immediate Cause' wizard ...................................................................................................................................... 38
Figure 13-1 Analysis choice .................................................................................................................................................................... 39
Figure 14-1 Recommendations section (1) ....................................................................................................................................... 51
Figure 14-2 Recommendations section (2) ....................................................................................................................................... 52
Figure 14-3 Executive Summary ............................................................................................................................................................ 53
Figure 15-1 Report ..................................................................................................................................................................................... 54
Figure 15-2 Word Report ......................................................................................................................................................................... 56

4
3 3 Installation Instructions
3.1 Installation
There are three types of download options that you can choose from, whether you download the software
from the download page or from a memory stick (or CD). Most of the time you are provided with these three
options:
Investigator 3 Installer (msi, for automatic installation)
This installer will guide you through the process of installing Investigator 3 on your computer. This is
the option most people should pick. Just download and double click this file to begin. To get an
extensive explanation on how to install with the Investigator 3 installer, look at attachment A.
Investigator 3 Manual Installation (zip, for manual installation)
If you would rather not use an .msi file, you can download a .zip file with the program. Just open this
file, copy the contents to your Desktop or other suitable folder, then double click the Investigator 3
program icon to begin. To get an extensive explanation on how to install Investigator 3 manually, look
at attachment B.
If, for any reason, the above options are not suitable, please download Investigator 3 with the .NET framework
already included. As its name would suggest, this does not require the .NET framework to be pre-installed.
Special version for corporate networks (no installation needed)
To help our corporate customers, we have designed a special version of Investigator 3 that does not
need the .NET framework to be installed. This special version of Investigator 3 needs no installation, just
open the .zip file, copy the contents to your Desktop or other suitable folder, then double click the
Investigator 3 program icon to begin.
Before you can use Investigator 3, you must have the Microsoft .NET framework version 2.0 installed. Some
computers already have this installed, some do not. If not you will get a warning while installing Investigator 3.
To install the software:
Click on the download link or open the software from your memory stick or CD.
A download window will appear that gives you the choice between running and saving the installer.

5
Click on Save to save the installer on your computer, otherwise click ‘run’. Save the installer on the
location of your choice. It is advised to save it on your desktop so that it can easily be found.
When you are manually installing the software with the .zip file, first extract the zip file and save it on a
location. Open the software then by clicking on the icon.
When the download is completed, click ‘run’, the Investigator 3 Setup wizard window will appear now.
The installer will offer to automatically save the software on a prefixed location, namely C:\Program
Files\TOP-SET Governors\Investigator 3\. You can change this location if you want.
The software will be installed now.
Open the software from the location where you saved it by clicking on the icon. You will be presented
with the ‘Investigator 3 Activation’ window.
3.2 Installation references
Investigator 3 is a regular desktop application, which runs on the hardware of the end user.
Investigator 3 adheres to all Microsoft specifications and only requires Domain Users rights to be run -
important for corporate network environments.
Investigator 3 is provided with an msi installer for deployment with network tools like Microsoft Systems
Management Server.
Investigator 3 stores information in a proprietary file-based compressed XML database. It does NOT require
database software to be installed. Even large Investigator 3 databases typically stay under 1 Megabyte of size.
Even if hundreds of Investigator 3 database versions are stored, storage requirements on a network file share
should stay well under 1 Gigabyte.
Configuration information is stored on disk in the user’s profile, in both the local and the roaming part. Some
system-wide data is stored in the all users profile (ProgramData on Windows 7).
The registry is used for file extension association and protocol handler association. If possible, these are made
system wide in HKLM. If access to HKLM is denied, the HKCU hive is used.
Citrix and Terminal Server environments are supported.
Supported operating systems:
Windows 2000
Windows XP (32 bit)
Windows Vista (32 and 64 bit)
Windows 7 (32 and 64 bit).
Operating system prerequisites:
If possible, the Microsoft .NET Framework 2.0 should be installed on the OS. If this is not possible a special
version of the software is available without this prerequisite.

6
3.3 Activation
After downloading the software and opening it for the first time, you will be prompted with the window visible
in Figure 3-1 Activation . In the window you get three choices in how you want to activate the software.
Figure 3-1 Activation Dialog 1
The first option is to enter a new activation key. Once you have received your activation key or trial code, you
can fill the code in this window in. If you want to view the host id again you can click on the Advanced...
button. When entering a correct code, the activation status will turn green and you can start the software (see
Figure 3-3 Activation Dialog 3).
7
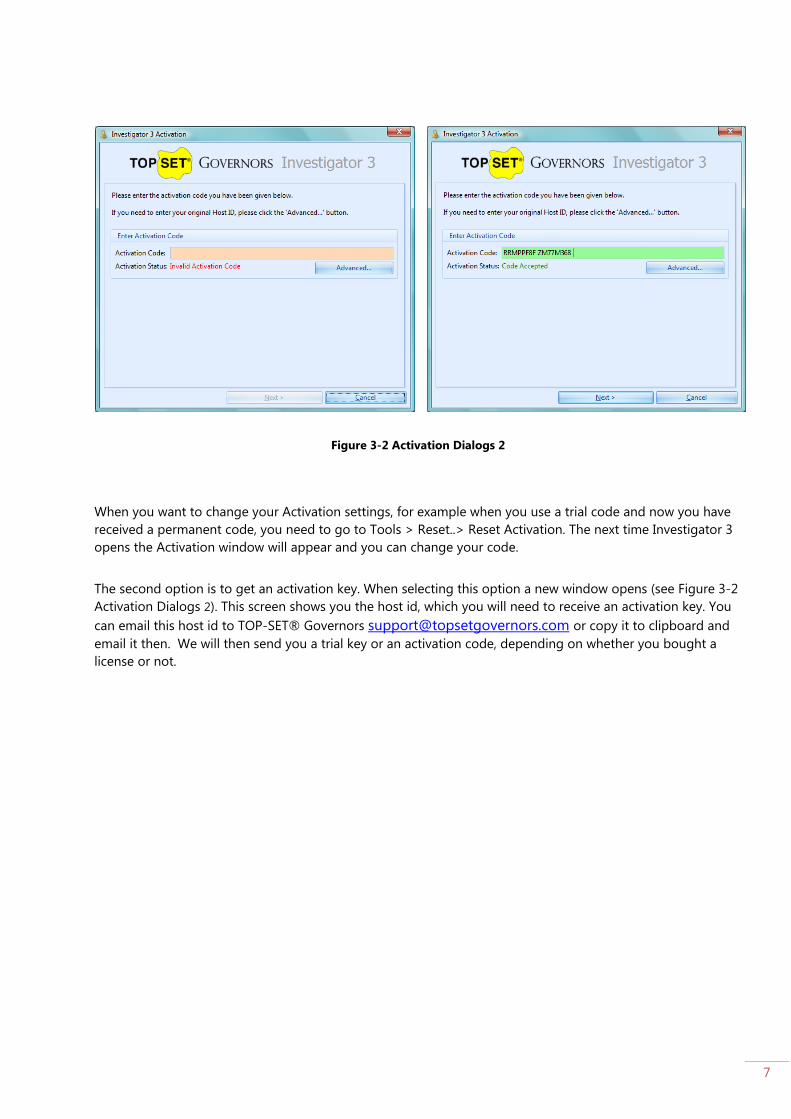
Figure 3-2 Activation Dialogs 2
When you want to change your Activation settings, for example when you use a trial code and now you have
received a permanent code, you need to go to Tools > Reset..> Reset Activation. The next time Investigator 3
opens the Activation window will appear and you can change your code.
The second option is to get an activation key. When selecting this option a new window opens (see Figure 3-2
Activation Dialogs 2). This screen shows you the host id, which you will need to receive an activation key. You
can email this host id to TOP-SET® Governors [email protected] or copy it to clipboard and
email it then. We will then send you a trial key or an activation code, depending on whether you bought a
license or not.

8
Figure 3-3 Activation Dialog 3
The last option ‘Continue’ is to run the software in trial mode. Choose this option when you did not receive an
activation key. This option will give you the opportunity to work and evaluate the software for 30 days. After
30 days the activation automatically expires.
3.4 Network Installation
To install the software on a network, you first need to create a Windows user group in your Windows domain,
say Investigator 3 Users. Then add licensed Windows domain users to the user group. Run Investigator 3
under an Administrator account. In the Activation Dialog (see Figure 3-1 Activation Dialog 1) upon first start
and choose ‘Get an Investigator 3 Activation code’. In the next dialog (see Figure 3-3 Activation Dialog 3) click on the Show Groups button and a list of all User Groups on your domain will show. Choose your User
Group, the one that contains the Investigator 3 users, and choose: ‘Copy details to clipboard’. This will copy
the Current Host ID shown to the clipboard. Paste the Activation details into an e-mail and send your request
to [email protected]. We will then send you an activation code and an activation.dat license file
that can be put next to the executable by hand or in an installation script. This license file will auto-activate the
software for any user who is a member of the user group.

9
4 4 Methods Used in Investigator 3
Investigator 3 has been developed by investigators for investigators. It has been developed for the
professional investigation of large-scale incidents. It is the latest in a series of innovative incident investigation
software tools developed by TOP-SET® Governors BV. Investigator 3 is a totally new product which builds on
the structure of the previous Investigator tool developed by Kelvin TOP-SET®. On top of that the incident
analysis method Tripod Beta is also included in the software. This way the two best practice methods in
incident investigation are brought together. The TOP-SET®
incident investigation method uncovers more
relevant facts during an investigation by pointing out every factor that could have played a role. This solid
investigation basis is required for sound Tripod Beta analysis by providing better quality data.
Investigator 3 has been built to replicate as closely as possible the paper- based TOP-SET® incident
investigation methodology. Investigations are traditionally carried out by a team using large A0-size paper
charts (the Planning chart, Storyboard chart and Root Cause Analysis chart) and Post-it notes. Here, this
method of working is recreated using easy to use graphical interfaces that replicate the flexibility of using
paper charts and Post-its. We would encourage that the software is used by a group working in collaboration,
and in tandem with the paper-based method, so that the open thinking vital to the methodology is
encouraged and enhanced.
The software acts as a repository for all of the information gathered during an investigation. Without the
software, organizing all of this information would be a cumbersome and time-consuming task. Furthermore,
using the software means that the information gathered during an investigation can be easily communicated
amongst the investigation team members and to senior staff. People in different locations can also work
together on the same investigation.

10
4.1 TOP-SET® Incident Investigation Methodology
The TOP-SET® incident investigation methodology is used by major blue-chip clients all around the world. It
is taught on 1-day or 3-day senior courses held throughout the world, and are the basis of several incident
investigation products for professional incident investigators (Further details are available at
www.kelvintopset.com).
TOP-SET® was developed in 1989 to provide a comprehensive incident investigation methodology that would
take users from the start of the process of investigation right through to the end. Users are educated in
planning an investigation, visiting the scene and gathering data, interviewing witnesses, creating a Storyboard
of events incorporating as much information as possible, analyzing the information to discover the causes,
creating recommendations, and reporting.
Figure 4-1 TOP-SET Planning Card
Step 1. Planning
Planning the investigation and gathering data involves using the TOP-SET® indicators, a set of 600+ prompts
which are arranged according to six categories: Technology, Organization, People, Similar Events, Environment
and Time. This set of prompts or indicators is what leads to the success of any TOP-SET® investigation. The
TOP-SET® Planning card shows a summarized version of the full set of indicators (see
Figure 4-1 TOP-SET Planning Card). This card is shown in the software (The Investigation Planner). The
indicators are used as prompts to help the user to think of as many events or issues as they can that may have
contributed to the incident. The indicators can be revisited as often as necessary.
11
Step 2. Storyboard
The issues identified are then investigated and the resulting data lay out on a Storyboard chart, organized by
TOP-SET® category and time.
Step 3. Analysis
At the analysis stage of the investigation, which comes after the investigation has been planned, carried out,
and all of the contributing events have been investigated and laid out on the Storyboard. Following the TOP-
SET® method a Root Cause Analysis Diagram is made. In this diagram the causes of the incident are analyzed
until the root causes are known.
Step 4. Reporting
All of the information that the user enters into the software is automatically forwarded to a report, which is set
up in a standardized format. The automatic creation of the report saves the user from having to write a report
about the investigation and its findings from scratch, as would be the case if they were carrying out a paper-
based investigation.

12
4.2 The Tripod Incident Analysis method
Investigator 3 contains a full Tripod Beta Incident Analysis implementation. Tripod Beta distinguishes itself
from other incident analysis methods through the Human Behavior model that is used to analyze the reasons
of failure of a Barrier. The Tripod Beta Analysis looks at what caused the sequence of events in an incident. The
aim of the analysis is to show:
What was the sequence of events?
How the incident happen, what barriers failed?
Why these barriers have failed?
The core of a Tripod analysis is a ‘tree’ diagram representation of the incident mechanism which describes the
events and its relationships. The Event in a Tripod Beta Diagram is the result of the Hazard acting on an
Object. A Barrier is something that’s preventing the meeting of an object and a hazard.
When such a barrier fails, a causation path is made to explain how and why this happened. The Tripod method
presumes that incidents are caused by human error, which can be prevented by controlling the working
environment. The Causation Path displays this by starting with the Active Failure of the barrier, then under
what Precondition or in what contextual state this happened and at last the Underlying Failure of the barrier.
The aim of Tripod Beta is to uncover the hidden deficiencies in an organization; the Latent Failures. These can
be classified into eleven Basic Risk Factors (BRF’s), these are categories that represent distinctive areas of
management activity where the solution of the problem lies. All the items of the Tripod Diagram are visible in
the basic Tripod tree diagram in Figure 4-2 Tripod tree.
Figure 4-2 Tripod tree

13
5 5 Introducing Investigator 3
Investigator 3 is a software program for the professional investigation and analysis of incidents. It can be used
for incidents of any scale. Investigator 3 is based on the TOP-SET® incident investigation methodology and
the Tripod method. Most of the information in this user manual is also available in the Help section of
Investigator 3.
The first screen (see Figure 5-1 Start page) gives the user the option to start a new investigation or open a
saved one.
After starting a new investigation or opening a saved one, Investigator 3 leads the user through a systematic
nine-step approach which covers the entire investigation process. This process is referred to as the
Figure 5-1 Start page

14
Investigation Workflow (see Figure 5-3 Investigation Workflow) and is presented on
the first screen. During the process this workflow is also available on the left-hand side
of the screen, the navigator (see Figure 5-2 Navigator). This menu will stay visible
throughout the program. The section were you are working in is highlighted in red in
the menu. You can jump through this menu in whatever order you want. Sections can
also be skipped. The Start-button will always bring you back to the Investigation
Workflow. In the Investigation Workflow you can select your choice between the two
analysis diagrams; Root Cause and Tripod Beta. You can also click on ‘Analysis
Diagram’ in the navigator. You will then also be able to make your choice between the
two analyses methods. The left-hand menu is divided in three sections: Investigation,
Analysis and Conclusion.
Each step in the Investigation Workflow has its own interface, some of which feature
graphics and tools that will help you to thoroughly investigate and analyse the
incident while others offer a way of adding textual information. The information you
enter into Investigator 3 will automatically be entered into the report which is
generated as the final step in the process. At the end of the process, besides the final
report, all of the information you have entered will be stored in the saved file,
enabling you to keep all of the information in one place, making the whole process of
investigation much less cumbersome.
The software was created to lead you through the process from the receipt of initial
information about the incident, all the way through to the reporting process. The
steps should be completed in the correct order. However, you are encouraged to
move back and forth between the sections as much as you like to refer to information
you have already entered.
Figure 5-2 Navigator
Figure 5-3 Investigation Workflow
15
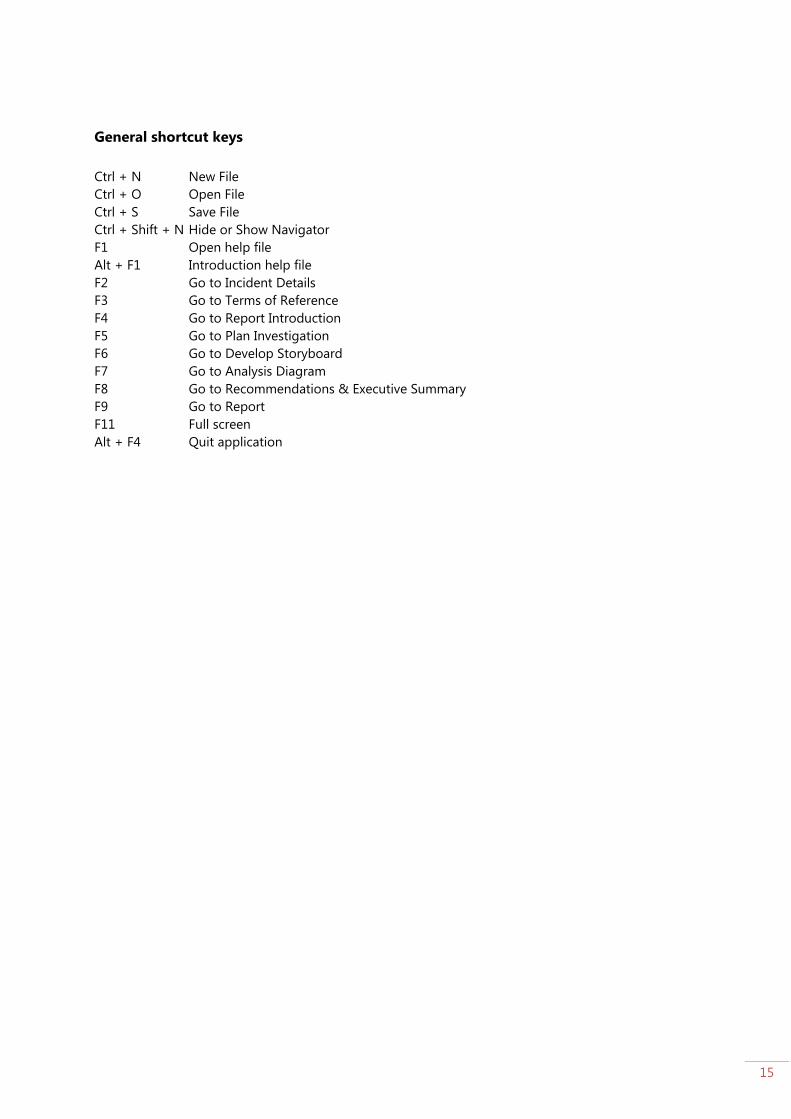
General shortcut keys
Ctrl + N New File
Ctrl + O Open File
Ctrl + S Save File
Ctrl + Shift + N Hide or Show Navigator
F1 Open help file
Alt + F1 Introduction help file
F2 Go to Incident Details
F3 Go to Terms of Reference
F4 Go to Report Introduction
F5 Go to Plan Investigation
F6 Go to Develop Storyboard
F7 Go to Analysis Diagram
F8 Go to Recommendations & Executive Summary
F9 Go to Report
F11 Full screen
Alt + F4 Quit application

16
6 6 Top menus & Toolbars
6.1 Top menus
Within Investigator 3 the top menu bar remains
available throughout the program. Most menu items
are similar to the standard ‘Microsoft Office’ tasks
such as new, open, save, special characters, help and
about see Figure 6-1 Top menus.
In the File menu consists of the options to manage your files, like New, Open, Save and Save as. But also the
option Recent Files which will give you an overview of all the files you recently worked in.
The Go To… menu items are the third way of getting access to your workflow and features the same elements
as the navigator. All the sections of the software are accessible in this menu.
Within the Tools… menu you can select or change all the options in the software. The
first option ‘Show Navigator’ is to show or hide the navigator on the left-hide side of
the screen. It is also possible to select special characters from the default windows
special character pallet. In the Tools menu you can also reset settings; reset the
Investigator 3 setting, reset the windows and toolbars and reset the activation. You can
also edit several options for Investigator 3 from this menu (see Figure 6-2 Options
Overview). Options that can be changed are:
General: Application appearance, currencies, files and image settings
Diagram: Diagram size and font, layout options
Storyboard: Time period, sizing, categories/actors
Report: Fonts and watermarks
Word Export: Report options, image size options
Terminology: Terminology options
In the Help menu you can find the Help file Contents, the newest Investigator 3 download links under Online
and the option to Collect the error report.
Figure 6-1 Top menus
Figure 6-2 Options Overview
17
Menu shortcut keys
Ctrl + N New File
Ctrl + O Open File
Ctrl + S Save File
Alt +P Go to People Involved
Alt + F Go to Menu > File
Alt + E Go to Menu > Edit
Alt + D Go to Menu > Diagram
Alt + V Go to Menu > View
Alt + G Go to Menu > Go to...
Alt + T Go to Menu > Tools
Alt + H Go to Menu > Help
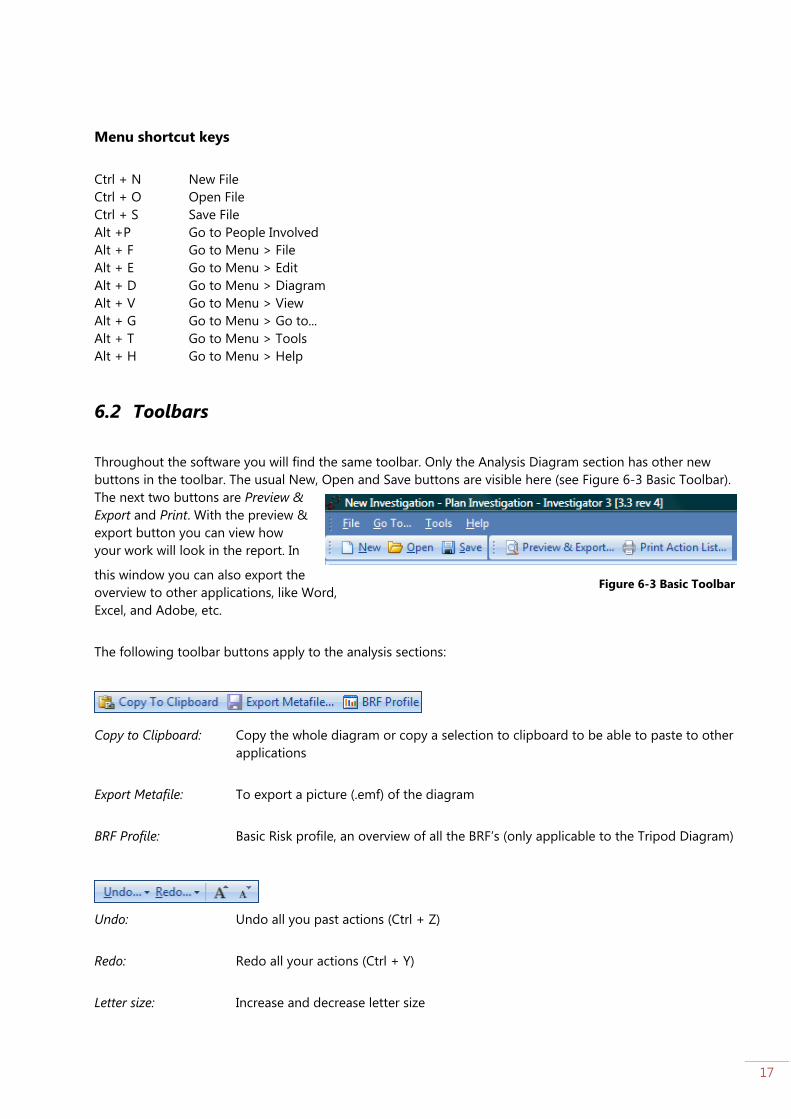
6.2 Toolbars
Throughout the software you will find the same toolbar. Only the Analysis Diagram section has other new
buttons in the toolbar. The usual New, Open and Save buttons are visible here (see Figure 6-3 Basic Toolbar).
The next two buttons are Preview &
Export and Print. With the preview &
export button you can view how
your work will look in the report. In
this window you can also export the
overview to other applications, like Word,
Excel, and Adobe, etc.
The following toolbar buttons apply to the analysis sections:
Copy to Clipboard: Copy the whole diagram or copy a selection to clipboard to be able to paste to other
applications
Export Metafile: To export a picture (.emf) of the diagram
BRF Profile: Basic Risk profile, an overview of all the BRF’s (only applicable to the Tripod Diagram)
Undo: Undo all you past actions (Ctrl + Z)
Redo: Redo all your actions (Ctrl + Y)
Letter size: Increase and decrease letter size
Figure 6-3 Basic Toolbar

18
Actions: All the actions that apply to the item that is selected
Layout: Layout the children of the selected item (Ctrl + L)
Pan: Pan option to be able to move your diagram around
Options: Increase or decrease the diagram and item size
Zoom: Zoom in and out in your diagram
Lock: Lock the zoom level
Fit: Bring the diagram back to a full overview
Show All: Show all the hidden items
Hide Causation Paths: Hide the causation paths in the diagram (only applicable to the Tripod Diagram)
Hide Balloons: Hide the narrative and recommendation balloons
Preview & Export and Report Toolbar
1 2 3 4 5 6 7 8 9 10 11 12 13 14 15 16 17 18
1. Document Map: Show the Document Map next to the report or not
2. Search: Use the Search functionality
3. Print: Select printer
4. Print: To print the overview
5. Page setup: To get an overview of the page before printing
6. Scale: Choose the scale to view the report with

19
7. Hand tool: Pan option to be able to move the overview of your diagram around
8. Magnifier: To zoom in on your overview
9. Zoom Out: Zoom out of the overview
10. Zoom Level: Drop down list with different zoom levels
11. Zoom In: Zoom in on the overview
12. Navigation: Navigate through the report by going to next and previous pages
13. Multiple pages: Show multiple pages at the same time
14. Background colour: Choose a colour for the background of the pages
15. Watermark: Opens the watermark window to show watermark colour, text, etc.
16. Export: Export the document in several formats
17. Email: To email the report in a certain format
18. Word: to export the file directly to Word

20
7 7 Incident Details
In this first step of the Investigator 3 software, you will enter the basic and detailed information about the
incident. You start with details such as the date and time of the incident, and then expand on these to include
a short incident statement, a list of the incident’s consequences, and a detailed description of the incident.
Here, you also add information about the people who were involved in the incident. It is important to be
thorough with this step. As with all the information you enter, these details will be used to populate your
report. It is important that the Incident Statement describes the exact incident you are investigating, as it will
provide the starting point for your analysis. There are three sections: Basic Information, Detailed Information
and People Involved. You can click on the tabs to select on or you can use the ‘Previous’ and ‘Next’ buttons:
7.1 Basic Information Tab
Figure 7-1 Basic information Tab
On this first tab, you need to enter the basic details about the incident, see Figure 7-1 Basic information Tab.

21
Titling Information:
Add a report title
Add the names of the authors of the report, press the Add button to add new authors
Add job title information
Add employer information
Incident Details:
Add the date and time of the incident
Add the location of the incident
Type and Severity:
There is a list of possible outcomes that occurred as a result of the incident. Check the boxes that
apply.
Make sure to click on the Check if reportable under law checkbox if this applies to the incident.

22
7.2 Detailed Information Tab
Figure 7-2 Detailed Information Tab
On this tab, you will enter more specific information about the incident; see Figure 7-2 Detailed Information
Tab
What Happened?
Condense the incident down to a specific one-line sentence. Make sure that you decide at this point
what specific incident you are investigating. Take care not to describe a more general incident in error.
What Were the Consequences?
Add the consequences of the incident. Click on the uppermost field in the consequences area, enter
your text, and press Enter to add each consequence. Delete consequences by placing the cursor at the
end of the text you want to delete, and use Backspace. Click outside the field to continue.
Add any potential consequences that could easily have occurred if circumstances had been a little
different.
Detailed Description of Incident:
Enter a narrative which explains the entire incident in more detail. This will be the main incident
description in the report, so the text should cover the incident in as much depth as you think will be
required.
23
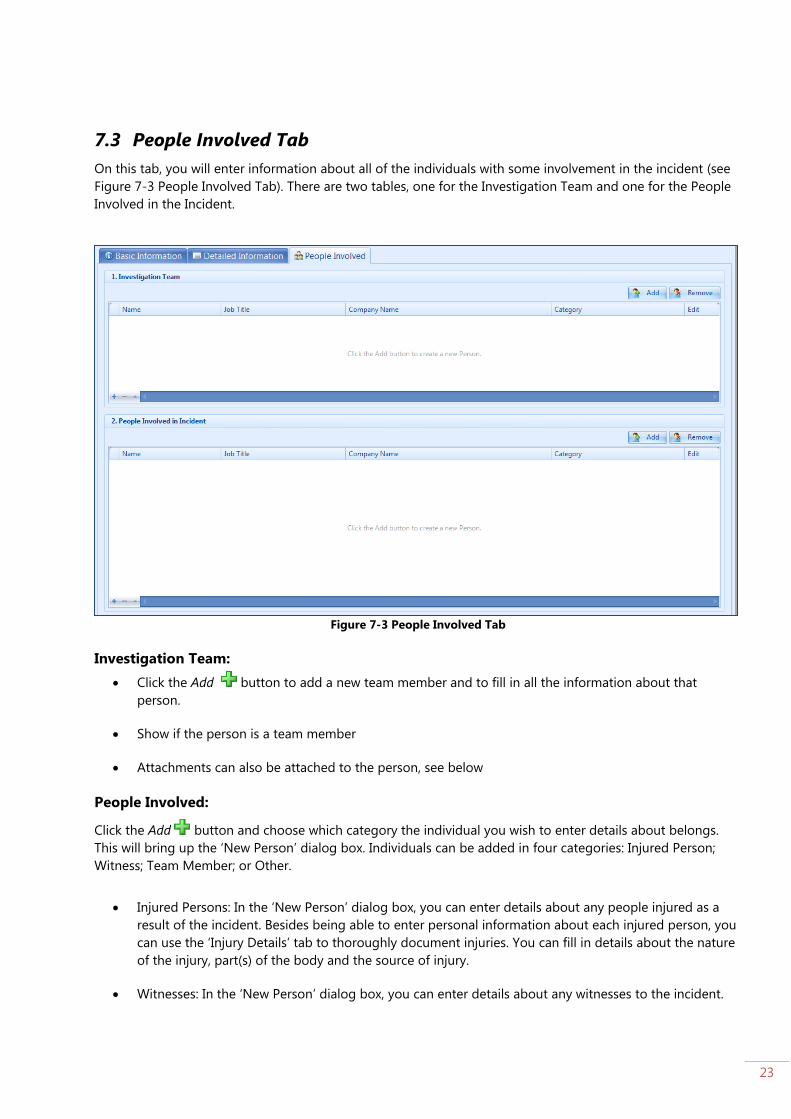
7.3 People Involved Tab
On this tab, you will enter information about all of the individuals with some involvement in the incident (see
Figure 7-3 People Involved Tab). There are two tables, one for the Investigation Team and one for the People
Involved in the Incident.
Figure 7-3 People Involved Tab
Investigation Team:
Click the Add button to add a new team member and to fill in all the information about that
person.
Show if the person is a team member
Attachments can also be attached to the person, see below
People Involved:
Click the Add button and choose which category the individual you wish to enter details about belongs.
This will bring up the ‘New Person’ dialog box. Individuals can be added in four categories: Injured Person;
Witness; Team Member; or Other.
Injured Persons: In the ‘New Person’ dialog box, you can enter details about any people injured as a
result of the incident. Besides being able to enter personal information about each injured person, you
can use the ‘Injury Details’ tab to thoroughly document injuries. You can fill in details about the nature
of the injury, part(s) of the body and the source of injury.
Witnesses: In the ‘New Person’ dialog box, you can enter details about any witnesses to the incident.
24
Other Persons Involved: In the ‘New Person’ dialog box, you can enter details about anyone else
involved in the incident or investigation that doesn’t fall under the earlier categories.
In the ‘New Person’ dialog box, you can also add notes, and drag and drop images and other attachments (for
example, Word documents), using the Attachments area.
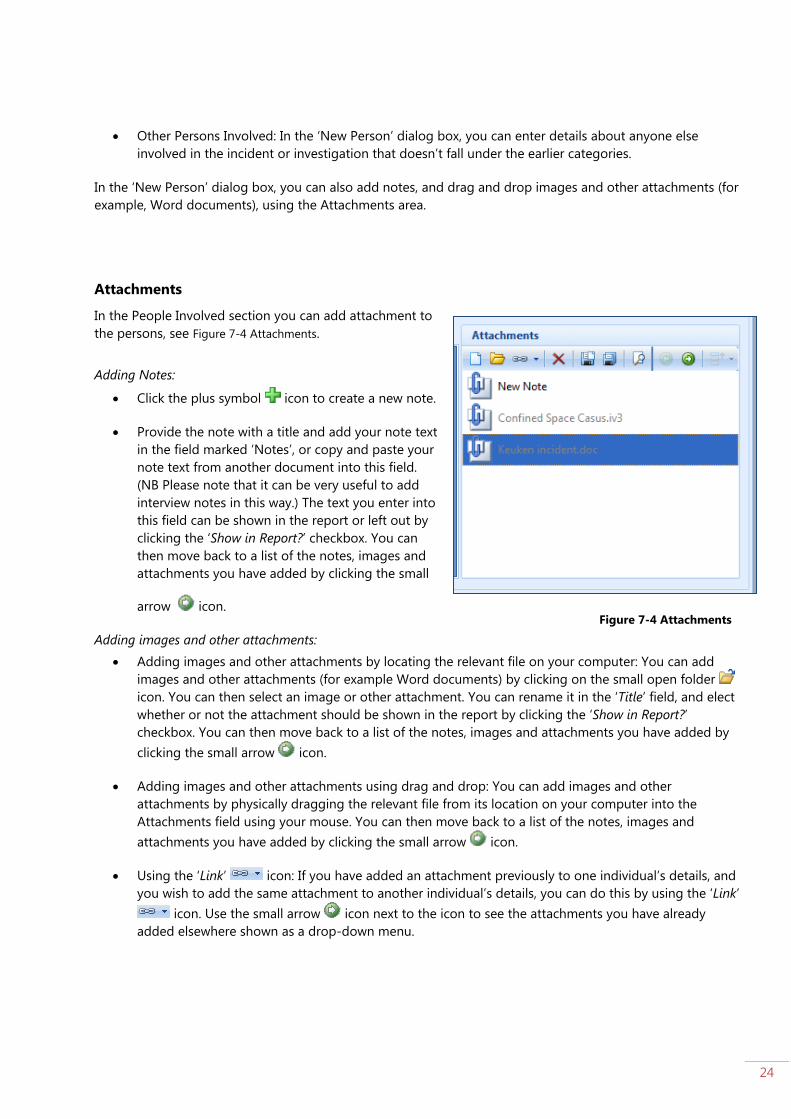
Attachments
In the People Involved section you can add attachment to
the persons, see Figure 7-4 Attachments.
Adding Notes:
Click the plus symbol icon to create a new note.
Provide the note with a title and add your note text
in the field marked ‘Notes’, or copy and paste your
note text from another document into this field.
(NB Please note that it can be very useful to add
interview notes in this way.) The text you enter into
this field can be shown in the report or left out by
clicking the ‘Show in Report?’ checkbox. You can
then move back to a list of the notes, images and
attachments you have added by clicking the small
arrow icon.
Adding images and other attachments:
Adding images and other attachments by locating the relevant file on your computer: You can add
images and other attachments (for example Word documents) by clicking on the small open folder
icon. You can then select an image or other attachment. You can rename it in the ‘Title’ field, and elect
whether or not the attachment should be shown in the report by clicking the ‘Show in Report?’
checkbox. You can then move back to a list of the notes, images and attachments you have added by
clicking the small arrow icon.
Adding images and other attachments using drag and drop: You can add images and other
attachments by physically dragging the relevant file from its location on your computer into the
Attachments field using your mouse. You can then move back to a list of the notes, images and
attachments you have added by clicking the small arrow icon.
Using the ‘Link’ icon: If you have added an attachment previously to one individual’s details, and
you wish to add the same attachment to another individual’s details, you can do this by using the ‘Link’
icon. Use the small arrow icon next to the icon to see the attachments you have already
added elsewhere shown as a drop-down menu.
Figure 7-4 Attachments

25
NB Please note that only plain text can be viewed in the report. This means that only text that has been copied
and pasted into the ‘Notes’ field can be viewed in the report. Pictures can also be viewed in the report.
However, it is not possible to view attached documents (for example, Word documents) in the report. Your
investigator 3 file will than get inconveniently large. Investigator 3 saves the location of your document. You
must save these attached files separately.

26
8 8 Terms of Reference
Particularly in bigger, more serious incidents, the Terms of Reference can be useful to make certain
appointments. For example, who will be on the team, what methods are used and how we describe the
incident. In the Terms of Reference (see
Figure 8-1 Terms of reference), information from the Incident Details section is automatically inserted where
relevant into the upper portion of the text. Then, a basic remit for the investigation is displayed. You should
edit the Terms of Reference to suit your own investigation.
Figure 8-1 Terms of reference
To edit the Terms of Reference:
Simply edit the text as you wish; the existing text is just for guidance.
If you wish to start again, click the button ‘Reset to Default Terms’.
Be sure to save your work using the Save button so that you do not lose your edited text.

27
If you wish, you can edit the default terms so that they appear as you wish them to each time you use the
application:
Click on the ‘Edit Default Terms’ button to edit the existing text.
Edit the default Terms of Reference in the ‘Default Terms of Reference’ window so that they appear as
you wish them to.
If you wish to start again, click ‘Reset’.
Once you are finished, click ‘OK’.
You must restart the application for the edited Terms of Reference to be displayed.
If you wish to reinstate the default terms:
Click on Tools, then Reset User Settings.
You must restart the application for the default Terms of Reference to be reinstated.

28
9 9 Report Introduction
In this section, you can create a Report Introduction and a Method of Work (seeFigure 9-1 Report Introduction &
Method of Work) which will be displayed near the start of the report. Use the ‘Preview & Export’ and the ‘Print’
buttons in the toolbar to export and print the Report Introduction and Method of Work.
Figure 9-1 Report Introduction & Method of Work
9.1 Report Introduction
To enter a Report Introduction:
Simply enter text in to the Report Introduction field that is appropriate to your investigation.
You can also copy and paste text in from other applications
Add attachment in the Attachments window next to the Report Introduction section (for help see
13.3.3 Attachments).

29
9.2 Method of Work
The Method of Work should provide a summary for the reader of how you undertake the investigation. It
should detail the methodology used, what the various steps were, and what these entail. The TOP-SET
methodology is already put in here as the standard method. Off course, you can alter or remove this text if
you like.
To edit the Method of Work:
Simply edit the text as you wish; the existing text is just for guidance.
If you wish to start again, click ‘Reset to Default Text’.
Be sure to save your work using the Save button so that you do not lose your edited text.
Add attachment in the Attachments window next to the Report Introduction section (for help see
13.3.3 Attachments).
If you wish, you can edit the default text so that it appears as you wish it to each time you use the application:
Click on ‘Edit Default Text’ to edit the existing text.
Edit the default Method of Work in the ‘Default Method of Work’ window so that it appears as you
wish it to.
If you wish to start again, click ‘Reset’.
Once you are finished, click ‘OK’.
You must restart the application for the edited Method of Work to be displayed.
If you wish to reinstate the default text:
Click on Tools, then Reset User Settings.
You must restart the application for the default Method of Work to be reinstated.

30
10
10 Plan Investigation
In this section you will plan the investigation and investigate to gather evidence or data.
10.1 Investigation Planner
The Investigation Planner (see
Figure 10-1 Investigation Planning Card ) is a representation of the TOP-SET®
Planning card, used on TOP-SET®
courses and worldwide by professional investigators. The colored graphic shows the Investigation Planner in
its typical form so that users are aware of its usual appearance. Behind the colored graphics you will see that
the Investigation Planner has been recreated as an interactive user interface for the purposes of the program.
Click on the Planner to go to the digital format of the planner, visible in

31
Figure 10-1 Investigation Planning Card. You can choose to hide this picture in the future by selecting the ‘Do
not show this again’ option.
Figure 10-1 Investigation Planning Card
The investigation planner is broken down into six categories:
Technology
Organisation
People
Similar Events
Environment
Time

32
As you can see the first letters of these words make the word TOP-SET®
. The meaning of the Planning Card is
to plan your investigation taking into account the different categories. The indicators in the lists are reminders.
The indicators are there merely to stimulate discussion and to foster an open minded in the investigator. Four
of the categories have a more detailed list of indicators underneath the main heading. Users can go through
the list and make actions on the indicators they think or have a feeling that might have played a role in the
causation of the incident. Double-click on any indicator to add an action to the Planning / Action List using the
Action / Planning Issue Editor
Figure 10-2 Investigation Planning). In this editor you can define the action that needs to be done with all the
additional information, like who has to do it, the due date, priority, etc. You can assign the action to an
individual, add a priority and due date, and mark it as complete. If necessary, you can add a new individual to
the investigation team. The box at the bottom of the editor is to put the investigation findings. You can fill
these in later when you have the answers to the questions of the planning items after the investigation.
Figure 10-2 Investigation Planning
On the right-hand side of the page there is a box with ‘Other Planning Items’ and ‘Action Points’. Here, you can
add actions to your investigation that may not be represented in the given lists. Continue to do this to build a
Planning / Action List of things to investigate. You can still open the TOP-SET®
Planner Image by clicking on
the ‘Show TOP-SET Planner Image’ button.
10.2 Planning / Action List
In this section, a Planning / Action List of all the actions you defined in the Investigation Planner are listed, see

33
Figure 10-3 Planning and action list. You can arrange the items in the list by grouping them by category, or by
filtering them according to the information you have entered under each category. You can move the columns
simply by grabbing the title bar with you mouse and moving the column to the position you desire. You can
also add or remove items on the list by clicking on the appropriate Add or Remove buttons.
Figure 10-3 Planning and action list
To group actions (e.g. by Person Responsible):
Grab the ‘Person Responsible’ title bar.
Drag it to the dark blue box at the top of the list. Investigator 3 will automatically group your actions
according to the people responsible for those actions.
Click on the plus or minus nodes to expand or hide the details under each item in the list.
You can ‘Preview & Export’ or ‘Print’ out these organized actions by using the print buttons on the
toolbar.
Follow the same steps above to arrange by the other available categories.

34
To filter items:
Arrange the items in the list the way you desire (i.e. by Person Responsible)
In the title bar of each category there is a little pin icon.
Click on the pin, and you can filter your results. For example, you can use the pin in the Person
Responsible title bar to show all of the actions for which a particular individual is responsible. Only the
action items that are visible in the action list will be exported or printed.

35
11
11 Develop the Storyboard
After making all the action items, the investigation is executed. When all the answers to the questions of the
action items are answered, they can be collected in the Storyboard. The Storyboard is a platform where all the
facts and information can be gathered. On the Storyboard platform you can place yellow sticky notes
represent the different events that contributed to the incident and show the timeline involved (see Figure 11-1
Storyboard). The Storyboard is divided into five categories: Technology, Environment, Organisation, People,
and Similar Events, and is organised by Time from left to right with the time the incident occurred at the very
right-hand side of the graphic.
Figure 11-1 Storyboard

36
Sticky Notes:
You can add sticky notes to the Storyboard by double clicking in the background. A new blank item
will appear. When clicking in that item you will be able to add text. You can also right-click in the
background of the storyboard to add the investigation findings which you filled in at the Planning
editor. Those are the results of your investigation using the Action/Planning List.
To create a sticky note, go to the Actions menu and select Add Item, right-click using your mouse and
select Add Item, or simply double-click on the graphic.
To add or edit text, double-click in the sticky note to zoom in and add or edit text. Click in the
background of the Storyboard to zoom out again or press enter. To do this you have to deselect the
option ‘Enable single-click editing of shapes’ in Tools > Application Settings > Diagram.
You will see at the top-right of the graphic that the Incident Statement and Consequences of the
incident are shown. This is to remind you of the specific incident you are investigating, so that you do
not get too side-tracked by the events you are working with.
Right-click on the sticky note items to delete them.
You can modify the sizes of the sticky notes by selecting the ‘Free sizing of shapes’ option in Tools >
Application settings > Diagram. You can also modify the text size by using the big A
and small a buttons in the toolbar.
You can position the sticky note according to when the event occurred and which category it belongs
to. Turn on the timeline by clicking on the ‘Show Time Periods’ button in the toolbar and just click on
the sticky note to grab it and move it around the Storyboard.
You can change the time on the items in two ways. First, you can change the time in the Properties
window > Date & Time. If you move the item around you see that time in the mouse over of the item.
You can also let the time change when you reposition the item on the storyboard. For this you need to
go to Tools > Application Settings > Storyboard, then select the option ‘Change date and time...’ Now
when you reposition the item on the storyboard the time changes too.
You can change the time periods when you enable the timeline on the Storyboard in the options. Go to
Tools > Application Settings > Storyboard and append and delete items with the +
and – buttons. If you make a new item, indicate how many seconds before the
incident the item takes place. This way the software knows exactly where the item will be located.
Item Properties (Figure 11-2 Properties window):
When you click on a sticky note on the Storyboard, the
details associated with that note appear in the Item
Properties window.
Information is grouped by type: Details (A), Classification
(B), and Miscellaneous(C).
Figure 11-2 Properties window

37
You will see that the event name appears next to Name.
As you move the sticky note, the date and time of the event and the category will change depending
on where you position the note.
You can color-code sticky notes using the drop-down menu next to ‘Color’ in the ‘Classification’
section. (Click in the field to activate the drop-down menu.)
Under Miscellaneous, you can choose whether each event should be included in the report (the events
you select from the Storyboard will be shown in the Timeline: Sequence of Events Leading to the
Incident subsection of the report).
11.1 Overview & attachments
To aid in navigating the different items/sticky notes it is possible to switch between the attachments
window and the overview window. You can find these windows underneath the Properties window at
the left bottom side of the screen. The overview window is used to navigate the entire storyboard with.
It shows you a bird’s eye view of the entire Storyboard. It is a good way to navigate a complex
Storyboard and zoom in on portions you wish to edit or move. To select a portion of the Storyboard,
use your mouse to drag the green box over the area you wish to focus on. The Storyboard will snap to
the selected section. Use the ‘Fit’ button on the toolbar to show the whole Storyboard again. To
find out how the Attachment window works, see 13.3.3 Attachments).

38
12 12 Identify the Immediate Causes
When you are planning to do a Root Cause Analysis, the Immediate Cause Wizard can help you identifying
your Immediate Causes. This dialog box will appear in the lower right-hand corner of the Storyboard window.
This wizard prompts you with relevant questions, trying to find the immediate causes of the incident. You go
through the wizard with the button ‘Next’ and by answering ‘Yes’ or ‘No’ to all the questions. When answering
yes you will identify what that immediate cause is. These immediate causes will then automatically appear in
your Root Cause Diagram. You can exit the Wizard at any time by clicking the cross icon in the top-right of the
Immediate Causes Wizard window, or by answering ‘No’ to further questions and finally ‘Finish’ to complete
the Wizard. It is recommended that you enter no more than three or four events into the Wizard so that it is
used maximally and does not become laborious.
Figure 12-1 The 'Immediate Cause' wizard

39
13 13 The Analysis Diagrams
When clicking on the Analysis Diagram in the navigator you will
get the choice between making a Root Cause or a Tripod Beta
Diagram first (see Figure 13-2). You can also make the choice at
the start page in the workflow. After this section is opened, it is
possible to make more diagrams. You can make multiple Root
Cause and Tripod Beta Analysis.
Multiple Analysis Diagrams
In the Analysis section it is possible to make multiple analysis diagrams, Root Cause diagrams and Tripod Beta
diagrams. In this way you have multiple views on your incident and it is a great way of brainstorming. Just
keep one diagram as your main diagram and use the others to play around with new ideas.
When you right click on the tab(s) that are at the bottom of your diagram window you will see four options:
- New... : add another Root Cause or Tripod diagram
- Rename: change the name of the selected analysis diagram
- Delete: remove the selected analysis diagram
- Duplicate: duplicate the selected diagram as a copy
13.1 Root Cause Diagram
Figure 13-1 Analysis choice

40
The Root Cause Diagram is divided in three parts: the Immediate Causes, Underlying Causes and Root Causes
(see Figure 3-1 Activation Dialog 1).
Building a Root Cause Diagram
Like in the Storyboard you can double-click in the background to add new Causes. You can also right-
click to add items from the Storyboard.
When double-clicking on a previous Cause, a new Cause with a linked line will appear. Vertical lines will
get the ‘Why?’ label and horizontal lines will get an ‘And/or’ labels.
When hovering over a cause four red triangles appear in each corner of the item. You
can use these triangles to draw lines in between causes. Just click in the triangle and
drag a line to a triangle of another item.
To create a new Cause, you can also go to the Actions button in the toolbar and select Add Item, right-
click using your mouse and select Add Cause, or simply double-click on the graphic.
There are several options to export your diagram. Go to Diagram > Export, here you see you can
export your diagram to Visio or export it as a metafile. You will then save your diagram as a picture
(.emf file). There is also a button in the toolbar Export Metafile... you can also export your diagram
by clicking at the Preview & Export button in the toolbar. A new window opens with an overview of
your diagram. You can export the diagram with the export button.
Figure 13-2 Root Cause Diagram

41
When clicking f11 you change the window toggle mode. Press it once you get full screen, press it
twice the windows and navigator disappear.
Layout options
To add or edit text, double-click in the Cause to zoom in and add or edit text. Click in the background
of the Storyboard to zoom out again or press enter. To do this you have to select the option ‘Enable
single-click editing of shapes’ in Tools > Application Settings > Diagram.
When you drag and move an item, the ‘children’ of that item will move as well. This makes the
customization of the layout easier. When you want to move just one item press the ‘alt’ button on your
keyboard while moving the item.
To redraw the layout of the diagram automatically, right click on any item and click on the option
‘Layout Immediate Children’ or ‘Layout all Children’. You can also click on the Layout button in the
toolbar.
You can modify the sizes of the sticky notes by selecting the ‘Free sizing of shapes’ option in Tools >
Application Settings > Diagram. You can also modify the text size by using the big A
and small a buttons in the toolbar.
You can color-code Causes using the drop-down menu next to ‘Color’ in the ‘Classification’ section.
(Click in the field to activate the drop-down menu.)
To select a particular part of your diagram, drag a square with your mouse over the items you want to
select. The selected area will then be highlighted. This is also a way to increase or decrease letter sizes
of the text of the items at the same time or copy the selection to clipboard (when you hit the ‘Copy to
Clipboard’ button only the selection will be copied).
Presentation options
When you have built a big tree and you want to present it to an audience, you do not want to show
the complete tree all at once. Therefore we made it possible to ‘hide’ certain parts of your tree to be
able to build it step by step. Right-click on a cause and you see the options ‘Hide Child Elements’ and
‘Hide Parent Elements’. With these options you can hide or show the child and/or parent element
attached to the selected item.
To select a particular part of your diagram, drag a square with your mouse over the items you want to
select. The selected area will then be highlighted. When you hit the ‘Copy to Clipboard’ button only the
selection will be copied and you can export for example to PowerPoint.
You can collapse and expand you Root Cause tree by clicking on the little yellow minuses in the upper
left and right corner of the items. The right minus will collapse the parents of the item, the left minus
collapses the children of the item. Then the minuses turn into plusses and you can expand your
selection again.

42
Right-click options
When right clicking on any of the items, you get a number of options (see Figure 13-3 Right mouse click
menu).
When right clicking on a Cause the first option is to add the
next Cause can be added.
When right-clicking on a Cause you see that there are
several options. You can add a Recommendation and a
Narrative. When adding a Recommendation a new window
opens where you can fill in all the information about that
recommendation, like
who is responsible, the
priority, the due date,
etc. A blue balloon with
the recommendation
code will then appear
on the item. In the
narrative balloon you
can place comments or extra information.
Then there is a Delete option, to delete the item.
The next options are for the layout of the children (items evolving from the selected item) of the item:
Layout Immediate Children
Layout All Children
The last option is to hide child or parent elements of that particular item.
Diagram shortcut keys
Ctrl + F Fit Diagram
Ctrl + L Layout Diagram
Ctrl + A Select all
Ctrl + B Layout all Children
Ctrl + Z Undo
Ctrl + Y Redo
Ctrl + Shift + P Pan
Ctrl + Alt + N Hide or Show Balloons
Figure 13-3 Right mouse click menu
(Root Cause)

43
13.2 Tripod Method Diagram
To make a Tripod diagram choose this when you get the Analysis choice (see
Figure 13-4 Tripod Analysis Diagram) or choose ‘Tripod Beta’ in the drop down lost under Analysis Diagram in
the Investigation Workflow at the start page.
Figure 13-4 Tripod Analysis Diagram
When the Tripod Diagram opens the main Event is already defined from the one line incident
statement. From this starting point you can enter, arrange, and connect the pieces of your
investigation using the shapes and definitions associated with the Tripod Method (
Figure 13-4 Tripod Analysis Diagram):
Event
Object
Hazard
Barrier
Active Failure
Precondition

44
Latent Failure
To start your Tripod Diagram:
Double-click in the Event item to create a Hazard and an Object for your first trio. (Make sure to
deselect the option ‘Enable single-click editing of shapes’ in Tools > Application Settings > Diagram).
You can continue double-clicking on every item in the diagram to create the next most logical step of
building your Tripod tree. The items will automatically be connected.
You can create additional items by using the Actions button in the toolbar, double clicking on existing
items, or by double clicking on a blank area of the diagram.
To add or edit text, double-click in the item to zoom in and add or edit text. Click in the background
of the Storyboard to zoom out again or press enter. To do this you have to select the option ‘Enable
single-click editing of shapes’ in Tools > Application Settings > Diagram.
To connect items hover over an item and four red triangles appear in each corner of the item. You can
use these triangles to draw lines in between items. Just click in the triangle and drag a line to a triangle
of another item, then click and drag to the item to which you want to connect.
When clicking f11 you change the window toggle mode. Press it once you get full screen, press it twice
the windows and navigator disappear.
To add a Barrier and Causation path:
Double-click on the line between the Event and the Hazard and/or the Event and Object to
automatically add a Failed Barrier.
To add a Missing Barrier and/or an Effective Barrier right-click on the line. You can also right click on an
existing Barrier and choose Convert to... > Effective Barrier or Missing Barrier.
If you double-click at a Failed Barrier, the Causation Path will be created – working backwards from the
Barrier. Barrier – Active Failure – Precondition – Latent Failure.
After that you can keep on double clicking on the different items. Double clicking on an Active Failure
will create another Precondition; double clicking on the Precondition will create an extra Latent Failure,
etc.
To add a BRF code to a Latent Failure:
Once you have added a Latent Failure to your diagram, you can select a BRF code.
45
In the bottom left corner of any Latent Failure item, there is a small drop-down window.
Click on the arrow to select from the list of BRF codes provided.
Layout options
To resize shapes select the option ‘Allow free sizing of shapes’ in Tools > Application Settings >
Diagram. Then little green handles will appear on the items to make them smaller or bigger.
When you drag and move an item, the ‘children’ of that item will move as well. This makes the
customization of the layout easier. When you want to move just one item press the ‘alt’ button on your
keyboard while moving the item.
To change the color of a line, click on it and change the color in the Properties window.
To redraw the layout of the diagram automatically, right click on any item and click on the option
‘Layout Immediate Children’ or ‘Layout all Children’. You can also click on the Layout button in the
toolbar.
To change the way the diagram is drawn you can change Layout options in Tools > Application
Settings > Diagram. Under the layout section you see different options:
Use right-angle links: select this option when you want the lines from Event to Hazard and Object to
appear right angled. When deselecting this option the lines will appear straight.
Automatically flip barriers: when selecting this option the barriers on the lines between Event and
Object will be flipped (turned upside down). This way the Causation Paths will go down instead of
up to make the layout more efficient.
Tripod Causation Path Link Styles: choose how you want the lines from the Barriers to the Active
Failures to appear. You have the choice between Straight, Curved and Right-Angle.
Tripod Diagram Alignment: choose how you want your diagram to be aligned. Top (default): the
Event appears on top (next to the Hazard), Centre Children: the Event appears in the middle of the
Hazard and Object, Centre Sub Trees: the main trio appears as default, the sub trees appear as
‘Centre Children’ and Bottom: the Event appears at the bottom of the diagram (next to the Object).
Presentation options
When you have built a big tree and you want to present it to an audience, you do not want to show
the complete tree all at once. Therefore we made it possible to ‘hide’ certain parts of your tree to be
able to build it step by step. In the toolbar you find two ‘hide’ buttons; ‘Hide Causation Paths’ and ‘Hide
Balloons’. When you click on the buttons again, the items appear again, you can also click on the
button ‘Show all’.

46
To select a particular part of your diagram, drag a square with your mouse over the items you want to
select. The selected area will then be highlighted. This is also a way to increase or decrease letter sizes
of the text of the items at the same time or copy the selection to clipboard. When you hit the ‘Copy to
Clipboard’ button only the selection will be copied and you can export for example to PowerPoint.
You can collapse and expand you Tripod tree by clicking on the little yellow minuses in the upper left
and right corner of the items. The right minus will collapse all the items at the right side of that item,
the left minus collapses the children of the item. Then the minuses turn into plusses and you can
expand your selection again.
When right-clicking on an item you can choose to hide the child or parent elements. This way you can
hide or show different parts of your diagram to be able to present it step by step.
Right-click options
When right clicking on any of the items, you get a number of
options (see Figure 13-5 Right mouse click menu (Tripod))
General
When right clicking on an item the first options are to add the
next items that can be added.
The next general option is to add a Recommendation and a
Narrative. When adding a Recommendation a new window
opens where you can fill in all the information about that
recommendation, like who is responsible, the priority, the due
date, etc. A blue balloon with the recommendation code will
then appear on the item. In the narrative balloon you can place
comments or extra information.
Then there is a Delete option, to delete the item.
The next options are for the layout of the children (items
evolving from the selected item) of the item:
Layout Immediate Children
Layout All Children
Then there is an option to convert the item to another item. With this option you can change the item
into another item of the Tripod Diagram.
The last option is to hide child or parent elements of that particular item.
Then there are a few options that count for only particular items:
Figure 13-5 Right mouse click menu
(Tripod)

47
Event/Hazard/Object
The option to Append Event and Append Event and Convert to... With this option you can append an
extra Event in the trio. With the option convert to, you append an Event and you can also convert to
item to a combined node (for example Event/Hazard combination).
Barriers
The first Barrier option is to move the Barriers left or right as opposed to other Barriers.
The next option is to flip the Barrier. With this option you can turn the Barrier upside down to optimize
the layout of the diagram. The Causation path will also be drawn downwards to make the layout more
efficient.
The last option for the Barrier is to insert another Barrier to the right or left from that item. You can
choose to add a Missing Barrier, a Failed Barrier or an Effective Barrier.
Diagram shortcut keys
Ctrl + F Fit Diagram
Ctrl + L Layout Diagram
Ctrl + A Select all
Ctrl + B Layout all Children
Ctrl + Z Undo
Ctrl + Y Redo
Ctrl + Shift + P Pan
Ctrl + Alt + N Hide or Show Balloons
13.3 Analysis Diagram windows
13.3.1 Item Properties (Figure 13-6 Properties window):
You can also edit the name, description, location of event,
date and time, and other information in the Item Properties
Window on the right side.
To the right bottom side of your diagram there is a smaller
window where you can edit information directly.
Any changes made here will be reflected instantly in your
diagram.
Figure 13-6 Properties window

48
13.3.2 Overview (Figure 13-7 Overview window):
Choose between the Overview, Recommendations and Attachment windows using the tabs at the
bottom of the windows.
The Overview window shows you a bird’s eye view of the
entire Tripod Method Diagram/Root Cause Diagram. This is a
good way to navigate a complex Diagram and zero in on
portions you wish to edit or move.
To select a portion of the Diagram, use your mouse to drag
the green box over the area you wish to focus on. The
Diagram will snap to the selected section.
Use the Fit button on the toolbar to show the whole Diagram
again.
13.3.3 Attachments (Figure 13-8 Attachments window):
Adding Notes:
Click the plus button to create a new note
Provide the note with a title and add your note text in the
field marked ‘Notes’, or copy and paste your note text from
another document into this field. (NB Please note that it can
be very useful to add interview notes in this way.) The text
you enter into this field can be shown in the report or left
out by clicking the Show in Report checkbox. You can then
move back to a list of the notes, images and attachments
you have added by clicking the small arrow button.
Adding images and other attachments:
Adding images and other attachments by locating the relevant file on your computer: You can add
images and other attachments (for example Word documents) by clicking on the small open folder
icon . You can then select an image or other attachment. You can rename it in the ‘Title’ field, and
elect whether or not the attachment should be shown in the report by clicking the Show in Report?
checkbox. You can then move back to a list of the notes, images and attachments you have added by
clicking the small arrow button.
Adding images and other attachments using drag and drop: You can add images and other
attachments by physically dragging the relevant file from its location on your computer into the
‘Attachments’ field using your mouse. You can then move back to a list of the notes, images and
attachments you have added by clicking the small arrow button.
Using the ‘Link’ button: If you have added an attachment previously to one individual’s details,
and you wish to add the same attachment to another individual’s details, you can do this by using the
Figure 13-7 Overview window
Figure 13-8 Attachments window

49
‘Link’ button. Use the small arrow button next to the icon to see the attachments you have
already added elsewhere shown as a drop-down menu.
Saving the attachments to disk: Use the small Save icon to save your attachments to a location of
your choosing.
NB Please note that only plain text can be viewed in the report. This means that only text that has been
copied and pasted into the ‘Notes’ field can be viewed in the report. Pictures can also be viewed in the
report. However, it is not possible to view attached documents (for example, Word documents) in the
report. You must save these files separately.

50
14 14 Recommendations & Executive Summary
14.1 Recommendations
In this section of the software, the recommendations made by you or your team are displayed. The
recommendations that are added in the Diagram section are automatically added in this section. But you can
also add new recommendations here by using the Add button. You can also add a new recommendation
by clicking the little plus button at the bottom left of the table. When clicking these buttons a new window
opens (see
Figure 14-1 Recommendations section (1)) where you can fill in all the information about your recommendation:
the person responsible, priority, due date and whether it is completed or not. All the recommendations will
appear in a table. You can arrange this table by name, person responsible, date, and priority. You can add or
remove recommendations on this screen by clicking on the appropriate buttons.
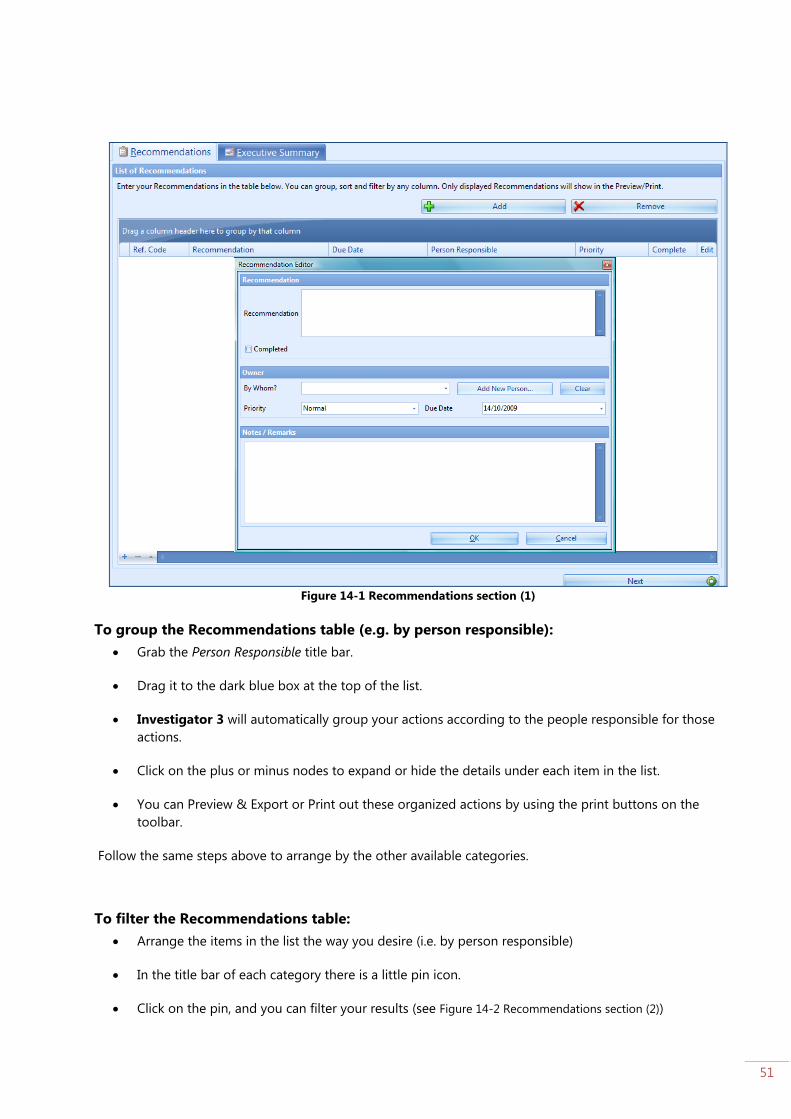
51
Figure 14-1 Recommendations section (1)
To group the Recommendations table (e.g. by person responsible):
Grab the Person Responsible title bar.
Drag it to the dark blue box at the top of the list.
Investigator 3 will automatically group your actions according to the people responsible for those
actions.
Click on the plus or minus nodes to expand or hide the details under each item in the list.
You can Preview & Export or Print out these organized actions by using the print buttons on the
toolbar.
Follow the same steps above to arrange by the other available categories.
To filter the Recommendations table:
Arrange the items in the list the way you desire (i.e. by person responsible)
In the title bar of each category there is a little pin icon.
Click on the pin, and you can filter your results (see Figure 14-2 Recommendations section (2))

52
Use the Preview & Export button in the toolbar to export you selection of the list or print it. This is
useful for providing people with specified lists – to assign actions, to group by date, etc.
Figure 14-2 Recommendations section (2)
14.2 Executive Summary
When clicking in the Next button or clicking on the tab you go to the next section: the Executive summary (see
Figure 14-3 Executive Summary). The Executive summary section consists of two parts: Discussion of Findings and
Conclusion. These are basically free text fields to write you findings and discussion. You can also copy-paste
text from Word or other applications. Again, you can use the Preview & Export or Print buttons in the toolbar
to export or print this section.
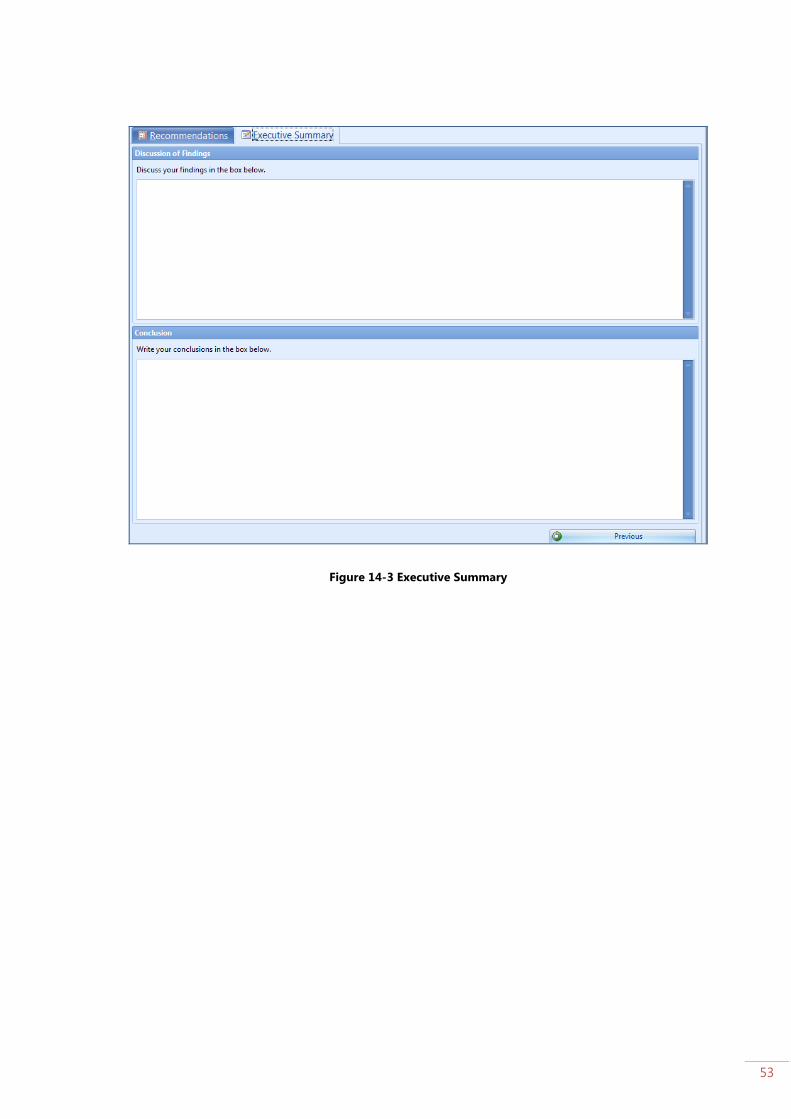
53
Figure 14-3 Executive Summary

54
15 15 Report
When you click on Report in the navigator, your investigation report will be created automatically based on all
the information you provided in the program (see Figure 15-1 Report). On the left side of the screen, there is a
Document Map you can use to navigate through your final report. You can click on the plus or minus nodes to
expand or hide the subheadings. To adjust settings for the report, like font size or select certain options go to
Tools > Application Settings > Report or Word Report.
Figure 15-1 Report
Investigator 3 creates the following chapters in your report:
Contents
Terms of Reference
Discussion of Findings
Conclusion
Recommendations
Introduction
Method of Work
Investigation Team

55
The Incident
Description of the Incident
Consequences
Detailed description of the Incident
When it happened
Where it happened
People Involved
Injured People
Other People
Findings of the Investigation
Timeline of events
Immediate Causes of the incident
Underlying Causes of the incident
Root Causes of the incident
Appendixes
Analysis Diagram (either Tripod or Root Cause)
Persons Interviewed
Injury Reports
15.1 Layout of the report
There are several adjustments you can make for the layout of the report:
Background color: click on the Color button in the toolbar to choose a background color for your
report.
Watermark: click on the Watermark button in the toolbar to open the Watermark window. Here you
can choose all the options for the watermark like text, color, size or if you would like a picture as a
watermark. You can also change some Watermark settings in Tools > Application Settings > Report.
Company logo: go to Tools > Application Settings > Report. Here you can right-click on the report
logo to edit or change it to your company logo.
15.2 Exporting the Report
There are several ways to export you report:
Use the Word button in the toolbar to export directly to Word.
The software will then ask you to name you word report and if you want to open the file. In Word the
report will be fully editable. The report is already put in a template where the contents are
automatically updated when you make changes in the chapters. Just press F9 and click on the company
logo to update the contents.
You can also click on the Export button in the toolbar to export your report to different
applications. You can export the report as a PDF file, HTML file, RTF file, Excel file, etc.

56
You can also send your report as an email with the email button in the toolbar. Again you can
choose from different formats.
Figure 15-2 Word Report

57
A
Attachment
How to install Investigator 3 – MSI
1. Click on the download link
2. Click on Save
3. Save the installer

58
4. Download the installer
5. Open the file (double click icon)
6. Run the software
7. Start the Wizard
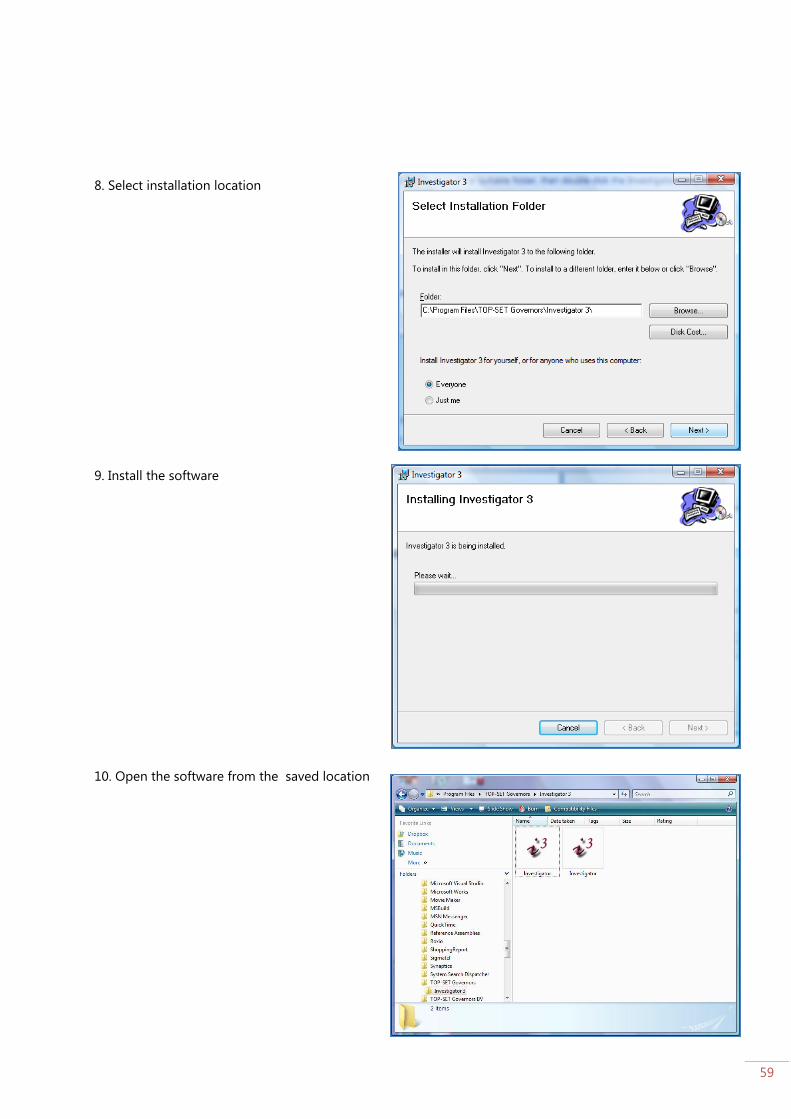
59
8. Select installation location
9. Install the software
10. Open the software from the saved location

60
11. Run the software and choose how you want to run
the software

61
B
Attachment
How to install Investigator 3 – zip
1. Click on the download link
2. Click on Save
3. Save the file
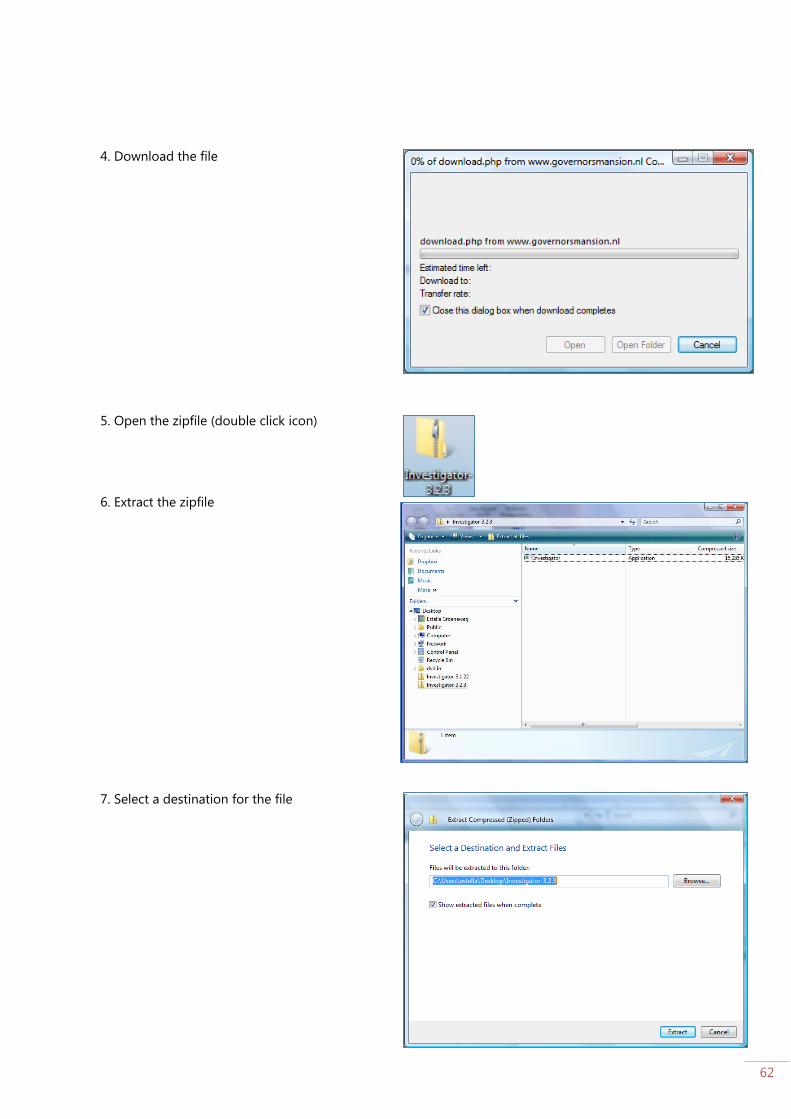
62
4. Download the file
5. Open the zipfile (double click icon)
6. Extract the zipfile
7. Select a destination for the file

63
10. Open the software from the saved location
11. Run the software
12. Choose how you want to run the software

64