Embed Size (px)
Citation preview
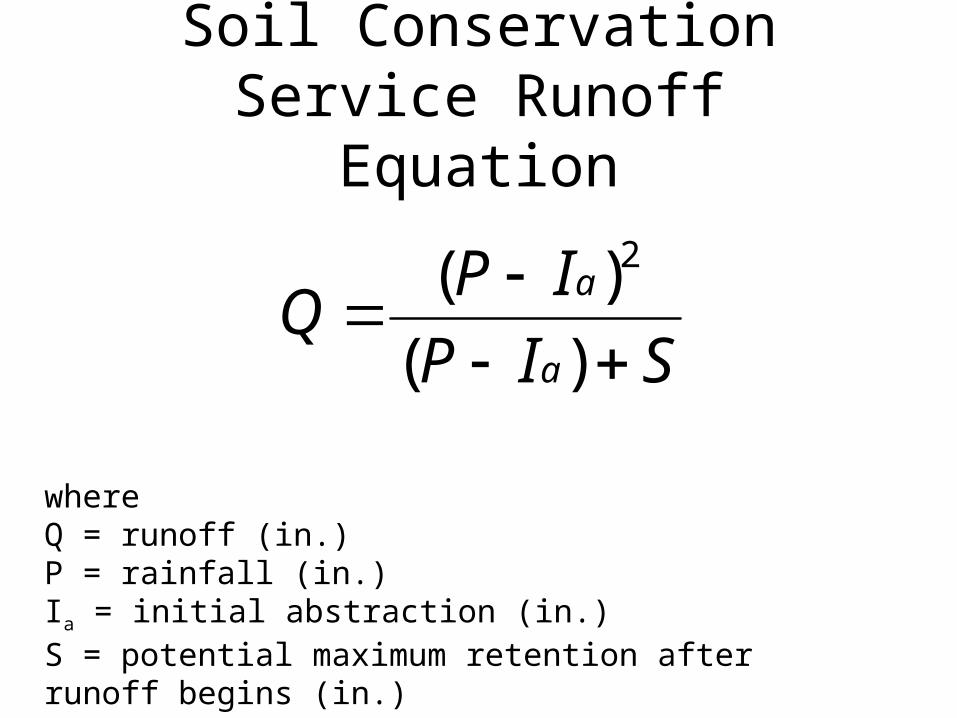
Soil Conservation Service Runoff Equation
SIP
IPQ
a
a
)(
)( 2
where Q = runoff (in.)P = rainfall (in.) Ia = initial abstraction (in.)S = potential maximum retention after runoff begins (in.)

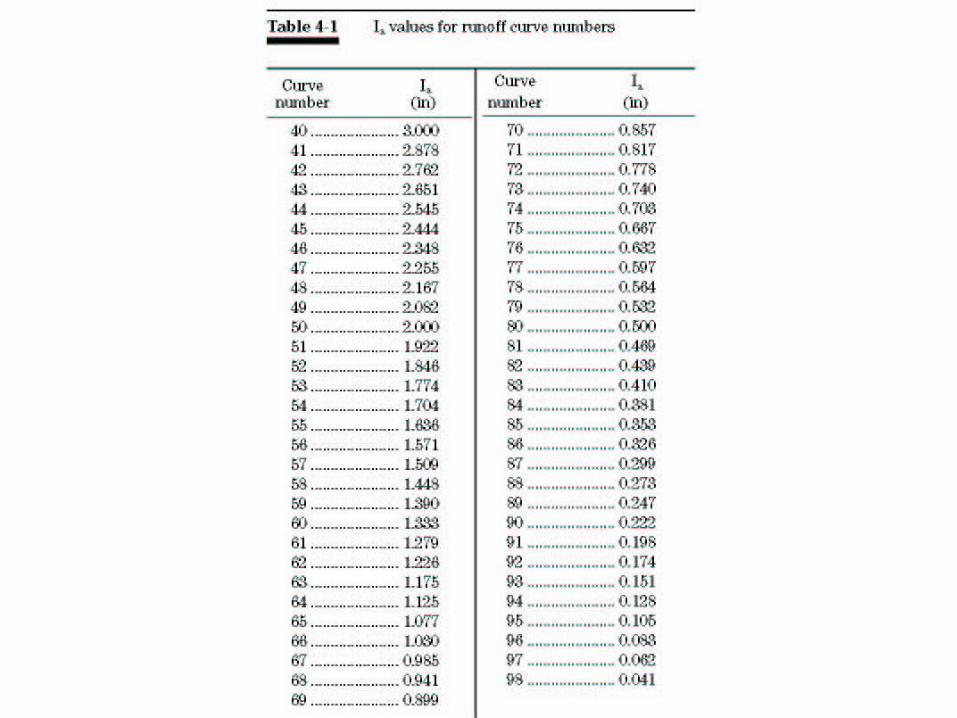
Initial Abstraction, Ia
SIa 2.0
Ia is all losses before runoff begins. It includes water retained in surface depressions, water intercepted by vegetation, evaporation, and infiltration. Ia is highly variable but generally is correlated with soil and cover parameters.

Soil Conservation Service Runoff Equation becomes:
)8.0(
)2.0( 2
SP
SPQ
101000
CN
S
where CN = curve number


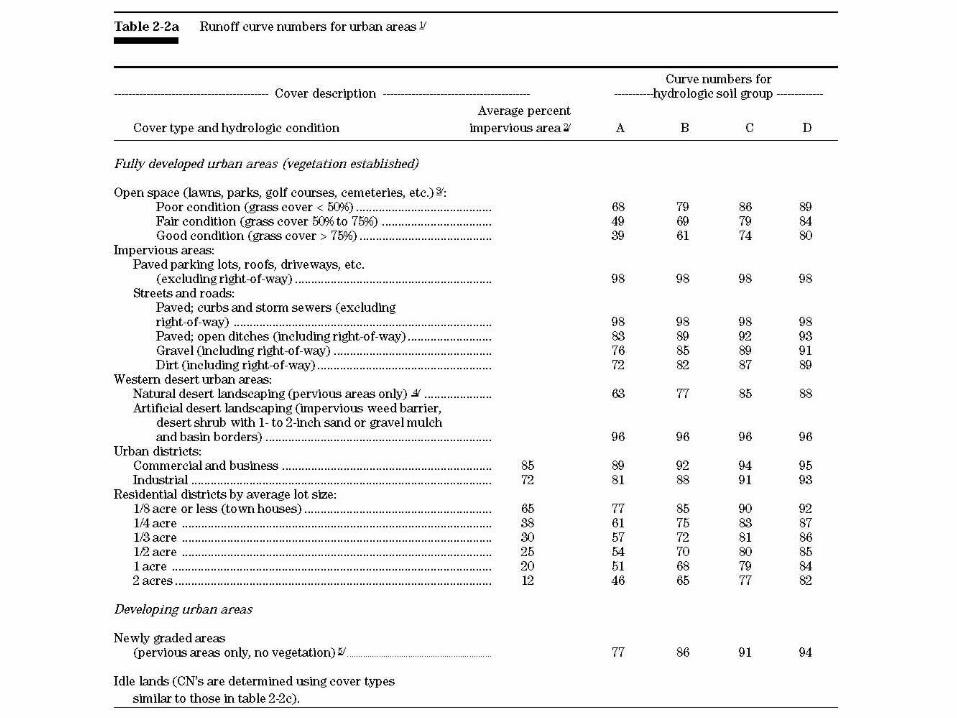
Curve Numbers
The major factors that determine CN are the hydrologic soil group (HSG), cover type, treatment, hydrologic condition, and antecedent runoff condition (ARC). Another factor considered is whether impervious areas outlet directly to the drainage system (connected) or whether the flow spreads over pervious areas before entering the drainage system (unconnected).

Group A soils have low runoff potential and high infiltration rates even when thoroughly wetted. They consist chiefly of deep, well to excessively drained sand or gravel and have a high rate of water transmission (greater than 0.30 in/hr). Soil Texture: Sand, loamy sand, or sandy loam
Group B soils have moderate infiltration rates when thoroughly wetted and consist chiefly of moderately deep to deep, moderately well to well drained soils with moderately fine to moderately coarse textures. These soils have a moderate rate of water transmission (0.15-0.30 in/hr). Soil Texture: Silt loam or loam
Group C soils have low infiltration rates when thoroughly wetted and consist chiefly of soils with a layer that impedes downward movement of water and soils with moderately fine to fine texture. These soils have a low rate of water transmission (0.05-0.15 in/hr). Soil Texture: Sandy clay loam
Group D soils have high runoff potential. They have very low infiltration rates when thoroughly wetted and consist chiefly of clay soils with a high swelling potential, soils with a permanent high water table, soils with a claypan or clay layer at or near the surface, and shallow soils over nearly impervious material. These soils have a very low rate of water transmission (0-0.05 in/hr). Soil Texture: Clay loam, silty clay loam, sandy clay, silty clay, or clay
Hydrologic Soil Groups


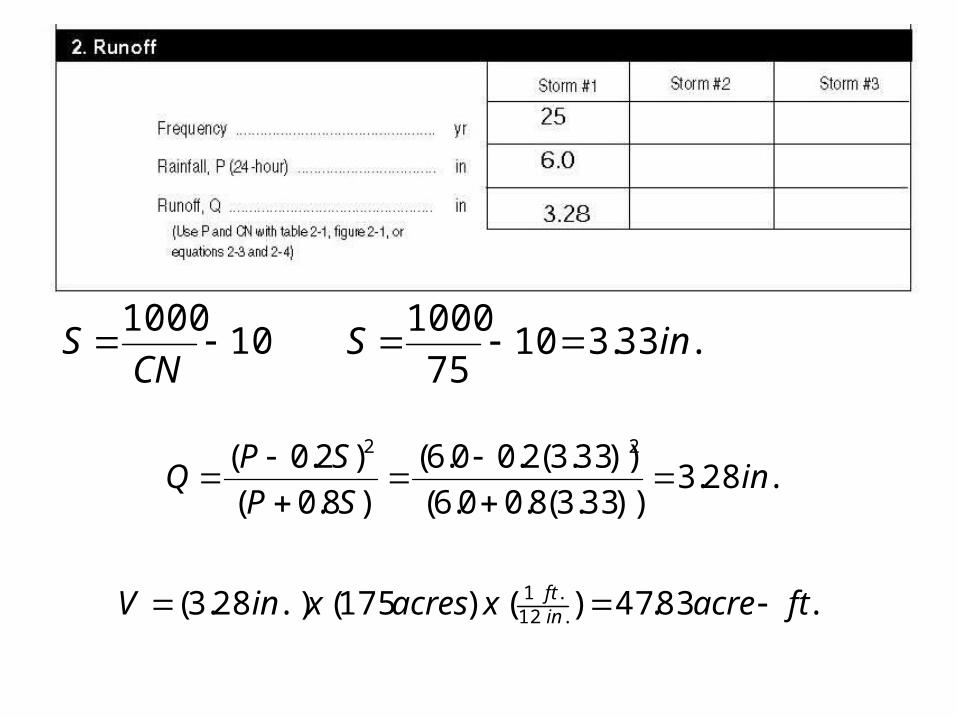
101000
CN
S
.28.3))33.3(8.00.6(
))33.3(2.00.6(
)8.0(
)2.0( 22
inSP
SPQ
.33.31075
1000inS
.83.47)()175(.)28.3( .12.1 ftacrexacresxinV inft

Time of Concentration and Travel Time
• Travel Time (Tt) is the time it takes water to travel from one location to another in a watershed. It is typically a component of Tc.
• Time of Concentration (Tc) is the time for runoff to travel from the hydraulically most distance point of the watershed to a point of interest in the watershed.
Factors Affecting Tt and Tc
• Surface roughness• Channel shape and flow patterns• Slope
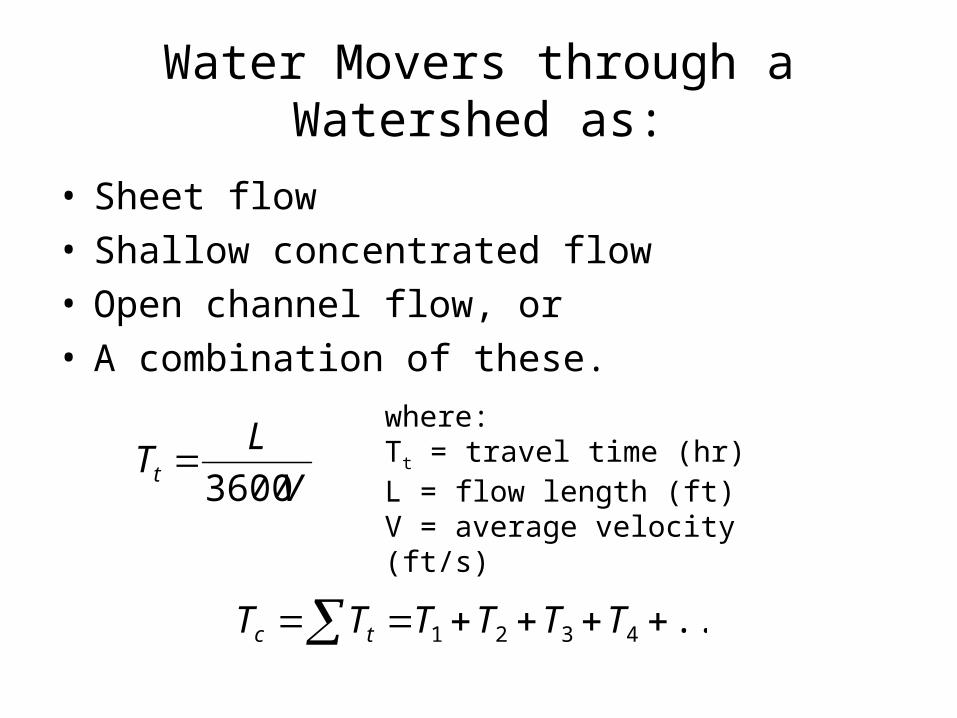
Water Movers through a Watershed as:
• Sheet flow• Shallow concentrated flow• Open channel flow, or• A combination of these.
V
LTt 3600
where:Tt = travel time (hr)L = flow length (ft)V = average velocity (ft/s)
...4321 TTTTTT tc

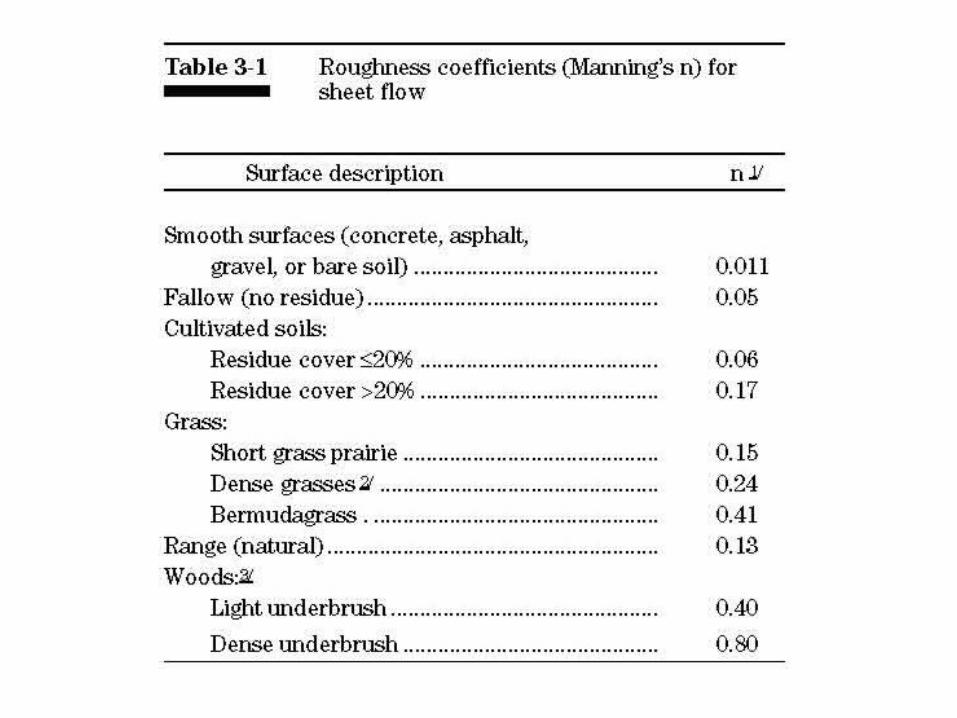
Sheet Flow
• Shallow flow depth (< 0.1 ft) over plane surfaces• Only for flows up to 300 feet
4.05.02
8.0
)(
)(007.0
sP
nLTt
where:Tt = travel time (hr)n = manning’s roughness coefficient (table 3-1)L = flow length (ft)P2 = 2-year, 24-hour rainfall (in)s = slope of hydraulic grade line (land slope, ft/ft)

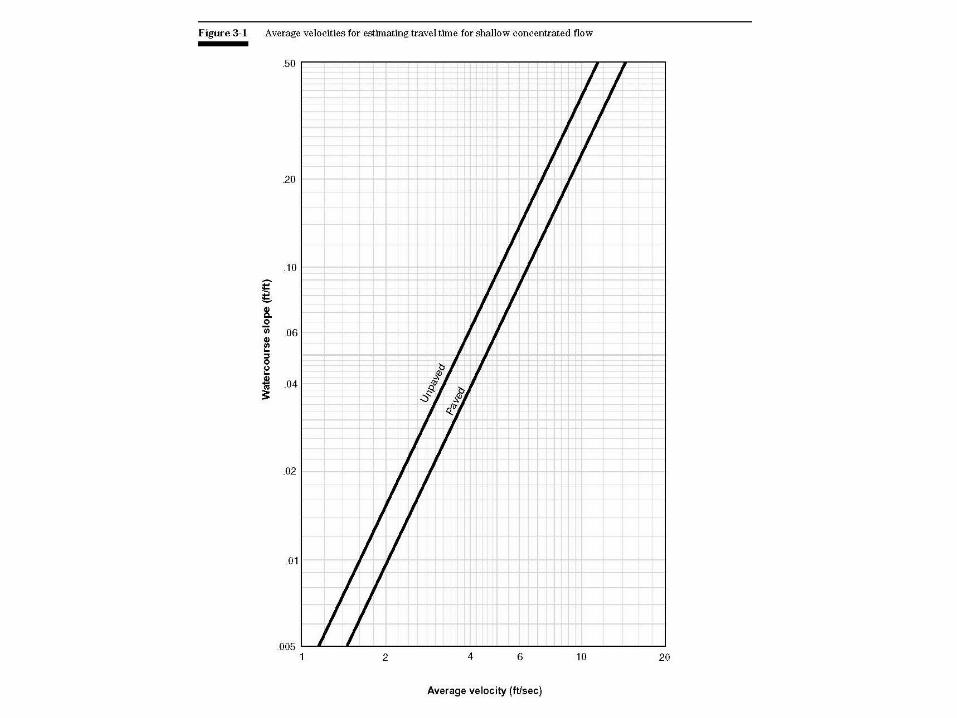
Shallow Concentrated Flow
• After a maximum of 300 feet, sheet flow usually becomes shallow concentrated flow.
V
LTt 3600
where:Tt = travel time (hr)L = flow length (ft)V = average velocity from Figure 3-1 (ft/s)

Open Channel Flow
• Based upon Manning’s Equation
n
srV
2/13/249.1
where:V = average velocity (ft/s)r = hydraulic radius (ft) and is equal to area/wetted perimeters = channel slope (ft/ft)n = Manning’s roughness coefficient for open channel flow
V
LTt 3600
Then plug V and L into this equation:

Example
Segment AB: Sheet flow; dense grass; slope (s) = 0.01 ft/ft; and length (L) = 100 ft.
Segment BC: Shallow concentrated flow; unpaved; s = 0.01 ft/ft; and L = 1,400 ft.
Segment CD: Channel flow; Manning’s n = .05; flow area (a) = 27 ft2; wetted perimeter (pw) = 28.2 ft; s = 0.005 ft/ft; and L = 7,300 ft.

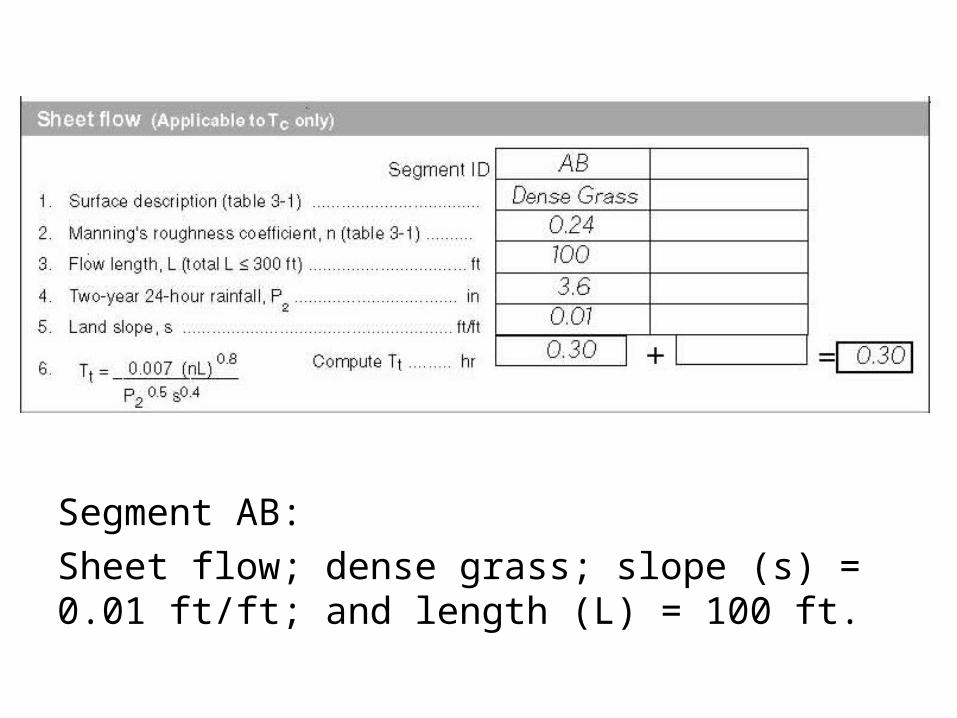
Segment AB:
Sheet flow; dense grass; slope (s) = 0.01 ft/ft; and length (L) = 100 ft.

Segment BC:
Shallow concentrated flow; unpaved; s = 0.01 ft/ft; and L = 1,400 ft.

Segment CD:Channel flow; Manning’s n = .05; flow area (a) = 27 ft2; wetted perimeter (pw) = 28.2 ft; s = 0.005 ft/ft; and L = 7,300 ft.

Graphical Peak Discharge Method
• The peak discharge equations used is:
pmup QFAqq
where:
qp = peak discharge (cfs)
qu = unit peak discharge (csm/in)
Am = drainage area (mi2)
Q = runoff (in)
Fp = pond and swamp adjustment factor


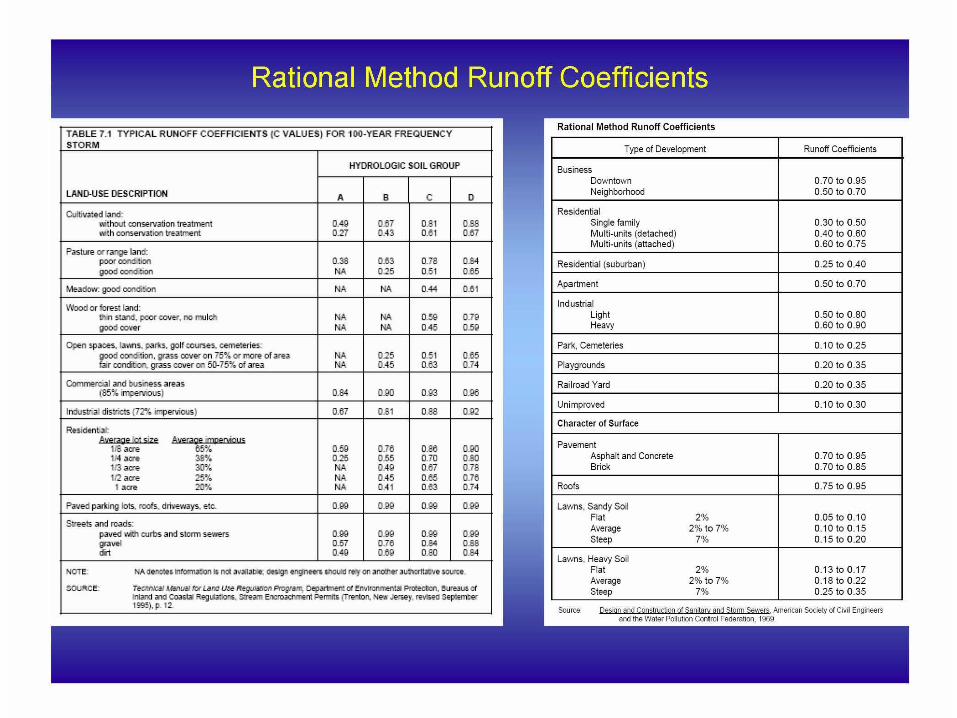
Rational Method(used for areas of less than 50 acres)
Q = C i A where:
Q = Peak rate of runoff in cubic feet per second
C = Runoff coefficient, an empirical coefficient representing a relationship between rainfall and runoff
i = Average intensity of rainfall for the time of concentration (Tc) for a selected design storm
A = Drainage area in acres

Lets convert In-Ac/Hr to CFS:[(1ft / 12 In) x (43,560 ft2 / Ac)] / 3600 Sec / Hr = 1.008 CFS / In-Ac / Hr
The degree of accuracy does not warrant a units conversion factor (constant) of1.008!!