Embed Size (px)
Citation preview

agriculture
Article
Soil N2O Emissions under Different N Rates in an OilPalm Plantation on Tropical Peatland
Auldry Chaddy 12 Lulie Melling 2 Kiwamu Ishikura 3 and Ryusuke Hatano 1
1 Laboratory of Soil Science Graduate School of Agriculture Hokkaido University Hokkaido 060-8589 Japanhatanochemagrhokudaiacjp
2 Sarawak Tropical Peat Research Institute Lot 6035 Kuching-Samarahan Expressway94300 Kota Samarahan Sarawak Malaysia luliemellinggmailcom
3 Tokachi Agricultural Experiment Station Hokkaido Research Organization Hokkaido 082-0081 Japanishikura-kiwamuhroorjp
Correspondence auldrychaddygmailcom Tel +60-82-662-491
Received 1 July 2019 Accepted 19 September 2019 Published 1 October 2019
Abstract (1) Background Nitrogen (N) fertilization on drained tropical peatland will likely stimulatepeat decomposition and mineralization enhancing N2O emission from the peat soil (2) MethodsA field experiment was conducted to quantify the N2O emissions from soil in an oil palm plantation(Elaeis guineensis Jacq) located in a tropical peatland in Sarawak Malaysia under different ratesof N fertilizers The study was conducted from January 2010 to December 2013 and resumed fromJanuary 2016 to December 2017 Nitrous oxide (N2O) flux was measured every month using a closedchamber method for four different N rates controlmdashwithout N (T1) 311 kg N haminus1 yrminus1 (T2)622 kg N haminus1 yrminus1 (T3) and 1243 kg N haminus1 yrminus1 (T4) (3) Results Application of the Nfertilizer significantly increased annual cumulative N2O emissions for T4 only in the years2010 (p = 0017) 2011 (p = 0012) 2012 (p = 0007) and 2016 (p = 0048) The highest average annualcumulative N2O emissions were recorded for T4 (415 plusmn 287 kg N haminus1 yrminus1) followed byT3 (351 plusmn 257 kg N haminus1 yrminus1) T1 (252 plusmn 178 kg N haminus1 yrminus1) and T2 (251 plusmn 154 kg N haminus1 yrminus1)indicating that the N rates of 622 kg N haminus1 yrminus1 and 1243 kg N haminus1 yrminus1 increased the averageannual cumulative N2O emissions by 39 and 65 respectively as compared to the controlThe N fertilization had no significant effect on annual oil palm yield (p = 0994) Alternating betweenlow (deeper than minus60 cm) and high groundwater level (GWL) (shallower than minus60 cm) enhancednitrification during low GWL further supplying NO3
minus for denitrification in the high GWLand contributing to higher N2O emissions in high GWL The emissions of N2O ranged from17 microg N mminus2 hrminus1 to 2447 microg N mminus2 hrminus1 and decreased when the water-filled pore space (WFPS) wasbetween 70 and 96 suggesting the occurrence of complete denitrification A positive correlationbetween N2O emissions and NO3
minus at 70ndash96 WFPS indicated that denitrification increased withincreased NO3
minus availability Based on their standardized regression coefficients the effect of GWLon N2O emissions increased with increased N rate (p lt 0001) Furthermore it was found thatannual oil palm yields negatively correlated with annual N2O emission and NO3
minus for all treatmentsBoth nitrification and denitrification increased with increased N availability making both processesimportant sources of N2O in oil palm cultivation on tropical peatland and (4) Conclusions To improveunderstanding of N2O mitigation strategies further studies should consider plant N uptake on N2Oemissions at least until the completion of the planting
Keywords ground water level (GWL) water-filled pore space (WFPS) oil palm yieldnitrification denitrification
Agriculture 2019 9 213 doi103390agriculture9100213 wwwmdpicomjournalagriculture
Agriculture 2019 9 213 2 of 18
1 Introduction
Nitrous oxide (N2O) is one of the most potent greenhouse gases with 298 times the global warmingpotential (GWP) of CO2 over a 100-year timescale [1] Agricultural soils are responsible for 60ndash80of anthropogenic N2O sources mainly derived from synthetic fertilizers manure applications and cropresidues left on farms [23] The drive to fulfill the global demand for food supply and the scarcity of othersuitable lands for agriculture has pushed the expansion of oil palm plantations into lowland tropicalpeatland Drainage in tropical peatland is strengthened to create oxic conditions for palm growth with anoptimum water table depth of 50ndash75 cm [4] Furthermore nitrogen (N) fertilization is added to promotepalm productivity In Malaysia the recommended annual N fertilizer for immature and mature oil palmsestablished on tropical peat soil is 50ndash100 kg N haminus1 yrminus1 and 120ndash160 kg N haminus1 yrminus1 respectively [5]However both will likely stimulate peat decomposition and mineralization enhancing N2O emissionfrom the soil [6ndash8]
The N2O emissions from soils are produced by the microbial processes of nitrification (conversion ofNH4
+ to NO3minus) in aerobic condition and denitrification (NO3
minus to N2O or N2) in anaerobic condition [69]Takakai et al [10] found that N2O emission from vegetable fields on tropical peatland significantlyincreased in the wet season and although NO3-N still accumulated in the soil in the dry seasonN2O emission was low Therefore denitrification is believed to be a significant emitter of N2O and thatsoil moisture is a major environmental factor controlling the N2O emissions as it regulates the oxygenavailability to soil microbes affecting the process of denitrification and nitrification [9] One studyobserved nitrification as the dominant N2O-producing process in all soils with 60 water-filled porespace (WFPS) while 70 WFPS peat soil was dominated by denitrification [11] Groundwater level(GWL) governs the anaerobicity and mineralization rate of soil [12] Dobbie and Smith [13] found thatrises in GWL were associated with increases in the WFPS of topsoil The lowering of GWL was mainlyreported to increase N2O emissions by introducing an oxic layer enhancing peat decomposition andthus nitrogen mineralization [614] However another study reported that the presence of groundwaterenhanced N2O production through denitrification [1315] Factors such as soil pH precipitation [16]and NH4
+ and NO3minus concentration [1718] have also been identified to affect soil N2O emissions
Only a few studies on soil N2O emissions from oil palm plantation on tropical peatland [16ndash18]have been carried out Of these studies Oktarita et al [18] conducted the only long-term studySakata et al [16] found that there were no significant effects of the N fertilizer on N2O emissionsin a young oil palm plantation on peat but high N2O emissions were observed when fertilizer wasapplied to wet peat soil They concluded that N fertilizer had insignificant effects on annual N2Oemissions because of the predominantly high emissions resulting from peat decomposition [1018]Meanwhile Hadi et al [19] reported that the addition of ammonium sulphate to soil significantlyreduced the emission of N2O compared to the control treatments because of the high ammoniumcontent that inhibited nitrification
Emissions of N2O are typically erratic often occurring as pulse events They are also spatiallyvariable and hard to predict as they are generally not well correlated with any single environmentalfactor [20] Thus more information and understanding of the key factors influencing the responseof soil N2O emissions due to N fertilization besides urea is necessary to develop approaches to mitigateN2O emissions from cultivated tropical peatland Finding a suitable nitrogen rate for optimum oilpalm growth and yield whilst maintaining low environmental impact is also crucial for the economicgrowth of the oil palm sector in Malaysia
In this study long-term monitoring was conducted to quantify soil N2O emissions by varyingthe rates of N fertilizers and the key factors influencing the response of soil N2O emissions under Nfertilization were identified In this study ammonium sulphate (21 N) was used for N fertilizationinstead of urea
Agriculture 2019 9 213 3 of 18
2 Materials and Methods
21 Site Description
This study was carried out in an oil palm plantation (Elaeis guineensis Jacq) on tropical peatlandin Sarawak Malaysia (211rsquo N 11150rsquo E) Sarawak has an average annual air temperature and anannual rainfall of 326 C and 2701 mm respectively Generally the wet season occurs between Octoberand March while the dry season occurs between April and September The peat in the experimental siteis a deep peat of about 9 m depth classified as Typic Haplofibrist based on the USDA soil classificationsystem [21] and Dystric Histosols based on the World Reference Base (WRB) for soil classificationsystems [22] The site was cleared and drained in 2007 After the peat surface was flattened withcompaction and consolidated using a heavy machine oil palms were planted in February 2008 ata density of 148 palms haminus1 (85 m between oil palms in a triangular design) The water table level wasinitially deeper than minus1 m but became shallower and controlled between minus50 cm and minus70 cm belowthe soil surface in June 2010 and therefore suited for oil palm growth
22 Field Experimental Design
The experiment used a randomized complete block design with four different N rates in threeblocks (three replications) Each block (1564 m2) consisted of 36 oil palms of which 16 central palmswere selected for the fresh fruit bunch (FFB) collection record while four were selected as the gassampling points Each block was separated by 2 to 3 rows of palms or field drains as shown in Figure 1The treatments included the control (T1 without N fertilization) low N (T2 311 kg N haminus1) moderate N(T3 622 kg N haminus1) and high N (T4 1243 kg N haminus1) The moderate N rate (T3) in this study was basedon the recommended rate by Hasnol et al [23] Ammonium sulphate (AS) (21N) was applied as the Nfertilizer four times a year in March June September and November The rate of N fertilization isshown in Table 1 Other fertilizers such as rock phosphate (RP) muriate of potash (MOP) copper (Cu)Zinc (Zn) and borate (Bo) were also applied based on the schedule shown in Table 2 All fertilizerswere applied 2 m away from the palm trunk (Figure 1)
Agriculture 2019 9 x FOR PEER REVIEW 3 of 18
This study was carried out in an oil palm plantation (Elaeis guineensis Jacq) on tropical peatland in Sarawak Malaysia (2deg11rsquo N 111deg50rsquo E) Sarawak has an average annual air temperature and an annual rainfall of 326 degC and 2701 mm respectively Generally the wet season occurs between October and March while the dry season occurs between April and September The peat in the experimental site is a deep peat of about 9 m depth classified as Typic Haplofibrist based on the USDA soil classification system [21] and Dystric Histosols based on the World Reference Base (WRB) for soil classification systems [22] The site was cleared and drained in 2007 After the peat surface was flattened with compaction and consolidated using a heavy machine oil palms were planted in February 2008 at a density of 148 palms haminus1 (85 m between oil palms in a triangular design) The water table level was initially deeper than minus1 m but became shallower and controlled between minus50 cm and minus70 cm below the soil surface in June 2010 and therefore suited for oil palm growth
22 Field Experimental Design
The experiment used a randomized complete block design with four different N rates in three blocks (three replications) Each block (1564 m2) consisted of 36 oil palms of which 16 central palms were selected for the fresh fruit bunch (FFB) collection record while four were selected as the gas sampling points Each block was separated by 2 to 3 rows of palms or field drains as shown in Figure 1 The treatments included the control (T1 without N fertilization) low N (T2 311 kg N haminus1) moderate N (T3 622 kg N haminus1) and high N (T4 1243 kg N haminus1) The moderate N rate (T3) in this study was based on the recommended rate by Hasnol et al [23] Ammonium sulphate (AS) (21N) was applied as the N fertilizer four times a year in March June September and November The rate of N fertilization is shown in Table 1 Other fertilizers such as rock phosphate (RP) muriate of potash (MOP) copper (Cu) Zinc (Zn) and borate (Bo) were also applied based on the schedule shown in Table 2 All fertilizers were applied 2 m away from the palm trunk (Figure 1)
Figure 1 A diagram of the experimental design each color represents different treatments (blackmdashT1 yellowmdashT2 redmdashT3 and greenmdashT4)
Table 1 Rate of ammonium sulphate (AS)
Treatment Month kg AS palmminus1 kg AS palmminus1 yrminus1
kg N haminus1 yrminus1
T1 March 0 0 0 June 0 September 0 November 0
T2 March 025 1 311
Figure 1 A diagram of the experimental design each color represents different treatments (blackmdashT1yellowmdashT2 redmdashT3 and greenmdashT4)
Agriculture 2019 9 213 4 of 18
Table 1 Rate of ammonium sulphate (AS)
Treatment Month kg AS palmminus1 kg AS palmminus1 yrminus1 kg N haminus1 yrminus1
T1 March 0 0 0June 0
September 0November 0
T2 March 025 1 311June 025
September 025November 025
T3 March 05 2 622June 05
September 05November 05
T4 March 1 4 1243June 1
September 1November 1
Table 2 Fertilization schedule from 2010 to 2017 (kg palmminus1)
RateFebruary March May June
RP AS MOP Cu Zn Bo AS MOP
T1 (Control) 175 0 1 01 01 01 0 1T2 (Low N) 175 025 1 01 01 01 025 1T3 (Recommended N) 175 05 1 01 01 01 05 1T4 (High N) 175 10 1 01 01 01 10 1
RateAugust September October November
Kieserite AS MOP Cu Zn Bo AS MOP
T1 (Control) 175 0 16 01 01 01 0 16T2 (Low N) 175 025 16 01 01 01 025 16T3 (Recommended N) 175 05 16 01 01 01 05 16T4 (High N) 175 10 16 01 01 01 10 16
Ammonium sulphate (NH4)2SO4 (AS) Rock phosphate Ca3(PO4)2 (RP) Muriate of potash (KCl) (MOP) Copper (Cu)Zinc (Zn) Borate (B2O3) (Bo) All values are in kilogram (kg)
23 Soil N2O Emission Measurements and Soil Sampling
This study was conducted from January 2010 to December 2013 and resumed from January2016 to December 2017 The N2O emissions were measured in the first week of every month ona non-rainy day 1 week after fertilization using a closed chamber method The chambers consistedof white-painted stainless-steel rings (25 cm height with a 20 cm diameter) Four palms in the middleof each replication plot were selected for the gas sampling Prior to gas sampling each chamber for eachpalm was placed directly into the soil at a fertilizer spot 2 m away from the selected palm The chamberwas then inserted directly up to 3 cm depth To attain stability in the presence of installation disturbanceall the chambers were left for 30 minutes upon installation [24] Gas emissions in the field were collectedbetween 11 am and 2 pm Before closing the chamber a 20 mL gas sample from the headspaceof each chamber was extracted using a gas-tight 25 mL syringe and transferred into an evacuated vialfor N2O analysis This measurement was regarded as time 0 min Under closed chamber conditionsanother 20 mL gas sample was taken after 10 20 and 40 min and then transferred into an evacuatedvial In the laboratory N2O gas concentrations were determined using an electron capture detector(ECD) gas chromatograph (Agilent Technologies 7890A)
Agriculture 2019 9 213 5 of 18
Gas emissions were calculated using the following linear regression equation [25]
F = p times h times (∆c∆t) times (273(273 + T) times α (1)
where F is the gas flux (microg N mminus2 hminus1 for N2O) p is the gas density (N2O = 1978 times 109 microg mminus3)h is the height of the chamber from the soil surface (m) ∆c∆t is the change in gas concentrationinside the chamber during the sampling period (10minus6 m3 mminus3 hminus1) T is the average air temperatureduring the sampling period (0 10 20 and 40 min) (C) and α is the conversion factor from N2O to N(ie 2844) A positive flux denotes emission from the soil and a negative flux denotes uptake fromthe atmosphere The annual cumulative soil N2O emissions were calculated from the monthly meanvalues as follows [17]
Annual cumulative N2O emission =nminus1sumi=1
FitimesDi (2)
where Fi is the mean gas flux (kg N haminus1 dayminus1) between two sampling times (ie for time interval i)Di is the number of days in the sampling interval and n is the frequency of sampling The emissionfactor (EF) was calculated using the following formula [26]
EF () = (F minus C)N times 100 (3)
where F is the annual cumulative N2O emission emitted from the fertilized treatment (kg N haminus1 yrminus1)C is the annual cumulative N2O emissions from the control treatments (kg N2O-N haminus1 yrminus1) and N isthe annual amount of N application (kg N haminus1 yrminus1)
24 Environmental Parameters and Soil Sampling
At the same time that the gas measurement was performed environmental variables such as airtemperature relative humidity soil temperature at 5 cm and 10 cm groundwater level and rainfall werealso measured Air temperature and relative humidity were measured using an air temperature andrelative humidity meter (TESTO 625 Testo SE amp Co KGaA Lenzkirch Germany) while soil temperaturewas measured using a portable soil temperature meter (Hanna CheckTemp 1 Hanna InstrumentsInc Rhode Island USA) Groundwater level was measured by installing a PVC perforated pipe intothe ground and rainfall was collected and measured using a rain gauge
Upon completing the gas measurement the bulk density and the water-filled pore space (WFPS)of the soil inside the chamber were assessed by collecting soil core samples using a core ring (5 cm diameter51 cm height) Then soil at 0ndash25 cm (higher root density zone) was sampled using a peat auger after whichthe chemical characteristics of the soil were further analyzed In the laboratory the soil samples wereair-dried and sieved (2 mm sieve) and extracted in deionized water or 2 M potassium chloride (KCl)filtered using filter paper The extracts were then stored at 4 C for further analysis to determine the contentof soil nitrate (NO3
minus) and ammonium (NH4+) From the water extracts NO3
minus concentrations of the soilwere analyzed using an ion chromatograph (Methrohm 761 Compact IC) while soil pH was measuredusing a pH meter (Methrohm 744) and NH4
+ was determined using a method proposed by Keeney andNelson [27] Loss on ignition (LOI) was determined using a thermogravimetric analyzer (LECO TGA701LECO Corporation San Jose MI USA) while carbon (C) and nitrogen (N) were analyzed using a CNanalyzer (LECO TruMac 4060 LECO Corporation San Jose MI USA)
25 Oil Palm Yield Collection
Oil palm yield parameterized as the fresh fruit bunch (FFB) in each palm of each treatment blockwere harvested weighed and recorded according to an approximately 7ndash10-day harvest interval in eachmonth whereas the yearly total was derived using the density of 148 palms haminus1 The number of fruit
Agriculture 2019 9 213 6 of 18
bunches produced was also recorded In this study the production of palm oil started in May 2010thus the annual oil palm yield was calculated starting from 2011 onwards
26 Statistical Analysis
One-way ANOVA and Tukeyrsquos test was used to compare the mean difference (p lt 005) of the givenvariable across the treatments A stepwise multiple regression analysis and Pearsonrsquos Correlationwere conducted to identify the main factors influencing N2O emissions as well as the environmentalparameters and soil properties All analyses were performed using SPSS Statistics Software version 21(IBM New York NY USA)
3 Results
31 General Soil Properties
The physicochemical properties of soil in the control plot are shown in Table 3 The groundwaterlevel (GWL) recorded an average of minus530 plusmn 204 cm below the peat surface and the water-filled porespace (WFPS) was 704 plusmn 104 The bulk density in the study site was 024 plusmn 001 g cmminus3mdasha resultof compaction and consolidation upon drainage The soil pH was 34 plusmn 01 and the loss on ignition(LOI) was 967 plusmn 10 A high soil CN ratio (303 plusmn 24) was recorded due to the higher C content(558 plusmn 24) of the soil Since the peat was ombrogenic it had high acidity and high C content
Table 3 Descriptions and physicochemical properties of soil at the study site (mean plusmn STD) WFPSwater-filled pore space GWL groundwater level LOI loss on ignition
Properties Value plusmn SD
Average annual rainfall (mm) 2697 plusmn 5967WFPS () 704 plusmn 104GWL (cm) minus530 plusmn 204Bulk density (g cmminus3) 024 plusmn 001Soil pH 34 plusmn 01LOI () 967 plusmn 10C () 558 plusmn 24N () 19 plusmn 02CN ratio 303 plusmn 24
32 Ground Water Level WFPS and Soil Temperatures
The monthly rainfall WFPS GWL and soil temperatures are shown in Figure 2 There is a clearseasonal pattern in the rainfall (Figure 2a) The GWL pattern generally follows the rainfall pattern(Figure 2b) The short-term low GWL for all treatments was observed between January 2010 and June2010 ranging from minus76 cm to minus109 cm below the peat surface The GWL increased beginning fromJuly 2010 onwards ranging from minus23 cm to minus1015 cm below the peat surface A lower GWL was alsoclearly observed from June 2011ndashDecember 2011 June 2016ndashDecember 2015 and June 2017ndashSeptember2017 (Figure 2b) A lower WFPS was observed from January to June 2010 ranging between 51 and70 coinciding with the lower GWL in the same period The WFPS in all treatments eventuallyincreased with time ranging from 59 to 959 (Figure 2c) The significant differences (p lt 005)of WFPS between continuous low GWL (minus76 cm to minus109 cm) and high GWL (minus24 cm to minus583 cm)in 2010 are shown in Table 4 However from 2010 to 2012 the pattern of WFPS (ranging from 51to 821) was mainly influenced by the pattern of GWL After 2012 the pattern of WFPS increasedwith an increase in the age of the palm to range from 71 to 959 (Figure 2c)
Agriculture 2019 9 213 7 of 18Agriculture 2019 9 x FOR PEER REVIEW 7 of 18
Figure 2 Monthly (a) rainfall (b) GWL (c) WFPS (d) soil temperature (e) NH4+-N (f) NO3minus-N concentrations and (g) N2O fluxes for each treatment The dashed line indicates N fertilization (applied every March June September and November of each year)
33 Soil NH4+ and NO3minus concentrations
Figure 2 Monthly (a) rainfall (b) GWL (c) WFPS (d) soil temperature (e) NH4+-N (f) NO3
minus-Nconcentrations and (g) N2O fluxes for each treatment The dashed line indicates N fertilization (appliedevery March June September and November of each year)
Agriculture 2019 9 213 8 of 18
Table 4 Mean WFPS NO3minus concentrations NH4
+ concentrations and N2O emissions for eachtreatment at low GWL (minus76 cm to minus109 cm) (JanuaryndashJune) and at high GWL (minus24 cm to 583 cm)(JulyndashDecember) in 2010
Properties GWL T1 T2 T3 T4
WFPS () Low GWL 615 (70) a 614 (74) a 640 (64) a 597 (71) a
High GWL 680 (70) a 722 (66) a 693 (78) a 713 (63) a
NO3minus (0ndash25 cm)
(mg N kgminus1)Low GWL 250 (147) a 289 (112) a 319 (181) a 348 (106) a
High GWL 147 (86) b 141 (140) b 208 (148) ab 337 (339) a
NH4+ (0ndash25 cm)
(mg N kgminus1)Low GWL 4891 (1827) a 4846 (1444) a 4400 (1887) a 4367 (1438) a
High GWL 4115 (1446) a 4608 (4817) a 4474 (1346) a 4972 (1923) a
N2O(microg N mminus2 hrminus1)
Low GWL 3437 (2404) a 2709 (1449) a 3944 (3400) a 4241 (2009) a
High GWL 10639 (9207) a 9570 (6213) a 13048 (7295) a 12099 (5643) a
The data represents the mean (standard deviation) (n = 18) The different letters show the significant differencesamong the treatments (p lt 005) The asterisk () indicates significant differences between low and high GWL(p lt 005)
Soil temperature at 5 cm and 10 cm depth did not show a clear seasonal or annual trend andremained in the range of 266 C to 300 C (Figure 2d)
33 Soil NH4+ and NO3
minus concentrations
As shown in Figure 2 the soil NH4+ for all treatments were higher than the soil NO3
minus throughoutthis study indicating that inorganic-N was dominated by NH4
+ at the study site The variationsin NH4
+ among the treatments were small ranging from 253ndash8652 mg N kgminus1 263ndash7857 mg N kgminus1253ndash6415 mg N kgminus1 and 171ndash6516 mg N kgminus1 for T1 T2 T3 and T4 respectively Following Nfertilization small peaks of NH4
+ could sometimes be observed (Figure 2e) Short-term GWL changedin 2010 but did not significantly affect NH4
+ either between treatments or between both low and highGWL conditions for each treatment (p gt 005) (Table 4) The N fertilization had no effect on NH4
+
in each year (p gt 005)The soil NO3
minus varied from 11ndash419 mg N kgminus1 10ndash520 mg N kgminus1 18ndash445 mg N kgminus1and 15ndash811 mg N kgminus1 for T1 T2 T3 and T4 respectively (Figure 2f)) Generally small peaksdenoting NO3
minus concentration were observed upon N fertilization Variation in NO3minus was generally
driven by the GWL pattern especially from 2010 to 2012 A significant negative correlation wasconsistently found between GWL and NO3
minus from 2010 to 2012 (p lt 005) (Table 5) High soil NO3minus
concentrations were recorded from January 2010 to June 2010 and then decreased mainly from June2010 to June 2011 for all treatments except for T4 where higher concentrations were observed in July2010 and August 2010 upon N fertilization A wider peak of NO3
minus for all treatments appeared in July2011 to September 2011 following N application also coinciding with a drop in GWL (Figure 2b)Soil NO3
minus concentrations for all treatments became constantly low afterwards except for T4 in August2012 where the highest peak of NO3
minus concentration (811 mg N kgminus1) of T4 appeared two months afterN application (Figure 2f) Significant effects of N application on soil NO3
minus were only observed in 2010with only T4 being significantly higher than the control (p lt 005) The changes in GWL in 2010 hada significant effect on NO3
minus for T1 and T2 as the high GWL significantly decreased NO3minus concentration
The N rates only had an effect at high GWL with only T4 denoting significantly increased NO3minus at
high GWL (Table 4)
Agriculture 2019 9 213 9 of 18
Table 5 Pearsonrsquos correlation coefficient denoting the effect of GWL on NO3minus concentrations for each
year (n = 48)
2010 2011 2012 2013 2016 2017
GWLminus0348 minus0527 minus0297 minus0054 minus0418 00030015 0000 0043 0714 0003 0981
Correlation is significant at the 001 level (2-tailed) Correlation is significant at the 005 level (2-tailed)
34 Soil N2O Emissions
The highest N2O fluxes were generally recorded for T4 The N2O fluxes varied from 2843ndash2635microg N mminus2 hrminus1 1719ndash165841 microg N mminus2 hrminus1 3807ndash244736 microg N mminus2 hrminus1 and 4563ndash211094 microg Nmminus2 hrminus1 for T1 T2 T3 and T4 respectively (Figure 2g) Higher soil N2O emissions for all treatmentswere observed mainly in 2010 2011 and 2012 compared to 2013 2016 and 2017 In 2010 peaks of N2Ofluxes appeared following N fertilization in most of the N fertilized treatments Emissions of N2O stillincreased 2 to 3 months upon N application particularly for T4 The N2O flux for T4 was significantlyhigher (149384 microg N mminus2 hrminus1) than other treatments (where T1 T2 and T3 were 72804 microg N mminus2 hrminus158155 microg N mminus2 hrminus1 and 64967 microg N mminus2 hrminus1 respectively) in August 2010 (p lt 005) The peak N2Oflux occurred in October 2010 for all treatments following N application with the control recordingthe highest flux The peak of N2O flux for T4 was significantly higher than other treatments upon Napplication in August 2012 (p lt 005) coinciding with a higher peak concentration of NO3
minus for T4in the same month In 2013 the pattern of N2O emissions started to decrease with a decrease in NO3-(Figure 2fg)
Besides N fertilization the patterns of N2O fluxes were also driven by the pattern of GWL andWFPS particularly in 2010 where continuously lower GWL occurred between January to June 2010before it started to increase in July 2010 (Figure 2bc) A comparison of N2O emissions from alltreatments between the low GWL and high GWL periods in 2010 is shown in Table 4 At a lower GWL(minus76 cm to minus109 cm) N2O emissions ranged from 155ndash63022 microg N mminus2 hrminus1 for T1 152ndash4745 microg Nmminus2 hrminus1 for T2 159ndash72189 microg N mminus2 hrminus1 for T3 and 330ndash60764 microg N mminus2 hrminus1 for T4 Meanwhile ata higher GWL (minus24 cm to minus58 cm) N2O fluxes for T1 T2 T3 and T4 ranged from 661ndash2635 microg N mminus2
hrminus1 581ndash1658 microg N mminus2 hrminus1 649ndash2447 microg N mminus2 hrminus1 and 664ndash1902 microg N mminus2 hrminus1 respectivelyThere were no significant effects of N fertilizers on N2O fluxes in both GWL conditions (low GWLp = 024 high GWL p = 048) for all treatments but a rise in GWL significantly increased N2O emissionsby 185 to 253 at low GWL (p lt 005) A pattern of higher soil N2O emissions were continuouslyobserved up until 2012
The annual cumulative N2O emissions for each year for all treatments are shownin Table 6 The annual cumulative N2O emissions for T1 T2 T3 and T4 ranged from65ndash474 kg N haminus1 yrminus1 76ndash435 kg N haminus1 yrminus1 82ndash707 kg N haminus1 yrminus1 and 98ndash797 kg N haminus1 yrminus1respectively The application of N fertilizer significantly increased the annual cumulative N2Oemissions only for T4 in 2010 (p = 0017) 2011 (p = 0012) 2012 (p = 0007) and 2016 (p = 0048)which were significantly higher than the control by 48 68 96 and 52 in 2010 20112012 and 2016 respectively This was also reflected in the N2O EF whereby T4 induced anEF ranging between 27 and 259 with the highest N2O EF recorded in 2011 The annualcumulative N2O emissions for all treatments started to significantly decrease in 2012 coinciding withincreased WFPS and decreased NO3
minus (Figure 2cf) The highest average annual cumulative N2Oemissions were recorded for T4 (415 plusmn 287 kg N haminus1 yrminus1) followed by T3 (351 plusmn 257 kg N haminus1 yrminus1)T1 (252 plusmn 178 kg N haminus1 yrminus1) and T2 (251 plusmn 154 kg N haminus1 yrminus1) indicating that the N ratesof 622 kg N haminus1 yrminus1 and 1277 kg N haminus1 yrminus1 increased the average annual cumulative N2O emissionsby 39 and 65 respectively compared to the control
Agriculture 2019 9 213 10 of 18
Table 6 Annual cumulative N2O emissions for each treatment
YearAnnual Cumulative N2O Emissions (kg N haminus1 yrminus1)
T1 T2 T3 T4
2010 459 (115)b AB 435 (53)b A 604 (117)ab A 678 (97)a A
2011 475 (42)b A 433 (25)b A 707 (222)ab A 797 (33)a A
2012 259 (113)b BC 249 (62)b B 368 (54)ab BC 507 (28)a B
2013 1359 (46)a C 194 (32)a BC 209 (70)a CD 229 (38)a C
2016 65 (03)b C 76 (16)ab D 82 (06)ab D 98 (16)a C
2017 122 (51)a C 118 (10)a D 134 (01)a CD 182 (33)a C
Mean 252 (178)a 251(154)a 351 (257)a 415(287)a
The data presents the mean (standard deviation) (n = 3ndash12) The letters (a b c) in the row indicate a significantdifference between treatments while the letters (A B C) in the column indicate a significant difference betweenyears using Tukeyrsquos Test at p lt 005
35 Oil Palm Yield
The oil palm in this study started to produce yield in May 2010 for all treatments (Figure 3)An increasing trend could be observed from May 2010 until December 2013 The yield productions of alltreatments were increased in October 2011 to November 2011 A trend of higher oil palm yield from alltreatments was observed in December 2012 and remained high up until December 2013 A higher annualoil palm yield for all treatments was recorded in 2013 and followed by 2017 ie more than 30 t haminus1 yrminus1The oil palm yields decreased in 2016 and started to increase again in 2017 However N fertilizationhad no significant effect on annual oil palm production in each year (p = 0994) Annual oil palm yieldwas negatively correlated with annual N2O fluxes and NO3
minus for overall treatment (Figure 4)
Agriculture 2019 9 x FOR PEER REVIEW 10 of 18
35 Oil Palm Yield
The oil palm in this study started to produce yield in May 2010 for all treatments (Figure 3) An increasing trend could be observed from May 2010 until December 2013 The yield productions of all treatments were increased in October 2011 to November 2011 A trend of higher oil palm yield from all treatments was observed in December 2012 and remained high up until December 2013 A higher annual oil palm yield for all treatments was recorded in 2013 and followed by 2017 ie more than 30 t haminus1 yrminus1 The oil palm yields decreased in 2016 and started to increase again in 2017 However N fertilization had no significant effect on annual oil palm production in each year (p = 0994) Annual oil palm yield was negatively correlated with annual N2O fluxes and NO3minus for overall treatment (Figure 4)
Figure 3 Oil palm yield for each treatment (2010ndash2017)
Figure 4 Relationships between oil palm yields and annual cumulative N2O emissions (a) and between oil palm yields and NO3minus (b) for each treatment
36 Factors Controlling Soil N2O Emissions
A stepwise regression analysis was done to examine the factors influencing soil N2O flux for each of the treatments (Table 7) Both GWL and WFPS were significant predictors in all treatments A positive correlation between GWL and N2O flux was observed for each treatment (T1 R2 = 018 T2 R2 = 020 T3 R2 = 013 T4 R2 = 017) indicating that N2O flux increased with increased GWL The highest N2O flux (2635 microg N mminus2 hrminus1) was also observed in the control plots at a high GWL of minus24 cm An exponential negative correlation was found between WFPS and N2O emissions for all treatments (T1 R2 = 032 T2 R2 = 030 T3 R2 = 042 T4 R2 = 017) The emissions of N2O at higher N rates (T3 and
Figure 3 Oil palm yield for each treatment (2010ndash2017)
Agriculture 2019 9 x FOR PEER REVIEW 10 of 18
35 Oil Palm Yield
The oil palm in this study started to produce yield in May 2010 for all treatments (Figure 3) An increasing trend could be observed from May 2010 until December 2013 The yield productions of all treatments were increased in October 2011 to November 2011 A trend of higher oil palm yield from all treatments was observed in December 2012 and remained high up until December 2013 A higher annual oil palm yield for all treatments was recorded in 2013 and followed by 2017 ie more than 30 t haminus1 yrminus1 The oil palm yields decreased in 2016 and started to increase again in 2017 However N fertilization had no significant effect on annual oil palm production in each year (p = 0994) Annual oil palm yield was negatively correlated with annual N2O fluxes and NO3minus for overall treatment (Figure 4)
Figure 3 Oil palm yield for each treatment (2010ndash2017)
Figure 4 Relationships between oil palm yields and annual cumulative N2O emissions (a) and between oil palm yields and NO3minus (b) for each treatment
36 Factors Controlling Soil N2O Emissions
A stepwise regression analysis was done to examine the factors influencing soil N2O flux for each of the treatments (Table 7) Both GWL and WFPS were significant predictors in all treatments A positive correlation between GWL and N2O flux was observed for each treatment (T1 R2 = 018 T2 R2 = 020 T3 R2 = 013 T4 R2 = 017) indicating that N2O flux increased with increased GWL The highest N2O flux (2635 microg N mminus2 hrminus1) was also observed in the control plots at a high GWL of minus24 cm An exponential negative correlation was found between WFPS and N2O emissions for all treatments (T1 R2 = 032 T2 R2 = 030 T3 R2 = 042 T4 R2 = 017) The emissions of N2O at higher N rates (T3 and
Figure 4 Relationships between oil palm yields and annual cumulative N2O emissions (a) and betweenoil palm yields and NO3
minus (b) for each treatment
Agriculture 2019 9 213 11 of 18
36 Factors Controlling Soil N2O Emissions
A stepwise regression analysis was done to examine the factors influencing soil N2O flux for eachof the treatments (Table 7) Both GWL and WFPS were significant predictors in all treatments A positivecorrelation between GWL and N2O flux was observed for each treatment (T1 R2 = 018 T2 R2 = 020T3 R2 = 013 T4 R2 = 017) indicating that N2O flux increased with increased GWL The highestN2O flux (2635 microg N mminus2 hrminus1) was also observed in the control plots at a high GWL of minus24 cmAn exponential negative correlation was found between WFPS and N2O emissions for all treatments(T1 R2 = 032 T2 R2 = 030 T3 R2 = 042 T4 R2 = 017) The emissions of N2O at higher N rates(T3 and T4) were highest at a WFPS of more than 70 It was observed that the N2O fluxes increasedwhen WFPS increased from 50 to 70 and decreased afterwards when the WFPS increased to a higherWFPS (gt 70) (Table 8) A significant positive correlation between NO3
minus concentration and N2Oemissions (p lt 001) and a significant negative correlation between WFPS and NO3
minus (p lt 005) wereobserved with a WFPS ranging between 70 and 96 (Table 8) Based on the standardized regressioncoefficients the strongest predictor was GWL except for T2 (Table 7) Also the standardized coefficientof GWL was increased from T2 to T4 (Table 7) Soil N2O emissions were significantly correlated withboth GWL (p lt 0001) and WFPS (p lt 001) for all treatments Soil N2O emission was significantlycorrelated with soil temperature for T2 only (p lt 001) while inorganic N was significantly correlatedwith N2O emissions for T3 and T4 only (p lt 005) (Table 7) An exponential positive correlation betweenN2O emissions and NO3
minus for T3 (R2 = 023) and T4 (R2 = 012) was observed
Table 7 The stepwise regression analysis denoting the effect of environmental variables and soilinorganic N on the N2O fluxes in each treatment (n = 72)
Treatment Variable Std Coefficient SE p-Value R2
T1 GWL 0375 1958 0000 018WFPS minus0374 3810 0000 032
T2 GWL 0373 1659 0000 020WFPS minus0322 3143 0002 029Soil temperature at 5 cm 0648 5243 0003Soil temperature at 10 cm minus0419 6920 0050
T3 WFPS minus0415 4698 0000 042GWL 0454 2314 0000 013NH4
+ 0235 0473 0009NO3
minus 0222 4216 0038
T4 NO3minus 0442 2645 0000 029
GWL 0516 2253 0000 017WFPS minus0293 4730 0002 031
Table 8 Pearsonrsquos correlation between the N2O emissions and WFPS and NO3minus concentrations at WFPS
of 50ndash70 and gt 70 (n = 79ndash207)
Variable 50ndash70 70ndash96
N2O WFPS N2O WFPS
WFPS 0384 - minus0506 -0000 - 0000 -
NO3minus 0032 minus0115 0376 minus0137
0782 0313 0000 0049
Correlation is significant at the 001 level (2-tailed) Correlation is significant at the 005 level (2-tailed)
The effect of GWL on N2O flux for both GWL conditions in 2010 is shown in Figure 5 The N2Oflux increased to above 800 microg N mminus2 hrminus1 with a GWL shallower than minus60 cm A significant positive
Agriculture 2019 9 213 12 of 18
correlation between N2O flux and NO3minus was observed for T4 (R2 = 023) but only at a low GWL
of deeper than minus60 cm (p lt 005)Agriculture 2019 9 x FOR PEER REVIEW 12 of 18
Figure 5 Relationship between GWL and N2O flux for each treatment in 2010
4 Discussion
41 Effect of N Fertilization on N2O Emissions
The increase in N2O flux with a small peak following N fertilization as generally observed in this study was also reported in other studies [2829] In this study only T4 saw significantly increased annual N2O emissions However a previous incubation study showed that the addition of ammonium sulphate to tropical peatland suppressed N2O emissions due to high ammonium content and an anaerobic condition that inhibited nitrification [19] However it was also observed that N2O fluxes were occasionally higher in control plots compared to N-fertilized plots It is likely that the greater part of N2O fluxes from drained organic soil was derived from N released as a result of peat decomposition and not from fertilization [101830] contributing to insignificant effects of N fertilizers on N2O emissions on tropical peatland A study on temperate peat showed that N fertilization stimulated N2O flux only when application rates were very high (480 kg N haminus1) but the N2O flux hardly increased under 60ndash120 kg N haminus1 application rates even when NO3minus was high [31] Although the effect of N application on annual cumulative N2O emissions was only significant in T4 the N application still has the potential to induce annual cumulative N2O emissions when the N fertilizer goes above 622 kg N haminus1 yrminus1mdash10 to 96 higher than without N
The annual N2O emissions in this study were significantly increased with N fertilization for T4 only in 2010 2011 2012 and 2016 (Table 6) In these years annual cumulative N2O emissions were higher coinciding with higher NO3minus concentration In 2010 N fertilization significantly increased both NO3minus and N2O emissions but only for T4 This could be due to the short-term drastic GWL change in 2010 in which increased GWL significantly decreased NO3minus concentration and significantly increased both WFPS and N2O emissions (Table 4) Alternating between low (deeper than minus60 cm) and high groundwater level (GWL) (shallower than minus60 cm) enhanced nitrification during low GWL further supplied NO3minus for denitrification in high GWL contributing to higher N2O emissions in high GWL [3233] In 2011 higher N2O and NO3minus were observed with decreasing GWL in June 2011 to December 2011 implying the occurrence of the nitrification process which may be the reason for the larger annual N2O emissions In 2012 annual N2O emissions started to significantly reduce for all treatments (Table 6) possibly due to the palm canopy density and leaf area index (LAI) As the palm grows the size of its canopy increases and eventually closes (usually 4 years after planting) Canopies with high LAIs can block sunlight from reaching the soil surface and absorb more momentum therefore allowing less vertical mixing of air within the canopy [34] These conditions keep the air and soil beneath the canopy cool during the day reducing water loss from the soil via evaporation A higher bulk density and a lower total porosity due to compaction and peat decomposition cause more micropores to form resulting in increased water retention capacity even during the dry season
Figure 5 Relationship between GWL and N2O flux for each treatment in 2010
4 Discussion
41 Effect of N Fertilization on N2O Emissions
The increase in N2O flux with a small peak following N fertilization as generally observed in thisstudy was also reported in other studies [2829] In this study only T4 saw significantly increasedannual N2O emissions However a previous incubation study showed that the addition of ammoniumsulphate to tropical peatland suppressed N2O emissions due to high ammonium content and ananaerobic condition that inhibited nitrification [19] However it was also observed that N2O fluxeswere occasionally higher in control plots compared to N-fertilized plots It is likely that the greater partof N2O fluxes from drained organic soil was derived from N released as a result of peat decompositionand not from fertilization [101830] contributing to insignificant effects of N fertilizers on N2Oemissions on tropical peatland A study on temperate peat showed that N fertilization stimulated N2Oflux only when application rates were very high (480 kg N haminus1) but the N2O flux hardly increasedunder 60ndash120 kg N haminus1 application rates even when NO3
minus was high [31] Although the effect of Napplication on annual cumulative N2O emissions was only significant in T4 the N application still hasthe potential to induce annual cumulative N2O emissions when the N fertilizer goes above 622 kg Nhaminus1 yrminus1mdash10 to 96 higher than without N
The annual N2O emissions in this study were significantly increased with N fertilization for T4only in 2010 2011 2012 and 2016 (Table 6) In these years annual cumulative N2O emissions werehigher coinciding with higher NO3
minus concentration In 2010 N fertilization significantly increasedboth NO3
minus and N2O emissions but only for T4 This could be due to the short-term drastic GWLchange in 2010 in which increased GWL significantly decreased NO3
minus concentration and significantlyincreased both WFPS and N2O emissions (Table 4) Alternating between low (deeper than minus60 cm)and high groundwater level (GWL) (shallower than minus60 cm) enhanced nitrification during low GWLfurther supplied NO3
minus for denitrification in high GWL contributing to higher N2O emissions in highGWL [3233] In 2011 higher N2O and NO3
minus were observed with decreasing GWL in June 2011to December 2011 implying the occurrence of the nitrification process which may be the reasonfor the larger annual N2O emissions In 2012 annual N2O emissions started to significantly reducefor all treatments (Table 6) possibly due to the palm canopy density and leaf area index (LAI)As the palm grows the size of its canopy increases and eventually closes (usually 4 years after planting)Canopies with high LAIs can block sunlight from reaching the soil surface and absorb more momentumtherefore allowing less vertical mixing of air within the canopy [34] These conditions keep the air
Agriculture 2019 9 213 13 of 18
and soil beneath the canopy cool during the day reducing water loss from the soil via evaporationA higher bulk density and a lower total porosity due to compaction and peat decomposition causemore micropores to form resulting in increased water retention capacity even during the dry seasonand the reduction in ground water level [35] The increase in WFPS with time may have decreasedthe N mineralization and nitrification but enhanced denitrification leading to a reduction in NO3
minus
supplies and N2O emissionTo date studies investigating the effect of N fertilization on N2O emissions in tropical peatland have
mainly used urea as the N source [1016ndash18] Urea is widely used as an N fertilizer worldwide due to itslower price per unit N and its high N content (46 N) compared to other N fertilizers The magnitudeof the pH decrease has been found to be greater using ammonium sulfate compared to urea [36] It hasbeen reported that the addition of urea accelerated nitrification while AS tended to lower the nitrificationstatus and inhibited nitrification at higher rates due to increased soil pH as a result of the hydrolysisof urea which stimulated nitrifier activity and the availability of soluble substrate thus enhancingthe nitrification rate [3738] However in the case of paddy fields application of ammonium sulphatewould result in larger emissions of N2O than that of urea probably due to the faster availabilityof NH4-N from AS for faster nitrification and thus higher N2O production [3940]
In the current study annual cumulative N2O emissions from 2010 until 2012 (ranging from249ndash797 kg N haminus1 yrminus1) were higher than the values obtained in a previous study involvinga urea-fertilized oil palm plantation on tropical peatland (ranging from 128ndash266 kg N haminus1 yrminus1) [18]while the values from 2013 until 2016 (ranging from 65ndash229 kg N haminus1 yrminus1) fell within the previousstudyrsquos range The higher values of N2O emissions from 2010 until 2012 in this study comparedto the previous study may be due to the lower GWL during the period in this study Howeverthe aforementioned values still fall within the values obtained by studies on cropland on tropicalpeatland [10] (ranging from 21ndash259 kg N haminus1 yrminus1) The EF for T4 in 2010 2011 2012 and 2016was 176 259 200 and 27 respectively In other studies on oil palm plantation on tropicalpeatland the EF of urea and coated urea was 191 and 438 respectively [16] higher than the EFvalues obtained in this study
42 Factors Influencing Soil N2O Emissions
The regression analysis revealed that N2O fluxes correlated significantly with GWL and WFPSfor all treatments with GWL as the strongest predictor This result shows that the depth of the watertable affects the degree of anaerobicity of the peat which is essential for denitrification and the thicknessof the aerobic layer which determines the soil volume for nitrification rate There was a significantpositive correlation between GWL and N2O flux (p lt 0001) where N2O flux increased as GWLincreased The highest N2O emissions in the drained tropical peatland forest were found to relateto rising water table conditions during the start of the wet season After the onset of the wet seasonpeat moisture increased due to the increased water infiltration and water table accompanied bysufficiently oxic conditions in the surface peat and the increased decomposition of fine root and leaflitter deposited during drier conditions resulting in a surge in N2O emissions [6] In 2010 short-termdrastic GWL changes were observed and increased GWL significantly increased N2O emissions by 185to 2533 over the low GWL (p lt 005) (Table 4) Rises in GWL were accompanied by increases in N2Oemissions through associated increases in WFPS Peat soil moisture distribution is also influenced bythe rate of capillary rise which in turn is affected by GWL and bulk density The highest soil watercontent (308) corresponded to the soil capillary rise in high GWL (minus40 cm) and high bulk density(02 g cmminus3) while the lowest water content (37) occurred in low GWL (minus100 cm) and low bulkdensity (01 g cmminus3) [41] At low GWL (deeper than minus60 cm) the WFPS ranged from 50ndash70 while athigh GWL (shallower than minus60 cm) the WFPS ranged from 60ndash80 The effect of N fertilization onN2O emission was prominent in wet soil [164243] which explains the larger effect of GWL on N2Oemissions at high N rates (Table 7)
Agriculture 2019 9 213 14 of 18
After GWL WFPS was one of the important factors in affecting soil N2O emissions in this studyThe WFPS was negatively correlated with N2O flux (p lt 001) Soil N2O emissions increased whenWFPS increased from 50 to 70 and decreased when WFPS went above 70 This phenomenon wasobserved in the beginning of 2012 where both N2O flux and NO3
minus decreased in tandem with increasedWFPS (gt70) (Figure 2) Complete denitrification might have occurred and N2O was mostly reducedto N2 when WFPS went above 70 [4445] Increasing WFPS likely reduced gas diffusivity in the soilinhibiting the escape of N2O and enhancing the probability of its reduction to N2 [1746] Moreoverthe low nitrification rate in continuously high WFPS limited the production of NO3
minus for denitrificationleading to low N2O emissions
A significant positive correlation between NO3minus and N2O flux was only found in T3 and T4 while
the effect of NH4+ on N2O flux was only found for T3 (Table 7) The emissions of N2O from the soil
were better correlated with NO3minus (product of nitrification and precursor of denitrification) than with
NH4+ suggesting that denitrification was an important source of soil N2O in this case [47] According to
Liu et al [48] NH4+ enhanced the N2O flux from the soil only at lower soil moisture which explains
the lack of a relationship between NH4+ and N2O flux when WFPS was mostly higher than 70
Soil temperature is also considered important in regulating the rate of N2O flux as the contributionsof nitrification and denitrification to N2O flux may vary with temperature [4950] For instanceLai et al [50] reported that nitrification and denitrification peaked at 35ndash40 C However at temperaturesabove 40 C high soil respiration rates will likely decrease oxygen availability enhancing the anaerobicmicrosites leading to the reduced of N2O to N2 production In this study a significant correlationbetween soil temperature at 5 cm and 10 cm and soil N2O flux was only found for T2 (Table 7) The lackof a relationship between soil temperature and N2O flux may be due to the constant variation in the soiltemperature in tropical regions
43 Effect of N Fertilization on Oil Palm Yield
In this study the N fertilization rates had no effect on annual oil palm yield (p gt 005)Morris et al [51] also reported the significant effect of N fertilization on the grain yield of riceplant planted on peat indicating the existence of a large N pool in the rewetted peat soils which wasalso reflected by the higher oil palm yield in the control plot rather than the fertilized plot in the studyA study on the mineral soil in an oil palm plantation showed that N rates of 120 kg N haminus1 yrminus1 metthe nitrogen demands (1162 kg N haminus1 yrminus1) to produce 30 t haminus1 yrminus1 FFB [52] According to Teh [53]nutrient demand in oil palm plantations will increase steeply in the next two to four years after whichit will stabilize to a rather constant level (180 kg N haminus1) thus high soil nutrient levels may notalways lead to high nutrient uptake The annual oil palm yield in this study was negatively correlated(p lt 005) with annual cumulative N2O emissions and NO3
minus suggesting that increased oil palm yieldreduced NO3
minus in soil via N uptake resulting in lower N2O emissions The effect of plant N uptake onN2O emissions was also reported by other studies [5455] Marwanto et al [56] showed that duringa drought two tropical peatlands exhibited a low soil pH (pH 37ndashpH 40) at a depth of 50 cm anda high soil pH (pH 59ndashpH 68) at a depth of 200 cm These phenomena are attributed to oxidationreactions such as organic acids and NO3
minus generation in shallower soil and reduction reactions such asdenitrification in deeper soil during a drought Therefore in the rainy season when NO3 leaches andground water level rises N2O production in subsurface soil will be increased Kusa et al [57] alsofound that the subsurface soil with a shallower ground water level would produce higher N2O dueto NO3
minus leaching
5 Conclusions
Although the effect of N application on annual cumulative N2O emissions was only significantfor T4 N application still has the potential to induce annual cumulative N2O emissions when morethan 622 kg N haminus1 yrminus1 N fertilizer rate is applied Both GWL (p lt 0001) and WFPS (p lt 001) weresignificant predictors for all treatments in which the effect of GWL on N2O flux increased as the N
Agriculture 2019 9 213 15 of 18
rates increased Based on this relationship denitrification was the dominant source of N2O emissionsin this study Alternating between low and high GWL particularly in 2010ndash2011 enhanced nitrificationduring low GWL further supplied NO3
minus for denitrification in the high GWL contributing to higherN2O fluxes in the aforementioned years Increasing WFPS (gt 70) was observed to start in 2012correlating to a decrease in both N2O flux and NO3
minus which could be due to complete denitrificationa reduction in gas diffusivity and plant N uptake However the effect of plant uptake on N2O fluxshould not be undermined at least until the completion of the planting cycle
Author Contributions Investigation Project Administration Formal Analysis WritingmdashOriginal draftpreparation AC Funding Acquisition Resources LM Supervision WritingmdashReview and editing LMKI and RH All authors have read and approved the final manuscript
Funding This research was funded by both Sarawak State Government and the Federal Government of Malaysia
Acknowledgments The authors gratefully acknowledge the STROPI staffs who assisted in the field trialmanagement and the laboratory analysis We acknowledge the editors and two anonymous reviewers for theirconstructive comments and suggestions that have helped to improve the quality of this paper
Conflicts of Interest The authors declare no conflict of interest The funders had no role in the design of the studyin the collection analyses or interpretation of data in the writing of the manuscript or in the decision to publishthe results
References
1 Forster P Ramaswamy V Artaxo P Berntsen T Betts R Fahey DW Haywood J Lean J Lowe DCMyhre G et al Changes in Atmospheric Constituents and in Radiative Forcing In Climate Change 2007The Physical Science Basis Contribution of Working Group I to the Fourth Assessment Report of the IntergovernmentalPanel on Climate Change Solomon S Qin D Manning M Chen Z Marquis M Averyt KB Tignor MMiller HL Eds Cambridge University Press Cambridge UK New York NY USA 2007 pp 129ndash234
2 Davidson EA The contribution of manure and fertilizer nitrogen to atmospheric nitrous oxide since 1860Nat Geosci 2009 2 659 [CrossRef]
3 Maraseni TN Qu J An international comparison of agricultural nitrous oxide emissions J Clean Prod2016 135 1256ndash1266 [CrossRef]
4 Comte I Colin F Whalen JK Gruumlnberger O Caliman JP Agricultural practices in oil palm plantationsand their impact on hydrological changes nutrient fluxes and water quality in Indonesia A reviewIn Advances in Agronomy Academic Press Cambridge MA USA 2012 Volume 116 pp 71ndash124
5 Mutert E Fairhurst TH Von Uexkuumlll HR Agronomic management of oil palms on deep peatBetter Crop Int 1999 13 22ndash27 Available online httpwwwipninetpublicationbcinsf0
963CC0D08521253185257BBA006E791B$FILEBetter20Crops20International201999-120p22pdf(accessed on 26 May 2019)
6 Jauhiainen J Silvennoinen H Haumlmaumllaumlinen R Kusin K Limin S Raison RJ Vasander H Nitrousoxide fluxes from tropical peat with different disturbance history and management Biogeosciences 2012 91337ndash1350 [CrossRef]
7 Couwenberg J Dommain R Joosten H Greenhouse gas fluxes from tropical peatlands in south-east AsiaGlob Chang Biol 2010 16 1715ndash1732 [CrossRef]
8 Murdiyarso D Hergoualcrsquoh K Verchot LV Opportunities for reducing greenhouse gas emissionsin tropical peatlands Proc Natl Acad Sci USA 2010 107 19655ndash19660 [CrossRef]
9 Butterbach-Bahl K Baggs EM Dannenmann M Kiese R Zechmeister-Boltenstern S Nitrous oxideemissions from soils How well do we understand the processes and their controls Philos Trans R Soc BBiol Sci 2013 368 20130122 [CrossRef]
10 Takakai F Morishita T Hashidoko Y Darung U Kuramochi K Dohong S Limin SH Hatano R Effectsof agricultural land-use change and forest fire on N2O emission from tropical peatlands central KalimantanIndonesia Soil Sci Plant Nutr 2006 52 662ndash674 [CrossRef]
11 Pihlatie M Syvaumlsalo E Simojoki A Esala M Regina K Contribution of nitrification and denitrificationto N2O production in peat clay and loamy sand soils under different soil moisture conditionsNutr Cycl Agroecosyst 2004 70 135ndash141 [CrossRef]
Agriculture 2019 9 213 16 of 18
12 Van Beek CL Pleijter M Kuikman PJ Nitrous oxide emissions from fertilized and unfertilized grasslandson peat soil Nutr Cycl Agroecosyst 2011 89 453ndash461 [CrossRef]
13 Dobbie KE Smith KA The effect of water table depth on emissions of N2O from a grassland soilSoil Use Manag 2006 22 22ndash28 [CrossRef]
14 Regina K Silvola J Martikainen PJ Short term effects of changing water table on N2O fluxes from peatmonoliths from natural and drained boreal peatlands Glob Chang Biol 1999 5 183ndash189 [CrossRef]
15 Minamikawa K Eguchi S Nishimura S Ihara H Maeda M Yagi K Komada M Groundwater-inducedemissions of nitrous oxide through the soil surface and from subsurface drainage in an Andosol upland fieldA monolith lysimeter study Soil Sci Plant Nutr 2013 59 87ndash95 [CrossRef]
16 Sakata R Shimada S Arai H Yoshioka N Yoshioka R Aoki H Inubushi K Effect of soil types andnitrogen fertilizer on nitrous oxide and carbon dioxide emissions in oil palm plantations Soil Sci Plant Nutr2014 61 48ndash60 [CrossRef]
17 Melling L Hatano R Goh KJ Nitrous oxide emissions from three ecosystems in tropical peatlandof Sarawak Malaysia Soil Sci Plant Nutr 2007 53 792ndash805 [CrossRef]
18 Oktarita S Hergoualcrsquoh K Anwar S Verchot LV Substantial N2O emissions from peat decompositionand N fertilization in an oil palm plantation exacerbated by hotspots Environ Res Lett 2017 12 104007[CrossRef]
19 Hadi A Inubushi K Purnomo E Razie F Yamakawa K Tsuruta H Effect of land-use changes onnitrous oxide (N2O) emission from tropical peatlands Chemosphere Glob Chang Sci 2000 2 347ndash358[CrossRef]
20 Page SE Morrison R Malins C Hooijer A Rieley JO Jauhiainen J Review of Peat Surface GreenhouseGas Emissions from Oil Palm Plantations in Southeast Asia White Paper Number 15 International Council onClean Transportation Washington DC USA 2011 p 22 Available online httpwwwenvironmentportalinfilesfileICCT_Peat-Emissions_Sept2011pdf (accessed on 26 May 2019)
21 Soil Survey Staff Keys to Soil Taxonomy 12th ed USDA-Natural Resources Conservation ServiceWashington DC USA 2014
22 IUSS Working Group WRB World Reference Base for Soil Resources 2014 International Soil Classification Systemfor Naming Soils and Creating Legends for Soil Maps World Soil Resources Reports No 106 FAO Rome Italy 2015
23 Hasnol O Farawahida MD Mohd H Samsudin A Re-evaluation of nutrients requirements for oilpalm planting on peat soil Planter 2014 90 161ndash177 Available online httpswwwcabdirectorgcabdirectabstract20143238761 (accessed on 28 May 2019)
24 Norman JM Kucharik CJ Gower ST Baldocchi DD Crill PM Rayment M Savage K Striegl RGA comparison of six methods for measuring soil-surface carbon dioxide fluxes J Geophys Res Atmos 1997102 28771ndash28777 [CrossRef]
25 Jin T Shimizu M Marutani S Desyatkin AR Iizuka N Hata H Hatano R Effect of chemical fertilizerand manure application on N2O emission from reed canary grassland in Hokkaido Japan Soil Sci Plant Nutr2010 56 53ndash65 [CrossRef]
26 Albanito F Lebender U Cornulier T Sapkota TB Brentrup F Stirling C Hillier J Direct nitrous oxideemissions from tropical and sub-tropical agricultural systems-a review and modelling of emission factorsSci Rep 2017 7 44235 [CrossRef]
27 Keeney DR Nelson DW Nitrogen-Inorganic forms In Methods of Soil Analysis Part 2 Chemical andMicrobiological Properties 2nd ed Agronomy 92 Page AL Miller RH Keeney DR Eds American Societyof Agronomy Madison WI USA 1982 pp 643ndash698
28 Weitz AM Linder E Frolking S Crill PM Keller M N2O emissions from humid tropical agriculturalsoils Effects of soil moisture texture and nitrogen availability Soil Biol Biochem 2001 33 1077ndash1093[CrossRef]
29 Zhou WJ Ji HL Zhu J Zhang YP Sha LQ Liu YT Lin YX The effects of nitrogen fertilizationon N2O emissions from a rubber plantation Sci Rep 2016 6 28230 [CrossRef]
30 Leifeld J Distribution of nitrous oxide emissions from managed organic soils under different land usesestimated by the peat CN ratio to improve national GHG inventories Sci Total Environ 2018 631 23ndash26[CrossRef]
31 Augustin J Merbach W Rogasik J Factors influencing nitrous oxide and methane emissions fromminerotrophic fens in northeast Germany Biol Fertil Soils 1998 28 1ndash4 [CrossRef]
Agriculture 2019 9 213 17 of 18
32 Martikainen PJ Nykaumlnen H Crill P Silvola J Effect of a lowered water table on nitrous oxide fluxesfrom northern peatlands Nature 1993 366 51 [CrossRef]
33 Susilawati HL Setyanto P Ariani M Hervani A Inubushi K Influence of water depth and soilamelioration on greenhouse gas emissions from peat soil columns Soil Sci Plant Nutr 2016 62 57ndash68[CrossRef]
34 Hardwick SR Toumi R Pfeifer M Turner EC Nilus R Ewers RM The relationship between leafarea index and microclimate in tropical forest and oil palm plantation Forest disturbance drives changesin microclimate Agric For Meteorol 2015 201 187ndash195 [CrossRef]
35 Kurnain A Moisture release of tropical peat soils as decreasing water table Trop Wetl J 2016 1 33ndash37Available online httpeprintsunlamacid1986109_5-9-1-SMpdf (accessed on 14 August 2019)
36 Fageria NK Dos Santos AB Moraes MF Influence of urea and ammonium sulfate on soil acidity indicesin lowland rice production Commun Soil Sci Plant Anal 2010 41 1565ndash1575 [CrossRef]
37 Rizal A Ahmad H Osumanu HA Halimi MS Influence of urea and ammonium sulfate on potentialmineralization and nitrification rate in tropical peat soil from oil palm cultivation under lab conditionInt J Trop Agric 2015 33 Pt IV 1747ndash1754 Available online httpswwwcabdirectorgcabdirectabstract20153342355 (accessed on 26 May 2019)
38 Tierling J Kuhlmann H Emissions of nitrous oxide (N2O) affected by pH-related nitrite accumulationduring nitrification of N fertilizers Geoderma 2018 310 12ndash21 [CrossRef]
39 Cai Z Xing G Yan X Xu H Tsuruta H Yagi K Minami K Methane and nitrous oxide emissionsfrom rice paddy fields as affected by nitrogen fertilisers and water management Plant Soil 1997 196 7ndash14[CrossRef]
40 Kumar U Jain MC Pathak H Kumar S Majumdar D Nitrous oxide emission from different fertilizersand its mitigation by nitrification inhibitors in irrigated rice Biol Fertil Soils 2000 32 474ndash478 [CrossRef]
41 Nugraha MI Annisa W Syaufina L Anwar S Capillary water rise in peat soil as affected by variousgroundwater levels Indones J Agric Sci 2017 17 75ndash83 [CrossRef]
42 Li ZA Zou B Xia HP Ding YZ Tan WN Ma ZR Effect of fertilizer and water content on N2Oemission from three plantation soils in south China J Environ Sci (China) 2005 17 970
43 Liu X Dong Y Qi Y Peng Q He Y Sun L Jia J Guo S Cao C Yan Z et al Responseof N2O emission to water and nitrogen addition in temperate typical steppe soil in Inner Mongolia ChinaSoil Tillage Res 2015 151 9ndash17 [CrossRef]
44 Davidson EA Keller M Erickson HE Verchot LV Veldkamp E Testing a conceptual model of soilemissions of nitrous and nitric oxides BioScience 2000 50 667ndash680 [CrossRef]
45 Ishikura K Darung U Inoue T Hatano R Variation in Soil Properties Regulate Greenhouse Gas Fluxesand Global Warming Potential in Three Land Use Types on Tropical Peat Atmosphere 2018 9 465 [CrossRef]
46 Smith KA McTaggart IP Tsuruta H Emissions of N2O and NO associated with nitrogen fertilizationin intensive agriculture and the potential for mitigation Soil Use Manag 1997 13 296ndash304 [CrossRef]
47 Paumlrn J Verhoeven JT Butterbach-Bahl K Dise NB Ullah S Aasa A Kasak K Nitrogen-rich organicsoils under warm well-drained conditions are global nitrous oxide emission hotspots Nat Commun 2018 91135 [CrossRef]
48 Liu XJ Mosier AR Halvorson AD Reule CA Zhang FS Dinitrogen and N2O emissions in arablesoils Effect of tillage N source and soil moisture Soil Biol Biochem 2007 39 2362ndash2370 [CrossRef]
49 Koponen HT Duran CE Maljanen M Hytoumlnen J Martikainen PJ Temperature responses of NO andN2O emissions from boreal organic soil Soil Biol Biochem 2006 38 1779ndash1787 [CrossRef]
50 Lai TV Farquharson R Denton MD High soil temperatures alter the rates of nitrification denitrificationand associated N2O emissions J Soils Sediments 2019 1ndash14 [CrossRef]
51 Morris J Ye R Silva LC Horwath WR Nitrogen fertilization had no effect on CH4 and N2O emissionsin rice planted in rewetted peatlands Soil Sci Soc Am J 2017 81 224ndash232 [CrossRef]
52 Tarmizi AM Tayeb DM Nutrient demands of Tenera oil palm planted on inland soils of Malaysia J OilPalm Res 2006 18 204ndash209 Available online httpwwwoneoilpalmcomwp-contentuploads201706Nutrient-demands-of-tenera-oil-palm-planted-on-inland-soils-of-Malaysiapdf (accessed on 30 August 2019)
53 Teh CBS Availability Use and Removal of Oil Palm Biomass in Indonesia Report for the International Councilon Clean Transportation University Putra Selangor Malaysia 2016
Agriculture 2019 9 213 18 of 18
54 Simojoki A Jaakkola A Effect of nitrogen fertilization cropping and irrigation on soil air composition andnitrous oxide emission in a loamy clay Eur J Soil Sci 2000 51 413ndash424 [CrossRef]
55 Sosulski T Szara E Stepien W Szymanska M Nitrous oxide emissions from the soil under differentfertilization systems on a long-term experiment Plant Soil Environ 2014 60 481ndash488 [CrossRef]
56 Marwanto S Watanabe T Iskandar W Sabiham S Funakawa S Effects of seasonal rainfall and watertable movement on the soil solution composition of tropical peatland Soil Sci Plant Nutr 2018 64 386ndash395[CrossRef]
57 Kusa K Sawamoto T Hu R Hatano R Comparison of the closed-chamber and gas concentration gradientmethods for measurement of CO2 and N2O fluxes in two upland field soils Soil Sci Plant Nutr 2008 54777ndash785 [CrossRef]
copy 2019 by the authors Licensee MDPI Basel Switzerland This article is an open accessarticle distributed under the terms and conditions of the Creative Commons Attribution(CC BY) license (httpcreativecommonsorglicensesby40)
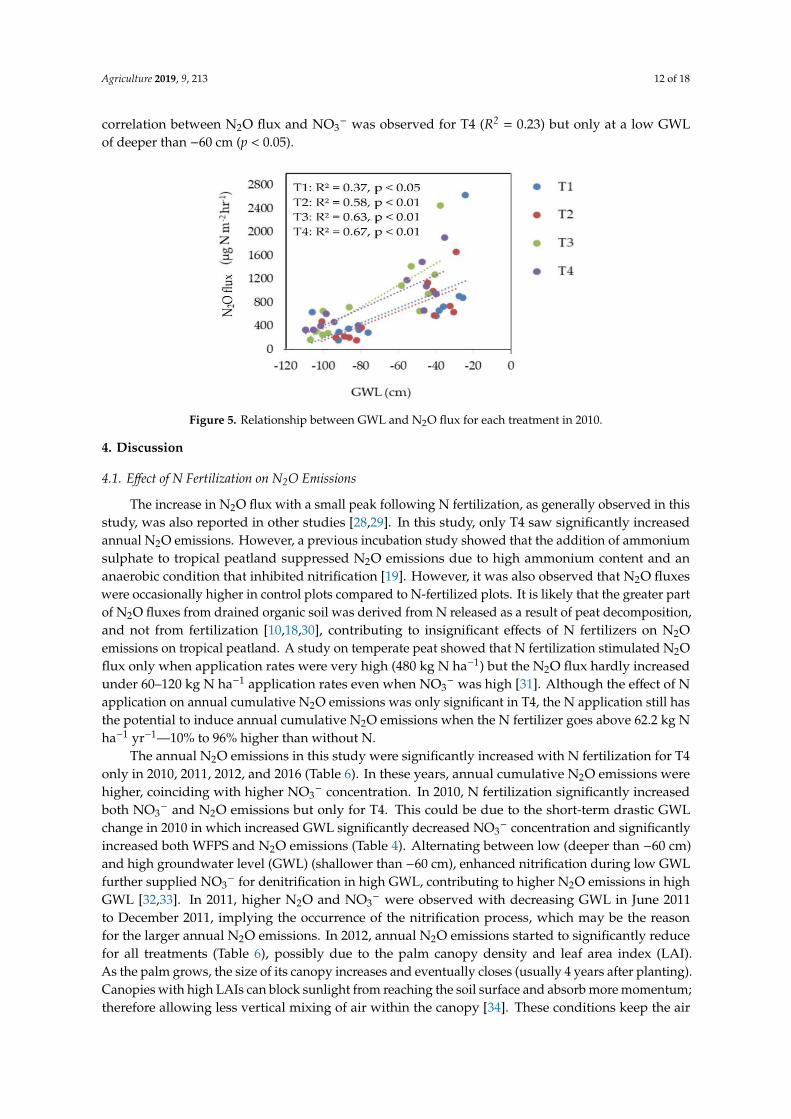