Embed Size (px)
Citation preview
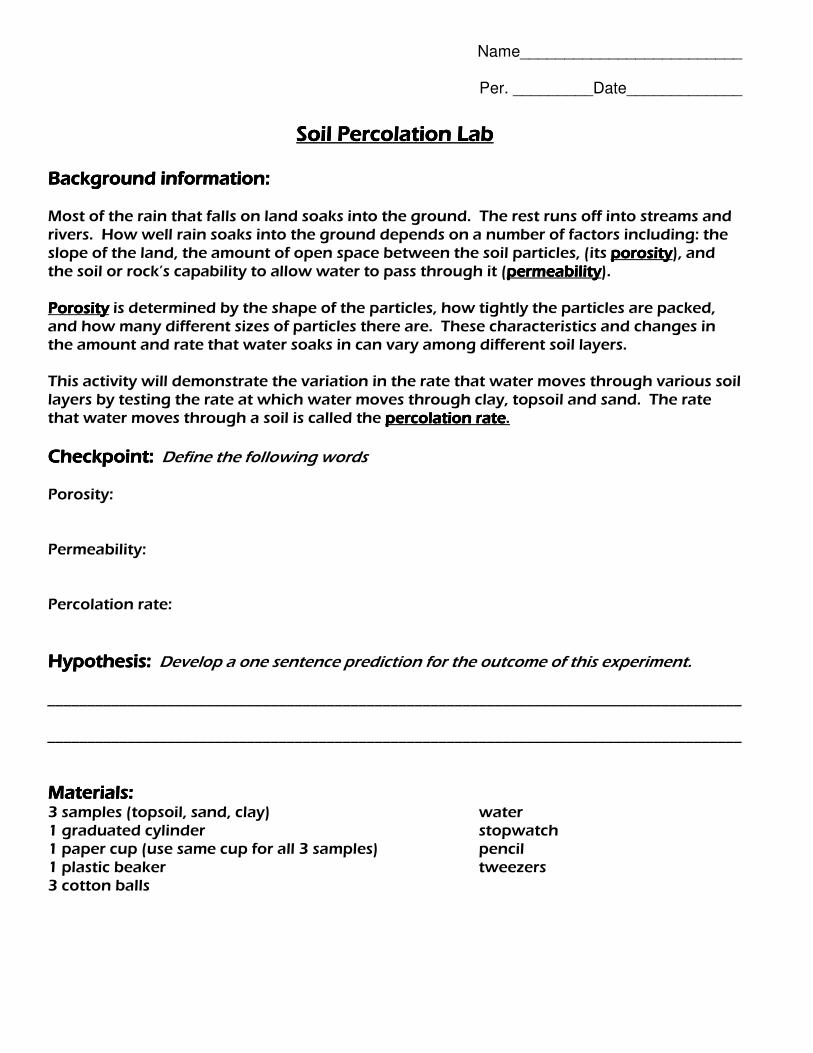
Name_________________________
Per. _________Date_____________
Soil Percolation LabSoil Percolation LabSoil Percolation LabSoil Percolation Lab
Background information:Background information:Background information:Background information: Most of the rain that falls on land soaks into the ground. The rest runs off into streams and rivers. How well rain soaks into the ground depends on a number of factors including: the slope of the land, the amount of open space between the soil particles, (its porosityporosityporosityporosity), and the soil or rock’s capability to allow water to pass through it (permeabilitypermeabilitypermeabilitypermeability). PorosityPorosityPorosityPorosity is determined by the shape of the particles, how tightly the particles are packed, and how many different sizes of particles there are. These characteristics and changes in the amount and rate that water soaks in can vary among different soil layers. This activity will demonstrate the variation in the rate that water moves through various soil layers by testing the rate at which water moves through clay, topsoil and sand. The rate that water moves through a soil is called the percolation ratepercolation ratepercolation ratepercolation rate.
Checkpoint:Checkpoint:Checkpoint:Checkpoint: Define the following words Porosity: Permeability: Percolation rate:
Hypothesis:Hypothesis:Hypothesis:Hypothesis: Develop a one sentence prediction for the outcome of this experiment. _______________________________________________________________________________________ _______________________________________________________________________________________ Materials:Materials:Materials:Materials: 3 samples (topsoil, sand, clay) water 1 graduated cylinder stopwatch 1 paper cup (use same cup for all 3 samples) pencil 1 plastic beaker tweezers 3 cotton balls
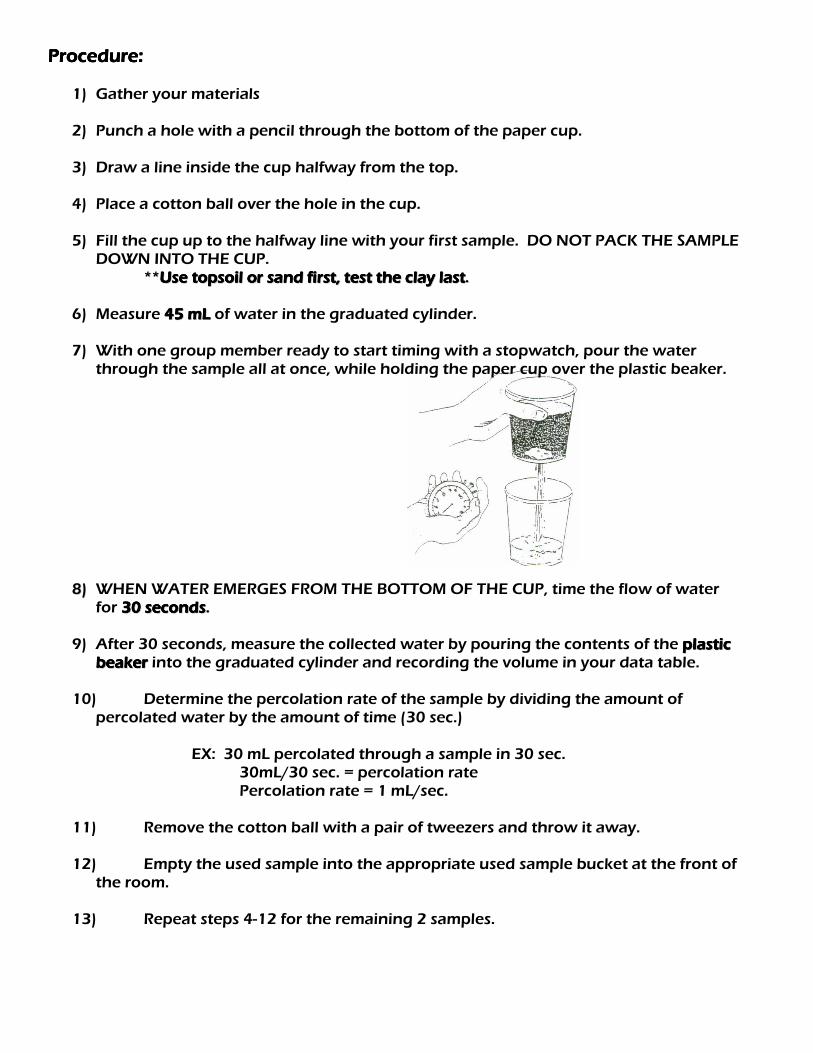
Procedure:Procedure:Procedure:Procedure:
1) Gather your materials
2) Punch a hole with a pencil through the bottom of the paper cup.
3) Draw a line inside the cup halfway from the top.
4) Place a cotton ball over the hole in the cup.
5) Fill the cup up to the halfway line with your first sample. DO NOT PACK THE SAMPLE DOWN INTO THE CUP.
****UUUUUUUUsssssssseeeeeeee ttttttttooooooooppppppppssssssssooooooooiiiiiiiillllllll oooooooorrrrrrrr ssssssssaaaaaaaannnnnnnndddddddd ffffffffiiiiiiiirrrrrrrrsssssssstttttttt,,,,,,,, tttttttteeeeeeeesssssssstttttttt tttttttthhhhhhhheeeeeeee ccccccccllllllllaaaaaaaayyyyyyyy llllllllaaaaaaaasssssssstttttttt..
6) Measure 4444444455555555 mmmmmmmmLLLLLLLL of water in the graduated cylinder.
7) With one group member ready to start timing with a stopwatch, pour the water through the sample all at once, while holding the paper cup over the plastic beaker.
88)) WHEN WATER EMERGES FROM THE BOTTOM OF THE CUP, time the flow of water for 3333333300000000 sssssssseeeeeeeeccccccccoooooooonnnnnnnnddddddddssssssss..
9) After 30 seconds, measure the collected water by pouring the contents of the ppppppppllllllllaaaaaaaassssssssttttttttiiiiiiiicccccccc
bbbbbbbbeeeeeeeeaaaaaaaakkkkkkkkeeeeeeeerrrrrrrr into the graduated cylinder and recording the volume in your data table.
10) Determine the percolation rate of the sample by dividing the amount of percolated water by the amount of time (30 sec.)
EX: 30 mL percolated through a sample in 30 sec. 30mL/30 sec. = percolation rate Percolation rate = 1 mL/sec.
11) Remove the cotton ball with a pair of tweezers and throw it away. 12) Empty the used sample into the appropriate used sample bucket at the front of
the room.
13) Repeat steps 4-12 for the remaining 2 samples.
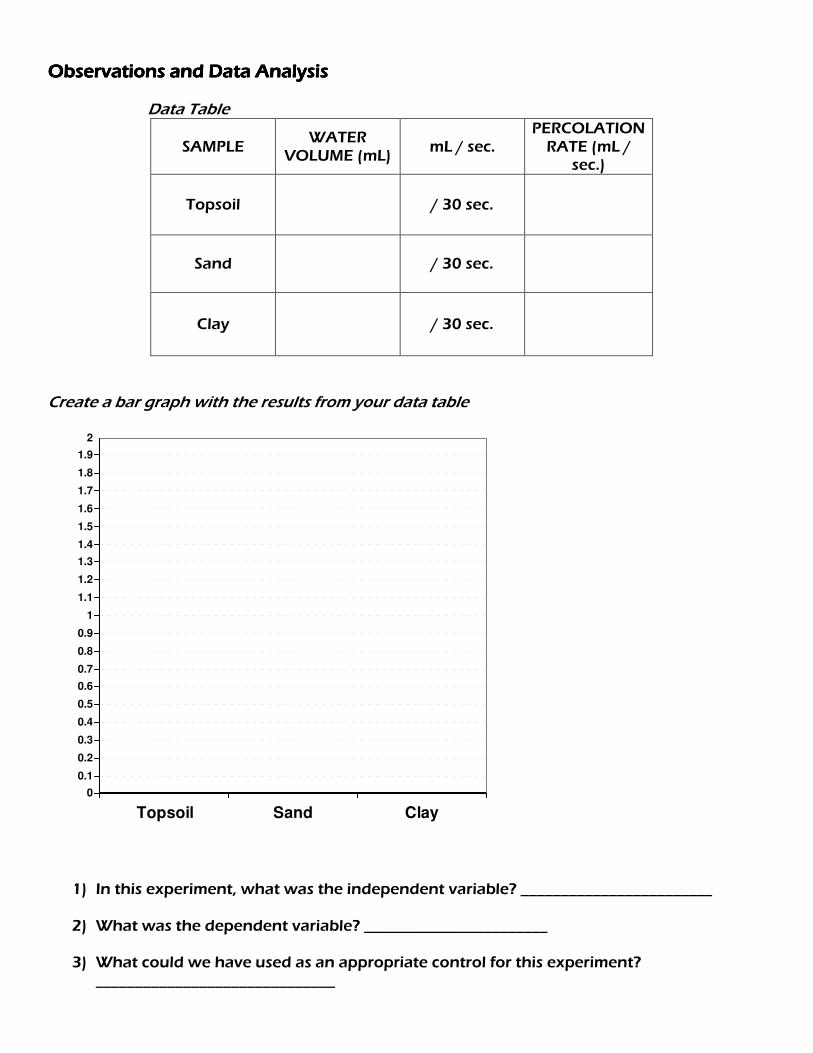
Observations and Data AnalysisObservations and Data AnalysisObservations and Data AnalysisObservations and Data Analysis
Data Table
SAMPLE WATER
VOLUME (mL) mL / sec.
PERCOLATION RATE (mL /
sec.)
Topsoil
/ 30 sec.
Sand
/ 30 sec.
Clay
/ 30 sec.
Create a bar graph with the results from your data table
0
0.1
0.2
0.3
0.4
0.5
0.6
0.7
0.8
0.9
1
1.1
1.2
1.3
1.4
1.5
1.6
1.7
1.8
1.9
2
Topsoil Sand Clay
1) In this experiment, what was the independent variable? ________________________ 2) What was the dependent variable? _______________________
3) What could we have used as an appropriate control for this experiment?
______________________________
4) Was your hypothesis correct or incorrect? ________________________
5) List 3 possible sources of error for that could have affected your results.
a) b) c)
Conclusion:Conclusion:Conclusion:Conclusion: Answer the following questions based on the activity using complete sentences.
6) Which soil component had the fastest percolation rate?___________________
7) Why does the soil component from question #1 percolate the quickest? What
properties/characteristics does it have that may contribute to its percolation rate?
8) Which soil component had the slowest percolation rate?___________________ 9) Why does the soil component from question #3 percolate the slowest? What
properties/characteristics does it have that may contribute to its percolation rate?
10) List at least 3 people or occupations that may find knowing the percolation rate of
various soil components to be useful. For each, explain how they would use this information.
a) b) c)
11) Suppose you are a farmer and you have 2 samples of soil—one is mostly sand and
the other is mostly clay. You want to grow soybeans in one of these 2 soils. What questions would you need to ask before choosing the soil in which to plant your soybeans? (Write at least 2 questions).
a) b)