Embed Size (px)
Citation preview

Forward-thinking solutions to leverage the fourth industrial revolution
2017-2019 3-Years Business Plan extract

01 Revenue
02 Profit
03 Cash
Excellence 2017-2019 three years Business Plan 2017-2019 three years Business Plan
A virtuous circle of excellence for a constant growth
Biesse Group / Our values

Gro
up
Cons
olid
ated
N
et S
ales
(€/
mln
)
Biesse Group Consolidates Net Sales (€/mln)
1969 1980 2001 2009 2013
an history of growth Revenue
Mechatronics Metal
Plastic & Advanced Materials
bSoft (software)
Biesse Group / Our values / Excellence
350 € mln of revenues CAGR 12.7%
2009-2016e
Glass
Stone
Wood
353 370 306 310 335
396 466 455
268 328
388 383 378 427
519
618
admitted to the STAR segment
(Milan Stock Exchange) June 2001
2017-2019 three years Business Plan
2016e

Gro
up
EBIT
DA
(€/m
ln)
Biesse Group EBITDA (€/mln)
2010 2011 2013 2014 2016e
EBITDA
Profit 84 € mln Delta EBIDTA 2009 – 2016e
2009-2016e
-8,4
15,7 22,4 25,0 34,0 40,0
64,0 75,8
-20
-10
0
10
20
30
40
50
60
70
80
90
2015
2017-2019 three years Business Plan Biesse Group / Our values / Excellence
2012 2009

-32,7
-18,9
-50,4 -56,2
-23,9
-11,2
0,1 4,9 0
After dividends payment in 2014 - 2015 - 2016 Net financial position
Cash
2009 2012 2013 2014 2015
positive net financial
position
Net
Deb
t (€
/mln
)
2016e
2017-2019 three years Business Plan
> 37€ mln of CASH
generated
2009-2016e
Biesse Group / Our values / Excellence
2011 2010

Strategy & Results
2017-2019 three years Business Plan
2016e successes Execution on track
Where we are: business plan update

2016e Successes
Where we are / Strategy & Results
75,8 €/mln
55,2 €/mln
493,2 €/mln
618,1 €/mln
+4,9 €/mln
EBITDA
EBIT
Net Sales
Order Intake
Net Debt

+ products
+ solutions
Best-in-class Alignment
One-stop Shopping
Differentiation Take Over
+ BCX
Time
Valu
e Execution on track
2017-2019 three years Business Plan Where we are / Strategy & Results

2017-2019 three years Business Plan
EBITDA +18,2%
+12 €/mln
Execution on track
519
572
618
2015 2016 Target
2016e Results
64
74 76
2015 2016 Target
2016e Results
0,1
3,7
4,9
2015 2016 Target
2016e Results
Net Debt
+4,8 €/mln
Net Sales +19,1%
+99 €/mln
Anticipating plan Execution
On track with plan Execution
Where we are / Strategy & Results

Products 2017-2019 three years Business Plan
Exceeding targets Wood Housing Glass & Stone Mechatronics Tooling Advanced Materials
Where we are: business plan update

+ products
Best-in-class Alignment
Exceeding targets
Where we are / Products 2017-2019 three years Business Plan
380 414
450
2015 2016 Target
2016e Results
81
90 96
2015 2016 Target
2016e Results
6,7 7,8
9,3
2015 2016 Target
2016e Results
3,5
9,6 12,0
2015 2016 Target
2016e Results
+ mechatronics (focus on metal) + plastic & A.M. +38,9%
+ glass & stone + wood
+243%
+18,4% +18,3%
+2,6 €/mln +8,5 €/mln
+70 €/mln +15 €/mln
2016 Results

Exceeding targets
2017-2019 three years Business Plan
+ solutions
One-stop Shopping
2016 Results
88,0
100,0 102,0
2015 2016 Target
2016e Results
+ Service +16%
+14 €/mln
16,0% System Incidence on Machine Sales in 2015
18,0% System Incidence on Machine Sales in 2016e
65,0 75,0 80,0
2015 2016 Target
2016e Results
+ Systems +23%
+15 €/mln
102€/mln Service Sales
In 2016e
Where we are / Solutions

2017-2019 three years Business Plan
Exceeding targets Close to customers Feeling the products Predicting customer needs IIoT with Accenture & Microsoft
Customer Experience
Where we are: business plan update

Exceeding target
Differentiation Take Over
+ customer
2016 Results
2017-2019 three years Business Plan
Revenues in Western Europe in 2016
+72,4 mln/€
Revenues in ASIA in 2016
+26,7 mln/€
+4 New Local Branches
8.000 Demos in 2016
Revenues in North America in 2016
+18,4 mln/€
Where we are / Customer Experience

2017-2019 three years Business Plan
01
02
03
04
Design
Materials
Production
Shape & Installation
Software
Industry 4.0
Materials Innovation
Digital Manufacturing Machines
“For us 4.0 is not simply a number representing the so-called new industrial revolution, but a real commitment toward our customers to allow them, to achieve the highest level of efficiency” - Federico Broccoli (Wood Division Director / Sales)
A new step towards the Factory of the Future
Predicting Customer needs
Where we are / Customer Experience

Where we want to go: 2019 new targets
Continuous Growth More products More solutions More Customer Experience

Wood Division Estimated CAGR 2017-2019
4% Market Estimated CAGR 2017-2019
G&S Division Estimated CAGR 2017-2019
7% Market Estimated CAGR 2017-2019
A.M. Division Estimated CAGR 2017-2019
2019 Target
19 mln€
Metal
2019 Target
30 mln€
Advanced Materials
2019 Targets
2017-2019 three years Business Plan
Mechatronics Division Estimated CAGR 2017-2019
5% Market Estimated CAGR 2017-2019
Where we want to go / Continuous Growth Where we want to go / Continuous Growth
More products New target

To evolve to Service 2.0: from a "break and fix" approach to a proactive service
To increase our market share in the system solutions market.
To improve our software to keep offering to our Customers endless possibilities.
2019 Targets
One-stop shopping
Service Target Contribution to Net Sales
20.5%
Software Target Contribution to Net Sales
1.0%
System Target Contribution to Machine Sales
20%
2017-2019 three years Business Plan Where we want to go / Continuous Growth
More solutions New target

Where we want to go / More Products
Advanced Materials*
2017-2019 three years Business Plan
Extend our product range drawing on the expertise of Uniteam to enhance its range of products and applications for machining advanced composite materials for several industries
appl
icat
ion
Medical Devices
Aerospace
Visual communication
Packaging
Renewable Energy
Automotive
30mln/€ 2019 target
In advanced material segment
*Advanced materials
Carbon Fiber Foam Plastics Composite Alluminium Titanium
Expand our plastic working machineries in order to meet the needs of the entire market. 01
02
Defense and Ballistics
Marine

More Solutions
2017-2019 three years Business Plan
2019 new targets Service Systems bSuite
Where we want to go: 2019 new targets
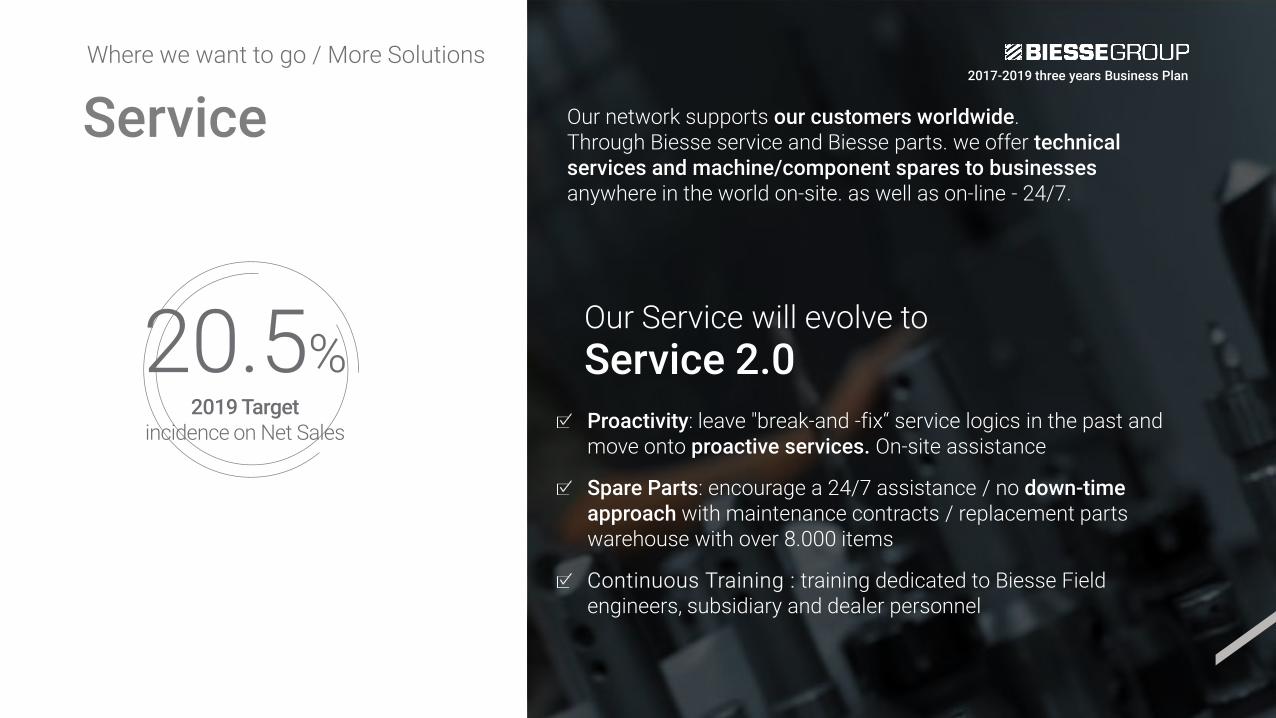
Our network supports our customers worldwide. Through Biesse service and Biesse parts. we offer technical services and machine/component spares to businesses anywhere in the world on-site. as well as on-line - 24/7.
Proactivity: leave "break-and -fix“ service logics in the past and move onto proactive services. On-site assistance
Spare Parts: encourage a 24/7 assistance / no down-time approach with maintenance contracts / replacement parts warehouse with over 8.000 items
Continuous Training : training dedicated to Biesse Field engineers, subsidiary and dealer personnel
Our Service will evolve to Service 2.0
2017-2019 three years Business Plan Where we want to go / More Solutions
Service
20.5% 2019 Target
incidence on Net Sales

We increased our market share becoming a leading company in the engineering solutions sector.
20% 2019 Target incidence on
Machine Sales
2017-2019 three years Business Plan
Definite lead times Automation Stock Management Modularity Total Quality
The guiding strategy of the Biesse Systems team is based on clear key concepts:
Where we want to go / More Solutions
Systems
20% 2019 Target
incidence on Net Sales

01
02
03
Consolidation. reliability and rationalization. Superior technology for creating synergies in machine automation.
Technological superiority and sustainability. Ensuring advanced. sustainable know-how in order to develop intelligent machines.
Simple. smart software. Meeting growing technological needs through application software and smart apps.
04 Business software. Business-oriented software to enhance collaboration with our customers’ businesses.
2017-2019 three years Business Plan
1.0 Potential Software Fees contribution to Net Sales %
Where we want to go / More Solutions
bSuite

In addition to the Italian sites, we boost manufacturing sites in India and China, to better satisfy Customer worldwide. The two sites, Bangalore and Dongguan manufacture a portfolio Local4Global, distributing their products worldwide.
Local suppliers certified by Biesse Quality 02 Product Quality Made in Biesse 01
2019 Target production abroad quote
20%
2017-2019 three years Business Plan
Ongoing integration and training 03
Close to customers: India & China
Where we want to go / BCx

Our future in figures Revenue Profit Cash Others Annex Associations The share

€/m
ln
Confirming the growth growth path to consolidate our leadership
2011 2012 2013 2014 2015 2016e 2018e 2019e
Net Sales - Anticipating plan execution Our future in figures
2017e
2017-2019 three years Business Plan
389 383 378 427
519
826
572
633
704
618 676
752
'16-'18 three years Plan '17-'19 three years Plan
In 2016e we went beyond our targets, anticipating plan execution
We yearn to achieve higher targets in 2019 leveraging on our strategy: more products, more solutions, more customers

Stabilize Profitability 2017-2019 three years Business Plan
Our future in figures
10,1% Net sales CAGR 2017-2019
39% Target COGS incidence on Net Sales
<20% Target Overhead Cost on Incidence on Net Sales
2019 Target 12,8 %
EBITDA Margin
2019 Target 105 mln€
EBITDA
2019 Target
EBITDA <30% Target Labor Cost incidence on Net Sales
Secure our positioning among the market leaders
Invest in human resources and capabilities as growth driver, controlling incidence on net sales
Optimize Overhead cost
Continue our growth path
Optimize our production cost

€/m
ln
Increasing our sales force. subsidiaries. agents and distributors worldwide
Growing not only in the woodworking machine sector. but also in the areas of glass. stone, mechatronics and advanced materials especially considering the after-sales services
Continuing to diversify into new sectors: advanced materials and metal working
Continuing to pursue an organic growth. .
2011 2012 2013 2014 2015 2016e 2018e 2019e
Net Sales Our future in figures / Revenue
10.1% CAGR
2017-2019
2017e
2017-2019 three years Business Plan
389 383 378 427
519
618 676
752
826

Source: CSIL furniture demand (world) - CRESME Furniture
2017-2019
+2.9% Consolidated net sales Biesse
CAGR 2017-2019
+10.1% Housing
2017-2019
+2.8%
Reference Market Housing - Furniture 2017-2019 three years Business Plan
Δ% year on year
Our future in figures / Revenue
-4-202468
10121416182022
1,4
18,9
2015
4,1
-3,2
21,6
2014
4,0 2,3
12,9
2013
4,4
4,3
-1,2
2012
1,9 3,1
-1,4
2011
2,9
3,5
18,6
2,4
2019e
3,0
2,9
9,8
2018e
2,6
2,9
11,2
2017e
2,9
2,9
9,4
2016e
Housing Furniture consolidated net sales - Biesse

206
278
323 302 313
376
443
493
58 77 90 82 78
116 141
164
orders intake backlog
€/m
ln
2016: Group orders intake* +11% (vs. the same period 2015) 2016: Group backlog* +16% (vs. the same period 2015)
Group orders intake & backlog
2009 2010 2011 2012 2013 2014 2015
2016
2017-2019 three years Business Plan Our future in figures / Revenue
only machines

22 25 34 40
64 76
83
96 105
5,8%
6,5%
9,1% 9,3%
12,4% 12,3% 12,3% 12,8% 12,8%
EBITDA EBITDA margin
€/m
ln -
%
Decreasing incidence of COGS on Net Sales through world production optimization and efficiency
Maintaining Labour Cost incidence on Net Sales below 30%
Maintaining Overhead incidence on Net Sales well below 20%
Ebitda generation of value.
2011 2012 2013 2014 2015 2016e 2017e 2018e 2019e
2017-2019 three years Business Plan Our future in figures / Profit

-50,4 -56,2
-23,9
-11,2
0,1 4,9
-0,5
17,2
44,7
0 Starting point: positive Net Financial Position at the end of 2016
Continuing to invest in R&D around 2% of Net Sales
Cash Flow finances the projected increasing CAPEX to support our growth forecast
Paid yearly dividends (since 2014 for tree years) for a total amount of > € 24 mln
Net Debt positive cash flow. €/
mln
2011 2012 2013 2014 2015 2016e 2017e 2018e 2019e
2017-2019 three years Business Plan Our future in figures / Cash

22,5% 21,5%
13,6%
13,0%
12,2% 10,5% 10,9% 11,0% 11,1%
operating net working capital o.n.w.c. margin
Maintaining Operating Net Working Capital incidence on Net Sales well below 12%
Maintaining our Group inventories below 21% incidence on Net Sales
Maintaining our Group DSO around 60 -65 days
Maintaining our Group DPO around 100-110 days
Operating Net Working Capital control our Operating Net Working Capital. €/
mln
- %
2011 2012 2013 2014 2015 2016e 2017e 2018e 2019e
2017-2019 three years Business Plan Our future in figures / Cash

17 19 20 21 25
37 42 32 32
4,4%
5,1% 5,2% 4,9% 4,9%
5,9%
6,2%
4,3% 3,9%
3,0%
total capex value total capex % R&D incidence on net sales
€/MIL
2017e tangible: € 24.4 mln intangible: € 17.2 mln main investments drivers:
Indian Manufacturing Site Chinese durable goods investments (KOREX) Mechatronics Italian plant (HSD S.p.A.) components production machines Metal Working (internal phase): improvement of the components production I.T.: digital factory – PLM & CRM – Oracle implementation R&D constant investment. around 2% on net sales every year
Capex* continue our growth path through investments.
€/m
ln -
%
2011 2012 2013 2014 2015 2016e 2017e 2018e 2019e
2017-2019 three years Business Plan Our future in figures / Other figures
*Potential growth strategy through M&A not included

Mechatronics Italian plant (HSD S.p.A.) components production machines (rotary tables) + american subsidiary new site (HSD U.S.A. subsidiary) TANGIBLE
ASSETS
Indian Manufacturing Site widening to meet the projected productive expansion
Chinese Production Site upgrade and durable goods investments (KOREX) CNC lathe , vertical and horizontal working center machines
Metal working (internal phase): improvement of the components production – durable goods investments ,
Capex: tangibles continue our growth path through investments
2017-2019 three years Business Plan Our future in figures / Other figures

2017-2019 three years Business Plan
Capex: intangibles continue our growth path through investments
ERP Oracle sales, distribution and services
Product Lifecycle Management
Internet Of Things
Customer Relationship Management
Collaboration Communication Co -sharing
Manufacturing Execution System
servitization
nicim manufacturing
ms office 365 - internal social employees
salesforce.com
teamcenter - siemens
Industry 4.0
Our future in figures / Other figures

Extract of the P&L 2017-2019 three years Business Plan
Our future in figures / Other figures
*after non recurring items
€/mln 2013 2014 2015 2016e 2019e Targets
Net sales year -1
378.4 -1.2%
427.1 +12.9%
519.1 +21.5%
618.1 +19.1% CAGR 10.1 825.7
Cost of good sold 155.9
41.2% 177.6
41.6% 206.1
39.8% 245.1
39.7% 322
39.0%
Value added %
147.0 38.8%
167.8 39.3%
212.4 40.9%
251.7 40.7% CAGR 11.3
347.3 42.1%
Labour cost 112.7
29.8% 128.2
30.0% 148.2
28.6% 175.9
28.5% 241.9
29.3% < 30% incidence
overhead 81.8
21.6% 91.0
21.3% 104.7
20.2% 124.8
20.2% 159.4
19.3% < 20% incidence
EBITDA %
34.3 9.1%
39.6 9.3%
64.1 12.4%
75.8 12.3% CAGR 11.6
105.4 12.8%
EBIT %
18.1 4.8%
24.8 5.8%
43.7 8.4%
55.2* 8.9% CAGR 12.5
78.7 9.5%

€/mln 2013 2014 2015 2016e 2019e Targets
Inventories % net sales 22.8% 23.0% 21.5% 21.0% 20.2%
<21%
Receivables % net sales 20.1% 18.9% 20.3% 20.9% 20.6% DSO 60-65
days
Payables % net sales 29.4% 28.8% 29.5% 31.5% 29.7% DPO 100-110
days
Operating Net Working Capital % net sales
51.4 13.6%
55.6 13.0%
63.4 12.2%
64.7 10.5%
92.0 11.1%
Operating Net Working Capital 2017-2019 three years Business Plan
Our future in figures / Other figures

Cashflow - Net Debt 2017-2019 three years Business Plan
€/mln 2013 2014 2015 2016e 2019e
Gross Cashflow % net sales
52.0 13.8%
38.3 9.0%
46.3 8.9%
51,1
8.3% 69.3
8.4%
Investments % net sales
-19.8 5.2%
-20.8 4.9%
-25.2 4.9%
-36.5
5.9%
-32.0 3.9%
Net Cashflow % net sales
32.2
8.5% 17.5
4.1% 21.1
4.1%
14.6
2.4% 37.3
4.5%
dividends -4.8 0.18 per share
-9.8
0.36 per share
-9.8
0.36 per share
-9.8
0.36 per share
Δ Net Debt 12.7 11.3 4.8
Net Debt -23.9 -11.2 0.1 4.9 44.7
Our future in figures / Other figures

138 141 147 168 212
252 284
318 347
35,5% 36,9%
38,8% 39,3% 40,9% 40,7%
42,0% 42,3% 42,1%
value added value added margin
Value added €/
mln
- %
2011 2012 2013 2014 2015 2016e 2017e 2018e 2019e
2017-2019 three years Business Plan Our future in figures / Other figures
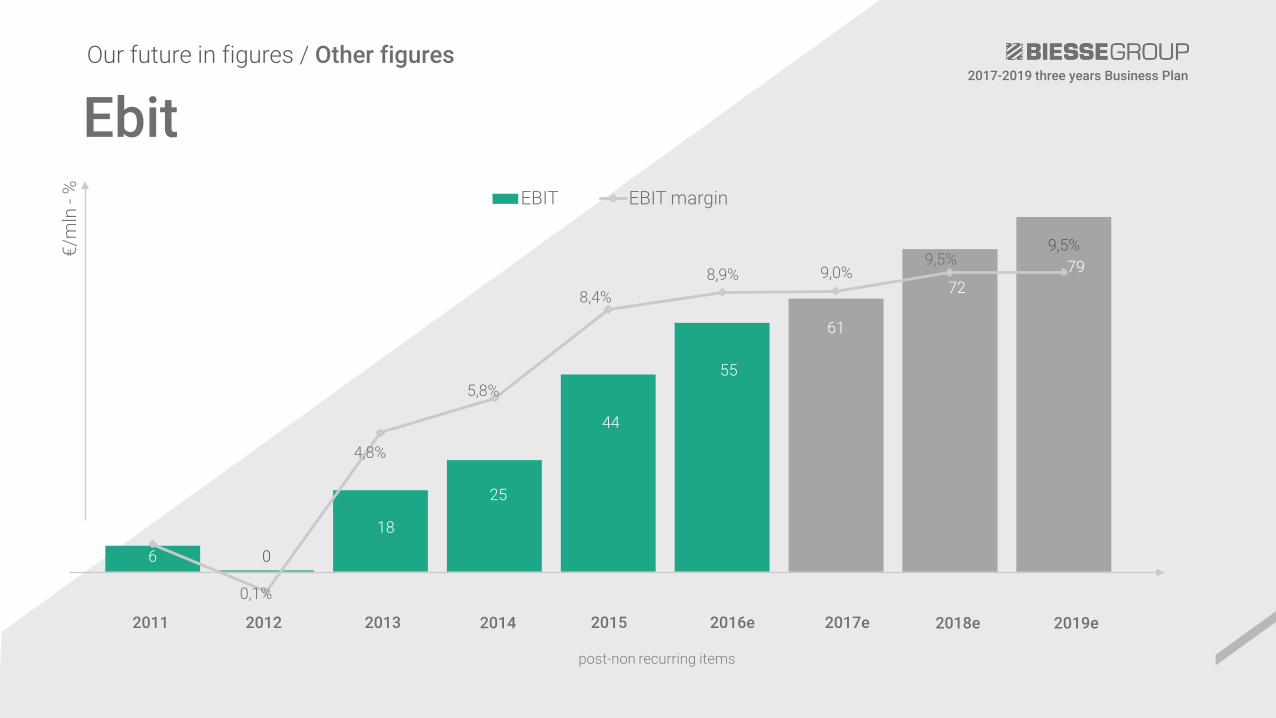
6 0
18
25
44
55
61
72 79
0,1%
4,8%
5,8%
8,4% 8,9% 9,0%
9,5% 9,5%
EBIT EBIT margin
Ebit €/
mln
- %
2011 2012 2013 2014 2015 2016e 2017e 2018e 2019e
2017-2019 three years Business Plan
post-non recurring items
Our future in figures / Other figures

116 116 113 128
148 176
201
222 242
29,7% 30,4% 29,8% 30,0% 28,6% 28,5% 29,7% 29,5% 29,3%
labour cost labour cost margin
Labour cost €/
mln
- %
2011 2012 2013 2014 2015 2016e 2017e 2018e
3-Years Business Plan 2017 - 2019
2019e
Our future in figures / Other figures

FY 2010 FY 2011 FY 2012 FY 2013 FY 2014 FY 2015 FY 2016
Production % of total people
965 41%
1.250 46%
1.265 45%
1.175 44%
1.201 42%
1.335 42%
1.482 41%
Service & After sale % of total people
568 24%
577 21%
574 21%
613 22%
628 22%
690 22%
803 22%
R&D % of total people
293 12%
316 12%
338 12%
321 12%
361 13%
383 13%
436 12%
Sales & Marketing % of total people
340 13%
361 13%
364 13%
351 13%
439 15%
495 15%
587 16%
G & A % of total people
202 9%
233 9%
242 9%
235 9%
252 9%
273 9%
310 8.5%
ITALY % of total people
1.660 70%
1.656 61%
1.646 59%
1.547 57%
1.605 56%
1.780 56%
2.009 56%
OUTSIDE ITALY** % of total people
708 30%
1.081 39%
1.136 41%
1.148 43%
1.276 44%
1.396 44%
1.609 44%
TOTAL 2.368 2.737 2.782 2.695 2.881 3.176 3.618*
*including Uniteam people (nr. 57) People distribution (without interim people)
3-Years Business Plan 2017 - 2019 Our future in figures / Other figures

People distribution
vs Dec 2015: +442 (13.9%) vs Dec 2014: +737 (25.6%) vs Jun 2016: +159 (4.6%) interim people at the end of Dec 2016: 181 (112 at the end of 2015)
3.799
FY 2010 FY 2011 FY 2012 FY 2013 FY 2014 FY 2015 FY 2016
ITALY % of total people
1.660 70%
1.656 61%
1.646 59%
1.547 57%
1.605 56%
1.780 56%
2.009 56%
OUTSIDE ITALY**
% of total people
708 30%
1.081 39%
1.136 41%
1.148 43%
1.276 44%
1.396 44%
1.609 44%
TOTAL 2.368 2.737 2.782 2.695 2.881 3.176 3.618
34
3-Years Business Plan 2017 - 2019 Our future in figures / Other figures

FY 2016 FY 2017e %
Production 1.482 1,574 + 6.2
Service & After sale
803 934 +16.3
R&D 436 495 +13.5
Sales & Marketing
587 676 +15.2
G & A 310 324 +4.5
ITALY 2.009 2,166 + 7.8
OUTSIDE ITALY 1.609 1,837 + 14.2
TOTAL 3.618 4,003 +10.6
People evolution the labour cost increase is EURO 25.1 mln vs 2016 (29.7% 2017 incidence against net sale vs 28.5% in 2016)
Italy
Germany Spain France UK
U.S.A.
Canada
Asia
Oceania
China
India
Increase by countries
2017-2019 three years Business Plan Our future in figures / Other figures

People distribution by main countries - 2016
56% Italy
10% E.U.
14,5% India
5,5% Americas
2% Asia
0% ROW
2017-2019 three years Business Plan Our future in figures / Other figures
People outside Italy: nr. 1.609 People in Italy: nr 2.009
10% China
2% Australia

People distribution by main countries – 2017e
54% Italy
10,5% E.U.
14,5% India
6% Americas
2% Asia
0,5% ROW
2017-2019 three years Business Plan Our future in figures / Other figures
People outside Italy: nr. 1.837 People in Italy: nr 2.166
10% China
2,5% Australia

389 383 378 427
519 618
676
752 826
28,9%
26,0%
20,1% 18,9% 20,3% 20.9 20,8%
20,9% 20,6%
29,1% 28,0% 29,4% 28,8% 29,5%
31,5% 30,5% 30,3% 29,7%
22,8% 23,6%
22,8% 23,0%
21,5% 21,0% 20,6%
20,5% 20,2%
net sales receivables margin payables margin inventories margin
Receivables - Payables - Inventories
2011 2012 2013 2014 2015 2016e 2017e 2018e 2019e
3-Years Business Plan 2017 - 2019 Our future in figures / Other figures

2017-2019 three years Business Plan
Market Value
(Wood, Glass, Stone, Advanced Material & Metal)
New Clients Incremental
Substitutions & Upgrade
Average Price per Unit
+
x
Replacement rate
Installed base
Technological Mix
Unit Price Evolution
Capital Goods demand to increase efficiency
Capital Goods demand
Q
P
+
x
x
Auto
mot
ive,
Aer
ospa
ce,
Met
al S
ecto
r Lo
w-C
ost
com
petit
ion
Cons
truc
tion
GDP
Hou
sing
& F
urni
ture
Au
tom
atio
n
– Automation degree – System integration
– Raw material & components costs
– Add-ons
– Increase in labor cost – Demand to increase
efficiency
– Increase in demand globally
– Emerging Counties Industrialization
– Service life – Assets utilization – Obsolescence
– Number of machines installed
– Machines value by ageing
Drivers and impact Machines Market Value Our future in figures / Annex

Housing - Furniture 2017-2019 three years Business Plan
Δ% year on year
Our future in figures / annex
-4-202468
10121416182022
3,1
-1,4 2,9
2011
18,6
2,6
9,8
2019e
3,0
2,9
2018e
11,2
2017e
2,9
2012
4,1 2,3
3,5
21,6
2,4
2016e 2015
9,4
18,9
1,4
12,9
2013
2,9
4,3
-1,2
4,4 1,9
-3,2
4,0
2014
2,9
Historical correlation index (since 2004) 3.9
Furniture Housing
consolidated net sales - Biesse

world furniture & housing average 2017-2019: +2.9% historical correlation index (2004-2016): 3.9 THEORETICAL BIESSE GROW RATE: 11.3%
Housing & Furniture - Beta 3-Years Business Plan 2017 - 2019
Our future in figures / Annex
2.9% 3.9 11.3%

biessegroup.com