Embed Size (px)
Citation preview
Some thermodynamic implications for thethermostability of proteins
DOUGLAS C. REES1AND ANDREW D. ROBERTSON2
1Howard Hughes Medical Institute and Division of Chemistry and Chemical Engineering, California Institute ofTechnology, Pasadena, California 91125, USA2Department of Biochemistry, College of Medicine, University of Iowa, Iowa City, Iowa 52242, USA
(RECEIVED January 16, 2001; FINAL REVISION March 15, 2001; ACCEPTED March 15, 2001)
Abstract
An analysis of the thermodynamics of protein stability reveals a general tendency for proteins that denatureat higher temperatures to have greater free energies of maximal stability. To a reasonable approximation, thetemperature of maximal stability for the set of globular, water-soluble proteins surveyed by Robertson andMurphy occurs at T* ∼283K, independent of the heat denaturation temperature, Tm. This observationindicates, at least for these proteins, that thermostability tends to be achieved through elevation of thestability curve rather than by broadening or through a horizontal shift to higher temperatures. The relation-ship between the free energy of maximal stability and the temperature of heat denaturation is such that anincrease in maximal stability of ∼0.008 kJ/mole/residue is, on average, associated with a 1°C increase in Tm.An estimate of the energetic consequences of thermal expansion suggests that these effects may contributesignificantly to the destabilization of the native state of proteins with increasing temperature.
Keywords: Protein stability; thermal expansion; protein volumes; stability curve
The temperature dependence of the free energy change,�G(T), for protein unfolding:
N ⇀↽ D (1)
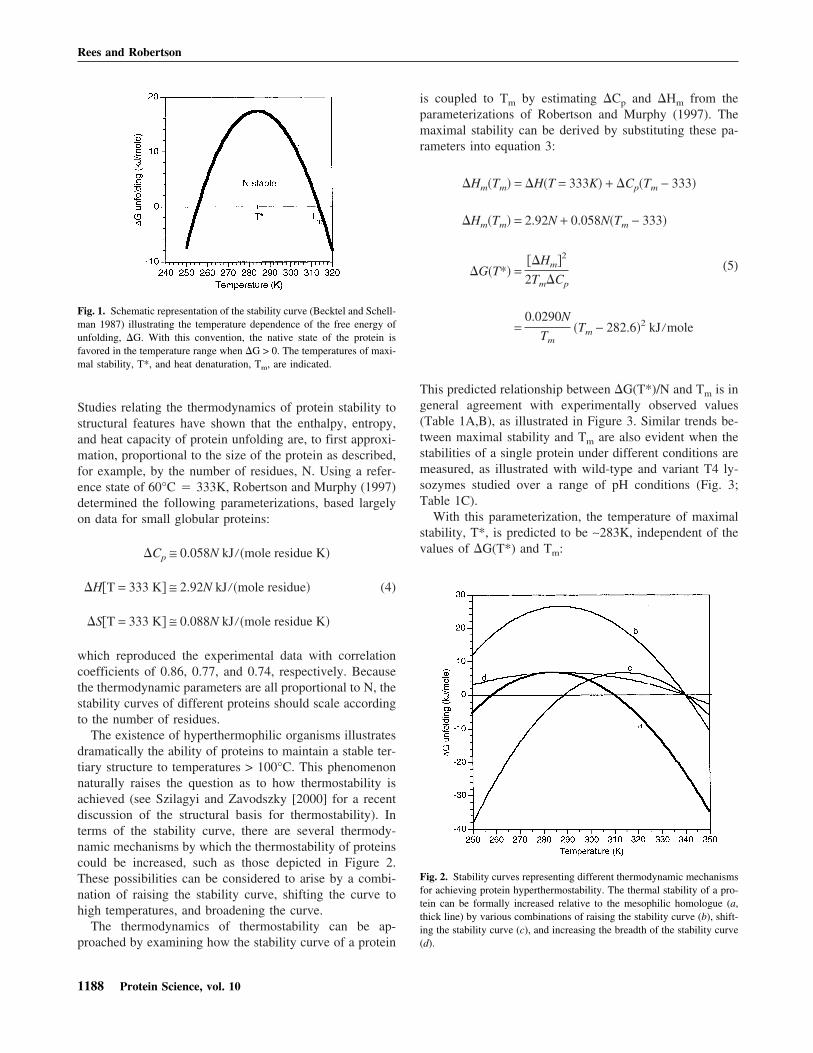
under a given set of conditions (pH, ionic strength, reduc-tion potential, etc.) may be conveniently represented by thestability curve (Becktel and Schellman 1987) as depicted inFigure 1. When the heat capacity is temperature indepen-dent, the stability curve is determined by the values of threeparameters, Tm, �Hm, and �Cp through the relationship(Hawley 1971; Privalov and Gill 1988):
�G�T� = �Hm�Tm − T
Tm� − �Cp�Tm − T�1 − ln� T
Tm���
(2)
in which Tm is the temperature of heat denaturation with�G(Tm) � 0; �Hm is the enthalpy of unfolding at Tm; �Cp
is the heat capacity change on unfolding. The positive �Cp
of protein denaturation likely reflects the exposure to waterof hydrophobic groups that were buried in the native state.One consequence of �Cp > 0 is that the stability curve isindeed a curve (Brandts 1964), and it shows a free energy ofmaximal stability at a temperature T*. In addition to Tm,there is a second point on the stability curve where �G isalso equal to zero that corresponds to the phenomenon ofcold denaturation (Privalov 1990).
The stability curve may be approximated as a quadraticfunction of the temperature with a free energy of maximalstability occurring at a temperature T* (Zipp and Kauzmann1973; Stowell and Rees 1995), in which:
�G�T*� ≅ � �Hm2
2Tm�Cp�
T* ≅ Tm − ��Hm
�Cp� (3)
Reprint requests to: Douglas C. Rees, Howard Hughes Medical Instituteand Division of Chemistry and Chemical Engineering, 147-75CH, Cali-fornia Institute of Technology, Pasadena, California 91125, USA; e-mail:[email protected]; fax: (626) 744-9524.
Article and publication are at www.proteinscience.org/cgi/doi/10.1110/ps.180101.
Protein Science (2001), 10:1187–1194. Published by Cold Spring Harbor Laboratory Press. Copyright © 2001 The Protein Society 1187
Studies relating the thermodynamics of protein stability tostructural features have shown that the enthalpy, entropy,and heat capacity of protein unfolding are, to first approxi-mation, proportional to the size of the protein as described,for example, by the number of residues, N. Using a refer-ence state of 60°C � 333K, Robertson and Murphy (1997)determined the following parameterizations, based largelyon data for small globular proteins:
�Cp ≅ 0.058N kJ��mole residue K�
�H�T = 333 K� ≅ 2.92N kJ��mole residue� (4)
�S�T = 333 K� ≅ 0.088N kJ��mole residue K�
which reproduced the experimental data with correlationcoefficients of 0.86, 0.77, and 0.74, respectively. Becausethe thermodynamic parameters are all proportional to N, thestability curves of different proteins should scale accordingto the number of residues.
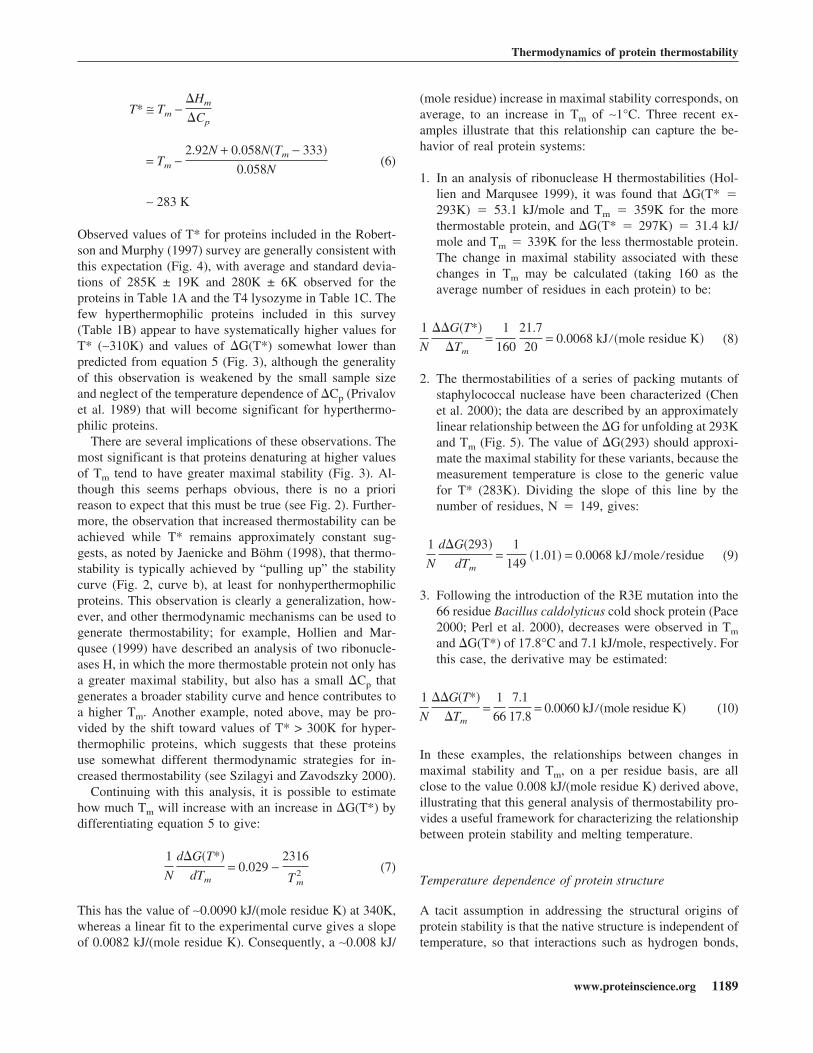
The existence of hyperthermophilic organisms illustratesdramatically the ability of proteins to maintain a stable ter-tiary structure to temperatures > 100°C. This phenomenonnaturally raises the question as to how thermostability isachieved (see Szilagyi and Zavodszky [2000] for a recentdiscussion of the structural basis for thermostability). Interms of the stability curve, there are several thermody-namic mechanisms by which the thermostability of proteinscould be increased, such as those depicted in Figure 2.These possibilities can be considered to arise by a combi-nation of raising the stability curve, shifting the curve tohigh temperatures, and broadening the curve.
The thermodynamics of thermostability can be ap-proached by examining how the stability curve of a protein
is coupled to Tm by estimating �Cp and �Hm from theparameterizations of Robertson and Murphy (1997). Themaximal stability can be derived by substituting these pa-rameters into equation 3:
�Hm�Tm� = �H�T = 333K� + �Cp�Tm − 333�
�Hm�Tm� = 2.92N + 0.058N�Tm − 333�
�G�T*� =��Hm�2
2Tm�Cp
=0.0290N
Tm�Tm − 282.6�2 kJ�mole
( 5)
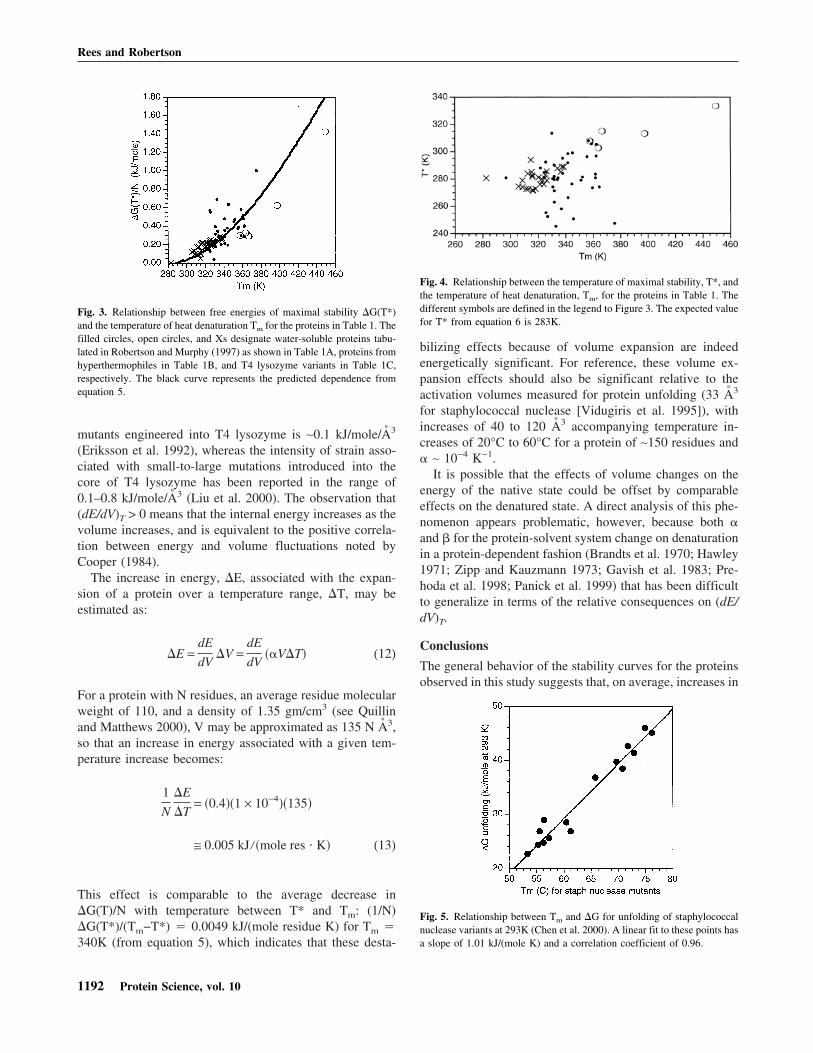
This predicted relationship between �G(T*)/N and Tm is ingeneral agreement with experimentally observed values(Table 1A,B), as illustrated in Figure 3. Similar trends be-tween maximal stability and Tm are also evident when thestabilities of a single protein under different conditions aremeasured, as illustrated with wild-type and variant T4 ly-sozymes studied over a range of pH conditions (Fig. 3;Table 1C).
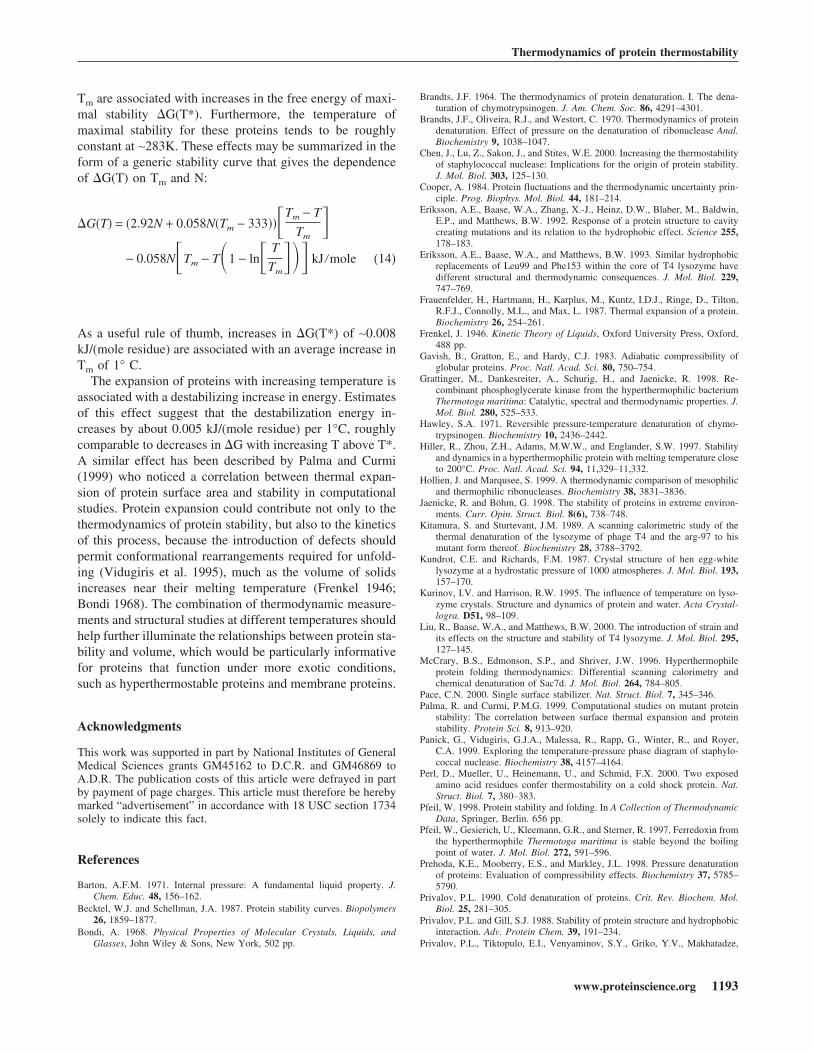
With this parameterization, the temperature of maximalstability, T*, is predicted to be ∼283K, independent of thevalues of �G(T*) and Tm:
Fig. 1. Schematic representation of the stability curve (Becktel and Schell-man 1987) illustrating the temperature dependence of the free energy ofunfolding, �G. With this convention, the native state of the protein isfavored in the temperature range when �G > 0. The temperatures of maxi-mal stability, T*, and heat denaturation, Tm, are indicated.
Fig. 2. Stability curves representing different thermodynamic mechanismsfor achieving protein hyperthermostability. The thermal stability of a pro-tein can be formally increased relative to the mesophilic homologue (a,thick line) by various combinations of raising the stability curve (b), shift-ing the stability curve (c), and increasing the breadth of the stability curve(d).
Rees and Robertson
1188 Protein Science, vol. 10
T* ≅ Tm −�Hm
�Cp
= Tm −2.92N + 0.058N�Tm − 333�
0.058N( 6)
∼ 283 K
Observed values of T* for proteins included in the Robert-son and Murphy (1997) survey are generally consistent withthis expectation (Fig. 4), with average and standard devia-tions of 285K ± 19K and 280K ± 6K observed for theproteins in Table 1A and the T4 lysozyme in Table 1C. Thefew hyperthermophilic proteins included in this survey(Table 1B) appear to have systematically higher values forT* (∼310K) and values of �G(T*) somewhat lower thanpredicted from equation 5 (Fig. 3), although the generalityof this observation is weakened by the small sample sizeand neglect of the temperature dependence of �Cp (Privalovet al. 1989) that will become significant for hyperthermo-philic proteins.
There are several implications of these observations. Themost significant is that proteins denaturing at higher valuesof Tm tend to have greater maximal stability (Fig. 3). Al-though this seems perhaps obvious, there is no a priorireason to expect that this must be true (see Fig. 2). Further-more, the observation that increased thermostability can beachieved while T* remains approximately constant sug-gests, as noted by Jaenicke and Böhm (1998), that thermo-stability is typically achieved by “pulling up” the stabilitycurve (Fig. 2, curve b), at least for nonhyperthermophilicproteins. This observation is clearly a generalization, how-ever, and other thermodynamic mechanisms can be used togenerate thermostability; for example, Hollien and Mar-qusee (1999) have described an analysis of two ribonucle-ases H, in which the more thermostable protein not only hasa greater maximal stability, but also has a small �Cp thatgenerates a broader stability curve and hence contributes toa higher Tm. Another example, noted above, may be pro-vided by the shift toward values of T* > 300K for hyper-thermophilic proteins, which suggests that these proteinsuse somewhat different thermodynamic strategies for in-creased thermostability (see Szilagyi and Zavodszky 2000).
Continuing with this analysis, it is possible to estimatehow much Tm will increase with an increase in �G(T*) bydifferentiating equation 5 to give:
1
N
d�G�T*�
dTm= 0.029 −
2316
Tm2 ( 7)
This has the value of ∼0.0090 kJ/(mole residue K) at 340K,whereas a linear fit to the experimental curve gives a slopeof 0.0082 kJ/(mole residue K). Consequently, a ∼0.008 kJ/
(mole residue) increase in maximal stability corresponds, onaverage, to an increase in Tm of ∼1°C. Three recent ex-amples illustrate that this relationship can capture the be-havior of real protein systems:
1. In an analysis of ribonuclease H thermostabilities (Hol-lien and Marqusee 1999), it was found that �G(T* �293K) � 53.1 kJ/mole and Tm � 359K for the morethermostable protein, and �G(T* � 297K) � 31.4 kJ/mole and Tm � 339K for the less thermostable protein.The change in maximal stability associated with thesechanges in Tm may be calculated (taking 160 as theaverage number of residues in each protein) to be:
1
N
��G�T*�
�Tm=
1
160
21.7
20= 0.0068 kJ��mole residue K� ( 8)
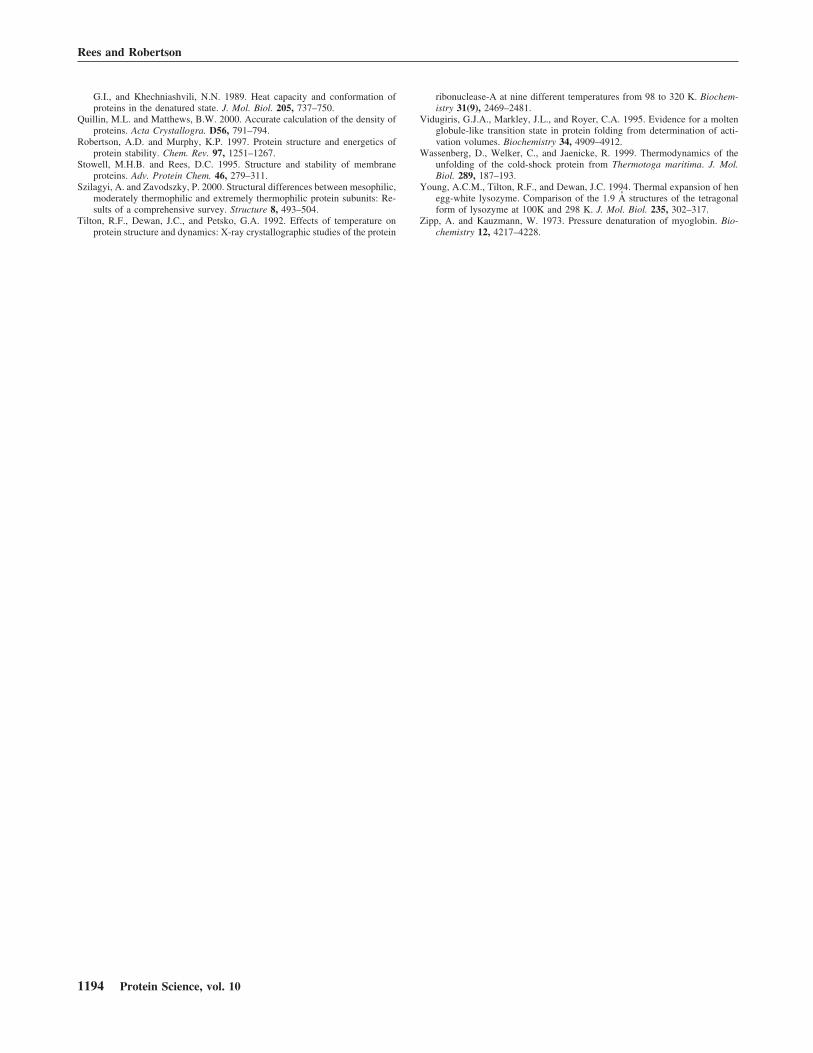
2. The thermostabilities of a series of packing mutants ofstaphylococcal nuclease have been characterized (Chenet al. 2000); the data are described by an approximatelylinear relationship between the �G for unfolding at 293Kand Tm (Fig. 5). The value of �G(293) should approxi-mate the maximal stability for these variants, because themeasurement temperature is close to the generic valuefor T* (283K). Dividing the slope of this line by thenumber of residues, N � 149, gives:
1
N
d�G�293�
dTm=
1
149�1.01� = 0.0068 kJ�mole�residue ( 9)
3. Following the introduction of the R3E mutation into the66 residue Bacillus caldolyticus cold shock protein (Pace2000; Perl et al. 2000), decreases were observed in Tm
and �G(T*) of 17.8°C and 7.1 kJ/mole, respectively. Forthis case, the derivative may be estimated:
1
N
��G�T*�
�Tm=
1
66
7.1
17.8= 0.0060 kJ��mole residue K� ( 10)
In these examples, the relationships between changes inmaximal stability and Tm, on a per residue basis, are allclose to the value 0.008 kJ/(mole residue K) derived above,illustrating that this general analysis of thermostability pro-vides a useful framework for characterizing the relationshipbetween protein stability and melting temperature.
Temperature dependence of protein structure
A tacit assumption in addressing the structural origins ofprotein stability is that the native structure is independent oftemperature, so that interactions such as hydrogen bonds,
Thermodynamics of protein thermostability
www.proteinscience.org 1189
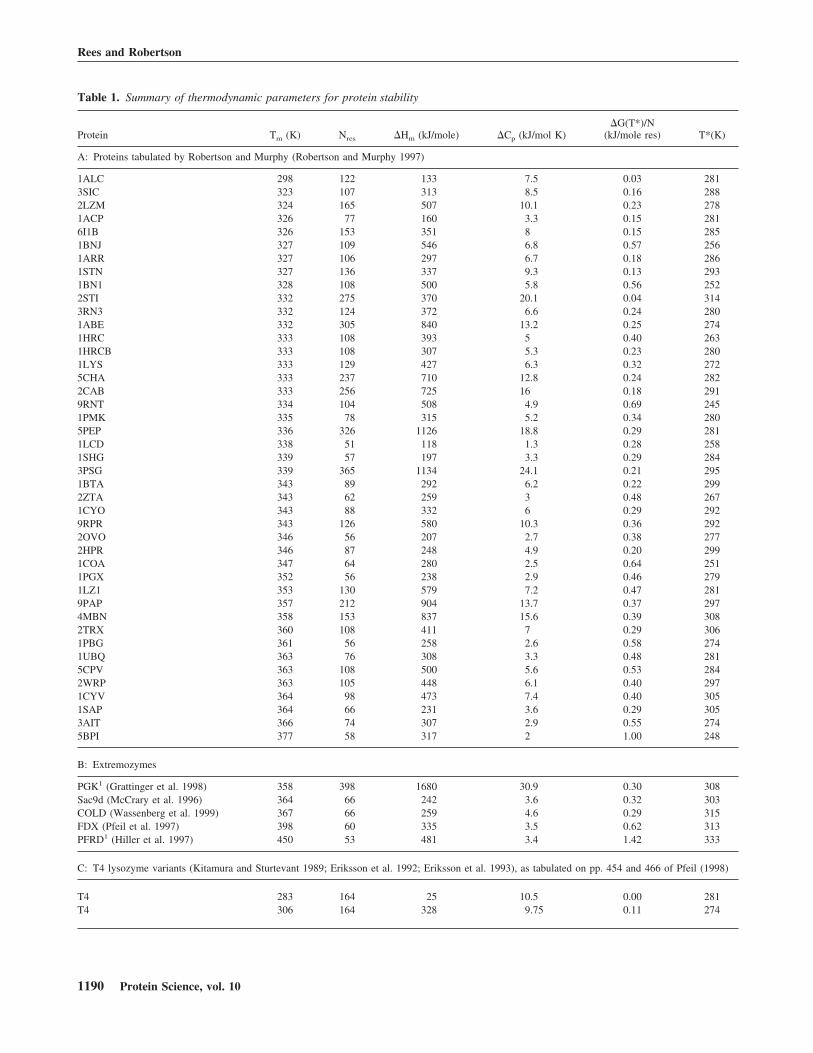
Table 1. Summary of thermodynamic parameters for protein stability
Protein Tm (K) Nres �Hm (kJ/mole) �Cp (kJ/mol K)�G(T*)/N
(kJ/mole res) T*(K)
A: Proteins tabulated by Robertson and Murphy (Robertson and Murphy 1997)
1ALC 298 122 133 7.5 0.03 2813SIC 323 107 313 8.5 0.16 2882LZM 324 165 507 10.1 0.23 2781ACP 326 77 160 3.3 0.15 2816I1B 326 153 351 8 0.15 2851BNJ 327 109 546 6.8 0.57 2561ARR 327 106 297 6.7 0.18 2861STN 327 136 337 9.3 0.13 2931BN1 328 108 500 5.8 0.56 2522STI 332 275 370 20.1 0.04 3143RN3 332 124 372 6.6 0.24 2801ABE 332 305 840 13.2 0.25 2741HRC 333 108 393 5 0.40 2631HRCB 333 108 307 5.3 0.23 2801LYS 333 129 427 6.3 0.32 2725CHA 333 237 710 12.8 0.24 2822CAB 333 256 725 16 0.18 2919RNT 334 104 508 4.9 0.69 2451PMK 335 78 315 5.2 0.34 2805PEP 336 326 1126 18.8 0.29 2811LCD 338 51 118 1.3 0.28 2581SHG 339 57 197 3.3 0.29 2843PSG 339 365 1134 24.1 0.21 2951BTA 343 89 292 6.2 0.22 2992ZTA 343 62 259 3 0.48 2671CYO 343 88 332 6 0.29 2929RPR 343 126 580 10.3 0.36 2922OVO 346 56 207 2.7 0.38 2772HPR 346 87 248 4.9 0.20 2991COA 347 64 280 2.5 0.64 2511PGX 352 56 238 2.9 0.46 2791LZ1 353 130 579 7.2 0.47 2819PAP 357 212 904 13.7 0.37 2974MBN 358 153 837 15.6 0.39 3082TRX 360 108 411 7 0.29 3061PBG 361 56 258 2.6 0.58 2741UBQ 363 76 308 3.3 0.48 2815CPV 363 108 500 5.6 0.53 2842WRP 363 105 448 6.1 0.40 2971CYV 364 98 473 7.4 0.40 3051SAP 364 66 231 3.6 0.29 3053AIT 366 74 307 2.9 0.55 2745BPI 377 58 317 2 1.00 248
B: Extremozymes
PGK1 (Grattinger et al. 1998) 358 398 1680 30.9 0.30 308Sac9d (McCrary et al. 1996) 364 66 242 3.6 0.32 303COLD (Wassenberg et al. 1999) 367 66 259 4.6 0.29 315FDX (Pfeil et al. 1997) 398 60 335 3.5 0.62 313PFRD1 (Hiller et al. 1997) 450 53 481 3.4 1.42 333
C: T4 lysozyme variants (Kitamura and Sturtevant 1989; Eriksson et al. 1992; Eriksson et al. 1993), as tabulated on pp. 454 and 466 of Pfeil (1998)
T4 283 164 25 10.5 0.00 281T4 306 164 328 9.75 0.11 274
Rees and Robertson
1190 Protein Science, vol. 10
salt bridges, buried surface area, and others can be enumer-ated independently of the conditions of the structure deter-mination. Even without consideration of such factors as thepossibility of large-scale conformational changes and theinfluence of crystallization conditions on the structure, theassumption of structural invariance cannot be strictly accu-rate. Like most materials, proteins expand with increasingtemperature. The coefficient of thermal expansion, � �((1/V) (dV/dT))P, has been estimated from thermodynamicmeasurements and structural studies, and is found to be∼10−4 K−1 for many proteins (Frauenfelder et al. 1987; Til-ton et al. 1992; Young et al. 1994). This implies, for ex-ample, that the volumes of proteins will contract severalpercent between room temperature and the ∼100K typicallyused for cryocrystallographic data collection.
As indicated by the preceding considerations, this in-crease in volume with increasing temperature is not ener-getically benign, but is associated with changes in the ther-modynamic parameters of both the N and D states. Oneexample of this is the volume dependence of the internalenergy, given by the quantity, (dE/dV)T, which is alsoknown as the internal pressure (Barton 1971). Values of(dE/dV)T may be obtained from the coefficients of thermalexpansion (�) and compressibility � � (−(1/V) (dV/dP))T,via the thermodynamic relationships:
dE = TdS − PdV
�dE
dV�T= T�dS
dV�T− P
= T�dP
dT�V− P
�from the Maxwell relationship �dS
dV�T= �dP
dT�V� ( 11)
= T�
�− P �since �dP
dT�V=
�
��≅ T
�
�
Because T�/� tends to be much larger than the externalpressure P (1 atm), the latter can be generally neglected. Forlysozyme, � ∼ 1 × 10⁻⁴ K−1 (Young et al. 1994; Kurinovand Harrison 1995) and � ∼ 5 × 10⁻⁶ atm−1 (Kundrot andRichards 1987) � 0.08 A3/(kJ/mole), so that the internalpressure equals ∼0.4 kJ/mole/A3 (� ∼6000 atm) at 298K.As a comparison, the volume-dependent term for cavity
Table 1. Continued
Protein Tm (K) Nres �Hm (kJ/mole) �Cp (kJ/mol K)�G(T*)/N
(kJ/mole res) T*(K)
T4 309 164 363 9.75 0.13 274T4 309 164 335 10.5 0.10 279T4 312 164 406 9.75 0.16 273T4 313 164 316 10.5 0.09 284T4 314 164 426 9.75 0.17 273T4 315 164 234 10.5 0.05 294T4 316 164 339 10.5 0.10 285T4 316 164 383 10.5 0.13 282T4 316 164 466 9.75 0.20 272T4 316 164 376 10.5 0.13 282T4 317 164 478 9.75 0.21 271T4 318 164 479 9.75 0.21 273T4 321 164 448 10.5 0.17 281T4 322 164 479 9.75 0.21 276T4 323 164 485 10.5 0.20 280T4 325 164 517 9.75 0.24 276T4 325 164 498 10.5 0.21 281T4 325 164 481 10.5 0.20 283T4 327 164 460 10.5 0.18 286T4 327 164 544 10.5 0.25 279T4 334 164 531 10.5 0.23 287T4 336 164 586 10.5 0.28 285T4 338 164 556 10.5 0.25 289T4 339 164 565 10.5 0.26 289
Values of T* and �G(T*) were obtained from the position of the stability curve maximum for each protein, as evaluated from equation 2 with Mathematica.1 �Hm and �Cp were estimated from stability curves presented in the reference.
Thermodynamics of protein thermostability
www.proteinscience.org 1191
mutants engineered into T4 lysozyme is ∼0.1 kJ/mole/A3
(Eriksson et al. 1992), whereas the intensity of strain asso-ciated with small-to-large mutations introduced into thecore of T4 lysozyme has been reported in the range of0.1–0.8 kJ/mole/A3 (Liu et al. 2000). The observation that(dE/dV)T > 0 means that the internal energy increases as thevolume increases, and is equivalent to the positive correla-tion between energy and volume fluctuations noted byCooper (1984).
The increase in energy, �E, associated with the expan-sion of a protein over a temperature range, �T, may beestimated as:
�E =dE
dV�V =
dE
dV��V�T� ( 12)
For a protein with N residues, an average residue molecularweight of 110, and a density of 1.35 gm/cm3 (see Quillinand Matthews 2000), V may be approximated as 135 N A3,so that an increase in energy associated with a given tem-perature increase becomes:
1
N
�E
�T= �0.4��1 × 10− 4��135�
≅ 0.005 kJ��mole res � K� ( 13)
This effect is comparable to the average decrease in�G(T)/N with temperature between T* and Tm: (1/N)�G(T*)/(Tm−T*) � 0.0049 kJ/(mole residue K) for Tm �340K (from equation 5), which indicates that these desta-
bilizing effects because of volume expansion are indeedenergetically significant. For reference, these volume ex-pansion effects should also be significant relative to theactivation volumes measured for protein unfolding (33 A3
for staphylococcal nuclease [Vidugiris et al. 1995]), withincreases of 40 to 120 A3 accompanying temperature in-creases of 20°C to 60°C for a protein of ∼150 residues and� ∼ 10−4 K−1.
It is possible that the effects of volume changes on theenergy of the native state could be offset by comparableeffects on the denatured state. A direct analysis of this phe-nomenon appears problematic, however, because both �and � for the protein-solvent system change on denaturationin a protein-dependent fashion (Brandts et al. 1970; Hawley1971; Zipp and Kauzmann 1973; Gavish et al. 1983; Pre-hoda et al. 1998; Panick et al. 1999) that has been difficultto generalize in terms of the relative consequences on (dE/dV)T.
Conclusions
The general behavior of the stability curves for the proteinsobserved in this study suggests that, on average, increases in
Fig. 3. Relationship between free energies of maximal stability �G(T*)and the temperature of heat denaturation Tm for the proteins in Table 1. Thefilled circles, open circles, and Xs designate water-soluble proteins tabu-lated in Robertson and Murphy (1997) as shown in Table 1A, proteins fromhyperthermophiles in Table 1B, and T4 lysozyme variants in Table 1C,respectively. The black curve represents the predicted dependence fromequation 5.
Fig. 4. Relationship between the temperature of maximal stability, T*, andthe temperature of heat denaturation, Tm, for the proteins in Table 1. Thedifferent symbols are defined in the legend to Figure 3. The expected valuefor T* from equation 6 is 283K.
Fig. 5. Relationship between Tm and �G for unfolding of staphylococcalnuclease variants at 293K (Chen et al. 2000). A linear fit to these points hasa slope of 1.01 kJ/(mole K) and a correlation coefficient of 0.96.
Rees and Robertson
1192 Protein Science, vol. 10
Tm are associated with increases in the free energy of maxi-mal stability �G(T*). Furthermore, the temperature ofmaximal stability for these proteins tends to be roughlyconstant at ∼283K. These effects may be summarized in theform of a generic stability curve that gives the dependenceof �G(T) on Tm and N:
�G�T� = �2.92N + 0.058N�Tm − 333���Tm − T
Tm�
− 0.058N�Tm − T�1 − ln� T
Tm��� kJ�mole ( 14)
As a useful rule of thumb, increases in �G(T*) of ∼0.008kJ/(mole residue) are associated with an average increase inTm of 1° C.
The expansion of proteins with increasing temperature isassociated with a destabilizing increase in energy. Estimatesof this effect suggest that the destabilization energy in-creases by about 0.005 kJ/(mole residue) per 1°C, roughlycomparable to decreases in �G with increasing T above T*.A similar effect has been described by Palma and Curmi(1999) who noticed a correlation between thermal expan-sion of protein surface area and stability in computationalstudies. Protein expansion could contribute not only to thethermodynamics of protein stability, but also to the kineticsof this process, because the introduction of defects shouldpermit conformational rearrangements required for unfold-ing (Vidugiris et al. 1995), much as the volume of solidsincreases near their melting temperature (Frenkel 1946;Bondi 1968). The combination of thermodynamic measure-ments and structural studies at different temperatures shouldhelp further illuminate the relationships between protein sta-bility and volume, which would be particularly informativefor proteins that function under more exotic conditions,such as hyperthermostable proteins and membrane proteins.
Acknowledgments
This work was supported in part by National Institutes of GeneralMedical Sciences grants GM45162 to D.C.R. and GM46869 toA.D.R. The publication costs of this article were defrayed in partby payment of page charges. This article must therefore be herebymarked “advertisement” in accordance with 18 USC section 1734solely to indicate this fact.
References
Barton, A.F.M. 1971. Internal pressure: A fundamental liquid property. J.Chem. Educ. 48, 156–162.
Becktel, W.J. and Schellman, J.A. 1987. Protein stability curves. Biopolymers26, 1859–1877.
Bondi, A. 1968. Physical Properties of Molecular Crystals, Liquids, andGlasses, John Wiley & Sons, New York, 502 pp.
Brandts, J.F. 1964. The thermodynamics of protein denaturation. I. The dena-turation of chymotrypsinogen. J. Am. Chem. Soc. 86, 4291–4301.
Brandts, J.F., Oliveira, R.J., and Westort, C. 1970. Thermodynamics of proteindenaturation. Effect of pressure on the denaturation of ribonuclease Anal.Biochemistry 9, 1038–1047.
Chen, J., Lu, Z., Sakon, J., and Stites, W.E. 2000. Increasing the thermostabilityof staphylococcal nuclease: Implications for the origin of protein stability.J. Mol. Biol. 303, 125–130.
Cooper, A. 1984. Protein fluctuations and the thermodynamic uncertainty prin-ciple. Prog. Biophys. Mol. Biol. 44, 181–214.
Eriksson, A.E., Baase, W.A., Zhang, X.-J., Heinz, D.W., Blaber, M., Baldwin,E.P., and Matthews, B.W. 1992. Response of a protein structure to cavitycreating mutations and its relation to the hydrophobic effect. Science 255,178–183.
Eriksson, A.E., Baase, W.A., and Matthews, B.W. 1993. Similar hydrophobicreplacements of Leu99 and Phe153 within the core of T4 lysozyme havedifferent structural and thermodynamic consequences. J. Mol. Biol. 229,747–769.
Frauenfelder, H., Hartmann, H., Karplus, M., Kuntz, I.D.J., Ringe, D., Tilton,R.F.J., Connolly, M.L., and Max, L. 1987. Thermal expansion of a protein.Biochemistry 26, 254–261.
Frenkel, J. 1946. Kinetic Theory of Liquids, Oxford University Press, Oxford,488 pp.
Gavish, B., Gratton, E., and Hardy, C.J. 1983. Adiabatic compressibility ofglobular proteins. Proc. Natl. Acad. Sci. 80, 750–754.
Grattinger, M., Dankesreiter, A., Schurig, H., and Jaenicke, R. 1998. Re-combinant phosphoglycerate kinase from the hyperthermophilic bacteriumThermotoga maritima: Catalytic, spectral and thermodynamic properties. J.Mol. Biol. 280, 525–533.
Hawley, S.A. 1971. Reversible pressure-temperature denaturation of chymo-trypsinogen. Biochemistry 10, 2436–2442.
Hiller, R., Zhou, Z.H., Adams, M.W.W., and Englander, S.W. 1997. Stabilityand dynamics in a hyperthermophilic protein with melting temperature closeto 200°C. Proc. Natl. Acad. Sci. 94, 11,329–11,332.
Hollien, J. and Marqusee, S. 1999. A thermodynamic comparison of mesophilicand thermophilic ribonucleases. Biochemistry 38, 3831–3836.
Jaenicke, R. and Böhm, G. 1998. The stability of proteins in extreme environ-ments. Curr. Opin. Struct. Biol. 8(6), 738–748.
Kitamura, S. and Sturtevant, J.M. 1989. A scanning calorimetric study of thethermal denaturation of the lysozyme of phage T4 and the arg-97 to hismutant form thereof. Biochemistry 28, 3788–3792.
Kundrot, C.E. and Richards, F.M. 1987. Crystal structure of hen egg-whitelysozyme at a hydrostatic pressure of 1000 atmospheres. J. Mol. Biol. 193,157–170.
Kurinov, I.V. and Harrison, R.W. 1995. The influence of temperature on lyso-zyme crystals. Structure and dynamics of protein and water. Acta Crystal-logra. D51, 98–109.
Liu, R., Baase, W.A., and Matthews, B.W. 2000. The introduction of strain andits effects on the structure and stability of T4 lysozyme. J. Mol. Biol. 295,127–145.
McCrary, B.S., Edmonson, S.P., and Shriver, J.W. 1996. Hyperthermophileprotein folding thermodynamics: Differential scanning calorimetry andchemical denaturation of Sac7d. J. Mol. Biol. 264, 784–805.
Pace, C.N. 2000. Single surface stabilizer. Nat. Struct. Biol. 7, 345–346.Palma, R. and Curmi, P.M.G. 1999. Computational studies on mutant protein
stability: The correlation between surface thermal expansion and proteinstability. Protein Sci. 8, 913–920.
Panick, G., Vidugiris, G.J.A., Malessa, R., Rapp, G., Winter, R., and Royer,C.A. 1999. Exploring the temperature-pressure phase diagram of staphylo-coccal nuclease. Biochemistry 38, 4157–4164.
Perl, D., Mueller, U., Heinemann, U., and Schmid, F.X. 2000. Two exposedamino acid residues confer thermostability on a cold shock protein. Nat.Struct. Biol. 7, 380–383.
Pfeil, W. 1998. Protein stability and folding. In A Collection of ThermodynamicData, Springer, Berlin. 656 pp.
Pfeil, W., Gesierich, U., Kleemann, G.R., and Sterner, R. 1997. Ferredoxin fromthe hyperthermophile Thermotoga maritima is stable beyond the boilingpoint of water. J. Mol. Biol. 272, 591–596.
Prehoda, K.E., Mooberry, E.S., and Markley, J.L. 1998. Pressure denaturationof proteins: Evaluation of compressibility effects. Biochemistry 37, 5785–5790.
Privalov, P.L. 1990. Cold denaturation of proteins. Crit. Rev. Biochem. Mol.Biol. 25, 281–305.
Privalov, P.L. and Gill, S.J. 1988. Stability of protein structure and hydrophobicinteraction. Adv. Protein Chem. 39, 191–234.
Privalov, P.L., Tiktopulo, E.I., Venyaminov, S.Y., Griko, Y.V., Makhatadze,
Thermodynamics of protein thermostability
www.proteinscience.org 1193
G.I., and Khechniashvili, N.N. 1989. Heat capacity and conformation ofproteins in the denatured state. J. Mol. Biol. 205, 737–750.
Quillin, M.L. and Matthews, B.W. 2000. Accurate calculation of the density ofproteins. Acta Crystallogra. D56, 791–794.
Robertson, A.D. and Murphy, K.P. 1997. Protein structure and energetics ofprotein stability. Chem. Rev. 97, 1251–1267.
Stowell, M.H.B. and Rees, D.C. 1995. Structure and stability of membraneproteins. Adv. Protein Chem. 46, 279–311.
Szilagyi, A. and Zavodszky, P. 2000. Structural differences between mesophilic,moderately thermophilic and extremely thermophilic protein subunits: Re-sults of a comprehensive survey. Structure 8, 493–504.
Tilton, R.F., Dewan, J.C., and Petsko, G.A. 1992. Effects of temperature onprotein structure and dynamics: X-ray crystallographic studies of the protein
ribonuclease-A at nine different temperatures from 98 to 320 K. Biochem-istry 31(9), 2469–2481.
Vidugiris, G.J.A., Markley, J.L., and Royer, C.A. 1995. Evidence for a moltenglobule-like transition state in protein folding from determination of acti-vation volumes. Biochemistry 34, 4909–4912.
Wassenberg, D., Welker, C., and Jaenicke, R. 1999. Thermodynamics of theunfolding of the cold-shock protein from Thermotoga maritima. J. Mol.Biol. 289, 187–193.
Young, A.C.M., Tilton, R.F., and Dewan, J.C. 1994. Thermal expansion of henegg-white lysozyme. Comparison of the 1.9 A structures of the tetragonalform of lysozyme at 100K and 298 K. J. Mol. Biol. 235, 302–317.
Zipp, A. and Kauzmann, W. 1973. Pressure denaturation of myoglobin. Bio-chemistry 12, 4217–4228.
Rees and Robertson
1194 Protein Science, vol. 10