Embed Size (px)
Citation preview
SONOMA COUNTY
JUNIOR COLLEGE DISTRICT
SANTA ROSA, CALIFORNIA
FINANCIAL STATEMENTS WITH INDEPENDENT AUDITOR'S REPORT
YEAR ENDED JUNE 30, 2018
SONOMA COUNTY JUNIOR COLLEGE DISTRICT
TABLE OF CONTENTS YEAR ENDED JUNE 30, 2018
PAGE INTRODUCTION Organization 1
FINANCIAL SECTION
INDEPENDENT AUDITOR'S REPORT 2 MANAGEMENT'S DISCUSSION AND ANALYSIS 5 BASIC FINANCIAL STATEMENTS:
Statement of Net Position 15 Statement of Revenues, Expenses, and Changes in Net Position 16 Statement of Cash Flows 17 Statement of Fiduciary Net Position 19 Notes to the Financial Statements 20
REQUIRED SUPPLEMENTARY INFORMATION SECTION
Schedule of Changes in the District’s Total OPEB Liability and Related Ratios 44 Schedule of the District’s Proportionate Share of the Net Pension Liability:
CalSTRS Plan 45 CalPERS Plan 46
Schedule of the District’s Contributions: CalSTRS Plan 47 CalPERS Plan 48
SUPPLEMENTARY INFORMATION SECTION
Schedule of Expenditures of Federal Awards 49 Schedule of State Financial Assistance 51 Schedule of Workload Measures for State General Apportionment Annual (Actual) Attendance 53 Reconciliation of ECS 84362 (50 Percent Law) Calculation 54 Reconciliation of Education Protection Account Expenditures to District Accounting Records 56 Reconciliation of Governmental Funds to Net Position 57 Reconciliation of Annual Financial and Budget Report (CCFS-311) With Audited Financial Statements 58 Notes to Supplementary Information 59
SONOMA COUNTY JUNIOR COLLEGE DISTRICT
TABLE OF CONTENTS YEAR ENDED JUNE 30, 2018
OTHER INDEPENDENT AUDITOR'S REPORTS
Report on Internal Control over Financial Reporting and on Compliance and Other Matters Based on an Audit of Financial Statements Performed in Accordance with Government Auditing Standards 61
Report on Compliance for Each Major Program
and on Internal Control Over Compliance Required by the Uniform Guidance 63
Report on Compliance with Applicable Requirements in
Accordance with the Contracted District Audit Manual 65
FINDINGS AND RECOMMENDATIONS SECTION
Schedule of Audit Findings and Questioned Costs 67 Status of Prior Year Findings and Recommendations 70
SONOMA COUNTY JUNIOR COLLEGE DISTRICT
ORGANIZATION YEAR ENDED JUNE 30, 2018
1
DESCRIPTION OF DISTRICT The Sonoma County Junior College District (the District) was established in 1918 with the founding of Santa Rosa Junior College. The District operates a campus in the City of Santa Rosa, a campus in the City of Petaluma, a criminal justice training center in the Town of Windsor, and classes at numerous other locations throughout the District. The District is comprised of an area of approximately 1,600 square miles. There were no changes in the boundaries of the District during the current year.
BOARD OF TRUSTEES Name Office Term Expires Maggie Fishman President 2018 Jordan Burns Vice President 2018 Dorothy Battenfeld Clerk 2018 Don Edgar Member 2020 Jeff Kunde Member 2018 W. Terry Lindley Member 2020 Mariana Martinez Member 2020 Robert Martinez Student Member 2018 ADMINISTRATION Dr. Frank Chong ..................................................................................................... Superintendent/President Mary Kay Rudolph ........................... Senior Vice President of Academic Affairs/Assistant Superintendent Doug Roberts ......... Senior Vice President of Finance & Administrative Services/Assistant Superintendent Karen C. Furukawa-Schlereth ............................................................... Vice President of Human Resources Pedro Avila ..................................................... Vice President of Student Services/Assistant Superintendent Jane Saldaña-Talley .................................................................................. Vice President, Petaluma Campus

FINANCIAL SECTION
2
INDEPENDENT AUDITOR'S REPORT Members of the Board of Trustees Sonoma County Junior College District Santa Rosa, California Report on the Financial Statements We have audited the accompanying financial statements of the business-type activities, the discretely presented component unit, and the aggregate remaining fund information of the Sonoma County Junior College District (the District) as of and for the year ended June 30, 2018, and the related notes to the financial statements, which collectively comprise the District’s basic financial statements, as listed in the table of contents. Management’s Responsibility for the Financial Statements Management is responsible for the preparation and fair presentation of these financial statements in accordance with accounting principles generally accepted in the United States of America; this includes the design, implementation, and maintenance of internal control relevant to the preparation and fair presentation of financial statements that are free from material misstatement, whether due to fraud or error. Auditor’s Responsibility Our responsibility is to express opinions on these financial statements based on our audit. We conducted our audit in accordance with auditing standards generally accepted in the United States of America; the standards applicable to financial audits contained in Government Auditing Standards, issued by the Comptroller General of the United States; and the Contracted District Audit Manual, issued by the California Community Colleges Chancellor’s Office. Those standards require that we plan and perform the audit to obtain reasonable assurance about whether the financial statements are free from material misstatement. An audit involves performing procedures to obtain audit evidence about the amounts and disclosures in the financial statements. The procedures selected depend on the auditor’s judgment, including the assessment of the risks of material misstatement of the financial statements, whether due to fraud or error. In making those risk assessments, the auditor considers internal control relevant to the entity’s preparation and fair presentation of the financial statements in order to design audit procedures that are appropriate in the circumstances, but not for the purpose of expressing an opinion on the effectiveness of the entity’s internal control. Accordingly, we express no such opinion. An audit also includes evaluating the appropriateness of accounting policies used and the reasonableness of significant accounting estimates made by management, as well as evaluating the overall presentation of the financial statements. We believe that the audit evidence we have obtained is sufficient and appropriate to provide a basis for our audit opinions.
PHONE:916.646.6464 FAX:916.929.6836 GilbertCPA.com
2880 GATEWAY OAKS DRIVE, SUITE 100, SACRAMENTO, CA 95833 101 PARKSHORE DRIVE, SUITE 100, FOLSOM, CA 95630
Relax. We got this.Relax. We got this.Relax. We got this.SM

Members of the Board of Trustees Sonoma County Junior College District Page 2
3
Opinions In our opinion, the financial statements referred to above present fairly, in all material respects, the respective financial position of the business-type activities, the discretely presented component unit, and the aggregate remaining fund information of the Sonoma County Junior College District, as of June 30, 2018, and the respective changes in financial position and, where applicable, cash flows thereof for the year then ended in conformity with accounting principles generally accepted in the United States of America.
Change in Accounting Principle
As discussed in Note 1 to the financial statements, in 2018 the District adopted new accounting guidance, GASB Statement No. 75, Accounting and Financial Reporting for Postemployment Benefits Other Than Pensions. Our opinion is not modified with respect to this matter. Other Matters Required Supplementary Information Accounting principles generally accepted in the United States of America require that the Management’s Discussion and Analysis, the Schedule of the District’s Total OPEB Liability and Related Ratios, the Schedules of the District’s Proportionate Share of the Net Pension Liability, and the Schedules of the District’s Contributions, as listed in the table of contents, be presented to supplement the basic financial statements. Such information, although not a part of the basic financial statements, is required by the Governmental Accounting Standards Board, who considers it to be an essential part of financial reporting for placing the basic financial statements in an appropriate operational, economic, or historical context. We have applied certain limited procedures to the required supplementary information in accordance with auditing standards generally accepted in the United States of America, which consisted of inquiries of management about the methods of preparing the information and comparing the information for consistency with management’s responses to our inquiries, the basic financial statements, and other knowledge we obtained during our audit of the basic financial statements. We do not express an opinion or provide any assurance on the information because the limited procedures do not provide us with sufficient evidence to express an opinion or provide any assurance. Supplementary Information Our audit was conducted for the purpose of forming opinions on the financial statements that collectively comprise the District's basic financial statements. The Supplementary Information Section, as listed in the table of contents, is presented for purposes of additional analysis, and is required by Title 2 U.S. Code of Federal Regulations (CFR) Part 200, Uniform Administrative Requirements, Cost Principles, and Audit Requirements for Federal Awards, and the Contracted District Audit Manual, issued by the California Community Colleges Chancellor’s Office, and is not a required part of the basic financial statements. This supplementary information is the responsibility of management and was derived from and relates directly to the underlying accounting and other records used to prepare the basic financial statements. Such information has been subjected to the auditing procedures applied in the audit of the basic financial statements and certain additional procedures, including comparing and reconciling such information directly to the underlying accounting and other records used to prepare the basic financial statements or to the basic financial statements themselves, and other additional procedures in accordance with auditing standards generally accepted in the United States of America. In our opinion, the supplementary information is fairly stated, in all material respects, in relation to the basic financial statements as a whole.
Members of the Board of Trustees Sonoma County Junior College District Page 3
4
Other Reporting Required by Government Auditing Standards In accordance with Government Auditing Standards, we have also issued our report dated December 3, 2018, on our consideration of the District’s internal control over financial reporting and on our tests of its compliance with certain provisions of laws, regulations, contracts, and grant agreements and other matters. The purpose of that report is to describe the scope of our testing of internal control over financial reporting and compliance and the results of that testing, and not to provide an opinion on internal control over financial reporting or on compliance. That report is an integral part of an audit performed in accordance with Government Auditing Standards in considering the District’s internal control over financial reporting and compliance. GILBERT ASSOCIATES, INC. Sacramento, California December 3, 2018
SONOMA COUNTY JUNIOR COLLEGE DISTRICT
MANAGEMENT’S DISCUSSION AND ANALYSIS YEAR ENDED JUNE 30, 2018
5
Introduction The following discussion and analysis provides an overview of the financial position and activities of the Sonoma County Junior College District for the year ended June 30, 2018. This discussion has been prepared by management and should be read in conjunction with the financial statements and notes which follow this section. The Sonoma County Junior College District, familiarly called Santa Rosa Junior College (SRJC), is a public two-year community college, which serves approximately 41,700 students. The District has two campuses, located in Santa Rosa and Petaluma, California, and two centers, a Public Safety Training Center located in Windsor, California, and the Robert Shone Agricultural Center located in Forestville, California. Students may choose from associate degree majors and certificate programs, complete courses toward the first two years of a bachelor’s degree program, or pursue courses for other professional or personal reasons. Reporting Highlights The annual report consists of three basic financial statements that provide information on SRJC as
a whole: the Statement of Net Position; the Statement of Revenues, Expenses and Changes in Net Position; and the Statement of Cash Flows. The information provided on the statements that follow includes all funds but excludes the fiduciary funds that are reported separately. The following information is provided to assist with the understanding of the financial statements and the financial position of the District. Each statement is presented in a consolidated format as required by GASB 34/35 and will be discussed separately.
In 2017/18, the District implemented GASB 75 (Accounting and Financial Reporting for Postemployment Benefits Other Than Pensions. GASB 75 improves accounting and financial reporting by state and local governments for other postemployment benefits (OPEB) by establishing standards for measuring and recognizing liabilities, deferred outflows of resources, deferred inflows of resources, and expenses. It requires the District to report an OPEB liability for the difference between the present value of projected OPEB benefits for past service and restricted resources held in trust for the payment of benefits. GASB 75 requires retroactive application, so the beginning net position decreased by $23,771,810 as the cumulative effect of change in accounting principle.
In 2017/18, the District also implemented GASB 89 (Accounting for Interest Cost Incurred before the End of a Construction Period). GASB 89 enhances the relevance and comparability of information about capital assets and the cost of borrowing for a reporting period, and simplifies accounting for interest cost incurred before the end of a construction period. It requires that interest costs incurred before the end of a construction period be recognized as an expense in the period in which the cost is incurred.
District’s Fiduciary Responsibility The District is the trustee, or fiduciary, for certain amounts held on behalf of students, clubs and
donors for student loans and scholarships. The District’s fiduciary activities are reported in separate Statements of Fiduciary Net Position and Changes in Fiduciary Net Position. These activities are excluded from the District’s other financial statements because we cannot use these assets to finance operations. The District is responsible for ensuring that the assets reported in these funds are used for their intended purposes.
SONOMA COUNTY JUNIOR COLLEGE DISTRICT
MANAGEMENT’S DISCUSSION AND ANALYSIS YEAR ENDED JUNE 30, 2018
6
The District maintains fiduciary funds to account for assets held by the District as an agent on behalf of others. The District’s fiduciary funds are the Student Representation Fee, Student Body Center Fee, and Associated Students, each reported as agency funds.
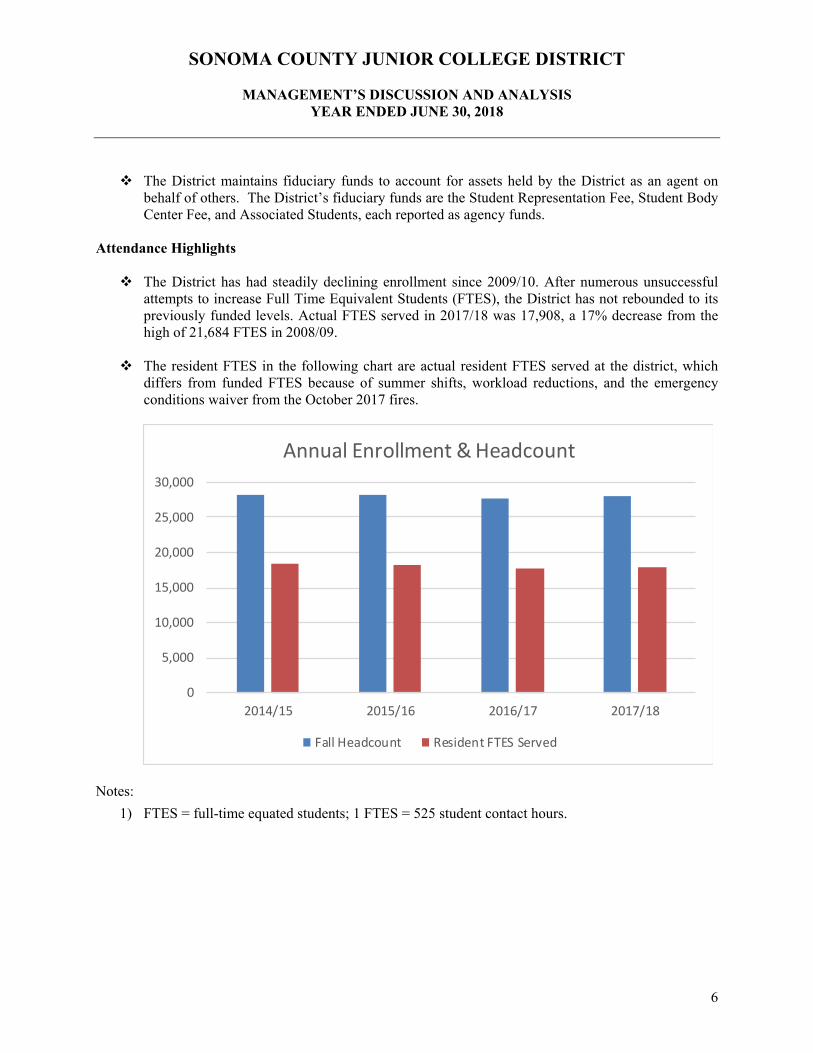
Attendance Highlights The District has had steadily declining enrollment since 2009/10. After numerous unsuccessful
attempts to increase Full Time Equivalent Students (FTES), the District has not rebounded to its previously funded levels. Actual FTES served in 2017/18 was 17,908, a 17% decrease from the high of 21,684 FTES in 2008/09.
The resident FTES in the following chart are actual resident FTES served at the district, which differs from funded FTES because of summer shifts, workload reductions, and the emergency conditions waiver from the October 2017 fires.
Notes:
1) FTES = full-time equated students; 1 FTES = 525 student contact hours.
0
5,000
10,000
15,000
20,000
25,000
30,000
2014/15 2015/16 2016/17 2017/18
Annual Enrollment & Headcount
Fall Headcount Resident FTES Served
SONOMA COUNTY JUNIOR COLLEGE DISTRICT
MANAGEMENT’S DISCUSSION AND ANALYSIS YEAR ENDED JUNE 30, 2018
7
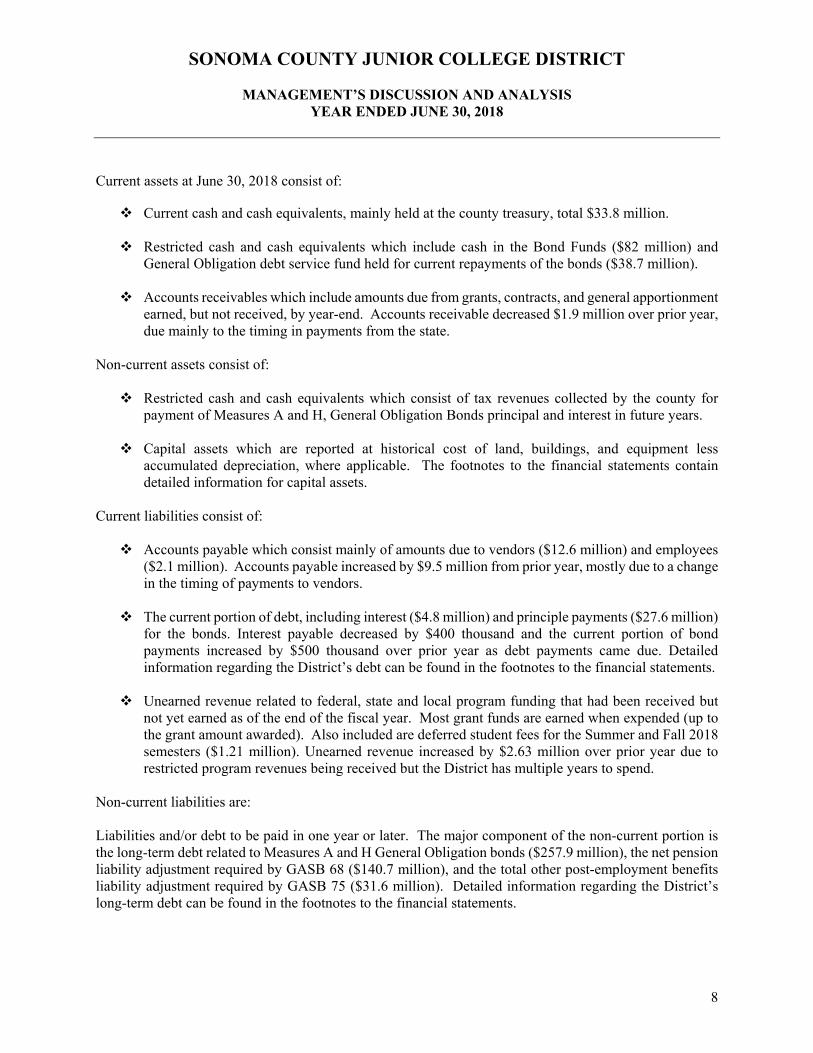
Financial Aid and Doyle Scholarships For the years ended June 30, 2018 and 2017, the following sources of student financial aid were disbursed:
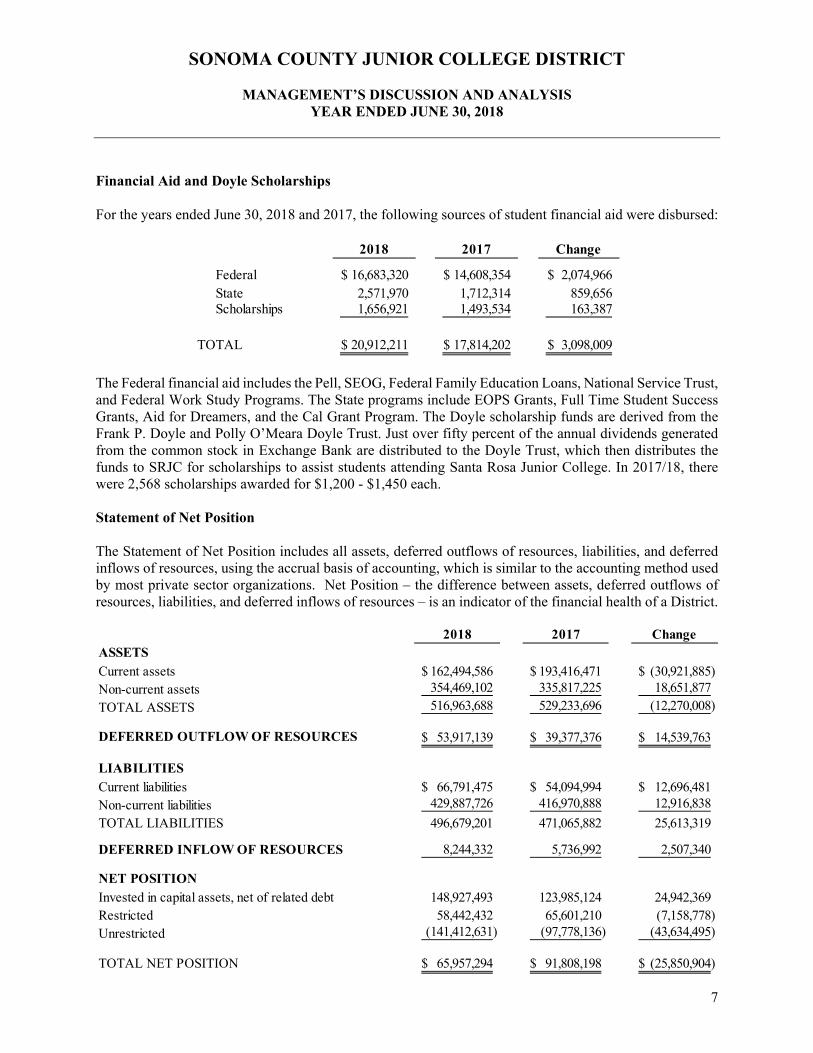
The Federal financial aid includes the Pell, SEOG, Federal Family Education Loans, National Service Trust, and Federal Work Study Programs. The State programs include EOPS Grants, Full Time Student Success Grants, Aid for Dreamers, and the Cal Grant Program. The Doyle scholarship funds are derived from the Frank P. Doyle and Polly O’Meara Doyle Trust. Just over fifty percent of the annual dividends generated from the common stock in Exchange Bank are distributed to the Doyle Trust, which then distributes the funds to SRJC for scholarships to assist students attending Santa Rosa Junior College. In 2017/18, there were 2,568 scholarships awarded for $1,200 - $1,450 each. Statement of Net Position The Statement of Net Position includes all assets, deferred outflows of resources, liabilities, and deferred inflows of resources, using the accrual basis of accounting, which is similar to the accounting method used by most private sector organizations. Net Position – the difference between assets, deferred outflows of resources, liabilities, and deferred inflows of resources – is an indicator of the financial health of a District.
2018 2017 Change
Federal 16,683,320$ 14,608,354$ 2,074,966$ State 2,571,970 1,712,314 859,656 Scholarships 1,656,921 1,493,534 163,387
TOTAL 20,912,211$ 17,814,202$ 3,098,009$
2018 2017 ChangeASSETSCurrent assets 162,494,586$ 193,416,471$ (30,921,885)$ Non-current assets 354,469,102 335,817,225 18,651,877
TOTAL ASSETS 516,963,688 529,233,696 (12,270,008)
DEFERRED OUTFLOW OF RESOURCES 53,917,139$ 39,377,376$ 14,539,763$
LIABILITIESCurrent liabilities 66,791,475$ 54,094,994$ 12,696,481$ Non-current liabilities 429,887,726 416,970,888 12,916,838
TOTAL LIABILITIES 496,679,201 471,065,882 25,613,319
DEFERRED INFLOW OF RESOURCES 8,244,332 5,736,992 2,507,340
NET POSITIONInvested in capital assets, net of related debt 148,927,493 123,985,124 24,942,369 Restricted 58,442,432 65,601,210 (7,158,778) Unrestricted (141,412,631) (97,778,136) (43,634,495)
TOTAL NET POSITION 65,957,294$ 91,808,198$ (25,850,904)$
SONOMA COUNTY JUNIOR COLLEGE DISTRICT
MANAGEMENT’S DISCUSSION AND ANALYSIS YEAR ENDED JUNE 30, 2018
8
Current assets at June 30, 2018 consist of: Current cash and cash equivalents, mainly held at the county treasury, total $33.8 million.
Restricted cash and cash equivalents which include cash in the Bond Funds ($82 million) and
General Obligation debt service fund held for current repayments of the bonds ($38.7 million). Accounts receivables which include amounts due from grants, contracts, and general apportionment
earned, but not received, by year-end. Accounts receivable decreased $1.9 million over prior year, due mainly to the timing in payments from the state.
Non-current assets consist of: Restricted cash and cash equivalents which consist of tax revenues collected by the county for
payment of Measures A and H, General Obligation Bonds principal and interest in future years. Capital assets which are reported at historical cost of land, buildings, and equipment less
accumulated depreciation, where applicable. The footnotes to the financial statements contain detailed information for capital assets.
Current liabilities consist of: Accounts payable which consist mainly of amounts due to vendors ($12.6 million) and employees
($2.1 million). Accounts payable increased by $9.5 million from prior year, mostly due to a change in the timing of payments to vendors.
The current portion of debt, including interest ($4.8 million) and principle payments ($27.6 million) for the bonds. Interest payable decreased by $400 thousand and the current portion of bond payments increased by $500 thousand over prior year as debt payments came due. Detailed information regarding the District’s debt can be found in the footnotes to the financial statements.
Unearned revenue related to federal, state and local program funding that had been received but
not yet earned as of the end of the fiscal year. Most grant funds are earned when expended (up to the grant amount awarded). Also included are deferred student fees for the Summer and Fall 2018 semesters ($1.21 million). Unearned revenue increased by $2.63 million over prior year due to restricted program revenues being received but the District has multiple years to spend.
Non-current liabilities are:
Liabilities and/or debt to be paid in one year or later. The major component of the non-current portion is the long-term debt related to Measures A and H General Obligation bonds ($257.9 million), the net pension liability adjustment required by GASB 68 ($140.7 million), and the total other post-employment benefits liability adjustment required by GASB 75 ($31.6 million). Detailed information regarding the District’s long-term debt can be found in the footnotes to the financial statements.
SONOMA COUNTY JUNIOR COLLEGE DISTRICT
MANAGEMENT’S DISCUSSION AND ANALYSIS YEAR ENDED JUNE 30, 2018
9
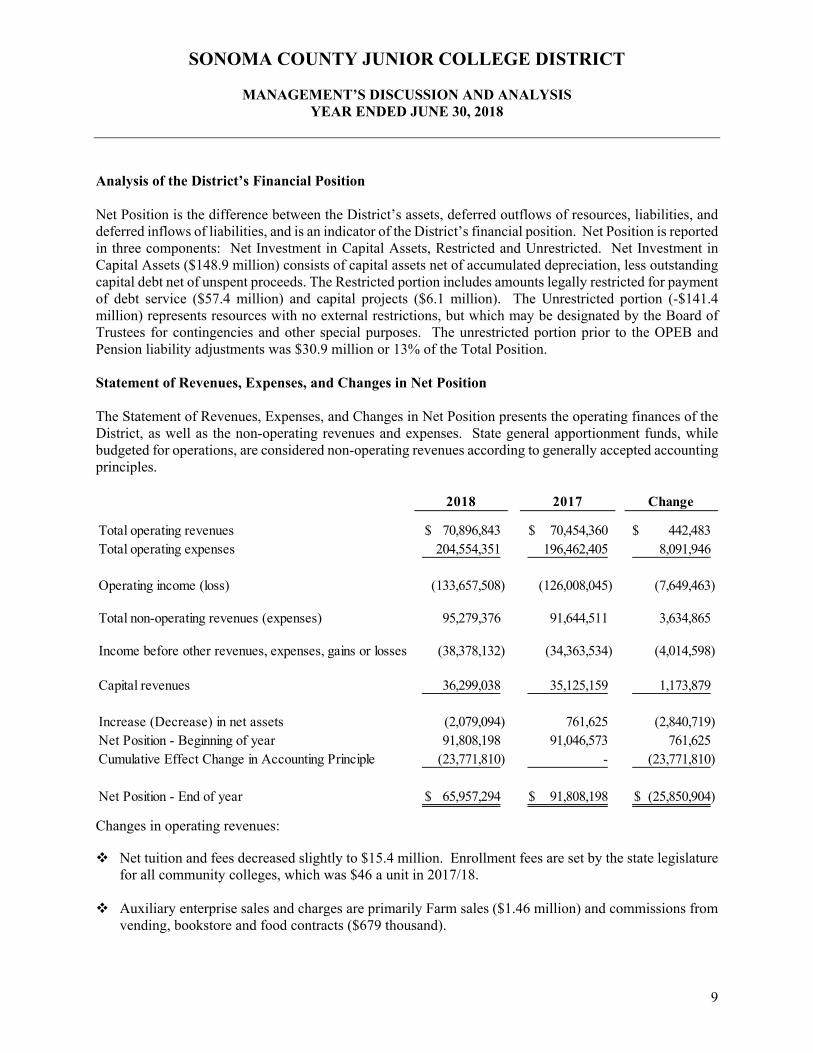
Analysis of the District’s Financial Position Net Position is the difference between the District’s assets, deferred outflows of resources, liabilities, and deferred inflows of liabilities, and is an indicator of the District’s financial position. Net Position is reported in three components: Net Investment in Capital Assets, Restricted and Unrestricted. Net Investment in Capital Assets ($148.9 million) consists of capital assets net of accumulated depreciation, less outstanding capital debt net of unspent proceeds. The Restricted portion includes amounts legally restricted for payment of debt service ($57.4 million) and capital projects ($6.1 million). The Unrestricted portion (-$141.4 million) represents resources with no external restrictions, but which may be designated by the Board of Trustees for contingencies and other special purposes. The unrestricted portion prior to the OPEB and Pension liability adjustments was $30.9 million or 13% of the Total Position. Statement of Revenues, Expenses, and Changes in Net Position The Statement of Revenues, Expenses, and Changes in Net Position presents the operating finances of the District, as well as the non-operating revenues and expenses. State general apportionment funds, while budgeted for operations, are considered non-operating revenues according to generally accepted accounting principles.
Changes in operating revenues: Net tuition and fees decreased slightly to $15.4 million. Enrollment fees are set by the state legislature
for all community colleges, which was $46 a unit in 2017/18. Auxiliary enterprise sales and charges are primarily Farm sales ($1.46 million) and commissions from
vending, bookstore and food contracts ($679 thousand).
2018 2017 Change
Total operating revenues 70,896,843$ 70,454,360$ 442,483$ Total operating expenses 204,554,351 196,462,405 8,091,946
Operating income (loss) (133,657,508) (126,008,045) (7,649,463)
Total non-operating revenues (expenses) 95,279,376 91,644,511 3,634,865
Income before other revenues, expenses, gains or losses (38,378,132) (34,363,534) (4,014,598)
Capital revenues 36,299,038 35,125,159 1,173,879
Increase (Decrease) in net assets (2,079,094) 761,625 (2,840,719) Net Position - Beginning of year 91,808,198 91,046,573 761,625 Cumulative Effect Change in Accounting Principle (23,771,810) - (23,771,810)
Net Position - End of year 65,957,294$ 91,808,198$ (25,850,904)$
SONOMA COUNTY JUNIOR COLLEGE DISTRICT
MANAGEMENT’S DISCUSSION AND ANALYSIS YEAR ENDED JUNE 30, 2018
10
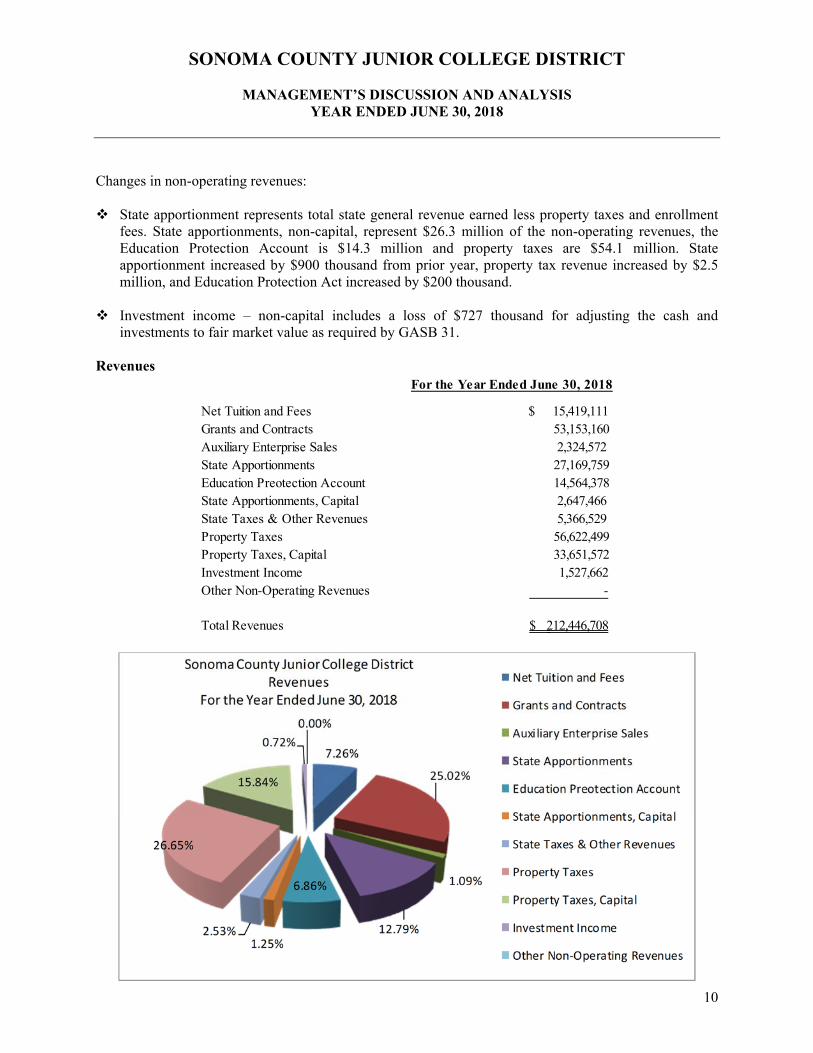
Changes in non-operating revenues: State apportionment represents total state general revenue earned less property taxes and enrollment
fees. State apportionments, non-capital, represent $26.3 million of the non-operating revenues, the Education Protection Account is $14.3 million and property taxes are $54.1 million. State apportionment increased by $900 thousand from prior year, property tax revenue increased by $2.5 million, and Education Protection Act increased by $200 thousand.
Investment income – non-capital includes a loss of $727 thousand for adjusting the cash and
investments to fair market value as required by GASB 31. Revenues
For the Year Ended June 30, 2018
Net Tuition and Fees $ 15,419,111 Grants and Contracts 53,153,160 Auxiliary Enterprise Sales 2,324,572 State Apportionments 27,169,759 Education Preotection Account 14,564,378 State Apportionments, Capital 2,647,466 State Taxes & Other Revenues 5,366,529 Property Taxes 56,622,499 Property Taxes, Capital 33,651,572 Investment Income 1,527,662 Other Non-Operating Revenues -
Total Revenues 212,446,708$
SONOMA COUNTY JUNIOR COLLEGE DISTRICT
MANAGEMENT’S DISCUSSION AND ANALYSIS YEAR ENDED JUNE 30, 2018
11
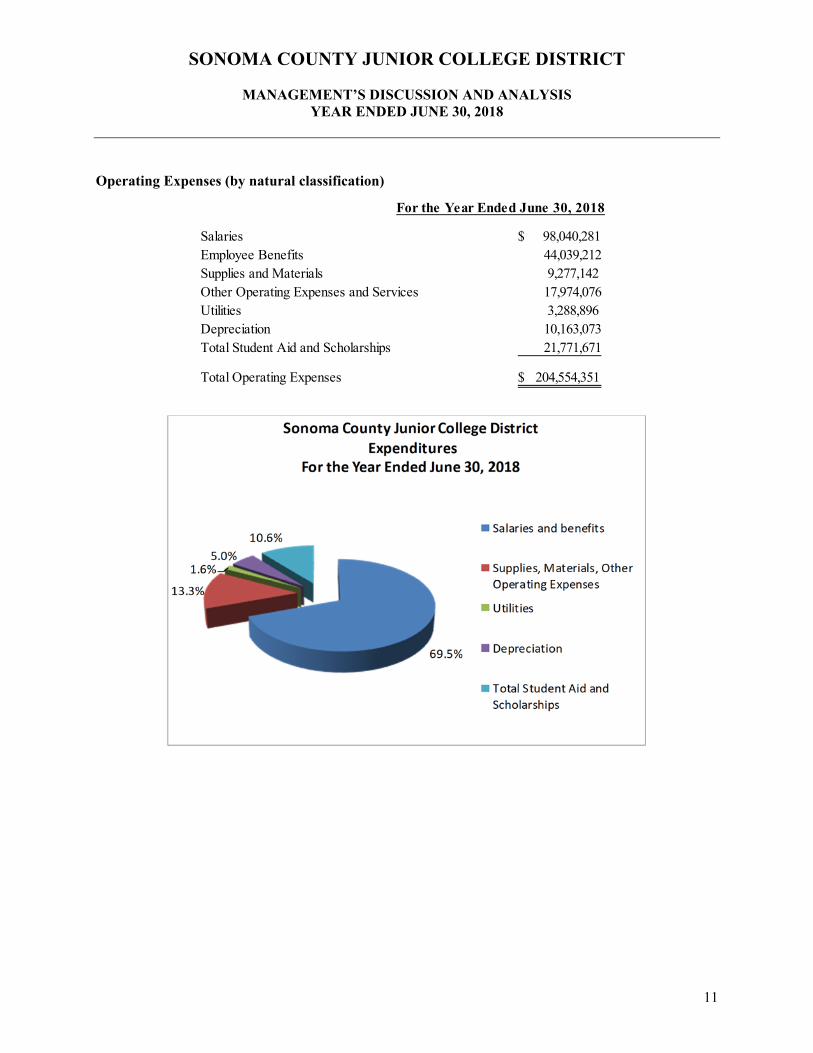
Operating Expenses (by natural classification)
For the Year Ended June 30, 2018
Salaries $ 98,040,281 Employee Benefits 44,039,212 Supplies and Materials 9,277,142 Other Operating Expenses and Services 17,974,076 Utilities 3,288,896 Depreciation 10,163,073 Total Student Aid and Scholarships 21,771,671
Total Operating Expenses $ 204,554,351
SONOMA COUNTY JUNIOR COLLEGE DISTRICT
MANAGEMENT’S DISCUSSION AND ANALYSIS YEAR ENDED JUNE 30, 2018
12
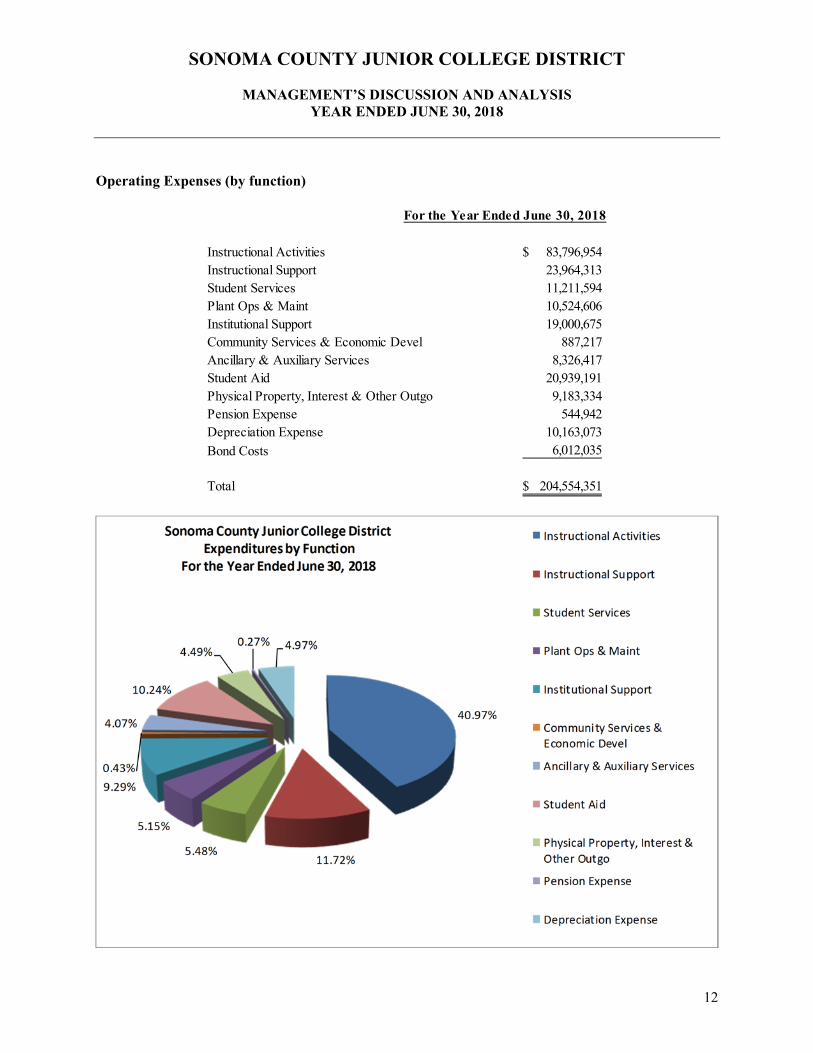
Operating Expenses (by function)
For the Year Ended June 30, 2018
Instructional Activities 83,796,954$ Instructional Support 23,964,313 Student Services 11,211,594 Plant Ops & Maint 10,524,606 Institutional Support 19,000,675 Community Services & Economic Devel 887,217 Ancillary & Auxiliary Services 8,326,417 Student Aid 20,939,191 Physical Property, Interest & Other Outgo 9,183,334 Pension Expense 544,942 Depreciation Expense 10,163,073
Bond Costs 6,012,035
Total 204,554,351$
SONOMA COUNTY JUNIOR COLLEGE DISTRICT
MANAGEMENT’S DISCUSSION AND ANALYSIS YEAR ENDED JUNE 30, 2018
13
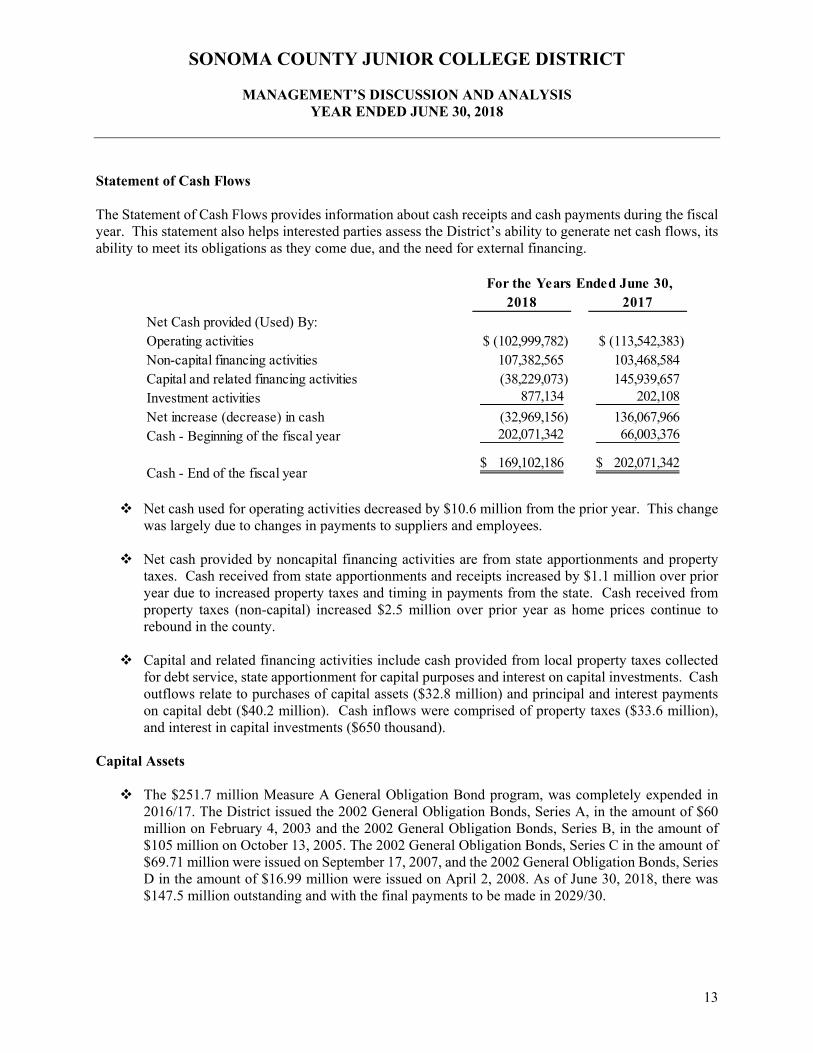
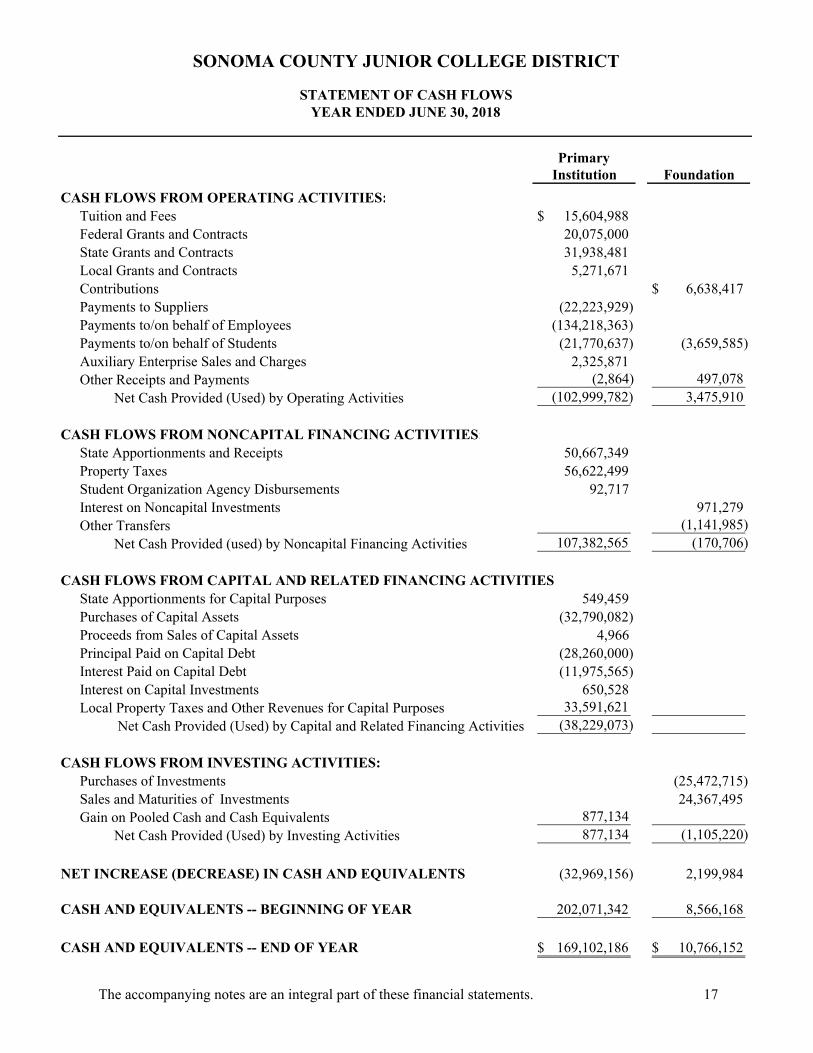
Statement of Cash Flows The Statement of Cash Flows provides information about cash receipts and cash payments during the fiscal year. This statement also helps interested parties assess the District’s ability to generate net cash flows, its ability to meet its obligations as they come due, and the need for external financing.
Net cash used for operating activities decreased by $10.6 million from the prior year. This change
was largely due to changes in payments to suppliers and employees. Net cash provided by noncapital financing activities are from state apportionments and property
taxes. Cash received from state apportionments and receipts increased by $1.1 million over prior year due to increased property taxes and timing in payments from the state. Cash received from property taxes (non-capital) increased $2.5 million over prior year as home prices continue to rebound in the county.
Capital and related financing activities include cash provided from local property taxes collected
for debt service, state apportionment for capital purposes and interest on capital investments. Cash outflows relate to purchases of capital assets ($32.8 million) and principal and interest payments on capital debt ($40.2 million). Cash inflows were comprised of property taxes ($33.6 million), and interest in capital investments ($650 thousand).
Capital Assets The $251.7 million Measure A General Obligation Bond program, was completely expended in
2016/17. The District issued the 2002 General Obligation Bonds, Series A, in the amount of $60 million on February 4, 2003 and the 2002 General Obligation Bonds, Series B, in the amount of $105 million on October 13, 2005. The 2002 General Obligation Bonds, Series C in the amount of $69.71 million were issued on September 17, 2007, and the 2002 General Obligation Bonds, Series D in the amount of $16.99 million were issued on April 2, 2008. As of June 30, 2018, there was $147.5 million outstanding and with the final payments to be made in 2029/30.
2018 2017Net Cash provided (Used) By:Operating activities (102,999,782)$ (113,542,383)$ Non-capital financing activities 107,382,565 103,468,584 Capital and related financing activities (38,229,073) 145,939,657 Investment activities 877,134 202,108
Net increase (decrease) in cash (32,969,156) 136,067,966 Cash - Beginning of the fiscal year 202,071,342 66,003,376
Cash - End of the fiscal year169,102,186$ 202,071,342$
For the Years Ended June 30,
SONOMA COUNTY JUNIOR COLLEGE DISTRICT
MANAGEMENT’S DISCUSSION AND ANALYSIS YEAR ENDED JUNE 30, 2018
14
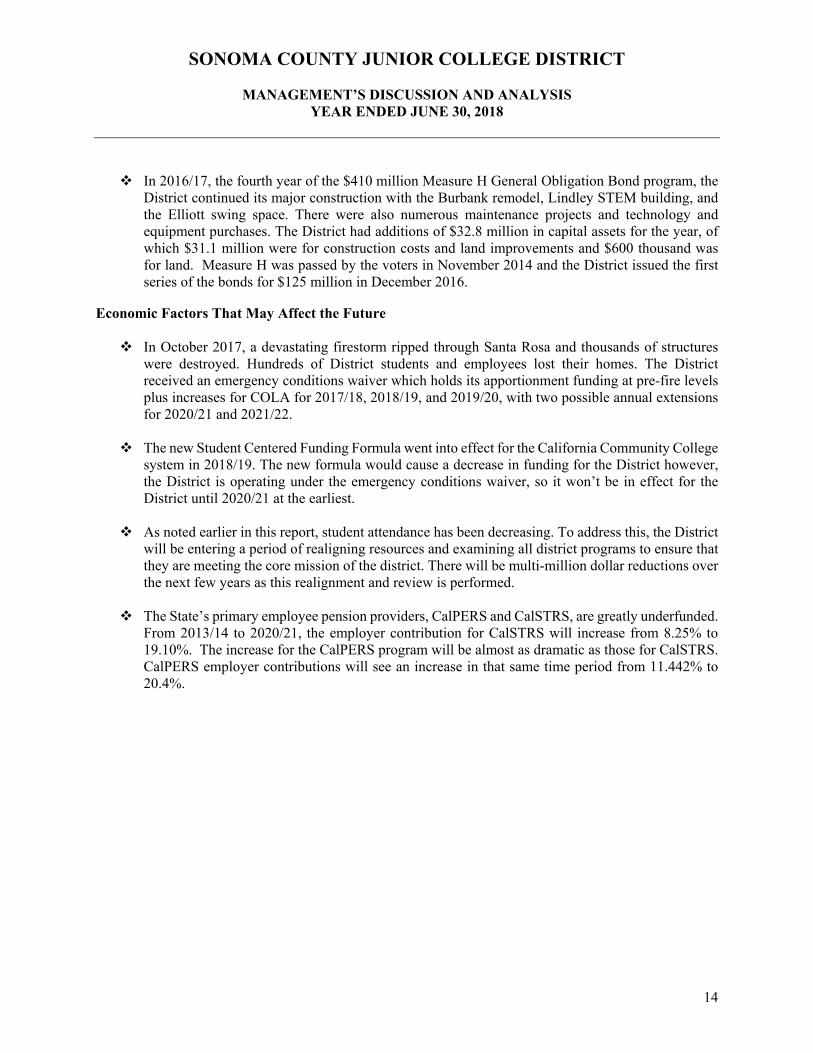
In 2016/17, the fourth year of the $410 million Measure H General Obligation Bond program, the District continued its major construction with the Burbank remodel, Lindley STEM building, and the Elliott swing space. There were also numerous maintenance projects and technology and equipment purchases. The District had additions of $32.8 million in capital assets for the year, of which $31.1 million were for construction costs and land improvements and $600 thousand was for land. Measure H was passed by the voters in November 2014 and the District issued the first series of the bonds for $125 million in December 2016.
Economic Factors That May Affect the Future In October 2017, a devastating firestorm ripped through Santa Rosa and thousands of structures
were destroyed. Hundreds of District students and employees lost their homes. The District received an emergency conditions waiver which holds its apportionment funding at pre-fire levels plus increases for COLA for 2017/18, 2018/19, and 2019/20, with two possible annual extensions for 2020/21 and 2021/22.
The new Student Centered Funding Formula went into effect for the California Community College system in 2018/19. The new formula would cause a decrease in funding for the District however, the District is operating under the emergency conditions waiver, so it won’t be in effect for the District until 2020/21 at the earliest.
As noted earlier in this report, student attendance has been decreasing. To address this, the District
will be entering a period of realigning resources and examining all district programs to ensure that they are meeting the core mission of the district. There will be multi-million dollar reductions over the next few years as this realignment and review is performed.
The State’s primary employee pension providers, CalPERS and CalSTRS, are greatly underfunded. From 2013/14 to 2020/21, the employer contribution for CalSTRS will increase from 8.25% to 19.10%. The increase for the CalPERS program will be almost as dramatic as those for CalSTRS. CalPERS employer contributions will see an increase in that same time period from 11.442% to 20.4%.
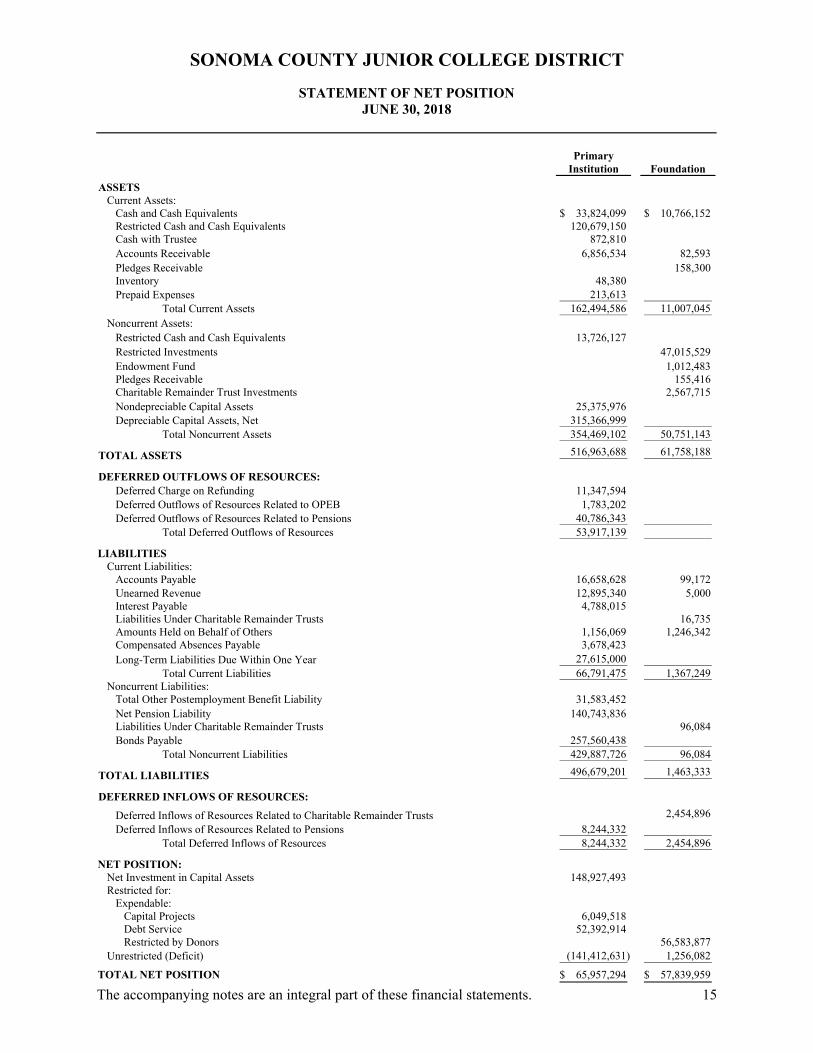
PrimaryInstitution Foundation
ASSETS Current Assets:
Cash and Cash Equivalents 33,824,099$ 10,766,152$ Restricted Cash and Cash Equivalents 120,679,150 Cash with Trustee 872,810 Accounts Receivable 6,856,534 82,593 Pledges Receivable 158,300 Inventory 48,380 Prepaid Expenses 213,613
Total Current Assets 162,494,586 11,007,045 Noncurrent Assets:
Restricted Cash and Cash Equivalents 13,726,127 Restricted Investments 47,015,529 Endowment Fund 1,012,483 Pledges Receivable 155,416 Charitable Remainder Trust Investments 2,567,715 Nondepreciable Capital Assets 25,375,976 Depreciable Capital Assets, Net 315,366,999
Total Noncurrent Assets 354,469,102 50,751,143
TOTAL ASSETS 516,963,688 61,758,188
DEFERRED OUTFLOWS OF RESOURCES: Deferred Charge on Refunding 11,347,594 Deferred Outflows of Resources Related to OPEB 1,783,202Deferred Outflows of Resources Related to Pensions 40,786,343
Total Deferred Outflows of Resources 53,917,139
LIABILITIESCurrent Liabilities:
Accounts Payable 16,658,628 99,172 Unearned Revenue 12,895,340 5,000 Interest Payable 4,788,015 Liabilities Under Charitable Remainder Trusts 16,735 Amounts Held on Behalf of Others 1,156,069 1,246,342 Compensated Absences Payable 3,678,423 Long-Term Liabilities Due Within One Year 27,615,000
Total Current Liabilities 66,791,475 1,367,249 Noncurrent Liabilities:
Total Other Postemployment Benefit Liability 31,583,452Net Pension Liability 140,743,836 Liabilities Under Charitable Remainder Trusts 96,084 Bonds Payable 257,560,438
Total Noncurrent Liabilities 429,887,726 96,084
TOTAL LIABILITIES 496,679,201 1,463,333
DEFERRED INFLOWS OF RESOURCES:
Deferred Inflows of Resources Related to Charitable Remainder Trusts 2,454,896
Deferred Inflows of Resources Related to Pensions 8,244,332 Total Deferred Inflows of Resources 8,244,332 2,454,896
NET POSITION:Net Investment in Capital Assets 148,927,493 Restricted for:
Expendable: Capital Projects 6,049,518 Debt Service 52,392,914 Restricted by Donors 56,583,877
Unrestricted (Deficit) (141,412,631) 1,256,082
TOTAL NET POSITION 65,957,294$ 57,839,959$
SONOMA COUNTY JUNIOR COLLEGE DISTRICT
STATEMENT OF NET POSITIONJUNE 30, 2018
The accompanying notes are an integral part of these financial statements. 15
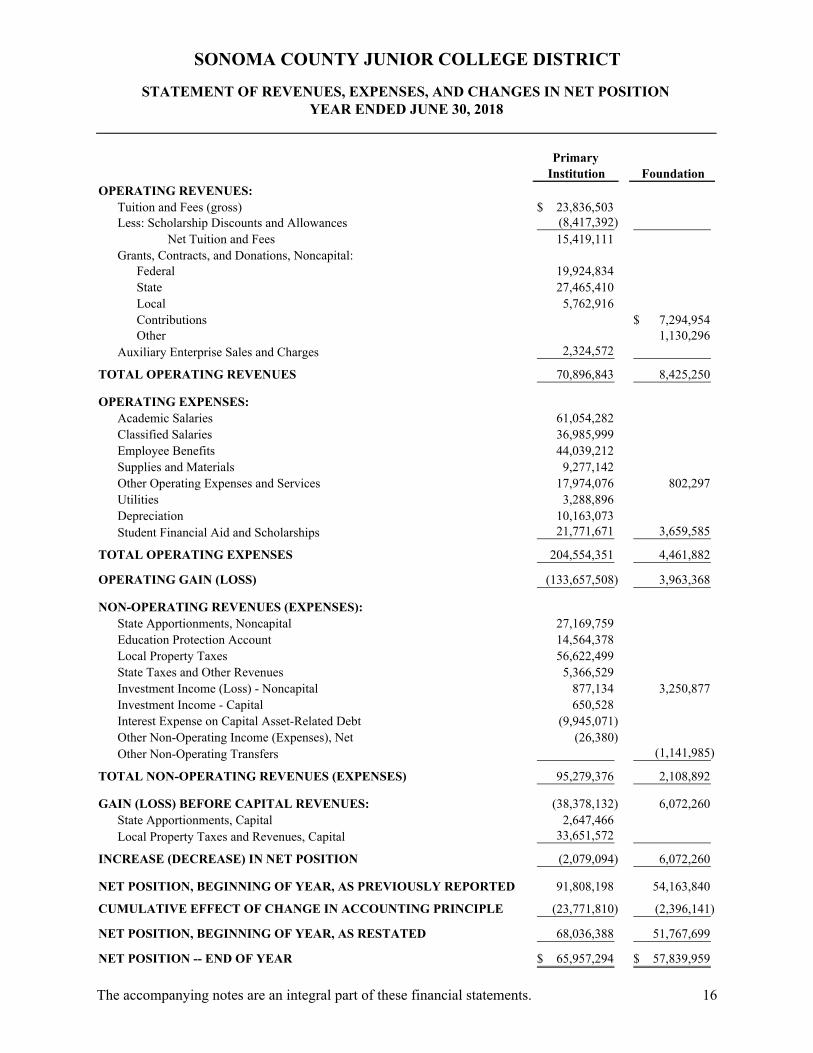
PrimaryInstitution Foundation
OPERATING REVENUES:Tuition and Fees (gross) 23,836,503$ Less: Scholarship Discounts and Allowances (8,417,392)
Net Tuition and Fees 15,419,111 Grants, Contracts, and Donations, Noncapital:
Federal 19,924,834 State 27,465,410 Local 5,762,916 Contributions 7,294,954$ Other 1,130,296
Auxiliary Enterprise Sales and Charges 2,324,572
TOTAL OPERATING REVENUES 70,896,843 8,425,250
OPERATING EXPENSES:Academic Salaries 61,054,282 Classified Salaries 36,985,999 Employee Benefits 44,039,212 Supplies and Materials 9,277,142 Other Operating Expenses and Services 17,974,076 802,297 Utilities 3,288,896 Depreciation 10,163,073 Student Financial Aid and Scholarships 21,771,671 3,659,585
TOTAL OPERATING EXPENSES 204,554,351 4,461,882
OPERATING GAIN (LOSS) (133,657,508) 3,963,368
NON-OPERATING REVENUES (EXPENSES):State Apportionments, Noncapital 27,169,759 Education Protection Account 14,564,378Local Property Taxes 56,622,499 State Taxes and Other Revenues 5,366,529 Investment Income (Loss) - Noncapital 877,134 3,250,877 Investment Income - Capital 650,528 Interest Expense on Capital Asset-Related Debt (9,945,071) Other Non-Operating Income (Expenses), Net (26,380) Other Non-Operating Transfers (1,141,985)
TOTAL NON-OPERATING REVENUES (EXPENSES) 95,279,376 2,108,892
GAIN (LOSS) BEFORE CAPITAL REVENUES: (38,378,132) 6,072,260 State Apportionments, Capital 2,647,466 Local Property Taxes and Revenues, Capital 33,651,572
INCREASE (DECREASE) IN NET POSITION (2,079,094) 6,072,260
NET POSITION, BEGINNING OF YEAR, AS PREVIOUSLY REPORTED 91,808,198 54,163,840
CUMULATIVE EFFECT OF CHANGE IN ACCOUNTING PRINCIPLE (23,771,810) (2,396,141)
68,036,388 51,767,699
NET POSITION -- END OF YEAR 65,957,294$ 57,839,959$
NET POSITION, BEGINNING OF YEAR, AS RESTATED
SONOMA COUNTY JUNIOR COLLEGE DISTRICT
STATEMENT OF REVENUES, EXPENSES, AND CHANGES IN NET POSITIONYEAR ENDED JUNE 30, 2018
The accompanying notes are an integral part of these financial statements. 16
PrimaryInstitution Foundation
CASH FLOWS FROM OPERATING ACTIVITIES:Tuition and Fees 15,604,988$ Federal Grants and Contracts 20,075,000 State Grants and Contracts 31,938,481 Local Grants and Contracts 5,271,671 Contributions 6,638,417$ Payments to Suppliers (22,223,929) Payments to/on behalf of Employees (134,218,363) Payments to/on behalf of Students (21,770,637) (3,659,585) Auxiliary Enterprise Sales and Charges 2,325,871 Other Receipts and Payments (2,864) 497,078
Net Cash Provided (Used) by Operating Activities (102,999,782) 3,475,910
CASH FLOWS FROM NONCAPITAL FINANCING ACTIVITIES:State Apportionments and Receipts 50,667,349 Property Taxes 56,622,499 Student Organization Agency Disbursements 92,717 Interest on Noncapital Investments 971,279 Other Transfers (1,141,985)
Net Cash Provided (used) by Noncapital Financing Activities 107,382,565 (170,706)
CASH FLOWS FROM CAPITAL AND RELATED FINANCING ACTIVITIES:State Apportionments for Capital Purposes 549,459 Purchases of Capital Assets (32,790,082) Proceeds from Sales of Capital Assets 4,966 Principal Paid on Capital Debt (28,260,000) Interest Paid on Capital Debt (11,975,565) Interest on Capital Investments 650,528 Local Property Taxes and Other Revenues for Capital Purposes 33,591,621
Net Cash Provided (Used) by Capital and Related Financing Activities (38,229,073)
CASH FLOWS FROM INVESTING ACTIVITIES:Purchases of Investments (25,472,715) Sales and Maturities of Investments 24,367,495 Gain on Pooled Cash and Cash Equivalents 877,134
Net Cash Provided (Used) by Investing Activities 877,134 (1,105,220)
NET INCREASE (DECREASE) IN CASH AND EQUIVALENTS (32,969,156) 2,199,984
CASH AND EQUIVALENTS -- BEGINNING OF YEAR 202,071,342 8,566,168
CASH AND EQUIVALENTS -- END OF YEAR 169,102,186$ 10,766,152$
SONOMA COUNTY JUNIOR COLLEGE DISTRICT
STATEMENT OF CASH FLOWSYEAR ENDED JUNE 30, 2018
The accompanying notes are an integral part of these financial statements. 17
PrimaryInstitution Foundation
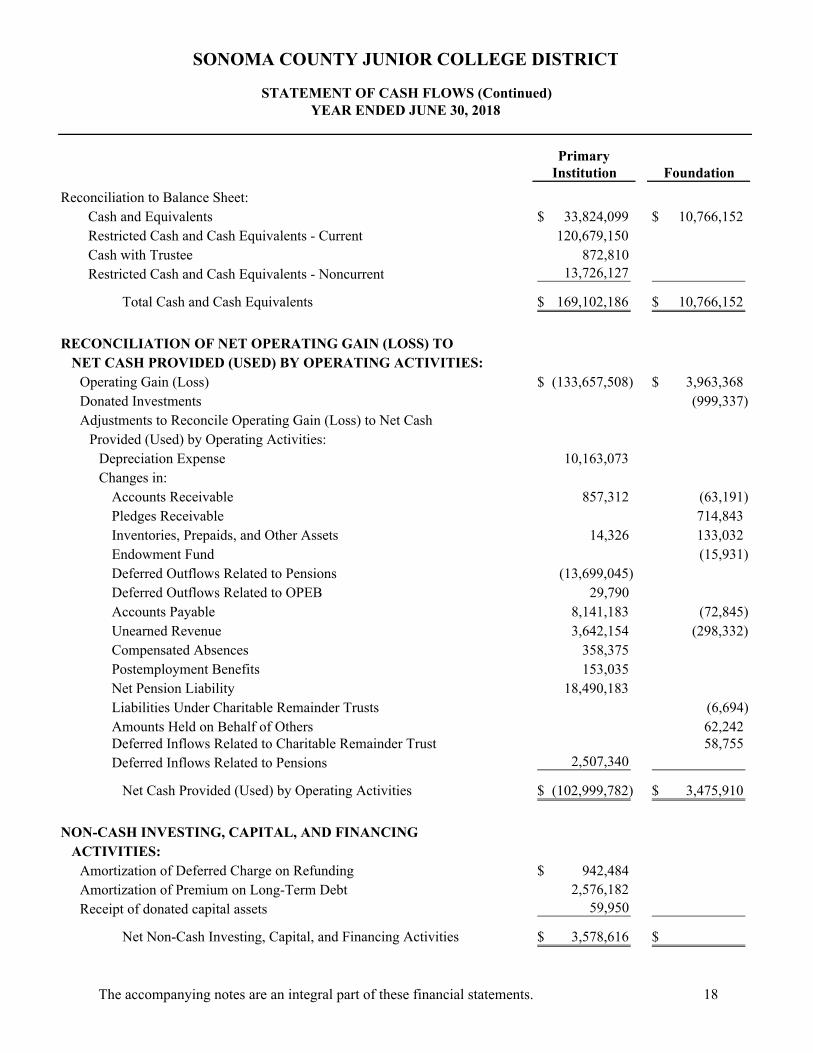
Reconciliation to Balance Sheet: Cash and Equivalents 33,824,099$ 10,766,152$ Restricted Cash and Cash Equivalents - Current 120,679,150 Cash with Trustee 872,810 Restricted Cash and Cash Equivalents - Noncurrent 13,726,127
Total Cash and Cash Equivalents 169,102,186$ 10,766,152$
RECONCILIATION OF NET OPERATING GAIN (LOSS) TO NET CASH PROVIDED (USED) BY OPERATING ACTIVITIES:
Operating Gain (Loss) (133,657,508)$ 3,963,368$ Donated Investments (999,337) Adjustments to Reconcile Operating Gain (Loss) to Net Cash
Provided (Used) by Operating Activities:Depreciation Expense 10,163,073 Changes in:
Accounts Receivable 857,312 (63,191) Pledges Receivable 714,843 Inventories, Prepaids, and Other Assets 14,326 133,032 Endowment Fund (15,931) Deferred Outflows Related to Pensions (13,699,045) Deferred Outflows Related to OPEB 29,790 Accounts Payable 8,141,183 (72,845) Unearned Revenue 3,642,154 (298,332) Compensated Absences 358,375 Postemployment Benefits 153,035 Net Pension Liability 18,490,183 Liabilities Under Charitable Remainder Trusts (6,694) Amounts Held on Behalf of Others 62,242 Deferred Inflows Related to Charitable Remainder Trust 58,755 Deferred Inflows Related to Pensions 2,507,340
Net Cash Provided (Used) by Operating Activities (102,999,782)$ 3,475,910$
NON-CASH INVESTING, CAPITAL, AND FINANCING ACTIVITIES:
Amortization of Deferred Charge on Refunding 942,484$ Amortization of Premium on Long-Term Debt 2,576,182 Receipt of donated capital assets 59,950
Net Non-Cash Investing, Capital, and Financing Activities 3,578,616$ $
STATEMENT OF CASH FLOWS (Continued)YEAR ENDED JUNE 30, 2018
SONOMA COUNTY JUNIOR COLLEGE DISTRICT
The accompanying notes are an integral part of these financial statements. 18
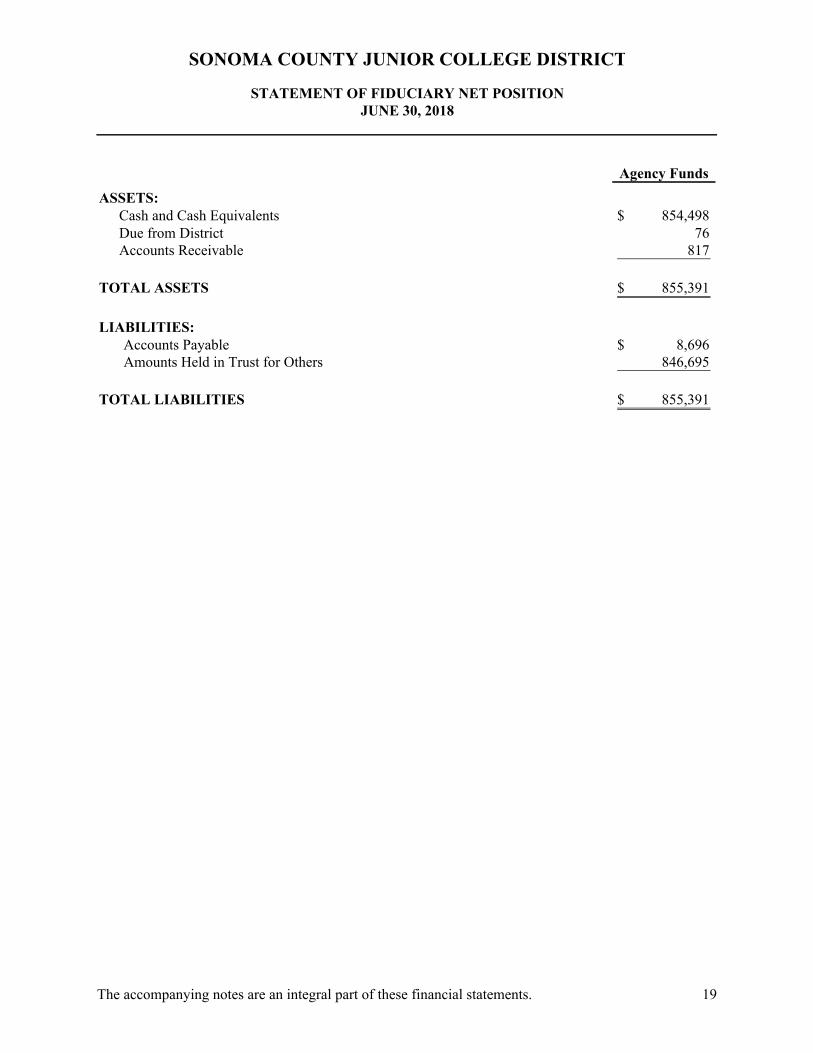
Agency Funds
ASSETS:Cash and Cash Equivalents 854,498$ Due from District 76 Accounts Receivable 817
TOTAL ASSETS 855,391$
LIABILITIES:Accounts Payable 8,696$ Amounts Held in Trust for Others 846,695
TOTAL LIABILITIES 855,391$
SONOMA COUNTY JUNIOR COLLEGE DISTRICT
STATEMENT OF FIDUCIARY NET POSITIONJUNE 30, 2018
The accompanying notes are an integral part of these financial statements. 19
SONOMA COUNTY JUNIOR COLLEGE DISTRICT
NOTES TO THE FINANCIAL STATEMENTS YEAR ENDED JUNE 30, 2018
20
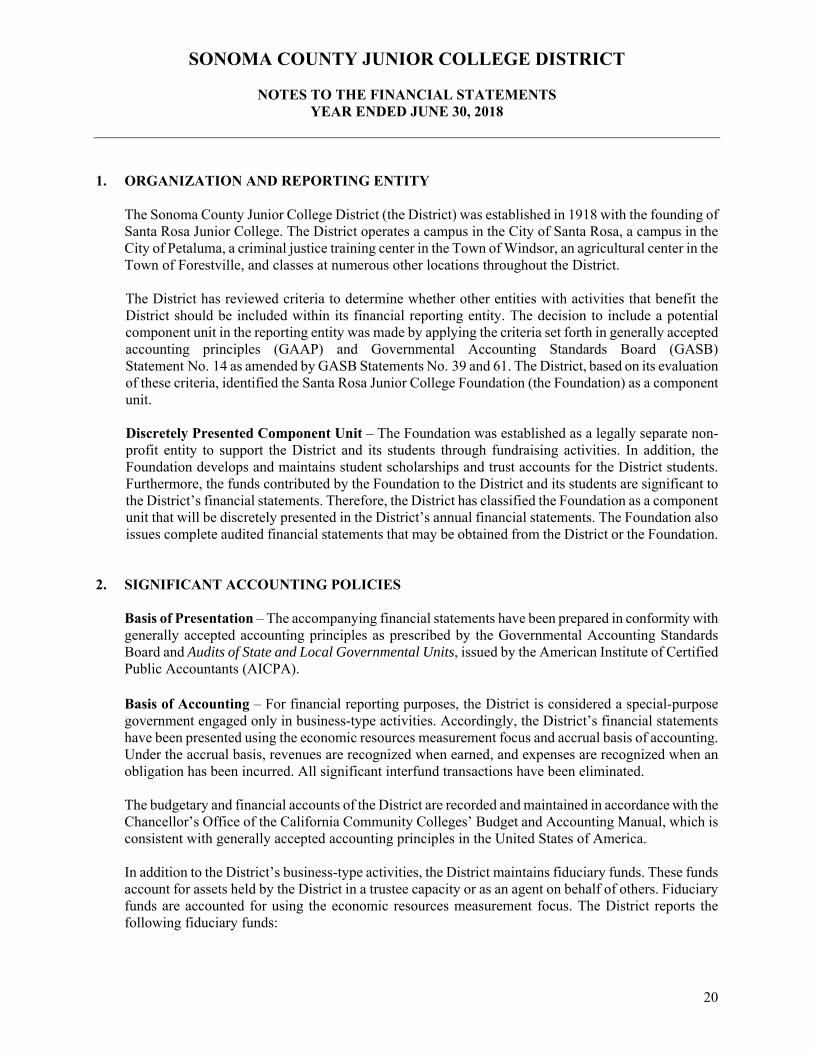
1. ORGANIZATION AND REPORTING ENTITY
The Sonoma County Junior College District (the District) was established in 1918 with the founding of Santa Rosa Junior College. The District operates a campus in the City of Santa Rosa, a campus in the City of Petaluma, a criminal justice training center in the Town of Windsor, an agricultural center in the Town of Forestville, and classes at numerous other locations throughout the District.
The District has reviewed criteria to determine whether other entities with activities that benefit the District should be included within its financial reporting entity. The decision to include a potential component unit in the reporting entity was made by applying the criteria set forth in generally accepted accounting principles (GAAP) and Governmental Accounting Standards Board (GASB) Statement No. 14 as amended by GASB Statements No. 39 and 61. The District, based on its evaluation of these criteria, identified the Santa Rosa Junior College Foundation (the Foundation) as a component unit. Discretely Presented Component Unit – The Foundation was established as a legally separate non-profit entity to support the District and its students through fundraising activities. In addition, the Foundation develops and maintains student scholarships and trust accounts for the District students. Furthermore, the funds contributed by the Foundation to the District and its students are significant to the District’s financial statements. Therefore, the District has classified the Foundation as a component unit that will be discretely presented in the District’s annual financial statements. The Foundation also issues complete audited financial statements that may be obtained from the District or the Foundation.
2. SIGNIFICANT ACCOUNTING POLICIES
Basis of Presentation – The accompanying financial statements have been prepared in conformity with generally accepted accounting principles as prescribed by the Governmental Accounting Standards Board and Audits of State and Local Governmental Units, issued by the American Institute of Certified Public Accountants (AICPA). Basis of Accounting – For financial reporting purposes, the District is considered a special-purpose government engaged only in business-type activities. Accordingly, the District’s financial statements have been presented using the economic resources measurement focus and accrual basis of accounting. Under the accrual basis, revenues are recognized when earned, and expenses are recognized when an obligation has been incurred. All significant interfund transactions have been eliminated. The budgetary and financial accounts of the District are recorded and maintained in accordance with the Chancellor’s Office of the California Community Colleges’ Budget and Accounting Manual, which is consistent with generally accepted accounting principles in the United States of America. In addition to the District’s business-type activities, the District maintains fiduciary funds. These funds account for assets held by the District in a trustee capacity or as an agent on behalf of others. Fiduciary funds are accounted for using the economic resources measurement focus. The District reports the following fiduciary funds:
SONOMA COUNTY JUNIOR COLLEGE DISTRICT
NOTES TO THE FINANCIAL STATEMENTS YEAR ENDED JUNE 30, 2018
21
Agency Funds – These funds include the Associated Students, Student Center Fee, and the Student Representation Fee Fund. The amounts reported for the Associated Students Fund represent the combined totals of all accounts for the various student body clubs and activities within the District. Individual totals, by club, are maintained within the Associated Student’s accounting system. The Student Center Fee Fund accounts for an annual building and operating fee for the purpose of financing, constructing, enlarging, remodeling, refurbishing, and operating a student body center. The Student Representation Fee Fund accounts for the student representation fee assessment, which is used by students for legislative advocacy.
Budgets and Budgetary Accounting – By state law, the District's governing board must approve a tentative budget no later than July 1st and adopt a final budget no later than September 15th of each year. A hearing must be conducted for public comments prior to adoption. The budget is revised during the year to incorporate categorical funds which are awarded during the year and miscellaneous changes to the spending plans. Revisions to the budget are approved by the District's governing board.
Estimates Used in Financial Reporting – In preparing financial statements in conformity with accounting principles generally accepted in the United States of America, management is required to make estimates and assumptions that affect the reported amounts of assets and liabilities and the disclosure of contingent assets and liabilities at the date of the financial statements and revenues and expenses during the reporting period. Actual results could differ from those estimates.
Cash and Cash Equivalents – For purposes of the statement of cash flows, the District considers all highly liquid investments with a maturity of three months or less at the time of purchase to be cash equivalents. Funds invested in the county treasurer’s investment pool are considered cash equivalents.
Restricted Cash, Cash Equivalents, and Investments – Cash, cash equivalents, and investments that are externally restricted per contractual obligations are classified as current or non-current assets in the statement of net position based on anticipated use. Accounts Receivable – Accounts receivable consist of amounts due from federal, state and local governments, or private sources, in connection with reimbursement of allowable expenses based on a contract or agreement between the District and the funding source. Additionally, accounts receivable consist of tuition and fee charges to students.
Inventory – Inventories are stated at the cost method (first-in, first-out method) or at market.
SONOMA COUNTY JUNIOR COLLEGE DISTRICT
NOTES TO THE FINANCIAL STATEMENTS YEAR ENDED JUNE 30, 2018
22
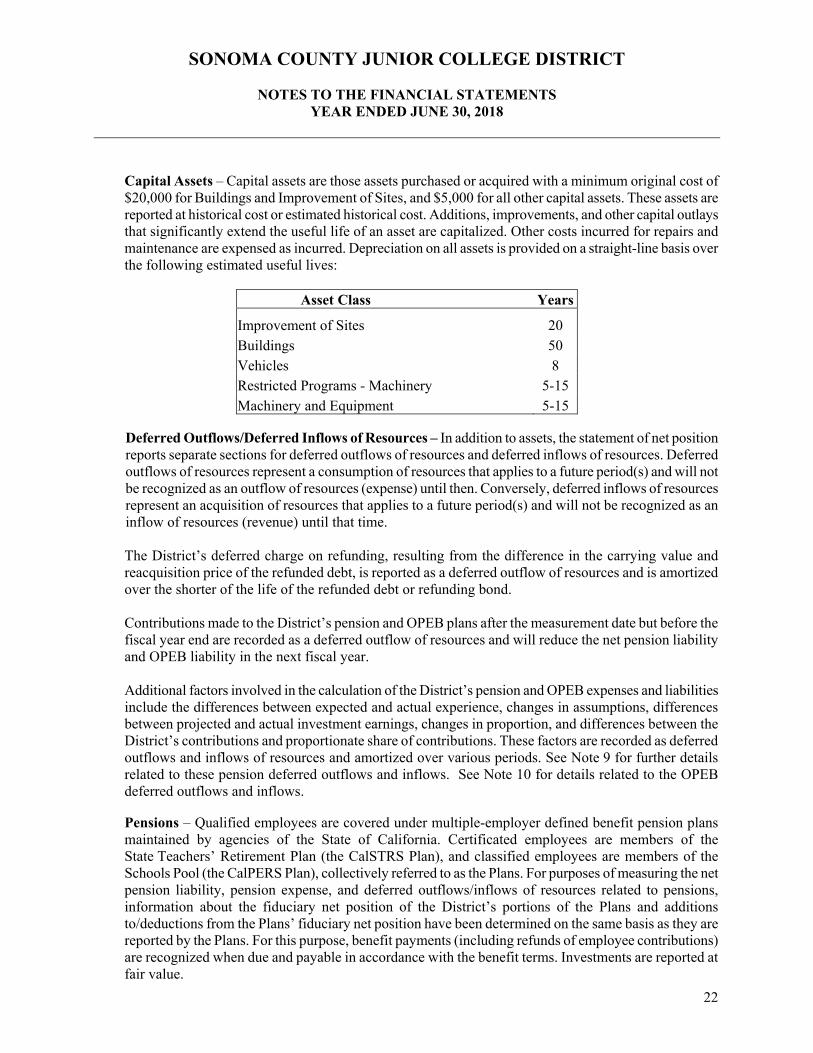
Capital Assets – Capital assets are those assets purchased or acquired with a minimum original cost of $20,000 for Buildings and Improvement of Sites, and $5,000 for all other capital assets. These assets are reported at historical cost or estimated historical cost. Additions, improvements, and other capital outlays that significantly extend the useful life of an asset are capitalized. Other costs incurred for repairs and maintenance are expensed as incurred. Depreciation on all assets is provided on a straight-line basis over the following estimated useful lives:
Asset Class Years
Improvement of Sites 20Buildings 50Vehicles 8Restricted Programs - Machinery 5-15Machinery and Equipment 5-15
Deferred Outflows/Deferred Inflows of Resources – In addition to assets, the statement of net position reports separate sections for deferred outflows of resources and deferred inflows of resources. Deferred outflows of resources represent a consumption of resources that applies to a future period(s) and will not be recognized as an outflow of resources (expense) until then. Conversely, deferred inflows of resources represent an acquisition of resources that applies to a future period(s) and will not be recognized as an inflow of resources (revenue) until that time. The District’s deferred charge on refunding, resulting from the difference in the carrying value and reacquisition price of the refunded debt, is reported as a deferred outflow of resources and is amortized over the shorter of the life of the refunded debt or refunding bond. Contributions made to the District’s pension and OPEB plans after the measurement date but before the fiscal year end are recorded as a deferred outflow of resources and will reduce the net pension liability and OPEB liability in the next fiscal year. Additional factors involved in the calculation of the District’s pension and OPEB expenses and liabilities include the differences between expected and actual experience, changes in assumptions, differences between projected and actual investment earnings, changes in proportion, and differences between the District’s contributions and proportionate share of contributions. These factors are recorded as deferred outflows and inflows of resources and amortized over various periods. See Note 9 for further details related to these pension deferred outflows and inflows. See Note 10 for details related to the OPEB deferred outflows and inflows.
Pensions – Qualified employees are covered under multiple-employer defined benefit pension plans maintained by agencies of the State of California. Certificated employees are members of the State Teachers’ Retirement Plan (the CalSTRS Plan), and classified employees are members of the Schools Pool (the CalPERS Plan), collectively referred to as the Plans. For purposes of measuring the net pension liability, pension expense, and deferred outflows/inflows of resources related to pensions, information about the fiduciary net position of the District’s portions of the Plans and additions to/deductions from the Plans’ fiduciary net position have been determined on the same basis as they are reported by the Plans. For this purpose, benefit payments (including refunds of employee contributions) are recognized when due and payable in accordance with the benefit terms. Investments are reported at fair value.
SONOMA COUNTY JUNIOR COLLEGE DISTRICT
NOTES TO THE FINANCIAL STATEMENTS YEAR ENDED JUNE 30, 2018
23
Other Postemployment Benefits (OPEB) – For purposes of measuring the total OPEB liability, deferred outflows of resources and deferred inflows of resources related to OPEB, and OPEB expense, information about the fiduciary net position of the District’s (OPEB Plan) and additions to/deductions from OPEB Plan’s fiduciary net position have been determined on the same basis. For this purpose, benefit payments are recognized when currently due and payable in accordance with the benefit terms. Unearned Revenues – Unearned revenues include amounts received for tuition and fees prior to the end of the fiscal year, but related to the subsequent accounting period. Unearned revenues also include amounts received from grants, contracts, and certain categorical programs that have not yet been earned. Compensated Absences – Employee vacation pay is accrued at year-end for financial statement purposes based on vacation time accrued and current pay rates. The liability and expense incurred are recorded at year end as accrued vacation payable in the statement of net position and as a component of employee benefits. It is the District’s policy to record sick leave in the period taken, since the employee’s right to sick leave payment does not vest upon termination. Noncurrent Liabilities – Non-current liabilities include estimated amounts for accrued postemployment benefits, net pension liabilities, and bond repayments and related interest that will not be paid within the next fiscal year. Net Position – The District's net position is classified as follows:
Net investment in capital assets – This represents the District's total investment in capital assets, net of outstanding debt obligations related to those capital assets. To the extent debt has been incurred but not yet expended for capital assets, such amounts are not included as a component of net investment in capital assets.
Restricted net position – expendable – Restricted expendable net position includes resources that the District is legally or contractually obligated to spend in accordance with restrictions imposed by external third parties.
Unrestricted net position (deficit) – Unrestricted net position (deficit) represents resources derived from student tuition and fees, state apportionments, and sales and services of educational departments and auxiliary enterprises. These resources are used for transactions relating to the educational and general operations of the District, and may be used at the discretion of the governing board to meet current expenses for any purpose. Unrestricted net position includes amounts internally designated for District obligations.
When both restricted and unrestricted resources are available for use, it is the District’s policy to use restricted resources first, and then unrestricted resources as they are needed.
Classification of Revenues – The District has classified its revenues as either operating or non-operating revenues according to the following criteria:
Operating revenues: Operating revenues include activities that have the characteristics of exchange transactions, such as (1) student tuition and fees, net of scholarship discounts and allowances; (2) sales and services of auxiliary enterprises; (3) most Federal, State, and local grants and contracts and Federal appropriations.
SONOMA COUNTY JUNIOR COLLEGE DISTRICT
NOTES TO THE FINANCIAL STATEMENTS YEAR ENDED JUNE 30, 2018
24
Non-operating revenues: Non-operating revenues include activities that have the characteristics of non-exchange transactions, such as gifts and contributions, and other revenue sources that are defined as non-operating revenues by GASB No. 9, “Reporting Cash Flows of Proprietary and Nonexpendable Trust Funds and Governmental Entities That Use Proprietary Fund Accounting” and GASB No. 34, such as State appropriations and investment income.
Scholarship Discounts and Allowances and Financial Aid – Student tuition and fee revenues are reported net of scholarship discounts and allowances in the statement of revenues, expenses, and changes in net position. The District offers Board of Governor’s (BOG) grants to qualified students and these tuition waivers are reported as scholarship discounts and allowances. Grants, such as Federal, State, or non-governmental programs, are recorded as operating or non-operating revenues in the District’s financial statements.
Property Taxes – Secured property taxes attach as an enforceable lien on property as of January 1, and are payable in two installments on November 1 and February 1. Unsecured property taxes are payable in one installment on or before August 31. The County of Sonoma bills and collects the taxes for the District. Tax revenues are recognized by the District when received. Changes in Accounting Principles – For the year ended June 30, 2018, the District implemented GASB Statement No. 75 (GASB 75), Accounting and Financial Reporting for Postemployment Benefits Other Than Pensions, and GASB Statement No. 89 (GASB 89), Accounting for Interest Cost Incurred before the End of a Construction Period. The primary objective of GASB 75 is to improve accounting and financial reporting by state and local governments for other postemployment benefits (OPEB) by establishing standards for measuring and recognizing liabilities, deferred outflows of resources, deferred inflows of resources, and expenses. It requires employers to report an OPEB liability for the difference between the present value of projected OPEB benefits for past service and restricted resources held in trust for the payment of benefits. GASB 75 identifies the methods and assumptions that should be used to project benefit payments, discount projected benefit payments to their actuarial present value, and attribute that present value to periods of employee service. Note 10 explains the effect of the implementation of GASB 75. Since GASB 75 requires retroactive application, the net OPEB liability offset by the related deferred outflow of resources and prior recognized OPEB liabilities as of June 30, 2017 reduces the beginning net position for the fiscal year ended June 30, 2018. As a result, for the year ended June 30, 2018, the beginning net position decreased by $23,771,810 as the cumulative effect of this change in accounting principle. The primary objectives of GASB 89 are to enhance the relevance and comparability of information about capital assets and the cost of borrowing for a reporting period, and to simplify accounting for interest cost incurred before the end of a construction period. It requires that interest costs incurred before the end of a construction period be recognized as an expense in the period in which the cost is incurred for business-type activities or enterprise funds. As a result, interest cost incurred before the end of a construction period will not be included in the historical cost of a capital asset. GASB 89 requires prospective application, therefore no adjustment was made to beginning net position.
SONOMA COUNTY JUNIOR COLLEGE DISTRICT
NOTES TO THE FINANCIAL STATEMENTS YEAR ENDED JUNE 30, 2018
25
For the year ended June 30, 2018, the Foundation implemented GASB Statement No. 81 (GASB 81), Irrevocable Split-Interest Agreements. Since GASB 81 requires retroactive application, the financial statements for the year ended June 30, 2017 have been restated to reflect the addition of the Foundation’s deferred inflow of resources for the net value of assets and liabilities received from irrevocable split-interest agreements of $2,396,141, reduces the beginning net position by $1,997,944 as well as the elimination of the changes in value of charitable remainders trusts and contributions received for new charitable remainder trusts of $331,946 and $66,251, respectively. Additional information regarding this change in accounting principle can be found in the Foundation’s audited financial statements.
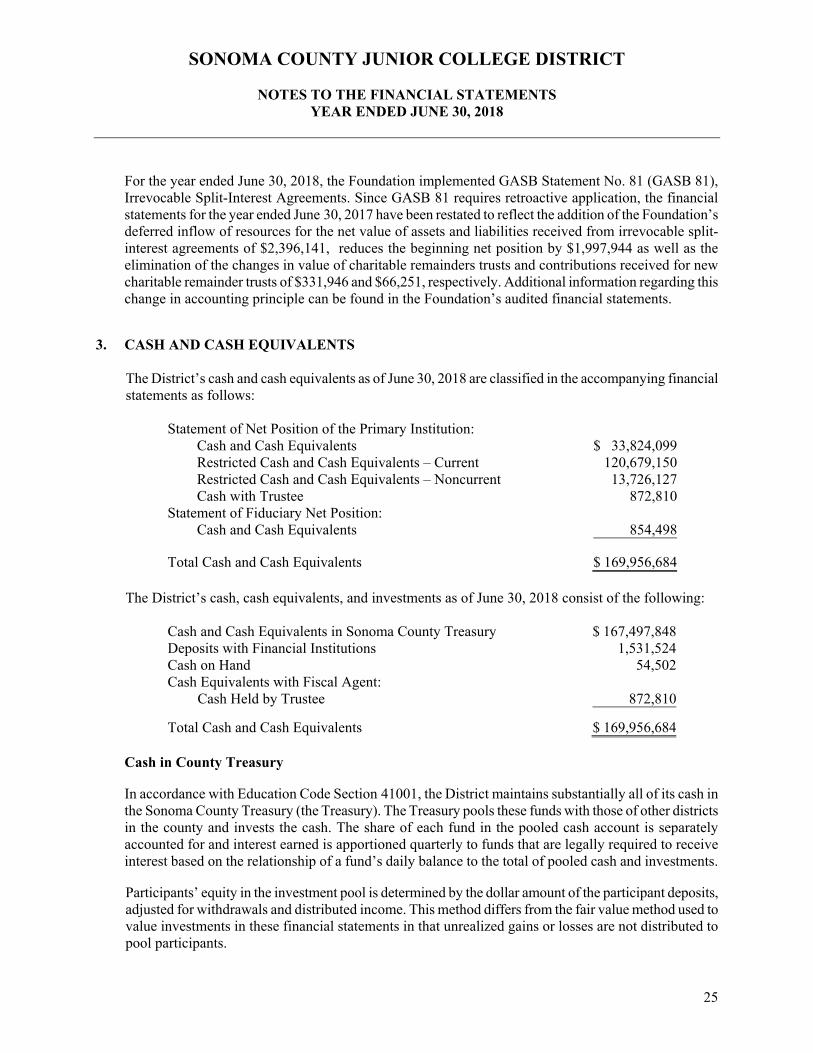
3. CASH AND CASH EQUIVALENTS The District’s cash and cash equivalents as of June 30, 2018 are classified in the accompanying financial statements as follows:
Statement of Net Position of the Primary Institution:Cash and Cash Equivalents $ 33,824,099Restricted Cash and Cash Equivalents – Current 120,679,150Restricted Cash and Cash Equivalents – Noncurrent 13,726,127Cash with Trustee 872,810
Statement of Fiduciary Net Position: Cash and Cash Equivalents 854,498
Total Cash and Cash Equivalents $ 169,956,684 The District’s cash, cash equivalents, and investments as of June 30, 2018 consist of the following:
Cash and Cash Equivalents in Sonoma County Treasury $ 167,497,848Deposits with Financial Institutions 1,531,524Cash on Hand 54,502Cash Equivalents with Fiscal Agent:
Cash Held by Trustee 872,810
Total Cash and Cash Equivalents $ 169,956,684
Cash in County Treasury
In accordance with Education Code Section 41001, the District maintains substantially all of its cash in the Sonoma County Treasury (the Treasury). The Treasury pools these funds with those of other districts in the county and invests the cash. The share of each fund in the pooled cash account is separately accounted for and interest earned is apportioned quarterly to funds that are legally required to receive interest based on the relationship of a fund’s daily balance to the total of pooled cash and investments.
Participants’ equity in the investment pool is determined by the dollar amount of the participant deposits, adjusted for withdrawals and distributed income. This method differs from the fair value method used to value investments in these financial statements in that unrealized gains or losses are not distributed to pool participants.
SONOMA COUNTY JUNIOR COLLEGE DISTRICT
NOTES TO THE FINANCIAL STATEMENTS YEAR ENDED JUNE 30, 2018
26
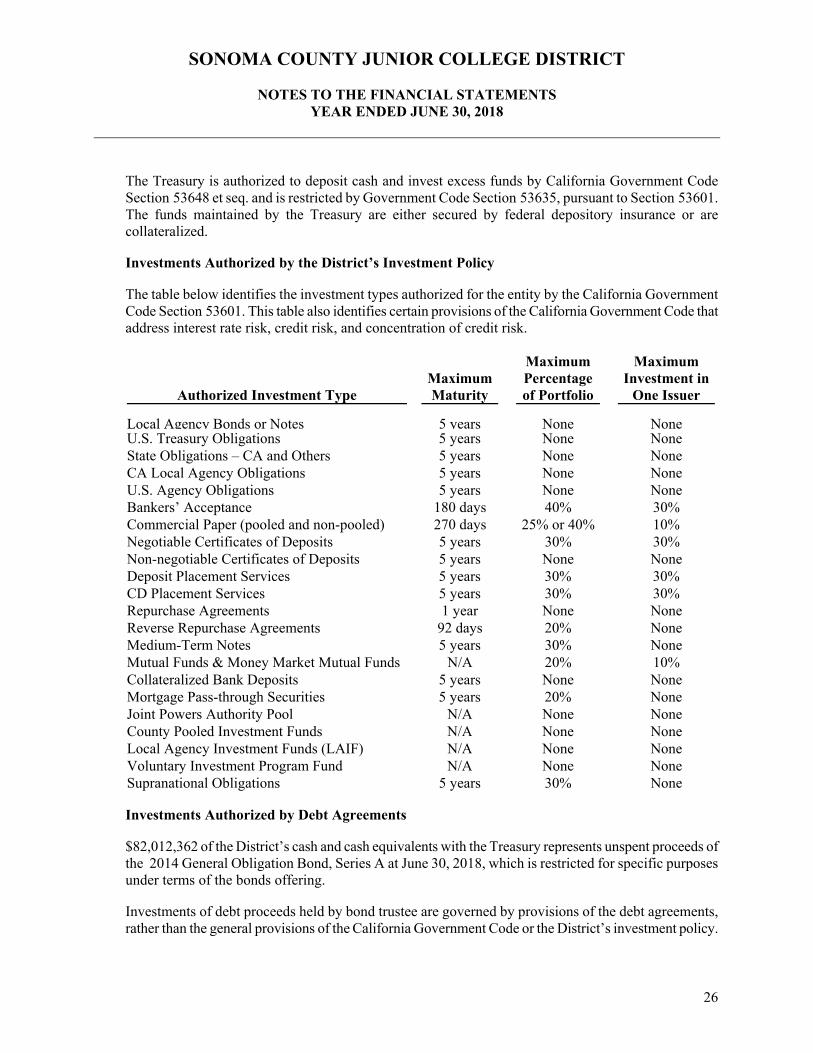
The Treasury is authorized to deposit cash and invest excess funds by California Government Code Section 53648 et seq. and is restricted by Government Code Section 53635, pursuant to Section 53601. The funds maintained by the Treasury are either secured by federal depository insurance or are collateralized.
Investments Authorized by the District’s Investment Policy
The table below identifies the investment types authorized for the entity by the California Government Code Section 53601. This table also identifies certain provisions of the California Government Code that address interest rate risk, credit risk, and concentration of credit risk.
Authorized Investment Type
MaximumMaturity
Maximum Percentage of Portfolio
Maximum Investment in
One Issuer
Local Agency Bonds or Notes 5 years None NoneU.S. Treasury Obligations 5 years None None State Obligations – CA and Others 5 years None None CA Local Agency Obligations 5 years None None U.S. Agency Obligations 5 years None None Bankers’ Acceptance 180 days 40% 30% Commercial Paper (pooled and non-pooled) 270 days 25% or 40% 10% Negotiable Certificates of Deposits 5 years 30% 30% Non-negotiable Certificates of Deposits 5 years None None Deposit Placement Services 5 years 30% 30% CD Placement Services 5 years 30% 30% Repurchase Agreements 1 year None None Reverse Repurchase Agreements 92 days 20% None Medium-Term Notes 5 years 30% None Mutual Funds & Money Market Mutual Funds N/A 20% 10% Collateralized Bank Deposits 5 years None None Mortgage Pass-through Securities 5 years 20% None Joint Powers Authority Pool N/A None None County Pooled Investment Funds N/A None None Local Agency Investment Funds (LAIF) N/A None None Voluntary Investment Program Fund N/A None None Supranational Obligations 5 years 30% None
Investments Authorized by Debt Agreements
$82,012,362 of the District’s cash and cash equivalents with the Treasury represents unspent proceeds of the 2014 General Obligation Bond, Series A at June 30, 2018, which is restricted for specific purposes under terms of the bonds offering.
Investments of debt proceeds held by bond trustee are governed by provisions of the debt agreements, rather than the general provisions of the California Government Code or the District’s investment policy.
SONOMA COUNTY JUNIOR COLLEGE DISTRICT
NOTES TO THE FINANCIAL STATEMENTS YEAR ENDED JUNE 30, 2018
27
Interest Rate Risk
Interest rate risk is the risk that changes in market interest rates will adversely affect the fair value of an investment. Generally, the longer the maturity of an investment, the greater the sensitivity of its fair values to changes in market interest rates. As of June 30, 2018, the weighted average maturity of the investments contained in the District’s Treasury's investment pool is approximately 533 days.
Credit Risk Generally, credit risk is the risk that an issuer of an investment will not fulfill its obligation to the holder of the investment. This is measured by the assignment of a rating by a nationally recognized statistical rating organization. The County Treasury investment pool does not have a rating provided by a nationally recognized statistical rating organization.
Concentration of Credit Risk
Concentration of credit risk is the risk of loss attributed to the magnitude of the District's investment in a single issuer. The proportion of investments in each of the permissible investment categories is restricted as defined in the California Government Code, Sections 53601 and 53635. The District does not hold any investments that constitute 5% or more of its total investment balance.
Cash on Hand, in Banks, and in Revolving Fund
As of June 30, 2018, the carrying amount of the District's bank balance was $1,830,436. Of the bank balance, $264,298 was insured by the Federal Depository Insurance Corporation (FDIC). Cash on hand of $54,502 is not insured. District deposits held with financial institutions in excess of FDIC limits were $2,349,110. Of the total bank balance, $1,531,524 is held by the primary institution and $386,559 is held by fiduciary funds.
Restricted Cash and Cash Equivalents The District’s restricted cash and cash equivalents are $134,405,277 at June 30, 2018. Included in this restricted balance is $82,012,362 for the 2014 Series A General Obligation Bond of unspent proceeds and $52,392,915 for the assessments collected by the County Treasurer’s Office on behalf of the District for the repayment of the District’s general obligation bonds. Derivative Investments The District did not directly enter into any derivative investments. Information regarding the amount invested in derivatives by the County Treasury was not available.
Fair Value Measurement GASB 72 requires the District to use valuation techniques which are appropriate under the circumstances and are either a market approach, a cost approach or an income approach. Statement No. 72 establishes a hierarchy of inputs used to measure fair value consisting of three levels. Level 1 inputs are quoted prices in active markets for identical assets or liabilities. Level 2 inputs are inputs other than quoted prices included within Level 1, which are observable for the asset or liability, either directly or indirectly. Level 3 inputs are unobservable inputs.
SONOMA COUNTY JUNIOR COLLEGE DISTRICT
NOTES TO THE FINANCIAL STATEMENTS YEAR ENDED JUNE 30, 2018
28
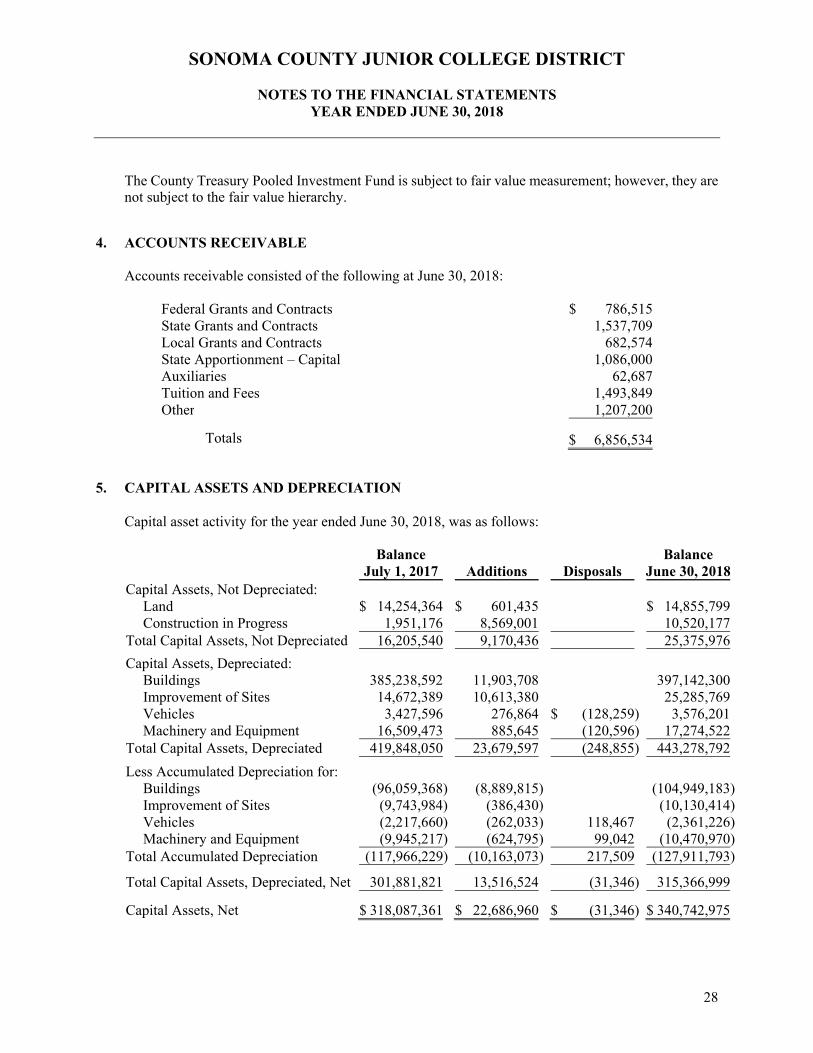
The County Treasury Pooled Investment Fund is subject to fair value measurement; however, they are not subject to the fair value hierarchy.
4. ACCOUNTS RECEIVABLE
Accounts receivable consisted of the following at June 30, 2018:
Federal Grants and Contracts $ 786,515State Grants and Contracts 1,537,709Local Grants and Contracts 682,574State Apportionment – Capital 1,086,000Auxiliaries 62,687Tuition and Fees 1,493,849Other 1,207,200
Totals $ 6,856,534
5. CAPITAL ASSETS AND DEPRECIATION
Capital asset activity for the year ended June 30, 2018, was as follows:
Balance
July 1, 2017 Additions Disposals Balance
June 30, 2018 Capital Assets, Not Depreciated:
Land $ 14,254,364 $ 601,435 $ 14,855,799Construction in Progress 1,951,176 8,569,001 10,520,177
Total Capital Assets, Not Depreciated 16,205,540 9,170,436 25,375,976
Capital Assets, Depreciated: Buildings 385,238,592 11,903,708 397,142,300Improvement of Sites 14,672,389 10,613,380 25,285,769Vehicles 3,427,596 276,864 $ (128,259) 3,576,201Machinery and Equipment 16,509,473 885,645 (120,596) 17,274,522
Total Capital Assets, Depreciated 419,848,050 23,679,597 (248,855) 443,278,792
Less Accumulated Depreciation for: Buildings (96,059,368) (8,889,815) (104,949,183)Improvement of Sites (9,743,984) (386,430) (10,130,414)Vehicles (2,217,660) (262,033) 118,467 (2,361,226)Machinery and Equipment (9,945,217) (624,795) 99,042 (10,470,970)
Total Accumulated Depreciation (117,966,229) (10,163,073) 217,509 (127,911,793)
Total Capital Assets, Depreciated, Net 301,881,821 13,516,524 (31,346) 315,366,999
Capital Assets, Net $ 318,087,361 $ 22,686,960 3$ (31,346) $ 340,742,975
SONOMA COUNTY JUNIOR COLLEGE DISTRICT
NOTES TO THE FINANCIAL STATEMENTS YEAR ENDED JUNE 30, 2018
29
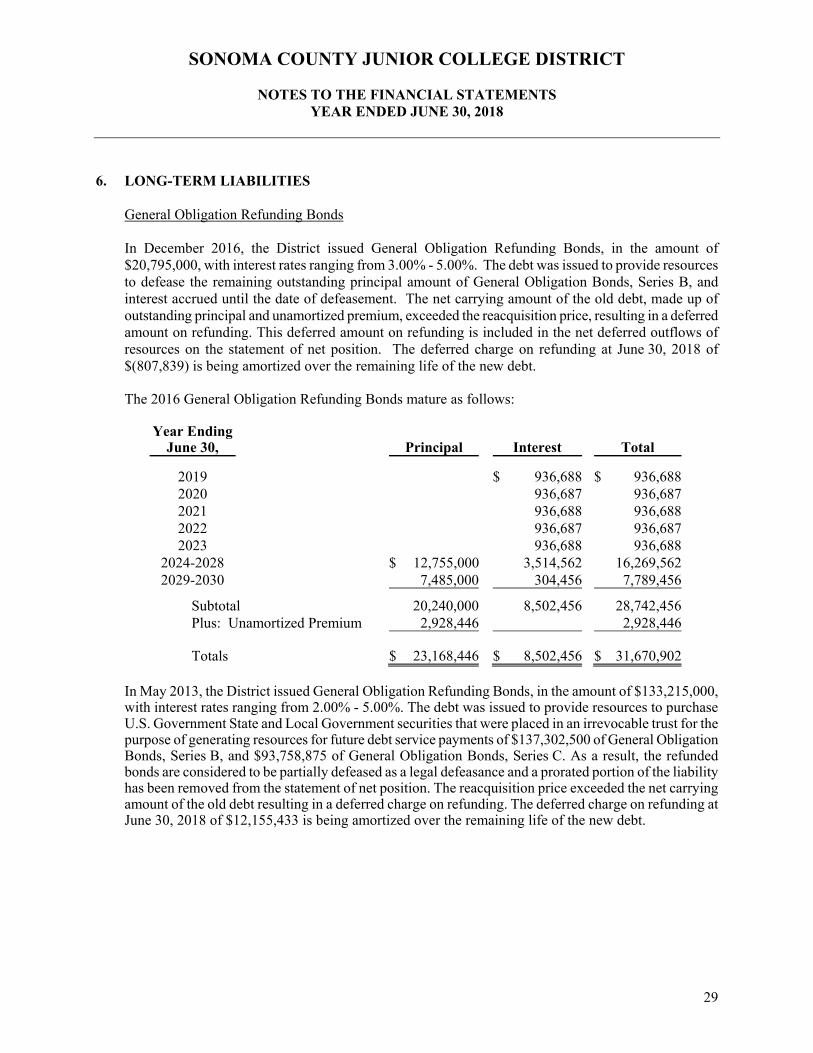
6. LONG-TERM LIABILITIES General Obligation Refunding Bonds In December 2016, the District issued General Obligation Refunding Bonds, in the amount of $20,795,000, with interest rates ranging from 3.00% - 5.00%. The debt was issued to provide resources to defease the remaining outstanding principal amount of General Obligation Bonds, Series B, and interest accrued until the date of defeasement. The net carrying amount of the old debt, made up of outstanding principal and unamortized premium, exceeded the reacquisition price, resulting in a deferred amount on refunding. This deferred amount on refunding is included in the net deferred outflows of resources on the statement of net position. The deferred charge on refunding at June 30, 2018 of $(807,839) is being amortized over the remaining life of the new debt. The 2016 General Obligation Refunding Bonds mature as follows:
Year Ending June 30, Principal Interest Total
2019 $ 936,688 $ 936,6882020 936,687 936,6872021 936,688 936,6882022 936,687 936,6872023 936,688 936,688
2024-2028 $ 12,755,000 3,514,562 16,269,5622029-2030 7,485,000 304,456 7,789,456
Subtotal 20,240,000 8,502,456 28,742,456Plus: Unamortized Premium 2,928,446 2,928,446
Totals $ 23,168,446 $ 8,502,456 $ 31,670,902 In May 2013, the District issued General Obligation Refunding Bonds, in the amount of $133,215,000, with interest rates ranging from 2.00% - 5.00%. The debt was issued to provide resources to purchase U.S. Government State and Local Government securities that were placed in an irrevocable trust for the purpose of generating resources for future debt service payments of $137,302,500 of General Obligation Bonds, Series B, and $93,758,875 of General Obligation Bonds, Series C. As a result, the refunded bonds are considered to be partially defeased as a legal defeasance and a prorated portion of the liability has been removed from the statement of net position. The reacquisition price exceeded the net carrying amount of the old debt resulting in a deferred charge on refunding. The deferred charge on refunding at June 30, 2018 of $12,155,433 is being amortized over the remaining life of the new debt.
SONOMA COUNTY JUNIOR COLLEGE DISTRICT
NOTES TO THE FINANCIAL STATEMENTS YEAR ENDED JUNE 30, 2018
30
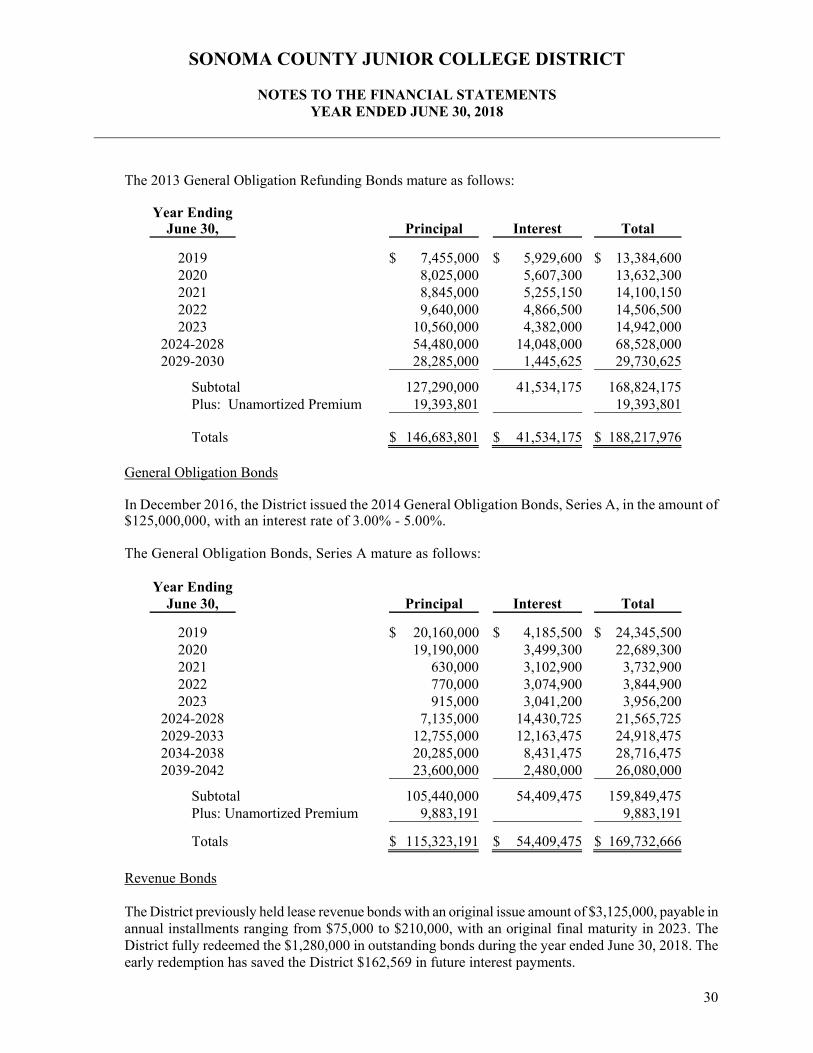
The 2013 General Obligation Refunding Bonds mature as follows:
Year Ending June 30, Principal Interest Total
2019 $ 7,455,000 $ 5,929,600 $ 13,384,6002020 8,025,000 5,607,300 13,632,3002021 8,845,000 5,255,150 14,100,1502022 9,640,000 4,866,500 14,506,5002023 10,560,000 4,382,000 14,942,000
2024-2028 54,480,000 14,048,000 68,528,0002029-2030 28,285,000 1,445,625 29,730,625
Subtotal 127,290,000 41,534,175 168,824,175Plus: Unamortized Premium 19,393,801 19,393,801
Totals $ 146,683,801 $ 41,534,175 $ 188,217,976 General Obligation Bonds
In December 2016, the District issued the 2014 General Obligation Bonds, Series A, in the amount of $125,000,000, with an interest rate of 3.00% - 5.00%.
The General Obligation Bonds, Series A mature as follows:
Year Ending June 30, Principal Interest Total
2019 $ 20,160,000 $ 4,185,500 $ 24,345,5002020 19,190,000 3,499,300 22,689,3002021 630,000 3,102,900 3,732,9002022 770,000 3,074,900 3,844,9002023 915,000 3,041,200 3,956,200
2024-2028 7,135,000 14,430,725 21,565,7252029-2033 12,755,000 12,163,475 24,918,4752034-2038 20,285,000 8,431,475 28,716,4752039-2042 23,600,000 2,480,000 26,080,000
Subtotal 105,440,000 54,409,475 159,849,475Plus: Unamortized Premium 9,883,191 9,883,191
Totals $ 115,323,191 $ 54,409,475 $ 169,732,666 Revenue Bonds
The District previously held lease revenue bonds with an original issue amount of $3,125,000, payable in annual installments ranging from $75,000 to $210,000, with an original final maturity in 2023. The District fully redeemed the $1,280,000 in outstanding bonds during the year ended June 30, 2018. The early redemption has saved the District $162,569 in future interest payments.
SONOMA COUNTY JUNIOR COLLEGE DISTRICT
NOTES TO THE FINANCIAL STATEMENTS YEAR ENDED JUNE 30, 2018
31
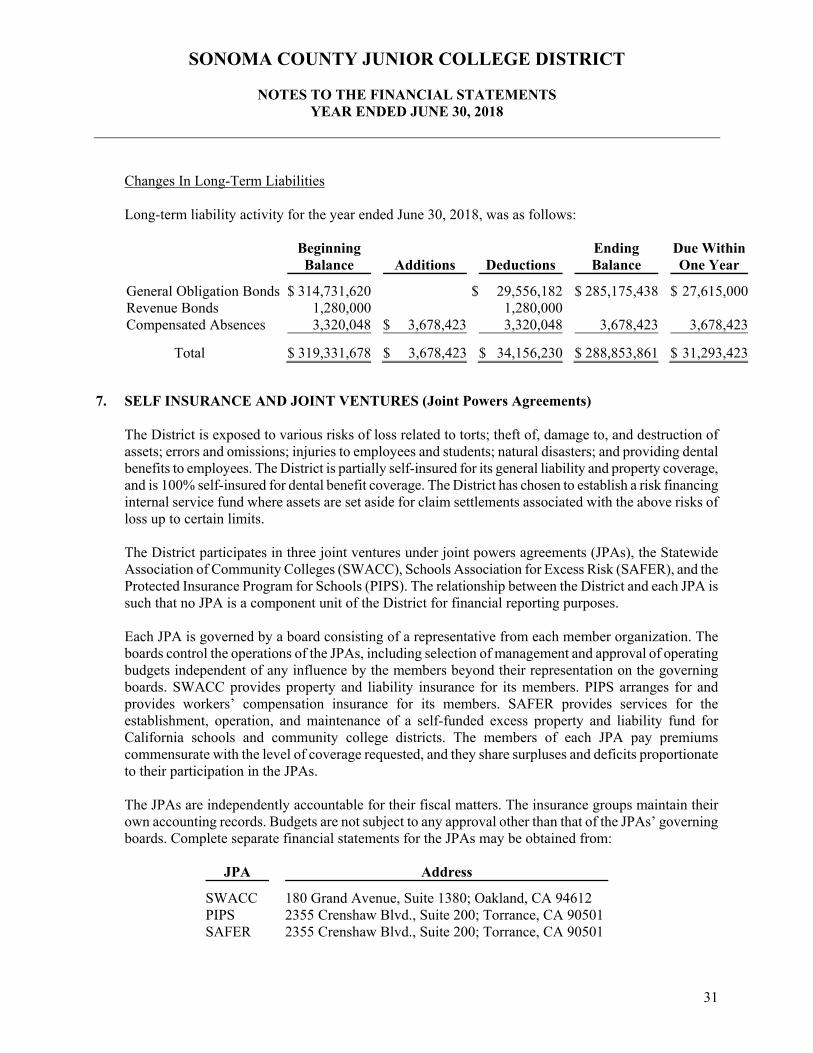
Changes In Long-Term Liabilities
Long-term liability activity for the year ended June 30, 2018, was as follows:
Beginning Balance
Additions
Deductions
Ending Balance
Due Within One Year
General Obligation Bonds $ 314,731,620 $ 29,556,182 $ 285,175,438 $ 27,615,000Revenue Bonds 1,280,000 1,280,000Compensated Absences 3,320,048 $ 3,678,423 3,320,048 3,678,423 3,678,423
Total $ 319,331,678 $ 3,678,423 $ 34,156,230 $ 288,853,861 $ 31,293,423
7. SELF INSURANCE AND JOINT VENTURES (Joint Powers Agreements)
The District is exposed to various risks of loss related to torts; theft of, damage to, and destruction of assets; errors and omissions; injuries to employees and students; natural disasters; and providing dental benefits to employees. The District is partially self-insured for its general liability and property coverage, and is 100% self-insured for dental benefit coverage. The District has chosen to establish a risk financing internal service fund where assets are set aside for claim settlements associated with the above risks of loss up to certain limits. The District participates in three joint ventures under joint powers agreements (JPAs), the Statewide Association of Community Colleges (SWACC), Schools Association for Excess Risk (SAFER), and the Protected Insurance Program for Schools (PIPS). The relationship between the District and each JPA is such that no JPA is a component unit of the District for financial reporting purposes. Each JPA is governed by a board consisting of a representative from each member organization. The boards control the operations of the JPAs, including selection of management and approval of operating budgets independent of any influence by the members beyond their representation on the governing boards. SWACC provides property and liability insurance for its members. PIPS arranges for and provides workers’ compensation insurance for its members. SAFER provides services for the establishment, operation, and maintenance of a self-funded excess property and liability fund for California schools and community college districts. The members of each JPA pay premiums commensurate with the level of coverage requested, and they share surpluses and deficits proportionate to their participation in the JPAs. The JPAs are independently accountable for their fiscal matters. The insurance groups maintain their own accounting records. Budgets are not subject to any approval other than that of the JPAs’ governing boards. Complete separate financial statements for the JPAs may be obtained from:
JPA Address
SWACC 180 Grand Avenue, Suite 1380; Oakland, CA 94612 PIPS 2355 Crenshaw Blvd., Suite 200; Torrance, CA 90501 SAFER 2355 Crenshaw Blvd., Suite 200; Torrance, CA 90501
SONOMA COUNTY JUNIOR COLLEGE DISTRICT
NOTES TO THE FINANCIAL STATEMENTS YEAR ENDED JUNE 30, 2018
32
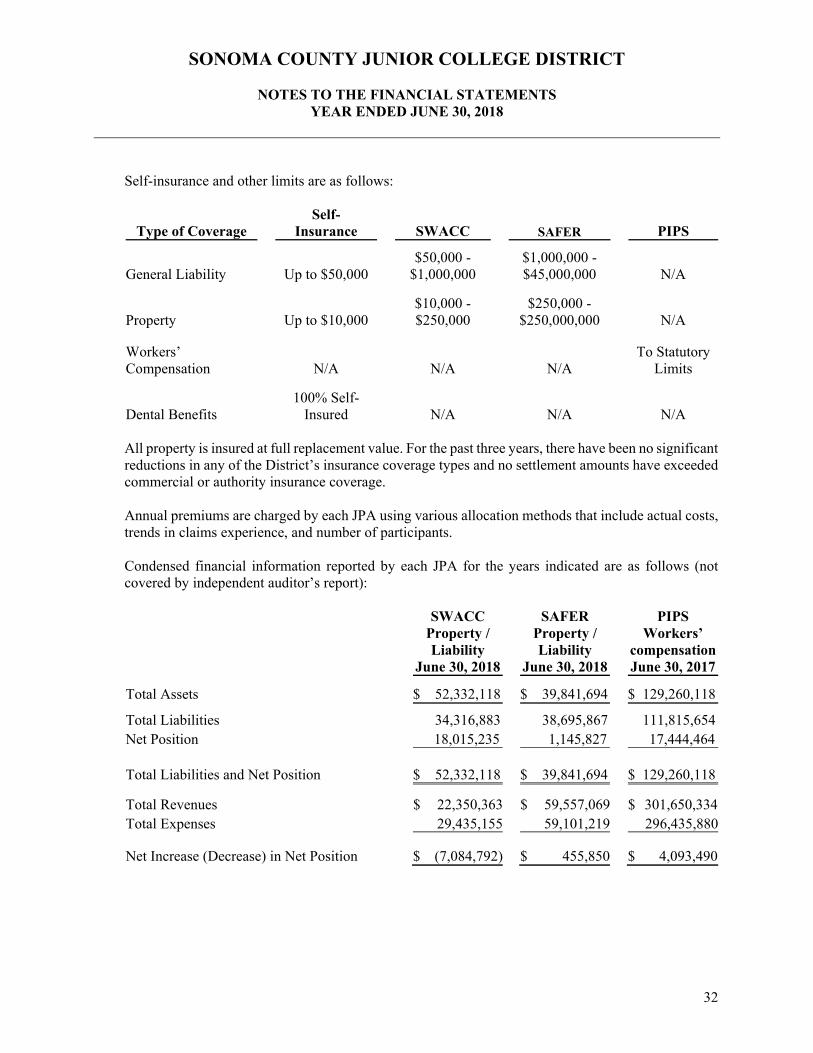
Self-insurance and other limits are as follows:
Type of Coverage Self-
Insurance SWACC SAFER PIPS
General Liability Up to $50,000$50,000 -
$1,000,000$1,000,000 -$45,000,000 N/A
Property Up to $10,000$10,000 - $250,000
$250,000 -$250,000,000 N/A
Workers’ Compensation N/A N/A N/A
To Statutory Limits
Dental Benefits 100% Self-
Insured N/A N/A N/A All property is insured at full replacement value. For the past three years, there have been no significant reductions in any of the District’s insurance coverage types and no settlement amounts have exceeded commercial or authority insurance coverage.
Annual premiums are charged by each JPA using various allocation methods that include actual costs, trends in claims experience, and number of participants.
Condensed financial information reported by each JPA for the years indicated are as follows (not covered by independent auditor’s report):
SWACC Property / Liability
June 30, 2018
SAFER Property / Liability
June 30, 2018
PIPS Workers’
compensation June 30, 2017
Total Assets $ 52,332,118 $ 39,841,694 $ 129,260,118
Total Liabilities 34,316,883 38,695,867 111,815,654Net Position 18,015,235 1,145,827 17,444,464
Total Liabilities and Net Position $ 52,332,118 $ 39,841,694 $ 129,260,118
Total Revenues $ 22,350,363 $ 59,557,069 $ 301,650,334Total Expenses 29,435,155 59,101,219 296,435,880
Net Increase (Decrease) in Net Position $ (7,084,792) $ 455,850 $ 4,093,490

SONOMA COUNTY JUNIOR COLLEGE DISTRICT
NOTES TO THE FINANCIAL STATEMENTS YEAR ENDED JUNE 30, 2018
33
8. COMMITMENTS AND CONTINGENCIES
State and Federal Allowances, Awards, and Grants
The District has received state and federal funds for specific purposes that are subject to review and audit by the grantor agencies. Although such audits could generate expenditure disallowances under terms of the grants, it is believed that any required reimbursement would not be material. Litigation
The District is a defendant in various lawsuits. However, based on consultation with legal counsel, management believes that the ultimate resolution of these matters will not have a material adverse effect on the District’s financial position or results of operations. Sick Leave Employees do not gain a vested right to accumulated sick leave; however, they are entitled to service credit for the calculation of their retirement benefits. The District tracks the sick leave balance for each employee and reports it to PERS or STRS at retirement to determine the service credit. Construction Commitments The District has construction commitments of approximately $66,088,268 at June 30, 2018. General Obligation Bonds have been approved for such construction commitments.
9. RETIREMENT PLANS
California State Teachers’ Retirement System (CalSTRS)
Plan Description The District participates in the State Teachers’ Retirement Plan (the CalSTRS Plan), a cost-sharing multiple-employer public employee retirement system defined benefit pension plan administered by CalSTRS. CalSTRS acts as a common investment and administrative agent for participating public entities within the State of California. CalSTRS issues a publicly available financial report that includes financial statements and required supplementary information for this plan. This report is available online at www.calstrs.com. Benefits Provided The benefits for the CalSTRS Plan are established by contract, in accordance with the provisions of the State Teachers' Retirement Law. Benefits are based on members’ years of service, age, final compensation, and a benefit formula. Benefits are provided for disability, death, and survivors of eligible members or beneficiaries. The California Public Employees’ Pension Reform Act of 2013 (PEPRA) made significant changes to the benefit structure that primarily affect members first hired to perform CalSTRS creditable activities on or after January 1, 2013. As a result of PEPRA, the CalSTRS Plan has two benefit structures: 1) CalSTRS 2% at 60 – Members first hired on or before December 31, 2012, to perform CalSTRS creditable activities, and 2) CalSTRS 2% at 62 – Members first hired on or after
SONOMA COUNTY JUNIOR COLLEGE DISTRICT
NOTES TO THE FINANCIAL STATEMENTS YEAR ENDED JUNE 30, 2018
34
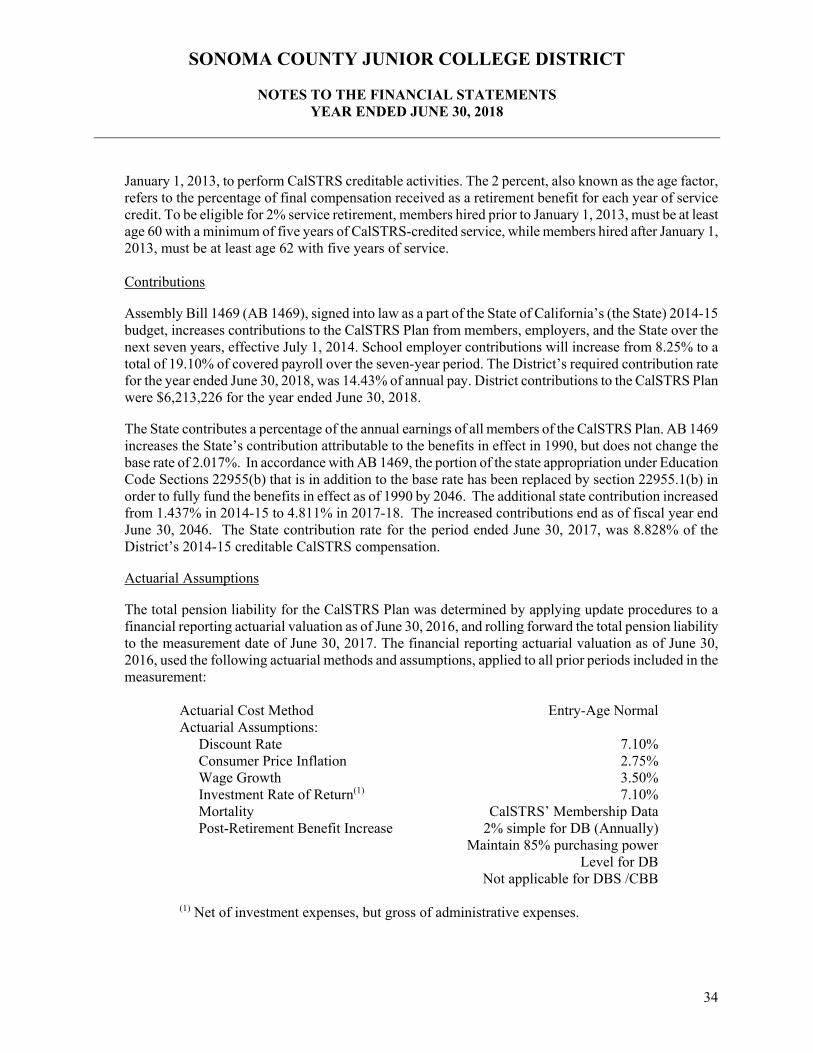
January 1, 2013, to perform CalSTRS creditable activities. The 2 percent, also known as the age factor, refers to the percentage of final compensation received as a retirement benefit for each year of service credit. To be eligible for 2% service retirement, members hired prior to January 1, 2013, must be at least age 60 with a minimum of five years of CalSTRS-credited service, while members hired after January 1, 2013, must be at least age 62 with five years of service. Contributions
Assembly Bill 1469 (AB 1469), signed into law as a part of the State of California’s (the State) 2014-15 budget, increases contributions to the CalSTRS Plan from members, employers, and the State over the next seven years, effective July 1, 2014. School employer contributions will increase from 8.25% to a total of 19.10% of covered payroll over the seven-year period. The District’s required contribution rate for the year ended June 30, 2018, was 14.43% of annual pay. District contributions to the CalSTRS Plan were $6,213,226 for the year ended June 30, 2018.
The State contributes a percentage of the annual earnings of all members of the CalSTRS Plan. AB 1469 increases the State’s contribution attributable to the benefits in effect in 1990, but does not change the base rate of 2.017%. In accordance with AB 1469, the portion of the state appropriation under Education Code Sections 22955(b) that is in addition to the base rate has been replaced by section 22955.1(b) in order to fully fund the benefits in effect as of 1990 by 2046. The additional state contribution increased from 1.437% in 2014-15 to 4.811% in 2017-18. The increased contributions end as of fiscal year end June 30, 2046. The State contribution rate for the period ended June 30, 2017, was 8.828% of the District’s 2014-15 creditable CalSTRS compensation.
Actuarial Assumptions
The total pension liability for the CalSTRS Plan was determined by applying update procedures to a financial reporting actuarial valuation as of June 30, 2016, and rolling forward the total pension liability to the measurement date of June 30, 2017. The financial reporting actuarial valuation as of June 30, 2016, used the following actuarial methods and assumptions, applied to all prior periods included in the measurement:
Actuarial Cost Method Entry-Age Normal Actuarial Assumptions:
Discount Rate 7.10%Consumer Price Inflation 2.75%Wage Growth 3.50%Investment Rate of Return(1) 7.10% Mortality CalSTRS’ Membership DataPost-Retirement Benefit Increase 2% simple for DB (Annually)
Maintain 85% purchasing power Level for DB
Not applicable for DBS /CBB (1) Net of investment expenses, but gross of administrative expenses.
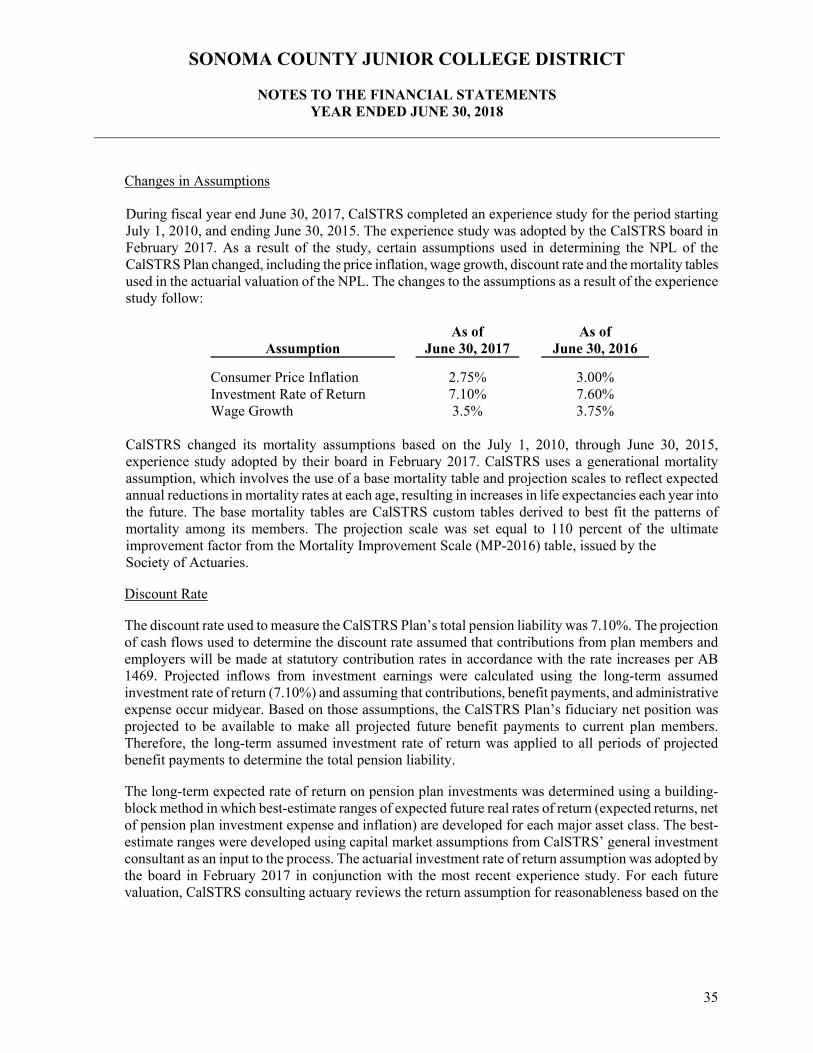
SONOMA COUNTY JUNIOR COLLEGE DISTRICT
NOTES TO THE FINANCIAL STATEMENTS YEAR ENDED JUNE 30, 2018
35
Changes in Assumptions
During fiscal year end June 30, 2017, CalSTRS completed an experience study for the period starting July 1, 2010, and ending June 30, 2015. The experience study was adopted by the CalSTRS board in February 2017. As a result of the study, certain assumptions used in determining the NPL of the CalSTRS Plan changed, including the price inflation, wage growth, discount rate and the mortality tables used in the actuarial valuation of the NPL. The changes to the assumptions as a result of the experience study follow:
Assumption As of
June 30, 2017 As of
June 30, 2016
Consumer Price Inflation 2.75% 3.00% Investment Rate of Return 7.10% 7.60% Wage Growth 3.5% 3.75%
CalSTRS changed its mortality assumptions based on the July 1, 2010, through June 30, 2015, experience study adopted by their board in February 2017. CalSTRS uses a generational mortality assumption, which involves the use of a base mortality table and projection scales to reflect expected annual reductions in mortality rates at each age, resulting in increases in life expectancies each year into the future. The base mortality tables are CalSTRS custom tables derived to best fit the patterns of mortality among its members. The projection scale was set equal to 110 percent of the ultimate improvement factor from the Mortality Improvement Scale (MP-2016) table, issued by the Society of Actuaries.
Discount Rate
The discount rate used to measure the CalSTRS Plan’s total pension liability was 7.10%. The projection of cash flows used to determine the discount rate assumed that contributions from plan members and employers will be made at statutory contribution rates in accordance with the rate increases per AB 1469. Projected inflows from investment earnings were calculated using the long-term assumed investment rate of return (7.10%) and assuming that contributions, benefit payments, and administrative expense occur midyear. Based on those assumptions, the CalSTRS Plan’s fiduciary net position was projected to be available to make all projected future benefit payments to current plan members. Therefore, the long-term assumed investment rate of return was applied to all periods of projected benefit payments to determine the total pension liability.
The long-term expected rate of return on pension plan investments was determined using a building-block method in which best-estimate ranges of expected future real rates of return (expected returns, net of pension plan investment expense and inflation) are developed for each major asset class. The best-estimate ranges were developed using capital market assumptions from CalSTRS’ general investment consultant as an input to the process. The actuarial investment rate of return assumption was adopted by the board in February 2017 in conjunction with the most recent experience study. For each future valuation, CalSTRS consulting actuary reviews the return assumption for reasonableness based on the
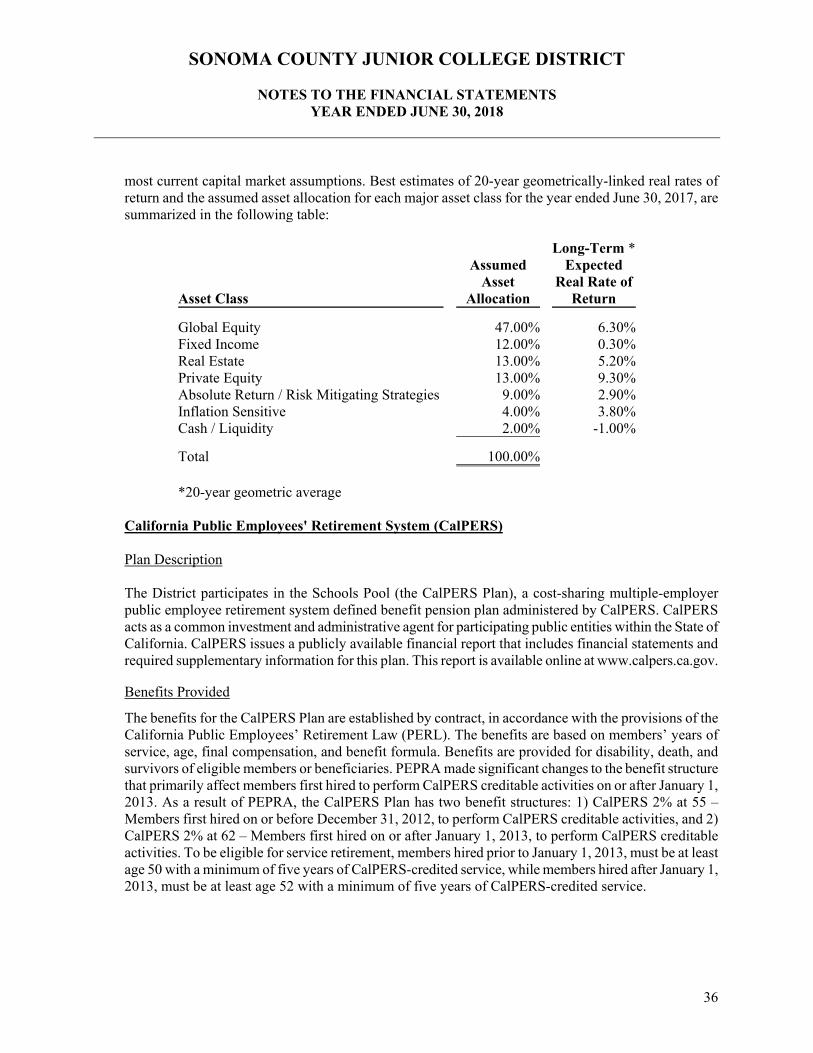
SONOMA COUNTY JUNIOR COLLEGE DISTRICT
NOTES TO THE FINANCIAL STATEMENTS YEAR ENDED JUNE 30, 2018
36
most current capital market assumptions. Best estimates of 20-year geometrically-linked real rates of return and the assumed asset allocation for each major asset class for the year ended June 30, 2017, are summarized in the following table:
Asset Class
Assumed Asset
Allocation
Long-Term * Expected
Real Rate of Return
Global Equity 47.00% 6.30%Fixed Income 12.00% 0.30%Real Estate 13.00% 5.20%Private Equity 13.00% 9.30%Absolute Return / Risk Mitigating Strategies 9.00% 2.90%Inflation Sensitive 4.00% 3.80%Cash / Liquidity 2.00% -1.00%
Total 100.00% *20-year geometric average
California Public Employees' Retirement System (CalPERS) Plan Description The District participates in the Schools Pool (the CalPERS Plan), a cost-sharing multiple-employer public employee retirement system defined benefit pension plan administered by CalPERS. CalPERS acts as a common investment and administrative agent for participating public entities within the State of California. CalPERS issues a publicly available financial report that includes financial statements and required supplementary information for this plan. This report is available online at www.calpers.ca.gov.
Benefits Provided
The benefits for the CalPERS Plan are established by contract, in accordance with the provisions of the California Public Employees’ Retirement Law (PERL). The benefits are based on members’ years of service, age, final compensation, and benefit formula. Benefits are provided for disability, death, and survivors of eligible members or beneficiaries. PEPRA made significant changes to the benefit structure that primarily affect members first hired to perform CalPERS creditable activities on or after January 1, 2013. As a result of PEPRA, the CalPERS Plan has two benefit structures: 1) CalPERS 2% at 55 – Members first hired on or before December 31, 2012, to perform CalPERS creditable activities, and 2) CalPERS 2% at 62 – Members first hired on or after January 1, 2013, to perform CalPERS creditable activities. To be eligible for service retirement, members hired prior to January 1, 2013, must be at least age 50 with a minimum of five years of CalPERS-credited service, while members hired after January 1, 2013, must be at least age 52 with a minimum of five years of CalPERS-credited service.
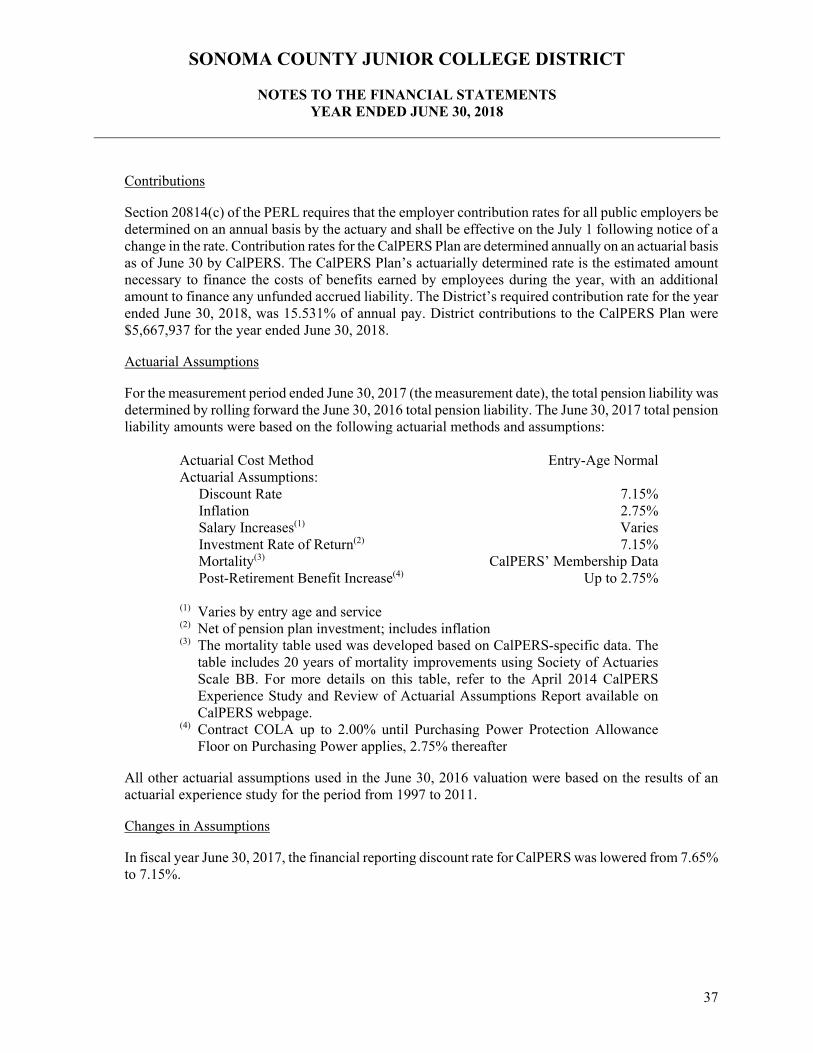
SONOMA COUNTY JUNIOR COLLEGE DISTRICT
NOTES TO THE FINANCIAL STATEMENTS YEAR ENDED JUNE 30, 2018
37
Contributions
Section 20814(c) of the PERL requires that the employer contribution rates for all public employers be determined on an annual basis by the actuary and shall be effective on the July 1 following notice of a change in the rate. Contribution rates for the CalPERS Plan are determined annually on an actuarial basis as of June 30 by CalPERS. The CalPERS Plan’s actuarially determined rate is the estimated amount necessary to finance the costs of benefits earned by employees during the year, with an additional amount to finance any unfunded accrued liability. The District’s required contribution rate for the year ended June 30, 2018, was 15.531% of annual pay. District contributions to the CalPERS Plan were $5,667,937 for the year ended June 30, 2018.
Actuarial Assumptions
For the measurement period ended June 30, 2017 (the measurement date), the total pension liability was determined by rolling forward the June 30, 2016 total pension liability. The June 30, 2017 total pension liability amounts were based on the following actuarial methods and assumptions:
Actuarial Cost Method Entry-Age Normal Actuarial Assumptions:
Discount Rate 7.15%Inflation 2.75%Salary Increases(1) Varies Investment Rate of Return(2) 7.15% Mortality(3) CalPERS’ Membership DataPost-Retirement Benefit Increase(4) Up to 2.75%
(1) Varies by entry age and service (2) Net of pension plan investment; includes inflation(3) The mortality table used was developed based on CalPERS-specific data. The
table includes 20 years of mortality improvements using Society of Actuaries Scale BB. For more details on this table, refer to the April 2014 CalPERS Experience Study and Review of Actuarial Assumptions Report available onCalPERS webpage.
(4) Contract COLA up to 2.00% until Purchasing Power Protection Allowance Floor on Purchasing Power applies, 2.75% thereafter
All other actuarial assumptions used in the June 30, 2016 valuation were based on the results of an actuarial experience study for the period from 1997 to 2011.
Changes in Assumptions
In fiscal year June 30, 2017, the financial reporting discount rate for CalPERS was lowered from 7.65% to 7.15%.
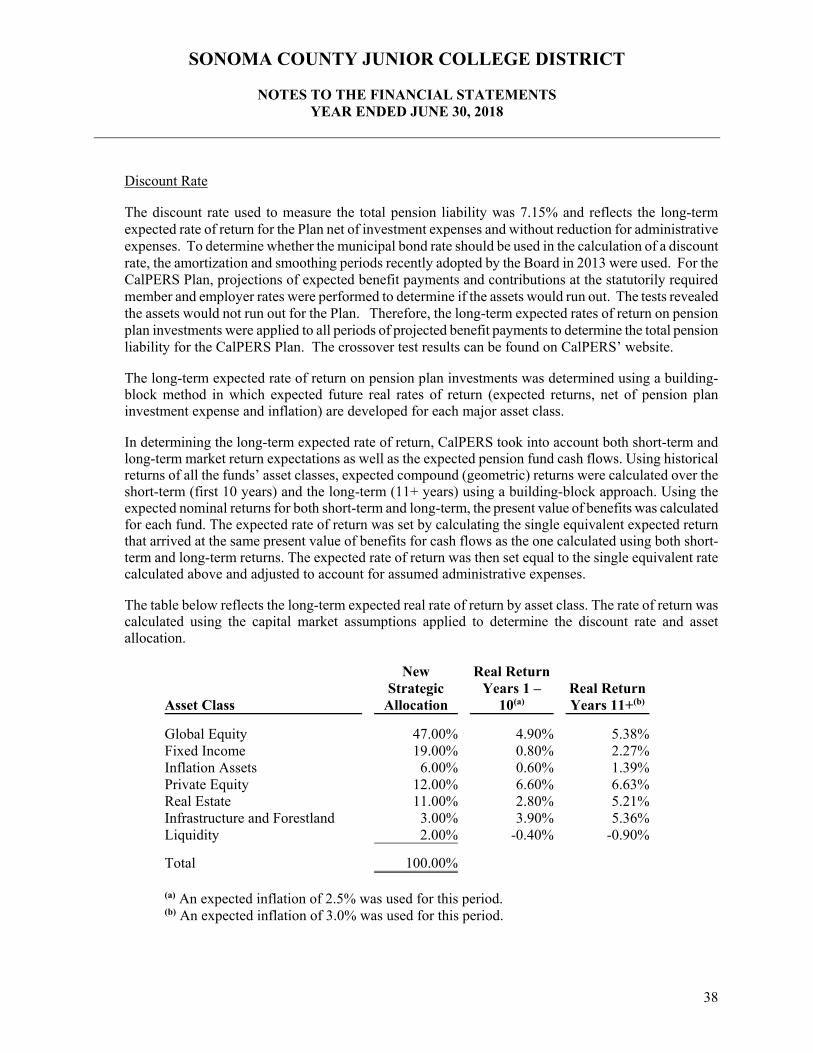
SONOMA COUNTY JUNIOR COLLEGE DISTRICT
NOTES TO THE FINANCIAL STATEMENTS YEAR ENDED JUNE 30, 2018
38
Discount Rate
The discount rate used to measure the total pension liability was 7.15% and reflects the long-term expected rate of return for the Plan net of investment expenses and without reduction for administrative expenses. To determine whether the municipal bond rate should be used in the calculation of a discount rate, the amortization and smoothing periods recently adopted by the Board in 2013 were used. For the CalPERS Plan, projections of expected benefit payments and contributions at the statutorily required member and employer rates were performed to determine if the assets would run out. The tests revealed the assets would not run out for the Plan. Therefore, the long-term expected rates of return on pension plan investments were applied to all periods of projected benefit payments to determine the total pension liability for the CalPERS Plan. The crossover test results can be found on CalPERS’ website.
The long-term expected rate of return on pension plan investments was determined using a building-block method in which expected future real rates of return (expected returns, net of pension plan investment expense and inflation) are developed for each major asset class.
In determining the long-term expected rate of return, CalPERS took into account both short-term and long-term market return expectations as well as the expected pension fund cash flows. Using historical returns of all the funds’ asset classes, expected compound (geometric) returns were calculated over the short-term (first 10 years) and the long-term (11+ years) using a building-block approach. Using the expected nominal returns for both short-term and long-term, the present value of benefits was calculated for each fund. The expected rate of return was set by calculating the single equivalent expected return that arrived at the same present value of benefits for cash flows as the one calculated using both short-term and long-term returns. The expected rate of return was then set equal to the single equivalent rate calculated above and adjusted to account for assumed administrative expenses.
The table below reflects the long-term expected real rate of return by asset class. The rate of return was calculated using the capital market assumptions applied to determine the discount rate and asset allocation.
Asset Class
New
Strategic Allocation
Real ReturnYears 1 –
10(a) Real Return Years 11+(b)
Global Equity 47.00% 4.90% 5.38%Fixed Income 19.00% 0.80% 2.27%Inflation Assets 6.00% 0.60% 1.39%Private Equity 12.00% 6.60% 6.63%Real Estate 11.00% 2.80% 5.21%Infrastructure and Forestland 3.00% 3.90% 5.36%Liquidity 2.00% -0.40% -0.90%
Total 100.00% (a) An expected inflation of 2.5% was used for this period.(b) An expected inflation of 3.0% was used for this period.

SONOMA COUNTY JUNIOR COLLEGE DISTRICT
NOTES TO THE FINANCIAL STATEMENTS YEAR ENDED JUNE 30, 2018
39
Pension Liabilities, Pension Expense, and Deferred Outflows/Inflows of Resources Related to Pensions
As of June 30, 2018, the District reported a liability for its proportionate share of the net pension liability that reflected a reduction for the State’s pension support provided to the District. The amount recognized by the District as its proportionate share of the net pension liability, the related State support, and the total portion of the net pension liability that was associated with the District were as follows:
District’s proportionate share of the net pension liability: CalSTRS Plan
$ 73,984,000
CalPERS Plan 66,759,836Total District net pension liability 140,743,836
State’s proportionate share of CalSTRS net pension liability associated with the District 43,783,412
Total $ 184,527,248
The District’s net pension liability is measured as the proportionate share of each Plan’s net pension liability. The net pension liabilities of the Plans are measured as of June 30, 2017, and calculated by reducing the total pension liability of each Plan by the respective Plan’s fiduciary net position. The District’s proportion of each Plan’s net pension liability was based on the ratio of the District’s actual employer contributions in the measurement period to the total actual employer and State contributions received by the respective Plan in the measurement period. The District’s proportionate share of the net pension liability as of June 30, 2017, was 0.080% and 0.2797% for the CalSTRS and CalPERS Plans, respectively, which was a decrease of 0.003% and an increase of 0.0005%, respectively, from its proportion measured as of June 30, 2016 for CalSTRS and CalPERS Plans, respectively.
For the measurement period ended June 30, 2017, the District recognized pension expense of $23,594,115 and revenue of $4,414,473 for support provided by the State. At June 30, 2018, the District reported deferred outflows of resources and deferred inflows of resources related to pensions from the following sources:
Deferred
Outflows of Resources
Deferred Inflows of Resources
Differences between expected and actual experience $ 2,665,330 $ (1,290,400)Changes in assumptions 23,457,724 (786,015)Changes in proportion 472,692 (3,885,283)Change in proportionate share of contributions (312,234)Net differences between projected and actual investment
earnings of pension plan investments
2,309,434 (1,970,400)District contributions subsequent to measurement date 11,881,163
Total $ 40,786,343 $ (8,244,332)
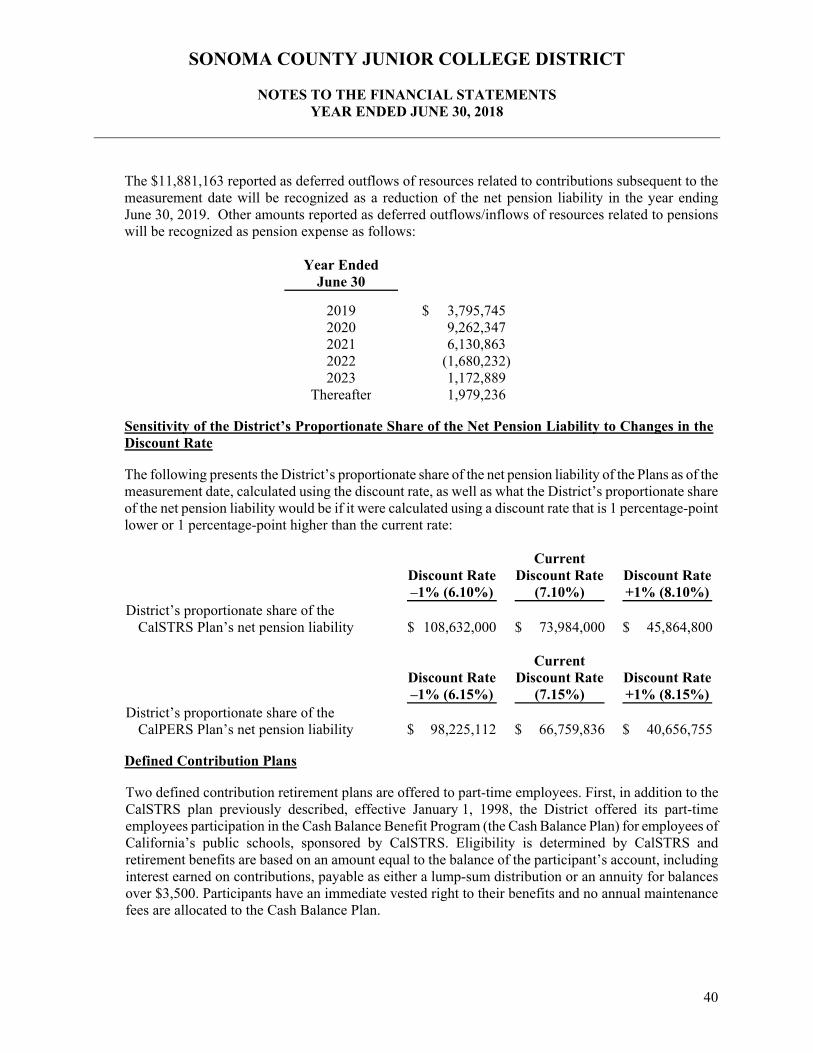
SONOMA COUNTY JUNIOR COLLEGE DISTRICT
NOTES TO THE FINANCIAL STATEMENTS YEAR ENDED JUNE 30, 2018
40
The $11,881,163 reported as deferred outflows of resources related to contributions subsequent to the measurement date will be recognized as a reduction of the net pension liability in the year ending June 30, 2019. Other amounts reported as deferred outflows/inflows of resources related to pensions will be recognized as pension expense as follows:
Year Ended
June 30
2019 $ 3,795,7452020 9,262,3472021 6,130,8632022 (1,680,232)2023 1,172,889
Thereafter 1,979,236
Sensitivity of the District’s Proportionate Share of the Net Pension Liability to Changes in the Discount Rate
The following presents the District’s proportionate share of the net pension liability of the Plans as of the measurement date, calculated using the discount rate, as well as what the District’s proportionate share of the net pension liability would be if it were calculated using a discount rate that is 1 percentage-point lower or 1 percentage-point higher than the current rate:
Discount Rate –1% (6.10%)
Current
Discount Rate (7.10%)
Discount Rate +1% (8.10%)
District’s proportionate share of the CalSTRS Plan’s net pension liability $ 108,632,000 $ 73,984,000 $ 45,864,800
Discount Rate –1% (6.15%)
Current
Discount Rate (7.15%)
Discount Rate +1% (8.15%)
District’s proportionate share of the CalPERS Plan’s net pension liability $ 98,225,112 $ 66,759,836 $ 40,656,755
Defined Contribution Plans
Two defined contribution retirement plans are offered to part-time employees. First, in addition to the CalSTRS plan previously described, effective January 1, 1998, the District offered its part-time employees participation in the Cash Balance Benefit Program (the Cash Balance Plan) for employees of California’s public schools, sponsored by CalSTRS. Eligibility is determined by CalSTRS and retirement benefits are based on an amount equal to the balance of the participant’s account, including interest earned on contributions, payable as either a lump-sum distribution or an annuity for balances over $3,500. Participants have an immediate vested right to their benefits and no annual maintenance fees are allocated to the Cash Balance Plan.
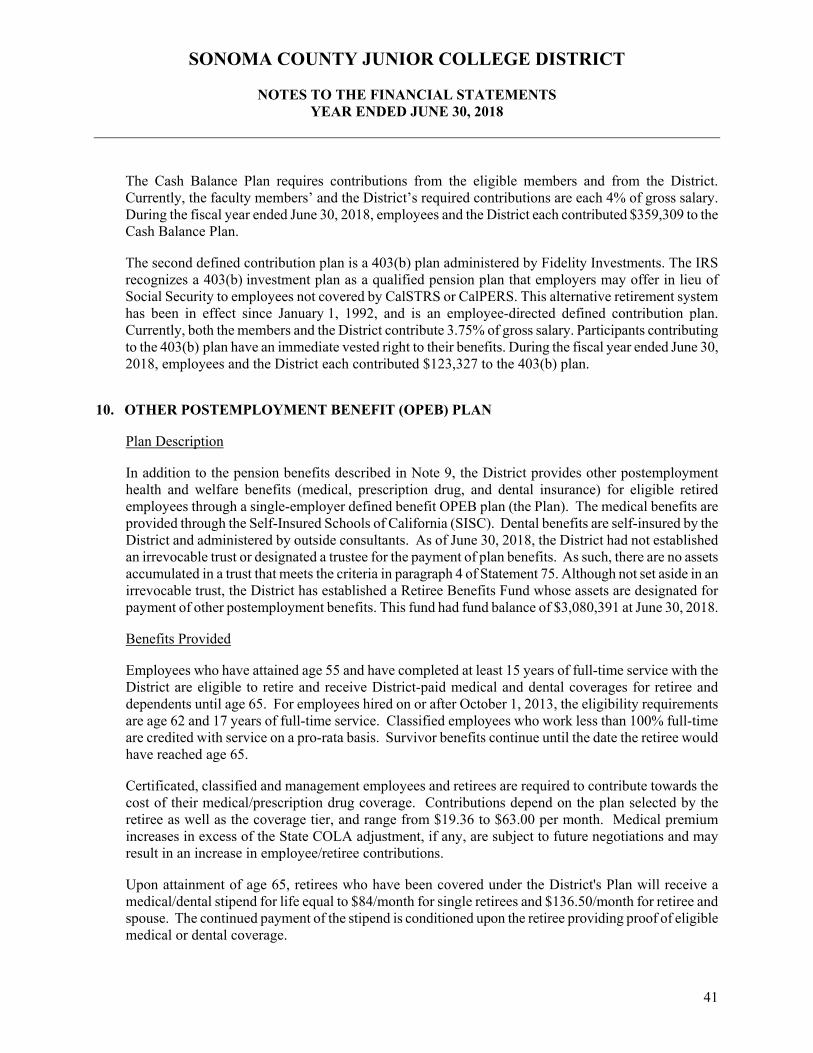
SONOMA COUNTY JUNIOR COLLEGE DISTRICT
NOTES TO THE FINANCIAL STATEMENTS YEAR ENDED JUNE 30, 2018
41
The Cash Balance Plan requires contributions from the eligible members and from the District. Currently, the faculty members’ and the District’s required contributions are each 4% of gross salary. During the fiscal year ended June 30, 2018, employees and the District each contributed $359,309 to the Cash Balance Plan.
The second defined contribution plan is a 403(b) plan administered by Fidelity Investments. The IRS recognizes a 403(b) investment plan as a qualified pension plan that employers may offer in lieu of Social Security to employees not covered by CalSTRS or CalPERS. This alternative retirement system has been in effect since January 1, 1992, and is an employee-directed defined contribution plan. Currently, both the members and the District contribute 3.75% of gross salary. Participants contributing to the 403(b) plan have an immediate vested right to their benefits. During the fiscal year ended June 30, 2018, employees and the District each contributed $123,327 to the 403(b) plan.
10. OTHER POSTEMPLOYMENT BENEFIT (OPEB) PLAN
Plan Description
In addition to the pension benefits described in Note 9, the District provides other postemployment health and welfare benefits (medical, prescription drug, and dental insurance) for eligible retired employees through a single-employer defined benefit OPEB plan (the Plan). The medical benefits are provided through the Self-Insured Schools of California (SISC). Dental benefits are self-insured by the District and administered by outside consultants. As of June 30, 2018, the District had not established an irrevocable trust or designated a trustee for the payment of plan benefits. As such, there are no assets accumulated in a trust that meets the criteria in paragraph 4 of Statement 75. Although not set aside in an irrevocable trust, the District has established a Retiree Benefits Fund whose assets are designated for payment of other postemployment benefits. This fund had fund balance of $3,080,391 at June 30, 2018.
Benefits Provided
Employees who have attained age 55 and have completed at least 15 years of full-time service with the District are eligible to retire and receive District-paid medical and dental coverages for retiree and dependents until age 65. For employees hired on or after October 1, 2013, the eligibility requirements are age 62 and 17 years of full-time service. Classified employees who work less than 100% full-time are credited with service on a pro-rata basis. Survivor benefits continue until the date the retiree would have reached age 65.
Certificated, classified and management employees and retirees are required to contribute towards the cost of their medical/prescription drug coverage. Contributions depend on the plan selected by the retiree as well as the coverage tier, and range from $19.36 to $63.00 per month. Medical premium increases in excess of the State COLA adjustment, if any, are subject to future negotiations and may result in an increase in employee/retiree contributions.
Upon attainment of age 65, retirees who have been covered under the District's Plan will receive a medical/dental stipend for life equal to $84/month for single retirees and $136.50/month for retiree and spouse. The continued payment of the stipend is conditioned upon the retiree providing proof of eligible medical or dental coverage.
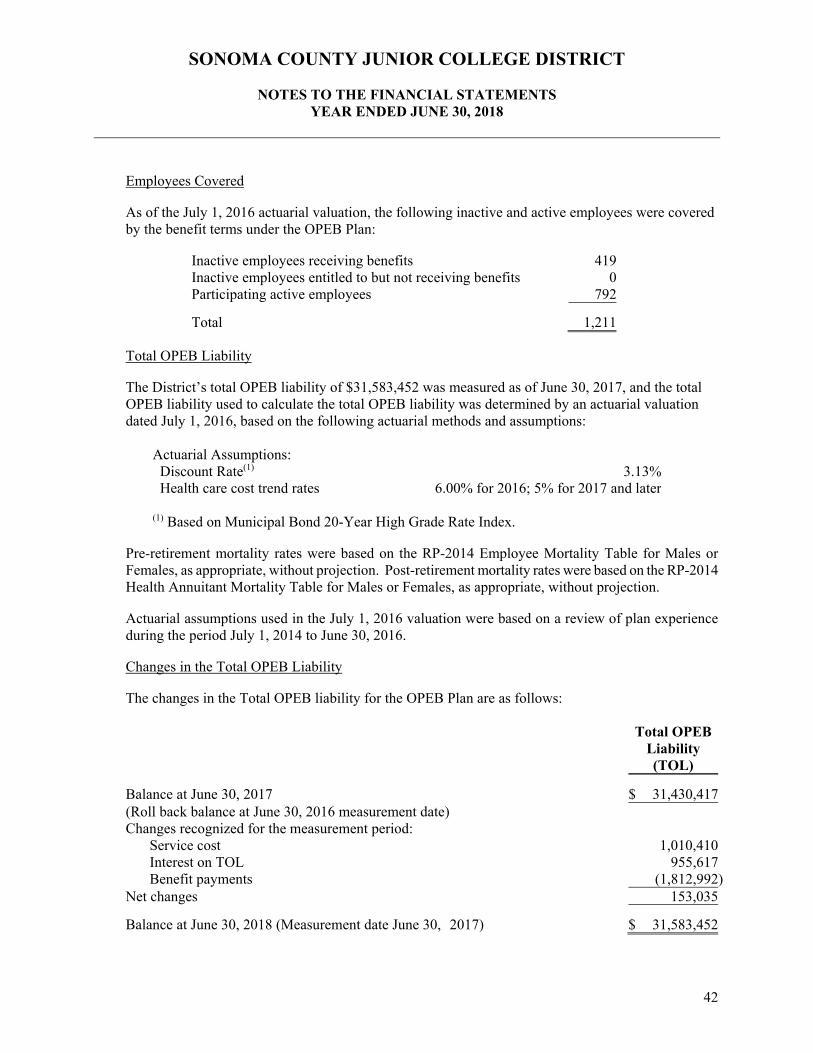
SONOMA COUNTY JUNIOR COLLEGE DISTRICT
NOTES TO THE FINANCIAL STATEMENTS YEAR ENDED JUNE 30, 2018
42
Employees Covered
As of the July 1, 2016 actuarial valuation, the following inactive and active employees were covered by the benefit terms under the OPEB Plan:
Inactive employees receiving benefits 419Inactive employees entitled to but not receiving benefits 0Participating active employees 792
Total 1,211
Total OPEB Liability
The District’s total OPEB liability of $31,583,452 was measured as of June 30, 2017, and the total OPEB liability used to calculate the total OPEB liability was determined by an actuarial valuation dated July 1, 2016, based on the following actuarial methods and assumptions:
Actuarial Assumptions: Discount Rate(1) 3.13% Health care cost trend rates 6.00% for 2016; 5% for 2017 and later (1) Based on Municipal Bond 20-Year High Grade Rate Index.
Pre-retirement mortality rates were based on the RP-2014 Employee Mortality Table for Males or Females, as appropriate, without projection. Post-retirement mortality rates were based on the RP-2014 Health Annuitant Mortality Table for Males or Females, as appropriate, without projection.
Actuarial assumptions used in the July 1, 2016 valuation were based on a review of plan experience during the period July 1, 2014 to June 30, 2016.
Changes in the Total OPEB Liability
The changes in the Total OPEB liability for the OPEB Plan are as follows: Total OPEB
Liability (TOL)
Balance at June 30, 2017 $ 31,430,417(Roll back balance at June 30, 2016 measurement date) Changes recognized for the measurement period:
Service cost 1,010,410Interest on TOL 955,617Benefit payments (1,812,992)
Net changes 153,035
Balance at June 30, 2018 (Measurement date June 30, 2017) $ 31,583,452
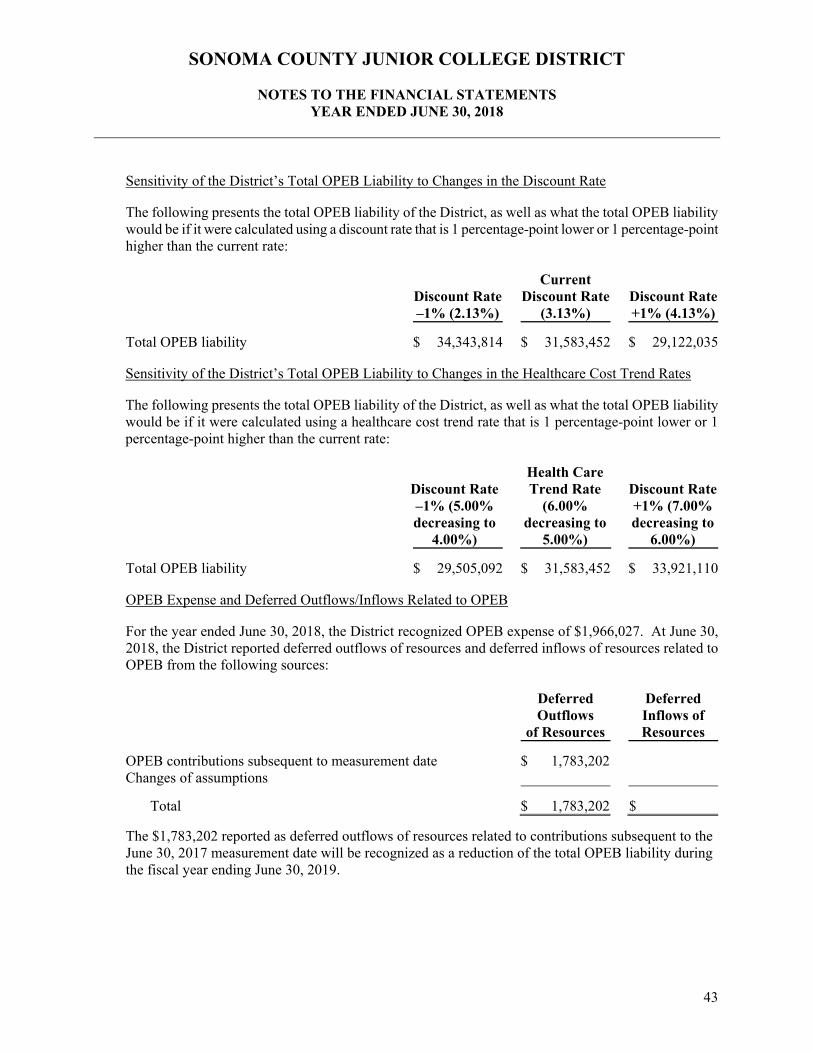
SONOMA COUNTY JUNIOR COLLEGE DISTRICT
NOTES TO THE FINANCIAL STATEMENTS YEAR ENDED JUNE 30, 2018
43
Sensitivity of the District’s Total OPEB Liability to Changes in the Discount Rate
The following presents the total OPEB liability of the District, as well as what the total OPEB liability would be if it were calculated using a discount rate that is 1 percentage-point lower or 1 percentage-point higher than the current rate:
Discount Rate –1% (2.13%)
Current
Discount Rate (3.13%)
Discount Rate +1% (4.13%)
Total OPEB liability $ 34,343,814 $ 31,583,452 $ 29,122,035
Sensitivity of the District’s Total OPEB Liability to Changes in the Healthcare Cost Trend Rates
The following presents the total OPEB liability of the District, as well as what the total OPEB liability would be if it were calculated using a healthcare cost trend rate that is 1 percentage-point lower or 1 percentage-point higher than the current rate:
Discount Rate –1% (5.00% decreasing to
4.00%)
Health Care Trend Rate
(6.00% decreasing to
5.00%)
Discount Rate +1% (7.00% decreasing to
6.00%)
Total OPEB liability $ 29,505,092 $ 31,583,452 $ 33,921,110
OPEB Expense and Deferred Outflows/Inflows Related to OPEB
For the year ended June 30, 2018, the District recognized OPEB expense of $1,966,027. At June 30, 2018, the District reported deferred outflows of resources and deferred inflows of resources related to OPEB from the following sources:
Deferred
Outflows of Resources
Deferred Inflows of Resources
OPEB contributions subsequent to measurement date $ 1,783,202 Changes of assumptions
Total $ 1,783,202 $
The $1,783,202 reported as deferred outflows of resources related to contributions subsequent to the June 30, 2017 measurement date will be recognized as a reduction of the total OPEB liability during the fiscal year ending June 30, 2019.
REQUIRED SUPPLEMENTARY INFORMATION SECTION
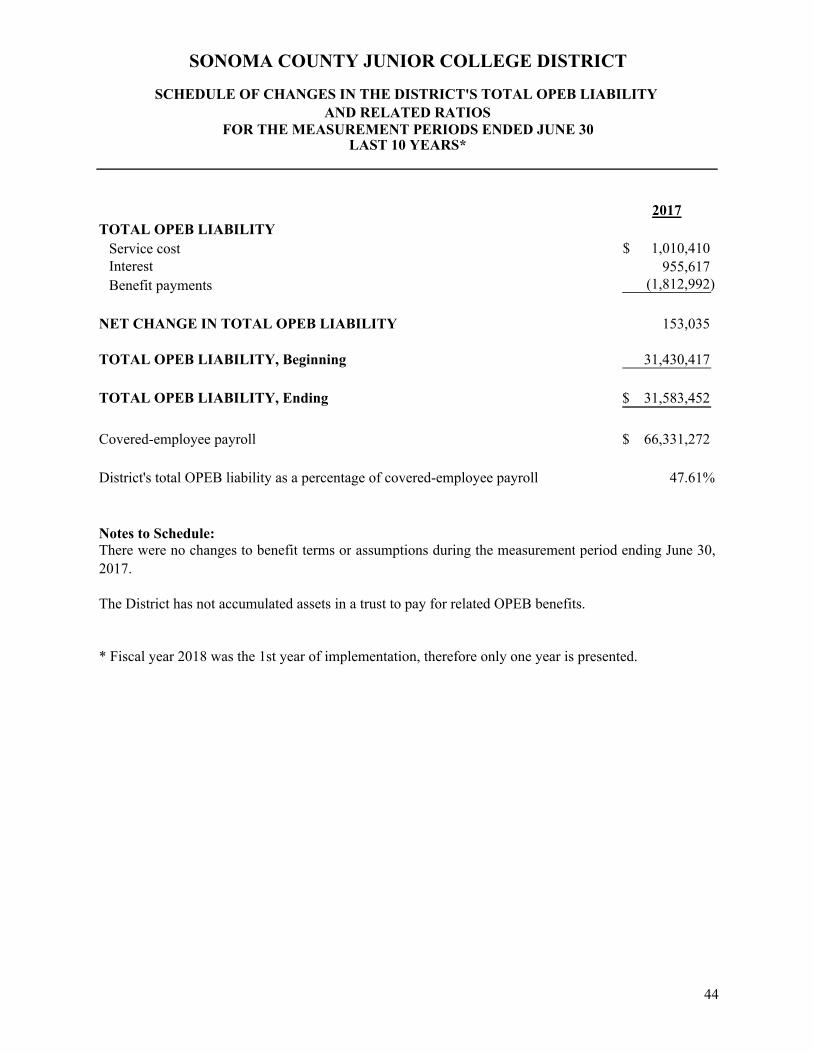
2017TOTAL OPEB LIABILITY
Service cost 1,010,410$ Interest 955,617 Benefit payments (1,812,992)
NET CHANGE IN TOTAL OPEB LIABILITY 153,035
TOTAL OPEB LIABILITY, Beginning 31,430,417
TOTAL OPEB LIABILITY, Ending 31,583,452$
Covered-employee payroll 66,331,272$
District's total OPEB liability as a percentage of covered-employee payroll 47.61%
Notes to Schedule:
The District has not accumulated assets in a trust to pay for related OPEB benefits.
* Fiscal year 2018 was the 1st year of implementation, therefore only one year is presented.
There were no changes to benefit terms or assumptions during the measurement period ending June 30,2017.
SONOMA COUNTY JUNIOR COLLEGE DISTRICT
SCHEDULE OF CHANGES IN THE DISTRICT'S TOTAL OPEB LIABILITY AND RELATED RATIOS
FOR THE MEASUREMENT PERIODS ENDED JUNE 30LAST 10 YEARS*
44
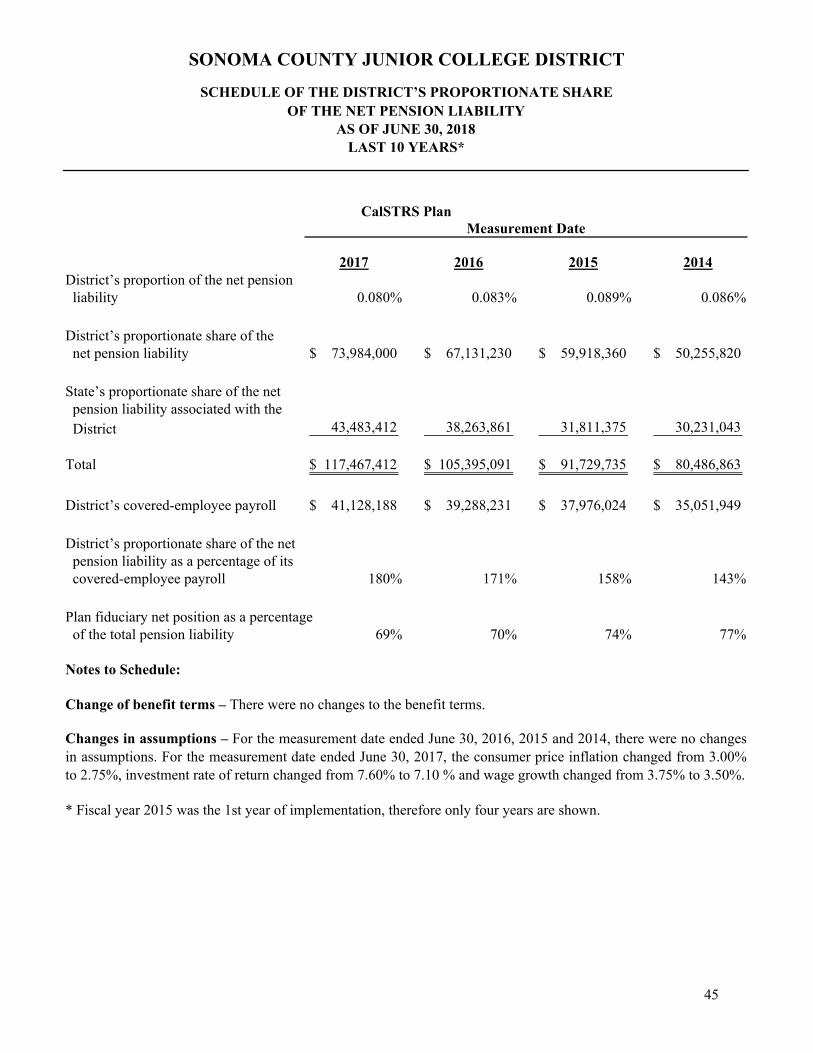
2017 2016 2015 2014District’s proportion of the net pension liability 0.080% 0.083% 0.089% 0.086%
District’s proportionate share of the net pension liability 73,984,000$ 67,131,230$ 59,918,360$ 50,255,820$
State’s proportionate share of the net pension liability associated with the District 43,483,412 38,263,861 31,811,375 30,231,043
Total 117,467,412$ 105,395,091$ 91,729,735$ 80,486,863$
District’s covered-employee payroll 41,128,188$ 39,288,231$ 37,976,024$ 35,051,949$
District’s proportionate share of the net pension liability as a percentage of its covered-employee payroll 180% 171% 158% 143%
Plan fiduciary net position as a percentage of the total pension liability 69% 70% 74% 77%
Notes to Schedule:
Change of benefit terms – There were no changes to the benefit terms.
* Fiscal year 2015 was the 1st year of implementation, therefore only four years are shown.
Changes in assumptions – For the measurement date ended June 30, 2016, 2015 and 2014, there were no changesin assumptions. For the measurement date ended June 30, 2017, the consumer price inflation changed from 3.00%to 2.75%, investment rate of return changed from 7.60% to 7.10 % and wage growth changed from 3.75% to 3.50%.
Measurement DateCalSTRS Plan
SONOMA COUNTY JUNIOR COLLEGE DISTRICT
SCHEDULE OF THE DISTRICT’S PROPORTIONATE SHAREOF THE NET PENSION LIABILITY
AS OF JUNE 30, 2018LAST 10 YEARS*
45
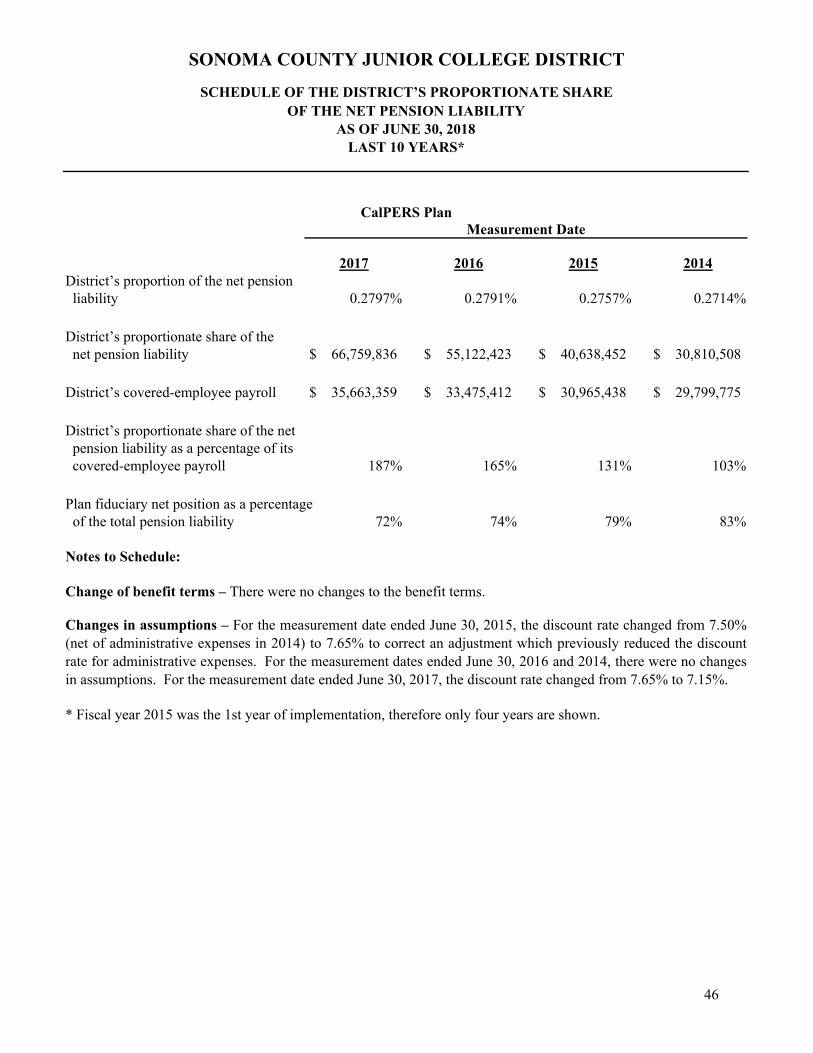
2017 2016 2015 2014District’s proportion of the net pension liability 0.2797% 0.2791% 0.2757% 0.2714%
District’s proportionate share of the net pension liability 66,759,836$ 55,122,423$ 40,638,452$ 30,810,508$
District’s covered-employee payroll 35,663,359$ 33,475,412$ 30,965,438$ 29,799,775$
District’s proportionate share of the net pension liability as a percentage of its covered-employee payroll 187% 165% 131% 103%
Plan fiduciary net position as a percentage of the total pension liability 72% 74% 79% 83%
Notes to Schedule:
Change of benefit terms – There were no changes to the benefit terms.
* Fiscal year 2015 was the 1st year of implementation, therefore only four years are shown.
CalPERS PlanMeasurement Date
Changes in assumptions – For the measurement date ended June 30, 2015, the discount rate changed from 7.50%(net of administrative expenses in 2014) to 7.65% to correct an adjustment which previously reduced the discountrate for administrative expenses. For the measurement dates ended June 30, 2016 and 2014, there were no changesin assumptions. For the measurement date ended June 30, 2017, the discount rate changed from 7.65% to 7.15%.
SONOMA COUNTY JUNIOR COLLEGE DISTRICT
SCHEDULE OF THE DISTRICT’S PROPORTIONATE SHAREOF THE NET PENSION LIABILITY
AS OF JUNE 30, 2018LAST 10 YEARS*
46
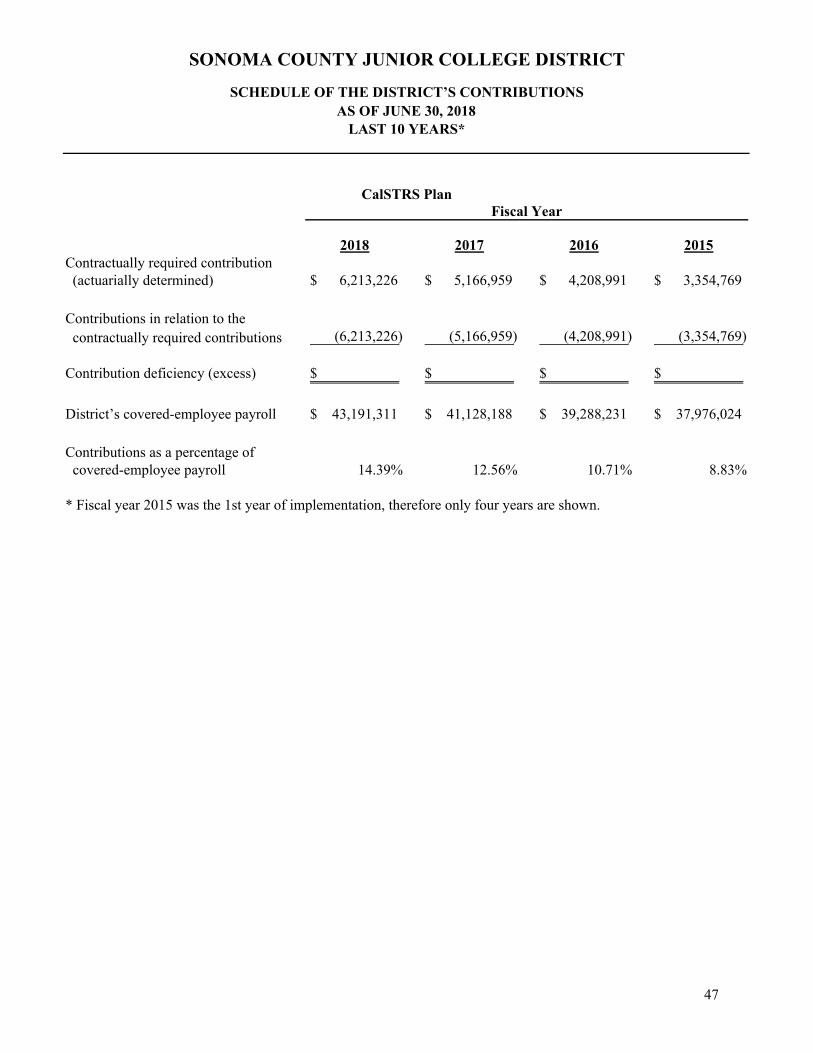
2018 2017 2016 2015Contractually required contribution (actuarially determined) 6,213,226$ 5,166,959$ 4,208,991$ 3,354,769$
Contributions in relation to the contractually required contributions (6,213,226) (5,166,959) (4,208,991) (3,354,769)
Contribution deficiency (excess) $ $ $ $
District’s covered-employee payroll 43,191,311$ 41,128,188$ 39,288,231$ 37,976,024$
Contributions as a percentage of covered-employee payroll 14.39% 12.56% 10.71% 8.83%
* Fiscal year 2015 was the 1st year of implementation, therefore only four years are shown.
Fiscal Year
SONOMA COUNTY JUNIOR COLLEGE DISTRICT
SCHEDULE OF THE DISTRICT’S CONTRIBUTIONSAS OF JUNE 30, 2018
LAST 10 YEARS*
CalSTRS Plan
47

2018 2017 2016 2015Contractually required contribution (actuarially determined) 5,667,937$ 4,952,867$ 3,965,995$ 3,592,525$
Contributions in relation to the contractually required contributions (5,667,937) (4,952,867) (3,965,995) (3,592,525)
Contribution deficiency (excess) $ $ $ $
District’s covered-employee payroll 36,703,058$ 35,663,359$ 33,475,412$ 30,965,438$
Contributions as a percentage of covered-employee payroll 15.44% 13.89% 11.85% 11.60%
* Fiscal year 2015 was the 1st year of implementation, therefore only four years are shown.
Fiscal Year
SONOMA COUNTY JUNIOR COLLEGE DISTRICT
SCHEDULE OF THE DISTRICT’S CONTRIBUTIONSAS OF JUNE 30, 2018
LAST 10 YEARS*
CalPERS Plan
48
SUPPLEMENTARY INFORMATION SECTION
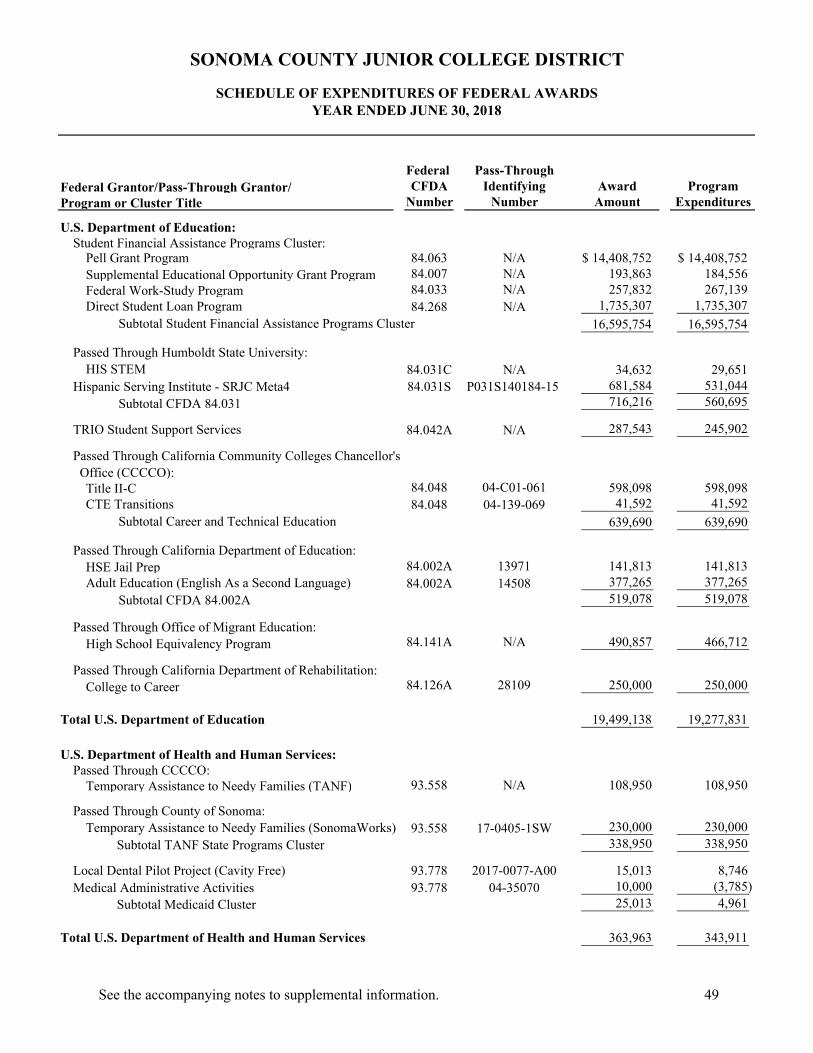
Federal Pass-ThroughFederal Grantor/Pass-Through Grantor/ CFDA Identifying Award ProgramProgram or Cluster Title Number Number Amount Expenditures
U.S. Department of Education:Student Financial Assistance Programs Cluster:
Pell Grant Program 84.063 N/A 14,408,752$ 14,408,752$ Supplemental Educational Opportunity Grant Program 84.007 N/A 193,863 184,556 Federal Work-Study Program 84.033 N/A 257,832 267,139 Direct Student Loan Program 84.268 N/A 1,735,307 1,735,307
Subtotal Student Financial Assistance Programs Cluster 16,595,754 16,595,754
Passed Through Humboldt State University:HIS STEM 84.031C N/A 34,632 29,651
Hispanic Serving Institute - SRJC Meta4 84.031S P031S140184-15 681,584 531,044 Subtotal CFDA 84.031 716,216 560,695
TRIO Student Support Services 84.042A N/A 287,543 245,902
Passed Through California Community Colleges Chancellor's Office (CCCCO):
Title II-C 84.048 04-C01-061 598,098 598,098 CTE Transitions 84.048 04-139-069 41,592 41,592
Subtotal Career and Technical Education 639,690 639,690
Passed Through California Department of Education:HSE Jail Prep 84.002A 13971 141,813 141,813 Adult Education (English As a Second Language) 84.002A 14508 377,265 377,265
Subtotal CFDA 84.002A 519,078 519,078
Passed Through Office of Migrant Education:High School Equivalency Program 84.141A N/A 490,857 466,712
Passed Through California Department of Rehabilitation:College to Career 84.126A 28109 250,000 250,000
Total U.S. Department of Education 19,499,138 19,277,831
U.S. Department of Health and Human Services:Passed Through CCCCO:
Temporary Assistance to Needy Families (TANF) 93.558 N/A 108,950 108,950
Passed Through County of Sonoma:Temporary Assistance to Needy Families (SonomaWorks) 93.558 17-0405-1SW 230,000 230,000
Subtotal TANF State Programs Cluster 338,950 338,950
Local Dental Pilot Project (Cavity Free) 93.778 2017-0077-A00 15,013 8,746 Medical Administrative Activities 93.778 04-35070 10,000 (3,785)
Subtotal Medicaid Cluster 25,013 4,961
Total U.S. Department of Health and Human Services 363,963 343,911
SONOMA COUNTY JUNIOR COLLEGE DISTRICT
SCHEDULE OF EXPENDITURES OF FEDERAL AWARDSYEAR ENDED JUNE 30, 2018
See the accompanying notes to supplemental information. 49
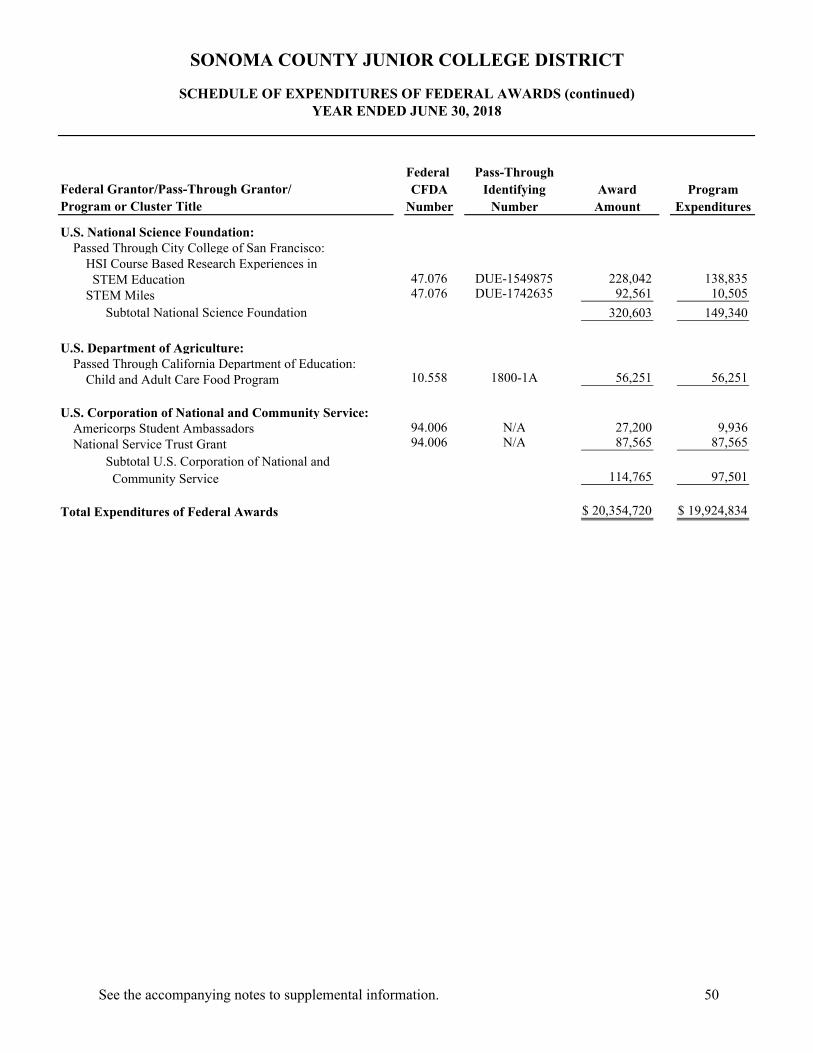
Federal Pass-ThroughFederal Grantor/Pass-Through Grantor/ CFDA Identifying Award ProgramProgram or Cluster Title Number Number Amount Expenditures
U.S. National Science Foundation:Passed Through City College of San Francisco:
HSI Course Based Research Experiences in STEM Education 47.076 DUE-1549875 228,042 138,835 STEM Miles 47.076 DUE-1742635 92,561 10,505
Subtotal National Science Foundation 320,603 149,340
U.S. Department of Agriculture:Passed Through California Department of Education:
Child and Adult Care Food Program 10.558 1800-1A 56,251 56,251
U.S. Corporation of National and Community Service:Americorps Student Ambassadors 94.006 N/A 27,200 9,936 National Service Trust Grant 94.006 N/A 87,565 87,565
Subtotal U.S. Corporation of National and Community Service 114,765 97,501
Total Expenditures of Federal Awards 20,354,720$ 19,924,834$
YEAR ENDED JUNE 30, 2018
SONOMA COUNTY JUNIOR COLLEGE DISTRICT
SCHEDULE OF EXPENDITURES OF FEDERAL AWARDS (continued)
See the accompanying notes to supplemental information. 50
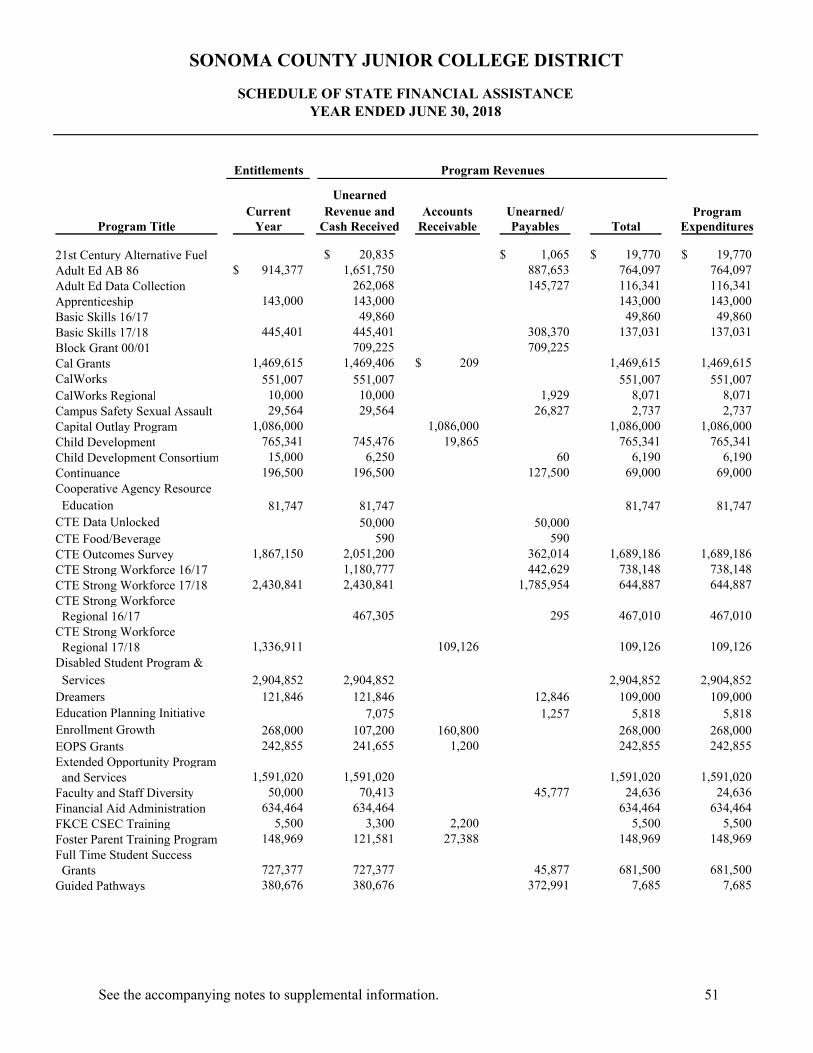
Entitlements
UnearnedCurrent Revenue and Accounts Unearned/ Program
Program Title Year Cash Received Receivable Payables Total Expenditures
21st Century Alternative Fuel 20,835$ 1,065$ 19,770$ 19,770$ Adult Ed AB 86 914,377$ 1,651,750 887,653 764,097 764,097 Adult Ed Data Collection 262,068 145,727 116,341 116,341 Apprenticeship 143,000 143,000 143,000 143,000 Basic Skills 16/17 49,860 49,860 49,860 Basic Skills 17/18 445,401 445,401 308,370 137,031 137,031 Block Grant 00/01 709,225 709,225 Cal Grants 1,469,615 1,469,406 209$ 1,469,615 1,469,615 CalWorks 551,007 551,007 551,007 551,007 CalWorks Regional 10,000 10,000 1,929 8,071 8,071 Campus Safety Sexual Assault 29,564 29,564 26,827 2,737 2,737 Capital Outlay Program 1,086,000 1,086,000 1,086,000 1,086,000 Child Development 765,341 745,476 19,865 765,341 765,341 Child Development Consortium 15,000 6,250 60 6,190 6,190 Continuance 196,500 196,500 127,500 69,000 69,000 Cooperative Agency Resource Education 81,747 81,747 81,747 81,747 CTE Data Unlocked 50,000 50,000 CTE Food/Beverage 590 590 CTE Outcomes Survey 1,867,150 2,051,200 362,014 1,689,186 1,689,186 CTE Strong Workforce 16/17 1,180,777 442,629 738,148 738,148 CTE Strong Workforce 17/18 2,430,841 2,430,841 1,785,954 644,887 644,887 CTE Strong Workforce Regional 16/17 467,305 295 467,010 467,010 CTE Strong Workforce Regional 17/18 1,336,911 109,126 109,126 109,126 Disabled Student Program & Services 2,904,852 2,904,852 2,904,852 2,904,852 Dreamers 121,846 121,846 12,846 109,000 109,000 Education Planning Initiative 7,075 1,257 5,818 5,818 Enrollment Growth 268,000 107,200 160,800 268,000 268,000 EOPS Grants 242,855 241,655 1,200 242,855 242,855 Extended Opportunity Program and Services 1,591,020 1,591,020 1,591,020 1,591,020 Faculty and Staff Diversity 50,000 70,413 45,777 24,636 24,636 Financial Aid Administration 634,464 634,464 634,464 634,464 FKCE CSEC Training 5,500 3,300 2,200 5,500 5,500 Foster Parent Training Program 148,969 121,581 27,388 148,969 148,969 Full Time Student Success Grants 727,377 727,377 45,877 681,500 681,500 Guided Pathways 380,676 380,676 372,991 7,685 7,685
SONOMA COUNTY JUNIOR COLLEGE DISTRICT
SCHEDULE OF STATE FINANCIAL ASSISTANCEYEAR ENDED JUNE 30, 2018
Program Revenues
See the accompanying notes to supplemental information. 51
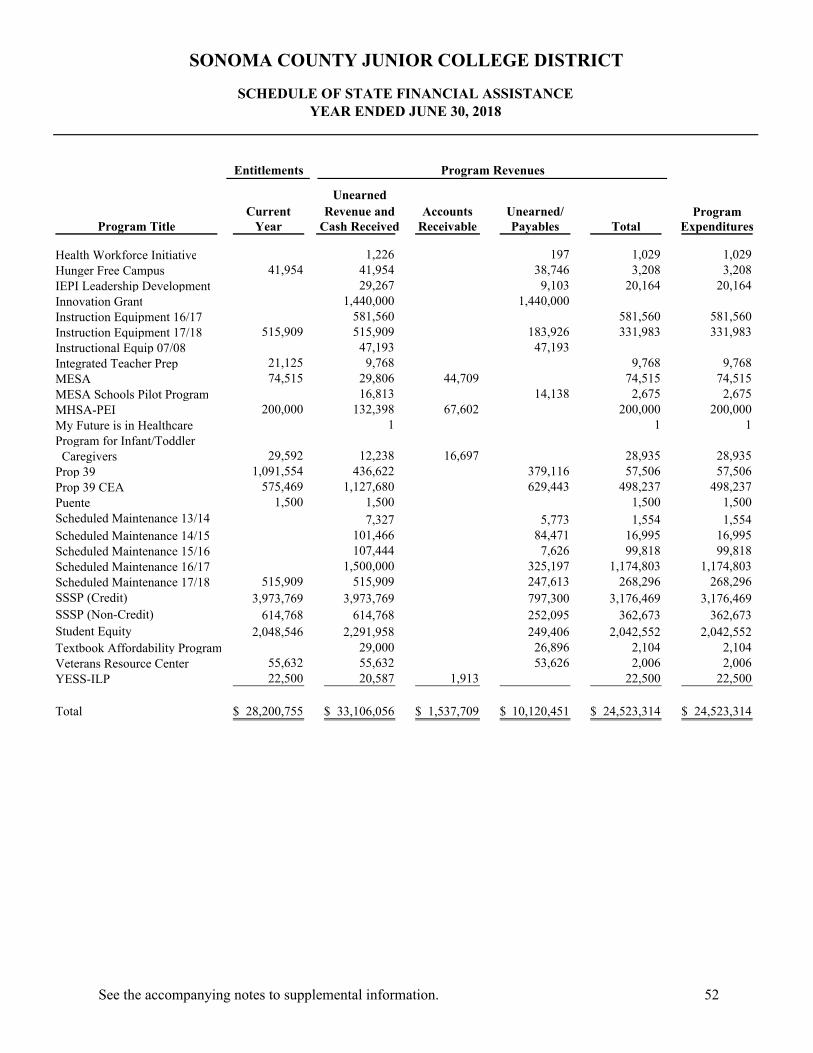
Entitlements
UnearnedCurrent Revenue and Accounts Unearned/ Program
Program Title Year Cash Received Receivable Payables Total Expenditures
SONOMA COUNTY JUNIOR COLLEGE DISTRICT
SCHEDULE OF STATE FINANCIAL ASSISTANCEYEAR ENDED JUNE 30, 2018
Program Revenues
Health Workforce Initiative 1,226 197 1,029 1,029 Hunger Free Campus 41,954 41,954 38,746 3,208 3,208 IEPI Leadership Development 29,267 9,103 20,164 20,164 Innovation Grant 1,440,000 1,440,000 Instruction Equipment 16/17 581,560 581,560 581,560 Instruction Equipment 17/18 515,909 515,909 183,926 331,983 331,983 Instructional Equip 07/08 47,193 47,193 Integrated Teacher Prep 21,125 9,768 9,768 9,768 MESA 74,515 29,806 44,709 74,515 74,515 MESA Schools Pilot Program 16,813 14,138 2,675 2,675 MHSA-PEI 200,000 132,398 67,602 200,000 200,000 My Future is in Healthcare 1 1 1 Program for Infant/Toddler Caregivers 29,592 12,238 16,697 28,935 28,935 Prop 39 1,091,554 436,622 379,116 57,506 57,506 Prop 39 CEA 575,469 1,127,680 629,443 498,237 498,237 Puente 1,500 1,500 1,500 1,500 Scheduled Maintenance 13/14 7,327 5,773 1,554 1,554 Scheduled Maintenance 14/15 101,466 84,471 16,995 16,995 Scheduled Maintenance 15/16 107,444 7,626 99,818 99,818 Scheduled Maintenance 16/17 1,500,000 325,197 1,174,803 1,174,803 Scheduled Maintenance 17/18 515,909 515,909 247,613 268,296 268,296 SSSP (Credit) 3,973,769 3,973,769 797,300 3,176,469 3,176,469 SSSP (Non-Credit) 614,768 614,768 252,095 362,673 362,673 Student Equity 2,048,546 2,291,958 249,406 2,042,552 2,042,552 Textbook Affordability Program 29,000 26,896 2,104 2,104 Veterans Resource Center 55,632 55,632 53,626 2,006 2,006 YESS-ILP 22,500 20,587 1,913 22,500 22,500
Total 28,200,755$ 33,106,056$ 1,537,709$ 10,120,451$ 24,523,314$ 24,523,314$
See the accompanying notes to supplemental information. 52
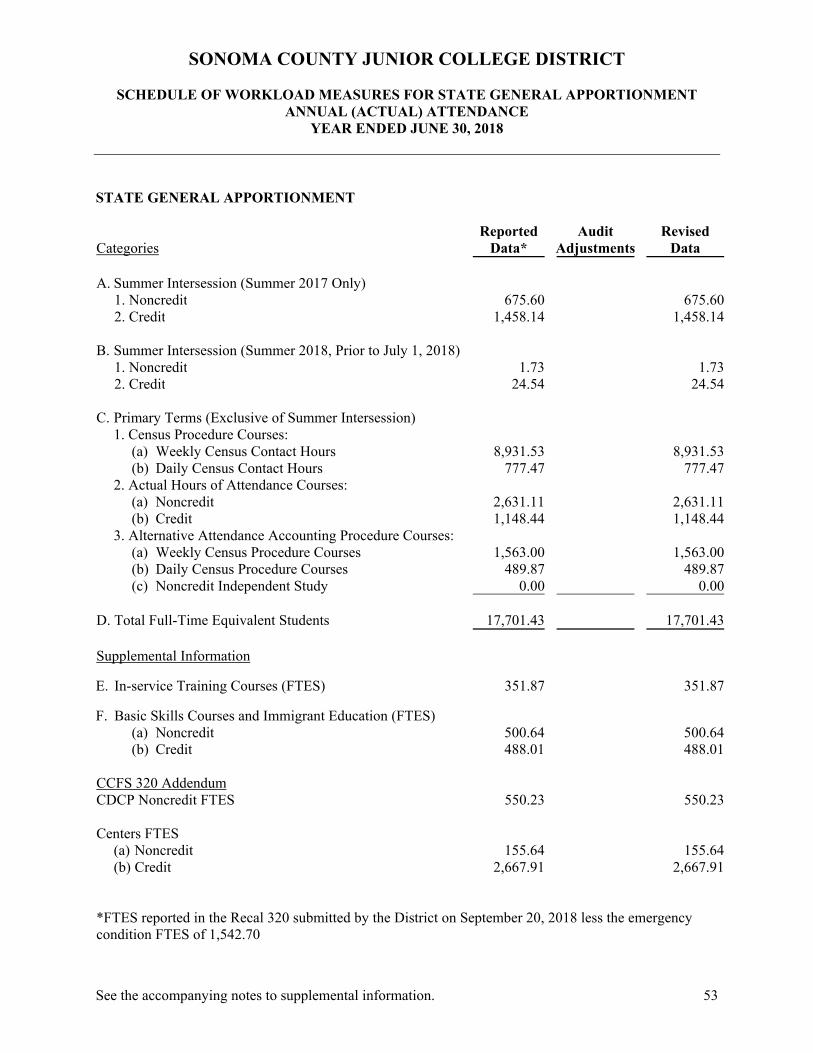
SONOMA COUNTY JUNIOR COLLEGE DISTRICT
SCHEDULE OF WORKLOAD MEASURES FOR STATE GENERAL APPORTIONMENT ANNUAL (ACTUAL) ATTENDANCE
YEAR ENDED JUNE 30, 2018
See the accompanying notes to supplemental information. 53
STATE GENERAL APPORTIONMENT Categories
Reported Data*
Audit Adjustments
Revised
Data A. Summer Intersession (Summer 2017 Only)
1. Noncredit 675.60 675.602. Credit 1,458.14 1,458.14
B. Summer Intersession (Summer 2018, Prior to July 1, 2018)
1. Noncredit 1.73 1.732. Credit 24.54 24.54
C. Primary Terms (Exclusive of Summer Intersession)
1. Census Procedure Courses: (a) Weekly Census Contact Hours 8,931.53 8,931.53(b) Daily Census Contact Hours 777.47 777.47
2. Actual Hours of Attendance Courses:(a) Noncredit 2,631.11 2,631.11(b) Credit 1,148.44 1,148.44
3. Alternative Attendance Accounting Procedure Courses:(a) Weekly Census Procedure Courses 1,563.00 1,563.00(b) Daily Census Procedure Courses 489.87 489.87(c) Noncredit Independent Study 0.00 0.00
D. Total Full-Time Equivalent Students 17,701.43 17,701.43
Supplemental Information
E. In-service Training Courses (FTES) 351.87 351.87
F. Basic Skills Courses and Immigrant Education (FTES)(a) Noncredit 500.64 500.64(b) Credit 488.01 488.01
CCFS 320 Addendum CDCP Noncredit FTES 550.23 550.23
Centers FTES
(a) Noncredit 155.64 155.64(b) Credit 2,667.91 2,667.91
*FTES reported in the Recal 320 submitted by the District on September 20, 2018 less the emergency condition FTES of 1,542.70
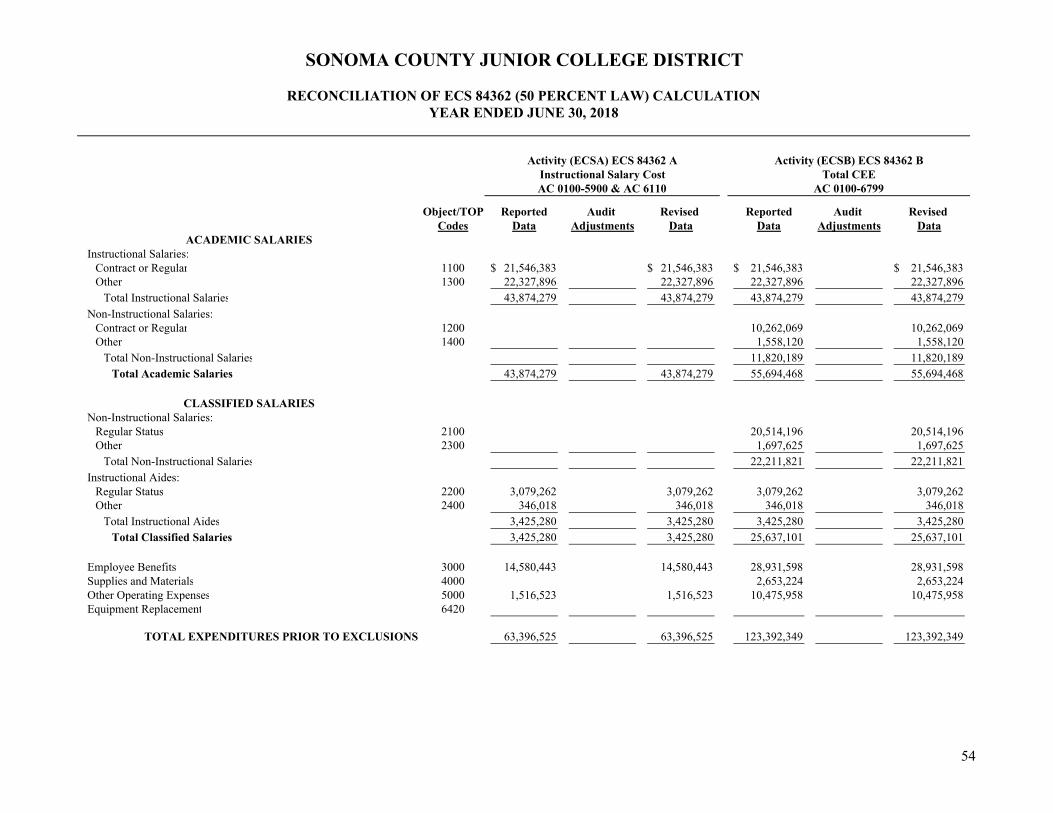
Object/TOP Reported Audit Revised Reported Audit Revised Codes Data Adjustments Data Data Adjustments Data
ACADEMIC SALARIESInstructional Salaries:
Contract or Regular 1100 21,546,383$ 21,546,383$ 21,546,383$ 21,546,383$ Other 1300 22,327,896 22,327,896 22,327,896 22,327,896
Total Instructional Salaries 43,874,279 43,874,279 43,874,279 43,874,279 Non-Instructional Salaries:
Contract or Regular 1200 10,262,069 10,262,069 Other 1400 1,558,120 1,558,120
Total Non-Instructional Salaries 11,820,189 11,820,189 Total Academic Salaries 43,874,279 43,874,279 55,694,468 55,694,468
CLASSIFIED SALARIESNon-Instructional Salaries:
Regular Status 2100 20,514,196 20,514,196 Other 2300 1,697,625 1,697,625
Total Non-Instructional Salaries 22,211,821 22,211,821 Instructional Aides:
Regular Status 2200 3,079,262 3,079,262 3,079,262 3,079,262 Other 2400 346,018 346,018 346,018 346,018
Total Instructional Aides 3,425,280 3,425,280 3,425,280 3,425,280 Total Classified Salaries 3,425,280 3,425,280 25,637,101 25,637,101
Employee Benefits 3000 14,580,443 14,580,443 28,931,598 28,931,598 Supplies and Materials 4000 2,653,224 2,653,224 Other Operating Expenses 5000 1,516,523 1,516,523 10,475,958 10,475,958 Equipment Replacement 6420
TOTAL EXPENDITURES PRIOR TO EXCLUSIONS 63,396,525 63,396,525 123,392,349 123,392,349
Instructional Salary CostAC 0100-5900 & AC 6110
Total CEEAC 0100-6799
SONOMA COUNTY JUNIOR COLLEGE DISTRICT
RECONCILIATION OF ECS 84362 (50 PERCENT LAW) CALCULATIONYEAR ENDED JUNE 30, 2018
Activity (ECSA) ECS 84362 A Activity (ECSB) ECS 84362 B
54
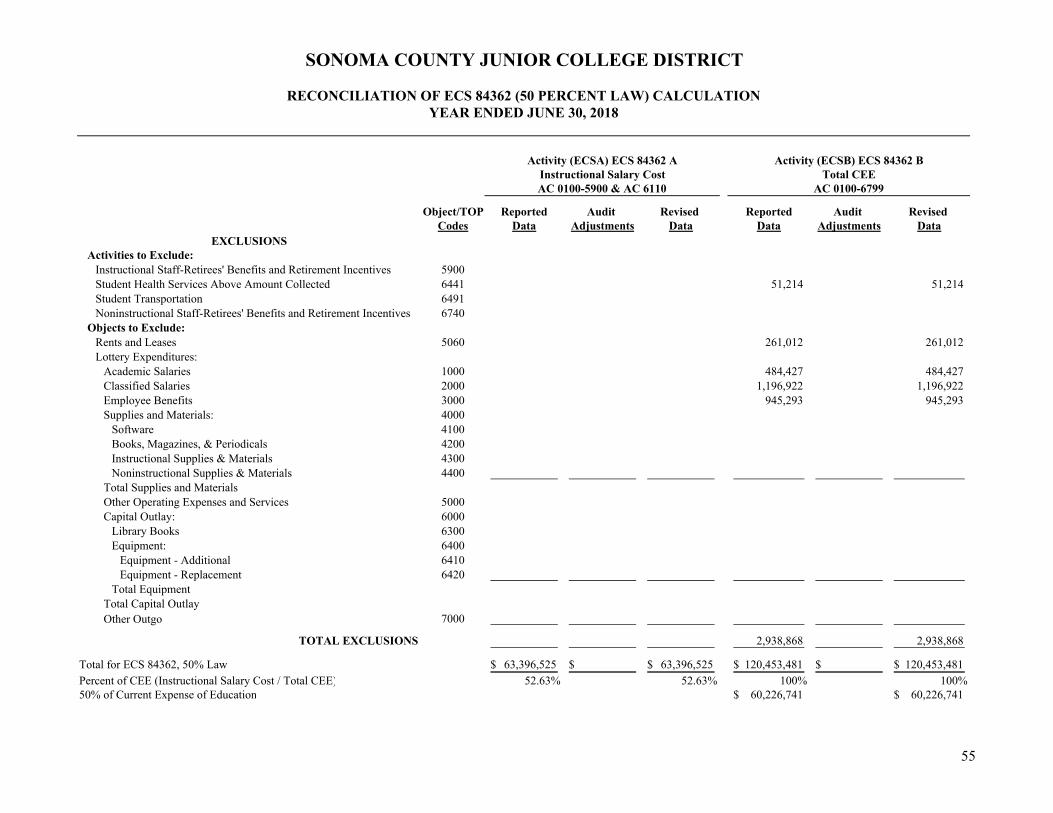
Object/TOP Reported Audit Revised Reported Audit Revised Codes Data Adjustments Data Data Adjustments Data
Instructional Salary CostAC 0100-5900 & AC 6110
Total CEEAC 0100-6799
SONOMA COUNTY JUNIOR COLLEGE DISTRICT
RECONCILIATION OF ECS 84362 (50 PERCENT LAW) CALCULATIONYEAR ENDED JUNE 30, 2018
Activity (ECSA) ECS 84362 A Activity (ECSB) ECS 84362 B
EXCLUSIONSActivities to Exclude:
Instructional Staff-Retirees' Benefits and Retirement Incentives 5900 Student Health Services Above Amount Collected 6441 51,214 51,214 Student Transportation 6491 Noninstructional Staff-Retirees' Benefits and Retirement Incentives 6740
Objects to Exclude: Rents and Leases 5060 261,012 261,012 Lottery Expenditures:
Academic Salaries 1000 484,427 484,427 Classified Salaries 2000 1,196,922 1,196,922 Employee Benefits 3000 945,293 945,293 Supplies and Materials: 4000
Software 4100 Books, Magazines, & Periodicals 4200 Instructional Supplies & Materials 4300 Noninstructional Supplies & Materials 4400
Total Supplies and Materials Other Operating Expenses and Services 5000 Capital Outlay: 6000
Library Books 6300 Equipment: 6400
Equipment - Additional 6410 Equipment - Replacement 6420
Total Equipment Total Capital Outlay Other Outgo 7000
TOTAL EXCLUSIONS 2,938,868 2,938,868
Total for ECS 84362, 50% Law 63,396,525$ $ 63,396,525$ 120,453,481$ $ 120,453,481$ Percent of CEE (Instructional Salary Cost / Total CEE) 52.63% 52.63% 100% 100%50% of Current Expense of Education 60,226,741$ 60,226,741$
55
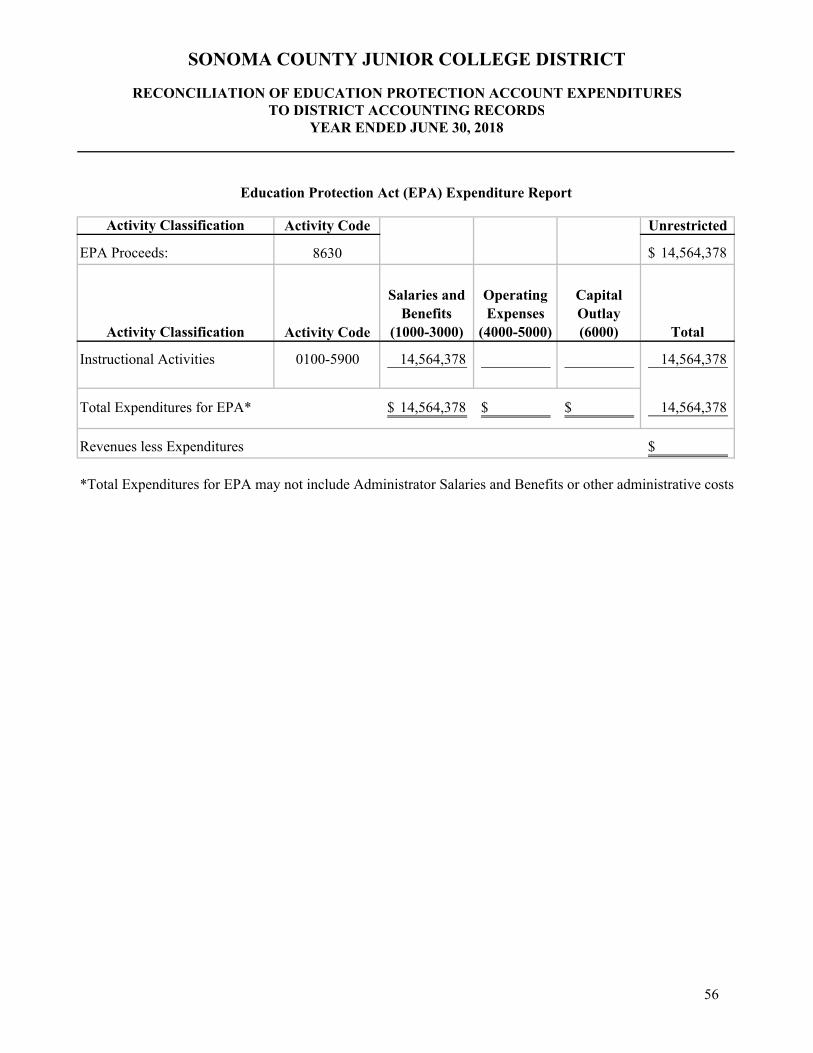
Activity Classification Activity Code Unrestricted
EPA Proceeds: 8630 14,564,378$
Activity Classification Activity Code
Salaries and Benefits
(1000-3000)
Operating Expenses
(4000-5000)
Capital Outlay (6000) Total
Instructional Activities 0100-5900 14,564,378 14,564,378
Total Expenditures for EPA* 14,564,378$ $ $ 14,564,378
Revenues less Expenditures $
*Total Expenditures for EPA may not include Administrator Salaries and Benefits or other administrative costs.
Education Protection Act (EPA) Expenditure Report
SONOMA COUNTY JUNIOR COLLEGE DISTRICT
RECONCILIATION OF EDUCATION PROTECTION ACCOUNT EXPENDITURESTO DISTRICT ACCOUNTING RECORDS
YEAR ENDED JUNE 30, 2018
56

Fund Balance:General Fund 6,971,242$ Revenue Bond Interest and Redemption Fund Child Development Fund Farm Operation Fund 708,809 Revenue Bond Project Fund 45,403 Other Special Revenue Fund 53,946 Capital Outlay Projects Fund 6,049,518 General Obligation Bond Fund 73,312,937 Self-Insurance Fund 581,173 Other Internal Service Fund 3,080,391 Student Financial Aid and Trust Fund Scholarship and Loan Trust Fund Other Trust Fund
Total Fund Balances as reported on the Annual Financial and90,803,419
Net audit adjustments:No adjustments were made to the District's Funds
Total Fund Balance 90,803,419
Reconciliation to Net Position:Restricted Cash and Deposits Held in Escrow 51,028,834 Total OPEB Liability (31,583,452) Interest Payable (4,788,015) Capital Assets, Net 340,742,975 Deferred Charge on Refunding 11,347,594 Deferred Outflows of Resources Related to Pensions 40,786,343 Deferred outflows of Resources Related to OPEB 1,783,202 Net Pension Liability (140,743,836) Bonds Payable (285,175,438) Deferred Inflows of Resources Related to Pensions (8,244,332)
Total Net Position 65,957,294$
SONOMA COUNTY JUNIOR COLLEGE DISTRICT
RECONCILIATION OF GOVERNMENTAL FUNDSTO NET POSITION
YEAR ENDED JUNE 30, 2018
Budget Report (CCFS-311)
See the accompanying notes to supplemental information. 57
SONOMA COUNTY JUNIOR COLLEGE DISTRICT
RECONCILIATION OF ANNUAL FINANCIAL AND BUDGET REPORT (CCFS-311) WITH
AUDITED FINANCIAL STATEMENTS YEAR ENDED JUNE 30, 2018
See the accompanying notes to supplemental information. 58
AUDITOR COMMENTS No adjustments were made to the District’s Fund Financial Statements.
SONOMA COUNTY JUNIOR COLLEGE DISTRICT
NOTES TO SUPPLEMENTARY INFORMATION YEAR ENDED JUNE 30, 2018
59
1. PURPOSE OF SCHEDULES
Schedule of Expenditures of Federal Awards The audit of the District for the year ended June 30, 2018, was conducted in accordance with Title 2 U.S. Code of Federal Regulations Part 200, Uniform Administrative Requirements, Cost Principles, and Audit Requirements for Federal Awards (Uniform Guidance), which requires disclosure of the financial activities of all federally funded programs, the Schedule of Expenditures of Federal Awards was prepared by the District. General – The accompanying Schedule of Expenditures of Federal Awards presents the activity of
all federal award programs of the District. The District reporting entity is defined in Note 1 to the District’s basic financial statements.
Basis of Accounting – The accompanying Schedule of Expenditures of Federal Awards is
presented using the accrual basis of accounting, which is described in Note 2 to the District’s basic financial statements. Negative amounts shown on the Schedule of Expenditures of Federal Awards represent adjustments or credits made in the normal course of business to amounts reported as expenditures in prior years.
Indirect Cost Rate – The District has elected not to use the 10-percent de minimis indirect cost rate
allowed under the Uniform Guidance.
Subrecipients – The District did not provide federal awards to subrecipients during the year ended June 30, 2018.
Schedule of State Financial Assistance The California Community Colleges Chancellor’s Office requires disclosure of the financial activities of all state funded programs. To comply with this requirement, the Schedule of State Financial Assistance is presented.
Schedule of Workload Measures for State General Apportionment Annual (Actual) Attendance Full-time equivalent students (FTES) is a measurement of the number of students attending classes of the District. The purpose of attendance accounting from a fiscal standpoint is to provide the basis on which apportionments of State funds are made to community college districts. This schedule provides information regarding the attendance of students based on various methods of accumulating attendance data. Reconciliation of ECS 84362 (50 Percent Law) Calculation The Reconciliation of ECS 84362 (50 Percent Law) Calculation form shows the annual reported data from the CCFS-311 and any audit adjustments.
SONOMA COUNTY JUNIOR COLLEGE DISTRICT
NOTES TO SUPPLEMENTARY INFORMATION YEAR ENDED JUNE 30, 2018
60
Reconciliation of Education Protection Account Expenditures to District Accounting Records This reconciliation of Education Protection Account Expenditures shows the annual general apportionment and the expenditures the District applied toward the apportionment. Reconciliation of Governmental Funds to Net Position This schedule provides the reconciliation of the adjustments necessary to bring the District’s internal fund financial statements, prepared on a modified accrual basis, to the entity-wide full accrual basis financial statements required under GASB Statements No. 34 and No. 35 business type activities reporting model. Reconciliation of Annual Financial and Budget Report (CCFS-311) with Audited Financial Statements This schedule reports any audit adjustments made to the fund balances of all funds as reported on the Annual Financial and Budget Report (Form CCFS-311).
OTHER INDEPENDENT AUDITOR’S REPORTS
61
REPORT ON INTERNAL CONTROL OVER FINANCIAL REPORTING AND ON COMPLIANCE AND OTHER MATTERS BASED ON AN AUDIT
OF FINANCIAL STATEMENTS PERFORMED IN ACCORDANCE WITH GOVERNMENT AUDITING STANDARDS
Independent Auditor’s Report
Members of the Board of Trustees Sonoma County Junior College District Santa Rosa, California
We have audited, in accordance with the auditing standards generally accepted in the United States of America and the standards applicable to financial audits contained in Government Auditing Standards, issued by the Comptroller General of the United States, the financial statements of the business-type activities, the discretely presented component unit, and the aggregate remaining fund information of the Sonoma County Junior College District (the District), as of and for the year ended June 30, 2018, and the related notes to the financial statements, which collectively comprise the District’s basic financial statements and have issued our report thereon dated December 3, 2018.
Internal Control Over Financial Reporting
In planning and performing our audit of the financial statements, we considered the District’s internal control over financial reporting (internal control) to determine the audit procedures that are appropriate in the circumstances for the purpose of expressing our opinion on the financial statements, but not for the purpose of expressing an opinion on the effectiveness of the District’s internal control. Accordingly, we do not express an opinion on the effectiveness of the District’s internal control.
A deficiency in internal control exists when the design or operation of a control does not allow management or employees, in the normal course of performing their assigned functions, to prevent, or detect and correct, misstatements on a timely basis. A material weakness is a deficiency, or a combination of deficiencies, in internal control, such that there is a reasonable possibility that a material misstatement of the entity’s financial statements will not be prevented, or detected and corrected on a timely basis. A significant deficiency is a deficiency, or a combination of deficiencies, in internal control that is less severe than a material weakness, yet important enough to merit attention by those charged with governance.
Our consideration of internal control was for the limited purpose described in the first paragraph of this section and was not designed to identify all deficiencies in internal control that might be material weaknesses or significant deficiencies and therefore, material weaknesses or significant deficiencies may exist that were not identified. Given these limitations, during our audit we did not identify any deficiencies in internal control that we consider to be material weaknesses. However, material weaknesses may exist that have not been identified.
PHONE:916.646.6464 FAX:916.929.6836 GilbertCPA.com
2880 GATEWAY OAKS DRIVE, SUITE 100, SACRAMENTO, CA 95833 101 PARKSHORE DRIVE, SUITE 100, FOLSOM, CA 95630
Relax. We got this.Relax. We got this.Relax. We got this.SM
Members of the Board of Trustees Sonoma County Junior College District Page 2
62
Compliance and Other Matters As part of obtaining reasonable assurance about whether the District’s financial statements are free of material misstatement, we performed tests of its compliance with certain provisions of laws, regulations, contracts, and grant agreements, noncompliance with which could have a direct and material effect on the determination of financial statement amounts. However, providing an opinion on compliance with those provisions was not an objective of our audit, and accordingly, we do not express such an opinion. The results of our tests disclosed no instances of noncompliance or other matters that are required to be reported under Government Auditing Standards.
Purpose of this Report
The purpose of this report is solely to describe the scope of our testing of internal control and compliance and the results of that testing, and not to provide an opinion on the effectiveness of the District’s internal control or on compliance. This report is an integral part of an audit performed in accordance with Government Auditing Standards in considering the District’s internal control and compliance. Accordingly, this communication is not suitable for any other purpose. GILBERT ASSOCIATES, INC. Sacramento, California December 3, 2018
63
REPORT ON COMPLIANCE FOR EACH MAJOR PROGRAM AND ON INTERNAL CONTROL OVER COMPLIANCE
REQUIRED BY THE UNIFORM GUIDANCE
Independent Auditor’s Report Members of the Board of Trustees Sonoma County Junior College District Santa Rosa, California Report on Compliance for Each Major Federal Program We have audited the Sonoma County Junior College District’s (the District) compliance with the types of compliance requirements described in the OMB Compliance Supplement that could have a direct and material effect on each of the District’s major federal programs for the year ended June 30, 2018. The District's major federal programs are identified in the Summary of Auditor's Results section of the accompanying Schedule of Audit Findings and Questioned Costs. Management’s Responsibility Management is responsible for compliance with federal statutes, regulations, and the terms and conditions of its federal awards applicable to its federal programs. Auditor’s Responsibility
Our responsibility is to express an opinion on compliance for each of the District’s major federal programs based on our audit of the types of compliance requirements referred to above. We conducted our audit of compliance in accordance with auditing standards generally accepted in the United States of America; the standards applicable to financial audits contained in Government Auditing Standards, issued by the Comptroller General of the United States; and the audit requirements of Title 2 U.S. Code of Federal Regulations Part 200, Uniform Administrative Requirements, Cost Principles, and Audit Requirements for Federal Awards (Uniform Guidance). Those standards and Uniform Guidance require that we plan and perform the audit to obtain reasonable assurance about whether noncompliance with the types of compliance requirements referred to above that could have a direct and material effect on a major federal program occurred. An audit includes examining, on a test basis, evidence about the District’s compliance with those requirements and performing such other procedures as we considered necessary in the circumstances.
We believe that our audit provides a reasonable basis for our opinion on compliance for each major federal program. However, our audit does not provide a legal determination of the District’s compliance.
PHONE:916.646.6464 FAX:916.929.6836 GilbertCPA.com
2880 GATEWAY OAKS DRIVE, SUITE 100, SACRAMENTO, CA 95833 101 PARKSHORE DRIVE, SUITE 100, FOLSOM, CA 95630
Relax. We got this.Relax. We got this.Relax. We got this.SM
Members of the Board of Trustees Sonoma County Junior College District Page 2
64
Opinion on Each Major Federal Program In our opinion, the District complied, in all material respects, with the types of compliance requirements referred to above that could have a direct and material effect on each of its major programs for the year ended June 30, 2018. Report on Internal Control Over Compliance Management of the District is responsible for establishing and maintaining effective internal control over compliance with the types of compliance requirements referred to above. In planning and performing our audit of compliance, we considered the District’s internal control over compliance with the types of requirements that could have a direct and material effect on each major federal program to determine the auditing procedures that are appropriate in the circumstances for the purpose of expressing an opinion on compliance for each major federal program and to test and report on internal control over compliance in accordance with Uniform Guidance, but not for the purpose of expressing an opinion on the effectiveness of internal control over compliance. Accordingly, we do not express an opinion on the effectiveness of the District’s internal control over compliance. A deficiency in internal control over compliance exists when the design or operation of a control over compliance does not allow management or employees, in the normal course of performing their assigned functions, to prevent, or detect and correct, noncompliance with a type of compliance requirement of a federal program on a timely basis. A material weakness in internal control over compliance is a deficiency, or combination of deficiencies, in internal control over compliance, such that there is a reasonable possibility that material noncompliance with a type of compliance requirement of a federal program will not be prevented, or detected and corrected, on a timely basis. A significant deficiency in internal control over compliance is a deficiency, or a combination of deficiencies, in internal control over compliance with a type of compliance requirement of a federal program that is less severe than a material weakness in internal control over compliance, yet important enough to merit attention by those charged with governance. Our consideration of internal control over compliance was for the limited purpose described in the first paragraph of this section and was not designed to identify all deficiencies in internal control over compliance that might be material weaknesses or significant deficiencies. We did not identify any deficiencies in internal control over compliance that we consider to be material weaknesses. However, material weaknesses may exist that have not been identified. The purpose of this report on internal control over compliance is solely to describe the scope of our testing of internal control over compliance and the results of that testing based on the requirements of Uniform Guidance. Accordingly, this report is not suitable for any other purpose. GILBERT ASSOCIATES, INC. Sacramento, California December 4, 2018
65
REPORT ON COMPLIANCE WITH APPLICABLE REQUIREMENTS IN ACCORDANCE WITH THE CONTRACTED DISTRICT AUDIT MANUAL
Independent Auditor's Report Members of the Board of Trustees Sonoma County Junior College District Santa Rosa, California Report on Compliance with Applicable Requirements We have audited the Sonoma County Junior College District’s (the District) compliance with the types of compliance requirements described in Section 400, State Compliance Requirements, of the Contracted District Audit Manual, issued by the California Community Colleges Chancellor's Office identified in the schedule below for the year ended June 30, 2018. Management’s Responsibilities Management is responsible for compliance with the state statutes, regulations, and the terms and conditions of its state programs. Auditor’s Responsibility Our responsibility is to express an opinion on compliance for the District’s state programs based on our audit of the types of compliance requirements referred to above. We conducted our audit of compliance in accordance with auditing standards generally accepted in the United States of America; the standards applicable to financial audits contained in Government Auditing Standards, issued by the Comptroller General of the United States; and Section 400, State Compliance Requirements, of the Contracted District Audit Manual, issued by the California Community Colleges Chancellor's Office. Those standards and the Contracted District Audit Manual require that we plan and perform the audit to obtain reasonable assurance about whether noncompliance with the types of compliance requirements referred to above occurred. An audit includes examining, on a test basis, evidence about the District’s compliance with those requirements and performing such other procedures as we considered necessary under the circumstances. We believe that our audit provides a reasonable basis for our opinion on compliance. However, our audit does not provide a legal determination on the District’s compliance with those requirements. In connection with the requirements referred to above, we have selected and tested transactions and records to determine the District’s compliance with the applicable programs identified below:
Salaries of Classroom Instructors (50% Law)
Apportionment for Instructional Service Agreements/Contracts
State General Apportionment Funding System
PHONE:916.646.6464 FAX:916.929.6836 GilbertCPA.com
2880 GATEWAY OAKS DRIVE, SUITE 100, SACRAMENTO, CA 95833 101 PARKSHORE DRIVE, SUITE 100, FOLSOM, CA 95630
Relax. We got this.Relax. We got this.Relax. We got this.SM
Members of the Board of Trustees Sonoma County Junior College District Page 2
66
Residency Determination for Credit Courses
Students Actively Enrolled
Dual Enrollment (CCAP and Non-CCAP)
Student Equity
Student Success and Support Program (SSSP) Funds
Scheduled Maintenance Program
Gann Limit Calculation
Open Enrollment
Proposition 39 Clean Energy Fund
Intersession Extension Program
Apprenticeship Related and Supplemental Instruction (RSI) Funds
Disabled Student Programs and Services (DSPS)
To Be Arranged Hours (TBA)
Proposition 1D and 51State Bond Funded Projects
Education Protection Account Funds
Other Matters
The results of our auditing procedures disclosed an instance of noncompliance, which is required to be reported in accordance with State Compliance Requirements, of the Contracted District Audit Manual, issued by the California Community Colleges Chancellor's Office and which is described in the accompanying schedule of findings and questioned costs as item 2018-001. Our opinion on the types of compliance requirements referred to above is not modified with respect to this matter.
The District’s response to the noncompliance finding identified in our audit is described in the accompanying Schedule of Audit Findings and Questioned Costs. This response was not subject to the auditing procedures applied in the audit of compliance and, accordingly, we express no opinion on the response. Opinion on State Compliance In our opinion, the District complied, in all material respects, with the compliance requirements referred to above for the fiscal year ended June 30, 2018. GILBERT ASSOCIATES, INC. Sacramento, California December 3, 2018
FINDINGS AND RECOMMENDATIONS SECTION
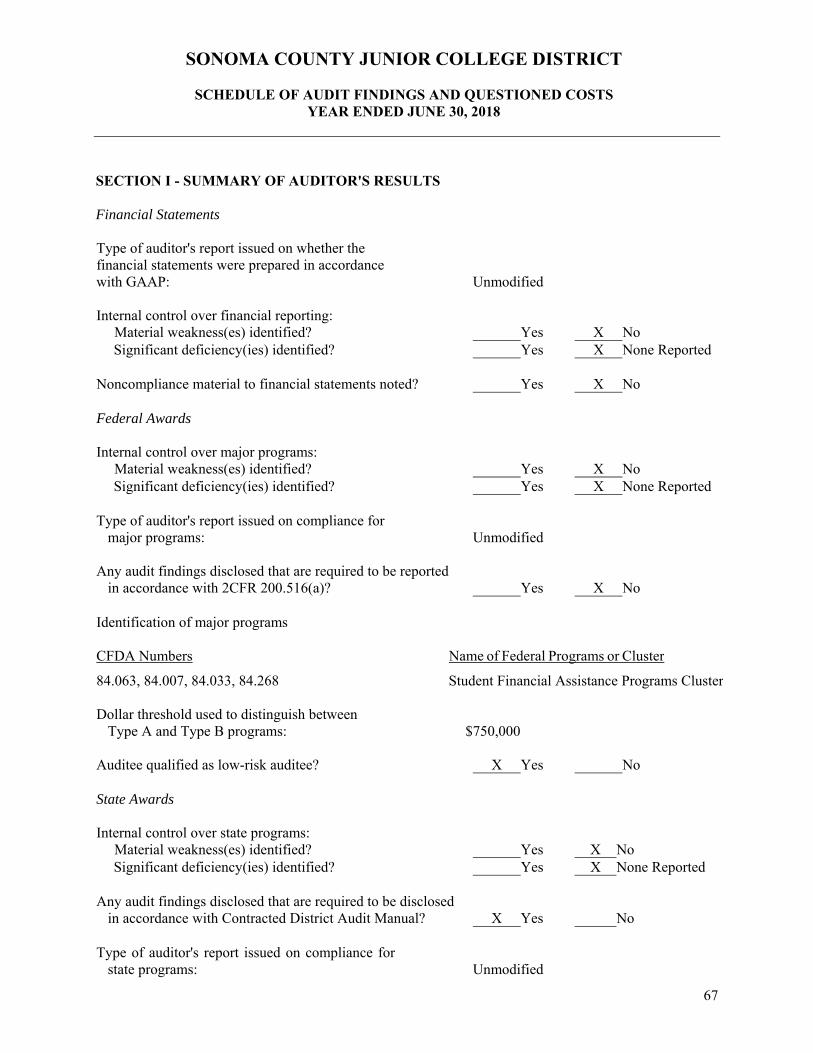
SONOMA COUNTY JUNIOR COLLEGE DISTRICT
SCHEDULE OF AUDIT FINDINGS AND QUESTIONED COSTS YEAR ENDED JUNE 30, 2018
67
SECTION I - SUMMARY OF AUDITOR'S RESULTS Financial Statements Type of auditor's report issued on whether the financial statements were prepared in accordance with GAAP:
Unmodified Internal control over financial reporting:
Material weakness(es) identified? Yes X No Significant deficiency(ies) identified? Yes X None Reported
Noncompliance material to financial statements noted? Yes X No Federal Awards Internal control over major programs:
Material weakness(es) identified? Yes X No Significant deficiency(ies) identified? Yes X None Reported
Type of auditor's report issued on compliance for major programs:
Unmodified
Any audit findings disclosed that are required to be reported
in accordance with 2CFR 200.516(a)?
Yes
X No
Identification of major programs CFDA Numbers
Name of Federal Programs or Cluster
84.063, 84.007, 84.033, 84.268 Student Financial Assistance Programs Cluster Dollar threshold used to distinguish between
Type A and Type B programs:
$ 750,000
Auditee qualified as low-risk auditee? X Yes No State Awards
Internal control over state programs: Material weakness(es) identified? Yes X No Significant deficiency(ies) identified? Yes X None Reported
Any audit findings disclosed that are required to be disclosed in accordance with Contracted District Audit Manual? X Yes No
Type of auditor's report issued on compliance for state programs:
Unmodified
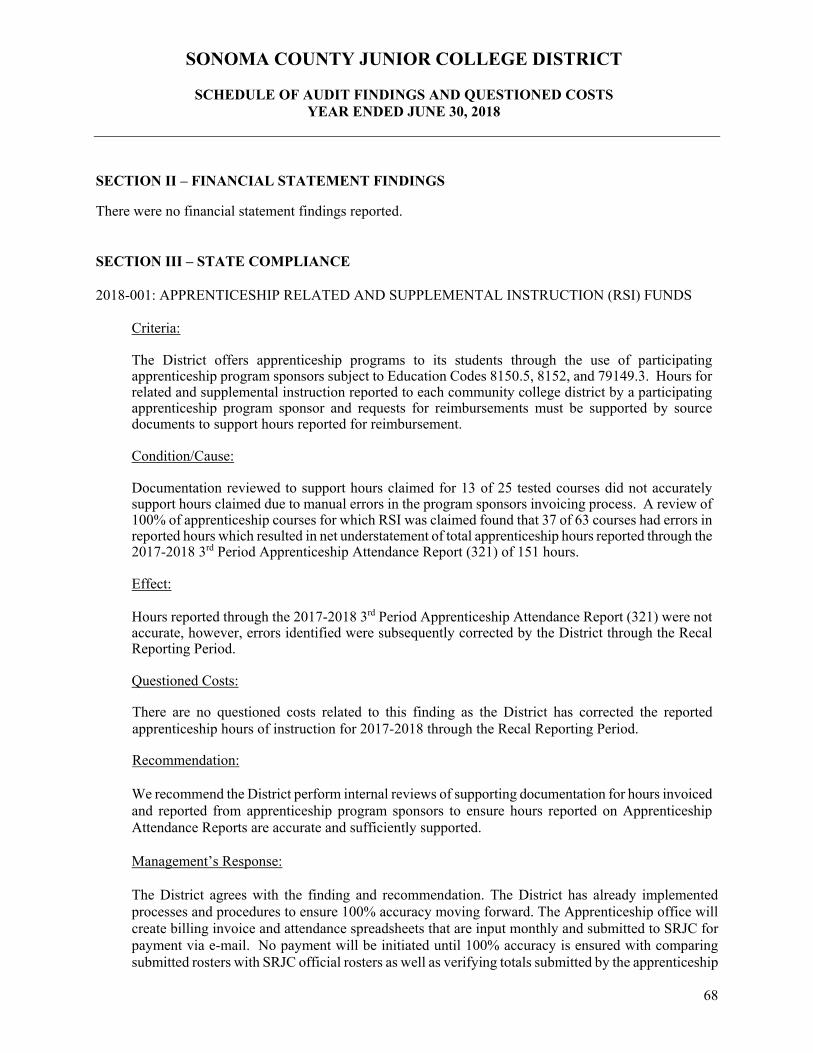
SONOMA COUNTY JUNIOR COLLEGE DISTRICT
SCHEDULE OF AUDIT FINDINGS AND QUESTIONED COSTS YEAR ENDED JUNE 30, 2018
68
SECTION II – FINANCIAL STATEMENT FINDINGS
There were no financial statement findings reported. SECTION III – STATE COMPLIANCE 2018-001: APPRENTICESHIP RELATED AND SUPPLEMENTAL INSTRUCTION (RSI) FUNDS
Criteria: The District offers apprenticeship programs to its students through the use of participating apprenticeship program sponsors subject to Education Codes 8150.5, 8152, and 79149.3. Hours for related and supplemental instruction reported to each community college district by a participating apprenticeship program sponsor and requests for reimbursements must be supported by source documents to support hours reported for reimbursement. Condition/Cause: Documentation reviewed to support hours claimed for 13 of 25 tested courses did not accurately support hours claimed due to manual errors in the program sponsors invoicing process. A review of 100% of apprenticeship courses for which RSI was claimed found that 37 of 63 courses had errors in reported hours which resulted in net understatement of total apprenticeship hours reported through the 2017-2018 3rd Period Apprenticeship Attendance Report (321) of 151 hours. Effect: Hours reported through the 2017-2018 3rd Period Apprenticeship Attendance Report (321) were not accurate, however, errors identified were subsequently corrected by the District through the Recal Reporting Period. Questioned Costs:
There are no questioned costs related to this finding as the District has corrected the reported apprenticeship hours of instruction for 2017-2018 through the Recal Reporting Period.
Recommendation: We recommend the District perform internal reviews of supporting documentation for hours invoiced and reported from apprenticeship program sponsors to ensure hours reported on Apprenticeship Attendance Reports are accurate and sufficiently supported. Management’s Response:
The District agrees with the finding and recommendation. The District has already implemented processes and procedures to ensure 100% accuracy moving forward. The Apprenticeship office will create billing invoice and attendance spreadsheets that are input monthly and submitted to SRJC for payment via e-mail. No payment will be initiated until 100% accuracy is ensured with comparing submitted rosters with SRJC official rosters as well as verifying totals submitted by the apprenticeship
SONOMA COUNTY JUNIOR COLLEGE DISTRICT
SCHEDULE OF AUDIT FINDINGS AND QUESTIONED COSTS YEAR ENDED JUNE 30, 2018
69
partner. The District has met with the individual apprentice programs to explain the situation, the findings, and inform them of the new changes being initiated to ensure accuracy, with positive results. District staff will verify enrollment and input all student hours into a database created to verify enrollment hours for the entire semester for each course for each apprentice program.
SECTION IV - FEDERAL COMPLIANCE There were no federal compliance findings reported.
SONOMA COUNTY JUNIOR COLLEGE DISTRICT
STATUS OF PRIOR YEAR FINDINGS AND RECOMMENDATIONS YEAR ENDED JUNE 30, 2018
70
FINANCIAL STATEMENT FINDINGS There were no financial statement findings reported in the prior year. FEDERAL COMPLIANCE There were no federal compliance findings reported in the prior year. STATE COMPLIANCE There were no state compliance findings reported in the prior year