Embed Size (px)
Citation preview
Soquel High SchoolSchool Accountability Report Card, 2007–2008Santa Cruz City School District
An annual report to the
community about teaching,
learning, test results,
resources, and measures of
progress in our school.
»
Soquel High School School Accountability Report Card, 2007–2008Santa Cruz City School District
»Contents
ONLINE USERS: CLICK ON A TITLE TO JUMP TO THAT SECTION
This School Accountability Report Card (SARC) provides information that can be used to evaluate and compare schools. State and federal laws require all schools to publish a SARC each year.
The information in this report represents the 2007–2008 school year, not the current school year. In most cases, this is the most recent data available. We present our school’s results next to those of the average high school in the county and state to provide the most meaningful and fair comparisons. To find additional facts about our school online, please use the DataQuest tool offered by the California Department of Education.
If you are reading a printed version of this report, note that words that appear in a smaller, bold typeface are links in the online version of this report to even more information. You can find a master list of those linked words, and the Web page addresses they are connected to, at:http://www.schoolwisepress.com/sarc/links_2008_en.html
Reports about other schools are available on the California Department of Education Web site. Internet access is available in local libraries.
If you have any questions related to this report, please contact the school office.
How to Contact Our School401 Old San Jose Rd.Soquel, CA 95073Principal: Ken Lawrence-EmanuelPhone: (831) 429-3909
How to Contact Our District405 Old San Jose Rd.Soquel, CA 95073Phone: (831) 429-3410http://www.sccs.santacruz.k12.ca.us
Published by
SCHOOL WISE PRESS385 Ashton Ave., Ste. 200San Francisco, CA 94112Phone: (415) 337-7971www.schoolwisepress.com
©2008 Publishing 20/20
Principal’s Message
Measures of Progress
Student Achievement
Students
Climate for Learning
Leadership, Teachers, and Staff
Preparation for College and the Workforce
Adequacy of Key Resources
Data Almanac
»
Soquel High SchoolSchool Accountability Report Card, 2007–2008Santa Cruz City School District
Santa Cruz City School District
Grade range and calendar
9–12TRADITIONAL
Academic Performance Index
727County Average: 719State Average: 710
Student enrollment
1,215County Average: 676State Average: 1,246
Teachers
49County Average: 30State Average: 54
Students per teacher
25County Average: 22State Average: 23
Students per computer
4County Average: 4State Average: 4
Principal’s Message
Soquel High School (SHS) was established in 1962 to serve the outlying areas of the Santa Cruz City School District. It is one of seven high schools in Santa Cruz County and is the largest of the three comprehensive high schools in the district. Situated near the center of the county, the 40-acre campus is in a beautiful setting overlooking the Monterey Bay.
SHS annually sends 95 percent of its surveyed seniors to college. We offer the largest number of Advanced Placement (AP) courses in the district. Our extensive Regional Occupational Program (ROP) includes courses in horticulture, floristry, veterinary science, sports occupations, justice administration, cabinetry, green careers, and computer graphics. Our wide range of arts offerings includes instrumental and vocal music, ceramics, drama, painting, and photography. We offer the Humanities Academy, which provides a rigorous program for academically motivated students in English and social studies. In conjunction with Cabrillo College and ROP, we offer the Manufacturing, Engineering, and Construction (MEC) Academy, which provides students an accelerated program in the industrial arts, designed specifically to help graduates find high-paying jobs in the local economy. In addition to high-quality arts and academic programs, SHS offers a variety of school clubs and an extensive array of athletic opportunities.
Ken Lawrence-Emanuel, PRINCIPAL
Soquel High School School Accountability Report Card for 2007–2008 Page 2
Major Achievements• Increased attention to student security and truancy prevention led to improvements in student learning.
Overall, students performed better on the California Standards Tests (CST), and fewer students earned Ds and Fs.
• The MEC Academy was launched, providing career-minded students integrated English, social studies, and industrial arts courses. Students in this four-year program will also take work experience and spe-cialty courses through ROP and at Cabrillo College prior to graduation.
• We added new courses in Sheltered Health, pre-algebra, and Algebra I for English Learners. We expanded our Read 180 reading improvement program to provide greater access for all students.
Focus for Improvement• Through our 2006 Western Association of Schools and Colleges Self Study, we identified the following
three critical academic needs of our student body: Increase academic success for underachieving students, increase and improve personal and academic support for English Learners, and establish a comprehensive data-management and training system.
• In 2007–2008, we set the following goals in our Single Plan for Student Achievement: Increase the num-ber of students scoring at Proficient or above on the CST by five percent; enable all students to pass the California High School Exit Exam (CAHSEE); and support all English Learners to rise one level on the California English Language Development Test, achieve Basic or higher on the CST, and achieve profi-ciency on the CAHSEE.
Santa Cruz City School District
Soquel High School School Accountability Report Card for 2007–2008 Page 3
School ExpendituresExpenditures of state and federal funds are defined by the Single Plan for Student Achievement, approved each year by our SSC. For 2007–2008 we decided to use these funds to pay for bilingual classroom support, staff development, student planners, computer hardware and tech support, tutors for our afterschool Homework Club, a CST awareness campaign, library materials, Web communications, GATE program supplies and materials, and counselors.
SafetySHS maintains a safe, clean, and orderly campus. Our supervisory staff includes the three administrators and one full-time and one part-time campus supervisor. They are on duty from 7 a.m. to 5 p.m. daily.
We review and update our School Safety Plan annually. Visitors to our school must wear a visitor badge after checking in with the school receptionist. We have established and practice emergency drills for fire, earthquake, and lockdown procedures. We provide a first aid kit in each classroom.
LeadershipKen Lawrence-Emanuel has four years of experience as a principal, four as an assistant principal, and nine as a teacher.
Teachers and administrators take an active role in decision making at our school. The principal meets weekly with the administrative team and monthly with department leaders to address school issues. Administrators, teachers, students, parents, and support staff serve on the School Site Council (SSC). Administrators meet regularly with our parent and student groups, which include the SSC, the English Language Advisory Committee (ELAC), our sports boosters, the Soquel Fund, the student senate, and the leadership class.
BuildingsWe have recently completed renovations to our 46-year-old campus, which included new paint and roofs, renovated first and third quads, upgraded athletic fields, blinds in all classrooms, and display boards in all hallways.
A solar electrical system will be installed in 2008–2009.
Parent InvolvementThe SSC, Humanities Academy Support Committee, Web Site Group, Scholarship Committee, GATE Committee, Soquel Fund, ELAC, Bond Oversight Committee, and Soquel Music Foundation offer opportunities for parents to get involved at SHS. Parents fund-raise, purchase supplies, and volunteer time and energy. Parents help run the SHS Web site and publish our Knight Notes online newsletter. For more information about participating at our school, please contact our principal.
Santa Cruz City School District
Soquel High School School Accountability Report Card for 2007–2008 Page 4
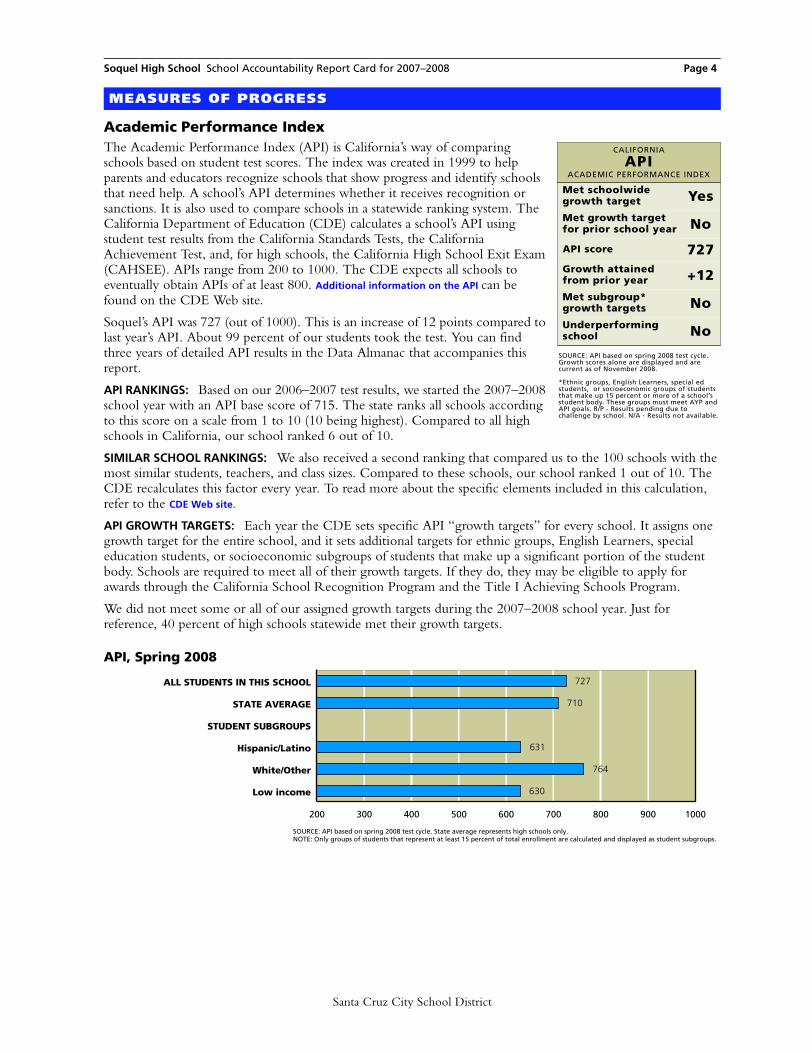
Academic Performance IndexThe Academic Performance Index (API) is California’s way of comparing schools based on student test scores. The index was created in 1999 to help parents and educators recognize schools that show progress and identify schools that need help. A school’s API determines whether it receives recognition or sanctions. It is also used to compare schools in a statewide ranking system. The California Department of Education (CDE) calculates a school’s API using student test results from the California Standards Tests, the California Achievement Test, and, for high schools, the California High School Exit Exam (CAHSEE). APIs range from 200 to 1000. The CDE expects all schools to eventually obtain APIs of at least 800. Additional information on the API can be found on the CDE Web site.
Soquel’s API was 727 (out of 1000). This is an increase of 12 points compared to last year’s API. About 99 percent of our students took the test. You can find three years of detailed API results in the Data Almanac that accompanies this report.
API RANKINGS: Based on our 2006–2007 test results, we started the 2007–2008 school year with an API base score of 715. The state ranks all schools according to this score on a scale from 1 to 10 (10 being highest). Compared to all high schools in California, our school ranked 6 out of 10.
SIMILAR SCHOOL RANKINGS: We also received a second ranking that compared us to the 100 schools with the most similar students, teachers, and class sizes. Compared to these schools, our school ranked 1 out of 10. The CDE recalculates this factor every year. To read more about the specific elements included in this calculation, refer to the CDE Web site.
API GROWTH TARGETS: Each year the CDE sets specific API “growth targets” for every school. It assigns one growth target for the entire school, and it sets additional targets for ethnic groups, English Learners, special education students, or socioeconomic subgroups of students that make up a significant portion of the student body. Schools are required to meet all of their growth targets. If they do, they may be eligible to apply for awards through the California School Recognition Program and the Title I Achieving Schools Program.
We did not meet some or all of our assigned growth targets during the 2007–2008 school year. Just for reference, 40 percent of high schools statewide met their growth targets.
MEASURES OF PROGRESS
CALIFORNIA
APIACADEMIC PERFORMANCE INDEX
Met schoolwide growth target YesMet growth target for prior school year No
API score 727Growth attained from prior year +12Met subgroup* growth targets NoUnderperforming school No
SOURCE: API based on spring 2008 test cycle. Growth scores alone are displayed and are current as of November 2008.
*Ethnic groups, English Learners, special ed students, or socioeconomic groups of students that make up 15 percent or more of a school’s student body. These groups must meet AYP and API goals. R/P - Results pending due to challenge by school. N/A - Results not available.
200 300 400 500 600 700 800 900 1000
Low income
White/Other
Hispanic/Latino
STUDENT SUBGROUPS
STATE AVERAGE
ALL STUDENTS IN THIS SCHOOL
API, Spring 2008
727
710
631
764
630
SOURCE: API based on spring 2008 test cycle. State average represents high schools only.NOTE: Only groups of students that represent at least 15 percent of total enrollment are calculated and displayed as student subgroups.
Santa Cruz City School District
Soquel High School School Accountability Report Card for 2007–2008 Page 5
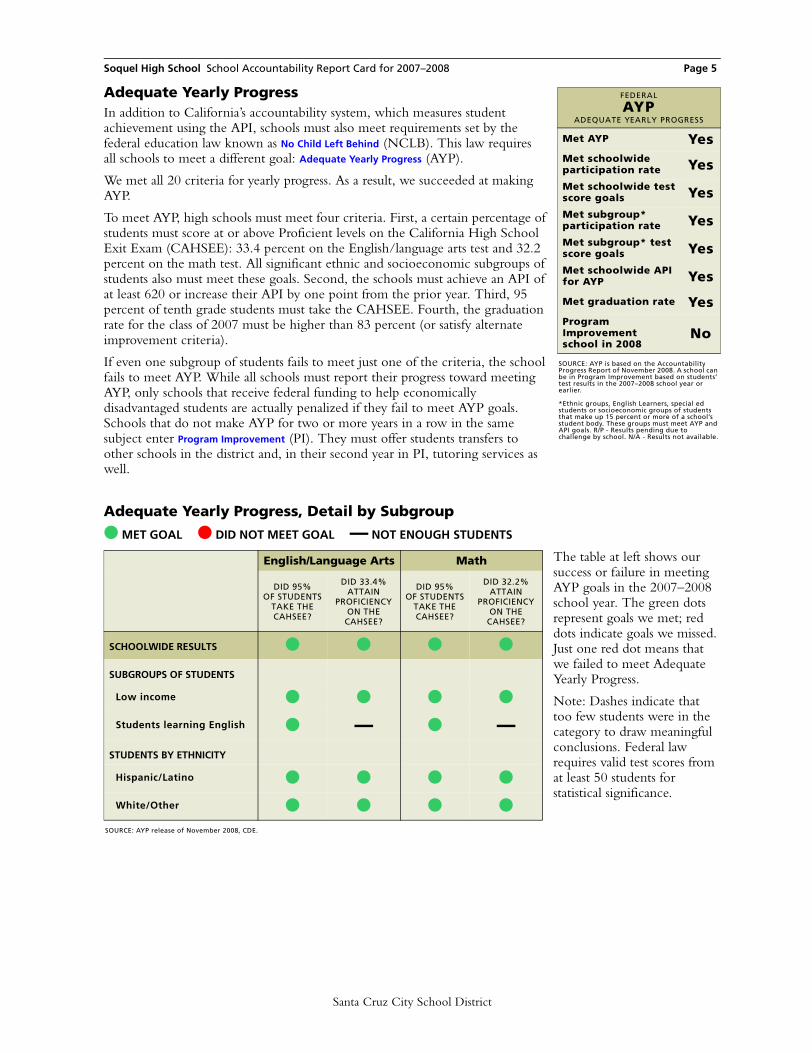
Adequate Yearly ProgressIn addition to California’s accountability system, which measures student achievement using the API, schools must also meet requirements set by the federal education law known as No Child Left Behind (NCLB). This law requires all schools to meet a different goal: Adequate Yearly Progress (AYP).
We met all 20 criteria for yearly progress. As a result, we succeeded at making AYP.
To meet AYP, high schools must meet four criteria. First, a certain percentage of students must score at or above Proficient levels on the California High School Exit Exam (CAHSEE): 33.4 percent on the English/language arts test and 32.2 percent on the math test. All significant ethnic and socioeconomic subgroups of students also must meet these goals. Second, the schools must achieve an API of at least 620 or increase their API by one point from the prior year. Third, 95 percent of tenth grade students must take the CAHSEE. Fourth, the graduation rate for the class of 2007 must be higher than 83 percent (or satisfy alternate improvement criteria).
If even one subgroup of students fails to meet just one of the criteria, the school fails to meet AYP. While all schools must report their progress toward meeting AYP, only schools that receive federal funding to help economically disadvantaged students are actually penalized if they fail to meet AYP goals. Schools that do not make AYP for two or more years in a row in the same subject enter Program Improvement (PI). They must offer students transfers to other schools in the district and, in their second year in PI, tutoring services as well.
The table at left shows our success or failure in meeting AYP goals in the 2007–2008 school year. The green dots represent goals we met; red dots indicate goals we missed. Just one red dot means that we failed to meet Adequate Yearly Progress.
Note: Dashes indicate that too few students were in the category to draw meaningful conclusions. Federal law requires valid test scores from at least 50 students for statistical significance.
FEDERAL
AYPADEQUATE YEARLY PROGRESS
Met AYP YesMet schoolwide participation rate YesMet schoolwide test score goals YesMet subgroup* participation rate YesMet subgroup* test score goals YesMet schoolwide API for AYP Yes
Met graduation rate YesProgram Improvement school in 2008
No
SOURCE: AYP is based on the Accountability Progress Report of November 2008. A school can be in Program Improvement based on students’ test results in the 2007–2008 school year or earlier.
*Ethnic groups, English Learners, special ed students or socioeconomic groups of students that make up 15 percent or more of a school’s student body. These groups must meet AYP and API goals. R/P - Results pending due to challenge by school. N/A - Results not available.
Adequate Yearly Progress, Detail by Subgroup
● MET GOAL ● DID NOT MEET GOAL – NOT ENOUGH STUDENTS
English/Language Arts Math
DID 95%OF STUDENTS
TAKE THE CAHSEE?
DID 33.4%ATTAIN
PROFICIENCY ON THE
CAHSEE?
DID 95%OF STUDENTS
TAKE THE CAHSEE?
DID 32.2%ATTAIN
PROFICIENCY ON THE
CAHSEE?
SCHOOLWIDE RESULTS ● ● ● ●
SUBGROUPS OF STUDENTS
Low income ● ● ● ●
Students learning English ● – ● –
STUDENTS BY ETHNICITY
Hispanic/Latino ● ● ● ●
White/Other ● ● ● ●SOURCE: AYP release of November 2008, CDE.
Santa Cruz City School District
Soquel High School School Accountability Report Card for 2007–2008 Page 6
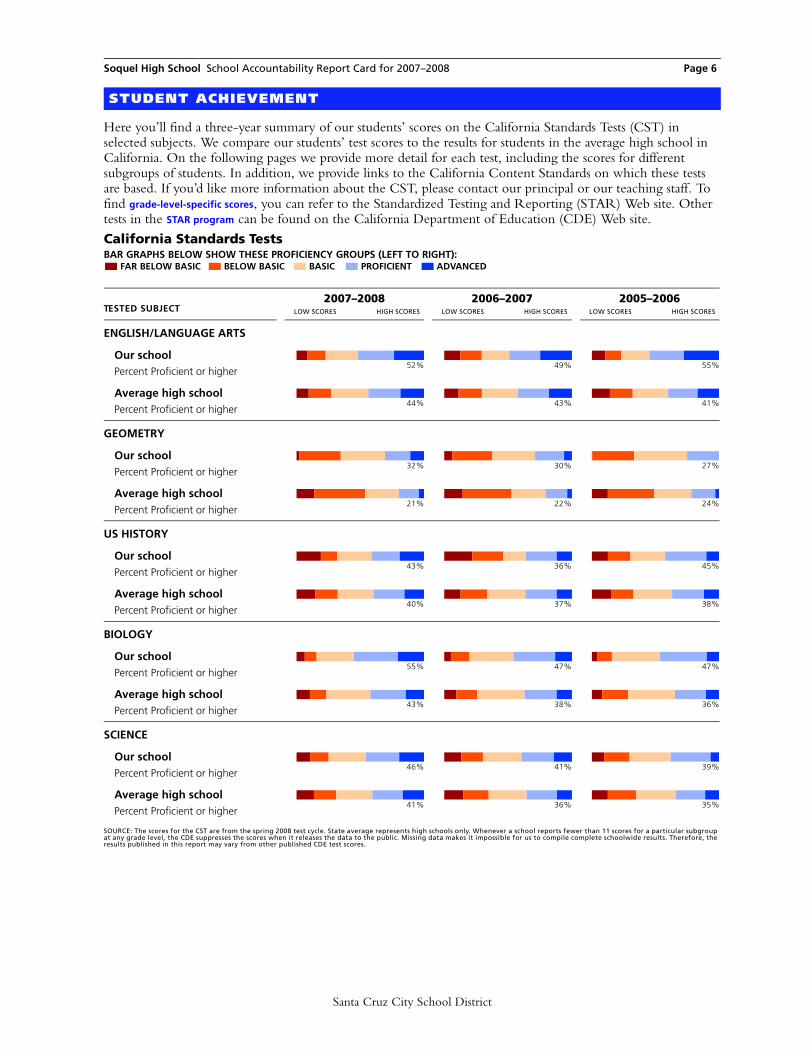
Here you’ll find a three-year summary of our students’ scores on the California Standards Tests (CST) in selected subjects. We compare our students’ test scores to the results for students in the average high school in California. On the following pages we provide more detail for each test, including the scores for different subgroups of students. In addition, we provide links to the California Content Standards on which these tests are based. If you’d like more information about the CST, please contact our principal or our teaching staff. To find grade-level-specific scores, you can refer to the Standardized Testing and Reporting (STAR) Web site. Other tests in the STAR program can be found on the California Department of Education (CDE) Web site.
STUDENT ACHIEVEMENT
BAR GRAPHS BELOW SHOW THESE PROFICIENCY GROUPS (LEFT TO RIGHT):FAR BELOW BASIC BELOW BASIC BASIC PROFICIENT ADVANCED
California Standards Tests
TESTED SUBJECT2007–2008
LOW SCORES HIGH SCORES
2006–2007 LOW SCORES HIGH SCORES
2005–2006 LOW SCORES HIGH SCORES
ENGLISH/LANGUAGE ARTS
Our schoolPercent Proficient or higher
52% 49% 55%
Average high schoolPercent Proficient or higher
44% 43% 41%
GEOMETRY
Our schoolPercent Proficient or higher
32% 30% 27%
Average high schoolPercent Proficient or higher
21% 22% 24%
US HISTORY
Our schoolPercent Proficient or higher
43% 36% 45%
Average high schoolPercent Proficient or higher
40% 37% 38%
BIOLOGY
Our schoolPercent Proficient or higher
55% 47% 47%
Average high schoolPercent Proficient or higher
43% 38% 36%
SCIENCE
Our schoolPercent Proficient or higher
46% 41% 39%
Average high schoolPercent Proficient or higher
41% 36% 35%
SOURCE: The scores for the CST are from the spring 2008 test cycle. State average represents high schools only. Whenever a school reports fewer than 11 scores for a particular subgroup at any grade level, the CDE suppresses the scores when it releases the data to the public. Missing data makes it impossible for us to compile complete schoolwide results. Therefore, the results published in this report may vary from other published CDE test scores.
Santa Cruz City School District

Soquel High School School Accountability Report Card for 2007–2008 Page 7
Frequently Asked Questions About Standardized TestsWHERE CAN I FIND GRADE-LEVEL REPORTS? Due to space constraints and concern for statistical reliability, we have omitted grade-level detail from these test results. Instead we present results at the schoolwide level. You can view the results of far more students than any one grade level would contain, which also improves their statistical reliability. Grade-level results are online on the STAR Web site. More information about student test scores is available in the Data Almanac that accompanies this report.
WHAT DO THE FIVE PROFICIENCY BANDS MEAN? Test experts assign students to one of these five proficiency levels, based on the number of questions they answer correctly. Our immediate goal is to help students move up one level. Our eventual goal is to enable all students to reach either of the top two bands, Advanced or Proficient. Those who score in the middle band, Basic, have come close to attaining the required knowledge and skills. Those who score in either of the bottom two bands, Below Basic or Far Below Basic, need more help to reach the Proficient level.
WHY ARE THE CALIFORNIA STANDARDS TESTS (CST) AND THE CALIFORNIA ACHIEVEMENT TEST (CAT/6) SCORED DIFFERENTLY? When students take the CST, they can score at any of the proficiency levels: Advanced, Proficient, Basic, Below Basic, or Far Below Basic. In theory all students in California could score at the top. The CAT/6 is a nationally normed test, which means that students are scored against each other nationally. This scoring method is similar to grading “on the curve.” CAT/6 scores are expressed as a ranking on a scale from 1 to 99.
HOW HARD ARE THE CALIFORNIA STANDARDS TESTS? Experts consider California’s standards to be among the most clear and rigorous in the country. Just 47 percent of elementary school students scored Proficient or Advanced on the English/language arts test; 56 percent scored Proficient or Advanced in math. You can review the California Content Standards on the CDE Web site.
ARE ALL STUDENTS’ SCORES INCLUDED? No. Only students in grades two through eleven are required to take the CST. When fewer than 11 students in one grade or subgroup take a test, state officials remove their scores from the report. They omit them to protect students’ privacy, as called for by federal law.
CAN I REVIEW SAMPLE TEST QUESTIONS? Sample test questions for the CST are on the CDE’s Web site. These are actual questions used in previous years.
WHERE CAN I FIND ADDITIONAL INFORMATION? The CDE has a wealth of resources on its Web site. The STAR Web site publishes detailed reports for schools and districts, and assistance packets for parents and teachers. This site includes explanations of technical terms, scoring methods, and the subjects covered by the tests for each grade. You’ll also find a guide to navigating the STAR Web site as well as help for understanding how to compare test scores.
WHY ARE ONLY SOME OF THE TEST RESULTS PRESENT? California’s test program includes many tests not mentioned in this report. For brevity’s sake, we’re reporting six CST tests usually taken by the largest number of students. We select at least one test from each core subject. For science, we’ve selected biology (an elective) and the tenth grade life science test. For math, we’ve selected two courses, both of them electives: Algebra I, which students take if they haven’t studied and passed it in eighth grade; and Geometry, often the most popular math course because it follows Algebra I. In social studies, we’ve selected US History, which is taken by all juniors (eleventh graders). English/language arts summarizes the results of students in grades nine through eleven.
Santa Cruz City School District
Soquel High School School Accountability Report Card for 2007–2008 Page 8
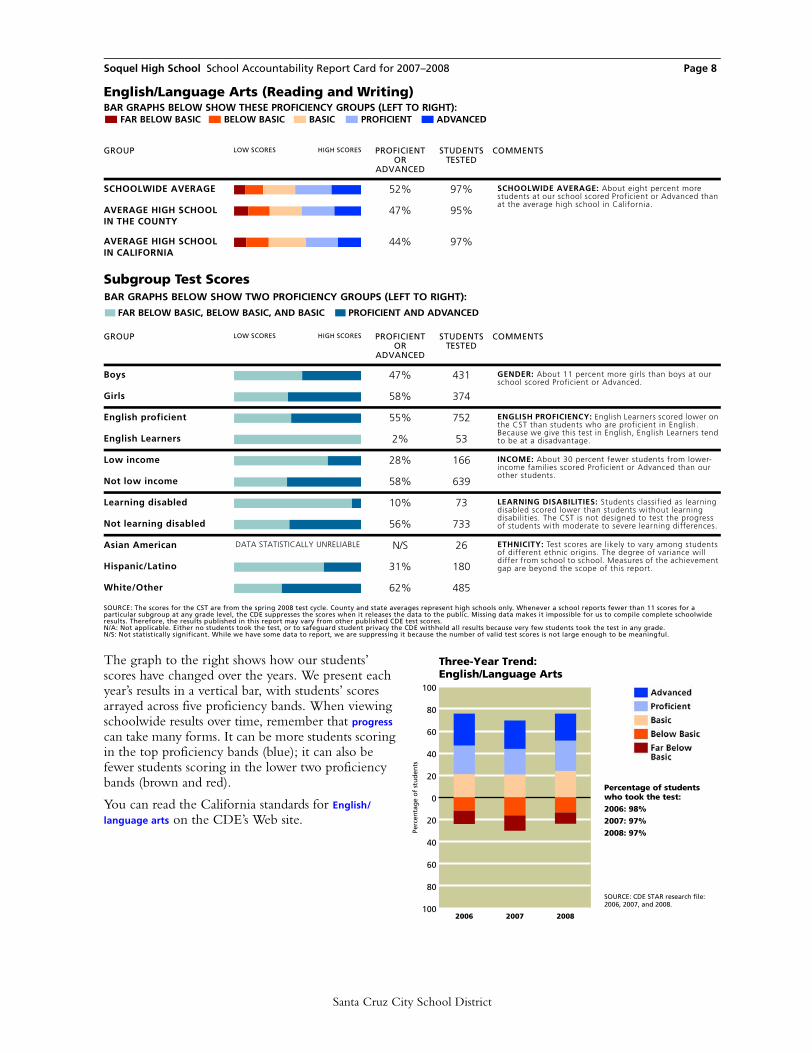
The graph to the right shows how our students’ scores have changed over the years. We present each year’s results in a vertical bar, with students’ scores arrayed across five proficiency bands. When viewing schoolwide results over time, remember that progress can take many forms. It can be more students scoring in the top proficiency bands (blue); it can also be fewer students scoring in the lower two proficiency bands (brown and red).
You can read the California standards for English/
language arts on the CDE’s Web site.
BAR GRAPHS BELOW SHOW THESE PROFICIENCY GROUPS (LEFT TO RIGHT):FAR BELOW BASIC BELOW BASIC BASIC PROFICIENT ADVANCED
English/Language Arts (Reading and Writing)
GROUP LOW SCORES HIGH SCORES PROFICIENT OR
ADVANCED
STUDENTS TESTED
COMMENTS
SCHOOLWIDE AVERAGE 52% 97% SCHOOLWIDE AVERAGE: About eight percent more students at our school scored Proficient or Advanced than at the average high school in California.
AVERAGE HIGH SCHOOL IN THE COUNTY
47% 95%
AVERAGE HIGH SCHOOL IN CALIFORNIA
44% 97%
BAR GRAPHS BELOW SHOW TWO PROFICIENCY GROUPS (LEFT TO RIGHT):
FAR BELOW BASIC, BELOW BASIC, AND BASIC PROFICIENT AND ADVANCED
Subgroup Test Scores
GROUP LOW SCORES HIGH SCORES PROFICIENT OR
ADVANCED
STUDENTS TESTED
COMMENTS
Boys 47% 431 GENDER: About 11 percent more girls than boys at our school scored Proficient or Advanced.
Girls 58% 374
English proficient 55% 752 ENGLISH PROFICIENCY: English Learners scored lower on the CST than students who are proficient in English. Because we give this test in English, English Learners tend to be at a disadvantage. English Learners 2% 53
Low income 28% 166 INCOME: About 30 percent fewer students from lower-income families scored Proficient or Advanced than our other students.
Not low income 58% 639
Learning disabled 10% 73 LEARNING DISABILITIES: Students classified as learning disabled scored lower than students without learning disabilities. The CST is not designed to test the progress of students with moderate to severe learning differences. Not learning disabled 56% 733
Asian American DATA STATISTICALLY UNRELIABLE N/S 26 ETHNICITY: Test scores are likely to vary among students of different ethnic origins. The degree of variance will differ from school to school. Measures of the achievement gap are beyond the scope of this report.Hispanic/Latino 31% 180
White/Other 62% 485
SOURCE: The scores for the CST are from the spring 2008 test cycle. County and state averages represent high schools only. Whenever a school reports fewer than 11 scores for a particular subgroup at any grade level, the CDE suppresses the scores when it releases the data to the public. Missing data makes it impossible for us to compile complete schoolwide results. Therefore, the results published in this report may vary from other published CDE test scores.N/A: Not applicable. Either no students took the test, or to safeguard student privacy the CDE withheld all results because very few students took the test in any grade.N/S: Not statistically significant. While we have some data to report, we are suppressing it because the number of valid test scores is not large enough to be meaningful.
100
80
60
40
20
0
20
40
60
80
100
2006 2007 2008
Three-Year Trend:English/Language Arts
Perc
enta
ge
of
stu
den
ts
SOURCE: CDE STAR research file: 2006, 2007, and 2008.
Percentage of studentswho took the test:
2006: 98%
2007: 97%
2008: 97%
Santa Cruz City School District
Soquel High School School Accountability Report Card for 2007–2008 Page 9
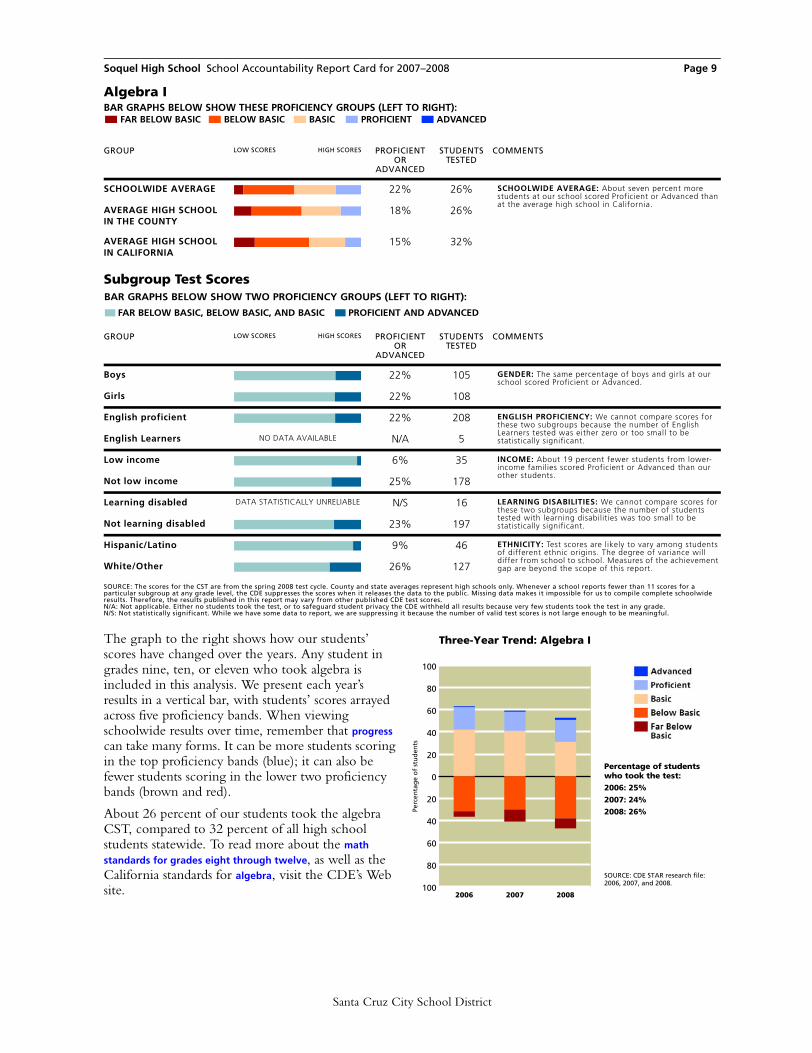
The graph to the right shows how our students’ scores have changed over the years. Any student in grades nine, ten, or eleven who took algebra is included in this analysis. We present each year’s results in a vertical bar, with students’ scores arrayed across five proficiency bands. When viewing schoolwide results over time, remember that progress can take many forms. It can be more students scoring in the top proficiency bands (blue); it can also be fewer students scoring in the lower two proficiency bands (brown and red).
About 26 percent of our students took the algebra CST, compared to 32 percent of all high school students statewide. To read more about the math
standards for grades eight through twelve, as well as the California standards for algebra, visit the CDE’s Web site.
BAR GRAPHS BELOW SHOW THESE PROFICIENCY GROUPS (LEFT TO RIGHT):FAR BELOW BASIC BELOW BASIC BASIC PROFICIENT ADVANCED
Algebra I
GROUP LOW SCORES HIGH SCORES PROFICIENT OR
ADVANCED
STUDENTS TESTED
COMMENTS
SCHOOLWIDE AVERAGE 22% 26% SCHOOLWIDE AVERAGE: About seven percent more students at our school scored Proficient or Advanced than at the average high school in California.
AVERAGE HIGH SCHOOL IN THE COUNTY
18% 26%
AVERAGE HIGH SCHOOL IN CALIFORNIA
15% 32%
BAR GRAPHS BELOW SHOW TWO PROFICIENCY GROUPS (LEFT TO RIGHT):
FAR BELOW BASIC, BELOW BASIC, AND BASIC PROFICIENT AND ADVANCED
Subgroup Test Scores
GROUP LOW SCORES HIGH SCORES PROFICIENT OR
ADVANCED
STUDENTS TESTED
COMMENTS
Boys 22% 105 GENDER: The same percentage of boys and girls at our school scored Proficient or Advanced.
Girls 22% 108
English proficient 22% 208 ENGLISH PROFICIENCY: We cannot compare scores for these two subgroups because the number of English Learners tested was either zero or too small to be statistically significant. English Learners NO DATA AVAILABLE N/A 5
Low income 6% 35 INCOME: About 19 percent fewer students from lower-income families scored Proficient or Advanced than our other students.
Not low income 25% 178
Learning disabled DATA STATISTICALLY UNRELIABLE N/S 16 LEARNING DISABILITIES: We cannot compare scores for these two subgroups because the number of students tested with learning disabilities was too small to be statistically significant. Not learning disabled 23% 197
Hispanic/Latino 9% 46 ETHNICITY: Test scores are likely to vary among students of different ethnic origins. The degree of variance will differ from school to school. Measures of the achievement gap are beyond the scope of this report.White/Other 26% 127
SOURCE: The scores for the CST are from the spring 2008 test cycle. County and state averages represent high schools only. Whenever a school reports fewer than 11 scores for a particular subgroup at any grade level, the CDE suppresses the scores when it releases the data to the public. Missing data makes it impossible for us to compile complete schoolwide results. Therefore, the results published in this report may vary from other published CDE test scores.N/A: Not applicable. Either no students took the test, or to safeguard student privacy the CDE withheld all results because very few students took the test in any grade.N/S: Not statistically significant. While we have some data to report, we are suppressing it because the number of valid test scores is not large enough to be meaningful.
100
80
60
40
20
0
20
40
60
80
100
2006 2007 2008
Three-Year Trend: Algebra I
Perc
enta
ge
of
stu
den
ts
SOURCE: CDE STAR research file: 2006, 2007, and 2008.
Percentage of studentswho took the test:
2006: 25%
2007: 24%
2008: 26%
Santa Cruz City School District
Soquel High School School Accountability Report Card for 2007–2008 Page 10
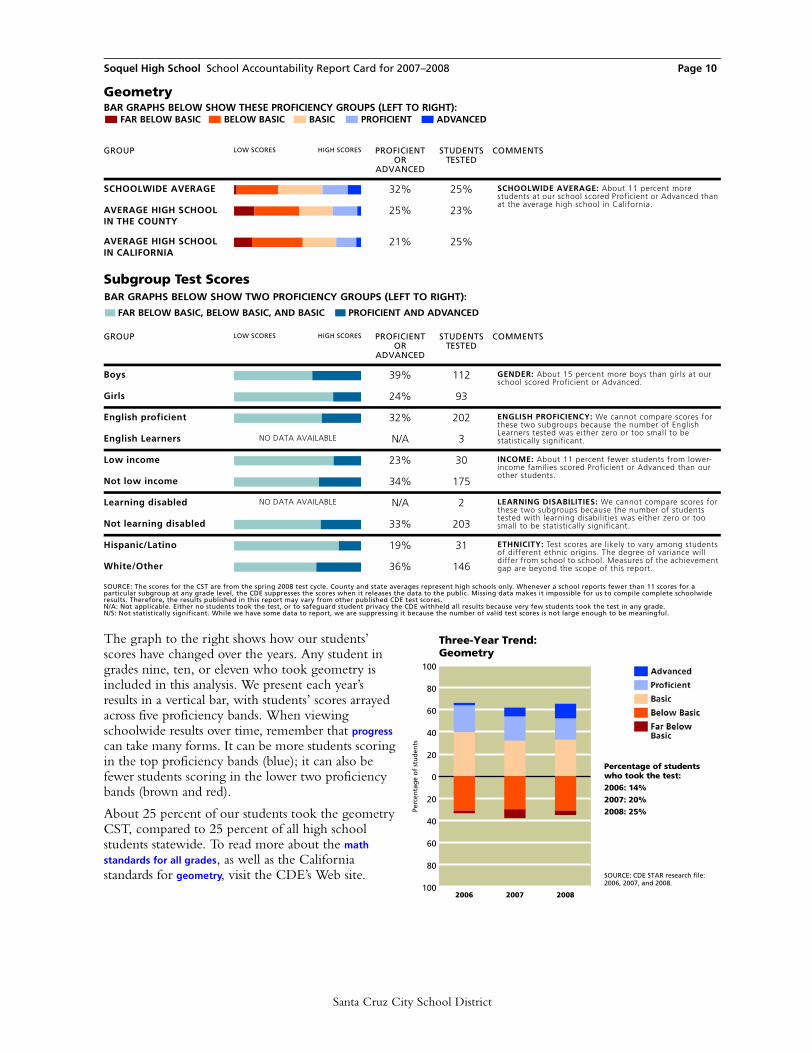
The graph to the right shows how our students’ scores have changed over the years. Any student in grades nine, ten, or eleven who took geometry is included in this analysis. We present each year’s results in a vertical bar, with students’ scores arrayed across five proficiency bands. When viewing schoolwide results over time, remember that progress can take many forms. It can be more students scoring in the top proficiency bands (blue); it can also be fewer students scoring in the lower two proficiency bands (brown and red).
About 25 percent of our students took the geometry CST, compared to 25 percent of all high school students statewide. To read more about the math
standards for all grades, as well as the California standards for geometry, visit the CDE’s Web site.
BAR GRAPHS BELOW SHOW THESE PROFICIENCY GROUPS (LEFT TO RIGHT):FAR BELOW BASIC BELOW BASIC BASIC PROFICIENT ADVANCED
Geometry
GROUP LOW SCORES HIGH SCORES PROFICIENT OR
ADVANCED
STUDENTS TESTED
COMMENTS
SCHOOLWIDE AVERAGE 32% 25% SCHOOLWIDE AVERAGE: About 11 percent more students at our school scored Proficient or Advanced than at the average high school in California.
AVERAGE HIGH SCHOOL IN THE COUNTY
25% 23%
AVERAGE HIGH SCHOOL IN CALIFORNIA
21% 25%
BAR GRAPHS BELOW SHOW TWO PROFICIENCY GROUPS (LEFT TO RIGHT):
FAR BELOW BASIC, BELOW BASIC, AND BASIC PROFICIENT AND ADVANCED
Subgroup Test Scores
GROUP LOW SCORES HIGH SCORES PROFICIENT OR
ADVANCED
STUDENTS TESTED
COMMENTS
Boys 39% 112 GENDER: About 15 percent more boys than girls at our school scored Proficient or Advanced.
Girls 24% 93
English proficient 32% 202 ENGLISH PROFICIENCY: We cannot compare scores for these two subgroups because the number of English Learners tested was either zero or too small to be statistically significant. English Learners NO DATA AVAILABLE N/A 3
Low income 23% 30 INCOME: About 11 percent fewer students from lower-income families scored Proficient or Advanced than our other students.
Not low income 34% 175
Learning disabled NO DATA AVAILABLE N/A 2 LEARNING DISABILITIES: We cannot compare scores for these two subgroups because the number of students tested with learning disabilities was either zero or too small to be statistically significant. Not learning disabled 33% 203
Hispanic/Latino 19% 31 ETHNICITY: Test scores are likely to vary among students of different ethnic origins. The degree of variance will differ from school to school. Measures of the achievement gap are beyond the scope of this report.White/Other 36% 146
SOURCE: The scores for the CST are from the spring 2008 test cycle. County and state averages represent high schools only. Whenever a school reports fewer than 11 scores for a particular subgroup at any grade level, the CDE suppresses the scores when it releases the data to the public. Missing data makes it impossible for us to compile complete schoolwide results. Therefore, the results published in this report may vary from other published CDE test scores.N/A: Not applicable. Either no students took the test, or to safeguard student privacy the CDE withheld all results because very few students took the test in any grade.N/S: Not statistically significant. While we have some data to report, we are suppressing it because the number of valid test scores is not large enough to be meaningful.
100
80
60
40
20
0
20
40
60
80
100
2006 2007 2008
Three-Year Trend: Geometry
Perc
enta
ge
of
stu
den
ts
SOURCE: CDE STAR research file: 2006, 2007, and 2008.
Percentage of studentswho took the test:
2006: 14%
2007: 20%
2008: 25%
Santa Cruz City School District
Soquel High School School Accountability Report Card for 2007–2008 Page 11
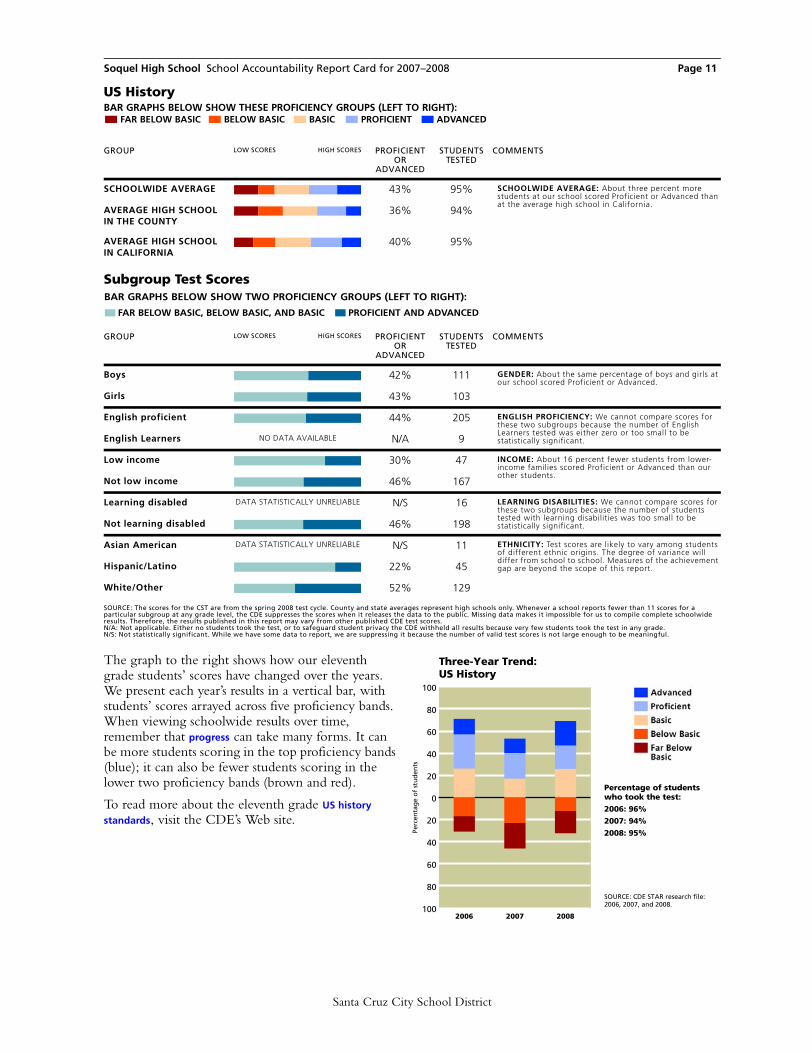
The graph to the right shows how our eleventh grade students’ scores have changed over the years. We present each year’s results in a vertical bar, with students’ scores arrayed across five proficiency bands. When viewing schoolwide results over time, remember that progress can take many forms. It can be more students scoring in the top proficiency bands (blue); it can also be fewer students scoring in the lower two proficiency bands (brown and red).
To read more about the eleventh grade US history
standards, visit the CDE’s Web site.
BAR GRAPHS BELOW SHOW THESE PROFICIENCY GROUPS (LEFT TO RIGHT):FAR BELOW BASIC BELOW BASIC BASIC PROFICIENT ADVANCED
US History
GROUP LOW SCORES HIGH SCORES PROFICIENT OR
ADVANCED
STUDENTS TESTED
COMMENTS
SCHOOLWIDE AVERAGE 43% 95% SCHOOLWIDE AVERAGE: About three percent more students at our school scored Proficient or Advanced than at the average high school in California.
AVERAGE HIGH SCHOOL IN THE COUNTY
36% 94%
AVERAGE HIGH SCHOOL IN CALIFORNIA
40% 95%
BAR GRAPHS BELOW SHOW TWO PROFICIENCY GROUPS (LEFT TO RIGHT):
FAR BELOW BASIC, BELOW BASIC, AND BASIC PROFICIENT AND ADVANCED
Subgroup Test Scores
GROUP LOW SCORES HIGH SCORES PROFICIENT OR
ADVANCED
STUDENTS TESTED
COMMENTS
Boys 42% 111 GENDER: About the same percentage of boys and girls at our school scored Proficient or Advanced.
Girls 43% 103
English proficient 44% 205 ENGLISH PROFICIENCY: We cannot compare scores for these two subgroups because the number of English Learners tested was either zero or too small to be statistically significant. English Learners NO DATA AVAILABLE N/A 9
Low income 30% 47 INCOME: About 16 percent fewer students from lower-income families scored Proficient or Advanced than our other students.
Not low income 46% 167
Learning disabled DATA STATISTICALLY UNRELIABLE N/S 16 LEARNING DISABILITIES: We cannot compare scores for these two subgroups because the number of students tested with learning disabilities was too small to be statistically significant. Not learning disabled 46% 198
Asian American DATA STATISTICALLY UNRELIABLE N/S 11 ETHNICITY: Test scores are likely to vary among students of different ethnic origins. The degree of variance will differ from school to school. Measures of the achievement gap are beyond the scope of this report.Hispanic/Latino 22% 45
White/Other 52% 129
SOURCE: The scores for the CST are from the spring 2008 test cycle. County and state averages represent high schools only. Whenever a school reports fewer than 11 scores for a particular subgroup at any grade level, the CDE suppresses the scores when it releases the data to the public. Missing data makes it impossible for us to compile complete schoolwide results. Therefore, the results published in this report may vary from other published CDE test scores.N/A: Not applicable. Either no students took the test, or to safeguard student privacy the CDE withheld all results because very few students took the test in any grade.N/S: Not statistically significant. While we have some data to report, we are suppressing it because the number of valid test scores is not large enough to be meaningful.
100
80
60
40
20
0
20
40
60
80
100
2006 2007 2008
Three-Year Trend: US History
Perc
enta
ge
of
stu
den
ts
SOURCE: CDE STAR research file: 2006, 2007, and 2008.
Percentage of studentswho took the test:
2006: 96%
2007: 94%
2008: 95%
Santa Cruz City School District
Soquel High School School Accountability Report Card for 2007–2008 Page 12
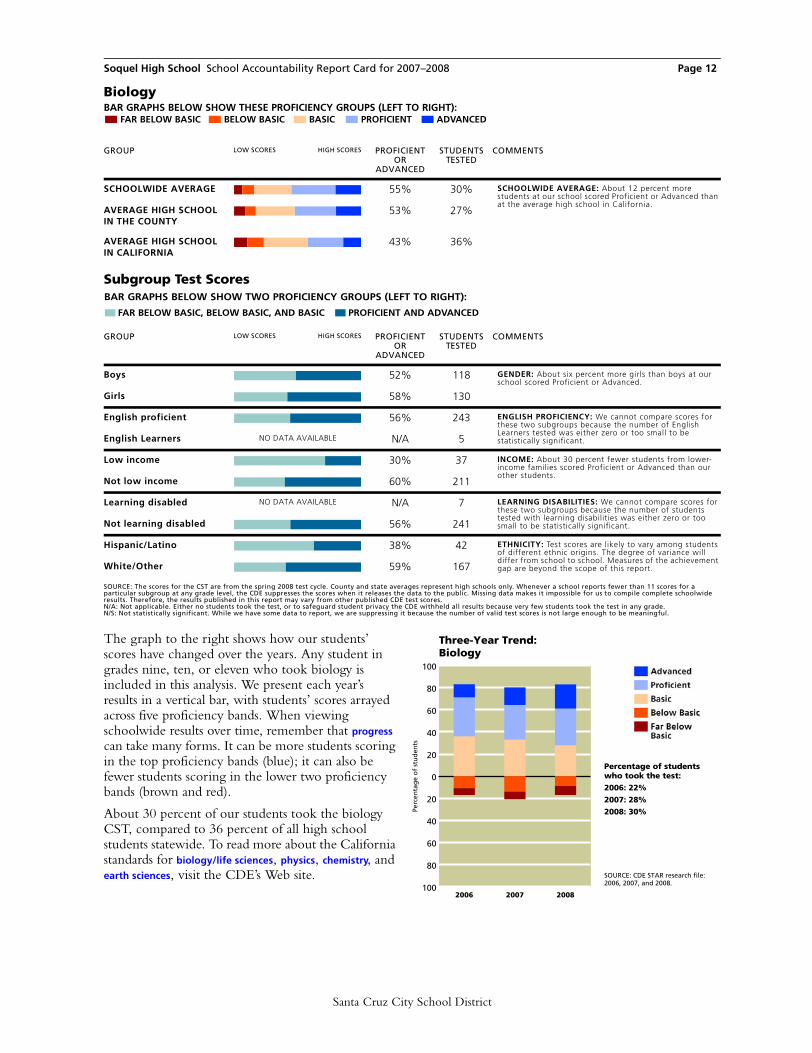
The graph to the right shows how our students’ scores have changed over the years. Any student in grades nine, ten, or eleven who took biology is included in this analysis. We present each year’s results in a vertical bar, with students’ scores arrayed across five proficiency bands. When viewing schoolwide results over time, remember that progress can take many forms. It can be more students scoring in the top proficiency bands (blue); it can also be fewer students scoring in the lower two proficiency bands (brown and red).
About 30 percent of our students took the biology CST, compared to 36 percent of all high school students statewide. To read more about the California standards for biology/life sciences, physics, chemistry, and earth sciences, visit the CDE’s Web site.
BAR GRAPHS BELOW SHOW THESE PROFICIENCY GROUPS (LEFT TO RIGHT):FAR BELOW BASIC BELOW BASIC BASIC PROFICIENT ADVANCED
Biology
GROUP LOW SCORES HIGH SCORES PROFICIENT OR
ADVANCED
STUDENTS TESTED
COMMENTS
SCHOOLWIDE AVERAGE 55% 30% SCHOOLWIDE AVERAGE: About 12 percent more students at our school scored Proficient or Advanced than at the average high school in California.
AVERAGE HIGH SCHOOL IN THE COUNTY
53% 27%
AVERAGE HIGH SCHOOL IN CALIFORNIA
43% 36%
BAR GRAPHS BELOW SHOW TWO PROFICIENCY GROUPS (LEFT TO RIGHT):
FAR BELOW BASIC, BELOW BASIC, AND BASIC PROFICIENT AND ADVANCED
Subgroup Test Scores
GROUP LOW SCORES HIGH SCORES PROFICIENT OR
ADVANCED
STUDENTS TESTED
COMMENTS
Boys 52% 118 GENDER: About six percent more girls than boys at our school scored Proficient or Advanced.
Girls 58% 130
English proficient 56% 243 ENGLISH PROFICIENCY: We cannot compare scores for these two subgroups because the number of English Learners tested was either zero or too small to be statistically significant. English Learners NO DATA AVAILABLE N/A 5
Low income 30% 37 INCOME: About 30 percent fewer students from lower-income families scored Proficient or Advanced than our other students.
Not low income 60% 211
Learning disabled NO DATA AVAILABLE N/A 7 LEARNING DISABILITIES: We cannot compare scores for these two subgroups because the number of students tested with learning disabilities was either zero or too small to be statistically significant. Not learning disabled 56% 241
Hispanic/Latino 38% 42 ETHNICITY: Test scores are likely to vary among students of different ethnic origins. The degree of variance will differ from school to school. Measures of the achievement gap are beyond the scope of this report.White/Other 59% 167
SOURCE: The scores for the CST are from the spring 2008 test cycle. County and state averages represent high schools only. Whenever a school reports fewer than 11 scores for a particular subgroup at any grade level, the CDE suppresses the scores when it releases the data to the public. Missing data makes it impossible for us to compile complete schoolwide results. Therefore, the results published in this report may vary from other published CDE test scores.N/A: Not applicable. Either no students took the test, or to safeguard student privacy the CDE withheld all results because very few students took the test in any grade.N/S: Not statistically significant. While we have some data to report, we are suppressing it because the number of valid test scores is not large enough to be meaningful.
100
80
60
40
20
0
20
40
60
80
100
2006 2007 2008
Three-Year Trend: Biology
Perc
enta
ge
of
stu
den
ts
SOURCE: CDE STAR research file: 2006, 2007, and 2008.
Percentage of studentswho took the test:
2006: 22%
2007: 28%
2008: 30%
Santa Cruz City School District
Soquel High School School Accountability Report Card for 2007–2008 Page 13
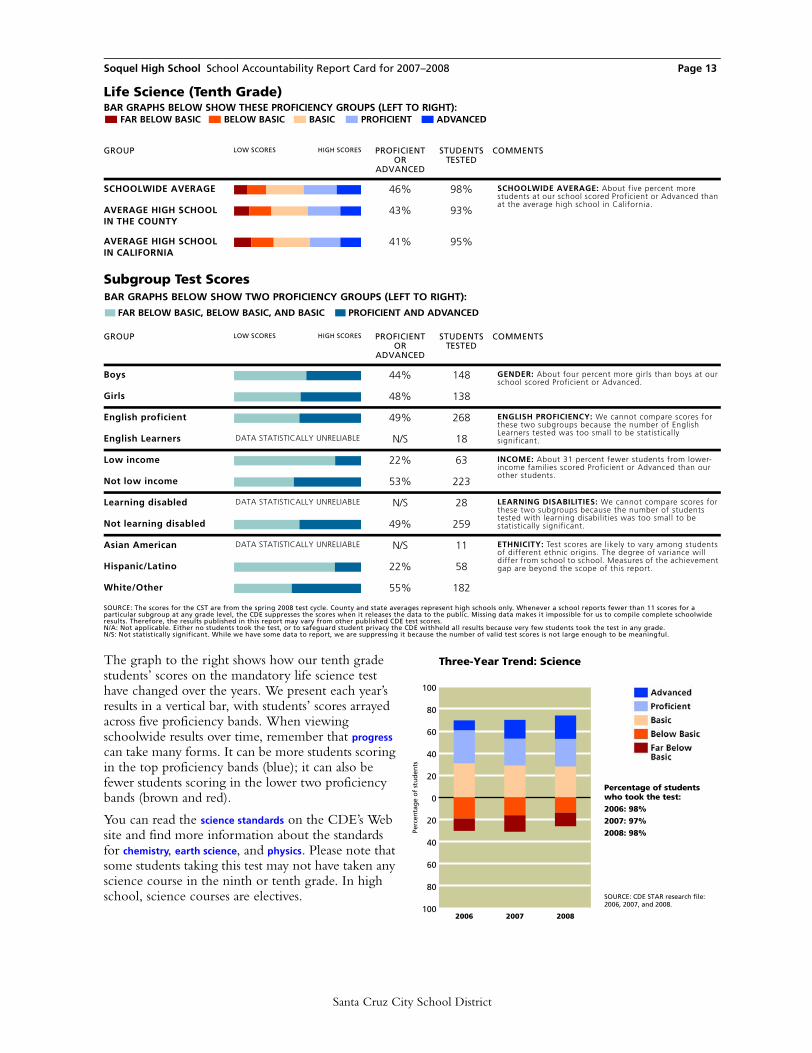
The graph to the right shows how our tenth grade students’ scores on the mandatory life science test have changed over the years. We present each year’s results in a vertical bar, with students’ scores arrayed across five proficiency bands. When viewing schoolwide results over time, remember that progress can take many forms. It can be more students scoring in the top proficiency bands (blue); it can also be fewer students scoring in the lower two proficiency bands (brown and red).
You can read the science standards on the CDE’s Web site and find more information about the standards for chemistry, earth science, and physics. Please note that some students taking this test may not have taken any science course in the ninth or tenth grade. In high school, science courses are electives.
BAR GRAPHS BELOW SHOW THESE PROFICIENCY GROUPS (LEFT TO RIGHT):FAR BELOW BASIC BELOW BASIC BASIC PROFICIENT ADVANCED
Life Science (Tenth Grade)
GROUP LOW SCORES HIGH SCORES PROFICIENT OR
ADVANCED
STUDENTS TESTED
COMMENTS
SCHOOLWIDE AVERAGE 46% 98% SCHOOLWIDE AVERAGE: About five percent more students at our school scored Proficient or Advanced than at the average high school in California.
AVERAGE HIGH SCHOOL IN THE COUNTY
43% 93%
AVERAGE HIGH SCHOOL IN CALIFORNIA
41% 95%
BAR GRAPHS BELOW SHOW TWO PROFICIENCY GROUPS (LEFT TO RIGHT):
FAR BELOW BASIC, BELOW BASIC, AND BASIC PROFICIENT AND ADVANCED
Subgroup Test Scores
GROUP LOW SCORES HIGH SCORES PROFICIENT OR
ADVANCED
STUDENTS TESTED
COMMENTS
Boys 44% 148 GENDER: About four percent more girls than boys at our school scored Proficient or Advanced.
Girls 48% 138
English proficient 49% 268 ENGLISH PROFICIENCY: We cannot compare scores for these two subgroups because the number of English Learners tested was too small to be statistically significant. English Learners DATA STATISTICALLY UNRELIABLE N/S 18
Low income 22% 63 INCOME: About 31 percent fewer students from lower-income families scored Proficient or Advanced than our other students.
Not low income 53% 223
Learning disabled DATA STATISTICALLY UNRELIABLE N/S 28 LEARNING DISABILITIES: We cannot compare scores for these two subgroups because the number of students tested with learning disabilities was too small to be statistically significant. Not learning disabled 49% 259
Asian American DATA STATISTICALLY UNRELIABLE N/S 11 ETHNICITY: Test scores are likely to vary among students of different ethnic origins. The degree of variance will differ from school to school. Measures of the achievement gap are beyond the scope of this report.Hispanic/Latino 22% 58
White/Other 55% 182
SOURCE: The scores for the CST are from the spring 2008 test cycle. County and state averages represent high schools only. Whenever a school reports fewer than 11 scores for a particular subgroup at any grade level, the CDE suppresses the scores when it releases the data to the public. Missing data makes it impossible for us to compile complete schoolwide results. Therefore, the results published in this report may vary from other published CDE test scores.N/A: Not applicable. Either no students took the test, or to safeguard student privacy the CDE withheld all results because very few students took the test in any grade.N/S: Not statistically significant. While we have some data to report, we are suppressing it because the number of valid test scores is not large enough to be meaningful.
100
80
60
40
20
0
20
40
60
80
100
2006 2007 2008
Three-Year Trend: Science
Perc
enta
ge
of
stu
den
ts
SOURCE: CDE STAR research file: 2006, 2007, and 2008.
Percentage of studentswho took the test:
2006: 98%
2007: 97%
2008: 98%
Santa Cruz City School District
Soquel High School School Accountability Report Card for 2007–2008 Page 14
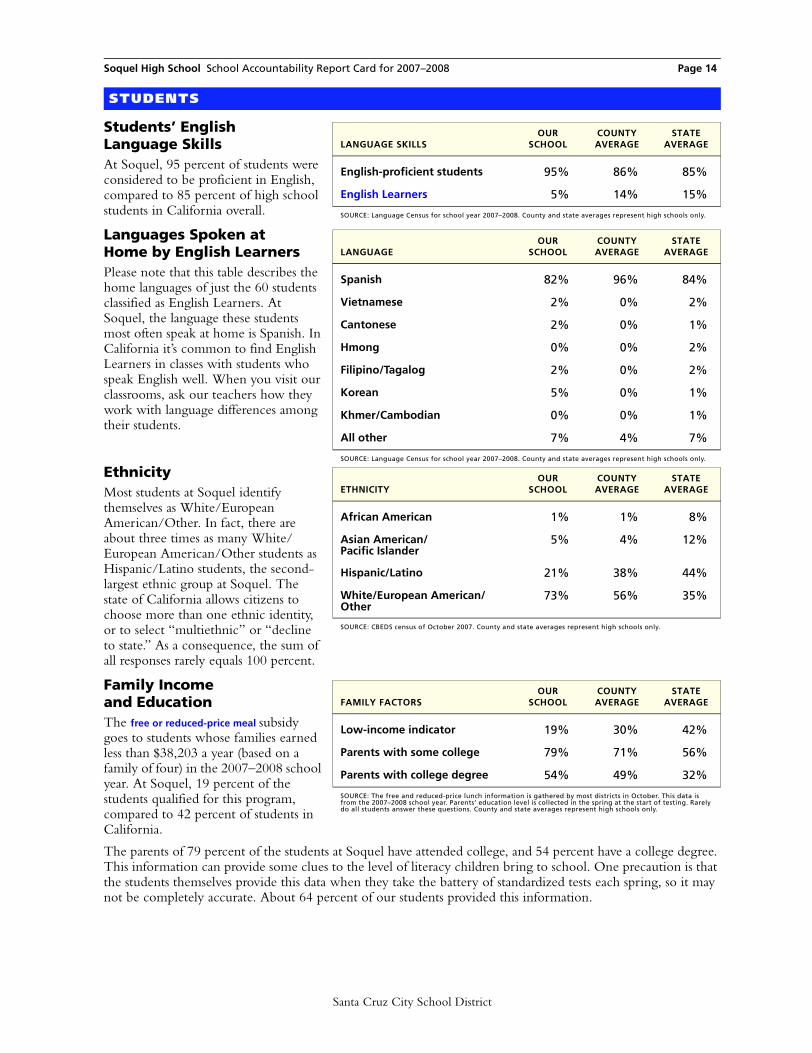
Students’ English Language SkillsAt Soquel, 95 percent of students were considered to be proficient in English, compared to 85 percent of high school students in California overall.
Languages Spoken atHome by English LearnersPlease note that this table describes the home languages of just the 60 students classified as English Learners. At Soquel, the language these students most often speak at home is Spanish. In California it’s common to find English Learners in classes with students who speak English well. When you visit our classrooms, ask our teachers how they work with language differences among their students.
EthnicityMost students at Soquel identify themselves as White/European American/Other. In fact, there are about three times as many White/European American/Other students as Hispanic/Latino students, the second-largest ethnic group at Soquel. The state of California allows citizens to choose more than one ethnic identity, or to select “multiethnic” or “decline to state.” As a consequence, the sum of all responses rarely equals 100 percent.
Family Income and EducationThe free or reduced-price meal subsidy goes to students whose families earned less than $38,203 a year (based on a family of four) in the 2007–2008 school year. At Soquel, 19 percent of the students qualified for this program, compared to 42 percent of students in California.
The parents of 79 percent of the students at Soquel have attended college, and 54 percent have a college degree. This information can provide some clues to the level of literacy children bring to school. One precaution is that the students themselves provide this data when they take the battery of standardized tests each spring, so it may not be completely accurate. About 64 percent of our students provided this information.
STUDENTS
LANGUAGE SKILLSOUR
SCHOOLCOUNTYAVERAGE
STATEAVERAGE
English-proficient students 95% 86% 85%
English Learners 5% 14% 15%
SOURCE: Language Census for school year 2007–2008. County and state averages represent high schools only.
LANGUAGEOUR
SCHOOLCOUNTYAVERAGE
STATEAVERAGE
Spanish 82% 96% 84%
Vietnamese 2% 0% 2%
Cantonese 2% 0% 1%
Hmong 0% 0% 2%
Filipino/Tagalog 2% 0% 2%
Korean 5% 0% 1%
Khmer/Cambodian 0% 0% 1%
All other 7% 4% 7%
SOURCE: Language Census for school year 2007–2008. County and state averages represent high schools only.
ETHNICITYOUR
SCHOOLCOUNTYAVERAGE
STATEAVERAGE
African American 1% 1% 8%
Asian American/Pacific Islander
5% 4% 12%
Hispanic/Latino 21% 38% 44%
White/European American/Other
73% 56% 35%
SOURCE: CBEDS census of October 2007. County and state averages represent high schools only.
FAMILY FACTORSOUR
SCHOOLCOUNTYAVERAGE
STATEAVERAGE
Low-income indicator 19% 30% 42%
Parents with some college 79% 71% 56%
Parents with college degree 54% 49% 32%
SOURCE: The free and reduced-price lunch information is gathered by most districts in October. This data is from the 2007–2008 school year. Parents’ education level is collected in the spring at the start of testing. Rarely do all students answer these questions. County and state averages represent high schools only.
Santa Cruz City School District
Soquel High School School Accountability Report Card for 2007–2008 Page 15
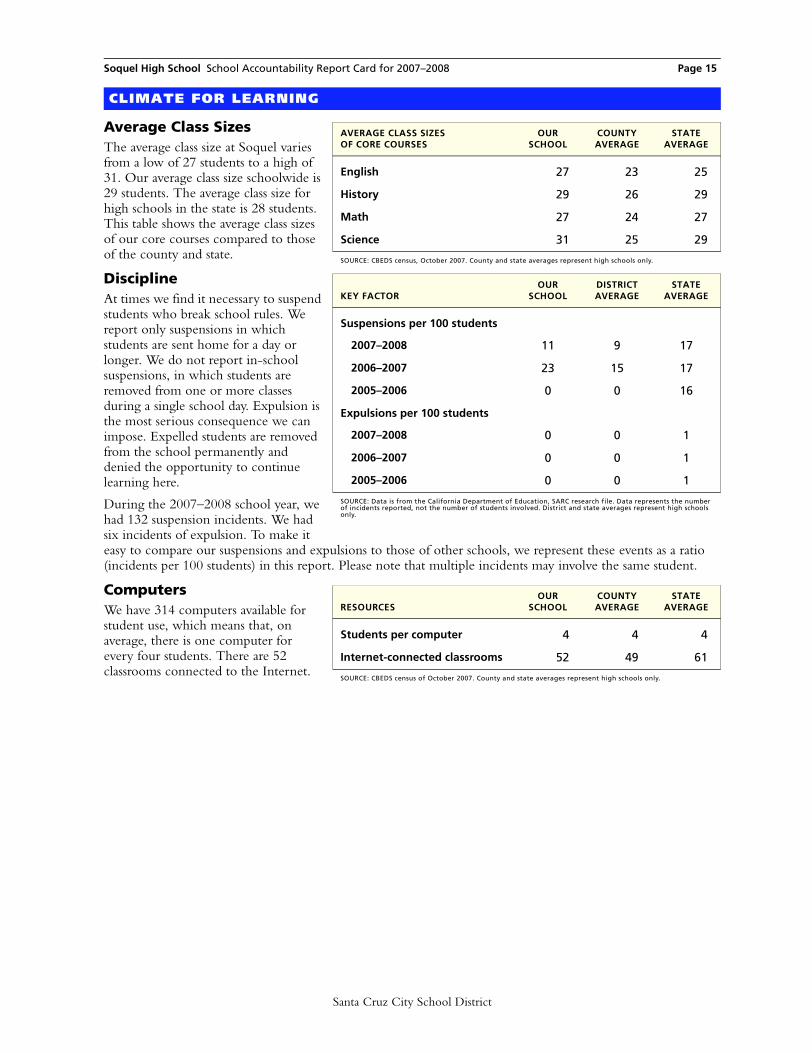
Average Class SizesThe average class size at Soquel varies from a low of 27 students to a high of 31. Our average class size schoolwide is 29 students. The average class size for high schools in the state is 28 students. This table shows the average class sizes of our core courses compared to those of the county and state.
DisciplineAt times we find it necessary to suspend students who break school rules. We report only suspensions in which students are sent home for a day or longer. We do not report in-school suspensions, in which students are removed from one or more classes during a single school day. Expulsion is the most serious consequence we can impose. Expelled students are removed from the school permanently and denied the opportunity to continue learning here.
During the 2007–2008 school year, we had 132 suspension incidents. We had six incidents of expulsion. To make it easy to compare our suspensions and expulsions to those of other schools, we represent these events as a ratio (incidents per 100 students) in this report. Please note that multiple incidents may involve the same student.
ComputersWe have 314 computers available for student use, which means that, on average, there is one computer for every four students. There are 52 classrooms connected to the Internet.
CLIMATE FOR LEARNING
AVERAGE CLASS SIZESOF CORE COURSES
OURSCHOOL
COUNTYAVERAGE
STATEAVERAGE
English 27 23 25
History 29 26 29
Math 27 24 27
Science 31 25 29
SOURCE: CBEDS census, October 2007. County and state averages represent high schools only.
KEY FACTOROUR
SCHOOLDISTRICTAVERAGE
STATEAVERAGE
Suspensions per 100 students
2007–2008 11 9 17
2006–2007 23 15 17
2005–2006 0 0 16
Expulsions per 100 students
2007–2008 0 0 1
2006–2007 0 0 1
2005–2006 0 0 1
SOURCE: Data is from the California Department of Education, SARC research file. Data represents the number of incidents reported, not the number of students involved. District and state averages represent high schools only.
RESOURCESOUR
SCHOOLCOUNTYAVERAGE
STATEAVERAGE
Students per computer 4 4 4
Internet-connected classrooms 52 49 61
SOURCE: CBEDS census of October 2007. County and state averages represent high schools only.
Santa Cruz City School District
Soquel High School School Accountability Report Card for 2007–2008 Page 16
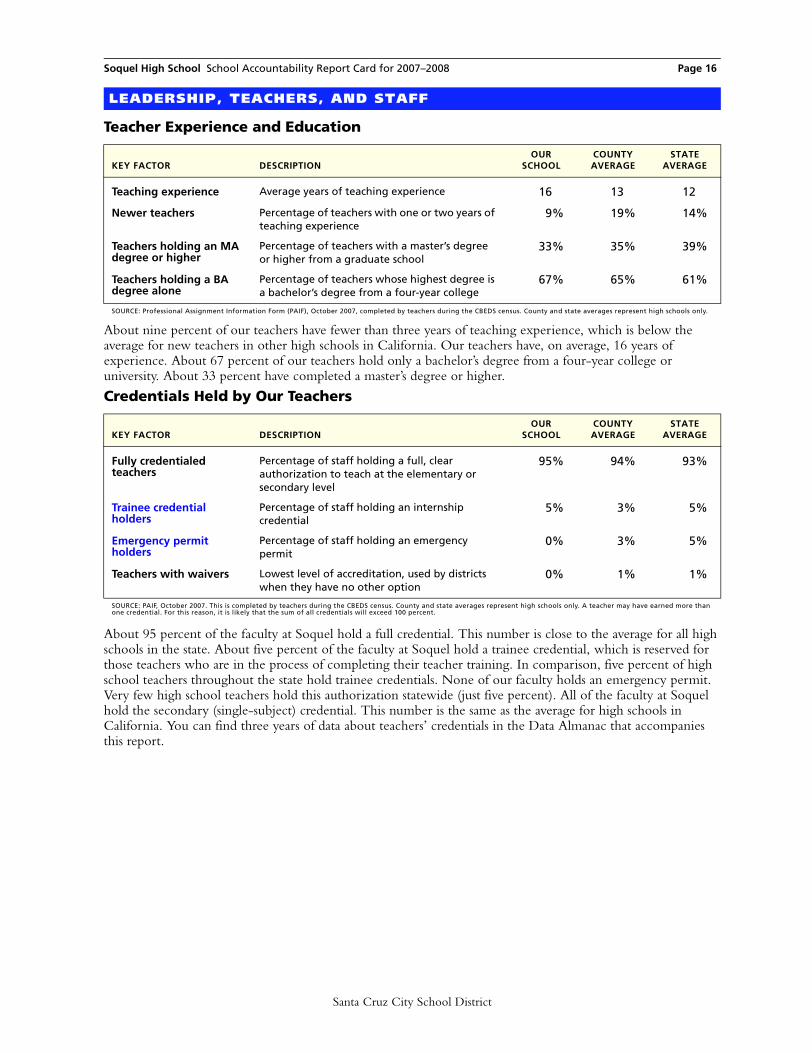
About nine percent of our teachers have fewer than three years of teaching experience, which is below the average for new teachers in other high schools in California. Our teachers have, on average, 16 years of experience. About 67 percent of our teachers hold only a bachelor’s degree from a four-year college or university. About 33 percent have completed a master’s degree or higher.
About 95 percent of the faculty at Soquel hold a full credential. This number is close to the average for all high schools in the state. About five percent of the faculty at Soquel hold a trainee credential, which is reserved for those teachers who are in the process of completing their teacher training. In comparison, five percent of high school teachers throughout the state hold trainee credentials. None of our faculty holds an emergency permit. Very few high school teachers hold this authorization statewide (just five percent). All of the faculty at Soquel hold the secondary (single-subject) credential. This number is the same as the average for high schools in California. You can find three years of data about teachers’ credentials in the Data Almanac that accompanies this report.
LEADERSHIP, TEACHERS, AND STAFF
Teacher Experience and Education
KEY FACTOR DESCRIPTIONOUR
SCHOOLCOUNTYAVERAGE
STATEAVERAGE
Teaching experience Average years of teaching experience 16% 13% 12%
Newer teachers Percentage of teachers with one or two years of teaching experience
9% 19% 14%
Teachers holding an MA degree or higher
Percentage of teachers with a master’s degree or higher from a graduate school
33% 35% 39%
Teachers holding a BA degree alone
Percentage of teachers whose highest degree is a bachelor’s degree from a four-year college
67% 65% 61%
SOURCE: Professional Assignment Information Form (PAIF), October 2007, completed by teachers during the CBEDS census. County and state averages represent high schools only.
Credentials Held by Our Teachers
KEY FACTOR DESCRIPTIONOUR
SCHOOLCOUNTYAVERAGE
STATEAVERAGE
Fully credentialed teachers
Percentage of staff holding a full, clear authorization to teach at the elementary or secondary level
95% 94% 93%
Trainee credential holders
Percentage of staff holding an internship credential
5% 3% 5%
Emergency permit holders
Percentage of staff holding an emergency permit
0% 3% 5%
Teachers with waivers Lowest level of accreditation, used by districts when they have no other option
0% 1% 1%
SOURCE: PAIF, October 2007. This is completed by teachers during the CBEDS census. County and state averages represent high schools only. A teacher may have earned more than one credential. For this reason, it is likely that the sum of all credentials will exceed 100 percent.
Santa Cruz City School District
Soquel High School School Accountability Report Card for 2007–2008 Page 17
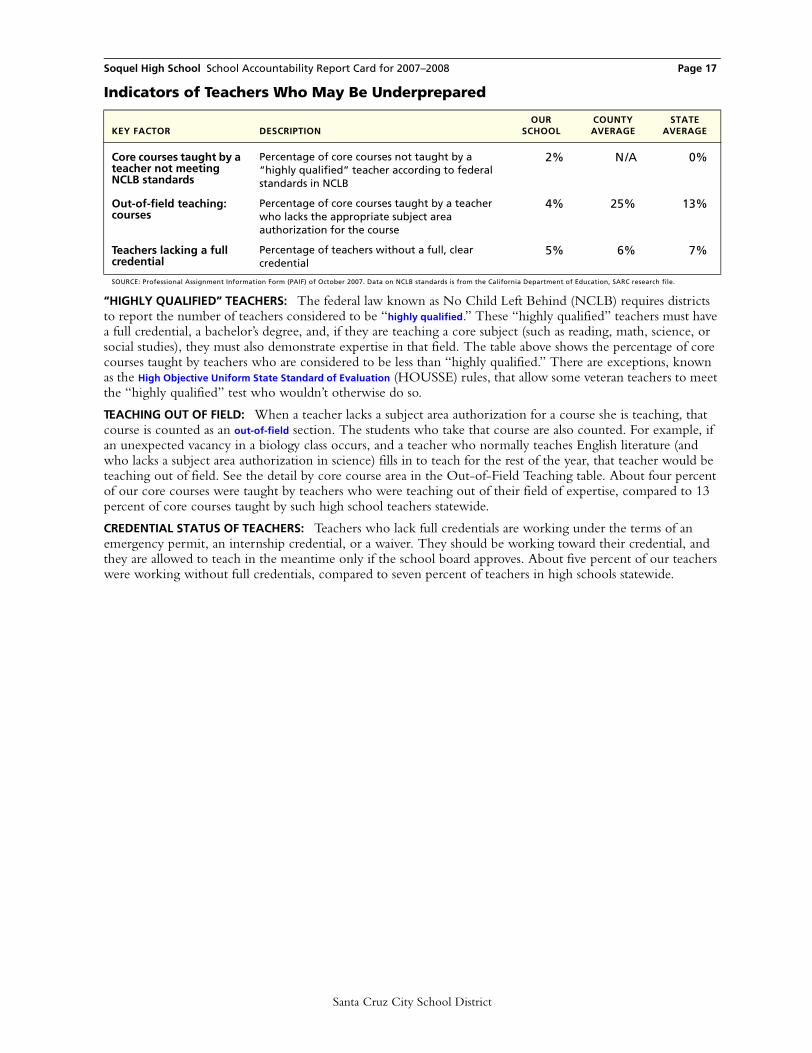
“HIGHLY QUALIFIED” TEACHERS: The federal law known as No Child Left Behind (NCLB) requires districts to report the number of teachers considered to be “highly qualified.” These “highly qualified” teachers must have a full credential, a bachelor’s degree, and, if they are teaching a core subject (such as reading, math, science, or social studies), they must also demonstrate expertise in that field. The table above shows the percentage of core courses taught by teachers who are considered to be less than “highly qualified.” There are exceptions, known as the High Objective Uniform State Standard of Evaluation (HOUSSE) rules, that allow some veteran teachers to meet the “highly qualified” test who wouldn’t otherwise do so.
TEACHING OUT OF FIELD: When a teacher lacks a subject area authorization for a course she is teaching, that course is counted as an out-of-field section. The students who take that course are also counted. For example, if an unexpected vacancy in a biology class occurs, and a teacher who normally teaches English literature (and who lacks a subject area authorization in science) fills in to teach for the rest of the year, that teacher would be teaching out of field. See the detail by core course area in the Out-of-Field Teaching table. About four percent of our core courses were taught by teachers who were teaching out of their field of expertise, compared to 13 percent of core courses taught by such high school teachers statewide.
CREDENTIAL STATUS OF TEACHERS: Teachers who lack full credentials are working under the terms of an emergency permit, an internship credential, or a waiver. They should be working toward their credential, and they are allowed to teach in the meantime only if the school board approves. About five percent of our teachers were working without full credentials, compared to seven percent of teachers in high schools statewide.
Indicators of Teachers Who May Be Underprepared
KEY FACTOR DESCRIPTIONOUR
SCHOOLCOUNTYAVERAGE
STATEAVERAGE
Core courses taught by a teacher not meeting NCLB standards
Percentage of core courses not taught by a “highly qualified” teacher according to federal standards in NCLB
2% N/A 0%
Out-of-field teaching: courses
Percentage of core courses taught by a teacher who lacks the appropriate subject area authorization for the course
4% 25% 13%
Teachers lacking a full credential
Percentage of teachers without a full, clear credential
5% 6% 7%
SOURCE: Professional Assignment Information Form (PAIF) of October 2007. Data on NCLB standards is from the California Department of Education, SARC research file.
Santa Cruz City School District
Soquel High School School Accountability Report Card for 2007–2008 Page 18
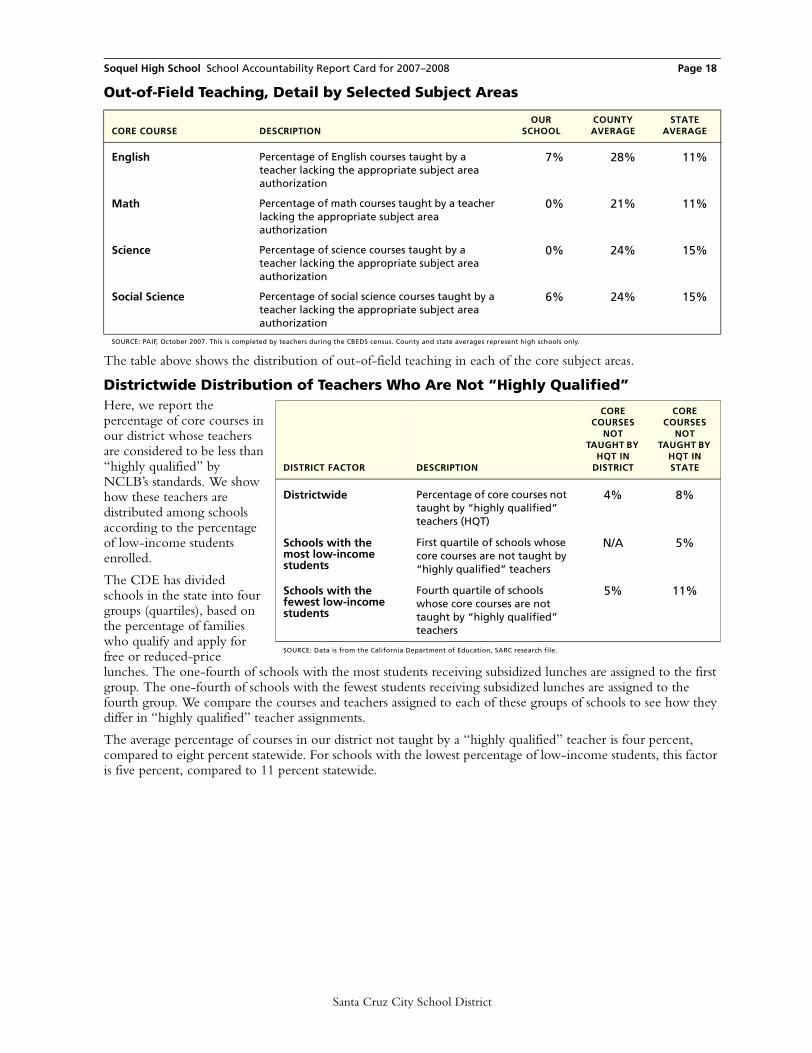
The table above shows the distribution of out-of-field teaching in each of the core subject areas.
Districtwide Distribution of Teachers Who Are Not “Highly Qualified”Here, we report the percentage of core courses in our district whose teachers are considered to be less than “highly qualified” by NCLB’s standards. We show how these teachers are distributed among schools according to the percentage of low-income students enrolled.
The CDE has divided schools in the state into four groups (quartiles), based on the percentage of families who qualify and apply for free or reduced-price lunches. The one-fourth of schools with the most students receiving subsidized lunches are assigned to the first group. The one-fourth of schools with the fewest students receiving subsidized lunches are assigned to the fourth group. We compare the courses and teachers assigned to each of these groups of schools to see how they differ in “highly qualified” teacher assignments.
The average percentage of courses in our district not taught by a “highly qualified” teacher is four percent, compared to eight percent statewide. For schools with the lowest percentage of low-income students, this factor is five percent, compared to 11 percent statewide.
Out-of-Field Teaching, Detail by Selected Subject Areas
CORE COURSE DESCRIPTIONOUR
SCHOOLCOUNTYAVERAGE
STATEAVERAGE
English Percentage of English courses taught by a teacher lacking the appropriate subject area authorization
7% 28% 11%
Math Percentage of math courses taught by a teacher lacking the appropriate subject area authorization
0% 21% 11%
Science Percentage of science courses taught by a teacher lacking the appropriate subject area authorization
0% 24% 15%
Social Science Percentage of social science courses taught by a teacher lacking the appropriate subject area authorization
6% 24% 15%
SOURCE: PAIF, October 2007. This is completed by teachers during the CBEDS census. County and state averages represent high schools only.
DISTRICT FACTOR DESCRIPTION
CORE COURSES
NOT TAUGHT BY
HQT IN DISTRICT
CORE COURSES
NOT TAUGHT BY
HQT IN STATE
Districtwide Percentage of core courses not taught by “highly qualified” teachers (HQT)
4% 8%
Schools with the most low-income students
First quartile of schools whose core courses are not taught by “highly qualified” teachers
N/A 5%
Schools with the fewest low-income students
Fourth quartile of schools whose core courses are not taught by “highly qualified” teachers
5% 11%
SOURCE: Data is from the California Department of Education, SARC research file.
Santa Cruz City School District
Soquel High School School Accountability Report Card for 2007–2008 Page 19
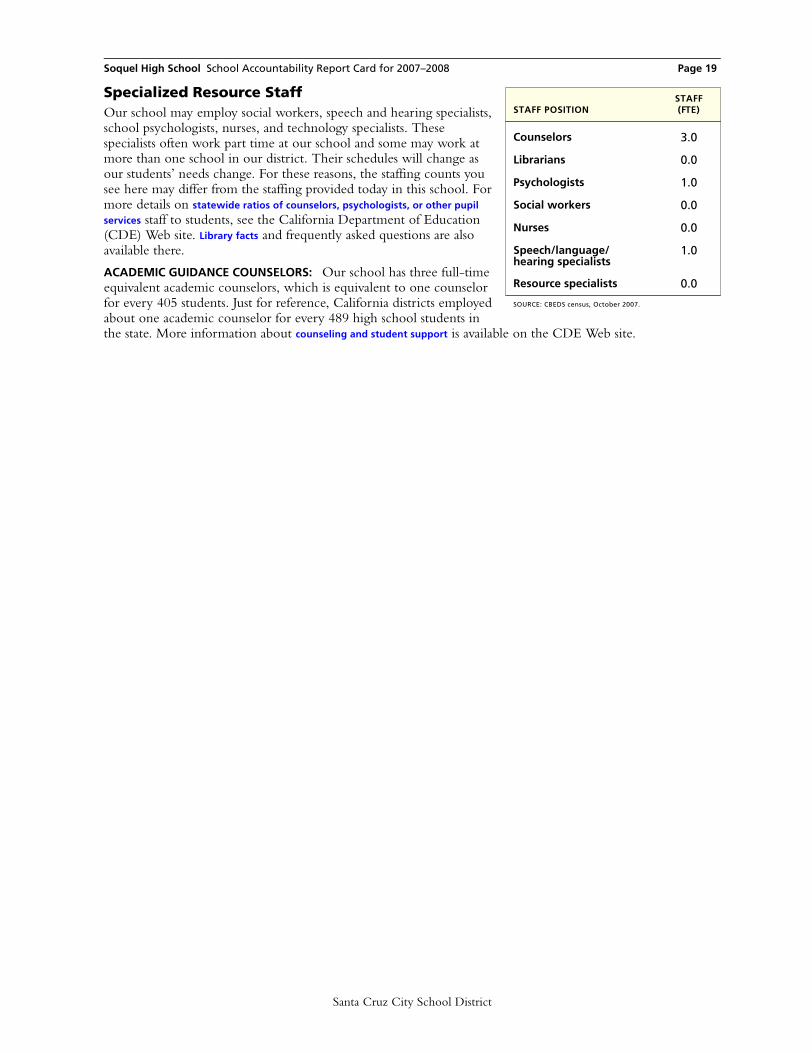
Specialized Resource StaffOur school may employ social workers, speech and hearing specialists, school psychologists, nurses, and technology specialists. These specialists often work part time at our school and some may work at more than one school in our district. Their schedules will change as our students’ needs change. For these reasons, the staffing counts you see here may differ from the staffing provided today in this school. For more details on statewide ratios of counselors, psychologists, or other pupil
services staff to students, see the California Department of Education (CDE) Web site. Library facts and frequently asked questions are also available there.
ACADEMIC GUIDANCE COUNSELORS: Our school has three full-time equivalent academic counselors, which is equivalent to one counselor for every 405 students. Just for reference, California districts employed about one academic counselor for every 489 high school students in the state. More information about counseling and student support is available on the CDE Web site.
STAFF POSITIONSTAFF (FTE)
Counselors 3.0
Librarians 0.0
Psychologists 1.0
Social workers 0.0
Nurses 0.0
Speech/language/hearing specialists
1.0
Resource specialists 0.0
SOURCE: CBEDS census, October 2007.
Santa Cruz City School District
Soquel High School School Accountability Report Card for 2007–2008 Page 20
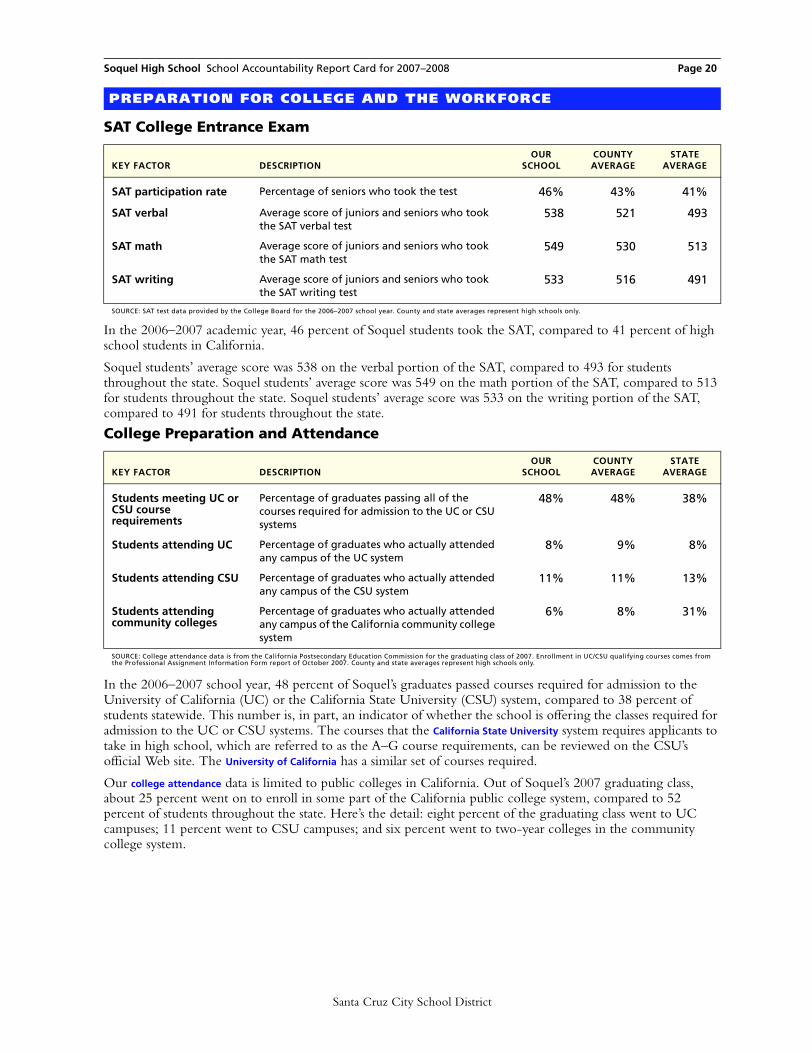
In the 2006–2007 academic year, 46 percent of Soquel students took the SAT, compared to 41 percent of high school students in California.
Soquel students’ average score was 538 on the verbal portion of the SAT, compared to 493 for students throughout the state. Soquel students’ average score was 549 on the math portion of the SAT, compared to 513 for students throughout the state. Soquel students’ average score was 533 on the writing portion of the SAT, compared to 491 for students throughout the state.
In the 2006–2007 school year, 48 percent of Soquel’s graduates passed courses required for admission to the University of California (UC) or the California State University (CSU) system, compared to 38 percent of students statewide. This number is, in part, an indicator of whether the school is offering the classes required for admission to the UC or CSU systems. The courses that the California State University system requires applicants to take in high school, which are referred to as the A–G course requirements, can be reviewed on the CSU’s official Web site. The University of California has a similar set of courses required.
Our college attendance data is limited to public colleges in California. Out of Soquel’s 2007 graduating class, about 25 percent went on to enroll in some part of the California public college system, compared to 52 percent of students throughout the state. Here’s the detail: eight percent of the graduating class went to UC campuses; 11 percent went to CSU campuses; and six percent went to two-year colleges in the community college system.
PREPARATION FOR COLLEGE AND THE WORKFORCE
SAT College Entrance Exam
KEY FACTOR DESCRIPTIONOUR
SCHOOLCOUNTYAVERAGE
STATEAVERAGE
SAT participation rate Percentage of seniors who took the test 46% 43% 41%
SAT verbal Average score of juniors and seniors who took the SAT verbal test
538 521 493
SAT math Average score of juniors and seniors who took the SAT math test
549 530 513
SAT writing Average score of juniors and seniors who took the SAT writing test
533 516 491
SOURCE: SAT test data provided by the College Board for the 2006–2007 school year. County and state averages represent high schools only.
College Preparation and Attendance
KEY FACTOR DESCRIPTIONOUR
SCHOOLCOUNTYAVERAGE
STATEAVERAGE
Students meeting UC or CSU course requirements
Percentage of graduates passing all of the courses required for admission to the UC or CSU systems
48% 48% 38%
Students attending UC Percentage of graduates who actually attended any campus of the UC system
8% 9% 8%
Students attending CSU Percentage of graduates who actually attended any campus of the CSU system
11% 11% 13%
Students attending community colleges
Percentage of graduates who actually attended any campus of the California community college system
6% 8% 31%
SOURCE: College attendance data is from the California Postsecondary Education Commission for the graduating class of 2007. Enrollment in UC/CSU qualifying courses comes from the Professional Assignment Information Form report of October 2007. County and state averages represent high schools only.
Santa Cruz City School District
Soquel High School School Accountability Report Card for 2007–2008 Page 21
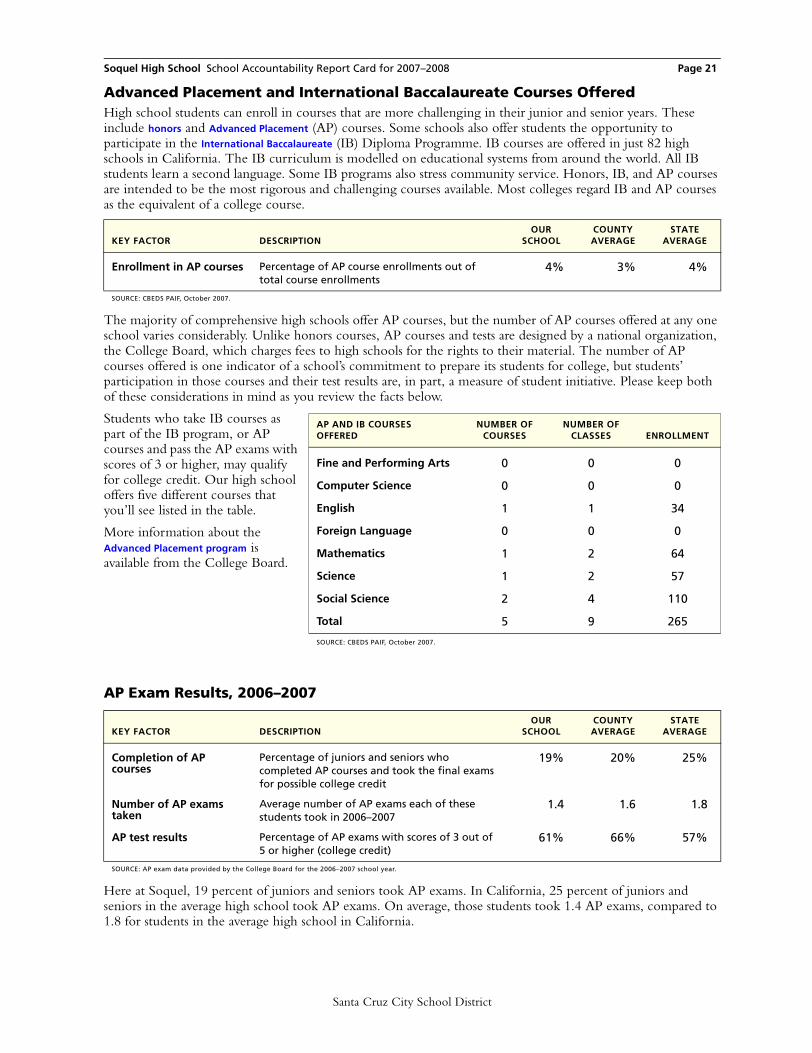
Advanced Placement and International Baccalaureate Courses OfferedHigh school students can enroll in courses that are more challenging in their junior and senior years. These include honors and Advanced Placement (AP) courses. Some schools also offer students the opportunity to participate in the International Baccalaureate (IB) Diploma Programme. IB courses are offered in just 82 high schools in California. The IB curriculum is modelled on educational systems from around the world. All IB students learn a second language. Some IB programs also stress community service. Honors, IB, and AP courses are intended to be the most rigorous and challenging courses available. Most colleges regard IB and AP courses as the equivalent of a college course.
The majority of comprehensive high schools offer AP courses, but the number of AP courses offered at any one school varies considerably. Unlike honors courses, AP courses and tests are designed by a national organization, the College Board, which charges fees to high schools for the rights to their material. The number of AP courses offered is one indicator of a school’s commitment to prepare its students for college, but students’ participation in those courses and their test results are, in part, a measure of student initiative. Please keep both of these considerations in mind as you review the facts below.
Students who take IB courses as part of the IB program, or AP courses and pass the AP exams with scores of 3 or higher, may qualify for college credit. Our high school offers five different courses that you’ll see listed in the table.
More information about the Advanced Placement program is available from the College Board.
Here at Soquel, 19 percent of juniors and seniors took AP exams. In California, 25 percent of juniors and seniors in the average high school took AP exams. On average, those students took 1.4 AP exams, compared to 1.8 for students in the average high school in California.
KEY FACTOR DESCRIPTIONOUR
SCHOOLCOUNTYAVERAGE
STATEAVERAGE
Enrollment in AP courses Percentage of AP course enrollments out of total course enrollments
4% 3% 4%
SOURCE: CBEDS PAIF, October 2007.
AP Exam Results, 2006–2007
KEY FACTOR DESCRIPTIONOUR
SCHOOLCOUNTYAVERAGE
STATEAVERAGE
Completion of AP courses
Percentage of juniors and seniors who completed AP courses and took the final exams for possible college credit
19% 20% 25%
Number of AP exams taken
Average number of AP exams each of these students took in 2006–2007
1.4 1.6 1.8
AP test results Percentage of AP exams with scores of 3 out of 5 or higher (college credit)
61% 66% 57%
SOURCE: AP exam data provided by the College Board for the 2006–2007 school year.
AP AND IB COURSES OFFERED
NUMBER OF COURSES
NUMBER OF CLASSES ENROLLMENT
Fine and Performing Arts 0 0 0
Computer Science 0 0 0
English 1 1 34
Foreign Language 0 0 0
Mathematics 1 2 64
Science 1 2 57
Social Science 2 4 110
Total 5 9 265
SOURCE: CBEDS PAIF, October 2007.
Santa Cruz City School District
Soquel High School School Accountability Report Card for 2007–2008 Page 22
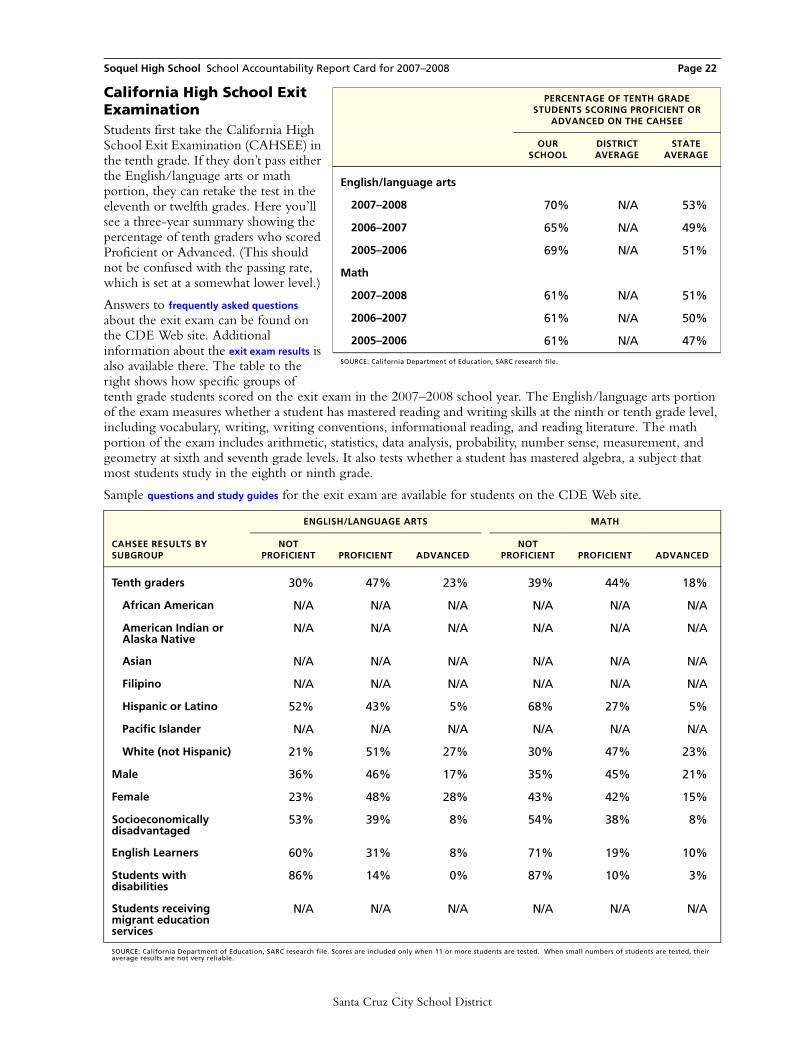
California High School Exit ExaminationStudents first take the California High School Exit Examination (CAHSEE) in the tenth grade. If they don’t pass either the English/language arts or math portion, they can retake the test in the eleventh or twelfth grades. Here you’ll see a three-year summary showing the percentage of tenth graders who scored Proficient or Advanced. (This should not be confused with the passing rate, which is set at a somewhat lower level.)
Answers to frequently asked questions about the exit exam can be found on the CDE Web site. Additional information about the exit exam results is also available there. The table to the right shows how specific groups of tenth grade students scored on the exit exam in the 2007–2008 school year. The English/language arts portion of the exam measures whether a student has mastered reading and writing skills at the ninth or tenth grade level, including vocabulary, writing, writing conventions, informational reading, and reading literature. The math portion of the exam includes arithmetic, statistics, data analysis, probability, number sense, measurement, and geometry at sixth and seventh grade levels. It also tests whether a student has mastered algebra, a subject that most students study in the eighth or ninth grade.
Sample questions and study guides for the exit exam are available for students on the CDE Web site.
ENGLISH/LANGUAGE ARTS MATH
CAHSEE RESULTS BY SUBGROUP
NOT PROFICIENT PROFICIENT ADVANCED
NOT PROFICIENT PROFICIENT ADVANCED
Tenth graders 30% 47% 23% 39% 44% 18%
African American N/A N/A N/A N/A N/A N/A
American Indian or Alaska Native
N/A N/A N/A N/A N/A N/A
Asian N/A N/A N/A N/A N/A N/A
Filipino N/A N/A N/A N/A N/A N/A
Hispanic or Latino 52% 43% 5% 68% 27% 5%
Pacific Islander N/A N/A N/A N/A N/A N/A
White (not Hispanic) 21% 51% 27% 30% 47% 23%
Male 36% 46% 17% 35% 45% 21%
Female 23% 48% 28% 43% 42% 15%
Socioeconomically disadvantaged
53% 39% 8% 54% 38% 8%
English Learners 60% 31% 8% 71% 19% 10%
Students with disabilities
86% 14% 0% 87% 10% 3%
Students receiving migrant education services
N/A N/A N/A N/A N/A N/A
SOURCE: California Department of Education, SARC research file. Scores are included only when 11 or more students are tested. When small numbers of students are tested, their average results are not very reliable.
PERCENTAGE OF TENTH GRADE STUDENTS SCORING PROFICIENT OR
ADVANCED ON THE CAHSEE
OUR SCHOOL
DISTRICT AVERAGE
STATE AVERAGE
English/language arts
2007–2008 70% N/A 53%
2006–2007 65% N/A 49%
2005–2006 69% N/A 51%
Math
2007–2008 61% N/A 51%
2006–2007 61% N/A 50%
2005–2006 61% N/A 47%
SOURCE: California Department of Education, SARC research file.
Santa Cruz City School District
Soquel High School School Accountability Report Card for 2007–2008 Page 23
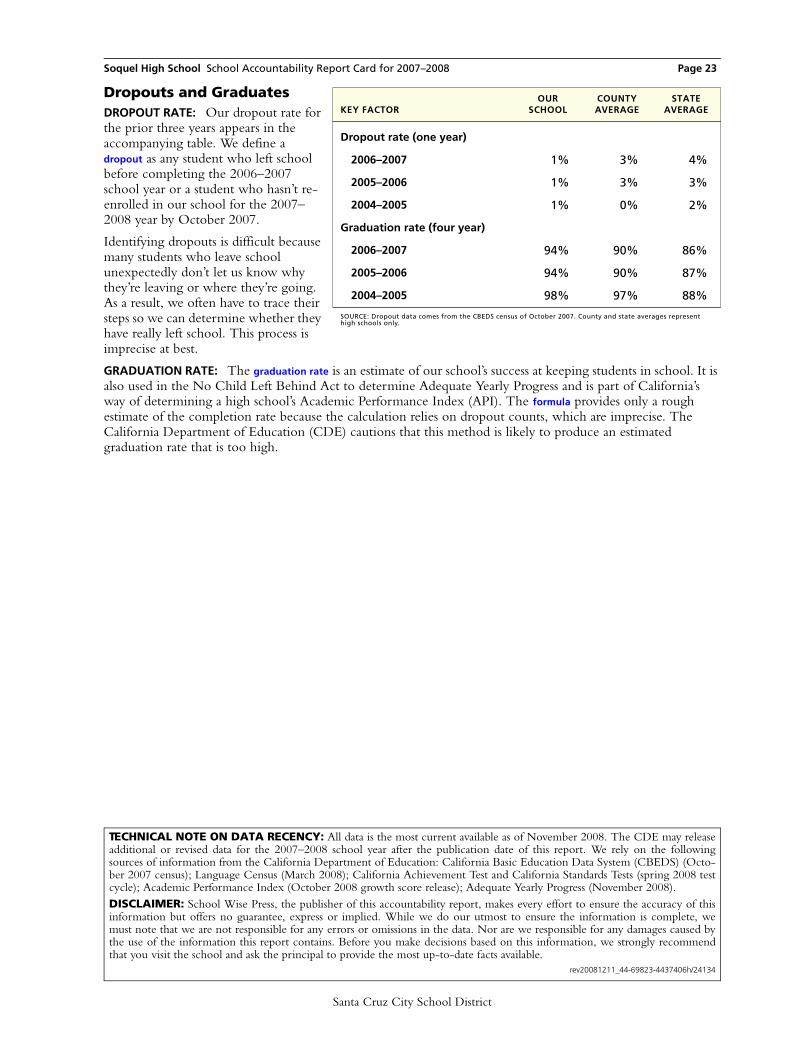
Dropouts and GraduatesDROPOUT RATE: Our dropout rate for the prior three years appears in the accompanying table. We define a dropout as any student who left school before completing the 2006–2007 school year or a student who hasn’t re-enrolled in our school for the 2007–2008 year by October 2007.
Identifying dropouts is difficult because many students who leave school unexpectedly don’t let us know why they’re leaving or where they’re going. As a result, we often have to trace their steps so we can determine whether they have really left school. This process is imprecise at best.
GRADUATION RATE: The graduation rate is an estimate of our school’s success at keeping students in school. It is also used in the No Child Left Behind Act to determine Adequate Yearly Progress and is part of California’s way of determining a high school’s Academic Performance Index (API). The formula provides only a rough estimate of the completion rate because the calculation relies on dropout counts, which are imprecise. The California Department of Education (CDE) cautions that this method is likely to produce an estimated graduation rate that is too high.
KEY FACTOROUR
SCHOOLCOUNTYAVERAGE
STATEAVERAGE
Dropout rate (one year)
2006–2007 1% 3% 4%
2005–2006 1% 3% 3%
2004–2005 1% 0% 2%
Graduation rate (four year)
2006–2007 94% 90% 86%
2005–2006 94% 90% 87%
2004–2005 98% 97% 88%
SOURCE: Dropout data comes from the CBEDS census of October 2007. County and state averages represent high schools only.
TECHNICAL NOTE ON DATA RECENCY: All data is the most current available as of November 2008. The CDE may releaseadditional or revised data for the 2007–2008 school year after the publication date of this report. We rely on the followingsources of information from the California Department of Education: California Basic Education Data System (CBEDS) (Octo-ber 2007 census); Language Census (March 2008); California Achievement Test and California Standards Tests (spring 2008 testcycle); Academic Performance Index (October 2008 growth score release); Adequate Yearly Progress (November 2008). DISCLAIMER: School Wise Press, the publisher of this accountability report, makes every effort to ensure the accuracy of thisinformation but offers no guarantee, express or implied. While we do our utmost to ensure the information is complete, wemust note that we are not responsible for any errors or omissions in the data. Nor are we responsible for any damages caused bythe use of the information this report contains. Before you make decisions based on this information, we strongly recommendthat you visit the school and ask the principal to provide the most up-to-date facts available.
rev20081211_44-69823-4437406h/24134
Santa Cruz City School District

School Accountability Report Card for 2007–2008
Santa Cruz City School District
CAREER TECHNICAL EDUCATION Our high school offers courses intended to help students prepare for the world of work. These career technical education courses (CTE, formerly known as vocational education) are open to all students.
Programs and Courses
COURSE
AGENCY OFFERING COURSE
OFFERED THROUGH ROC/ROP?
SATISFIES GRADUATION
REQUIREMENTS? PART OF A-G
CURRICULUM?
MEC Industrial Art Wheel SHS N Y N
MEC English 9 SHS N Y Y
Drafting, Adv Drafting SHS N Y N
Woodshop, Adv Woodshop SHS N Y N
Manf Tech, Adv Manf Tech SHS N Y N
Mill Cabinetry SCCROP Y Y N
Agricultural Science SHS N Y N
Agricultural Biology SHS N Y Y
Special Studies in Agriculture SHS N Y N
Environmental Horticultural Science SCCROP Y Y Y
Veterinary Science SCCROP Y Y Y
Floral Design SCCROP Y Y Y
Administration of Justice SCCROP Y Y N
Computer Graphics SCCROP Y Y N
Economics of Marketing SCCROP Y Y N
Sports Occupations SCCROP Y Y N
KEY FACTOR OUR
SCHOOL
Number of students participating in CTE courses
476
Percentage of students completing a CTE program and earning a high school diploma
96%
Percentage of CTE courses coordinated with colleges
63%
Page 24
School Accountability Report Card for 2007–2008
Santa Cruz City School District
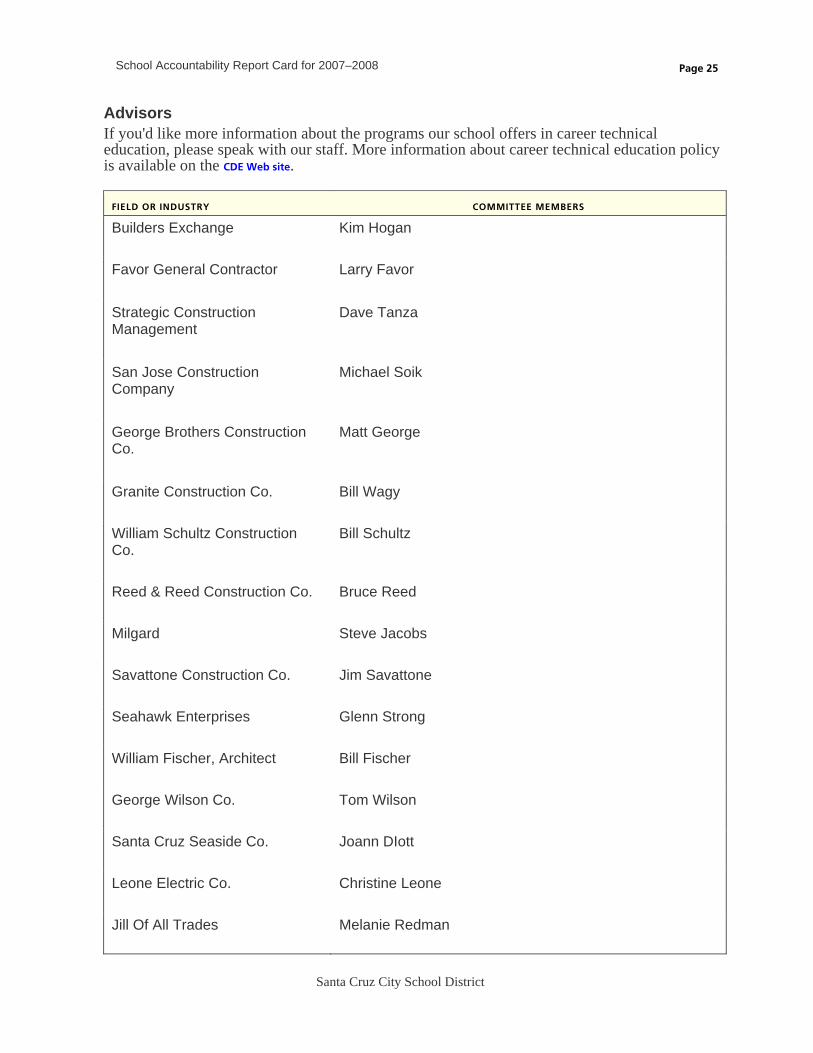
Advisors If you'd like more information about the programs our school offers in career technical education, please speak with our staff. More information about career technical education policy is available on the CDE Web site.
FIELD OR INDUSTRY COMMITTEE MEMBERS
Builders Exchange
Kim Hogan
Favor General Contractor
Larry Favor
Strategic Construction Management
Dave Tanza
San Jose Construction Company
Michael Soik
George Brothers Construction Co.
Matt George
Granite Construction Co.
Bill Wagy
William Schultz Construction Co.
Bill Schultz
Reed & Reed Construction Co.
Bruce Reed
Milgard
Steve Jacobs
Savattone Construction Co.
Jim Savattone
Seahawk Enterprises
Glenn Strong
William Fischer, Architect
Bill Fischer
George Wilson Co.
Tom Wilson
Santa Cruz Seaside Co.
Joann DIott
Leone Electric Co.
Christine Leone
Jill Of All Trades
Melanie Redman
Page 25
School Accountability Report Card for 2007–2008
Santa Cruz City School District
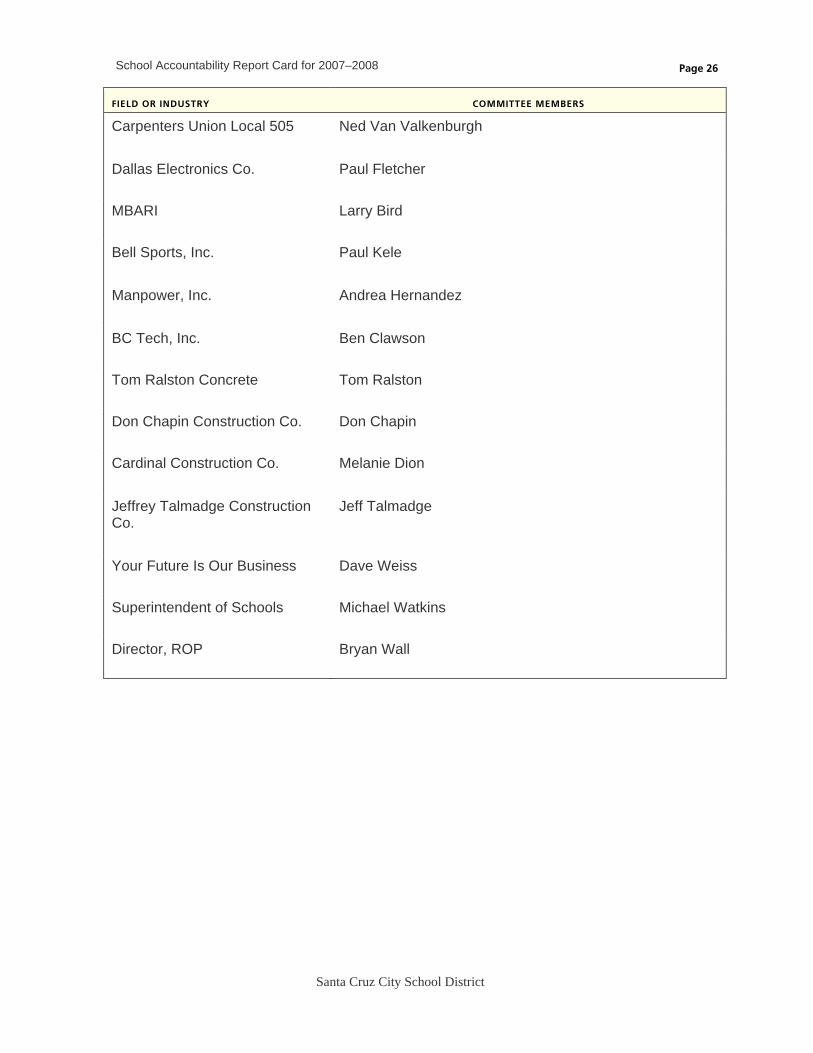
FIELD OR INDUSTRY COMMITTEE MEMBERS
Carpenters Union Local 505
Ned Van Valkenburgh
Dallas Electronics Co.
Paul Fletcher
MBARI
Larry Bird
Bell Sports, Inc.
Paul Kele
Manpower, Inc.
Andrea Hernandez
BC Tech, Inc.
Ben Clawson
Tom Ralston Concrete
Tom Ralston
Don Chapin Construction Co.
Don Chapin
Cardinal Construction Co.
Melanie Dion
Jeffrey Talmadge Construction Co.
Jeff Talmadge
Your Future Is Our Business
Dave Weiss
Superintendent of Schools
Michael Watkins
Director, ROP
Bryan Wall
Page 26
Soquel High School School Accountability Report Card for 2007–2008
Santa Cruz City School District
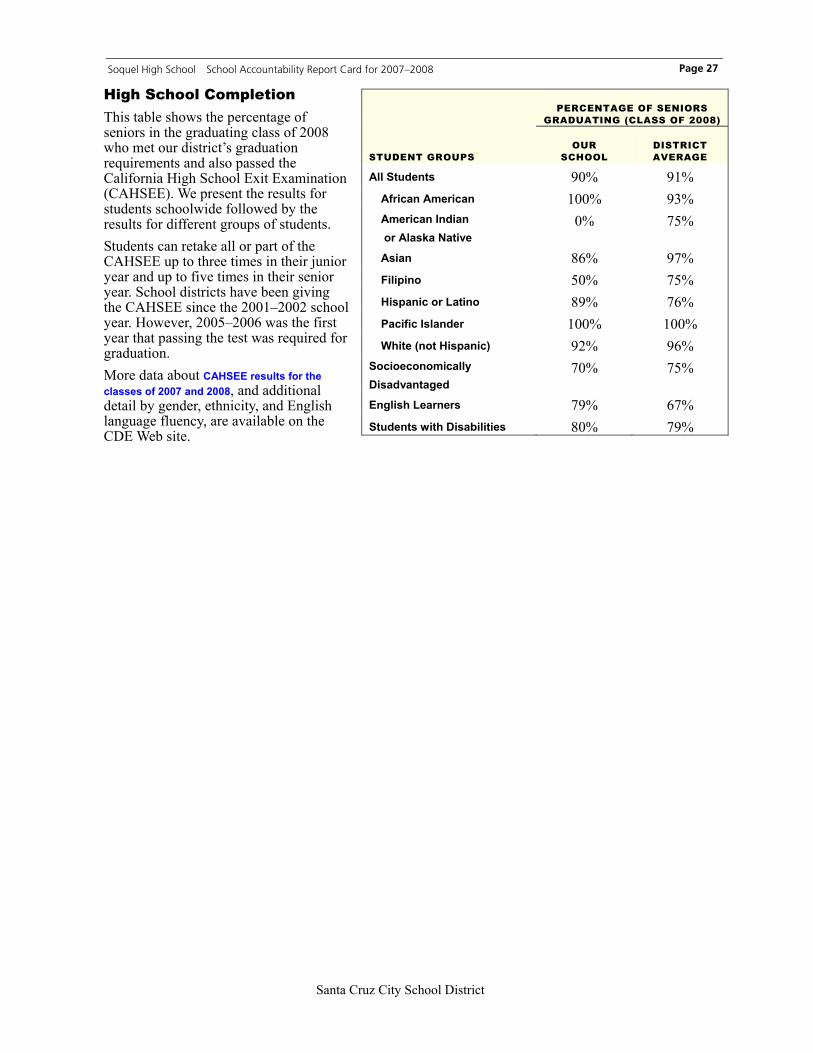
High School Completion This table shows the percentage of seniors in the graduating class of 2008 who met our district’s graduation requirements and also passed the California High School Exit Examination (CAHSEE). We present the results for students schoolwide followed by the results for different groups of students. Students can retake all or part of the CAHSEE up to three times in their junior year and up to five times in their senior year. School districts have been giving the CAHSEE since the 2001–2002 school year. However, 2005–2006 was the first year that passing the test was required for graduation. More data about CAHSEE results for the classes of 2007 and 2008, and additional detail by gender, ethnicity, and English language fluency, are available on the CDE Web site.
PERCENTAGE OF SENIORS
GRADUATING (CLASS OF 2008)
STUDENT GROUPS OUR
SCHOOL DISTRICT AVERAGE
All Students 90% 91% African American 100% 93% American Indian or Alaska Native
0% 75%
Asian 86% 97% Filipino 50% 75% Hispanic or Latino 89% 76% Pacific Islander 100% 100% White (not Hispanic) 92% 96%
Socioeconomically Disadvantaged
70% 75%
English Learners 79% 67% Students with Disabilities 80% 79%
Page 27

Page 28
Soquel High School School Accountability Report Card for 2007–2008
»
Page 29
Adequacy of Key Resources
Here you’ll find key facts about our teachers, textbooks, and facilities during the school year in progress, 2008–2009. Please note that these facts are based on evaluations our staff conducted in accordance with the Williams legislation.
This section also contains information about 2006–2007 staff development days, and, for high schools, percentages of seniors who met our district’s graduation requirements.
Santa Cruz City School District
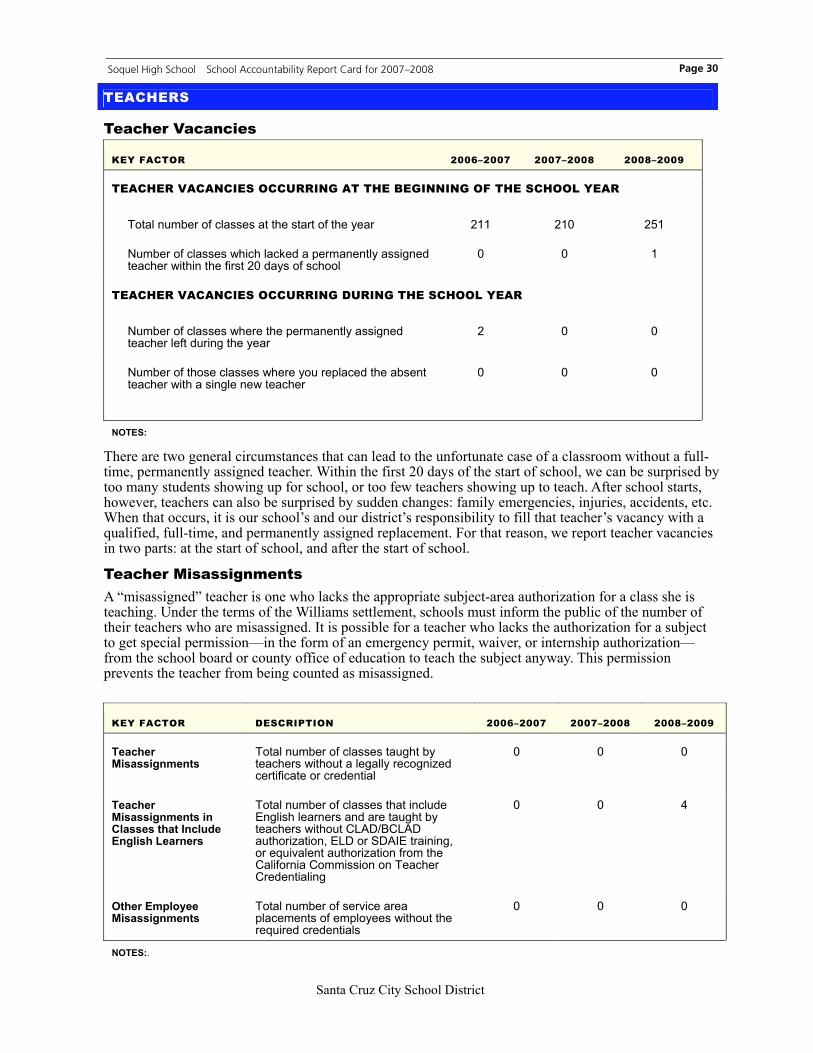
Soquel High School School Accountability Report Card for 2007–2008
Santa Cruz City School District
Teacher Vacancies
KEY FACTOR 2006–2007 2007–2008 2008–2009
TEACHER VACANCIES OCCURRING AT THE BEGINNING OF THE SCHOOL YEAR
Total number of classes at the start of the year 211 210 251
Number of classes which lacked a permanently assigned teacher within the first 20 days of school
0 0 1
TEACHER VACANCIES OCCURRING DURING THE SCHOOL YEAR
Number of classes where the permanently assigned teacher left during the year
2 0 0
Number of those classes where you replaced the absent teacher with a single new teacher
0 0 0
NOTES:
There are two general circumstances that can lead to the unfortunate case of a classroom without a full-time, permanently assigned teacher. Within the first 20 days of the start of school, we can be surprised by too many students showing up for school, or too few teachers showing up to teach. After school starts, however, teachers can also be surprised by sudden changes: family emergencies, injuries, accidents, etc. When that occurs, it is our school’s and our district’s responsibility to fill that teacher’s vacancy with a qualified, full-time, and permanently assigned replacement. For that reason, we report teacher vacancies in two parts: at the start of school, and after the start of school.
Teacher Misassignments A “misassigned” teacher is one who lacks the appropriate subject-area authorization for a class she is teaching. Under the terms of the Williams settlement, schools must inform the public of the number of their teachers who are misassigned. It is possible for a teacher who lacks the authorization for a subject to get special permission—in the form of an emergency permit, waiver, or internship authorization—from the school board or county office of education to teach the subject anyway. This permission prevents the teacher from being counted as misassigned.
KEY FACTOR DESCRIPTION 2006–2007 2007–2008 2008–2009
Teacher Misassignments
Total number of classes taught by teachers without a legally recognized certificate or credential
0 0 0
Teacher Misassignments in Classes that Include English Learners
Total number of classes that include English learners and are taught by teachers without CLAD/BCLAD authorization, ELD or SDAIE training, or equivalent authorization from the California Commission on Teacher Credentialing
0 0 4
Other Employee Misassignments
Total number of service area placements of employees without the required credentials
0 0 0
NOTES:.
TEACHERS
Page 30
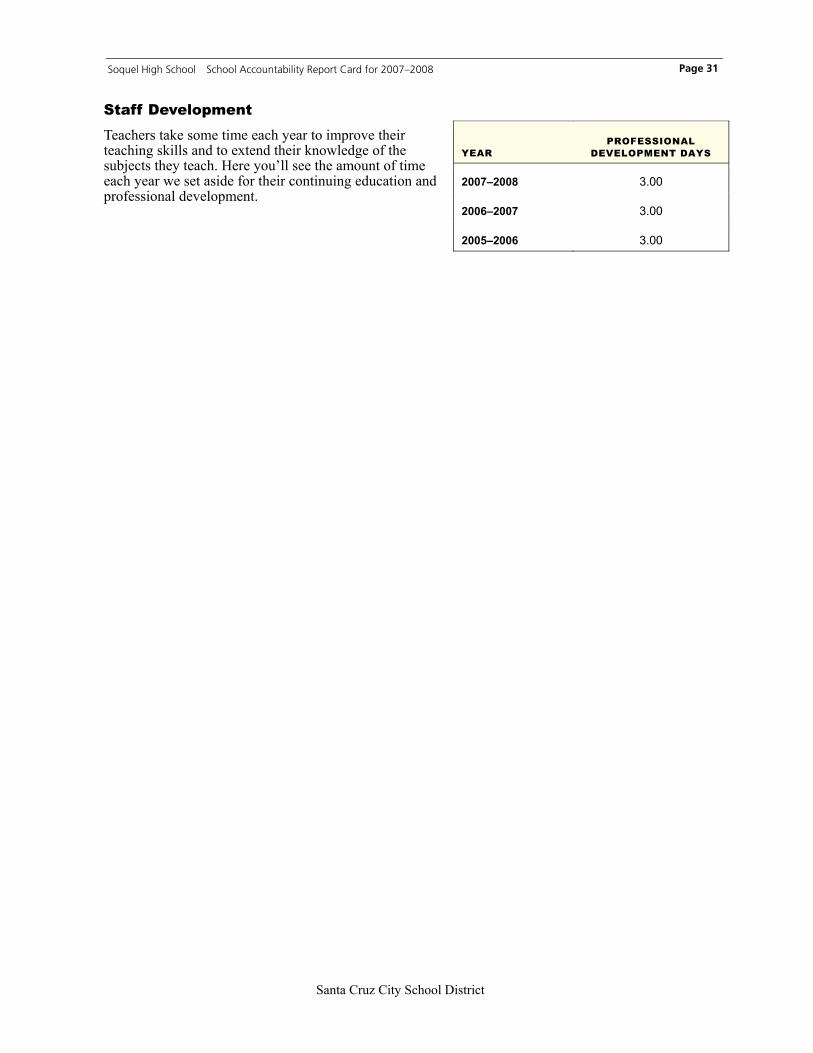
Soquel High School School Accountability Report Card for 2007–2008
Santa Cruz City School District
Staff Development
Teachers take some time each year to improve their teaching skills and to extend their knowledge of the subjects they teach. Here you’ll see the amount of time each year we set aside for their continuing education and professional development.
YEAR PROFESSIONAL
DEVELOPMENT DAYS
2007–2008 3.00
2006–2007 3.00
2005–2006 3.00
Page 31
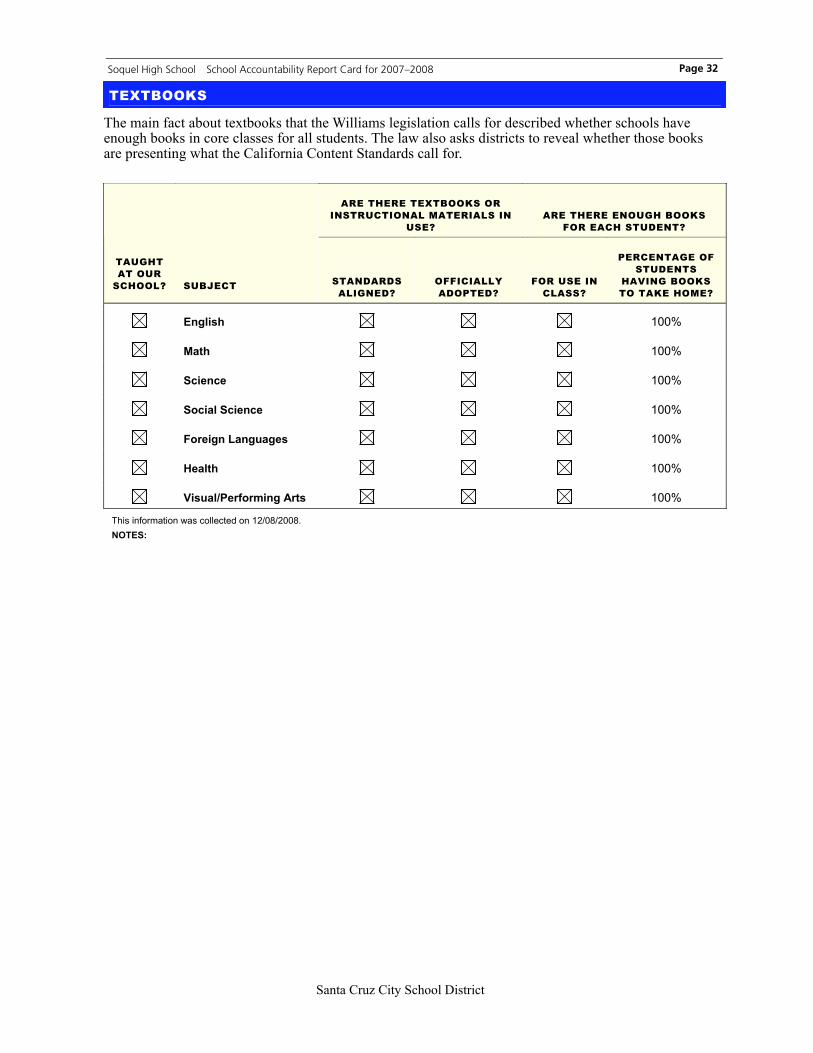
Soquel High School School Accountability Report Card for 2007–2008
Santa Cruz City School District
TEXTBOOKS
The main fact about textbooks that the Williams legislation calls for described whether schools have enough books in core classes for all students. The law also asks districts to reveal whether those books are presenting what the California Content Standards call for.
ARE THERE TEXTBOOKS OR INSTRUCTIONAL MATERIALS IN
USE? ARE THERE ENOUGH BOOKS
FOR EACH STUDENT?
TAUGHT AT OUR
SCHOOL? SUBJECT STANDARDS ALIGNED?
OFFICIALLY ADOPTED?
FOR USE IN CLASS?
PERCENTAGE OF STUDENTS
HAVING BOOKS TO TAKE HOME?
English 100%
Math 100%
Science 100%
Social Science 100%
Foreign Languages 100%
Health 100%
Visual/Performing Arts 100%
This information was collected on 12/08/2008. NOTES:
Page 32
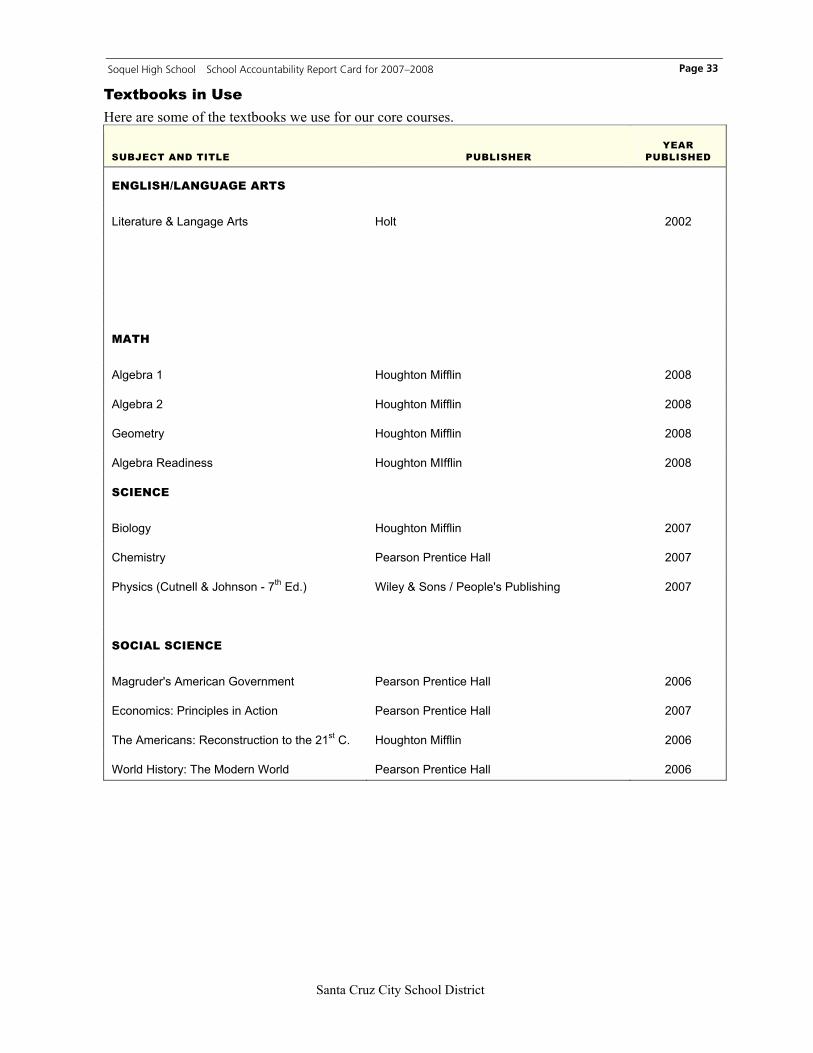
Soquel High School School Accountability Report Card for 2007–2008
Santa Cruz City School District
Textbooks in Use Here are some of the textbooks we use for our core courses.
SUBJECT AND TITLE PUBLISHER YEAR
PUBLISHED
ENGLISH/LANGUAGE ARTS
Literature & Langage Arts Holt 2002
MATH
Algebra 1 Houghton Mifflin 2008
Algebra 2 Houghton Mifflin 2008
Geometry Houghton Mifflin 2008
Algebra Readiness Houghton MIfflin 2008
SCIENCE
Biology Houghton Mifflin 2007
Chemistry Pearson Prentice Hall 2007
Physics (Cutnell & Johnson - 7th Ed.) Wiley & Sons / People's Publishing 2007
SOCIAL SCIENCE
Magruder's American Government Pearson Prentice Hall 2006
Economics: Principles in Action Pearson Prentice Hall 2007
The Americans: Reconstruction to the 21st C. Houghton Mifflin 2006
World History: The Modern World Pearson Prentice Hall 2006
Page 33
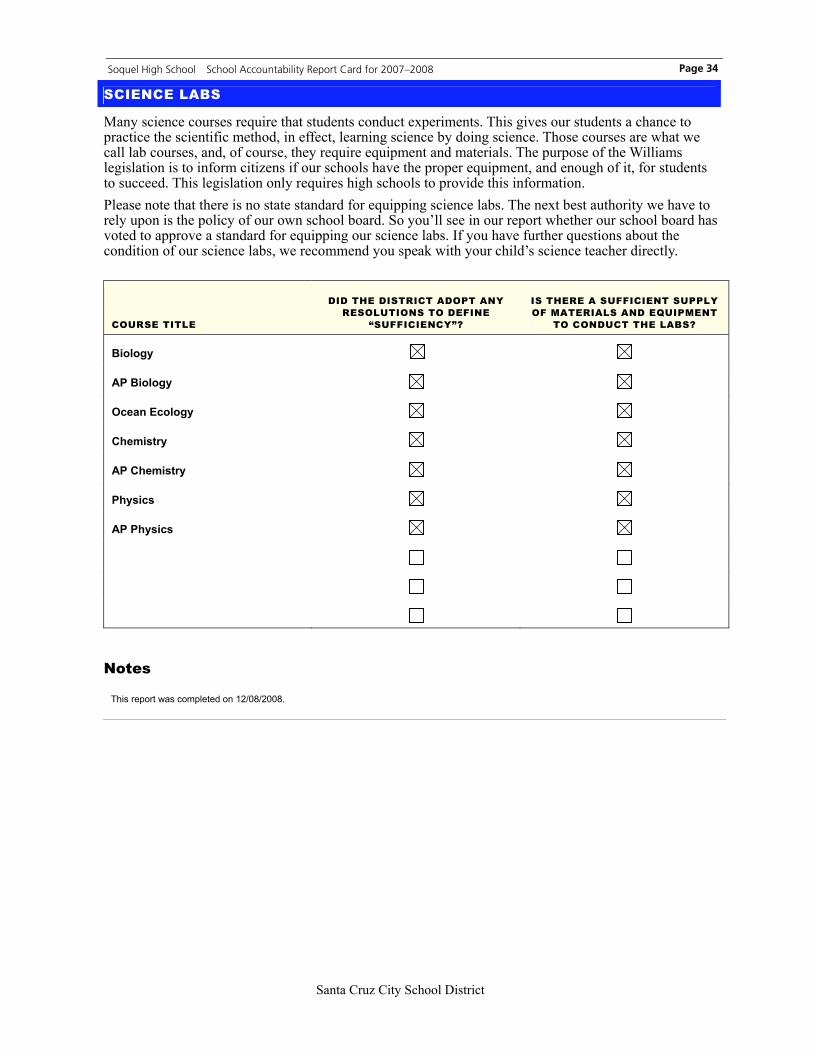
Soquel High School School Accountability Report Card for 2007–2008
Santa Cruz City School District
Many science courses require that students conduct experiments. This gives our students a chance to practice the scientific method, in effect, learning science by doing science. Those courses are what we call lab courses, and, of course, they require equipment and materials. The purpose of the Williams legislation is to inform citizens if our schools have the proper equipment, and enough of it, for students to succeed. This legislation only requires high schools to provide this information. Please note that there is no state standard for equipping science labs. The next best authority we have to rely upon is the policy of our own school board. So you’ll see in our report whether our school board has voted to approve a standard for equipping our science labs. If you have further questions about the condition of our science labs, we recommend you speak with your child’s science teacher directly.
COURSE TITLE
DID THE DISTRICT ADOPT ANY RESOLUTIONS TO DEFINE
“SUFFICIENCY”?
IS THERE A SUFFICIENT SUPPLY OF MATERIALS AND EQUIPMENT
TO CONDUCT THE LABS?
Biology
AP Biology
Ocean Ecology
Chemistry
AP Chemistry
Physics
AP Physics
Notes
This report was completed on 12/08/2008.
SCIENCE LABS
Page 34
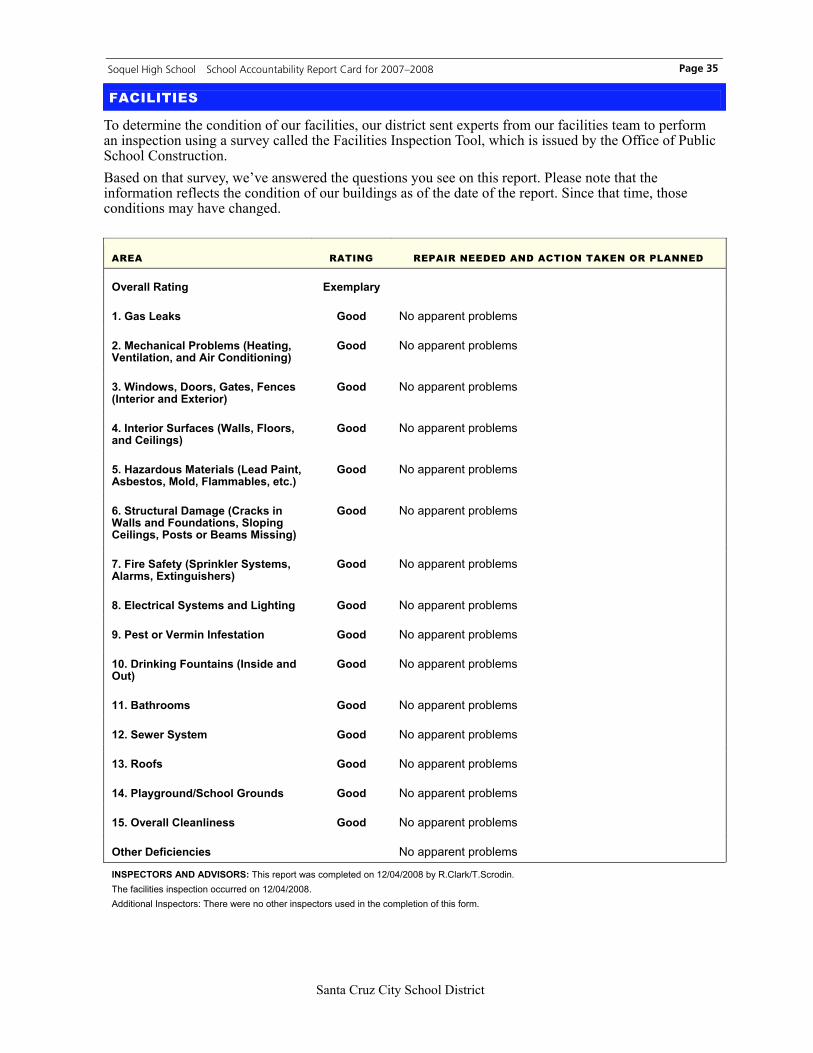
Soquel High School School Accountability Report Card for 2007–2008
Santa Cruz City School District
FACILITIES
To determine the condition of our facilities, our district sent experts from our facilities team to perform an inspection using a survey called the Facilities Inspection Tool, which is issued by the Office of Public School Construction. Based on that survey, we’ve answered the questions you see on this report. Please note that the information reflects the condition of our buildings as of the date of the report. Since that time, those conditions may have changed.
AREA RATING REPAIR NEEDED AND ACTION TAKEN OR PLANNED
Overall Rating Exemplary
1. Gas Leaks Good No apparent problems
2. Mechanical Problems (Heating, Ventilation, and Air Conditioning)
Good No apparent problems
3. Windows, Doors, Gates, Fences (Interior and Exterior)
Good No apparent problems
4. Interior Surfaces (Walls, Floors, and Ceilings)
Good No apparent problems
5. Hazardous Materials (Lead Paint, Asbestos, Mold, Flammables, etc.)
Good No apparent problems
6. Structural Damage (Cracks in Walls and Foundations, Sloping Ceilings, Posts or Beams Missing)
Good No apparent problems
7. Fire Safety (Sprinkler Systems, Alarms, Extinguishers)
Good No apparent problems
8. Electrical Systems and Lighting Good No apparent problems
9. Pest or Vermin Infestation Good No apparent problems
10. Drinking Fountains (Inside and Out)
Good No apparent problems
11. Bathrooms Good No apparent problems
12. Sewer System Good No apparent problems
13. Roofs Good No apparent problems
14. Playground/School Grounds Good No apparent problems
15. Overall Cleanliness Good No apparent problems
Other Deficiencies No apparent problems
INSPECTORS AND ADVISORS: This report was completed on 12/04/2008 by R.Clark/T.Scrodin. The facilities inspection occurred on 12/04/2008. Additional Inspectors: There were no other inspectors used in the completion of this form.
Page 35

Soquel High School School Accountability Report Card for 2007–2008
Santa Cruz City School District
SCHOOL FINANCES, 2006–2007
We are required to report financial data from the 2006–2007 school year by the California Dept. of Education. More recent financial data is available on request from the district office.
Spending per Student To make comparisons possible across schools and districts of varying sizes, we first report our overall spending per student. We base our calculations on our average daily attendance (ADA), which was 1,060 students during the 2006-2007 school year. We’ve broken down expenditures by the type of funds used to pay for them. Unrestricted funds can be used for any lawful purpose. Restricted funds, however, must be spent for specific purposes set out by legal requirements or the donor. Examples include funding for instructional materials, economic impact aid, and teacher and principal training funds. Next to the figures for the district and state averages, we show the percentage by which the school’s spending varies from the district and state averages. For example, we calculate the school’s variance from the district average using this formula:
(SCHOOL AMOUNT – DISTRICT AVERAGE)
DISTRICT AVERAGE
TYPE OF FUNDS OUR
SCHOOL DISTRICT AVERAGE
SCHOOL VARIANCE
STATE AVERAGE
SCHOOL VARIANCE
Unrestricted funds ($/student) $5,143.00 $5,121.00 0% $5,300 -3%
Restricted funds ($/student) $1,230.00 $1,652.00 -26% $2,817 -56%
Total ($/student) $6,373.00 $6,773.00 -6% $8,117 -21%
Compensation per Teacher To make comparisons possible across schools and districts of varying sizes, we report our compensation per full-time equivalent (FTE) teacher. A teacher who works full-time counts as 1.0 FTE teacher. A teacher who works only half-time counts as 0.5 FTE. We had 48 FTE teachers working in our school.
CATEGORY OUR
SCHOOL DISTRICT AVERAGE
SCHOOL VARIANCE
STATE AVERAGE
SCHOOL VARIANCE
Salary $62,849.00 $61,044.00 3% $62,157 1%
Benefits $20,133.00 $19,667.00 2% $17,426 16%
Total $82,982.00 $80,711.00 3% $79,583 4%
Page 36

Soquel High School School Accountability Report Card for 2007–2008
»
Page 37
Data Almanac
This Data Almanac provides more-detailed information than the School Accountability Report Card or data that covers a period of more than one year. It presents the facts and statistics in tables without narrative text.
Santa Cruz City School District
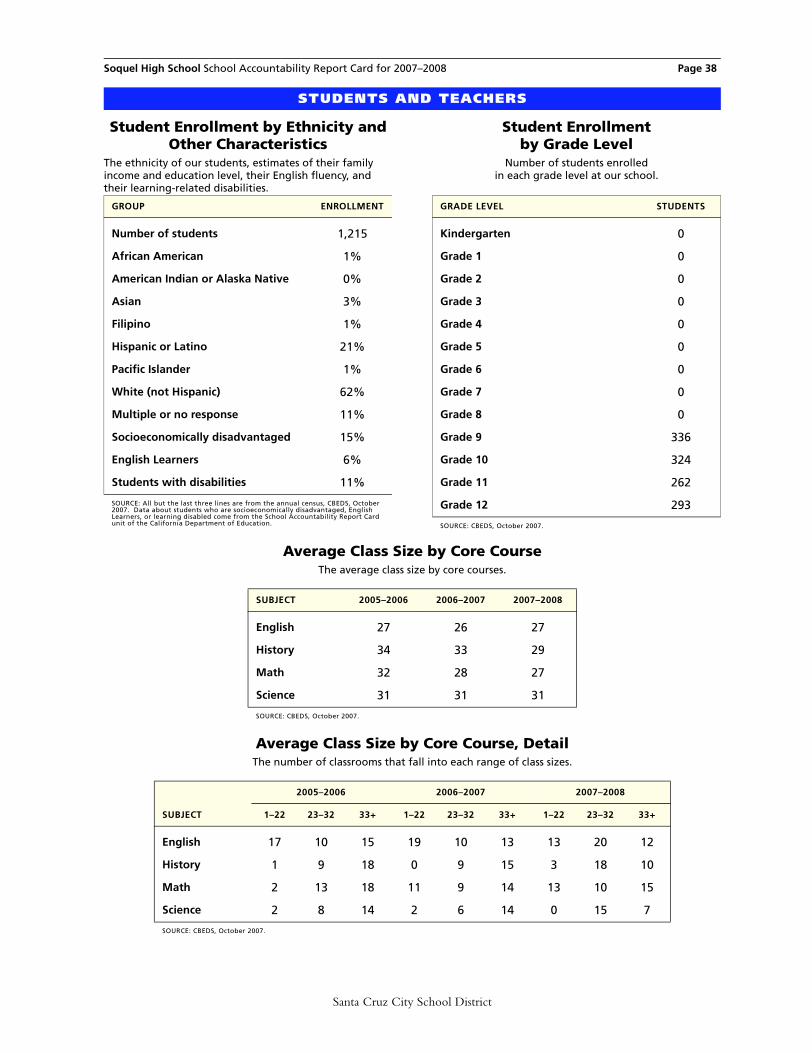
Soquel High School School Accountability Report Card for 2007–2008 Page 38
Average Class Size by Core CourseThe average class size by core courses.
Average Class Size by Core Course, DetailThe number of classrooms that fall into each range of class sizes.
STUDENTS AND TEACHERS
Student Enrollment by Ethnicity and Other Characteristics
The ethnicity of our students, estimates of their family income and education level, their English fluency, and their learning-related disabilities.
Student Enrollment by Grade Level
Number of students enrolled in each grade level at our school.
SUBJECT 2005–2006 2006–2007 2007–2008
English 27 26 27
History 34 33 29
Math 32 28 27
Science 31 31 31
SOURCE: CBEDS, October 2007.
2005–2006 2006–2007 2007–2008
SUBJECT 1–22 23–32 33+ 1–22 23–32 33+ 1–22 23–32 33+
English 17 10 15 19 10 13 13 20 12
History 1 9 18 0 9 15 3 18 10
Math 2 13 18 11 9 14 13 10 15
Science 2 8 14 2 6 14 0 15 7
SOURCE: CBEDS, October 2007.
GROUP ENROLLMENT
Number of students 1,215
African American 1%
American Indian or Alaska Native 0%
Asian 3%
Filipino 1%
Hispanic or Latino 21%
Pacific Islander 1%
White (not Hispanic) 62%
Multiple or no response 11%
Socioeconomically disadvantaged 15%
English Learners 6%
Students with disabilities 11%
SOURCE: All but the last three lines are from the annual census, CBEDS, October 2007. Data about students who are socioeconomically disadvantaged, English Learners, or learning disabled come from the School Accountability Report Card unit of the California Department of Education.
GRADE LEVEL STUDENTS
Kindergarten 0
Grade 1 0
Grade 2 0
Grade 3 0
Grade 4 0
Grade 5 0
Grade 6 0
Grade 7 0
Grade 8 0
Grade 9 336
Grade 10 324
Grade 11 262
Grade 12 293
SOURCE: CBEDS, October 2007.
Santa Cruz City School District
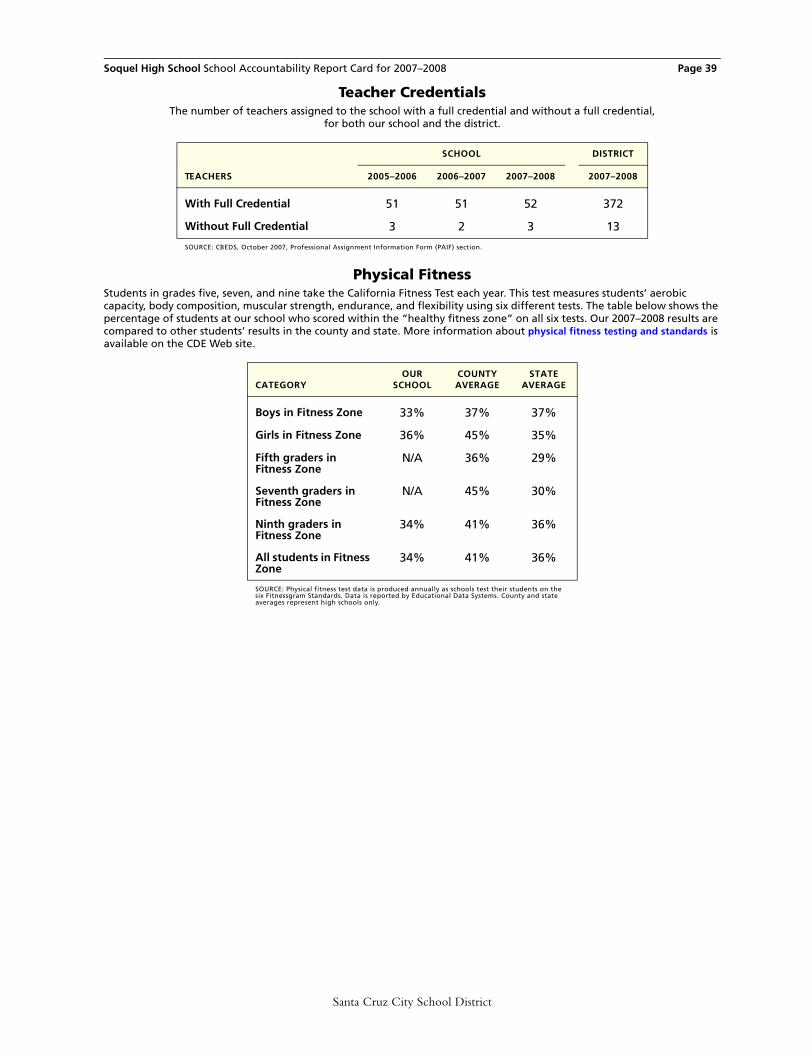
Soquel High School School Accountability Report Card for 2007–2008 Page 39
Teacher CredentialsThe number of teachers assigned to the school with a full credential and without a full credential,
for both our school and the district.
Physical FitnessStudents in grades five, seven, and nine take the California Fitness Test each year. This test measures students’ aerobic capacity, body composition, muscular strength, endurance, and flexibility using six different tests. The table below shows the percentage of students at our school who scored within the “healthy fitness zone” on all six tests. Our 2007–2008 results are compared to other students’ results in the county and state. More information about physical fitness testing and standards is available on the CDE Web site.
SCHOOL DISTRICT
TEACHERS 2005–2006 2006–2007 2007–2008 2007–2008
With Full Credential 51 51 52 372
Without Full Credential 3 2 3 13
SOURCE: CBEDS, October 2007, Professional Assignment Information Form (PAIF) section.
CATEGORYOUR
SCHOOLCOUNTYAVERAGE
STATEAVERAGE
Boys in Fitness Zone 33% 37% 37%
Girls in Fitness Zone 36% 45% 35%
Fifth graders in Fitness Zone
N/A 36% 29%
Seventh graders in Fitness Zone
N/A 45% 30%
Ninth graders in Fitness Zone
34% 41% 36%
All students in Fitness Zone
34% 41% 36%
SOURCE: Physical fitness test data is produced annually as schools test their students on the six Fitnessgram Standards. Data is reported by Educational Data Systems. County and state averages represent high schools only.
Santa Cruz City School District
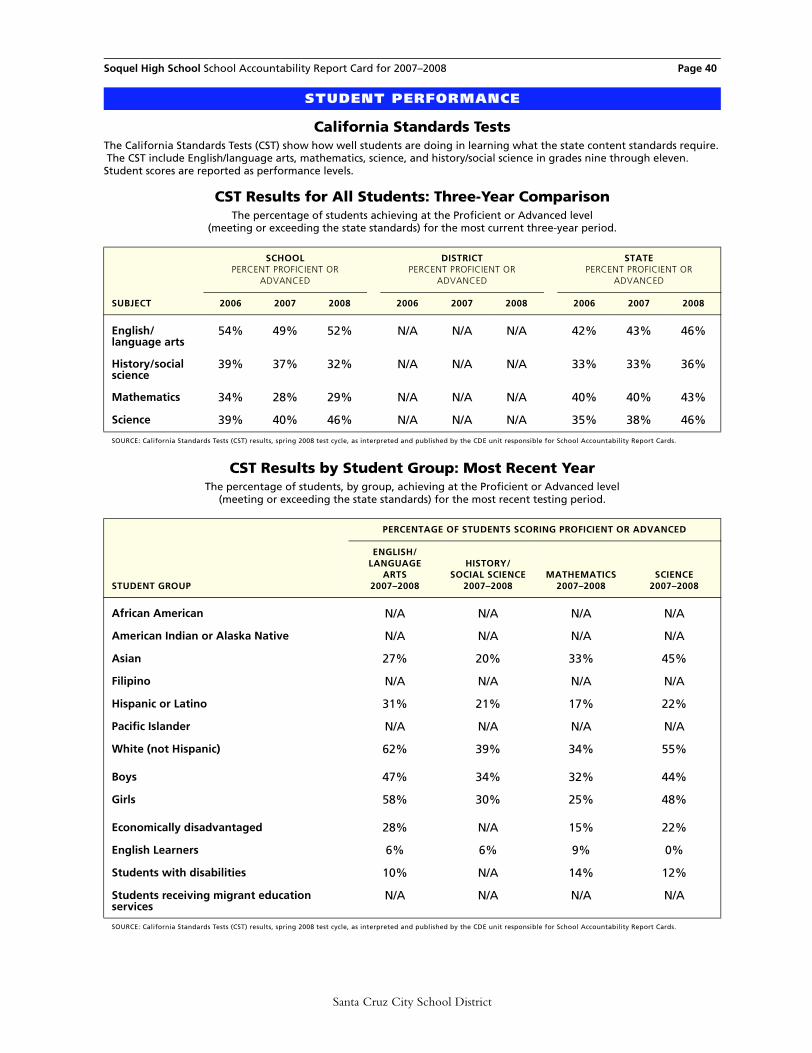
Soquel High School School Accountability Report Card for 2007–2008 Page 40
California Standards TestsThe California Standards Tests (CST) show how well students are doing in learning what the state content standards require. The CST include English/language arts, mathematics, science, and history/social science in grades nine through eleven. Student scores are reported as performance levels.
CST Results for All Students: Three-Year ComparisonThe percentage of students achieving at the Proficient or Advanced level
(meeting or exceeding the state standards) for the most current three-year period.
CST Results by Student Group: Most Recent YearThe percentage of students, by group, achieving at the Proficient or Advanced level
(meeting or exceeding the state standards) for the most recent testing period.
STUDENT PERFORMANCE
SCHOOLPERCENT PROFICIENT OR
ADVANCED
DISTRICTPERCENT PROFICIENT OR
ADVANCED
STATEPERCENT PROFICIENT OR
ADVANCED
SUBJECT 2006 2007 2008 2006 2007 2008 2006 2007 2008
English/language arts
54% 49% 52% N/A N/A N/A 42% 43% 46%
History/social science
39% 37% 32% N/A N/A N/A 33% 33% 36%
Mathematics 34% 28% 29% N/A N/A N/A 40% 40% 43%
Science 39% 40% 46% N/A N/A N/A 35% 38% 46%
SOURCE: California Standards Tests (CST) results, spring 2008 test cycle, as interpreted and published by the CDE unit responsible for School Accountability Report Cards.
PERCENTAGE OF STUDENTS SCORING PROFICIENT OR ADVANCED
STUDENT GROUP
ENGLISH/LANGUAGE
ARTS2007–2008
HISTORY/SOCIAL SCIENCE
2007–2008MATHEMATICS
2007–2008SCIENCE
2007–2008
African American N/A N/A N/A N/A
American Indian or Alaska Native N/A N/A N/A N/A
Asian 27% 20% 33% 45%
Filipino N/A N/A N/A N/A
Hispanic or Latino 31% 21% 17% 22%
Pacific Islander N/A N/A N/A N/A
White (not Hispanic) 62% 39% 34% 55%
Boys 47% 34% 32% 44%
Girls 58% 30% 25% 48%
Economically disadvantaged 28% N/A 15% 22%
English Learners 6% 6% 9% 0%
Students with disabilities 10% N/A 14% 12%
Students receiving migrant education services
N/A N/A N/A N/A
SOURCE: California Standards Tests (CST) results, spring 2008 test cycle, as interpreted and published by the CDE unit responsible for School Accountability Report Cards.
Santa Cruz City School District
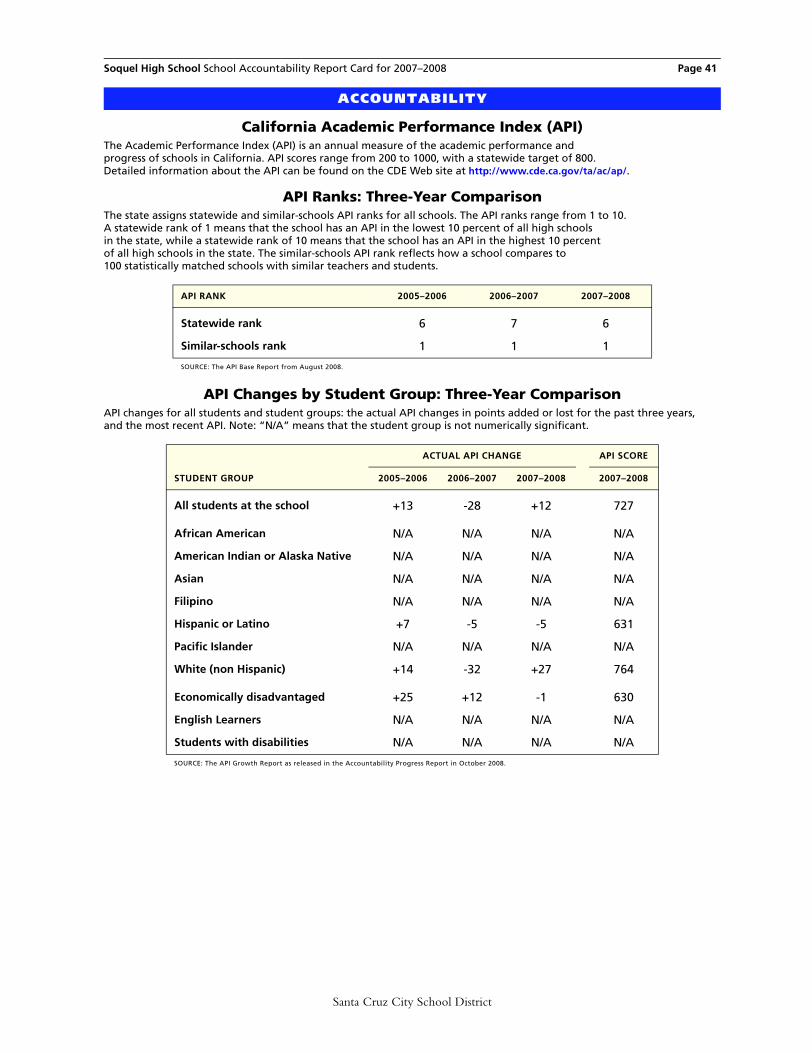
Soquel High School School Accountability Report Card for 2007–2008 Page 41
California Academic Performance Index (API)The Academic Performance Index (API) is an annual measure of the academic performance and progress of schools in California. API scores range from 200 to 1000, with a statewide target of 800. Detailed information about the API can be found on the CDE Web site at http://www.cde.ca.gov/ta/ac/ap/.
API Ranks: Three-Year ComparisonThe state assigns statewide and similar-schools API ranks for all schools. The API ranks range from 1 to 10. A statewide rank of 1 means that the school has an API in the lowest 10 percent of all high schools in the state, while a statewide rank of 10 means that the school has an API in the highest 10 percent of all high schools in the state. The similar-schools API rank reflects how a school compares to 100 statistically matched schools with similar teachers and students.
API Changes by Student Group: Three-Year ComparisonAPI changes for all students and student groups: the actual API changes in points added or lost for the past three years, and the most recent API. Note: “N/A” means that the student group is not numerically significant.
ACCOUNTABILITY
API RANK 2005–2006 2006–2007 2007–2008
Statewide rank 6 7 6
Similar-schools rank 1 1 1
SOURCE: The API Base Report from August 2008.
ACTUAL API CHANGE API SCORE
STUDENT GROUP 2005–2006 2006–2007 2007–2008 2007–2008
All students at the school +13 -28 +12 727
African American N/A N/A N/A N/A
American Indian or Alaska Native N/A N/A N/A N/A
Asian N/A N/A N/A N/A
Filipino N/A N/A N/A N/A
Hispanic or Latino +7 -5 -5 631
Pacific Islander N/A N/A N/A N/A
White (non Hispanic) +14 -32 +27 764
Economically disadvantaged +25 +12 -1 630
English Learners N/A N/A N/A N/A
Students with disabilities N/A N/A N/A N/A
SOURCE: The API Growth Report as released in the Accountability Progress Report in October 2008.
Santa Cruz City School District

Soquel High School School Accountability Report Card for 2007–2008 Page 42
Federal Adequate Yearly Progress (AYP) and Intervention ProgramsThe federal law known as No Child Left Behind requires that all schools and districts meet all four of the following criteria in order to attain Adequate Yearly Progress (AYP): (a) a 95-percent participation rate on the state’s tests; (b) a CDE-mandated percentage of students scoring Proficient or higher on the English/language arts and mathematics tests; (c) an API of at least 590 or growth of at least one point; and (d) the graduation rate for the graduating class must be higher than 82.9 percent (or satisfy alternate improvement criteria).
AYP for the DistrictWhether the district met the federal requirement for AYP overall,
and whether the school and the district met each of the AYP criteria.
Intervention Program: District Program Improvement (PI)Districts receiving federal Title I funding enter Program Improvement (PI) if they do not
make AYP for two consecutive years in the same content area (English/language arts or mathematics) and for each grade span or on the same indicator (API or graduation rate). After entering PI,
districts advance to the next level of intervention with each additional year that they do not make AYP.
AYP CRITERIA DISTRICT
Overall N/A
Graduation rate N/A
Participation rate in English/language arts N/A
Participation rate in mathematics N/A
Percent Proficient in English/language arts N/A
Percent Proficient in mathematics N/A
Met Academic Performance Index (API) N/A
SOURCE: The AYP Report as released in the Accountability Progress Report in November 2008.
INDICATOR DISTRICT
PI stage N/A
The year the district entered PI N/A
Number of schools currently in PI 3
Percentage of schools currently in PI 21%
SOURCE: The Program Improvement Report as released in the Accountability Progress Report in October 2008.
Santa Cruz City School District
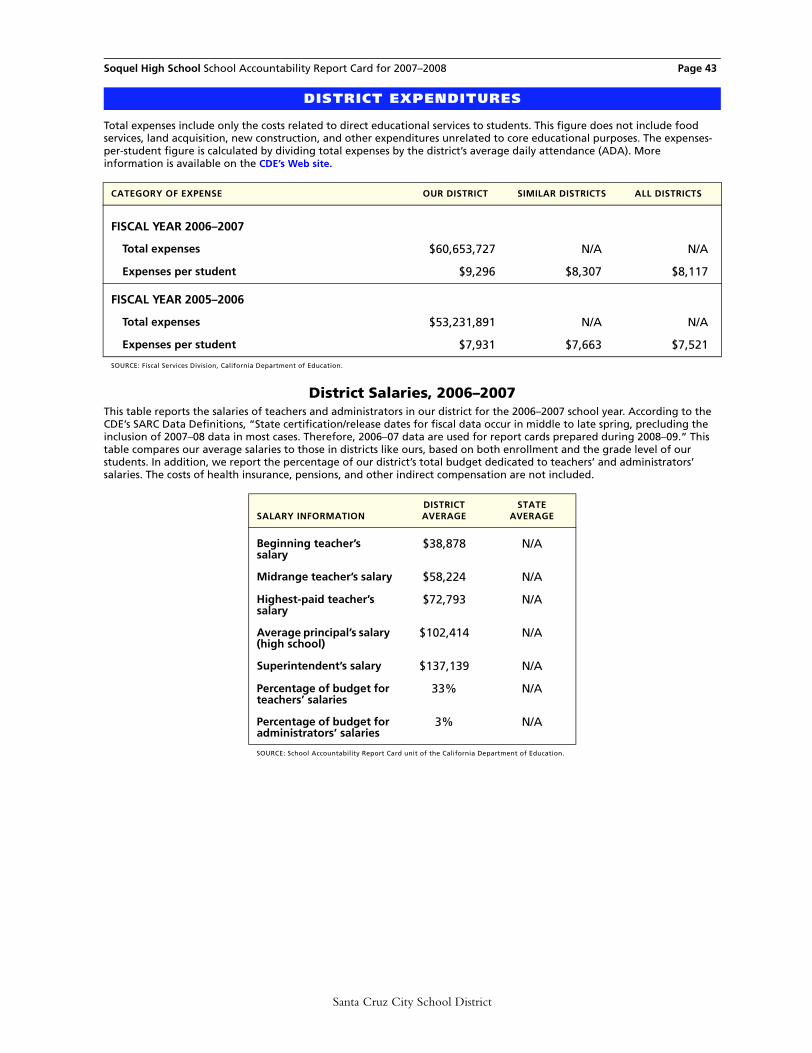
Soquel High School School Accountability Report Card for 2007–2008 Page 43
Total expenses include only the costs related to direct educational services to students. This figure does not include food services, land acquisition, new construction, and other expenditures unrelated to core educational purposes. The expenses-per-student figure is calculated by dividing total expenses by the district’s average daily attendance (ADA). More information is available on the CDE’s Web site.
District Salaries, 2006–2007This table reports the salaries of teachers and administrators in our district for the 2006–2007 school year. According to the CDE’s SARC Data Definitions, “State certification/release dates for fiscal data occur in middle to late spring, precluding the inclusion of 2007–08 data in most cases. Therefore, 2006–07 data are used for report cards prepared during 2008–09.” This table compares our average salaries to those in districts like ours, based on both enrollment and the grade level of our students. In addition, we report the percentage of our district’s total budget dedicated to teachers’ and administrators’ salaries. The costs of health insurance, pensions, and other indirect compensation are not included.
DISTRICT EXPENDITURES
CATEGORY OF EXPENSE OUR DISTRICT SIMILAR DISTRICTS ALL DISTRICTS
FISCAL YEAR 2006–2007
Total expenses $60,653,727 N/A N/A
Expenses per student $9,296 $8,307 $8,117
FISCAL YEAR 2005–2006
Total expenses $53,231,891 N/A N/A
Expenses per student $7,931 $7,663 $7,521
SOURCE: Fiscal Services Division, California Department of Education.
SALARY INFORMATIONDISTRICTAVERAGE
STATEAVERAGE
Beginning teacher’s salary
$38,878 N/A
Midrange teacher’s salary $58,224 N/A
Highest-paid teacher’s salary
$72,793 N/A
Average principal’s salary (high school)
$102,414 N/A
Superintendent’s salary $137,139 N/A
Percentage of budget for teachers’ salaries
33% N/A
Percentage of budget for administrators’ salaries
3% N/A
SOURCE: School Accountability Report Card unit of the California Department of Education.
Santa Cruz City School District
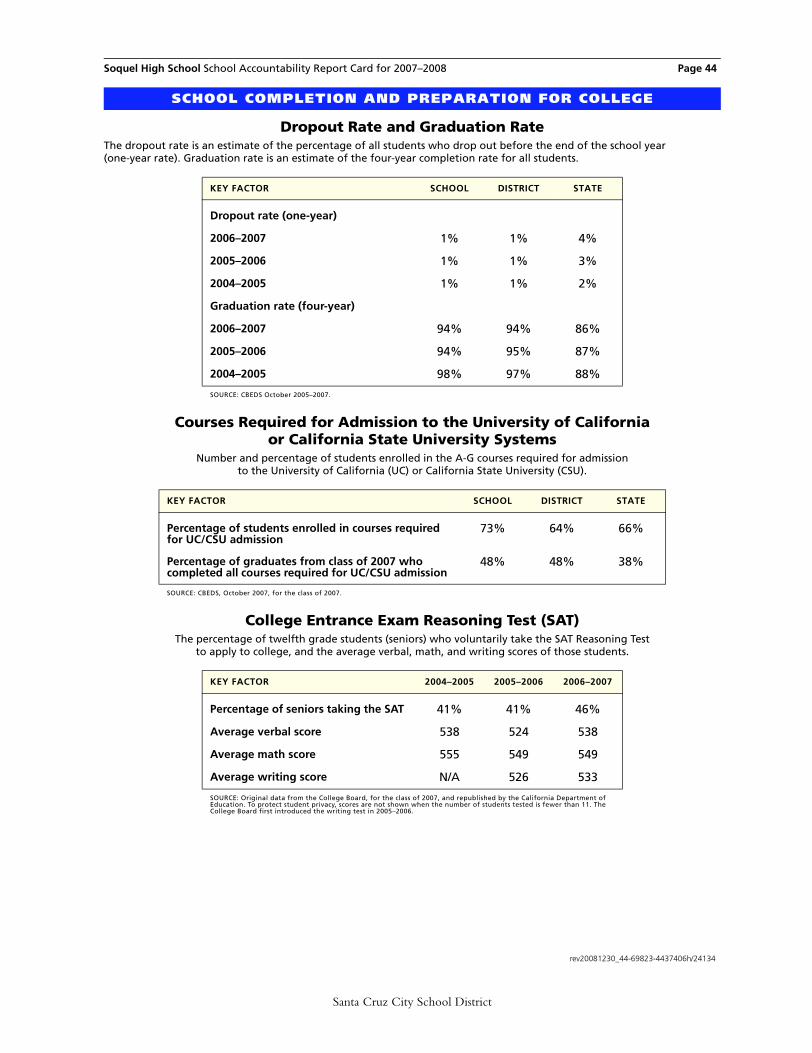
Soquel High School School Accountability Report Card for 2007–2008 Page 44
Dropout Rate and Graduation RateThe dropout rate is an estimate of the percentage of all students who drop out before the end of the school year (one-year rate). Graduation rate is an estimate of the four-year completion rate for all students.
Courses Required for Admission to the University of California or California State University Systems
Number and percentage of students enrolled in the A-G courses required for admission to the University of California (UC) or California State University (CSU).
College Entrance Exam Reasoning Test (SAT)The percentage of twelfth grade students (seniors) who voluntarily take the SAT Reasoning Test
to apply to college, and the average verbal, math, and writing scores of those students.
SCHOOL COMPLETION AND PREPARATION FOR COLLEGE
KEY FACTOR SCHOOL DISTRICT STATE
Dropout rate (one-year)
2006–2007 1% 1% 4%
2005–2006 1% 1% 3%
2004–2005 1% 1% 2%
Graduation rate (four-year)
2006–2007 94% 94% 86%
2005–2006 94% 95% 87%
2004–2005 98% 97% 88%
SOURCE: CBEDS October 2005–2007.
KEY FACTOR SCHOOL DISTRICT STATE
Percentage of students enrolled in courses required for UC/CSU admission
73% 64% 66%
Percentage of graduates from class of 2007 who completed all courses required for UC/CSU admission
48% 48% 38%
SOURCE: CBEDS, October 2007, for the class of 2007.
KEY FACTOR 2004–2005 2005–2006 2006–2007
Percentage of seniors taking the SAT 41% 41% 46%
Average verbal score 538 524 538
Average math score 555 549 549
Average writing score N/A 526 533
SOURCE: Original data from the College Board, for the class of 2007, and republished by the California Department of Education. To protect student privacy, scores are not shown when the number of students tested is fewer than 11. The College Board first introduced the writing test in 2005–2006.
rev20081230_44-69823-4437406h/24134
Santa Cruz City School District