Embed Size (px)
Citation preview
Figure S1. Sorting nexin 9 (SNX9) specifically binds pSmad3 and not pSmad 1/5/8. Lysates from AKR-2B cells untreated (-) or stimulated (+) for 45 min with 5 ng/ml TGFβ or 10 ng/ml BMP4 were incubated with full length (FL) SNX9 immobilized on GST beads as in Figure 1A. Bound proteins were eluted and assessed by Western analysis for pSmad3 or pSmad1/5/8. Cell lysate reflects signal obtained from 10 µg total protein. Blots are representative of 3 separate experiments.

A
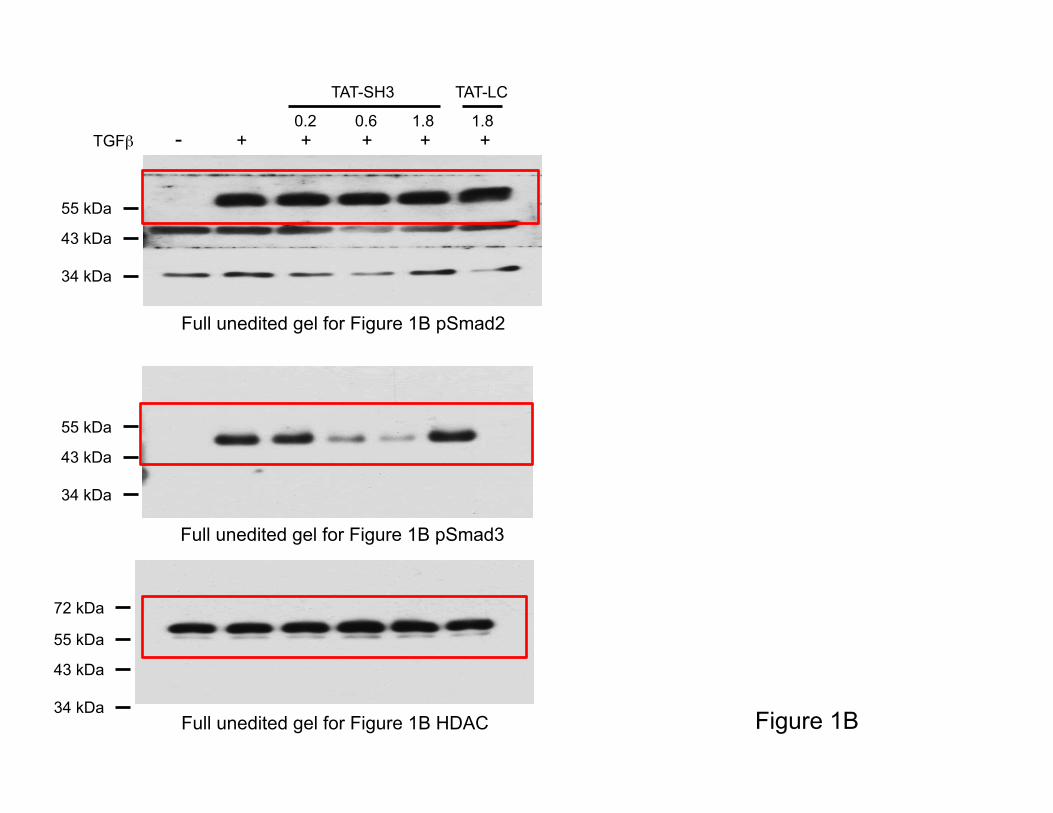
B Figure S2. SH3 domain of sorting nexin 9 prevents nuclear pSmad3 import. (A) AKR-2B cells were transduced for 90 min with the indicated concentration (µM) of TAT fusion peptide to the SH3 or LC domains of SNX9 as in Figure 1B. Following washing and 1 hr TGFβ (5 ng/ml) treatment cytosolic fractions were isolated and Western blotted for pSmad2, pSmad3, or GAPDH. Blots are representative of 3 separate experiments. (B) Quantitation of cytosolic pSmads was performed with Image J software and represents the mean +/- SEM of 3 experiments. Data was analyzed by one-way ANOVA followed by Dunnett’s multiple comparisons test. *P<0.05, **P<0.005.

A
B Figure S3. TAT-SH3 co-localizes with pSmad3. (A) AKR-2B cells were transduced for 90 min with TAT-SH3 or TAT-LC (1.8 µM). Following washing and 45 min TGFβ (5 ng/ml) treatment immunofluorescence for Smad3 or the HA-tagged TAT peptide was performed as described in Methods. Nuclei were stained with DAPI and right panels reflect higher magnification of boxed areas to visualize Smad3/TAT co-localization (yellow). (B). Quantitation of Smad3/TAT co-localization of 20 cells from each of 3 separate experiments using Image J software. Data was analyzed by 2-tailed Student’s t-test. ***P<0.0005.

A
B
Figure S4. TAT-SH3-2 domain of sorting nexin 9 prevents nuclear pSmad3 import. (A) AKR-2B cells were transduced for 90 min with the indicated TAT peptide. Following washing and 1 hr TGFβ (5 ng/ml) treatment cytosolic fractions were isolated as in Figure S2 and Western blotted for pSmad2, pSmad3, or GAPDH. Blots are representative of 3 separate experiments. (B) Quantitation (mean +/- SEM) of cytosolic pSmad2 or pSmad3 from 3 experiments using Image J software. Data were analyzed by one-way ANOVA followed by Dunnett’s multiple comparisons test. ***P<0.0005.
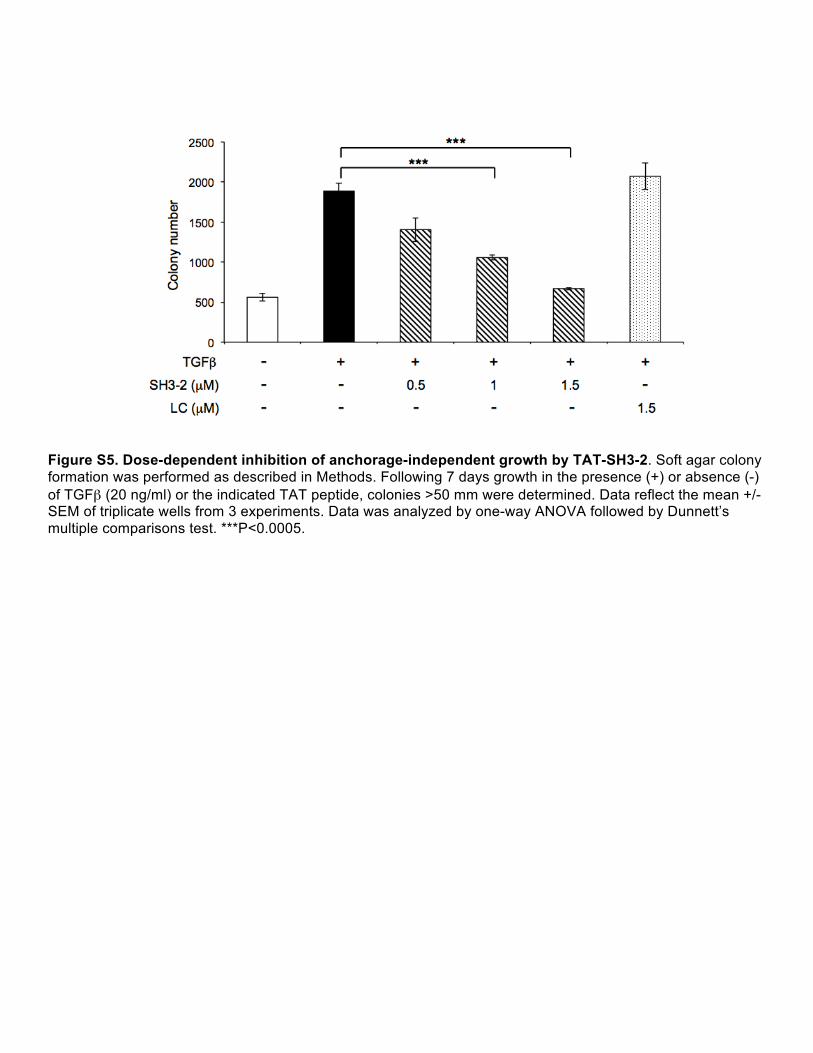
Figure S5. Dose-dependent inhibition of anchorage-independent growth by TAT-SH3-2. Soft agar colony formation was performed as described in Methods. Following 7 days growth in the presence (+) or absence (-) of TGFβ (20 ng/ml) or the indicated TAT peptide, colonies >50 mm were determined. Data reflect the mean +/- SEM of triplicate wells from 3 experiments. Data was analyzed by one-way ANOVA followed by Dunnett’s multiple comparisons test. ***P<0.0005.
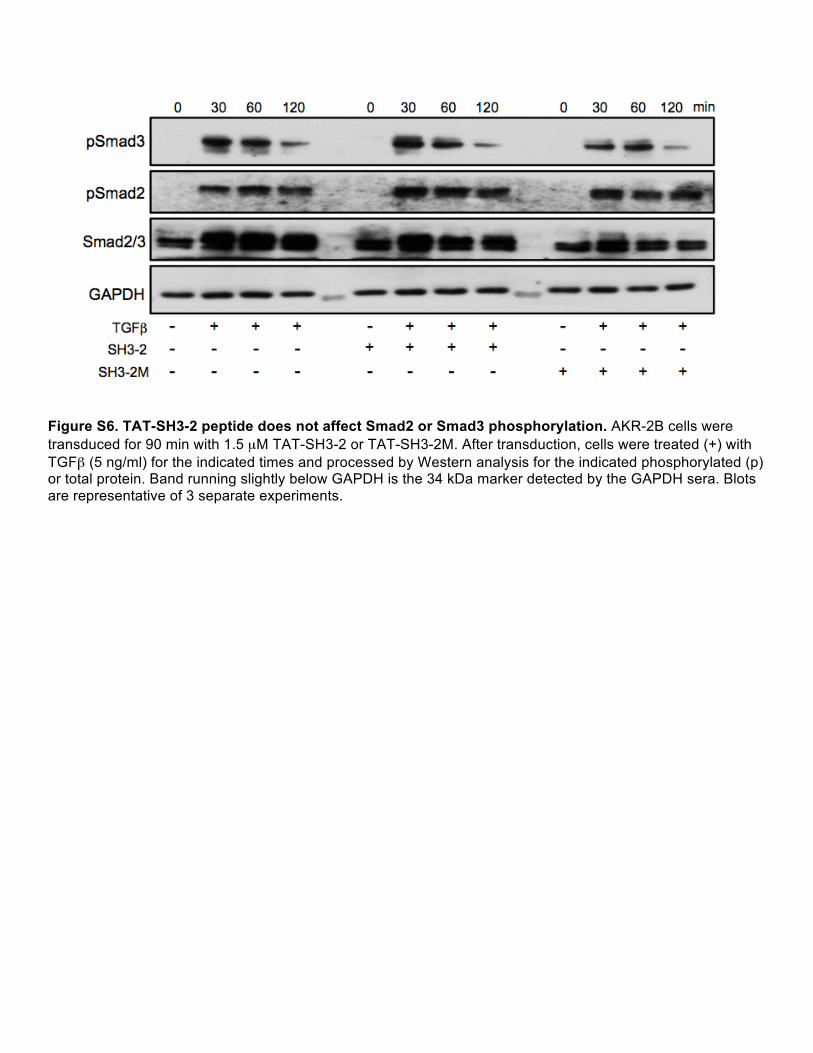
Figure S6. TAT-SH3-2 peptide does not affect Smad2 or Smad3 phosphorylation. AKR-2B cells were transduced for 90 min with 1.5 µM TAT-SH3-2 or TAT-SH3-2M. After transduction, cells were treated (+) with TGFβ (5 ng/ml) for the indicated times and processed by Western analysis for the indicated phosphorylated (p) or total protein. Band running slightly below GAPDH is the 34 kDa marker detected by the GAPDH sera. Blots are representative of 3 separate experiments.
A B
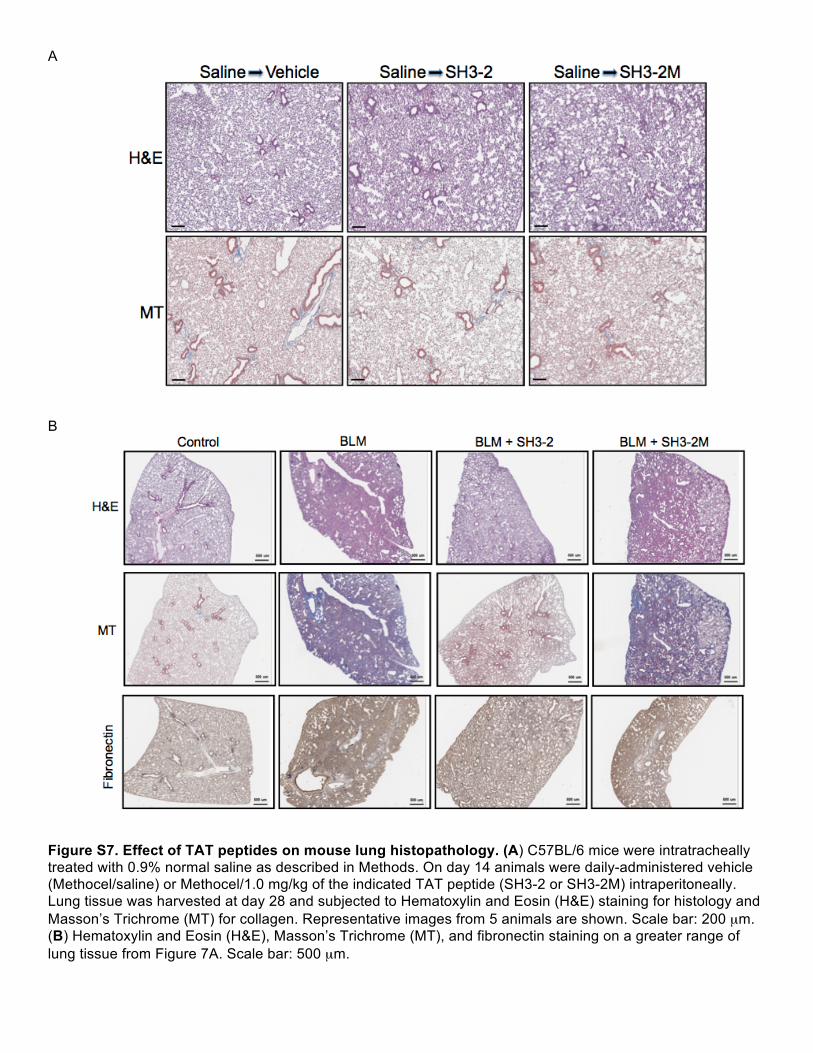
Figure S7. Effect of TAT peptides on mouse lung histopathology. (A) C57BL/6 mice were intratracheally treated with 0.9% normal saline as described in Methods. On day 14 animals were daily-administered vehicle (Methocel/saline) or Methocel/1.0 mg/kg of the indicated TAT peptide (SH3-2 or SH3-2M) intraperitoneally. Lung tissue was harvested at day 28 and subjected to Hematoxylin and Eosin (H&E) staining for histology and Masson’s Trichrome (MT) for collagen. Representative images from 5 animals are shown. Scale bar: 200 µm. (B) Hematoxylin and Eosin (H&E), Masson’s Trichrome (MT), and fibronectin staining on a greater range of lung tissue from Figure 7A. Scale bar: 500 µm.
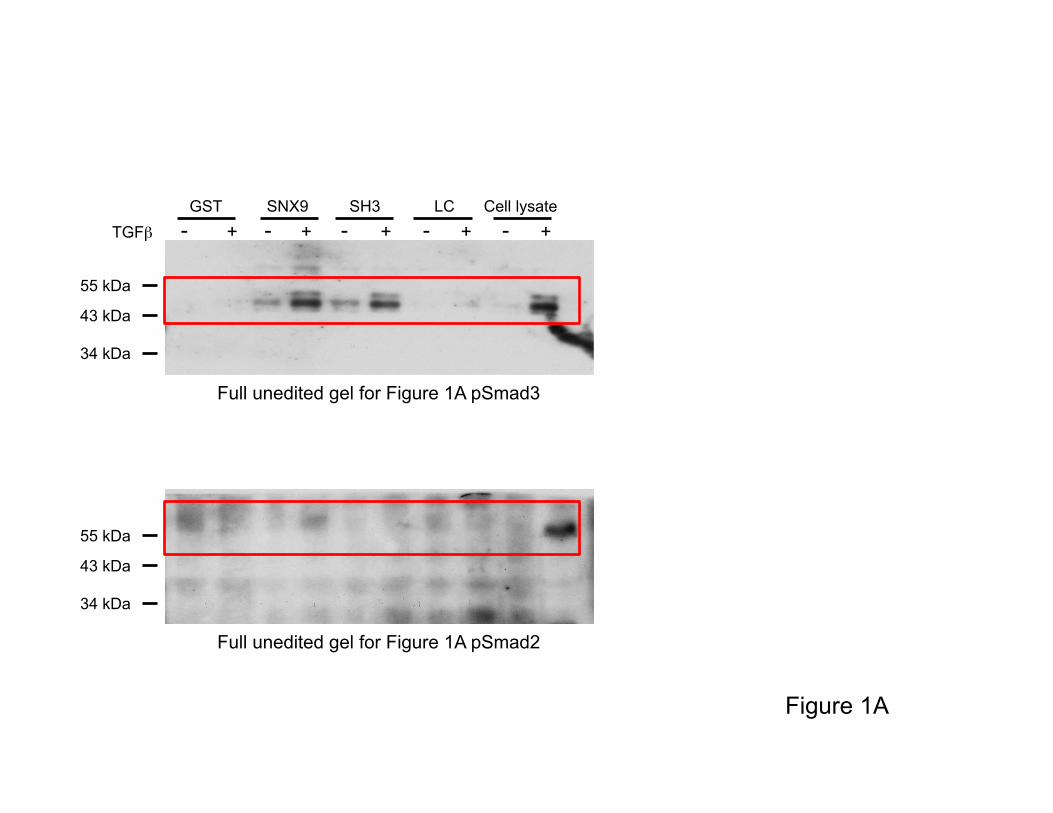
Full unedited gel for Figure 1A pSmad3
Full unedited gel for Figure 1A pSmad2
Figure 1A
55 kDa
43 kDa
34 kDa
55 kDa
43 kDa
34 kDa
SH3 LC TGFβ
SNX9 GST Cell lysate - - - - - + + + + +
Full unedited gel for Figure 1B pSmad2
Full unedited gel for Figure 1B HDAC
Full unedited gel for Figure 1B pSmad3
Figure 1B
55 kDa
43 kDa
34 kDa
55 kDa
43 kDa
34 kDa
55 kDa
43 kDa
34 kDa
72 kDa
TGFβ - + + + + +
TAT-SH3 TAT-LC
0.2 0.6 1.8 1.8
TGFβ
TAT-SH3 0.5 1.5
TAT-LC 1.5 0.1
PAI-1
GAPDH
CTGF
MMP-2
Smad3
Smad2
100 bp 200 bp
Full unedited gel for Figure 2B PAI-1
100 bp 200 bp
500 bp 650 bp
400 bp
300 bp
200 bp 300 bp
100 bp
300 bp
Full unedited gel for Figure 2B CTGF
Full unedited gel for Figure 2B MMP-2
Full unedited gel for Figure 2B GAPDH Figure 2B
- + + + + + µM
Full unedited gel for Figure 3A pSmad3
Full unedited gel for Figure 3A His
55 kDa
43 kDa
34 kDa
72 kDa
10 kDa
25 kDa
17 kDa
Figure 3A
SH3-2 SH3-3 TGFβ
SH3-1 SH3 LC - - - - - + + + + +
TAT Peptide

Full unedited gel for Figure 3B pSmad2
Full unedited gel for Figure 3B pSmad3
Full unedited gel for Figure 3B HDAC
55 kDa
43 kDa
34 kDa
55 kDa
43 kDa
34 kDa
55 kDa
43 kDa
34 kDa
75 kDa
Figure 3B
SH3-2 SH3-3 TGFβ
SH3-1 LC - - + + + +
TAT Peptide - +
Full unedited gel for Figure 4A pSmad3
Full unedited gel for Figure 4A CTGF
Full unedited gel for Figure 4A PAI-1
Full unedited gel for Figure 4A β-actin
55 kDa
43 kDa
34 kDa
25 kDa
43 kDa
34 kDa
34 kDa
55 kDa
43 kDa
34 kDa
55 kDa
43 kDa
Figure 4A
SH3-2M LC TGFβ
SH3-2 TAT - - - - + + + +
TAT Peptide
TGFβ - + + + + + TAT Peptide - - SH3-2 SH3-2M LC -
SB431542 - - - - - +
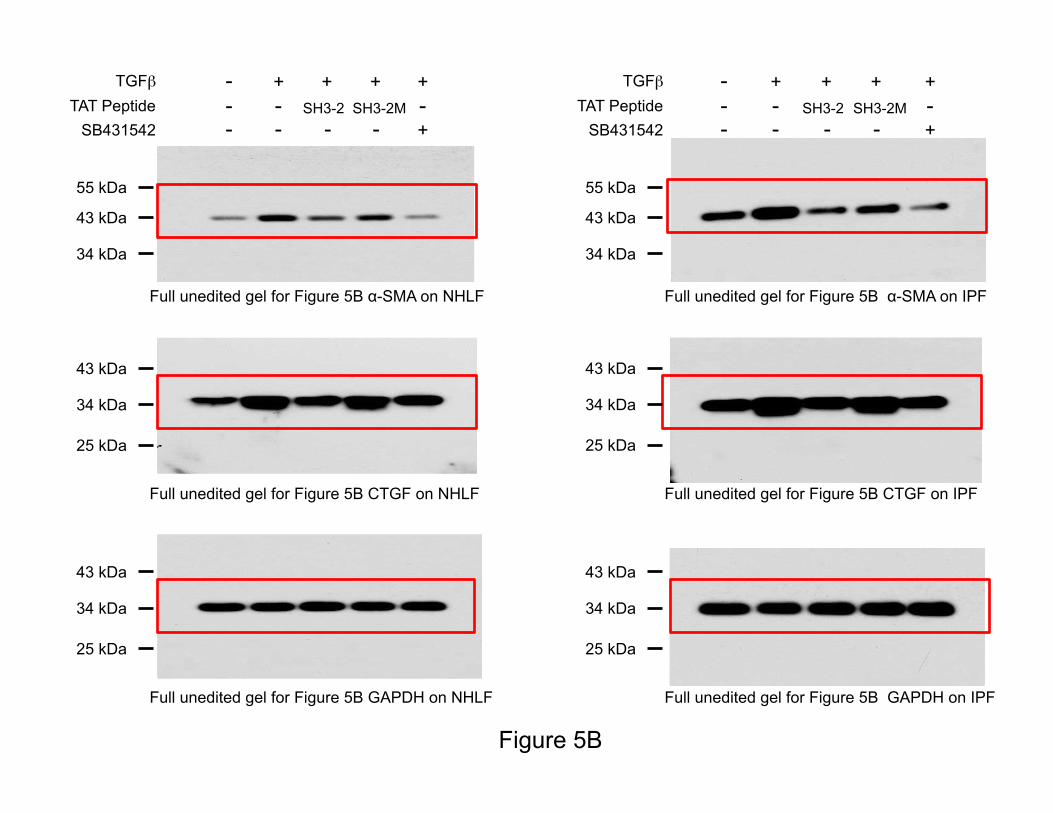
Full unedited gel for Figure 5B α-SMA on NHLF
Full unedited gel for Figure 5B CTGF on NHLF
Full unedited gel for Figure 5B GAPDH on NHLF
Full unedited gel for Figure 5B α-SMA on IPF
Full unedited gel for Figure 5B CTGF on IPF
Full unedited gel for Figure 5B GAPDH on IPF
34 kDa
55 kDa
43 kDa
34 kDa
55 kDa
43 kDa
34 kDa
25 kDa
43 kDa
34 kDa
25 kDa
43 kDa
34 kDa
25 kDa
43 kDa
34 kDa
25 kDa
43 kDa
Figure 5B
TGFβ - + + + + TAT Peptide - - SH3-2 SH3-2M -
SB431542 - - - - +
TGFβ - + + + + TAT Peptide - - SH3-2 SH3-2M -
SB431542 - - - - +

CelllysateFull unedited gel for Figure S1 pSmad3
Full unedited gel for Figure S1 GAPDH
Full unedited gel for Figure S1 pSmad1/5/8
Full unedited gel for Figure S1 GAPDH
Pulldown(GST-SNX9)
Full unedited gel for Figure S1 pSmad3
Full unedited gel for Figure S1 SNX9
Full unedited gel for Figure S1 pSmad1/5/8
Full unedited gel for Figure S1 SNX9
55 kDa
43 kDa
25 kDa
43 kDa
34 kDa
55 kDa
43 kDa
25 kDa
43 kDa
34 kDa
55 kDa
43 kDa
130 kDa
95 kDa
55 kDa
43 kDa
130 kDa
95 kDa
Figure S1
- + BMP4
- + TGFβ

Full unedited gel for Figure S2 pSmad2
Full unedited gel for Figure S2 GAPDH
Full unedited gel for Figure S2 pSmad3
72 kDa
55 kDa
43 kDa
34 kDa
55 kDa
43 kDa
34 kDa
25 kDa
43 kDa
Figure S2
TGFβ - + + + + +
TAT-SH3 TAT-LC
0.2 0.6 1.8 1.8

Full unedited gel for Figure S4 pSmad2
Full unedited gel for Figure S4 pSmad3
Full unedited gel for Figure S4 GAPDH
72 kDa
55 kDa
43 kDa
34 kDa
55 kDa
43 kDa
72 kDa
55 kDa
43 kDa
Figure S4
SH3-2 SH3-3 TGFβ
SH3-1 LC - - + + + +
TAT Peptide - +

34 kDa
55 kDa
43 kDa
Full unedited gel for Figure S6 pSmad3
72 kDa
55 kDa
43 kDa Full unedited gel for Figure S6 pSmad2
34 kDa
25 kDa
43 kDa
Full unedited gel for Figure S6 GAPDH
72 kDa
55 kDa
43 kDa Full unedited gel for Figure S6 Smad2/3
0 30 60 120 min 0 30 60 120 0 30 60 120
Figure S6
TGFβ - + + + SH3-2 - - - -
SH3-2M - - - -
- + + + + + + + - - - -
- + + + - - - - + + + +