Embed Size (px)
Citation preview

Sorting of a sand–gravel mixture in a Gilbert-type delta
CARLES FERRER-BOIX*, JUAN P. MART�IN-VIDE† and GARY PARKER‡*Department of Geography, The University of British Columbia, 1984 West Mall, Vancouver, BC V6T1Z2, Canada (E-mail: [email protected])†Department of Hydraulic, Maritime and Environmental Engineering, Technical University ofCatalonia, C. Jordi Girona, 1-3, Barcelona 08034, Spain‡2527c Hydrosystems Laboratory, Department of Civil and Environmental Engineering andDepartment of Geology, University of Illinois, 301 N. Mathews Ave., Urbana, IL 61801, USA
Associate Editor – David Mohrig
ABSTRACT
This paper presents the results of a Gilbert-type delta progradation experi-
ment within an impoundment created by a dam. The delta was composed of
a poorly sorted sand–gravel mixture in a bedload-dominated environment.
The main goal of the paper is to analyse the sorting process of material
within the deposit as the delta progrades towards the dam. Bed profile evo-
lution has been documented and the entire delta has been extensively sam-
pled in order to study sorting processes. Longitudinal and vertical sorting
mechanisms are illustrated. What is novel in this investigation is the com-
plete record, within an entire deltaic deposit, of the vertical distribution of
streamwise sorting in the absence of suspended load. The data presented
herein provide a detailed description of sorting processes in a Gilbert-type
delta. The experimental set-up, the water flow and the sediment feed rate
chosen determine the evolution of the delta: it initially progrades with little
topset aggradation and degrades afterwards. Experimental results fit well
with a previously presented empirical sorting model, despite the fact that
the experimental conditions used here were well outside the range of those
used to derive that model. The relative coarsening of the upper layers of the
delta is found to be related to the slow speed at which the delta progrades,
the formation of a mobile armour layer and the erosion of the topset towards
the end of the run. Furthermore, a strong correlation between the coarsening
of the bottom layer of the delta and its front height has been documented
and explained: as the delta gets higher, as there is more space to sort sedi-
ment, it is more likely that coarse particles failing near the top of the foreset
reach the bottom of the foreset. These findings provide new and useful data
documenting sediment sorting in granular, bedload-dominated deltas.
Keywords Empirical model, experiment, Gilbert-type delta, sorting, strati-graphy.
INTRODUCTION
Alluvial deltas are complex depositional sys-tems of material fed by rivers into a standingbody of water. Their stratigraphy is often usedto infer changes in the water level and the waveenergy of the basin as well as in the sediment
supply of the channel that originated it. Further,much of the attention deserved by coarse-grained deltas partly arises from their potentialas hydrocarbon and minerals reservoirs. If thestanding body of water is caused by a dam, therate at which sediment deposits withinthe impoundment and progrades towards the
1© 2015 The Authors. Sedimentology © 2015 International Association of Sedimentologists
Sedimentology (2015) doi: 10.1111/sed.12189

dam becomes crucial to foresee the lifetime ofthe reservoir: many reservoirs are nearly filledwith sediment, and others are close to the endof their life-span (Evans et al., 2000).Classical Gilbert-type deltas have delta fronts
that, as they prograde into still water (sea, lake,reservoir, etc.), maintain a slope that is at, or nottoo far below, the angle of repose (Gilbert, 1890;Kleinhans, 2005; Muto et al., 2012). In thesetypes of deltas, all sediment coming in settleson the topset and foreset, which might result ina delta that progrades, aggrades and graduallylowers the streamwise slope of the topset(Nemec, 1990).As illustrated in Fig. 1 (based on Vanoni,
1975), deltas show a depositional structurecomposed of three different zones: (i) a deltatopset, where the material entering into the sys-tem may be transferred to a prograding distribu-tary plain; (ii) a foreset, also referred to as thelee surface, corresponding to the relativelysteep face of the prograding delta, where thematerial being transported along the topsetdeposits after avalanching across the topset–foreset brinkpoint therefore making the deltaprograde basinward; and finally (iii) a bottom-set, i.e. a mild-slope delta toe deposit locateddownstream of the foreset, the material ofwhich is finer than that forming the foreset(Jopling, 1965). Figure 1 shows the way inwhich a delta progrades within an impound-ment. The respective average slopes of thetopset and the foreset reflect the different domi-nant processes occurring within. The topsetslope depends on external constraints, i.e. thesediment supply rate, water depth and sedi-ment grain-size distribution, among others. In aGilbert-type delta, however, the slope of theforeset remains close to the submerged angle ofrepose (Vanoni, 1975; Carling & Glaister, 1987;Hotchkiss & Parker, 1991; Kleinhans, 2002).
The modes by which sediment is moved inthese three zones are dramatically different.While the topset area is associated with alluvialsediment transport processes, material is trans-ported along the foreset by gravity-driven mech-anisms. Sediment transported in suspensiondeposits either on the bottomset or on the fore-set (individual material grains can be depositedat the foreset–bottomset break after being ejectedfrom the foreset–topset brinkpoint). Althoughdifferent processes dominate in each zone, allthree areas constitute an integral and coexistingsedimentary structure (Nemec, 1990).The sedimentary processes involved in
Gilbert-type deltas have been studied widely bymeans of experimental analyses (Jopling, 1965;Hunter & Kocurek, 1986; Seal et al., 1997;Kleinhans, 2005; Blom & Kleinhans, 2006).Equivalent sedimentary processes along leesides of dunes and isolated steps have alsodeserved attention (Allen, 1965; Hunter, 1985a;Blom & Kleinhans, 2006). Bed material beingtransported either in suspension or as bedloadcan be deposited on the lee surface below thebrinkpoint as flow separates downstream of it;the former can even be deposited further down-stream in the bottomset (Jopling, 1965). Sedi-ment is moved along the foreset as grain falls,grain flows and individual grains rolling down(Jopling, 1965; Hunter, 1985b; Carling & Glaister,1987). Grain fall refers to the process by whichbed material settles from suspension onto theforeset or the bottomset. Bedload is deposited inthe upper part of the foreset forming a wedge,the slope of which (static angle of repose) issteeper than the average foreset slope (dynamicangle of repose). Bed material accumulated inthe top wedge periodically collapses and fallsdown along the lee face when its slope growsbeyond the static angle of repose. This mecha-nism, called ‘avalanching’, consists of a grain
Fig. 1. Schematic diagram of bedprofiles of a prograding Gilbert-typedelta within an impoundmentupstream of a dam (based onVanoni, 1975).
© 2015 The Authors. Sedimentology © 2015 International Association of Sedimentologists, Sedimentology
2 C. Ferrer-Boix et al.

flow that is the main process responsible foremplacement of the foreset (Nemec, 1990). Grainflow is an intermittent process because sometime is needed to build the oversteepenedwedge (Allen, 1965, 1970; Hunter, 1985b). How-ever, continuous ‘avalanching’ may occur whensediment supply exceeds a critical value (Hunter& Kocurek, 1986; Nemec, 1990). The process bywhich the foreset is formed has been mathemati-cally modelled by semi-theoretical approaches(Allen, 1970; Hunter, 1985b; Blom & Parker,2004; Blom & Kleinhans, 2006; Blom et al.,2006) and by empirical approaches (Kleinhans,2005). The semi-theoretical approach proposedby Blom & Kleinhans (2006) has recently beenincluded by Viparelli et al. (2011, 2014) in amorphodynamic model for Gilbert-type deltas.Field examples of Gilbert-type deltas have
been the subject of much previous study (Hun-ter, 1985a; Bornhold & Prior, 1990; Sohn et al.,1997; Saito, 2011), including systems composedof a variety of grain-size distributions rangingfrom fine sand (Hunter, 1985a) to coarse sandand gravel (Saito, 2011) and even boulders(Bornhold & Prior, 1990). Sorting processes asso-ciated with Gilbert-type deltas have also beenstudied experimentally. Jopling (1965) studiedthe particle paths transported in suspensiondownstream of the brinkpoint, and resulting pat-terns of deposition in the foreset, by conductinga set of experiments with sands and a sand–gravel mixture. Hotchkiss (1989; see also Hotch-kiss & Parker, 1991), conducted experiments onprograding deltas using quasi-uniform light-weight material (crushed walnut shells). Cantelliet al. (2004) performed two experiments on deltaprogradation in a reservoir with uniform sand.These authors recorded delta evolution until theimpoundment was completely filled. Kleinhans(2005) conducted a set of experiments on deltaprogradation with sediment mixtures, the aim ofwhich was to study the grain sorting by grainflows on the foreset. The experiments allowedestablishment of empirical expressions fordimensionless parameters characterizing sortingas functions of dimensionless delta properties.Some researchers have studied bed sorting of
sand–gravel mixtures in other, related sedimen-tary structures: Carling & Glaister (1987) experi-mentally analysed bed sorting downstream of anegative step using bimodal sand–gravel mix-tures. Bed material sorting in dunes has beenstudied by Kleinhans (2002) and Blom et al.(2003). This past research has identified diffe-rent mechanisms affecting sorting at the lee face
in Gilbert-type deltas and other steep slip-facebedforms: (i) slope failures (Bornhold & Prior,1990; Sohn et al., 1997); (ii) grain flows and ava-lanches (Bagnold, 1954; Allen, 1965, 1970;Jopling, 1965; Hunter, 1985a; Hunter & Kocurek,1986; Blom et al., 2003; Kleinhans, 2005); (iii)kinetic sieving on the lee face: the small parti-cles in the grain flow dynamically percolatethrough the pores left by the coarse materialresulting in an upward coarsening of the grainflow laminae thickness (Kleinhans, 2005); and(iv) individual grain falls (Allen, 1965; Jopling,1965; Kleinhans, 2005). The interaction betweensediment supply and wave action (Saito, 2011),as well as geometrical mechanisms caused bycoarse protruding particles at the lee face andthe temporal succession of gravity-driven flows(Nemec, 1990; Sohn et al., 1997), have been rec-ognized as controlling factors of sediment sort-ing along lee faces. The major presence of coarseparticles in the outer layer of grain flows hasalso been explained in terms of dispersive pres-sures caused by grain collisions in a mixture(Bagnold, 1954). A downward coarsening distri-bution of sediment along the lee face is the mosttypical grain-size profile in steep slope subaque-ous bedforms and deltas, although some upwardcoarsening settings have also been documented(Jopling, 1965; Hunter, 1985a; Sohn et al., 1997).The experiments performed by Jopling (1965)
appear to be the first attempt to study the bedgrain-size distribution within a delta deposit.Experiments carried out by Kleinhans (2005)have made a significant contribution to theknowledge of bed material size sorting createdby prograding deltas.The groundbreaking research of Kleinhans
(2005) was focused on sorting processes onthe delta foreset itself (sediment samples wereextracted from the lee face). The present expe-rimental research extends the scope of thiswork by considering both the vertical and hor-izontal structure of the entire deltaic deposit.This structure is characterized in terms of thespatial variation in the grain-size distributionof the sediment. Knowledge of the pattern ofthis spatial variation, along with the time evo-lution of the bed profiles of the topset/foresetas the delta progrades, allows a sorting func-tion similar to that of Kleinhans (2005) to beback-calculated from measured stratigraphy.The present research thus offers a newmethodology for inferring aspects of the mor-phodynamics of delta progradation from itsstratigraphy.
© 2015 The Authors. Sedimentology © 2015 International Association of Sedimentologists, Sedimentology
Sorting in a Gilbert-type delta 3

DESCRIPTION OF THE EXPERIMENTALSET-UP
One experiment was carried out in a 12 m longand 0�60 m wide rectangular tilting flume. Sedi-ment was placed over the horizontal, inerodiblebed so as to make an antecedent deposit with aslope of 0�02 m m�1. The deltaic deposit pro-grading over this surface thus had a foresetheight that increased as in time as it progradedover an ever-lower bed.The bed material was composed of a sediment
mixture with geometric mean size Dg = 3�39 mmand geometric standard deviation rg = 1�8. Thespecific gravity of the mixture was 2�58, the bedporosity was 0�35 (Viparelli et al., 2010a) andthe size D90 (such that 90% of the sediment isfiner) was 7�83 mm. This material was alsoemployed as sediment supply from the channelinlet. A vertical dam was used to create anobstacle to the flow such that sediment supplieddeposited in the impoundment upstream. Thedam was located 9 m from the inlet of theflume. The dam height above the initial sedi-ment bed was 15 cm. A summary of the mainfeatures of the experiment can be found inTable 1. The experiment reported here was car-ried out in the same flume and using the samesediment as that of Viparelli et al. (2010a,b).Hence, the experiment was conducted using asetup that had been well-verified in advance.The experiments of Viparelli et al. (2010a) wereperformed for developing and validating amodel of river aggradation/degradation due todifferential bedload transport of sediment mix-tures. Here, the focus is on the sorting thatresults as sediment is emplaced on a progradingforeset, which is driven by the longitudinal sort-ing of the sediment transported along the deltatopset. The antecedent experiments of Cantelliet al. (2004) on incision into sandy deltaicdeposits upon dam removal proved helpful inthe design of the present experiment. Figure 2shows the grain-size distribution of the mixtureused during the experiment reported here. This
distribution was used for emplacing an initialsediment bed, and was also used for the feedsediment.Water discharge was measured with an elec-
tromagnetic flow meter attached to the pipeinlet. A valve was used to adjust the dischargeto the desired value. Sediment was introducedat a constant rate by means of a sediment screw-type feeder. The sediment feeder was placedwithin the first 2 m of the flume (x = 0 to 2 m).The sediment mixture used was introduced dry,into the upper box of the feeder. Water depthswere measured at stations upstream of the dam1 m apart. The closest and the furthest measure-ment stations from the dam are located atx = 8 m and x = 3 m, respectively. Thus, waterdepth was registered at six stations upstream ofthe dam.The flume upstream of the dam was uniformly
filled with the mixture up to a depth of 0�1 mprior to the experiment. Sediment feed was com-menced at the specified rate, and the waterpumps were switched on to the specified dis-charges, all simultaneously. Water and sediment
Table 1. Main characteristics of the experiment. Dg,f and rg,f are the geometric mean diameter and the geometricstandard deviation of the sediment feed, respectively, Lf and Wf are the flume length and the flume width; Qw andQs are the water and the sediment discharges; St and Sb are the topset and the initial bed slope, respectively, H isthe mean water depth above the topset and finally Hd and C illustrate the range of the delta height and the celer-ity of the deltaic deposit registered during the experiment.
Dg,f (mm) rg,f (–) Lf (m) Wf (m) Qw (m3 sec�1) Qs (kg sec�1) St (–) Sb (–) H (m) Hd (m) C (cm min�1)
3�39 1�8 12 0�60 4�70 9 10�2 1�33 9 10�2 0�005 0�02 0�10 0�60 to 0�135 0�52 to 0�81
10−1
100
101
0
10
20
30
40
50
60
70
80
90
100
Grain size (mm)
% F
iner
than
Fig. 2. Feed and initial (antecedent) bed grain-sizedistribution used in the experiment.
© 2015 The Authors. Sedimentology © 2015 International Association of Sedimentologists, Sedimentology
4 C. Ferrer-Boix et al.

discharges were chosen so that a topset slopenear 0�005 m m�1 evolved. The sediment feedrate was set to 1�33 9 10�2 kg sec�1, a valuechosen so that impoundment filling would takeplace within a convenient amount of time. Withthis in mind and with the aid of previous expe-riments carried out with the same facility andsediment mixture (Viparelli et al., 2010a,b),water discharge was set equal to 47 l sec�1.Indeed, the selected water discharge, sedimentdischarge and grain-size distribution, correspondto an equilibrium bed slope of 0�005 m m�1
(Viparelli et al., 2010a,b). Bed profiles weremeasured with the aid of four ultrasonic trans-ducer probes (described in Wong et al., 2007),located at transverse distances 13�5 cm, 24�5 cm,35�5 cm and 46�5 cm with respect to one side ofthe flume, attached to a carriage. Four stream-wise bed profiles could thus be simultaneouslymeasured just by moving the carriage along theflume. Long profile measurements spanned fromx = 3 m in the upstream end (i.e. 1 m down-stream of the feeder) to a distance between0�5 m and 1 m downstream of the foreset–bottomset break. This procedure was followed,because the experiment was conducted in theabsence of sediment transported in suspension,which means that sediment was deposited alongthe topset or the foreset without settling on thebottomset. The elevations of the topset weretaken at a 0�2 m resolution. Node spacing alongthe foreset slopes was decreased to 0�02 m. Thespatial resolution of the measurements was gra-dually reduced to 0�1 m and 0�05 m in caseswhere it was observed that the topsetapproached the foreset slope. After each bedprofile measurement, the flume was drained inorder to video record the position of the deltafront. To continue the run, the flume was back-filled by means of two hoses (if the flume hadbeen filled by its inlet, water would have erodedthe delta front).Sediment samples of the deltaic deposit were
taken once the experiment was finished. Sam-ples were extracted with a metallic box 30 cmhigh, 10 cm wide and 15 cm long. This box hasbeen previously used by Blom et al. (2003), andis documented therein. The box was manuallydriven into the deposit, and then extracted withthe material inside it. The delta was destroyedafter the sediment sampling (see Fig. 3). Sam-ples were extracted from six cross-sections ofthe deposit, equally spaced 1 m apart (fromx = 3�5 to 8�5 m, which correspond to the last5�5 m of the flume upstream of the dam). Two
samples were extracted from each cross-section,i.e. one at each side of the bed. The sedimentcontained in the box was divided into 2 cmthick slices, each of which was sieved indepen-dently. The deepest samples corresponded to adepth of 5 cm and were extracted from the ini-tial bed layer of 0�1 m deep. A total of 79 sam-ples were analysed.The run was ended when the toe of the foreset
reached the dam. The experiment was repeatedtwice to check for consistency. Details of theexperiment can be found in Ferrer-Boix (2011).
EXPERIMENTAL RESULTS
Experimental results obtained from the run ondelta progradation are shown below. One runwas used to collect data, while the other onewas used to verify the delta progradationpattern. The experiment was used to analysehow the delta fills the impoundment as itapproaches the dam and how bed material issorted within the deposit.
Delta evolution
As water and sediment approach the dam, watervelocity slows and bed material deposits, resultingin an aggrading bed profile. In general, bed mate-
Fig. 3. Photograph illustrating the excavation ofmaterial for sampling of delta material as well as thesediment sampling device (used by Blom et al., 2003and Viparelli et al., 2010a,b).
© 2015 The Authors. Sedimentology © 2015 International Association of Sedimentologists, Sedimentology
Sorting in a Gilbert-type delta 5

rial is deposited both on topsets, causing bedaggradation, and on foresets, causing progradationtowards the dam (Hotchkiss & Parker, 1991).Figure 4 plots the delta advance towards the
dam at different times until complete filling ofthe impoundment after approximately 10�5 h.Data obtained by the four probes have been ave-raged in order to obtain one profile of the deltaat each time. All profiles show small irregulari-ties that are thought to be bars that were toosubtle to be distinguished by sight. Figure 5shows three positions of the delta foreset duringone of the two runs on delta progradation.It can be seen in Fig. 4 that if the first profile
(for which there are only four points to calculatethe slope) is omitted, the topset slope changes lit-tle in time. The second profile already exhibits atopset slope of 0�0049 m m�1, i.e. identical to thelast profile at t = 625 min, which was obtainedwith 34 points (R2 = 0�95). This slope was alsonearly equal to the equilibrium value associatedwith the water discharge, sediment feed rate andsediment size distribution (Viparelli et al., 2010a,b). Figure 6 illustrates the changes in bed eleva-tion Dz of the topset between consecutive long
profiles. Topset aggraded until t = 359 min anddegraded from this time onwards. Maximummean topset aggradation between t = 138 minand t = 238 min was 4�2 mm (2�8 mm betweent = 238 min and 359 min). Mean topset degrada-tion was 1�1 mm from t = 359 to 510 mm(1�7 mm from t = 510 to 625 mm). Thus, aftert = 359 min, there is no longer significant verticalstorage of material due to aggradation, and thedelta grows by means of sediment emplacementin the foreset as it progrades downstream (accom-panied by little degradation of the delta topset:2�8 mm in the last 4�4 h of the run). The insetplot at the top right of Fig. 6 illustrates the eleva-tion of the delta and its height at the brinkpoint(zbp and Hd,bp, respectively). Under conditions ofa constant base level, material emplaced in theforeset decreases the slope of the delta topset asit progrades downstream, thus causing a reduc-tion in the sediment transport capacity in thedownstream direction. This configuration leadsto an upward-concave profile if the width of thetopset is maintained uniform – some changes inthe curvature may arise driven by downstreamvariations of the surface grain-size distribution
300 400 500 600 700 800 9000
5
10
15
20
25
30
x (cm)
Elev
atio
n (c
m)
t = 0 min, Sb = 0·02 m m–1
t = 9 min
t = 40 min
t = 63 mint = 138 min
t = 238 mint = 359 min
t = 510 min
t = 625 min, St = 0·005 m m–1
t = 138 min t = 238 min t = 359 min t = 510 min t = 625 min
0·05 0·1 0·150·4
1·0
1·6
1/Hfs (cm–1)
C (c
m m
in–1
)
R2 = 0·92
Fig. 4. Delta profiles at different times. Values have been obtained by averaging from the four transducer probeslocated at each cross-section. In the bottom-left is a plot of the delta celerity (C) versus the inverse of delta height(1/Hfs). The markers shown in the delta profiles in the main plot have been used in the celerity-height plot. Col-our lines are the water surface profiles obtained with the hydraulic model for the delta profiles registered att = 138 min, 238 min, 359 min, 510 min and 625 min. The colour of the line matches the colour of the marker fora pair of water surface and bed profiles, respectively.
© 2015 The Authors. Sedimentology © 2015 International Association of Sedimentologists, Sedimentology
6 C. Ferrer-Boix et al.

(Ferrer-Boix et al., 2014). Concavity of each top-set long profile has been examined by fittingpotential curves. Results of the interpolationshow that all long profiles are slightly upward-concave. Topset profiles exhibit low values of themean curvature (ranging between 9�9 9 10�4 m�1
and 1�5 9 10�4 m�1) with no significant diffe-rences between aggrading and degrading profiles.
The foreset slope is close to the angle ofrepose. The average foreset slope is 34°. Thisvalue corresponds with the prediction ofCarling & Glaister (1987), i.e. a foreset slope of31 to 34° for a sand content in the sedimentranging from 20 to 60%. The fraction of sandin the mixture used in this experiment was24�7%.
A B C
Fig. 5. Three front views of the prograding delta at different times: 40 min (A), 510 min (B) and 625 min (C).
300 400 500 600 700 800–7·5
–5
–2·5
0
2·5
5
7·5
10
x (cm)
∆z (
mm
)
z138 min
– z63 min
z238 min
– z138 min
z359 min
– z238 min
z510 min
– z359 min z
625 min– z
510 min
0 120 240 360 480 600 72015
16
17
Time (min)
z bp(c
m)
0
5
10
15
Hd,
bp(c
m)
Hd,bp zbp
Fig. 6. Changes in bed elevation of the topset between consecutive long profiles after t = 63 min. The inset plotillustrates the temporal evolution of the bed elevation (black triangles) and the delta height (white squares) at thebrinkpoint.
© 2015 The Authors. Sedimentology © 2015 International Association of Sedimentologists, Sedimentology
Sorting in a Gilbert-type delta 7

Delta progradation celerities were computedfrom long profiles in Fig. 4. The delta frontposition is here defined as the topset–foresetbrinkpoint. It was found that front celerity fol-lows a decaying relationship with elapsedtime: the larger the time the slower the deltacelerity, confirming the mathematical findingsof a prograding delta analysed by, for example,Lorenzo-Trueba & Voller (2010).There are two reasons why delta celerity
should decrease in time. Even under condi-tions of constant base level (downstream watersurface elevation in the present case) and pro-gradation over a horizontal bed, celeritydecreases in time, because under aggradingtopset conditions, a loss of sediment due tothe emplacement of an ever-longer topsetreduces the sediment supply to the brinkpoint.In the case of the present experiment, how-ever, the antecedent bed had a slope of0�02 m m�1, so that antecedent bed elevationdeclined. This condition forced the height ofthe foreset to increase as it migrated down-stream. For the same amount of sedimentdelivered to the brinkpoint, a higher foresetimplies a lower progradation speed. Becausethe topset slightly aggraded during the first sixhours of run and degraded afterwards, it wasthis latter effect that dominated decreasing thecelerity with time.
Bed material sorting
Figure 7 shows the geometric mean grain-sizedistribution within the delta deposit. Initial andfinal bed profiles have been included. Express-ing any grain size D in the w-scale such that:
D ¼ 2w ð1Þ
The geometric mean diameter Dg is calculatedas:
wg ¼XM
i¼1
wmifi and Dg ¼ 2wg ð2Þ
where wmi is the centre of each grain class in thew-scale, fi are the sediment fractions of eachgrain class being M the number of grain classesof the mixture. The geometric standard devia-tion of the samples rg is obtained as:
r2 ¼XM
i¼1
ðwmi � wgÞ2fi and rg ¼ 2r ð3Þ
Four different layers can be observed (from topto the bottom) in Fig. 7:
1 In the topmost layer, mean grain size is closeto that of the feed material (3�39 mm). However,some fining is observed within this layer. Sedi-
300
Initial bed
Deltaic deposit
400 500 600 700 800 900–5·0
0·0
5
10
15
20
Bed
ele
vatio
n (c
m)
x (cm)
Dg,feed
= 3·39 mm
2·0
2·5
3·0
3·5
4·0
4·5
5·0
Dg
(mm)
Fig. 7. Geometric mean diameter within the deltaic deposit and in the initial (antecedent) sediment.
© 2015 The Authors. Sedimentology © 2015 International Association of Sedimentologists, Sedimentology
8 C. Ferrer-Boix et al.
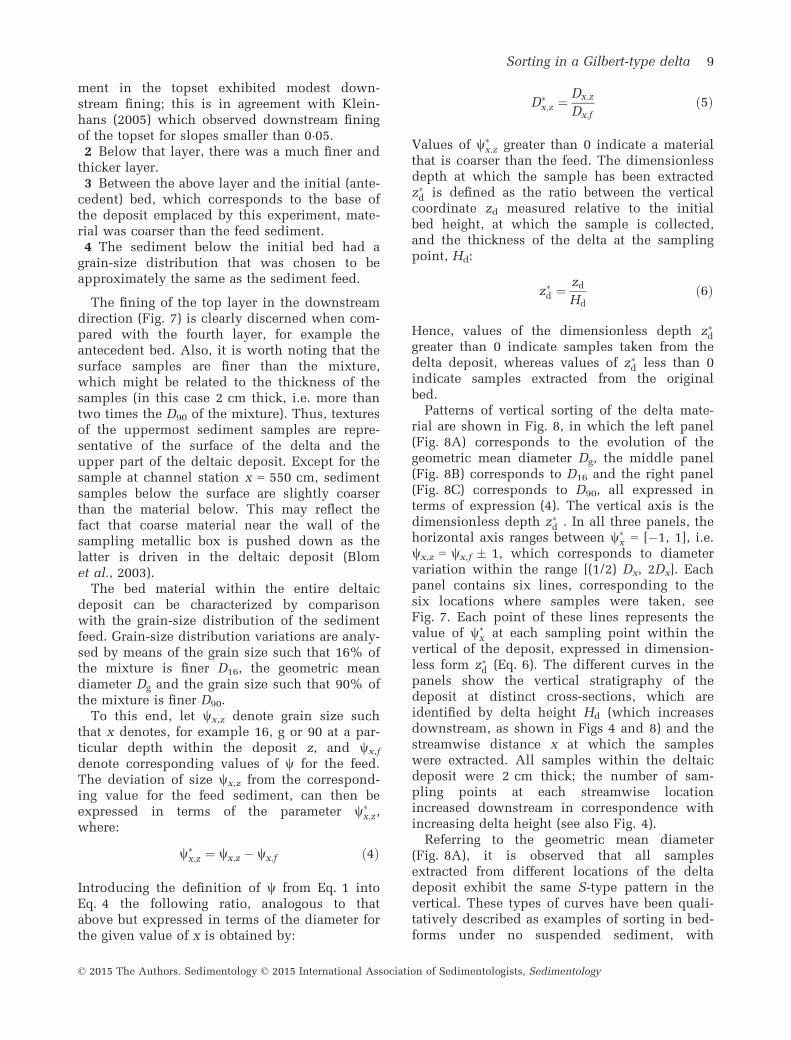
ment in the topset exhibited modest down-stream fining; this is in agreement with Klein-hans (2005) which observed downstream finingof the topset for slopes smaller than 0�05.2 Below that layer, there was a much finer and
thicker layer.3 Between the above layer and the initial (ante-
cedent) bed, which corresponds to the base ofthe deposit emplaced by this experiment, mate-rial was coarser than the feed sediment.4 The sediment below the initial bed had a
grain-size distribution that was chosen to beapproximately the same as the sediment feed.
The fining of the top layer in the downstreamdirection (Fig. 7) is clearly discerned when com-pared with the fourth layer, for example theantecedent bed. Also, it is worth noting that thesurface samples are finer than the mixture,which might be related to the thickness of thesamples (in this case 2 cm thick, i.e. more thantwo times the D90 of the mixture). Thus, texturesof the uppermost sediment samples are repre-sentative of the surface of the delta and theupper part of the deltaic deposit. Except for thesample at channel station x = 550 cm, sedimentsamples below the surface are slightly coarserthan the material below. This may reflect thefact that coarse material near the wall of thesampling metallic box is pushed down as thelatter is driven in the deltaic deposit (Blomet al., 2003).The bed material within the entire deltaic
deposit can be characterized by comparisonwith the grain-size distribution of the sedimentfeed. Grain-size distribution variations are analy-sed by means of the grain size such that 16% ofthe mixture is finer D16, the geometric meandiameter Dg and the grain size such that 90% ofthe mixture is finer D90.To this end, let wx,z denote grain size such
that x denotes, for example 16, g or 90 at a par-ticular depth within the deposit z, and wx,f
denote corresponding values of w for the feed.The deviation of size wx,z from the correspond-ing value for the feed sediment, can then beexpressed in terms of the parameter w�
x;z,where:
w�x;z ¼ wx;z � wx;f ð4Þ
Introducing the definition of w from Eq. 1 intoEq. 4 the following ratio, analogous to thatabove but expressed in terms of the diameter forthe given value of x is obtained by:
D�x;z ¼
Dx;z
Dx;fð5Þ
Values of w�x;z greater than 0 indicate a material
that is coarser than the feed. The dimensionlessdepth at which the sample has been extractedz�d is defined as the ratio between the verticalcoordinate zd measured relative to the initialbed height, at which the sample is collected,and the thickness of the delta at the samplingpoint, Hd:
z�d ¼ zdHd
ð6Þ
Hence, values of the dimensionless depth z�dgreater than 0 indicate samples taken from thedelta deposit, whereas values of z�d less than 0indicate samples extracted from the originalbed.Patterns of vertical sorting of the delta mate-
rial are shown in Fig. 8, in which the left panel(Fig. 8A) corresponds to the evolution of thegeometric mean diameter Dg, the middle panel(Fig. 8B) corresponds to D16 and the right panel(Fig. 8C) corresponds to D90, all expressed interms of expression (4). The vertical axis is thedimensionless depth z�d . In all three panels, thehorizontal axis ranges between w�
x = [�1, 1], i.e.wx,z = wx,f � 1, which corresponds to diametervariation within the range [(1/2) Dx, 2Dx]. Eachpanel contains six lines, corresponding to thesix locations where samples were taken, seeFig. 7. Each point of these lines represents thevalue of w�
x at each sampling point within thevertical of the deposit, expressed in dimension-less form z�d (Eq. 6). The different curves in thepanels show the vertical stratigraphy of thedeposit at distinct cross-sections, which areidentified by delta height Hd (which increasesdownstream, as shown in Figs 4 and 8) and thestreamwise distance x at which the sampleswere extracted. All samples within the deltaicdeposit were 2 cm thick; the number of sam-pling points at each streamwise locationincreased downstream in correspondence withincreasing delta height (see also Fig. 4).Referring to the geometric mean diameter
(Fig. 8A), it is observed that all samplesextracted from different locations of the deltadeposit exhibit the same S-type pattern in thevertical. These types of curves have been quali-tatively described as examples of sorting in bed-forms under no suspended sediment, with
© 2015 The Authors. Sedimentology © 2015 International Association of Sedimentologists, Sedimentology
Sorting in a Gilbert-type delta 9

armouring on the surface and grain flows com-posed primarily of gravel (Kleinhans, 2004). Atthe top of the curve (z�d = 1), w�
g is close to zero,implying a geometric mean size close to that ofthe feed material. Geometric mean grain sizediminishes downwards until reaching a mini-mum value at a depth close to the half of thedelta height (z�d = 0�5). Below this point, diame-ters begin to increase until they attain a maxi-mum value at the bottom of the deposit (z�d = 0).Bottom layer coarsening reaches values of w thatare almost 50% larger than the feed (41% largervalues in terms of grain size D) at locationsproximal to the dam. Samples deeper than thoselocated at the bottom of the delta are close to 0,meaning that, as expected, the antecedent bedhas the same grain-size distribution as the feedsediment. The averaging inherent to the sam-pling technique is the reason why the upper-most samples of the initial bed (z�d < 0) areslightly coarser than the feed material.The 16% percentile vertical variations of w�
16
in Fig. 8B exhibit the same pattern as discussedabove for the geometric mean diameter. It can beseen that there is less fining in the top half ofthe delta deposit compared to w�
g, and more
coarsening in the bottom half. This behaviourdiffers from that observed for the 90% percentilein Fig. 8C: there is no significant coarsening of
w�90 at the delta base, but fining within the delta
deposit reaches almost 50% of the value of D90
of the feed. This is because w�16 and w�
90 account,approximately, for the lower and the upperboundaries of the grain-size distribution, respec-tively.Figure 9 is a lateral view of the delta deposit
at longitudinal coordinate x = 5 m (i.e. 4 mupstream of the dam). Downward coarseningwithin the delta is clearly seen: its bottom layer(above the horizontal line) is much coarser thanthe original bed (which has the same grain-sizedistribution as the sediment feed), as well as thelayers above.According to Fig. 8A, there is a positive gradi-
ent in the mean grain size between the middleof the delta height (z�d = 0�5) and the bottom(z�d = 0). This grading ‘intensity’ can be quanti-fied with the aid of the following expressions.Let �zd define a downward dimensionless coordi-nate:
�zd ¼ 1� z�d ð7Þ
A sketch of the delta sample showing the defini-tion of �zd has been included in Fig. 7. The verti-cal dimensionless gradients of w�
g (Fig. 8A) areapproximated by central finite differences as fol-lows:
–1·0 –0·5 0·0 0·5 1·0–1·0
–0·5
0·0
0·5
1·0A
ψg* (–)
z d*(–
)
–1·0 –0·5 0·0 0·5 1·0
B
ψ16* (–)
–1·0 –0·5 0·0 0·5 1·0
C
Deltaicdeposit
Initial bed
ψ90* (–)
Hd = 6·01 cm(x = 3·5 m)
Hd = 7·51 cm(x = 4·5 m)
Hd = 9·01 cm(x = 5·5 m)
Hd = 10·5 cm(x = 6·5 m)
Hd = 12·0 cm(x = 7·5 m)
Hd = 13·5 cm(x = 8·5 m)
Fig. 8. Vertical sorting at different locations of the delta in terms of geometric mean diameter (left) and percen-tiles corresponding to 16% (centre) and 90% (right). There are six lines per panel. Each line plots the values of wg
(or w16 or w90) at the six locations where the samples were taken, ordered as measured from the inlet so that themost upstream sample is at x = 3�5 m. and the most downstream sample is at x = 8�5 m. (Note that the dam islocated at x = 9 m.) Each point of these lines represents the value of w�
x at each sampling point within the verticalof the deposit, the latter expressed in dimensionless form z�d . The value of Hd indicates the height of the delta ateach location (which increases linearly in the downstream direction: see Fig. 10).
© 2015 The Authors. Sedimentology © 2015 International Association of Sedimentologists, Sedimentology
10 C. Ferrer-Boix et al.

dw�g
d�zdffi w�
g;zþ1 � w�g;z�1
�zd;zþ1 � �zd;z�1ð8Þ
The maximum value of this gradientðdwg=d�zdÞmax, which herein is called the gradingintensity, is located between z�d = 0�25 and 0�5.Figure 10 plots the maximum gradient as a func-tion of the dimensionless length of the deltax�d = x/L, where L denotes the distance between
the feeder and the dam and x is measured rela-tive to the position of the feeder. The small insetpanel illustrates the linear variation in delta
height Hd with the streamwise distance x�d, and
thus x. Figure 10 clearly shows that there is astrong correlation between downstream distancein the delta and the vertical grading intensity,which means that, given the linear increase ofthe delta height with x, there is in fact a strongpositive correlation between grading intensityand delta height.Figure 8 shows a weak downstream fining of
the delta grain-size distribution for the materialin the top layer (z�d = 1). Downstream sorting ofthe bottom layer is analysed in Fig. 11, whichwas obtained by averaging the correspondingvalues shown in Fig. 8 of the geometric meandiameter w�
g (Fig. 11A), 16% size w�16 (Fig. 11B)
and 90% size w�90 (Fig. 11C), within the bottom
layer (z�d = [0�0–0�2]). Downstream coarsening isclearly observed in all three plots. Moreover, thefiner the reference diameter w�
x, the greater theamount of coarsening. As noted before, this pat-tern is partly constrained by the lower andupper limits of the grain-size distribution. Onthe other hand, the feed material has been usedfor normalization of the vertical samplesextracted from the deposit (Eqs 4 and 5). Thismaterial is coarser than the actual sedimenttransport rate over the brinkpoint, because somedownstream fining has been noticed in the toplayer. This normalization process might havecontributed to an overestimation of the fining ofthe D90 in the central part of the deposit and anunderestimation of the coarsening of the D90 in
Initial bed
Deltaic deposit
Fig. 9. Lateral view of the delta during the experi-ment. Water flows from left to right. The red linedenotes the interface between the deposit and theantecedent sediment below.
0 0·2 0·4 0·6 0·8 1·00
0·5
1·0
1·5
2·0
2·5
3·0
3·5
d ψg*
d zd max
= 3·3 xd*1·44
R2 = 0·97
d ψ
g*
d z d
max
(−)
xd* (−)
200 550 900
5
10
15
x (cm)
Hd (
cm)
0 0·5 1x
d* (−)
maDtniopdeeF
Fig. 10. Maximum gradient ðdwg=d�zdÞmax of the sorting material of the geometric mean diameter versus stream-wise distance x�
d. Inset plot shows the linear relation of the delta height Hd with the dimensionless streamwisecoordinate.
© 2015 The Authors. Sedimentology © 2015 International Association of Sedimentologists, Sedimentology
Sorting in a Gilbert-type delta 11

the bottom layer (Fig. 8C). Finally, the variabledensity of sediment samples, especially in theverticals at x = 350 cm and 450 cm might haveintroduced an additional sorting in the bottomlayer in the longitudinal direction.A normalized standard deviation of grain-size
distribution of a sample is defined here as r�g ,where:
r�g ¼
rg;z
rg;fð9Þ
where, again, f stands for the fed material and zfor elevation. Thus, rg,z is the geometric stan-
dard deviation of the deposit at elevation z andrg,f is the geometric standard deviation of thefeed material. This parameter enables discussionof the patterns of sorting in the deposit. Valuesof r�g greater than 1 mean that the grain-sizedistribution is more poorly sorted than the sedi-ment feed. Figure 12 summarizes the down-stream variation of r�
g as computed from theupper layer of the delta, i.e. the range z�d = [0�8–1�0]. Within the upper layer r�
g diminishes as itmoves downstream, demonstrating selectivetransport along the topset, with a wider range ofsizes upstream and a narrower range down-stream.The process of sediment deposition on the
foreset consists of repeated cycles of avalanches.Coarser material is initially deposited just belowthe break between the topset and the foreset,forming a steeper slope than the angle of repose.This material wedge eventually avalanchesdown the lee surface dragging finer materialaccumulated further below the topset–foresetbreak. The less volume of material involved, themore efficient the sorting process (Kleinhans,2004). The avalanche generally results in prefe-rential motion of the coarser material to the baseof the foreset. Various sorting mechanisms occurduring this material displacement (Kleinhans,2002), but what is important here is that thehigher the delta, the higher number of ava-lanches (because, for a given sediment transportrate, the greater the delta height, the more timerequired to fill the entire height of the delta tomake it prograde). Kleinhans (2005) quantifiedthis by introducing a coefficient A* which wasdefined as a dimensionless grain flow number:A* = RghgC
�2 where R is the submerged specific
−0·50
−0·25
0
0·25
0·50
ψg* (
−)
A
−0·50
−0·25
0
0·25
0·50
ψ16*
(−
)
B
0 0·25 0·5 0·75 1·0−0·50
−0·25
0
0·25
0·50
ψ90*
(−
)
xd* (−)
C
Fig. 11. Longitudinal sorting of the bed materialwithin the bottom layer in terms of the geometricmean diameter w�
g (A), the sizes w�16 (B) and w�
90 (C).
0 0·5 10·8
0·9
1·0
1·1
1·2
σg*
(−
)
xd
* (−)
Fig. 12. Longitudinal variation of the geometric stan-dard deviation r�
g within the upper layer of the deposit.
© 2015 The Authors. Sedimentology © 2015 International Association of Sedimentologists, Sedimentology
12 C. Ferrer-Boix et al.

gravity of the sediment, g is the acceleration ofgravity, hg is the thickness of the grain flowsand C is the celerity at which the delta pro-grades. It is seen that for a given grain flowthickness hg, A* increases as the height of thedelta celerity decreases. Because delta celerity isinversely proportional to the delta height (seebottom-left inset in Fig. 4), the dimensionlessnumber of grain-flow events scales with thedelta height. An increasing number of ava-lanches of material originated at the topset–fore-set brinkpoint fall down the lee face of the deltapreferentially dragging coarser particles alongthe foreset towards the bottom layer of thedeltaic deposit. In addition, a thicker foresetprompts better grain separation as the sedimentavalanches, so preferentially moving coarsermaterial to the base of the delta. Note that themaximum grading intensity is located at z�d =[0�25–0�5]. These patterns are likely to be associ-ated with the dominant mechanisms that causethe bottom layer to get coarser. In addition tothis, larger foresets provide more space to sortmaterial, making the sorting more efficientbecause there is more time for the coarse parti-cle to be dragged down along the foreset. Someother physical processes linked to the coarsen-ing of the bottom layer in the downstream direc-tion are given in the Discussion section.
Hydraulics of the experiment
Channel hydraulics are crucial to interpretationof the experiment on delta progradation. A one-dimensional numerical modelling using thehydraulic code HEC-RAS has been carried out.Water surface profiles for each of the long pro-files of the delta obtained at times t = 138 min,238 min, 359 min, 510 min and 625 min havebeen computed. A detailed description of thenumerical model can be found in Data S1.Normal depth for each delta topset profile
(computed using the D90 of the mixture and themean bed slope of each long profile) rangesbetween 0�11 m and 0�12 m, whereas the corre-sponding water depth for the initial 2% slope is0�067 m. The critical depth is 0�086 m. Thus, asubcritical backwater curve is expected betweenthe brinkpoint and the dam, and a distinct watersurface profile curve would develop along thedelta topset depending on whether the waterdepth at the brinkpoint is higher, lower or equalto the normal depth. Computed long profilesdemonstrate that the height of the dam at thedownstream end imposes a water depth at the
brinkpoint close to the normal depth: 0�091 m to0�11 m. Thus, a uniform flow profile developson the delta topsets. Figure 4 illustrates thecomputed water surface elevation for the deltaprofiles after t = 63 min. All five water surfaceprofiles show some common features: a back-water curve in the ever-shorter part of theimpoundment between the brinkpoint and thedam (with equal water surface elevations for alllong profiles at the closest stations to the dam)and a uniform flow along the topset. Mean devi-ation of the water depth with respect to the nor-mal depth, depending on the local channelslope (and also the surface texture in the lastprofile), ranges between 3�2% (t = 625 min) and16�5% (t = 138 min). Maximum values of Fro-ude number (Fr ¼ v=
ffiffiffiffiffiffigh
pwhere v and h are the
mean flow velocity and the water depth, respec-tively) are near critical conditions in the deltatopset profiles at stations close to the brinkpointat t = 138 min, 238 min and 359 min. Slightlylower values of the maximum Froude number(Frmax = 0�85) are obtained for the last two deltatopset profiles at t = 510 min and t = 625 min.Mean Froude number along the topset graduallydeclines during the experiment (Fr = 0�84 to0�73).
DISCUSSION
The topset deposit aggrades during the first359 min and starts to degrade afterwards: allmaterial supplied from upstream and part of thetopset that had been previously built up was,from t = 359 mm to the end of the run, em-placed along the foreset without contributingany longer to topset aggradation. The relation-ship between the delta celerity and the inverseof the delta front height can be used as a way toquantify how significant the topset aggradation(and degradation) is relative to the downstreamprogradation of the delta: if all material suppliedfrom upstream deposited on the lee slope (with-out any change in the delta topset) so as to makethe delta advance towards the dam, a perfectlylinear relationship would exist between thedelta celerity and the inverse of the delta frontheight. A nearly linear relationship (R2 = 0�92)is obtained when all data after t = 40 min areincluded in this analysis (Fig. 4), the correlationcoefficient rises to 0�98 if only the last four deltaprofiles are considered. The high correlationcoefficients evidence the minor significance ofthe storage of material on the topset slope rela-
© 2015 The Authors. Sedimentology © 2015 International Association of Sedimentologists, Sedimentology
Sorting in a Gilbert-type delta 13
tive to the downstream advance of the deltaregardless of whether the sediment suppliedcontributes to topset aggradation or not. Thegood agreement between these two variables alsodemonstrates the absence of suspended sedi-ment in the experiment, some of which wouldotherwise have been wafted beyond the base ofthe foreset, and emplaced as a bottomset. Theminor changes in the topset elevation (Fig. 6)and the low values of the curvatures of the longprofiles are consistent with the uniform flowdeveloped along the topset and predicted by thehydraulic model (Fig. 4).Vertical sorting parameters in the w-scale have
been normalized with the corresponding para-meters of the feed grain-size distribution. Amore detailed analysis could have used the rele-vant grain size of the sediment transport at thesame vertical position where the sample wasextracted. However, the material in the samplingpoints of the same vertical was deposited at dif-ferent times. That is, insofar as the foreset slopeis close to the angle of repose, the basal layersof a vertical cross-section were emplaced earlierthan the layers above. Thus, a normalization ofthe vertical structure using the sediment trans-port grain-size distribution would only havebeen representative of the surface samples.Kleinhans (2002, 2005), in experiments of sort-ing in deltas and dunes, normalized the vertical
samples by using the average sediment transportgrain-size distribution at various locations onthe foreset, where the samples were collected.That is, Kleinhans sampled along a diagonal,whereas the present authors sampled in the ver-tical.Comparisons between Fig. 8 and results
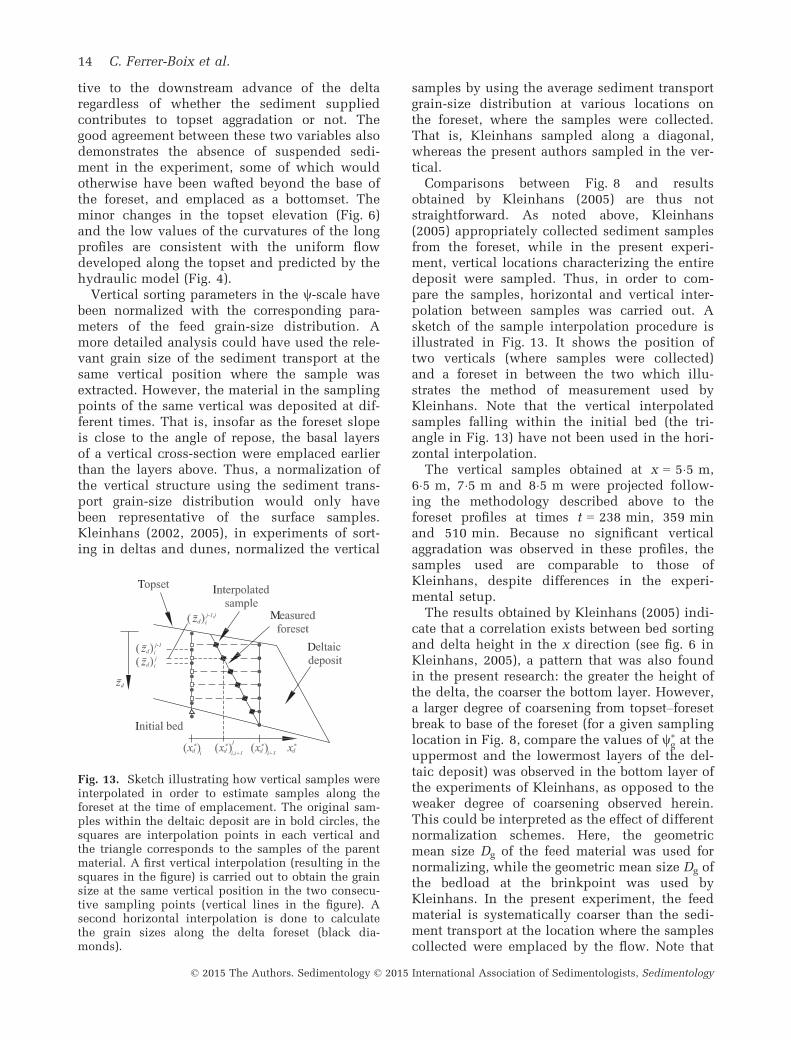
obtained by Kleinhans (2005) are thus notstraightforward. As noted above, Kleinhans(2005) appropriately collected sediment samplesfrom the foreset, while in the present experi-ment, vertical locations characterizing the entiredeposit were sampled. Thus, in order to com-pare the samples, horizontal and vertical inter-polation between samples was carried out. Asketch of the sample interpolation procedure isillustrated in Fig. 13. It shows the position oftwo verticals (where samples were collected)and a foreset in between the two which illu-strates the method of measurement used byKleinhans. Note that the vertical interpolatedsamples falling within the initial bed (the tri-angle in Fig. 13) have not been used in the hori-zontal interpolation.The vertical samples obtained at x = 5�5 m,
6�5 m, 7�5 m and 8�5 m were projected follow-ing the methodology described above to theforeset profiles at times t = 238 min, 359 minand 510 min. Because no significant verticalaggradation was observed in these profiles, thesamples used are comparable to those ofKleinhans, despite differences in the experi-mental setup.The results obtained by Kleinhans (2005) indi-
cate that a correlation exists between bed sortingand delta height in the x direction (see fig. 6 inKleinhans, 2005), a pattern that was also foundin the present research: the greater the height ofthe delta, the coarser the bottom layer. However,a larger degree of coarsening from topset–foresetbreak to base of the foreset (for a given samplinglocation in Fig. 8, compare the values of w�
g at theuppermost and the lowermost layers of the del-taic deposit) was observed in the bottom layer ofthe experiments of Kleinhans, as opposed to theweaker degree of coarsening observed herein.This could be interpreted as the effect of differentnormalization schemes. Here, the geometricmean size Dg of the feed material was used fornormalizing, while the geometric mean size Dg ofthe bedload at the brinkpoint was used byKleinhans. In the present experiment, the feedmaterial is systematically coarser than the sedi-ment transport at the location where the samplescollected were emplaced by the flow. Note that
Fig. 13. Sketch illustrating how vertical samples wereinterpolated in order to estimate samples along theforeset at the time of emplacement. The original sam-ples within the deltaic deposit are in bold circles, thesquares are interpolation points in each vertical andthe triangle corresponds to the samples of the parentmaterial. A first vertical interpolation (resulting in thesquares in the figure) is carried out to obtain the grainsize at the same vertical position in the two consecu-tive sampling points (vertical lines in the figure). Asecond horizontal interpolation is done to calculatethe grain sizes along the delta foreset (black dia-monds).
© 2015 The Authors. Sedimentology © 2015 International Association of Sedimentologists, Sedimentology
14 C. Ferrer-Boix et al.

for this analysis, the pattern of increasing deltaheight as it approaches the dam will be expresseddifferently for different deltas: a higher antece-dent bed slope and a higher rate of topset aggra-dation lead to a more strongly increasing deltaheight. Figure 14 illustrates a comparison ofthree representative results from Kleinhans(2005) (tests S1, S2 – two results – and A1therein) and the present data on sorting of thegeometric mean diameter projected to the foresetof the longitudinal profile at t = 510 min (lineswith black squares). Thus, although the ordinateof the diagram is z�d , the data points correspondto the foreset (as measured by Kleinhans andinterpolated for the experiment herein). The toplayer of the present results is somewhat coarserthan the uppermost layer of the Kleinhans data.It is important to keep in mind, however, that theKleinhans uppermost layer was somewhat belowthe surface itself. This disparity may be related tothe difference in delta celerity. The range of deltaspeed progradation in Table 1 accounts for thethree profiles along which vertical samples wereprojected (by interpolation). These values arebetween one and two orders of magnitude slowerthan those of Kleinhans.A coarser top layer (with respect to deeper sam-
ples in the deltaic deposit; see Fig. 7) was alsoobserved by Jopling (1965) in experiments withgravelly sand and glacial outwash sand. Some topcoarsening was also reported by M. G. Kleinhans
(2011, pers. comm.). A probable explanation forthis topmost coarsening is that the much slowervalues of delta progradation speed in the presentexperiment (as compared to Kleinhans) may leadto less frequent grain-flow events on the foreset,thus rendering the process of sorting less effectiveas the material falls from brinkpoint to the deltatoe. This same phenomenon would also explainwhy the bottom layers observed in the presentexperiment are finer than those of Kleinhans.Previous investigations have linked grain-flowevents to sediment transport rate on the delta top-set (Allen, 1970; Hunter, 1985b; Hunter & Ko-curek, 1986; Nemec, 1990; Kleinhans, 2005), notto the delta speed propagation. However, there isa definable relation between these two when sedi-ment transport takes place only through bedload:all sediment approaching the brinkpoint contri-butes to delta progradation into the water body.This phenomenon has been demonstrated beforewhen analysing the dependences on the dimen-sionless grain flow number defined by Kleinhans(2005).Another reason that might contribute to coar-
sen the top layer of the deltaic deposit is the for-mation of an equilibrium mobile armour. Therole of the mobile armour is to prompt coarsefractions of the mixture to the surface. Thismaterial, intrinsically less mobile than the finestgrain sizes, is over-represented on the bed sur-face so that the sediment transport texturematches that of the feed (Parker & Klingeman,1982). The formation of the mobile armour thusimplies a surface coarsening. The formation ofan equilibrium mobile armour layer has beenmodelled numerically by Viparelli et al. (2014).Topset bed slopes are close to those in equili-brium with the flow and feed rates from aftert = 40 min. However, this does not necessarilyimply that the texture of the bedload transporthad already matched that of the feed at thistime: bedload texture might take longer to equalthe feed grain-size distribution even thoughequilibrium slope has been achieved (Ferrer-Boix & Hassan, 2014). Thus, it can be hypothe-sized that an equilibrium mobile armourdevelops towards the end of the run. In thiscase, a relative increase in the bed roughnesswould be expected which, in turn, would leadto an increase in the normal depth. The down-stream boundary imposes a fixed water surfaceelevation at the dam. This boundary conditionforces the erosion of the topset, especially whenthe delta foreset approaches the dam, and if thewater depth at the brinkpoint resulting from
−1·5 −1 −0·5 0 0·5 1·0 1·50
0·2
0·4
0·6
0·8
1
ψg* (−)
z d* (−
)
S1
S2 (2 lines)
A1
Fig. 14. Sorting along the long profile foreset att = 510 min compared with some representative data(tests S1, S2 – two lines – and A1) from Kleinhans(2005).
© 2015 The Authors. Sedimentology © 2015 International Association of Sedimentologists, Sedimentology
Sorting in a Gilbert-type delta 15

the sediment emplacement is smaller than thatimposed by the boundary conditions, which isobserved in Fig. 6 where erosion of the topsetafter t = 359 to 625 min progresses upstream.In turn, the erosion of the topset might have left
the upper layers of the delta below the surfaceexposed. Thus, these layers, initially finer thanthe former topset surface, become the surface ofthe delta, leading to a finer surface (compared tothe feed, but coarser compared to the materialbelow). In this regard, it is worth noting that thedownstream fining of the topset is clearly notice-able between x = 550 cm and 850 cm, wheremost of the topset degradation takes place(Fig. 6). It could be thought that coarse particleseroded from the delta topset might have beendragged down the foreset contributing to thecoarsening of the bottom layer of the delta(Fig. 11). Furthermore, the degradation of the top-set might have enhanced its coarsening, espe-cially in those stations close to the brinkpoint.Given the limited height of the delta front, sedi-ment accumulated on the wedge of material ontop of the foreset that eventually avalanchesmight have been transported down to the bottomlayer of the delta, amplifying the coarsening inthe downstream direction. In this regard, Allen(1970) noticed that material dragged down alongthe lee face could stop at intermediate positionsand be activated afterwards when pushed downby successive events. However, the possibleamplification of the downstream coarsening isnot fully supported because Fig. 11 shows down-stream coarsening of the bottom layer atx ≤ 650 cm which was not affected by the erosionof the topset – recall that topset degradationstarted after t = 359 min, the brinkpoint positionof which is located at x = 717 cm (Figs 4 and 6).The present experiment and those conducted
by Kleinhans (2005) are both interested in howand why sediment is sorted in Gilbert-type deltas.However, the condition of the experiment pre-sented herein is essentially different from thosecarried out by Kleinhans (2005). This is because,as mentioned before, the downstream boundarycondition in the present experiment is such thatit initially imposes a water depth at the brink-point close to the normal depth. This is the rea-son why delta evolves during the first six hours ofrun with nearly no aggradation. The overall effectof the formation of an armour layer on the topset,the decreasing of the speed at which the deltaprogrades and the fixed water surface elevationimposed as a boundary condition downstreamforces the delta to degrade after t = 359 min.
Finally, the experiment shows that when bed-load dominates, no bottomset is emplaced fromsuspended load, so that the associated down-stream fining pattern from brinkpoint to damshown in Fig. 1 is not observed. This pattern ofdownstream fining is observed when suspendedload is an important fraction of the total load(Jopling, 1965). Conversely, in deltas emplacedby bedload, coarser material is deposited on thebottom layer, such that coarser material accumu-lates closer to the dam. This condition holds atleast for the experiment conducted here.
Comparison with a sorting model
The experiments carried out by Kleinhans(2005) were focused on studying vertical sortingon the delta lee face due to grain flow. The aimof the experiment presented herein is, however,to describe the spatial variation in the entiredeposit emplaced by a prograding delta. Never-theless, insofar as every point within the depositwas formed by the bed material falling along thelee face, the Kleinhans experiments, eventhough different in scope, can be used for thepurpose of comparison with the present work.In particular, a check can be made as to whetherthe equation presented by Kleinhans (2005) forlee face (foreset) sorting can be applied to theexperiment herein.Here, the grain-size distribution along the pre-
sent delta is compared with the predictions of theempirical sorting model presented by Kleinhans(2005). The model has the advantage of simplicitybut, as pointed out by Blom & Kleinhans (2006),one drawback is that mass conservation is not sat-isfied. In this regard, Blom & Kleinhans (2006)present a sorting model, calibrated and validatedwith delta and dune experiments, which does sat-isfy mass conservation. However, the presentresearch warrants a direct comparison with theKleinhans sorting model.A key parameter of the Kleinhans model is a
dimensionless sorting slope along the lee face,defined as follows:
SS� ¼ 1
rT
dw�
dð1� z�dÞð10Þ
where rT is the arithmetic standard deviationcomputed in w-scale of the mixture passing overthe brinkpoint, i.e. r according to Eq. 3, SS* isequivalent in scope to Eq. 8 except for the inclu-sion of rT: the expression (8) linearly discretizesthe derivative in the right-hand side of Eq. 10.
© 2015 The Authors. Sedimentology © 2015 International Association of Sedimentologists, Sedimentology
16 C. Ferrer-Boix et al.

According to Kleinhans (2005) the celerity ofthe prograding delta is expressed in dimension-less form as:
C� ¼ CffiffiffiffiffiffiffiffiffiffiffiffiffiffiffiRgDg;T
p ð11Þ
in which Dg,T is the geometric mean diameter ofthe bedload going over the brinkpoint (topset–foreset break). There are some misprints inKleinhans (2005). Here corrected valuesobtained directly from the author are used. Theamended Kleinhans relation for SS* versus C*reads as follows:
SS� ¼ 0 � 64C��0�15 ð12Þ
Figure 15 plots the results of SS* versus C*for the Kleinhans tests, together with the valuescorresponding to the present experiment. Thedashed line represents Eq. 12. Fitting a curve tothe complete set of data (the data herein andthat of Kleinhans), only a slight variation in thecoefficient of Eq. 12 is obtained: the coefficient
0�64 is modified to 0�61. The minor differencesfound between the two curves means that theequation proposed by Kleinhans (2005) repre-sents a good approximation to obtain the sortingslope in Gilbert-type deltas that prograde at lowcelerities (such as those registered in the presentexperiment).Equation 12 allows the present authors to
obtain an expression for the vertical sorting ofthe geometric mean grain size (in the w-scale) asfollows:
w�gðz�Þ ¼ �rT ð1� z�Þ � ð1� z�0Þ
� �0 � 64C��0�15
ð13Þ
where z�0 is the dimensionless vertical height atwhich wg equals wg,f Implicit in Kleinhans(2005) is the assumption that z�0 should belocated at half the delta height. Equation 13 hasbeen obtained by substituting SS* from Eq. 12into Eq. 10 and by assuming a linear variation ofw�g along the dimensionless vertical coordinate
�zd – equal to 1�z�d , Eq. 7 – on the right-hand
10−4
10−3
10−2
10−1
0
0·5
1
1·5
2
2·5
N1
N1
N2N2
N3
N3
N4
N4
N5
N5
N6N6
N7
N7
N8N8
N9
N9
N10
N10
N11
N11
M1
U1S1
S2A
A1 C1
C2
t = 238 min
t = 359 min
t = 510 min
Dimensionless celerity C* (−)
Sort
ing
slop
e SS
* (−
)
Fig. 15. Relation between the dimensionless sorting slope SS* and dimensionless delta celerity progradation C*.Figure includes the present data at three different times (t = 238 min, 359 min and 510 min) and data fromKleinhans (2005) in circles and white squares. The data from Kleinhans has been amended to correct misprints,as communicated directly by M. G. Kleinhans.
© 2015 The Authors. Sedimentology © 2015 International Association of Sedimentologists, Sedimentology
Sorting in a Gilbert-type delta 17

side of Eq. 10. The negative sign in Eq. 13accounts for the downward coarsening of theforeset. As illustrated below, a lower value of z�0pertains to the present experiment.Figure 16 illustrates the comparison between
measured and computed values of w�g;z according
to Eq. 13. Each marker type in Fig. 16 plots theinterpolated sediment samples for the foresetprofiles at t = 238 min, 359 min and 510 min.Figure 16A shows the comparison between the
complete experimental set of data and the com-puted values using the new Eq. 13 (i.e. with theadjusted coefficient 0�61), but using the valuez�0 = 0�5 of Kleinhans (2005). All values arebounded by the range w�
g � 1, but some of themfall outside of the lines corresponding tow�g � 1/2 which bracket the line of perfect agree-
ment. This means that computed values are con-tained in the range [(1/2) Dg, 2Dg].Equation 13 is linearly dependent on the loca-
tion of z�0. Furthermore, as can be seen in Figs 8and 14, it seems that in the present experiment,the point in the vertical z�0 where wg = wg,f is sys-tematically located within the lower half of thedelta height. A position z�0 = 0�29 is obtainedwhen minimizing the root mean square deviationbetween observed and predicted values of w�
g;z.Figure 16B illustrates the improvement in thecalculated values of sorting with the newposition of z�0; now all of them are con-tained within the range w�
g � 1/2, i.e. betweenð1= ffiffiffi
2p ÞDg;
ffiffiffi2
pDg
� �. Despite the scatter, the predic-
tions by the empirical model presented byKleinhans (2005), as modified here, appear to bereasonable, taking into account that the delta cel-erities measured herein are between one and twoorders of magnitude slower than those of Kleinh-ans (2005) (Fig. 15), and that the sediment sam-ples used to test the model were not extractedfrom the delta foreset itself, but from verticallines located at different stations along the delta.Slower delta celerities are assumed to be
responsible for the drop in the point z�0 at whichwg equals wg,f. The slower the rate of delta pro-gradation, the fewer the number of grain-flowevents that occur along the foreset. Thus, anover-representation of the coarser particles inthe upper layer is expected. By mass conserva-tion, less coarse particles will be located in thelower layer, and thus a fall in z�0 should occur.Further, as noticed above, smaller delta celeri-ties lead to fewer grain-flow events. If the sedi-ment transport rate at the brinkpoint is constantas the delta progrades downstream (in agree-ment with the uniform flow developed on thetopset), an increasing volume of sediment ofgrain-flow events in the downstream directioncan occur. This would lessen the efficiency ofsorting processes on the topset (Kleinhans,2004). As mentioned before, the formation of amobile armour layer might have also contributedto the coarsening of the surface sample. Thedrop of z�0 merely illustrates the consequences ofthe aforementioned processes in the sorting pro-cesses along foresets in Gilbert-type deltas.
−1·0
−0·5
0·0
0·5
1·0Aψ
* g,z,
calc
(−
)
z*d = 0·50
−1·0 −0·5 0·0 0·5 1·0−1·0
−0·5
0·0
0·5
1·0
ψ* g,
z,ca
lc (
−)
ψ*g,z,exp
(−)
B
z*d = 0·29
t = 238 min
t = 359 min
t = 510 min
Fig. 16. Performance of the empirical model for leeface sorting proposed by Kleinhans (2005) as adjustedabove, i.e. Eq. 11. The plot shows measured values ofw�g at various levels z (w�
g;z;exp ) versus calculated val-ues (w�
g;z;calc). Comparison using original value z�0 = 0�5of Kleinhans is shown in (A), and comparison withthe amended value z�0 = 0�29 is shown in (B). Dashedlines above and below the main diagonal illustratethe errors in the range of w�
g � 1/2 with respect theperfect agreement, i.e. between ð1= ffiffiffi
2p ÞDg;
ffiffiffi2
pDg
� �.
© 2015 The Authors. Sedimentology © 2015 International Association of Sedimentologists, Sedimentology
18 C. Ferrer-Boix et al.

CONCLUSIONS
An experiment was performed on the prograda-tion of a Gilbert-type delta with a poorly sortedsandy gravel. Sediment transport along the top-set was only as bedload. The bed profile evolu-tion was measured, and the celerity of deltaprogradation was calculated. Water surface pro-files were calculated by means of a calibratedhydraulic model.The delta prograded towards the dam with lit-
tle topset aggradation during the first six hours ofthe run; this was caused by the water depthimposed to the brinkpoint, which was close tothe normal depth. The parts of the topset closestto the dam started to degrade afterwards, as aresult of the formation of a mobile armour and thewater configuration of the experiment, thatimposed a fixed water surface elevation at theoutlet. The material eroded from the topset anddragged down along the foreset to the base of thedelta has been found to have minor implicationsin the coarsening of the bottom layer of the delta.The stratigraphy of the delta was analysed by
extensive sampling, both in the vertical and inthe streamwise directions. It was found thatthere is a characteristic vertical sorting of thematerial that forms the delta: the grain-size dis-tribution towards the bottom of the deposit iscoarser than the sediment feed material. Thisbottom layer coarsening is accompanied by avertical fining in the central part of the body ofthe delta compared to the feed grain-size distri-bution: large particles do not stay in this zone.Rather they are dragged to the bottom as theyfall over the delta foreset. Furthermore, the toplayer of the deposit was observed to be coarserthan the material in the central part of thedeposit (but finer than the feed); this may berelated to the slow delta progradation celerity ofthe present experiment, and due to the forma-tion of a mobile armour layer and the degrada-tion of the part of the topset closest to the dam.It was found that coarsening of the bottom layeris related to delta height: the higher the delta,the coarser the mean grain size at the base ofthe foreset, and thus the base of the deposit,which means that when bedload dominates,the closer the proximity to the dam, the coarserthe bottom layer, at least for the experimentreported here. This coarsening process is relatedto the increasing probability for a coarse parti-cle to fall to the base of the foreset as the heightof the delta increases. Finally, a tendency fordownstream fining within the top layer of the
deposit was observed, with coarser particlesdepositing at locations close to the point of sed-iment feed. However, the magnitude of down-stream fining in the top layer is much weakerthan the magnitude of vertical sorting.Bed material sorting patterns were described
well by the empirical model presented byKleinhans (2005). The modest variations of theseparameters were back-calculated from the mea-sured grain-size distribution. This good agree-ment was obtained despite the fact that the datawere collected in very different ways. That is, thedata of Kleinhans (2005) were obtained by gath-ering appropriate measurements from the foresetitself, whereas the present experiment sampledthe entire deltaic deposit. Nonetheless, the factthat the deltaic deposit of this experiment can beconsidered as formed by sediment emplacementin the foreset (insofar as no significant topsetaggradation occurred) aids comparison with theKleinhans experiments. Interpolation was usedto cast the present data into a form directly com-parable with those of Kleinhans. The experimen-tal results for both delta progradation andsediment sorting provide useful data for testingmorphodynamic models of delta progradationassociated with a sediment supply that consistsof a poorly sorted mixture of sand and gravel(e.g. Viparelli et al., 2010a,b, 2011, 2014).
ACKNOWLEDGEMENTS
This research was funded in part by theNational Center for Earth-surface Dynamics, aScience and Technology Center and by the USNational Science Foundation, under agreementEAR-0120914. The readers can freely access thedata from this paper by contacting the firstauthor. Thanks to M. G. Kleinhans for providingall data and specific details of his experiments.Comments from the two reviewers Astrid Blomand Brandon McElroy and the Associate EditorDavid Mohrig helped us improved the paper.
REFERENCES
Allen, J. (1965) Sedimentation to the lee of small underwater
sand waves: an experimental study. J. Geol., 73, 95–116.Allen, J. (1970) The avalanching of granular solids on dune
and similar slopes. J. Geol., 78, 326–351.Bagnold, R.A. (1954) Experiments on a gravity-free
dispersion of large solid spheres in a Newtonian fluid
under shear. Proc. Roy. Soc. London. A Math. Phys. Sci.225, 49–63.
© 2015 The Authors. Sedimentology © 2015 International Association of Sedimentologists, Sedimentology
Sorting in a Gilbert-type delta 19
Blom, A. and Kleinhans, M.G. (2006) Modelling sorting over
the lee face of individual bed forms. In: River Flow 2006
(Eds A. Dittrich, K. Koll, J. Aberle and P. Geisenhainer),
pp. 807–816. Taylor & Francis, London.
Blom, A. and Parker, G. (2004) Vertical sorting and the
morphodynamics of bed form–dominated rivers: a
modeling framework. J. Geophys. Res. Earth., 109, F02007.Blom, A., Ribberink, J.S. and de Vriend, H.J. (2003) Vertical
sorting in bed forms: flume experiments with a natural and
trimodal sediment mixture. Water Resour. Res., 39, 1025.Blom, A., Parker, G., Ribberink, J.S. and de Vriend, H.J.
(2006) Vertical sorting and the morphodynamics of bed-
form-dominated rivers: an equilibrium sorting model.
J. Geophys. Res. Earth., 111, F01006.Bornhold, B. and Prior, D.B. (1990) Morphology and
sedimentary processes on the subaqueous Noeick River
Delta, British Columbia, Canada. In: Coarse-Grained Deltas
(Eds A. Colella and D.B. Prior), pp. 169–181. Blackwell
Publishing Ltd., Oxford, UK.
Cantelli, A., Paola, C. and Parker, G. (2004) Experiments on
upstream-migrating erosional narrowing and widening of
an incisional channel caused by dam removal. Water
Resour. Res., 40, W03304.
Carling, P.A. and Glaister, M. (1987) Rapid deposition of sand
and gravel mixtures downstream of a negative step: the role
of matrix infilling and particle overpassing in the process of
bar front accretion. J. Geol. Soc. London, 144, 543–551.Evans, J., Mackey, S., Gottgens, J. and Gill, W. (2000)
Lessons from a dam failure. Ohio J. Sci., 100, 121–131.Ferrer-Boix, C. (2011) River incision due to gravel mining
and dam removal. Mathematical and experimental study,
PhD thesis, Technical University of Catalunya, Barcelona.
Ferrer-Boix, C. and Hassan, M.A. (2014) Influence of the
sediment supply texture on morphological adjustments in
gravel-bed rivers. Water Resour. Res., 50, 1–23. doi:
10.1002/2013WR015117.
Ferrer-Boix, C., Mart�ın-Vide, J.P. and Parker, G. (2014)
Channel evolution after dam removal in a poorly sorted
mixture. Experiments and numerical model. Water Resour.
Res., 50, 1–23. doi: 10.1002/2014WR015550.
Gilbert, G.K. (1890) Lake Boneville, Technical report. United
States Geological Survey, Washington, 438 pp.
Hotchkiss, R.H. (1989) Reservoir sedimentation and
sediment sluicing: experimental and numerical analysis,
PhD thesis. University of Minneapolis.
Hotchkiss, R.H. and Parker, G. (1991) Shock fitting of
aggradational profiles due to backwater. J. Hydraul. Eng.,117, 1129–1144.
Hunter, R. (1985a) Subaqueous sand-flow cross strata. J. Sed.
Petrol., 55, 886–894.Hunter, R. (1985b) A kinematic model for the structure of
lee-side deposits. Sedimentology, 32, 409–422.Hunter, R. and Kocurek, G. (1986) An experimental study
of subaqueous slipface deposition. J. Sed. Petrol., 56,387–394.
Jopling, A.V. (1965) Laboratory study of the distribution of
grain sizes in cross-bedded deposits. In: Primary Sedimentary
Structures and Their Hydrodynamic Interpretation (Ed.
G.V. Middleton), SEPM Spec. Publ., 12, 53–65.Kleinhans, M.G. (2002) Sorting out sand and gravel:
sediment transport and deposition in sand-gravel bed
rivers, PhD thesis. Faculty of Geographical Sciences,
Utrecht University.
Kleinhans, M.G. (2004) Sorting in grain flows at the lee side
of dunes. Earth Sci. Rev., 65, 75–102.
Kleinhans, M.G. (2005) Grain-size sorting in grainflows at
the lee side of deltas. Sedimentology, 52, 291–311.Lorenzo-Trueba, J. and Voller, V. (2010) Analytical and
numerical solution of a generalized Stefan problem
exhibiting two moving boundaries with application to
ocean delta formation. J. Math. Anal. Appl., 366, 538–549.Muto, T., Yamagishi, C., Sekiguchi, T., Yokokawa, M. and
Parker, G. (2012) The hydraulic autogenesis of distinct
cyclicity in delta foreset bedding: flume experiments.
J. Sed. Res., 82, 545–558.Nemec, W. (1990) Aspects of sediment movement on steep
delta slopes. In: Coarse-Grained Deltas (Eds A. Colella and
D.B. Prior), pp. 29–73. Blackwell Publishing Ltd., Oxford, UK.
Parker, G. and Klingeman, P. (1982) On why gravel bed
streams are paved. Water Resour. Res., 18, 1409–1423.Saito, Y. (2011) Delta-front morphodynamics of the Kurore
River fan delta, central Japan. In: RCEM 2011. River,
Coastal and Estuarine Morphodynamics (Eds X. Shao, Z.
Wang and G. Wang), pp. 969–976. Tsinghua University
Press, Beijing.
Seal, R., Paola, C., Parker, G., Southard, J.B. and Wilcock,P.R. (1997) Experiments on downstream fining of gravel: I.
Narrow channel runs. J. Hydraul. Eng., 123, 874–884.Sohn, Y., Kim, S., Hwang, I., Bahk, J., Choe, M. and
Chough, S. (1997) Characteristics and depositional pro-
cesses of large-scale gravelly Gilbert-type foresets in the
Miocene Doumsan fan delta, Pohang Basin, SE Korea.
J. Sed. Res., 67, 130–141.Vanoni, V.A. (ed.) (1975) Sedimentation Engineering.
American Society of Civil Engineers, New York, NY.
Viparelli, E., Haydel, R., Salvaro, M., Wilcock, P.R. and
Parker, G. (2010a) River morphodynamics with creation/
consumption of grain size stratigraphy 1: laboratory
experiments. J. Hydraul. Res., 48, 715–726.Viparelli, E., Sequeiros, O.E., Cantelli, A., Wilcock, P.R. and
Parker, G. (2010b) River morphodynamics with creation/
consumption of grain size stratigraphy 2: numerical
model. J. Hydraul. Res., 48, 727–741.Viparelli, E., Blom, A. and Parker, G. (2011) Numerical
prediction of the stratigraphy of bedload-dominated deltas:
preliminary results. In: RCEM 2011. River, Coastal and
Estuarine Morphodynamics (Eds X. Shao, Z. Wang and G.
Wang), pp. 552–562. Tsinghua University Press, Beijing, China.
Viparelli, E., Blom, A., Ferrer-Boix, C. and Kuprenas, R.(2014) Comparison between experimental and numerical
stratigraphy emplaced by a prograding delta. Earth Surf.
Dyn., 2, 323–338.Wong, M., Parker, G., DeVries, P., Brown, T. and Burges, S.
(2007) Experiments on dispersion of tracer stones under
lower-regime plane-bed equilibrium bed load transport.
Water Resour. Res., 43, W03440.
Manuscript received 10 November 2013; revisionaccepted 16 January 2015
Supporting Information
Additional Supporting Information may be found inthe online version of this article:
Data S1. Hydraulics of the experiment.
© 2015 The Authors. Sedimentology © 2015 International Association of Sedimentologists, Sedimentology
20 C. Ferrer-Boix et al.