Embed Size (px)
Citation preview
SDMS DocID 567848
SOURCE CONTROL SAMPLING AND ANALYSIS PLAN
VOLUME n
Field Sampling Plan OConnor Site Augusta Maine
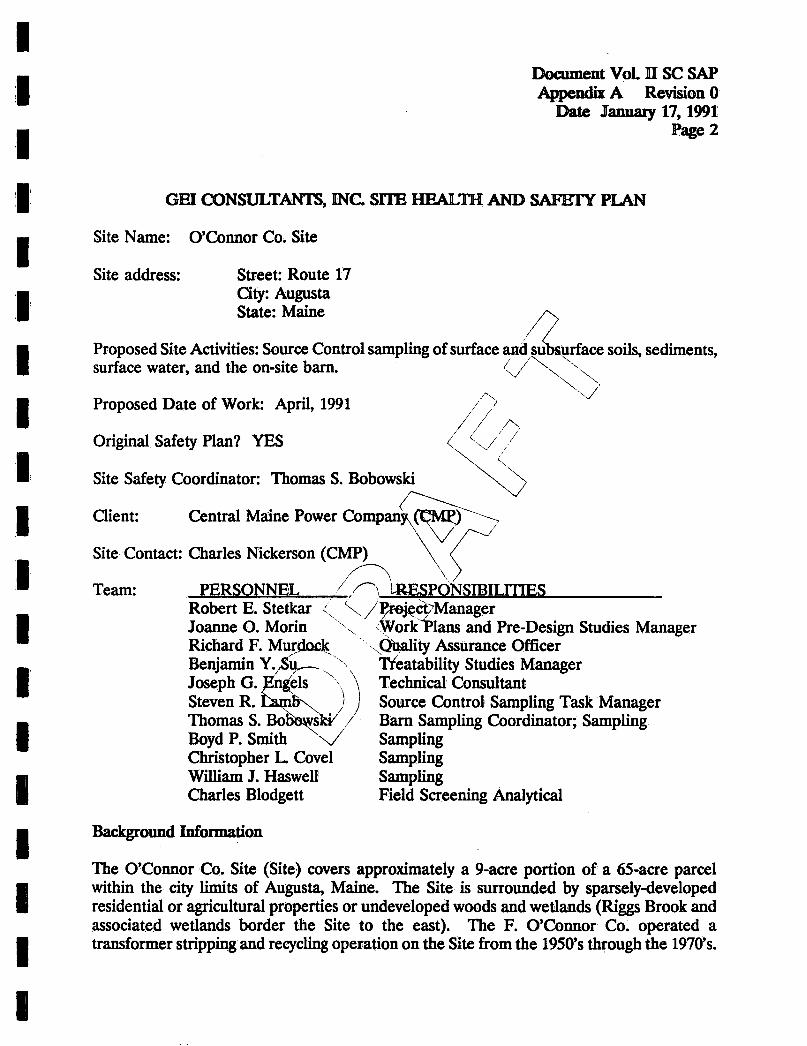
Submitted by GEI Consultants Inc
Work Plan and Pre-Design Studies Manager
Robert E Stetkar PE Project Manager
53 Regional Drive Concord New Hampshire March 28 1991 (603) 224-7979 Revision 1
Document Vol II SC SAP Revision 1
Date March 28 1991
TABLE OF CONTENTS
TABLE OF CONTENTS LIST OF TABLES LIST OF FIGURES LIST OF APPENDICES
Page No
1 INTRODUCTION 1 11 Purpose 1 12 Site Location and Description 1 13 Site History 2 14 Soil Surface Water Sediment and On-Site Barn Contamination 3
141 Soil 3 142 Surface Water 4 143 Sediment 6 144 On-Site Barn Characteristics 6
2 SAMPLING AND DATA QUALITY OBJECTIVES 8 21 General 8 22 Soils 9 23 Sediments 10 24 Surface Water 12 25 Barn 12
3 HEALTH AND SAFETY 14
4 SAMPLING LOCATION AND FREQUENCY 15 41 Soils 15
411 General 15 412 Soil Analysis Program 17 413 Soil Sample Designation 17
42 Sediment 18 421 General 18 422 Sediment Analysis Program 19 423 Sediment Sample Designation 20
43 Surface Water 20 431 General 20 432 Surface Water Analysis Program 21 433 Surface Water Sample Designation 22
Document Vol II SC SAP Revision 1
Date March 28 1991
44 Barn 22 441 General 22 442 Barn Analysis Program 23
443 Barn Sample Designation 241
5 SAMPLING EQUIPMENT AND PROCEDURES 25 51 Air Monitoring 25
52 Soil Sampling 25 521 General 25 522 Soil Sampling Methods for Test Pits 26 523 Soil Sampling Methods for Borings 28
53 Surface Water 30 531 General 30 532 Surface Water Sampling Methods 31
54 Sediment 32 541 General 32 542 Sediment Sampling Methods 32
55 Barn 34 551 General 34 552 Barn Sampling Methods 34
6 SAMPLE HANDLING AND ANALYSIS 38 61 General 38 62 Sample Labeling and Documentation 38 63 Chain-of-CustodySample Assignment 38 64 Sample Shipments 39
TABLES FIGURES APPENDICES
Revision 1 includes additional Page 24a as an expansion to Section 4
LIST OF TABLES
TABLE 1 - Soil Sampling Schedule TABLE 2 - Soil Analysis Program TABLE 3 - Sediment Analysis Program TABLE 4 - Surface Water Analysis Program TABLE 5 - Barn Sampling Analysis Program TABLE 6 - Soil Sampling Equipment TABLE 7 - Sediment Sampling Equipment Requirements TABLE 8 - Surface Water Sampling Equipment Requirements TABLE 9 - Barn Sampling Equipment Requirements TABLE 10 - Sample Containers and Preservation Requirements
bullv LIST OF FIGURES
gtFIGURE 1 - Site Location Map lt FIGURE 2 - Location of Transformer Work Areas and Swales FIGURE 3 - Soil Sampling Locations FIGURE 4 - Surface Water and Sediment-Sampling Locations FIGURE 5 - Example Barn Sampling Locations
lt
LIST OF APPENDICES
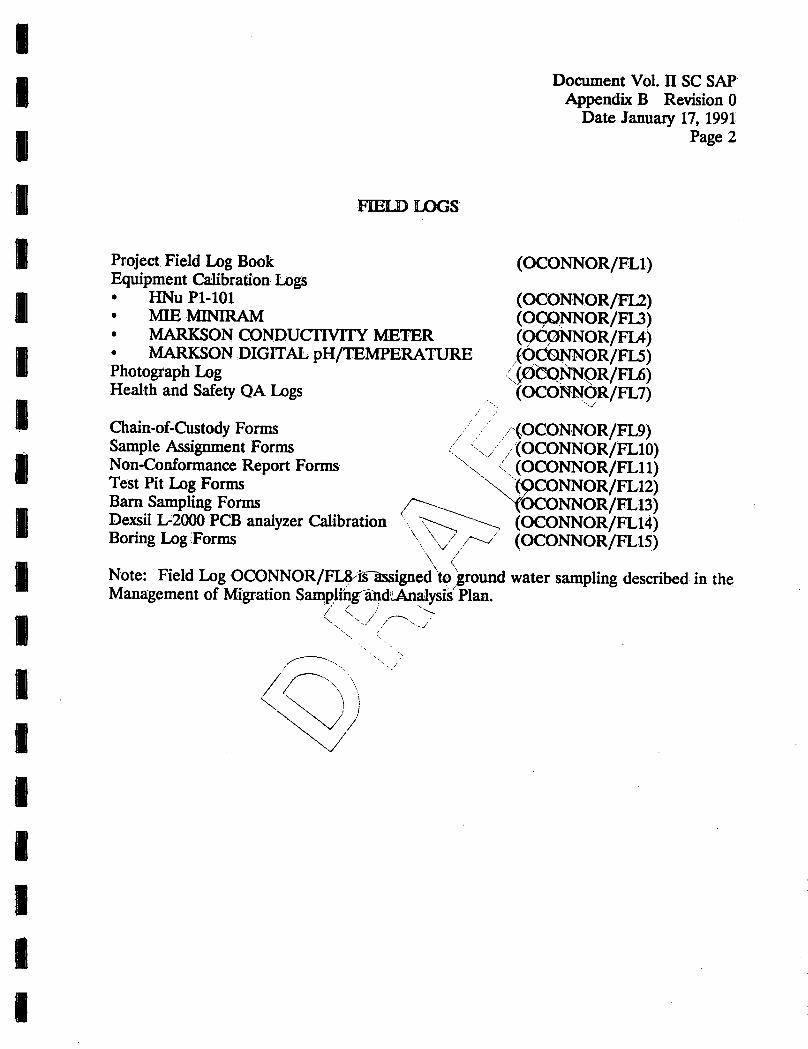
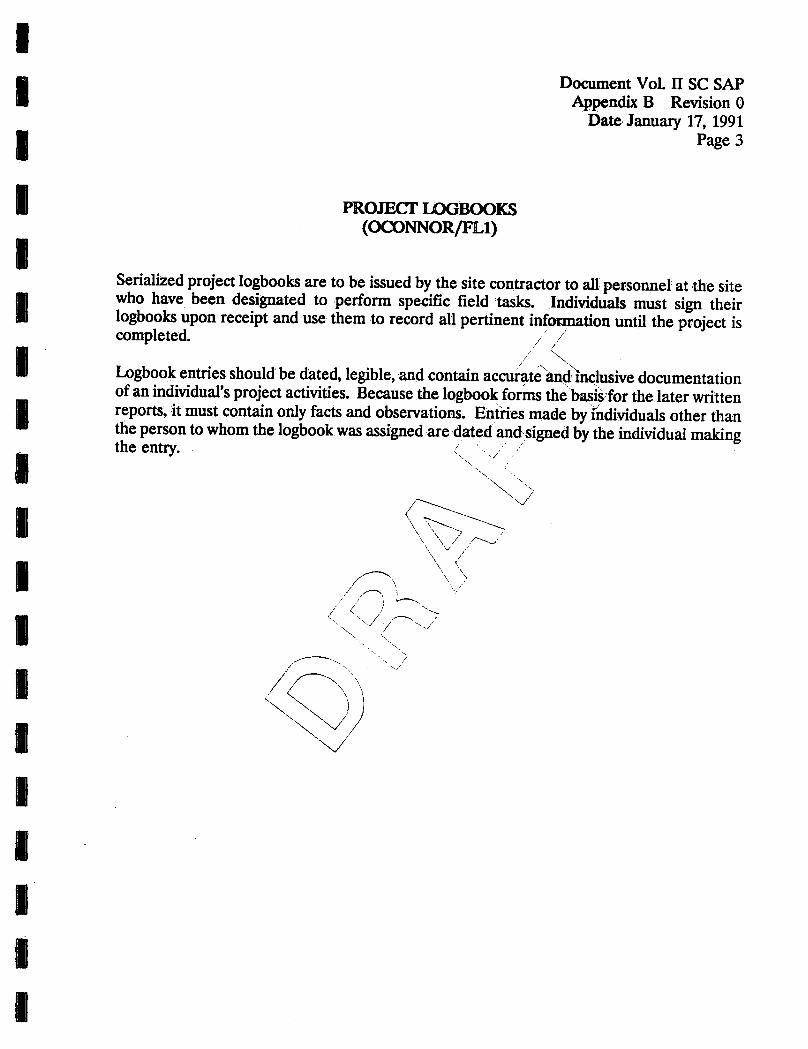
APPENDIX A - and Safety Plan APPENDIX B - field Logs APPENDIX C - iquipmentiCalibration APPENDIX D - ^ofAc^onyms
Document Vol II SC SAP Revision 0
Date January 17 1991 Page 1
1 INTRODUCTION
11 Purpose
This document is the Field Sampling Plan (FSP) portion of the Sampling and Analysis Plan for Source Control components of Pre-Design Studies for Remedial DesignRemedial Action at the OConnor Co Superfund Site in Augusta Maine The overall objectives of the Source Control Sampling and Analysis Plan (SC SAP)are to document objectives procedures and rationales for sampling and analytical workprovide rationale for sampling and analytical protocols and provide a mechanism for planning anchapproving Pre-design Source Control field sampling and laboratory activities
gtThe Field Sampling Plan (FSP) defines the samplinganddata-gathering methods to be used during the Source Control component of the Pre-Desigp phase This FSP has been developed in accordance with the requirements of Part Bin Attachment A to the Statement of Work for Remedial DesignRemedial ActftmTbr the OConnor Superfund Site dated July 30 1990
The Quality Assurance Project Plan (QAPP) is provided as Volume I of the Source Control Sampling and Analysis Plan ^~N ygt
)
12 Site Location and Description J N ^
The OConnor Site (Site) is located along QS Route 17 near the eastern boundary of the city limits of Augusta Maine^Eigure 1) The Site covers approximately nine acres within a larger 65-acre parcelThe SiteXis currently surrounded by a chain link fence and is abutted by woodlands toHh^north) and west US Route 17 to the south and the west branch of Riggs Brook and itassociated wetlands to the east
The Site is situated on the crest of a low ridge which is aligned parallel to Riggs Brook Principal features on the property include a large barn that formerly housed scrap operations an Upland Marsh an adjacent low area of fill two surface water impoundments (lagoons) three former outdoor transformer work areas (TWAs) and a former scrap area (Figure 2) Site drainage is principally controlled by the slope extending downward toward Riggs Brook and man-made drainage features connecting the Upland Marsh on the top of the ridge to Riggs Brook
Access into the Site is via an unimproved gravel road from US Route 17 that passes through a wooden fence near the on-site barn and follows the ridge line of the property to die northeast for approximately one-quarter mile to the wooded area of the Site Three
Document Vol II SC SAP Revision 0
Date January 17 1991 Page 2
separate and distinct transformer disassembly areas are situated along the access road and are identified by oil-stained soils metal wire and porcelain fragments The three areas are identified as transformer work areas (TWAs) I n and HI A former scrap-yard (Scrap Area on Figure 2) is located within the wooded area beyond TWA in Empty tanks white goods automobile bodies tires sheet metal and other items were stored or discarded in this Scrap Area
gtThe barn consists of a three-story wooden structure with a plan area of approximately 3100
square feet The barn has a concrete floor slab and contains ^large-variety of items These
items consist chiefly of the following furniture metal racksand doors lumber electric
meters automobile parts a wood stove heating registers an antiqueautomobile a boat
and a large amount of miscellaneous metal scrap debris gt v
13 Site History lt ltvy
lt
The Site was primarily used as grazing land until the l950sgtrhen the F OConnor Co started a salvage and transformer recyclingbusiness ThV salvage processes included stripping and recycling transformers that contaibedpblyehlorinated biphenyl (PCB)-laden oils As a result Of the uncontrolled releases ofPCB afthe Site the Site was placed on the National Priorities List (NPL) On March 231985 United States Environmental Protection Agency (EPA) and Maine DepartmenTof Environmental Protection (DEP) issued an Administrative Order to the OCohndPs and Central Maine Power Company (CMP) (Docket No 1-86-1031) identifying eachas-aPotentially Responsible Party (PRP) to (1) remove known threats to the public health or welfare which exist on-site (tanks of oil) (2) secure the areas of the Site thaLhave known contaminated soils (3) conduct a Remedial Investigation (RI) and (4jyjrepare a Feasibility Study (FS) In response to the Administrative Order CMPberformed the following interim remedial actions
bull Construction of a chai compassing TWA I and TWA II (approximately 75 acres) and the majority of the^sit^-related chemicals (1985)
bull Sampling cleaning and removal of 20 on-site storage tanks (1986)
bull Removal of over 500 tons of material from the scrap area and sampling of soils beneath the scrap (1987)
bull Extension of the chain link fence to secure TWA HI and part of the TWA II drainage swale
Currently two lagoons located on the slope leading down to Riggs Brook serve as detention basins for surface water flow from the Upland Marsh The portion of the Site currently
Document Vol II SC SAP Revision 0
Date January 17 1991 Page 3
fenced includes TWA I n and III part of the scrap area and all areas in which residual PCBs are present in soils The RI and FS were conducted by CMP and their consultant EC Jordan Co The objectives of the RIFS were to provide the necessary information to 1) identify and assess the existing and potential public health andor environmental risks which may be caused by the release or threatened release of hazardous substances pollutants or contaminants and (2) formulate and evaluate alternative recommendations for the remedial actions needed if any to prevent or mitigate the migration release or threatened release of hazardous substances
14 Soil Surface Water Sediment and On-Site Barnc Contamination and Remedy Description )
141 Soil s lt w
During the RI approximately 500 surface and Subsurface soil samples were collected by grab sampling shallow borings or test pits PCBs and lead were the principal contaminants found in the surface pTno^05-feet deep) soils and PCBs and carcinogenic polycyclic aromatic hydrocarbons-^(cPAHs) were the principal contaminants detected in the subsurface (05lO12-feet deep) soils
The highest concentrations of PpB^contaminated soils were found primarily within the former transformer work areas (TWAS)r-and the drainage areas associated with these TWAs (Figure 2) Contaminatedsoikinthe TWAs were found to contain up to 200000 parts per million (ppm^PCBs However the most contaminated soils (greater than 500 ppm) constitutelless than 125 of the total estimated volume of soil contamination (23500-trubic yards) and most of the contaminated soil contains PCBs at concentrations le^sthan 50 ^pm Lead was detected above background (ie approximately 70 ppm^average) principally in the surface soils within TWAs I and II with the maximum leachc^neentfation occurring at 4100 ppm within TWA II
Subsurface soil samples taken from TWAs I and II and the low area hear the Upland Marsh contained cPAHs The low area is an area where sediment dredged from the Upper Lagoon in 1977 was deposited adjacent to the area currently containing the Upland Marsh Disposal of this sediment resulted in blockage of natural drainage and formation of the Upland Marsh The depth of vertical migration of the cPAHs appeared to be limited to the upper 6-feet within TWA I and the low area while a small pocket of cPAHs was found to exceed 8 feet within TWA II The maximum cPAH concentration of 30 ppm was found within the low area Depth of PCB contamination in the subsurface soils outside of the TWAs was typically limited to less than 2 feet while PCBs were detected within TWAs I and II at depths of up to 12 feet
Document Vol II SC SAP Revision 0
Date January 17 1991 Page 4
Cleanup standards for soil were determined based on a public Health Environmental Risk Assessment performed by the EPA Cleanup standards are summarized below compared to maximum concentrations of chemicals encountered at the site
Maximum Concentration Soil Cleanup Chemicals Detected Standards
(ppm) (ppm)
Lead 4100 248 x
cPAHs 30 dX X PCBs 200000 1 gt bull
bullX
The RODspecifies that approximately23500 cubicyardsjof contaminated soils contain PCBs cPAHs and lead above the established Cleanup standards are to be treated on site using a solvent extraction technology This technology principally involves the use of a solvent to extract the PCBs and cPAHs from the contaminated soils The contaminated liquids containing the extracted PCBs and cPAHs will be destroyed at a licensed off-site TSCA incinerator AddkionaHyr-soil treatment residues resulting from the solvent extraction process that haveJlacNevels above the 248 ppm cleanup standard will undergo further treatment using n solidificationstabilization treatment technology Those solid treatmentNresidues jesulting from the solvent extraction process that do not achieve the cleahup-standards and that have undergone additional treatment through solidificationstabilization will be transported off-site to a licensed landfill It is currently estimated by the EPA that 5000 cubic yards of the total 23500 cubic yards of contaminated soils undergoing solvent extraction will require off-site disposal
142 Surface Wateiv
The on-site surface waterNirainage features include an Upland Marsh an Upper Lagoon and a Lower Lagoon (see Figure 2) The Upland Marsh drains to the Upper Lagoon via a subsurface drainage pipe The Upper Lagoon drains to the Lower Lagoon via a drainage swale The water that flows out of the Lower Lagoon follows a drainage swale to Riggs Brook
In 1976 under the advice of Maine DEP the two lagoons were constructed in an attempt to control oil migration The Upper Lagoon was constructed with a concrete retaining wall and an inverted siphon to prevent migration of oils floating on the lagoon surface Floating oils were collected and contained in six large on-site storage tanks The lower lagoon was excavated at the base of the slope and constructed with an earthen berm and a horizontal pipe discharge
Document Vol n SC SAP Revision 0
Date January 17 1991 Page 5
In 1977 under the direction of the Maine DEP the use of the lagoons was discontinued The water from the Upper Lagoon was placed in storage tanks and the sediments were excavated and placed in the low area shown on Figure 2 The sediments placed in the low1- area were underlain by a 1-foot-thick layer of marine clay and then covered with a clayey soil less than 6 inches thick The filling of the low area created a barrier to the previous natural surface water drainage and resulted in the formation of the Upland Marsh In an attemptto drain the marsh the subsurface drainage pipe was installed between the marsh and the Upper Lagoon in September 1978 The saturated area of the Upland Marsh presently still exists
On-site surface water quality was measured at five sampling locations These include one surface water sample from each of the lagoons and one from the Upland Marsh The surface water quality data in the RI indicated that PCBs (from unfiltered samples) were detectable in the Upper and Lower Lagponsyand in drainage from the Lower Lagoon but were not detected in surfacewater samples taken from Riggs Brook PCB concentrations in the on-site surface waters for the EowersLagoon the Upper Lagoon and Upland Marsh were 055 ppb 16 ppb^jand non-detected respectively Other contaminants of concern in the on-site urfkceTwaters were the inorganic chemicals lead and aluminum Lead was found at concentrations ranging from 36 to 13 ppb in all the on-site surface waters Additionally aluminum was detected in the on-site surface waters at concentrationsrangfog from 236 to 3740 ppb
O V Cleanup standards for surface water were determined based upon a Public Health
Environmental Risk Assessment performed by the EPA Cleanup standards are
summarized below compared to themaximum concentration of chemicals encountered
at the site N v
Surface Water Maximum Concentration Cleanup
Chemicals xD6tected Standards (PPb) (ppb)
Lead 13 194 Aluminum 3740 87
PCBs 16 0065
The selected remedy for surface water remediation at the site is pumping of surface water from the Upper and Lower Lagoons and Upland Marsh and disposal off-site unless otherwise approved by EPA The ROD indicates that the approximately 150000 to 195000 gallons of surface water are contained in the Upland Marsh and Upper and Lower Lagoons
Document Vol II SC SAP Revision 0
Date January 17 1991 Page 6
143 Sediment
The sediment sampling program conducted during the RI consisted of a total of 23 sediment samples from 19 locations both at on-site and off-site locations A total of six sediment samples were collected from the Upland Marsh Upper Lagoon and Lower Lagoon consisting of two samples from each of these surface water bodies Other samples were collected from Riggs Brook and drainage swales between the lagoons and Riggs Brook
xPCBs were detected in the sediment samples obtained from thexdge of the Upland Marsh both on-site lagoons and the Lower Lagoon drainage area leading into Riggs Brook PCB concentrations were highest in the Upper Lagoon (up to 1100 ppm) but decreased significantly downstream in the Lower iiigoon PCB concentrations were lowest in the drainage swale downstream fronii dieLower Lagoon (approximately 4 ppm) Cleanup standards for the sedimentswere~detennined based on a Public Health Environmental Risk Assessment performed by the ERA Cleanup standards are summarized below compared to maximiimgtCQncentrations of chemicals encountered in sediment samples from the Upland MSrsh Upper Lagoon and Lower Lagoon
Vmdash ( Sediment
MaximumConcentration gt Cleanup Chemicals Detected-^ v Standards
( (PPF1) -mdash (PPm)
Lead 28 248 cPAHs y 1 PCBs 1100 1
The ROD indicates that the cm-site sediments will be dredged and the sediment containing chemicals above^tbe established cleanup standards will be treated using the solvent extraction technology as described in Section 141
144 On-Site Barn Characteristics
The barn has been reported to formerly house scrap operations A surficial soil sample taken from within the barn (JSS1) during the RI was collected and analyzed for the presence of PCBs and lead The exact nature or matrix of the surficial soil (eg dust concrete wood) collected from within the barn could not be ascertained from the available documents The results of the PCB screening indicated a concentration of 96 ppm PCBs Lead was detected at a concentration of 1610 ppm No analysis for cPAHs was performed on the sample from the barn
Document Vol II SC SAP Revision 0
Date January 17 1991 Page 7
In the ROD EPA set soil cleanup standards for the site of 1ppm PCBs 1ppm cPAHs and 248 ppm lead The cleanup standards for barn materials were not specified in the ROD by EPA However the ROD specified that the barn would undergo decontamination procedure if contamination was present above cleanup standards (to be determined) through collection of soil dust and other loose material and these materials would be combined with the other contaminated soils and sediments for on-site solvent extraction treatment Large scrap items in the barn would then be removed for disposal off-site and the barn structure would be sampled for detection of the presence of contamination Following sampling and analysis of the barn structure the barn would be demolished and transported to an off-site facility for appropriate disposal ^gt
N
Document Vol II SC SAP Revision 0
Date January 17 1991 Page 8
2 SAMPLING AND DATA QUALITY OBJECTIVES
21 General
Sampling of soils surface water sediments and the on-site barn and its contents will be performed during the Source Control (SC) component of the Pre-Design Study Pre-Design SC sampling results will be used in the design of the SourceControl component of the remedy and development of the treatability testing program for soil and sediment
Pre-Design SC sampling will include N
Collection of surface water samples from the Upland Marsh and Upper and Lower Lagoons in April 1991 V
x
Collection of sediment samples from the Upland Marslkahd Upper and Lower Lagoons in April 1991 ^
Collection of soil samples from test pits and^Orihgsrin April 1991
bull Collection of samples of soil woodimckconcrete from the on-site barn floor and Walls and wipe samples from debris andlquipment located within the barn in May 1991
V-X7EPAs guidance document Data Quality Objectives for Remedial Response Activities (OSWER Directive 93550-78Jdarch 1987) identifies four analytical levels
Level I - field screeningoranalysis using portable instruments Results are often not compound specific and o^ qualitative in nature
Level II - field analyses using mbresophisticated portable analytical instruments Results are more reliable in terms of compound identification and may be semi-quantitative
Level El - laboratory analyses by established referenced methods Results are quantitative and compound specific
Level TV - EPA Contract Laboratory Program (CLP) services utilizing rigorous QAQC protocols and documentation
Level V - Laboratory analyses by non-standard methods Identified in the CLP asspecial analytical services
Document Vol II SC SAP Revision 1
Date March 28 1991 Page 9
A combination of Level I Level in and Level IV analytical protocols will be specified during Pre-Design SC sampling EPA Contract Laboratory Program (CLP) protocols prescribed in the 1988 Organic and Inorganic Statement of Works will be utilized for laboratory analysis of target compounds (PCBs cPAHs lead and aluminum) in surface water sediment soil and barn samples The analytical protocols that will be utilized for Pre-Design SC sampling are detailed in the SC Quality Assurance Project Plan (QAPP) included as Volume I of the SC SAP
22 Soils
Soil samples will be collected and analyzed to provide additional data for comparison with cleanup standards for design of the Source Control program at the OConnor Site Data will be used to refine the previously estimated volume of soils contaminated at various concentrations above the cleanup standards and to provide additional information at areas with apparent data gaps on the lateral and vertical extent of soil with PCB concentrations greater than 1 ppm Soil also will be collected at specified locations to provide samples for solvent extraction treatability bench-scale testing Samples selected for treatability testing will contain PCBs at concentrations previously not examined during limited bench-scale testing performed during the Feasibility Study (FS) The effectiveness of solvent extraction on removal of lead cPAH and PCB contamination will be examined during the bench-scale treatability studies performed during Pre-Design
The soil sampling program performed during the RI was designed to estimate the horizontal and vertical distribution of soils contaminated with PCBs lead and cPAHs above the cleanup standards The distribution of PCBs lead and cPAHs are summarized in the RI on Figures 4-8 4-10 and 1-10 respectively GEI identified several inconsistencies in the distribution of contaminated soils within the summary figures For instance the distributions of PCB contamination shown on Figures 1-6 and 4-8 in the RI in the northern portion of the site near TWA III do not agree Also previous soil sampling did not consistently confirm the horizontal and vertical limits of PCB contamination The vertical limits of the PCB contaminationwere not adequately identified for remedial design purposes near transformer work areas and along drainage pathways where PCB migration has occurred
The effectiveness of solvent extraction as the selected remedy for treating the on-site soils was not fully demonstrated during the FS The bench-scale testing that was performed during the FS did not investigate the full range of contamination levels and recovery efficiencies from different soil types that exist on the site
There are three primary objectives for collection of soil quality data during the Pre-Design studies
Document Vol II SG SAP Revision 1
Date March 28 1991 Page 10
1 Collect additional data with close control of analytical precision to evaluate datagaps and inconsistencies reported during the RI The collection of these data will primarily be performed near TWAs and drainage pathways
2 Refine the previously estimated volume of soils contaminated at various concentrations above the cleanup standards
3 Evaluate theselected remedy of solvent extraction through bench-scale testingof soils with specific ranges of PCB concentrations
All soil samples collected for treatability bench-scale testing will also have an aliquot collected for PCB analyses by Ceimic Corporation of Narragansett Rhode Island This will provide added confidence that designated samples are within the specified ranges of PCB concentrations for solvent extraction bench-scale testing
In order to facilitate comparison of Pre-Design Study soil quality with RI study soil quality rigorous QAQC protocols and documentation will be needed All sampleswill be analyzed by Ceimic Corporation using 1988 CLP protocols Analytical Level IV (CLP QAQC and documentation) will be utilized on 20 percent of the soil samples collected The remaining 80 percent will be analyzed according to 1988 CLP protocols utilizing Analytical Level III (CLP QAQC butwithout CLPdocumentation) These serviceswill provide detection limits at or below the ROD Cleanup Standards
During Pre-Design sampling equipment blanks will be collected and analyzed after decontamination of sampling equipment to identify artifact contamination that could result from incomplete decontamination of equipment Trip blanks will also be included during sample shipment to identify cross-contamination during transportation to Ceimic Corporation The laboratory and field QAQC procedures described above will enable the precision required to satisfy the objectives of the soil sampling component of this study
23 Sediments
Sediment samples will be collected and analyzed to provide additional data for comparison with the cleanup standards for design of the Source Control program at the OConnor site Data will be used to supplement the sediment quality data previously collected in the RI for a refined estimate of the levels of lead cPAH and PCB contamination in the sediments of the Upland Marsh Upper Lagoon and Lower Lagoon In addition a composite sediment sample from the Upper Lagoon and a composite sediment sample from the Lower Lagoon will be collected for solvent extraction treatability bench-scale testing Treatability testing on contaminated sediments was not performed during the FS The effectiveness of solvent extraction on removal of lead cPAHs and PCBs from sediments will be examined during the bench-scale treatability studies performed during Pre-Design
Document Vol II SC SAP Revision 1
Date March 28 1991 Page 11
The sediment quality data collected during the RI was limited Only two sediment samples were collected from the Upland Marsh Upper Lagoon and Lower Lagoon In addition limited data have been previously collected regarding the volume of contaminated sediment on-site
There are three primary objectives for sediment quality data to be collected during Pre-Design studies
1 Collect additional data with close control of analytical precision to examine levels of contamination in sediment at locations previously not investigated This will include two additional samples from the Upper Lagoon two additional samples from the Lower Lagoon and six additionalsamples from the Upland Marsh The investigation in the Upland Marsh will be directed towards delineating the extent of contamination in the westerly (upstream) direction
2 Refine the previously estimated volume of sediment in the Upland Marsh Upper Lagoon and Lower Lagoon
3 Evaluate the solvent extraction remedy effectiveness on treatment of sediment through bench-scale testing
In order to facilitate comparison of Pre-Design Study sediment quality with RI study sediment quality rigorous QAQC protocols and documentation will be needed Only sediment samples containing greater than 30 percent solids (based on visual observations) will be submitted for analysis After sample collection in the field percent volume of settled sediment in the sample container will be compared to the percent volume of free water Samples will be submitted to the laboratory for analysis if the volume of settled sediment in the sample container exceeds 50 percent of the total volume of the sample All samples will be analyzed by Ceimic Corporation of Narragansett Rhode Island following 1988 CLP protocols Analytical Level IV (CLP QAQC and documentation) will be performed by Ceimic on 20 percent of the sediment samples collected The remaining 80 percent will be analyzed by Ceimic utilizing Analytical Level in (CLP QAQC but without CLP documentation) These services will provide the detection limits at or below the ROD Cleanup Standards
During Pre-Design sampling equipment blanks will be collected and analyzed after decontamination of sampling equipment to identify artifact contamination that could result from incomplete decontamination of equipment Trip blanks will also be included during sample shipment to identify cross-contamination during transportation to Ceimic
The laboratory and field QAQC procedures described above will enable the precision required to satisfy the objectives of the sediment sampling component of this study
Document Vol II SC SAP Revision 1
Date March 28 1991 Page 12
24 Surface Water
The OConnor SiteStatement of Work for Remedial DesignRemedial Action requires that surface water contained within the Upper and Lower Lagoon and in the Upland Marsh be drained collected and transported off-sitefor treatment unlessotherwise instructed by EPA
The three primary objectives for surface water data to be collected during the Pre-Design Studies are to
1 Probe surface water depths in Lagoons and Upland Marsh to obtain a better estimate of surface Water volumes to be handled during remediation
2 Evaluate changes in surface water quality that may have occurred during the approximately three-year period since sampling during the RI and evaluate extent of surface water contamination in the Upland Marsh which is at the upstream edge of the PGB contamination area
3 Collect additional data to design an appropriate program for surface water diversion pumping treatment and disposal Off-site disposal destinations as well as on-site treatment and disposal options will be examined in more detail during the Pre-Design Study
All surface water samples will be submitted to Ceimic Corporation for analysis of PCBs aluminum and lead All of these samples will be analyzed following 1988 CLP protocols including CLP QAQC and CLP documentation (Analytical Level IV) One additional sample will be collected from each surface water body and submitted to Ceimic for Total Suspended Solids Analysis (EPA Method 1602) utilizing Analytical Level III
2JS Barn
The available data for the extent of contamination of barn materials consists of one sample point The surficial soil sample collected was not described such that it is known whether the sample consisted of dust the concrete slab soil within cracks of the slab or debris samples within the barn The elevated levels of PCBs and lead within the sample may not be representative of the majority of the loose materials within the barn Furthermore no wipe sampling on non-porous debris or sampling of the wooden barn structure was performed during the RI
Document Vol II SC SAP Revision 0
Date January 17 1991 Page 13
Cleanup standards for target chemicals listed in the ROD have not yet been established by EPA for barn materials The ROD indicates that the Toxic Substance Control Act (TSCA) Spill Cleanup Policy and Disposal Regulations (40 CFR Part 761) may be used in lieu of site-specific determination of acceptable levels
Samples of selected media within the barn will be collected and analyzed to provide an initial data set to establish the degree of contamination present within the barn Data will be used in developing the work plan for decontamination and demolition of the barn and to determine appropriate disposal sites for barn demolition debriSNand loose debris within the barn Depending on data results an evaluation will be made tbvdetermine whether additional sampling will be required prior to demolition to betterseqnence demolition activities so that PCB-contaminated material can beSeparated from non-contaminated building materials and debris
ltx All soil wood and concrete barnsamples will besubmitted to Ceimic Corporation (Ceimic) of Narragansett Rhode Island for analysis of PCBs cPAHsgtand lead Wipe samples of debris will be submitted to Ceimic for analySis-ofPCBs All samples will be analyzed following CLP protocols Analytical LeveK IV-requiring CLP QAQC and reporting requirements will be utilized for 20 percent of the5amples Analytical Level in utilizing CLP analytical protocols but without the documentation requirements of CLP will be specified for the remainder of the
Document Vol II SC SAP Revision 0
Date January 17 1991 Page 14
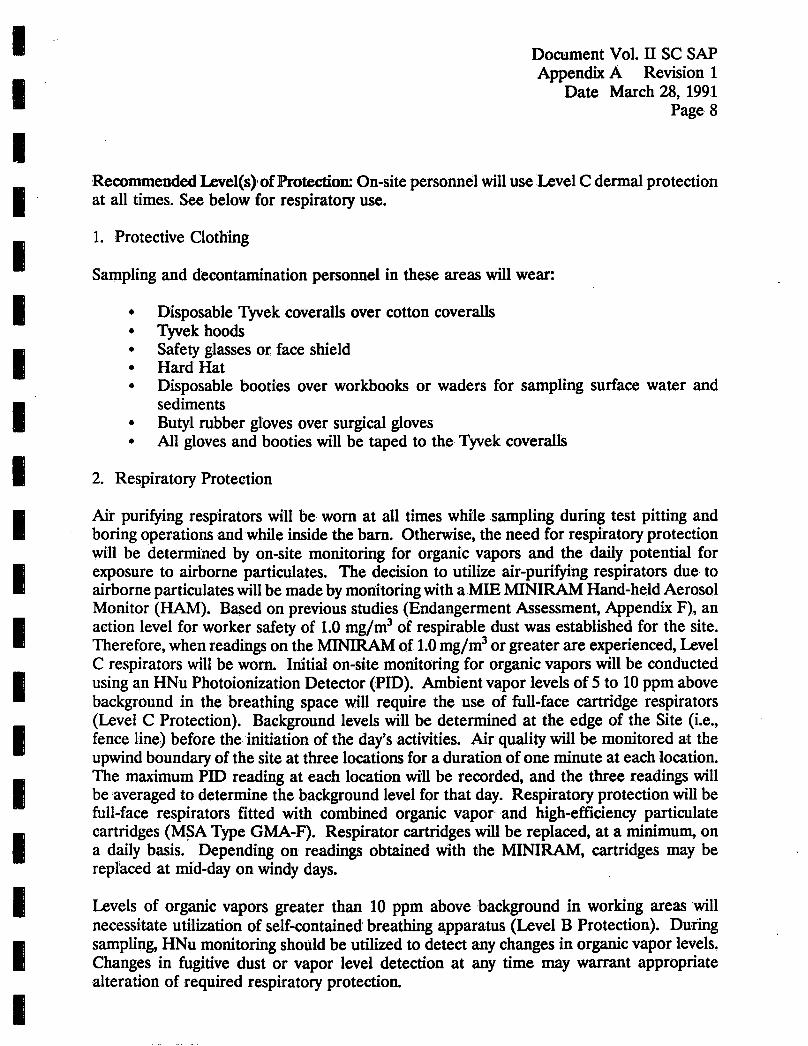
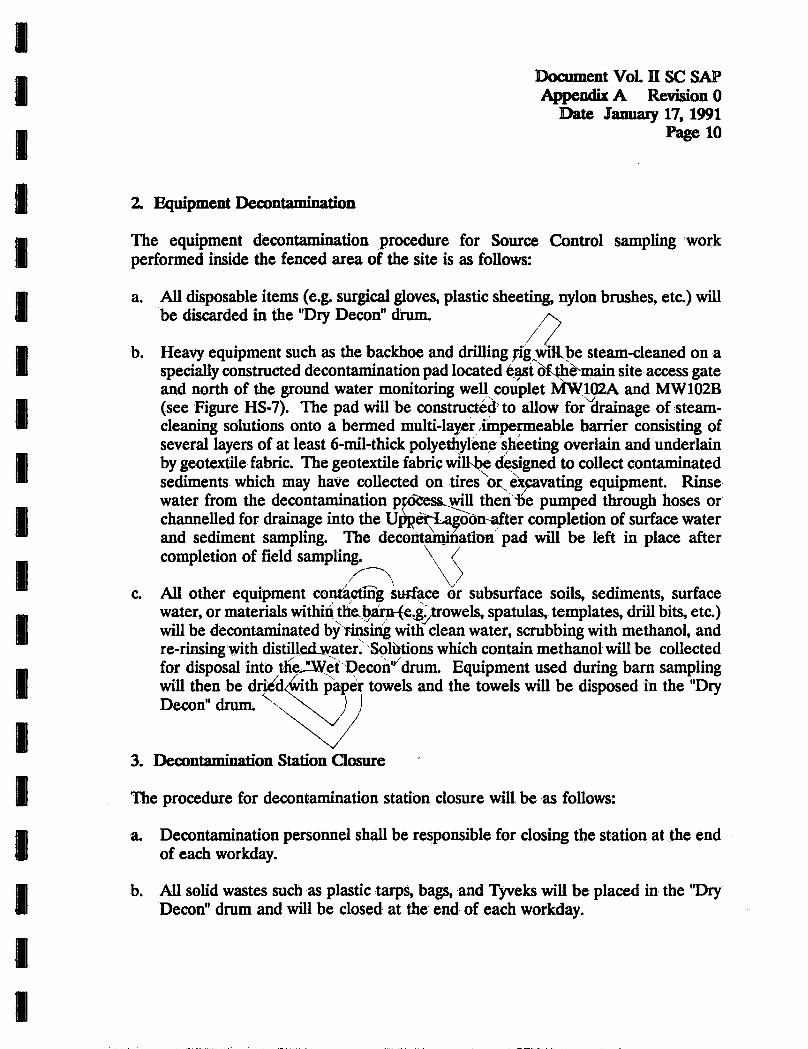
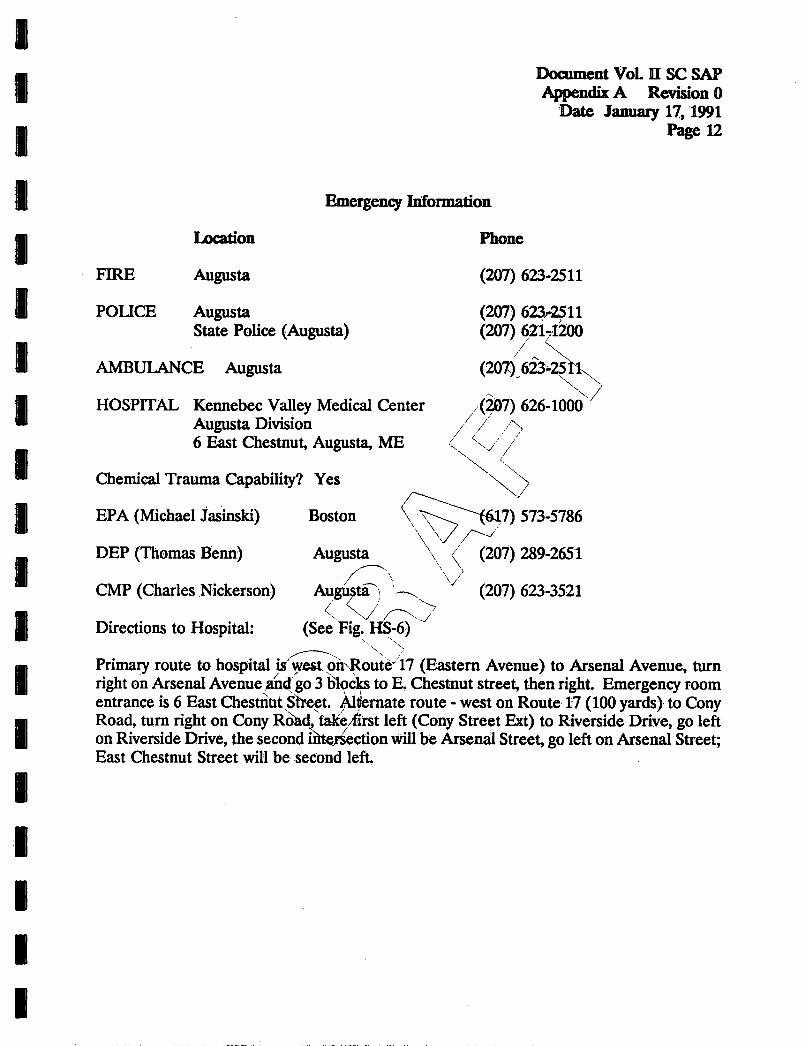
3 HEALTH AND SAFETY
A Health and Safety Plan for the Source Control Field Sampling Plan is presented in Appendix A All personnel involved in the sampling program have been trained in accordance with the requirements of the Occupational Safety and Health Administration Regulation OSHA 1910120 Hazardous Operations and Emergency Response and are enrolled in a comprehensive medical monitoring program
A list of personnel authorized to perform work on this project ^and listing of their participation in personnel training and health monitoring programs^arepresented in the Health and Safety Plan gt
Document Vol II SC SAP Revision 1
Date March 28 1991 Page 15
4 SAMPLING LOCATION AND FREQUENCY
41 Soils
411 General
In general the soil sampling program includes collection of the following two basic categories of samples
1 Soil samples collected from test pits for possible bench-scale testing and
2 Soil samples collected from test pits and borings to fill data gaps on the lateral and vertical extent of soil contamination above cleanup standards and to refine estimates of the quantity of contaminated soils
Figure 3 shows the locations of test pits and borings planned for this investigation These locations were based on the depth delineation of 1 ppm for Total PCBs presented in the Remedial Investigation Table 1provides ageneral sampling rationale including test pit and boring identification numbers target sampling depth and elevation anticipated PCB concentration level and soil type A summary of the analyses to be performed on soil samples including replicates and blanks is shown in Table 2
A total of 12 soil samples for possible bench-scale testing will be collected from test pits during April 1991 Two samples of each soil type indicated below will be collected within the specified ranges of PCB concentrations Each sample will have a minimum volume of about 05 cubic feet (about 60 lb weight) to provide sufficient soil for bench-scale testing
PCB Concentration Range fppml Soil Types
1 to 10 Clay and Fill 10 to 20 Clay 20 to 50 Clay 50 to 500 Clay and FiU
During the RI three soil samples were collected for bench-scale treatability testing with initial PCB concentrations of 1000 4000 and 22000 ppm However sample locations had been selected to obtain samples with PCB concentrations in the range of 250 to 700 ppm based on PCB concentration contours developed during the RI
Document Vol II SC SAP Revision 1
Date March 28 1991 Page 16
Therefore PCB concentration contours developed from the RI data do not precisely indicate the extent and level of contamination
In order to gain a higher degree of confidence that samples within each specific PCB concentration range have been collected GEI will perform field PCB screening with a Dexsil L-2000 PCB analyzer to estimate the soil PCB concentration range prior to collecting the soilsample Aliquots of the 12 bench-scale soilsamples will be collected for confirmatory testing for PCB concentrations by Ceimic of Narragansett Rhode Island utilizing 1988 CLP protocols
GEI will select the soil samples for bench-scale testing after receiving the CLP laboratory results of the PCB concentrations If the laboratory data do not indicate that at least one of the two soil samples was collected from the targeted concentration ranges and soil types an additional contingency round of soil sampling may occur Sampling locations for this contingency sampling round will be selected based Upon the PCB data summarized in the RI and the data collected by GEI during the previous SC sampling round
A total of 40 soil samples (including replicates) will be collected from test pits and borings during April 1991 to fill data gaps on the extent and quantity of contaminated soil The soil sampleswill be collected at the approximate elevation specified for each sampling location as indicated in Table 1 Sample elevations of the bench-scale samples may vary if PCB concentrations in samples screened with the Dexsil L-2000 PCB analyzer are not within the ranges indicated below
Acceptable Screening Target PCB Concentrations Range PCB Concentration Range
(ppm) (ppm)
1 to 10 1 to 10 10 to 20 10 to 20 20 to 50 25 to 45
50 to 500 200 to 350
The soil samples will be analyzed for PCBs ePAHs and lead by Ceimic of Narragansett Rhode Island utilizing CLP protocols Four soil samples (including two selected for bench-scale treatability testing) will also be analyzed for total organic carbon (TOC) cation exchange capacity (CEC) and pH
Document Vol II SC SAP Revision 1
Date March 28 1991 Page 17
Detailed descriptions of the soil sampling and decontamination methods are provided in Section 5 Appendix A and the QAPP Contractors will be used for surveying performance of test pits and drilling of borings All contractors will be required to document that they have completed health and safety training that complies with OSHA Standard 1910120 In generalstakes marking the planned locationsof test pits will be surveyed by a registered surveyor prior to test pit excavation The Stakes will serve as temporary bench marks for reference during location of test pit samples A rubber-tired type backhoe will be used to excavate test pits for planned sampling locations less than or equal to5 feet below ground surface The backhoe and operator will be supplied by HE Sargent Inc of Lewiston Maine capable of operating at hazardous waste sites under Level C personnel protection Soil samples will be collected from in-situ test pit excavations by GEI personnel using a stainless steel shovel or trowel
Due to anticipated shallow ground water conditions a drill rig will be used to advance test borings for soil sampling at locations where the target sampling location is greater than 5 feet below ground surface The soil samples will be collected using a split-spoon sampler Drilling and sampling will be performed by Northeast Diamond Drilling Company of Union Maine capable of working on hazardouswaste sites under Level C personnel protection
412 Soil Analysis Program
Analytical procedures are identified in the Quality Assurance Project Plan (QAPP) The samples will be analyzed using 1988 CLP methods for PCB cPAHs and lead by Ceimic of Narragansett Rhode Island EPA methods 9045 9060 and 9080 will be used to analyze soils for pH TOC and CEC respectively A summary of the analyses to be performed on soil samples including replicates and blanks is shown in Table 2 Samples will be collected in I-Chem glassware or equivalent and stored at 4 deg C as described in Section 6
A series of quality control blanks (replicates and blanks) will be collected by GEI and analyzed by the laboratory to aid in data assessment as discussed in the Quality Assurance Project Plan (QAPP) All quality control samples will be labelled with false sample identification as shown in Table 2 in order to avoid laboratory bias
Sampling equipment blanks and aqueous trip blanks will be submitted for every ten soil samples during the sampling program to check for the presence of cross-contamination These will provide a quality control check for decontamination and handling practices The trip blanks will contain laboratory-supplied organic-free water and will accompany the shipment of soil samples during storage and shipment The trip blanks will be analyzed for PCBs (sample identification will be TP26-TP29) Wipe
Document Vol II SC SAP Revision 1
Date March 28 1991 Page 18
samples will be collected from the shovel or hand trowel and split-spoon sampler (sample identification numbers TP30-TP33 and TP34-TP37 respectively) after decontamination and will be analyzed for PCBs Wipe sampling procedures are described as part of barn sampling procedures in Section 562 One replicate sample will be collected for every ten soil samples Replicate sample locations and identification numbers are indicated on Table 2
413 Soil Sample Designation
Each piece of soil sample glassware will be affixed with a self-sticking adhesive label Each label will be completed with an indelible marker to contain the following information
GEI Consultants Inc Site Name Project Number Sampling Date and Time Sample Number Samplers Initials Analysis Requested
The sample number is composed of a series of information to identify the sample as unique to the sampling point and sampling event The sample number labelled in the field and referred to on all associated documents is composed of the following
Matrix Project Sampling Location Sample Number
Soil - 90393 -TP2-SS1
The example sample number above indicates that soil sample SSI was collected from Test Pit No 2 under project number 90393
4JZ Sediment
431 General
Sediment samples will be collected by GEI from the Upland Marsh the Upper Lagoon and the Lower Lagoon during April 1991 A summary of the laboratory analyses of sediment samples is listed on Table 3 Procedures for sampling and equipment decontamination are provided in Section 5 Appendix A and the QAPP
Document Vol II SC SAP Revision 1
Date March 28 1991 Page 19
In general the sediment sampling program includes collection of the following two basic categories of samples
1 Two composite sediment samples collected using a clam-shell sampler for bench-scale testing
2 Eleven sediment samples (including one replicate) collected with a tube sediment sampler to provide additional data on sediment quality and for estimating the quantity of contaminated sediments
The two composite sediment samples collected using a clam-shell type sampler for bench-scale testing will be collected within the Upper Lagoon and Lower Lagoon at the locations shown on Figure 4 Based on the data in the RI the Upper Lagoon contained the higher sediment concentrations of PCBs
The eleven sediment samples collected to provide additional data on sediment quality and for estimating the quantity of sediments will be collected at the locations shown on Figure 4 As shown on the figure six sediment sampling locations were chosen for the Upland Marsh two locations were chosen for the Upper Lagoon and two locations for the Lower Lagoon
Detailed descriptions of the methods and equipment to be used during the sampling program are provided in Section 5 In general a temporary reference bench mark will be surveyed and staked adjacent to each surface water body by a surveyor licensed in the State of Maine and OSHA-approved for working on a hazardous waste site The actual sediment sampling locations will be measured by tape and compass bearings from the reference bench mark prior to sampling For the bench-scale sample a 5shygallon sample container will be filled with sediment from the dredge type sample The samples for providing additional data on sediment PCB concentrations will be collected with a tubesediment sampler pushed into the complete thickness of sediment at the sampling location All sampling equipment will be decontaminated using methanol and distilled water rinses before each use
4SL2 Sediment Analysis Program
Analytical procedures are identified in the Quality Assurance Project Plan (QAPP) Sediment samples will be submitted to Ceimic of Narragansett Rhode Island for laboratory analysis utilizing CLP protocols The samples collected for bench-scale testing will be analyzed for PCBs The remainder of the sediment samples will be analyzed for PCBs cPAHs and lead One sediment sample will also be analyzed for total organic carbon (TOC) cation exchange capacity (CEC) and pH by EPA methods 9060 9080 and 9045 respectively A summary of analyses to be performed on
Document Vol II SC SAP Revision 1
Date March 28 1991 Page 20
sediment samples including replicates and blanks is shown in Table 3 Samples will be collected in I-Chem glassware or equivalent and stored at 4degC as described in Section 6
A series of quality control samples (replicates and blanks) Will be collected by GEI and analyzed by the laboratory to aid in data assessment as discussed in the Quality Assurance Project Plan (QAPP) All qualitycontrol samples will be labelled withfalse sample identification as shown in Table 3 in order to avoid laboratory bias
Two sampling equipment blanks and one aqueous trip blank will be submitted during the sampling program to check for the presence of cross-contamination These will provide a quality control check for decontamination and sample handling practices The trip blank containing laboratory-supplied organic free water will accompany the shipment of sediment samples and will be analyzed for PCBs (Sample ID SED7) Wipe samples will be collected from the tube sediment sampler and dredge sampler after decontamination and will be analyzed for PCBs (sample identification numbers SED9 and SED8 respectively) Wipe sampling procedures are described as part of barn sampling procedures in Section 562 One replicate sample will be collected during sediment sampling Replicate sample location and identification is indicated on Table 3
423 Sediment Sample Designation
Each piece of sediment sample glassware will be affixed with a self-sticking adhesive label Each label will be completed with an indelible marker to contain the following information
GEI Consultants Inc Site Name Project Number Sampling Date and Time Sample Number Samplers Initials Analysis Requested
The sample number is composed of a series of information to identify the sample as unique to the sampling point and sampling event The sample number labelled in the field and referred to on all associated documents is composed of the following
Matrix Project Surface Water Body Sample Location
SED - 90393 - UM - SED1
Document Vol II SC SAP Revision 1
Date March 28 1991 Page 21
The example sample was obtained from sample location SED1 in the Upland Marsh under project number 90393 The surface water body designations for the Upper Lagoon and the Lower Lagoon will be UL and LL respectively
43 Surface Water
431 General
Surface water quality data consisting of two samples each from the Upland Marsh Upper Lagoon and the Lower Lagoon will be collected by GEI in April 1991 Sampling locations are shown on Figure 4 Surface water sampling locations will be determined in the field by tape and compass bearings from the temporary reference bench mark established for sediment sampling A summary of the analyses to be performed on surface water samples including duplicates and blanks is shown on Table 4 Detailed descriptions of the sampling methods to be used during surface water sampling are provided in Section 5 In general the depth of the water at the sampling location will be measured at each sampling location with a weighted tape measure prior to collecting the surface water sample A water sample will be collected after lowering a stainless steel Kemmerer sampling device one-half the total depth of the water column All sampling equipment will be decontaminated using methanol and distilled water rinses before each sampling event
433 Surface Water Analysis Program
Analytical procedures are identified in the Quality Assurance Project Plan (QAPP) All of the surface water samples will be analyzed using 1988 CLP methods for PCBs aluminum and lead One sample from each surface water body will also be Submitted for Total Suspended Solids Analysis (EPA Method 1602) A summary of the analyses to be performed on surface water samples including duplicates and blanks is shown on Table 4 Surface water samples will be submitted to Ceimic Corporation for laboratory analysis Samples will be collected in I-Chem glassware or equivalent and stored at 40 C as described in Section 6
A series of quality control samples (duplicates and blanks) will be collected by GEI and analyzed by the laboratory to aid in data assessment as discussed in the Quality Assurance Project Plan (QAPP) All quality control samples will be labelled with false sample identification as shown in Table 4 and described below in order to avoid laboratory bias
One sampling equipment blank and a trip blank will be submitted during each sampling round to Check for the presence of cross-contamination These will provide a quality control check for decontamination and handling practices One trip blank
Document Vol II SC SAP Revision 1
Date March 28 1991 Page 22
sample consisting of laboratory-supplied organic-free and de-ionized water will accompany the samples during storage and shipment and will be analyzed for PCBs aluminum and lead (sample identificationwill be SW4) A samplingequipment blank will be collected by pouring laboratory-supplied organic-free and de-ionized water through the Kemmerer sampler at the end of the sampling program The sampling equipment blank will then be analyzed for PCBs aluminum and lead (sample identification will be SW5)
One surface water duplicate will also be collected each sampling round Duplicate sample location and identification is indicated on Table 4
433 Surface Water Sample Designation
Each piece of sample glassware will be affixed With a self-sticking adhesive label Each label will be completed with an indelible marker to contain the following information
GEI Consultants Inc Site Name Project Number Sampling Date and Time Samplers Initials Analyses Requested
The sample number is composed of a series of information to identify the sample as unique to the sampling point and sampling event The sample number labelled in the field and referred to on all associated documents is composed of the following
Matrix Project Surface Water Body Sampling Location
SW - 90393 - UM - SW1
The example sample number above indicates thata surface water sample was obtained from the Upland Marsh at location SW1 under Project Number 90393 The surface water body designations for the Upper Lagoon and the Lower Lagoon will be UL and LL respectively
Document Vol II SC SAP Revision 1
Date March 28 1991 Page 23
44 Barn
441 General
A total of approximately 30 samples of various media within the barn will be collected by GEI during May 1991 The types of media collected will generally consist of wood fragments from barn walls dust concrete and wipes on non-porous debris within the barn The exact sample locations will be primarily determined in the field based on observations during sampling (eg staining on soils concrete or wood) Based on a site visit by GEI on December 19 1990 preliminary sample locations for barn materials were chosen as shown in Figure 5 These preliminary locations will enable representative sampling of general debris and staining in the barn and indicates the general sampling strategy which will be employed during Pre-Design Final sampling locations may be modified during the program based on closer observation of equipment barn materials and evidence of staining
Detailed descriptions of the methods to be used during the barn sampling program are provided in Section 5 In general a survey of the general types of materials present in the bam and locations of apparent staining of surficiial materials or debris will be recorded on a plan Following the survey representative areas within the barn will be sampled A total of 12 wipe samples will be collected (eg steel shelves boat wood stove electric meters etc) by wiping a 100 cm2 area with laboratory-prepared sampling wipes A total of ten samples of Wood from the walls of the barn will be collected by using a wood boring bit and wood chisel A total of four samples of loose dust will be collected from the floor of the concrete slab of the barn using disposable nylon brushes and stainless steel trowels Finally a total of four samples of concrete will be collected from areas of visible staining and one unstained area by drilling the concrete to a maximum depth of 12 inch in a 100 cm2 area All non-disposal steel sampling equipment will be decontaminated using methanol and distilled water rinses before use at each sampling location
442 Barn Analysis Program
Analytical procedures are identified in the Quality Assurance Project Plan (QAPP) Three field equipment blanks and three trip blanks will be submitted during the barn sampling program to check for the presence of cross-contamination These will provide aquality control check on decontamination and handling practicesAsummary of the analyses to be performed on each sample matrix and the quality controlsamples is shown in Table 5
Document Vol II SC SAP Revision 1
Date March 28 1991 Page 24
Wipe wood dust and concrete samples will be submitted to Ceimic in Narragansett Rhode Island for laboratory analysis Wood dust and concrete samples will be analyzed for PCBs cPAHs and lead Samples will be collected in I-Chem glassware or equivalent provided by Ceimic and preserved and stored as described in Section 6
The objective of the barn sampling program is to provide a preliminary assessment of the degree of contamination present within the barn (see Section 2) It may be difficult to ensure that representative replicates can be made of the various matrices during sampling Therefore no replicate samples of barn materials will be collected during this initial sampling effort
Aqueous trip blank wipe samples will accompany the samples during storage and shipment and will be analyzed for PCBs (sample identification will be PTB1-PTB3) Sampling equipment blank wipes will be made following decontamination of all steel sampling equipment at various times during the sampling program The steel equipment wiped will include the hole saw trowel and the drill bit used for barn wall dust and concrete sampling respectively The equipment wipe samples will then be analyzed for PCBs (sample identification will be PEB1-PEB3)gt
443 Barn Sample Designation
Each piece of sample glassware will be affixed with a self-sticking adhesive label Each label will be completed with an indelible marker to contain the following information
GEI Consultants Inc Site Name Project Number Sampling Data and Time Sample Number Samplers Initials Analysis Requested
The sample number is composed of a series of information to identify the sample as unique to the sampling point and sampling event The sample number labelled in the field and referred to on all associated documents is composed of the following
General Sample Location Project Sample Type Sample
BARN - 90393 - D2
Document Vol II SC SAP Revision 1
Date March 28 1991 Page 24a
The example sample number above indicates that a barn sample was obtained under project number 90393 and was the second dust sample collected The designations for the wipe samples will be P wooden samples W dust samples D concrete samples C and other samples O
Document Vol II SC SAP Revision 1
Date March 28 1991 Page 25
5 SAMPLING EQUIPMENT AND PROCEDURES
51 Air Monitoring
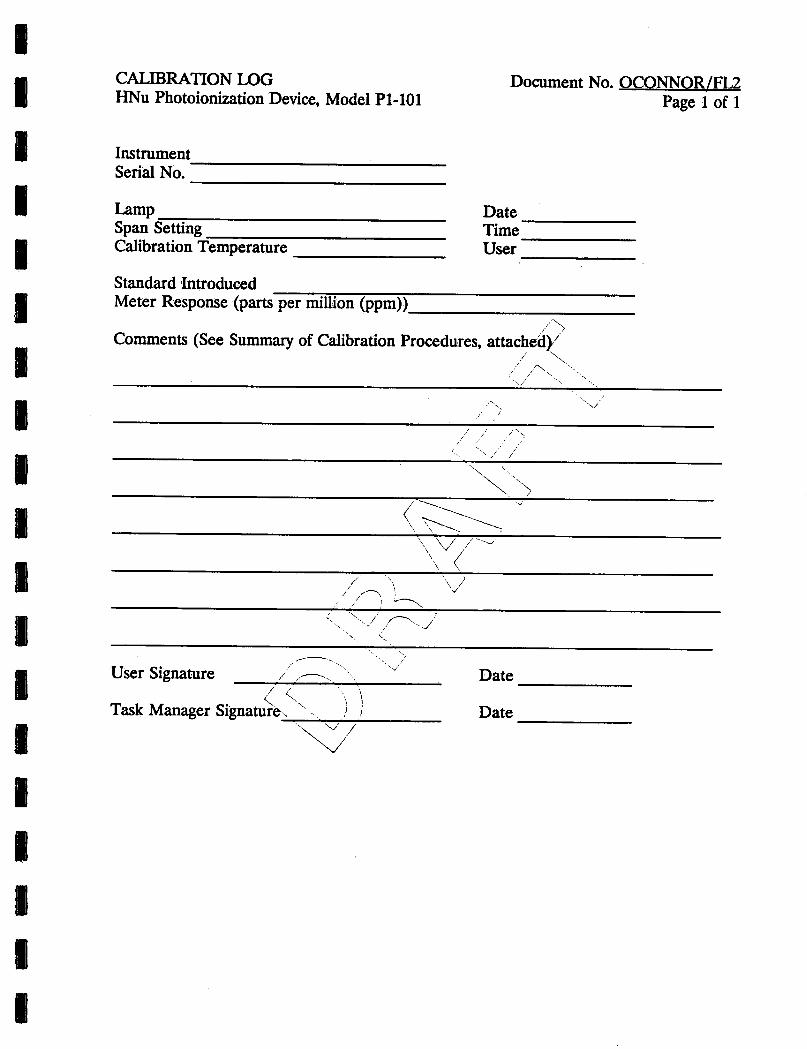
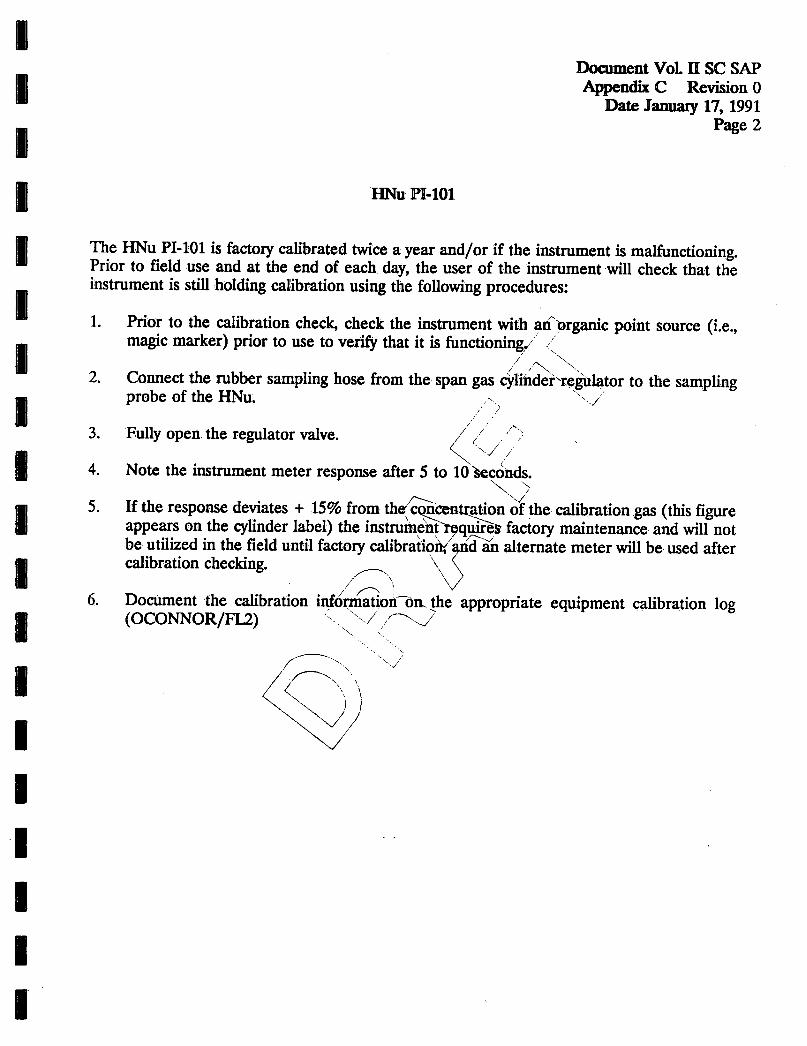
Short-term air monitoring will be performed regularly on-site during the Source Control (SC) sampling program A HNu photoionization detector (PID) and an MIE Model MINIRAM hand-held aerosol monitor (HAM) will be used for air monitoring The PID is capable of detecting total ionizable compounds (typically VOCs) and the HAM detects solid or liquid particulates in air which often take the form of dust smoke fumes and mists Each air monitoring instrument will be operated in accordance with the requirements specified in the Health and Safety Plan provided in Appendix A Readings from the PID and HAM will be recorded in the Project Field Log Book (see Appendix B) Calibration procedures for the PID (HNu Model PI-101) and the HAM (MIE Model MINIRAM) are provided in Appendix C
52 Soil Sampling
521 General
Soil sampling locations are shown on Figure 3 Table 1 lists each soil sampling location planned approximate sample depth and rationale for sample collection
Prior to sampling a surveyor registered in the State of Maine will survey the exact location of each test pit and boring location and provide a temporary stake that will function as a bench mark for horizontal and vertical control within 20 feet of each test pit and at each boring Sample locations within test pits will be by tape and compass bearing methods
Soil sampling will be performed with strict adherence to the procedures described below A list of equipment requirements for the soil sampling program is provided in Table 6 In general excavation of soil to the target depth in test pits will be performed with a backhoe for sampling to 5 feet below ground surface The backhoe and operator will be supplied by HE Sargent Inc and the operator will be equipped with Level C personnel protection (see Appendix A) A bombardier or truck-mounted drill rig operated by Northeast Diamond Drilling by personnel equipped with Level C protection will be utilized for sampling points greater than 5 feet below ground surface Soil samples collected by GEI for possible bench-scale testing will be obtained only at test pit locations Ambient air monitoring will be performed by GEI regularly while working on-site for health and safety monitoring Mobilization
Document VoL II SC SAP Revision 1
Date March 28 1991 Page 26
of equipment and transportation of materials over the site during the soil sampling program will avoid heavily contaminated transformer work areas when possible to reduce dispersing PCBs to other areas Drilling and excavating equipment will be decontaminated under the supervision of GEI prior to use at each sampling location following strict decontamination procedures described in Appendix A and below Sampling equipment will be decontaminated by GEI prior to each sampling event as described below All soil sampling operations within the site will be performed using Level C dermal and respiratory personnel protective equipment to protect against PCB-contaminated dust levels which are likely to exceed 1 mgm3 during sampling The detailed Health and Safety Plan that will be followed during soil sampling is provided in Appendix A
522 Soil Sampling Methods for Test Pits
A minimum of a two-person crew in addition to the backhoe operator or the drill rig crew will be provided by GEI during the sampling program
All soil samples will be collected from test pits by GEI with a shovel or trowel following excavation to the appropriate depth with a rubber tire backhoe as follows
1 Check the survey stakes for the proper test pit number identification and location
2 Place polyethylene sheeting on each side of the test pit for staging the excavated soils from the test pit
3 A standard rubber tire type backhoe will perform the soil excavation to the planned sampling depth All soil excavated from the test pit will be placed on the plastic sheeting adjacent to the test pit The top 2 feet of excavated soil will be cast to one side of the test pit on the sheeting and the bottom 3 feet of soil will be cast to the opposite side to avoid mixing soils with potentially significantly different levels of contamination After completion of sampling soil will be backfilled at a similar depth from which it was excavated
4 All excavation activities will be continuously observed by an engineer or geologist from GEI A test pit log form (OCONNORFL12) will be completed by GEI for each test pit performed and will include the following information
Document Vol II SC SAP Revision 0
Date January 17 1991 Page 27
Name and Location of Job Date Excavation and Test Pit Number Approximate Ground Surface Elevation at Test Pit Total Depth of Test Pit Dimensions of Test Pit Location and Depth of Soil Sample Relative to Stake Reference Method of Soil Sample Acquisition (Shovel Trowel) Volume of Soil Sample J Soil and Stratigraphic Descriptions x
Ground Water Levels (if encountered) y ^v Air Monitoring Information v Other observations Such as soil staining buried debris etc
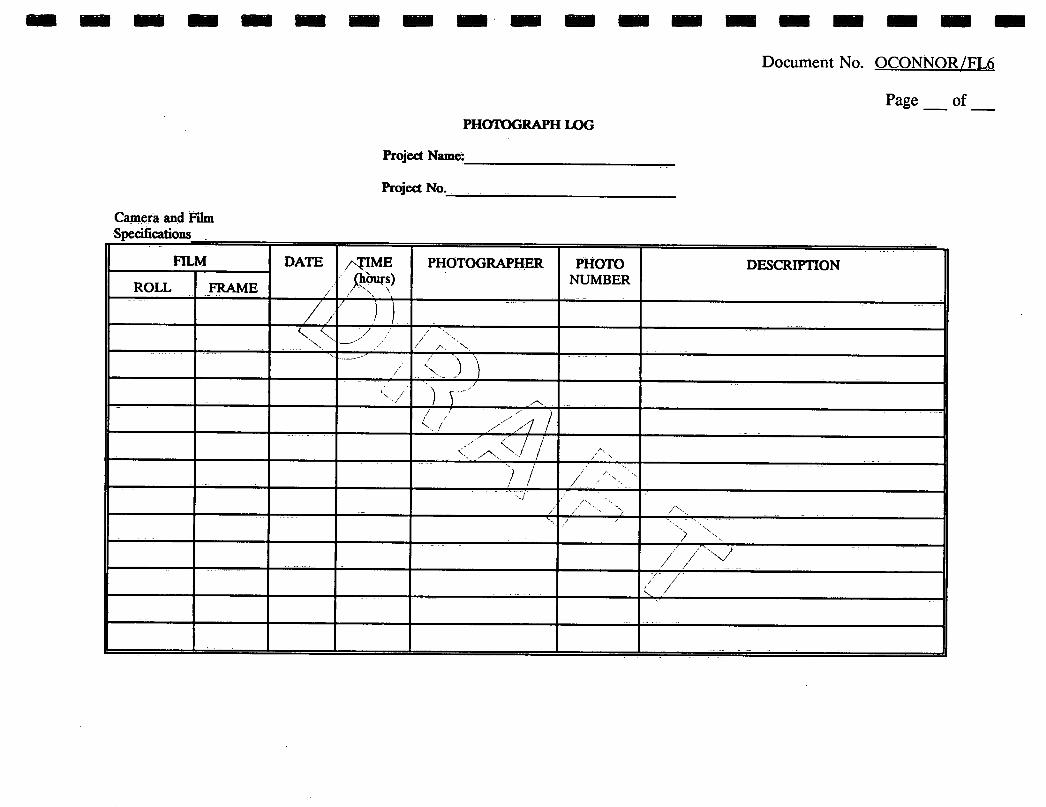
5 At least one photograph will be taken oflta wall of each test pit from within the test pit with a scale for comparison to indicate soil layering or staining In addition one photograph shall be taken of thertesVpit from the ground surface also showing sample locations withinthe-test pit Photographs of the test pits will be marked to include site locationxjdbmumber^test pit number date and time A photograph log sheet will be maintained fampMuture reference
6 The target soil sampling elevation will be determined by GEI using a level and rod
7 Soil sampling will begin from within the test pit only after the side walls of the pit have been properly^sloped back in accordance with OSHA requirements (see Health and Safety Plan^ Appendix A) All samples collected will be identified on the test pit logazid in the field book Information about the sample including sample number^de^th voiuine and soil description will be recorded The soil sample will be colleetedTrotn an undisturbed area of the test pit floor or wall by means of scraping or digging with a stainless steel shovel or trowel The number of clean sampling utensils for each test pit shall be equal to the number of soil samples collected at the test pit Shovels or trowels used to clean sloughed material from the sampling location will not be used to collect the sample unless decontaminated before use in sampling Care will be taken to assure that the sample is taken from the actual soil unit desired mid does not include slough or scraped material from the sides of the trench The desired soil sample will be immediately placed into the sample container within the test pit A portion of the sample will be retained for screening with the Dexsil L-2000 PCB analyzer The containers will then be sealed labelled and stored in asecure area until Shipment to the laboratory
Document Vol II SC SAP Revision 1
Date March 28 1991 Page 28
8 When collecting a larger volume sample for bench-scale testing a smaller soil sample will first be collected for field screening using the Dexsil L-2000 PCB Analyzer If the analyzer indicates that the PCB concentration is within the target range the bench-scale soil sample will be collected If the Analyzer indicates that the PCB concentration is outside the target range the test pit will be expanded if necessary and another sample will be collected for PCB screening This procedure will be continued until a sample within the target range is identified The test pit will be expanded no more than 2 feet in all directions and to the maximum depth of 5 feet below ground surface If after this over-excavation the soil within the target concentration range has not been identified with the Dexsil L-2000 PCB Analyzer a new test pit location will be selected near the original test pit in an area indicated by the Remedial Investigation to contain soil contamination within the target range
9 Once the targeted PCB concentration has been indicated by field screening the desired soil sample will be collected with a clean stainless steel trowel or shovel at a sufficient quantity to fill a 5-gallon container An aliquot from the 5-gallon sample container will be collected and placed in an appropriate sample container for laboratory analysis for PCBs The 5-gallon containers will then be sealed labelled and appropriately stored in a secure area until transported off-site The laboratory samples will be sealed labelled and stored with the other soil samples awaiting shipment to the laboratory
10 Upon completion of sample collection the excavated soil material will then be backfilled into the test pit The backfilled area will be compacted to the approximate original ground elevation
11 Equipment will be decontaminated after backfilling the test pit (ie shovel trowels measuring equipment) byscrubbing and With methanol and distilled water rinses Portions of the backhoe (bucket bucket arm etc) will be decontaminated with a high-pressure steam rinse on the decontamination pad (see Appendix A)
523 Soil Sampling Methods for Borings
Selected soil samples are planned to be collected at depths greater than 5 feet below ground surface to obtain additional data on the depth of PCB contaminationexceeding cleanup standards in Transformer Work Areas Samples will be obtained using split-spoon sampling techniques within 3-inch ID hollow stem augers in test borings generally following procedures specified by American Society for Testing Materials (ASTM) D1586-84 Test borings will be performed by Northeast Diamond Drilling
Document Vol II SC SAP Revision 1
Date March 28 1991 Page 29
under the observation of an engineer or geologist from GEI The following procedures not specified in ASTM D1586-84 will be used
1 Place a polyethylene sheet on one side of the boring location for temporarily staging drilling cuttings during borehole advancement All drilling equipment shall be decontaminated with a high pressure steam rinse on the decontamination pad prior to beginning drilling
2 Advance hollow-stem augers without split-spoon sampling to a depth about 5 feet above the sampling depth specified in Table 1
3 Begin continuous split-spoon sampling with 18-inch-long samples Collect a specimen from the middle of each sample for screening with the Dexsil L-2000 PCB analyzer and the HNu photoionization detector Rinse the split-spoon sampler with methanol and distilled water rinses before each sample
4 Collect a split-spoon sample at the designated sample depth Divide the split-spoon sample vertically Place a minimum of 4 inches of sample recovered from the bottom right half of the sample into the glass sample container Seal and label the sample container as indicated in Section 4 and store the container in a cooler with ice in a secure area until shipment to the laboratory Retain the left half of the split-spoon sample for screening with the Dexsil 1^2000 PCB analyzer and the HNu photoionization detector
5 After collecting the final soil sample in the boring measure depth to ground water below ground surface using a decontaminated Solinst battery-operated water level indicator Record the time elapsed after completion of the boring when the ground water level was measured
6 Remove augers from borehole If the borehole remains open and evidence of ground water was encountered during sampling collect additional measurements of depth to ground water prior to backfilling until the ground water level appears to stabilize Note occurrence of precipitation or other events which could effect water level measurements in the project log book
7 Backfill borehole within 24 hours after completion of the boring with drill cuttings staged adjacent to the borehole If the borehole collapses and cuttings cannot be backfilled in the borehole store staged cuttings in a steel drum to be left on site Label outside of drum to indicate contents are borehole cuttings from the designated boring number and affix labelindicating PCB-contaminated materials Cuttings from more than one boring can be combined in a single drum
Document Vol II SC SAP Revision 0
Date January 17 1991 Page 30
8 Decontaminate measuring and sampling equipment with methanol and distilled water rinses Decontaminate downhole drilling equipment on the decontamination pad with a high-pressure steam rinse before starting the next boring
A log will be prepared by GEI for each boring and will include the following
information 7
Name and Location of Project
Boring Number lt Date of Boring Ground Surface Elevation x-Boring Diameter and Depth Sample Numbers and Depths Soil Screening Data Visual Soil Descriptions Water Level Measurements Air Monitoring Levels Other Observations
The boring log form is provrdedin Appendix B (OCONNORFL15)V
i
Surface Water ^^7
531 General
N
Surface water sam^les^will becollected at the locations shown in Figure 4 If water is too deep for safe aecess^with hip-waders andor access with hip waders will severely disturb sediment an inflatableboat will be used to access Surface water sampling locations
The surface water sampling program will be performed following strict adherence to the following procedures A list of the equipment requirements for surface water sampling is provided in Table 8 In general ambient air monitoring will be performed regularly while working on-site for health and safety considerations Areas of the site which have been determined by previous studies to have elevated concentrations of PCBs in soils (for example TWAs) will be avoided while traversing the site to reduce the likelihood of dispersing PCBs to other areas The depth of water at the sampling stations will be measured and the surface water elevation will be surveyed on each water body Equipment will be decontaminated prior to use at each sampling station following decontamination procedures
Document Vol II SC SAP Revision 0
Date January 17 1991 Page 31
532 Surface Water Sampling Methods
Surface water samples will be collected during the Pre-Design Study at the locations shown on Figure 4 Surface water samples will be collected during the initial stage of the Source Control sampling program prior to soil and sediment sampling An inflatable boat will be used to access surface water sampling locations if there is sufficient water depth The boat will be cleaned with methanol and distilled water rinses before sampling in each water body The surface water sampling procedures will be as follows ltX1 Determine the location of the sampling station by tape^and compass from a
temporary bench mark at the edge of the surface water body x
2 Measure the depth of water at the sampling station with a weighted tape measure x (
^ 3 Gently lower a clean Kemmerer sample^bottle to the desired depth (one-half
water depth) so as not to remove th^stoppeisprematurely V^
4 Pull out the stopper with a sharp jerk ofdhe sampler line
5 Allow the bottle to fill completelyras evidenced by the cessation of air bubbles
6 Raise the sample and capdhe nottle X x
7 Pour the sampl^fromthe bottle into the appropriate sample container The container willbesealedlabelled and stored in a secure area until shipment to the laboratory
8 Fill a beaker with water remaining in the sampler and measure specific conductance pH and temperature
9 Decontaminate the sampling apparatus measuring tape and Kemmerer sampler by scrubbing internally and externally with methanol and distilled water rinses
10 Record the following surface water sampling information in the project log book (OCONNORFL1)
Document Vol II SC SAP Revision 0
Date January 17 1991 Page 32
Date Time Total Depth of Water Location and Depth of Sample pH Conductivity Measurements Air monitoring levels detected Other observations
Sediment
541 General x
gt The locations of the sediment sampling stations are shown on Figure 4 Table 3 lists the various sampling stations and sampling methods for the sampling program Sediment sampling during the project will beperformed with strict adherence to the following procedures A list of equipment requirements for the sediment sampling program is provided in Table7 In general ambientw monitoring will be performed regularly while working on-site for health-and safetymonitoring Mobilization of equipment and materials over the sitdduring^he-sediment sampling program will follow specific routes to reduce the likelihoocKPfdispersing PCBs to other areas Equipment will be decontaminated prior to sampling at each location following strict decontamination procedures described belowy All sediment sampling operations within the site will be performed fusing level C dermal personnel protective equipment and Level D respiratory^protective equipment will be worn
v ^
542 Sediment Sampling Methods gtSN
The sediment sampling^vili be performed after collection of surface water samples and will consist of rivo primary components
1 Tube sediment smiling to provide additional data on sediment quality and to estimate the thickness of sediment
2 Dredge sediment sampling to obtain a sample for laboratory for bench-scale treatability testing
The tube sediment sampling program will be performed as follows
Document Vol II SC SAP Revision 0
Date January 17 1991 Page 33
1 Determine the sampling locations by tape and compass measurements from a temporary bench mark (reference stake) surveyed near the edge of the surface water body Access locations in interior portions of the water bodies using an inflatable rubber boat The boat will be decontaminated with methanol and distilled water rinses before use in each surface water body
2 Measure the depth of water with a weighted tape measure
3 Lower the hand tube sediment sampler to the desired ctepth Sediment entering the tube is trapped by a plastic core retainer allbyringlheunit to be retrieved a n d t h e s a m p l e r e m o v e d w i t h o u t s a m p l e l o s s X x y
4 Extract the sediment samplefrom the sampler and^immediately place the sample
into the sample container The containers ywllthen be sealed labelled and stored on ice in a cooler in a secure area until shipment to the laboratory
5 Decontaminate the sampling apparatua and measuring tape by scrubbing with methanol and distilled water rinses
vw 7 Record sediment sampling record information in the project log book
(OCONNORFL2) after collecting a sediment sample at each sampling station The information that will beuro~documenteamp includes the following
Date and Time ^ Total Depth of Water N Thickness of Sediment Location of Sample Length and Vblume^of Simple Sample Description x- Air Monitoring LevetesDeteeted Other Observations
The sediment sampling procedure for collecting samples for bench-scale treatability testing will be as follows
1 Determine the location of the dredge traverse line by tape and compass bearings from the temporarily bench mark adjacent to the surface water body
2 Pull the sediment dredge along the planned traverse with a wire line from the edge of the surface water body
Document Vol II SC SAP Revision 0
Date January 17 1991 Page 34
3 Repeat sampling until 5 gallons of sediment have been collected and placed in the 5-gallon sample container The containers will then be sealed labelled and stored in a secure area until shipment to the laboratory
4 Decontaminate the sampling apparatusand drag line by scrubbing with methanol and distilled water rinses
S6 Record the following sedimentsampling informationin die project log book after
sample collection X nXx
Date and Time X gt Total Depth of Water Location and Volume of Sample Number of Grab Samples Collected to Form Composite Volume Sample Description Air Monitoring Levels Detected x X Other Observations
Barn
5-51 General
Sampling within the barn will4gteperformed with strict adherence to the following procedures A list of equipment requirements for the barn sampling program is provided in Table 9 Areas of the Site which have been determined by previous studies to have elevatedconcentrations of PCBs in soils (for example TWAs) will be avoided during bam sampling to reduce the likelihood of dispersing PCBs to other areas within the barnXEquipment will be decontaminated prior to use at each sampling location inside thetarn following strict decontamination procedures All sampling operations withfaMhe barn will be performed with Level C personnel protective equipment due to dust levels which may to exceed 1 mgm3 during sampling (see Appendix A) A detailed Health and Safety Plan which will be followed during barn sampling is provided in Appendix A
552 Barn Sampling Methods
If power is not available on-site a gasoline-powered generator capable of supplying electricity for lighting and sampling equipment will be positioned outside the fenced area of the site prior to sampling Extension cords will be run to the barn (avoiding TWAI) for power supply In order to reduce the potential for cross-contamination due to dust generation the sampling of different matrices will proceed in the
Document Vol II SC SAP Revision 0
Date January 17 1991 Page 35
following sequence 1) wipe samplingof non-porous debris 2)wood sampling of barn walls 3) dust sampling from top of floor slab 4) concrete sampling of floor slab Areas to be sampled will be chosen based on the presence of apparent oil-type staining and to obtainan even distributionof representative samples with no apparent staining
Following sampling at each location a self-sticking adhesive label marked with the sample number will be placed at the sample location for future reference Each label will then be located by taping relative to a reference point Established at the western corner of the barn (W-Z corner) as shown in Figure 5 Walls W and Z will be used as orthogonal axes similar to a typical coordinate system For samples collected above the concrete floor slab (eg wipe and wooden wall samples the height above the floor slab will also be recorded All samples willbe collected between the floor slab and a maximum height of seven feet All location measurements and a brief description of the area sampled will be recorded on the Barn Sampling Form (OCONNORFL13) provided in Appendix B Imaddition a photograph of each sampling location will be taken and^ recordedy on the Photograph Log (OCONNORFL6) Detailed procedures-for each type of sample to be collected during the barn sampling program follows
lt Win Samnlino N
1 Identify the non-porous item within the barn selected to be sampled which has an area of at least 100 cm2 which maybe wiped Examples include sheet metal fiberglass cleanly painted wooden surfaces glass etc
2 Place a decontaminated stainless steel or plastic 100 cm2 (10 cm X 10 cm) template at t^desired sampling location
Note For smaller areas such as on electric meters use the quarter template of 25 cm2 area and make four wipes to compose one sample
3 Remove the laboratory-supplied gauze from within the glassware with stainless steel forceps The gauze should be moist with solvent as prepared by the laboratory
4 While holding the appropriate template in place thoroughly swab the 100 cm2 area with the gauze using forceps or bufyl rubber gloves Inspect the area to ensure that all loose dust has been wiped with the Alter paper
Document Vol II SC SAP Revision 0
Date January 17 1991 Page 36
5 Fold the gauze over to ensure that the dust is contained on the inside of the gauze Place in the appropriate sample container seal label and store in a secure area until shipment to the laboratory
6 Decontaminate the forceps and templates by scrubbing with methanol rinsing with distilled water and wiping dry with paper towels
7 Label the sample location photograph and complete^he Barn Sampling Form
(see Appendix B) and other necessary documentation after each sample is
c o l l e c t e d lt X x x y x x
xWooden Wall Sampling X
1 Select the sampling area of at least 100 cm2 on the inside wall of the barn and secure a decontaminated 100cm2 template at the location Place a steel pan below the sampling area to catch sawdust ancLwood chips
2 Using an electric drill equipped withra-one-ineh diameter wood-boring bit drill out wood within the template area to arnaximum depth of 12 inch
3 Place sawdust and wood chips man appropriate sample container seal label and store in a secure area untiLsRipinent to the laboratory
4 Decontaminate the drilTbit and pan by scrubbing with methanol rinsing with distilled water and jwiping dry with paper towels
5 Label the samplelocatidn photograph and complete the Barn Sampling Form (see Appendix^)
Dust on Floor Slab Sampling
1 Select an area to sample such that at least 100 grams of dust or soil may be obtained This will vary depending on thickness of the dust or soil
2 Using a disposable nylon brush or stainlesssteel trowel brush or scrape dustsoil toward the center of the area chosen minimizing the creation of airborne dust
3 After the dustsoil has been centralized use a flat stainless steel trowel to collect the material and place in laboratory-supplied glassware seal and label
Document Vol II SC SAP Revision 0
Date January 17 1991 Page 37
4 Dispose of the nylon brush with other containerized PCB-waste materials and decontaminate the stainless steel trowelsby scrubbingwith methanol rinsingwith distilled water and wiping dry with paper towels
5 Label the sample location photograph and complete the Barn Sampling Form
Concrete Slab Sampling
1 Identify three areas of visible staining and one area of no visible staining on the floor slab Using a disposable nylon brush carefulfy brushxaway loose dust and soil from an approximately 1-square-foot area
2 Place a pre-cut 10-square-foot sheet of clean polyethylene sheeting with a 1shysquare foot hole cut in the center over thevsampling area and secure in place with duct tape Place a decontaminated lOO cmr template in the center where t h e s a m p l e i s t o b e o b t a i n e d X v N
3 Using an electric hammer drill eqi^pedwitlra^ungsten-carbide mortar bit drill the four corners established by the tempfate^to a maximum depth of 12 inch
4 Remove the template ancLdrilL the remaining 100 cm2 within the established square to a maximum dep^fof l2Jnch
-vFollowing drilling brush the concrete chips and dust from the plastic sheeting toward the center otlhe sarhplihggtarea Collect sample with a clean disposable nylon brush andtrowel and place in an appropriate sample container seal label and store in aSecure area until shipment to the laboratory
6 Dispose of the nylon oriish with other containerized PCB-contaminated waste materials and decontaminate the stainless steel trowel and template by scrubbing with methanol rinsing with distilled water and wiping dry with paper towels
7 Remove and dispose of the polyethylene sheeting and duct tape in an appropriately marked barrel that will remain on the site with other sampling waste disposal materials Label the samplinglocation photograph and complete the Barn Sampling Form
Document Vol II SC SAP Revision 0
Date January 17 1991 Page 38
6 SAMPLE HANDLING AND ANALYSIS
61 General
GEI has established a program of sample chain-of-custody that is followed during sample handling activities in both field and laboratory operations Thisvprogram is designed to assure that each sample is accounted for at all times To accomplish this objective sample container labels sampling records chain-of-custody records sample assignment forms shipping airbill records and laboratory receipt sheets must be completed by the appropriate sampling and laboratory personnel ^ y gt
62 Sample Labeling and Documentation gt
The plastic 5-gallon containers for bench-scale testingsWilKbe cleaned with methanol and distilled water rinses prior to use All other sample containers^will be pre-cleaned by EPA-approved methods and provided by the laboratory^ A summary of the sample containers and preservation requirements for each of thamp^analytieal parameters to be measured is shown in Table 10 Each piece of sample gl^sware^will be affixed with a self-sticking adhesive label Each label will contain the information described in Sections 4 and 5 of this document ^
To further document the samplingprogr^mand Sample handling procedures the project log book (OCONNORFL1) will containinformation regarding the activities on-site and sample handling In addition photographs of each type of field procedure will be taken The photographs will be representative of thetechniques employed throughout the sampling program A record ofeach photograph Will be made on the Photograph Log (OCONNORFL6) as stiown 4i^Appendix B
63 Chain-of-CustodySample^Assignment
Chain-of-custody will be maintained at all times as described in more detail in the Quality Assurance Project Plan (QAPP) A copy of the chain-of-custody form (OCONNORFL9) to be used is provided in Appendix B
In general the chain-of-custody record must be used such that it includes the following information
Document Vol II SC SAP Revision 0
Date January 17 1991 Page 39
Project name and number Names of the sampler(s) and person shipping the samples Station number or well identification Date and time the samples were collected Composited or grab sample designation Sample number (eg 1GU-90393-MW101A) Total number of containers Analysis requested Date and time the samples were delivered for shipping Names of those responsible for receiving the sampled at the laboratory
Prior to shipment of the samples a sample assignment form will be completed (see OCONNORFLIO in Appendix B) The sample assignmenrform will provide the contract laboratory sufficient information to process the samples and perform the appropriate analysis
The chain-of-custody record and sample assignment fornr will both be completed in duplicate in the field through the use of carbon paperT The original copy of the forms will be enclosed in a plastic bag and placed in the coolersWith the samples for shipment to the laboratory The carbon copy of the forms will be retained by GEL
VSoil samples for bench-scale testing ynH be-stored on site in a locked storage shed until samples are selected for the bench-scale7testing^ This decision will be made after receipt of the laboratory PCB analyses results and approval of the Source Control Work Plan by the EPA Soil samples not usecLfor bench-scale testing will remain in the locked storage shed and will be included with-other soil for treatment during the Remedial Action
lt v 64 Sample Shipments
Sample containers are generally packed in coolers for shipment Prior to packing organic analysis samples will be placed in plastic bags Bottles are to be packed tightly so that no motion is possible Styrofoam vermiculite and bubble pack are suitable for most instances Ice Will be placed in sealed plastic bags or ice packs in order to keep samples at 4degC at all times Samples will be protected against freezing during cold weather The original chain-of-custody and sample assignment forms will be sealed in plastic bags and placed in the cooler with the samples The cooler will be closed and a signed self-sticking label with the words Custody Seal will placed between the body of the cooler and the cover The cover will then be sealed with clear tape Samples will be shipped so that they are received by the laboratory no later than 60 hours from the time of sample collection
Document Vol II SC SAP Revision 0
Date January 17 1991 Page 40
All shipping of samples will be done through Federal Express or equivalent overnight delivery service Samples will be shipped in accordance with Department of Transportation (DOT) regulations If prompt arrival of the samples cannot be guaranteed the samplers will be responsible for proper storage of the samples until adequate transportation arrangements can be made The laboratory will be notified prior to shipment to arrange for receiving the samples and to prepare for the analyses requested Based on the low concentrations of chemicals detected during previous studies theSamples will be classified as environmental samples The air bill for the samples will speeiiythat the contents of the cooler are environmental or hazardoussamples as appropriated When samples are received by the laboratory they will notify the Task Manager of theccondition of the samples
H craTrsi
TABLE 1 - SOIL SAMPLING SCHEDULE Field Sampling Plan OConnor Co Site Augusta Maine
DEPTH APPROXIMATE BELOW ANTICIPATED
SAMPLE NUMBER SAMPLE GROUND PCS GENERAL LOCATION OF ELEVATION SURFACE CONCENTRATION SOIL
ID SAMPLES (MSL) (PPm) TYPE COMMENTS
TP1 2175 25 ND ClaySandy Till Confirm contours 215 35 ND
TP2 217 15 50 ClaySandy Till Confirm contours TP3 212 ND Siltv Clav Confirm horizontal extent toward marsh TP4 211 5-50 Clav Obtain bench scale 20-50 ppm
TP5 213 50-500 Clay Confirm lateral extent
TP6 215 15 5-50 Fill Obtain bench test sample In 1-10 ppm
TP7 210 35 0-5 Siltv Fine Sand Confirm vertical extent in drainage area
217 3 0-5 FillClay Confirm contours TP8 219 1 0-5 TP9 207 35 0-5 Siltv Fine Sand Confirm vertical extent In drainage area
TP10 1175 15 50-5000 Fill Bench scale test sample 50 to 500 ppm
TP11 218 0-5 SandClay Confirm horizontal extent toward marsh
TP12 218 0-5 SandPay Confirm horizontal extent toward marsh
TP13 221 5-50 Clav Bench-scale test sample 10-20 ppm
TP14 206 0-5 Gray Silty Clay Confirm vertical extent
TP15 200 0-5 Gray Silty Clay Confirm vertical extent
TP16 2185 15 5-50 Clay Bench-scale test sample 1-10 ppm
228 4 TP17 230 2 Confirm contouring in north end of site
231 4 TP18 233 2 Confirm contourtng in north end of site
236 4 TP19 238 2 Confirm contouring in north end Of site
Project 90393 GEI Consultants Inc Page 1 of 2 March 28 1991
SAMPLE NUMBER LOCATION OF
SAMPLES
TP20 TP21 TP22 TP23
TP24 TP25
B1
B2
1 B3 2
B4
B5
ND = Not Detected
TABLE 1
APPROXIMATE SAMPLE
ELEVATION MSLJ
231 233
2275 237 237 235 236 222 210 215 210 215
215 220
218 220 220 222
- SOIL SAMPLING SCHEDULE Field Sampling Plan OConnor Co Site Augusta Maine
DHTH BELOW
GROUND SURFACE
4 2
15
2 1
8 3 8 3
12 6
8 6 6 4
ANTICIPATED PC8
CONCENTRATION
ND ND 0-5
500-5000 5-50
50-5000 0-5
50-500
0-5 50-500
0-5 0-5 0-5 0-5
GENERAL SOIL TYPE
Clavev Silt Silty Clay
Clay
Till or Clay
Till or Clay
Gray Silt
Gray Clavev Silt
Gray Clayey Silt
i
Confirm contouring in north end of site Confirm contours Confirm contours Confirm contours
Confirm contours Bench scale sample 50-500 ppm
Confirm contouring and vertical extent
Confirm Contouring and vertical extent
Confirm contours and vertical extent
Confirm contours and vertical extent
Confirm contours
Project 90393 GEI Consultants Inc Page 2 of 2 March 28 1991
TABLE 2 SOIL ANALYSIS PROGRAM Field Sampling Plan OConnor Co Site Augusta Maine
Sample Depth
Sample Location ID
SoB Sample Number
(ft below ground surface) Lead cPAHs PCBs
pH TOC CEC
Anatyticsd Level IV
TEST PITS TP1 SS1 TP2 SS1 15
SS2 35 TP3 SS1 TP4 SSI
SS2 TP5 SSI TP6 SS1 15
SS2 15 TP7 SS2 35 TP8 SSI
SS2 TP9 SSI 35
replicate of SS2 SSI
TP10 SS1 15 SS2 15
TP11 SSI TP12 SSI TP13 SS1
SS2 TP14 SS1 TP15 SS1
replicate of SS2 SS1
TP16 551 15 552 15
TP17 551 552
TP18 551 552
TP19 551 552
TP20 551 552
TP21 SS1 15 TP22 SS1
Project 90393 GEI Consultants Inc Page 1 of 2 March 281991
TABLE 2 SOIL ANALYSIS PROGRAM Field Sampling Plan OConnor Co Site Augusta Maine
Sample Depth
Sample Location ID
SoB Sample Number
(ft below ground surface) Lead cPAHs PCBs
pHTOC CEC
Analytical Level IV
Bench Scale
Sample
replicate of SS2 SS1
TP23 SS1 TP24 SS1
SS2 TP25 SSI
SS2 BORINGS
B1 SS1 SS2
B2 SS1 SS2
B3 SS1 6 replicate of
SS2 SS1 SS3 12
B4 551 552
B5 551 552
QUALITY CONTROL TP26-TP29
(trip blank) SS1-SS4 TP30-TP33 (shovel or
hand trowel SS1-SS4 blank)
TP34-TP37 (split-spoon
blank) SS1-SS4 TOTAL
ANALYSES 40 40 64 15 12
TOC - Total Oraanic Carbon CEC - Cation Exchange Capacity
Will be designated to the laboratory as matrix spikematrix spike duplicate
Additional trip blanks may be needed to ensure one trip blank per cooler
Project 90393 GEI Consultants Inc Page 2 of 2 March 281991
TABLE 3 SEDIMENT ANALYSIS PROGRAM Field Sampling Plan OConnor Company Site Augusta Maine
PH Bench Sample TOC Analytical Scale
Sample Location Number Lead cPAHs PCBs CEC Level IV Sample
Surface Water Body
SED1
SED2
SED3Upland Marsh (UM) SED4
SED5
SED6
SED1
SED2Upper Lagoon (UL)
SED3
SED4
Lower Lagoon (LL) SED1
SED2
SED3
SED7 (trip blank)
SED8Quality Control (dredge
blank)
SED9 (tube
samples blank)
Total Analyses 11 11 16
TOC - Total Organic Carbon CEC - Cation Exchange Capacity
UL SED2 is a replicate sample of UL SED1
Will be designated to the laboratory as matrix spikematrix spike duplicate
Additional trip blanks may be needed to ensure one trip blank per cooler
Project 90393 GEI Consultants Inc March 281991
TABLE 4 - SURFACE WATER ANALYSIS PROGRAM Field Sampling Plan OConnor Co Site Augusta Maine
SAMPLE SAMPLE LOCATION NUMBER Lead Aluminum PCBs
Upland SW1 X X X Marsh (UM) SW2 X X X
Upper SW1 X X X Lagoon (UL) SW2 X X X
SW3 X X X
Lower SW1 X X X Lagoon (LL) SW2 X X X
Quality Control Samples
Trip Blank SW4
Sampler Blank SW5
TOTAL ANALYSES
TSD - Total Suspended Solids
SW2 is a duplicate of SW1
Will be designated to the laboratory as matrix spikematrix spike duplicate
Additional trip blanks may be needed to ensure one trip blank per cooler
Project 90393 GEI Consultants Inc Page 1 of 1 March 28 1991
TABLE 5 - BARN SAMPLING ANALYSIS PROGRAM Field Sampling Plan OConnor Co Site Augusta Maine
SAMPLE MATRIX PCBS CPAHS Lead
Analytical Level IV
Wipe samples PTB (trip blank) PEB (equipment blank)
12 3 3
Wooden wall samples 10 10 10
Dustsoil on floor slab
Concrete slab
Total Analyses 36 18 18
Additional trip blanks may be needed to ensure one trip blank per cooler
One sample will be designated to the laboratory as a matrix spikematrix spike duplicate
Project 90393 GEI Consultants Inc Page 1 of 1 March 281991
TABLE 6 - SOIL SAMPLING EQUIPMENT REQUIREMENTS Field Sampling Plan OConnor Co Site Augusta Maine
Safety Equipment (Level C - Dermal)
Health and Safety Plan (copy) Portable Photoionization Detector (HNu) Hand-held Aerosol Monitor (HAM) Disposable Tyvek Coveralls Tyvek Hoods Duct Tape Safety Goggles Safety Boots Surgical Gloves Butyl Sampling Gloves n gt Rubber Boots or DisposableBooties Hard Hats (when near qverhead objects)
Safety Equipment (Level C - Respiratory)
Sampling and Measuring Equipment
Other
Full-face Respirators Combined Organic Vapor and
High-efficientcy particulate Cartridges Dust Prefilters
Level and Rod Measuring^Tape Stainless -SteeLShovels Stainless Stee^T rowels 165-foot Measuring Tape Methanol V
Distilled Water Paper Towels
SafopltngjSlassware (See Table 10) xCo6lers with Ice or Ice Pack
Clear Plastic Tape Re-sealable Plastic Bags
Gallon Drums
ite Maps Project Log Books Marking Pens Camera Photograph Log Forms Test Pit Log Forms Boring Log Forms Chain-of-Custody Forms Sample Assignment Forms Equipment Calibration Logs Extra Bottle Labels Spare AA Batteries for Meters Blank Federal Express Airbills
Project 90393 GEI Consultants Inc Page 1 of 1 January 171991
TABLE 7 - SEDIMENT SAMPLING EQUIPMENT REQUIREMENTS Field Sampling Plan OConnor Co Site Augusta Maine
Safety Equipment (Level C - Dermal)
Safety Equipment (Level C - Respiratory)
Sampling and Measuring Equipment
Other
GEI Consultants Inc
Health and Safety Plan (copy) Portable Photoionization Detector (HNu) Hand-held Aerosol Monitor (HAM) Disposable Tyvek Coveralls Tyvek Hoods Duct Tape Floatation Vest Inflatable Boat Safety Goggles Safety Boots Surgical Gloves Butyl Sampling Gloves Rubber Boots or Disposable obties Hard Hats (when near overheackobjepts)
V Full-face Respirators Combined Organic Vaporand
High-efficiencyHPartjculate Cartridges Dust Prefilters
Level andRod Measuring Tapp 165-foot MPasuririgTape Methanol V Distilled Water jper tpwels V
SjE(mplinsect~Glassware (See Table 10) Cdolbrs wlthjbe or Ice Pack
Clear Plastic Tape Re-sealable Plastic Bags
-Galloh Drums fghted Measuring Tape e Sediment Sampler dge Sediment Sampler
Site Maps Project Log Books Marking Pens Camera Photograph Log Forms Chain-of-Custody Forms Sample Assignment Forms Equipment Calibration Logs Extra Bottle Labels Spare AA Batteries for Meters Blank Federal Express Airbills
Project 90393 Page 1 of 1 January 17 1991
TABLE 8 - SURFACE WATER SAMPLING EQUIPMENT REQUIREMENTS Field Sampling Plan OConnor Co Site Augusta Maine
Safety Equipment (Level C - Dermal)
Safety Equipment (Level C - Respiratory)
Sampling and Measuring Equipment
Health and Safety Plan (copy) Portable Photoionization Detector (HNu) Hand-held Aerosol Monitor (HAM) Disposable Tyvek Coveralls Floatation Vest Inflatable Boat Tyvek Hoods Duct Tape Safety Goggles Safety Boots Surgical Gloves Butyl Sampling Gloves Rubber Boots or Disposable Booties Hard Hats (when nearOverhead objects)
w Full-face Respirators Combined OrganicVaporand
High-efficiency Particulate Cartridges Dust Pi
Level and Rod
Measuring Tape M3amp-foot Measuring Tape JsopropyhAlcohol Mbthanol DistlHed Water PaperTowels Sampling Glassware (See Table 6)
oolers with Ice or Ice Pack tear Plastic Tape
Re-sealable Plastic Bags 55-Gallon Drums Weighted Measuring Tape Kenmerer Sampler Disposable 045 Micron Field Filters Pressure Pump for Field Filtering pH Meter with Temperature Probe Cole-Parmer pH-40 70 Calibration Solutions Cole-Parmer 1413 Micromhoscm Calibration Solution
Project 90393 GEI Consultants Inc Page 1 of 2 January 171991
TABLE 8 - SURFACE WATER SAMPLING EQUIPMENT REQUIREMENTS Field Sampling Plan OConnor Co Site Augusta Maine
Other Site Maps Project Log Books Marking Pens Camera Photograph Log Forms Chain-of-Custody Forms Sample Assignment Forms Equipment Calibration Logs lt Extra Bottle Labels Spare AA Batteries forM6ters Blank Federal Express Airbills Xy
Project 90393 GEI Consultants Inc Page 2 of 2 January 171991
TABLE 9 - BARN SAMPLING EQUIPMENT REQUIREMENTS Field Sampling Plan OConnor Co Site Augusta Maine
Safety Equipment (Level C - Dermal)
Safety Equipment (Level C - Respiratory)
Sampling and Measuring Equipment
Other
Health and Safety Plan (copy) Portable Photoionization Detector (HNu) Hand-held Aerosol Monitor (HAM) Disposable Tyvek Coveralls Floatation Vest Tyvek Hoods Duct Tape Safety Goggles Safety Boots Surgical Gloves Butyl Sampling Gloves Rubber Boots or Disposable Bboties Hard Hats (when near overheackpbjects)
Full-face Respirators Combined OrganicVapor and
High-efficiencyParticutale Cartridges Dust Prefilters
Gas powered electrfcgenerator 5 gallonsgaspline 350 feetNplectricahextfnsion cord Self-standin^work-larnps (200 watts minimum) Electric 38drilkwith two 1-inch wood boring bits ElectricBoschhammer drillwtungsten-carbidemortar bit Hpound-cut polyethylene sheeting and duct tape
Steel blaRing sheet X^vdiSpdsabfe nylon brushes
Stainless steel trowels Three 100 cm templates andone 25 cm template Forceps Peper towels Silf-sticking adhesive labels and push pins
Site Maps Project Log Books Marking Pens Camera Photograph Log Forms Bam Sampling Forms Chain-of-Custody Forms Sample Assignment Forms Equipment Calibration Logs Extra Bottle Labels Spare AA Batteries for Meters Blank Federal Express Airbills
Project 90393 GEI Consultants Inc Page 1 of 1 January 171991
TABLE 10 - SAMPLE CONTAINERS AND PRESERVATION REQUIREMENTS Field Sampling Plan OConnor Co Site Augusta Maine
Holding Media Parameter Container Preservation Time
PCBs 8 oz glass jar 4deg C 14 days-with Teflon- extraction lined lid 40 days shy
analysis
cPAHs 8 oz glass jar 4deg C 14 days-SOIL with Teflon- extractionSEDIMENT lined lid 40 days shyWOOD
analysisCONCRETE AND WIPE Lead 8 oz glass jar 4deg C 6 months SAMPLES with Teflon-
lined lid
Bench-scale 5 gallon high NA NA testing density
polyethylene bucket
PCBs Two 1-liter 4deg C 7 days shyamber glass extraction bottles 40 days shy
SURFACE analysis WATER
Lead 500mi HN03 4deg C 6 monthsSAMPLES polyethylene to pH bottle lt20
Aluminum 500ml HN03 4deg C 6 months polyethylene to pH bottle lt20
NOTE All standard sample containers will be l-CHEM equivalent bottles supplied by the laboratory The 5-gallon polyethylene bucket will be rinsed with methanol and distilled water prior to use
NA = Not applicable
Project 90393 GEI Consultants Inc March 28 1991
gt 1I L )
i bullbullbull j bullgti sil- j-V
poundP
A C
jfr35
QUAOnANQLE LOCATIONTOOU9 POND MAINEJI881)N4416-W37-307B
bull4000 FEET
Central Maine Power Company Pre-Design Work Plans SITE Augusta Maine OConnor Site LOCATIONFrom EC Jordon Co RIFS
Augusta Maine MAPReport dated June 1989
C D Project 90393 January 1991 Fig 1 G E I C o n s u l t a n t s I n c
b-r
p pp l-I 0 x foooo^ _^_ZZZ~~r^-^
UpoundEtpound 1IMA iRAMWOfMII NOW AM A OAAMAG IWAllrj WWEOfOHAMMS MHICUOn Central Maine Power Company Pre-Design Work Plans LOCAIION Oh
in cuelt^KL2 Augusta Maine OConnor Site TRANSFORMER
Scale 1 inch = 142 feet Augusta Maine WORK AREAS AND SWALESFrom EC Jordon Co RIFS
Report dated June 1989 C D G E I C o n s u l t a n t s I n c Prnjprf QfttM January 1QQ1 Fifl 0
~- bull middot bull -middot r middot~middotmiddotmiddotIll middotmiddot t~r
I bull Imiddot
bull bull1 middotmiddot middotir-------~-------middot ~ bull middot middot-------------------middotmiddot ~ middotmiddotmiddotamiddot A middotimiddot r bull amiddot A I bull TWA I tmiddot LOW AREA A NO~TH) SOUTH) I
v
A middot
rmiddot---middot---middot~middot---- ----middot~middot [WEST) [W[ST) (EASr) middot I
middot middot middotmiddot AmiddotA D-D 220 SCRAP ARf-A 201 -
bull - I
nor 140 TWA I 2bull0
1 bull middotbullmiddot1~-~~ L~W AR1-A ---- middot-~ l0 ~
i r bull I -$-~middot
0 - )1 _~ ~ middot1~oi I EEltY
J I ~2J~ bullbull
bullf()omiddot middotmiddot middot~ bull0 2 i- 0
11bull I lo bull ~middotmiddotmiddot~middot ~ ~--middotmiddot~middotbull ~-8~-i~~jplusmny~f~=ii1 - ~ bull ___ I I- _5 middot~bull-tmiddoti~middot~ N ~ bullbull ~ i I o middot TP19 gt - ~ ~ Jmiddot ~I middot~middot~I bullJUI 215 middot 215~-I e bull TP23 if 21~ ~ middot middot middot_ ------ ~middot - L middot~ ~ ~~ 1 i i
235 middotQ1middot1middotmiddot ~ bullbull ~~middot~middot- Lil middot~ _~ middot f bulllto --- z middotmiddot middot
middotr
-lt lt -middot I ~ middot ~ I
1 c ~ __ ) bull bull bullmiddot bull --middot Q
middot bull bullbull - 1middotmiddot - bullbull ~middots middot- uPPfR 1middotmiddot T LAGOON 1middot middot -$- middot middotmiddotpoundpound~middotmiddotmiddotmiddotmiddot bull =lt middot
~ middot ~~ iP22 gt middotgt
w
210 I
-
------_7___ 210 1 _
w_ +-
middot middot w--~ J210 middot i~30 -- middot_
1 TP18 bull middotmiddotI middot~ ----shy middot-middotmiddot
middot~ I j
middot- t - I 1 I BEDROCK 11 I
1
lmiddotmiddotomiddotmiddotmiddotmiddotmiddot middot middot middot =middot _middotmiddot middotmiddotmiddotmiddot 1 I rI Th 205 bull 205
bull -middotmiddot bull_ 1 225 22 middot bullbullbull fltISmiddot middot middot ~ ~middot f4tmiddotmiddotmiddot I J205 1bull
middot OOTR10U1t0N craquo-middotPC~middot~oN~A~ SEL11r~~~TS H LO~ AR~A ------------------------------------------------bull1 BASEO IN PART ON QBSERVATION Of FILL PlACEMENTmiddot bullmiddot E~middot-1middot bull bullbullbull middotmiddot Q - _
_
-1 I
fmiddot bull bull
-middotmiddot I r-middot shy c bull
I omiddotmiddot
r- middotmiddotI ~I
1 middot1 r bull bullf-Sf1 TWA I middotbull middot ~ i1 bull bull middot (EASfJbullI middot-----bullI (WEST) middotI bull I 1I cmiddot middot~ I~ ~ I bull bullbullbullI 1bullbull
(EAST) - bull middot- - I
bull bull r ~middot l
~
~30 i
2io bull
middot) Ibullbull
I
- J l TPl7 bull- f ~j -middot middotmiddotmiddotmiddot I 1 J middotmiddot1
middot~ ~ bull middotimiddotmiddotch bull bull_ t-ROAOI cli middot bull ~ middot1middot
225
I bull ILmiddot i~A--middot1middot 225 bull
1225 middot I ~ CENTRAL DRAINAGE middotmiddotmiddot--Q-middot --middot _ --middot
~ I -- -shy A middot
bull B-B --- m
- _ - middoti-- 10bull ~ m
g r
220 220 I ~
I middot _
l MI r ~ I
middot middot 1bull bull1 111
I rbull bull
middot
bull bull l
215 BEOROC~ 215
bull I bull middot - -
) l
-middotshy- bull Il
I 5 -middot middot middottc bull bull gt f bull 110 1~ w 210 210 ~ middotmiddotmiddotmiddotmiddot middot-middot -
( bull
middotlt bull [ I
bull G -
-middot-
middot middotmiddot bull ~middot-middot-- -middot- t~middotmiddotmiddotmiddotmiddotmiddot middotmiddot middot L -middot 1 -middot~ bull bull - middotmiddot L middot-~ _ bull f middot middot1 I ~ l
205 bull bull ~middot JO~cmiddotimiddotmiddotmiddotmiddot middot--middotmiddotmiddot1 _~ middotmiddotmiddotmiddotmiddot middotmiddotmiddotmiddotmiddotmiddot bullI bull middot -middotmiddotmiddotmiddotmiddotmiddotg
bull -$-middotmiddotmiddot middot~middot iii~~- ~0 i TB-20 SUBSURFACE BORING NUMBER bull bull bull TPmiddot 105 TEST PIT NUMBER
middot
bull1
bull I TP16 middotmiddotmiddotmiddotmiddot~ Q G) ) mmiddot i GROUND SURFACEmiddot bull 1bull 1middot bull I i ~ u o I bullbullbull I~ bullbullbull bullbullbullbullbullbullbullbullbullbullbullbull bullbullbullbullbullbullbullbullbullbull bull middot bull
ll bull bullbullbull middotmiddotoz bull I 250 CONCENTRATION OF PCBs IN SCREENED SAMPLE lPPm) r lt bull bull I
middot CONCENTRATION CONTOUR middot middot bull - -- CROSS-SECTIONS CONTOURED AT 5ppm 50ppm ANO 500 ppm TOTAL PCBs
middotbull middotmiddot c- I bull ~~ ND NOT DElECTED -middot ~ I
middotmiddot middot--middot~ middot sect t I middot UNDERLINED VALUES ARE CLP RESULTS (ppm)bull
middot -____ bull ~~ - -- I
bull bull middot -middot middot bull Ibullbull middot ~- middot --- LEGEND (ISOPACH MAP) bull lmiddot I l
I
-middot 1 middot I
bull middot ~SUBSURFACE EJORING LOCATION middot
-t middot ( 10766 - 10 10186) middot middot J BORING NUMBER -2 middot THICKNESS OF SOIL CONTAINING PCBs IN EXCESS OF 5 ppm
I
bull ~ middot
LOW AREA BORING LOCTION (107187)
- I j
I
bull BORING LETTER - ~ THlC~NESS OF SOIL C011TAINING PCBs IN EXCESS oF Sppm middot middot middot middottmiddot=plusmn+ TEStPIT LOCATION 1 bull bull bullbullbull i 0~ Q G) I -$ ELECTRICAL EQUIPMENT SAMPLE POINl middot middot -middot bull 1-1 I ~ bull
If bull bull ) bullbull bullbullbullbullbullbullbullbullbullbull f4( middot~01 l - bullmiddotomiddot
middot - ( ~-~ SURFICIAL EXTENT OF SOILS CONTAINING gtSppm PCBs bull middot (
bull __ ~ -middot middot_ middotmiddotmiddotmiddotmiddotmiddotmiddotmiddot _ - middotmiddot --- bull bull -bull - ISOPACH LINE ILLUSTRATING THICKNESS OF SOILS CONTAMINATED BY middot middot middot -middot~middotmiddotbullmiddotmiddotmiddot middotmiddotmiddot bullbull middot middot bull middotmiddot middot 8 -- bull _CONTOURS [)RAWN _-- ~ _l bull abull lO_fEF lran_~OUllCStRF~CI gt~~~~ ~~~~bull
I bull middot T o o bull bull middot middotmiddot
) NOTES 1 -middot -middot bull
I1 THE ISOPACH CONTOURS WEREDRAWN TO DENOTE THE THICKNESS OF SOIL ~ Q iP1 middot 0 bullbull 5 bull GEi BORING LOCATIONS middotMEASURED FROM THE SURFACE CONTAMINATED BY GREATER THAN 5ppm TOTAL PCBs bullbull bull bull I THE VALUE OF 5ppm WAS CHOSEN ARBITRARILY AND IS NOT INTENDED TO REPRESENT
middot bullv middot-- - l A SITE-SPECIFIC CLEAN-UP LEVEJ GEi TEST PIT LOCATIONS
2 CRO~S-SECTIONS ILLUSTRAt EXTENT OF PCB CONTAMINATION WITH DEPTH I middot- -f j bull I
_ veRTt6l1 EXAGGEP1r10M m c~oss sicT1c~S 1s 61 middot
bull
middot
I middotshy1
middot J~uJt bull bull i ~ ~ _ - middot j
1 ~ middot bull bull bull middotmiddot l a )
0 gt bullmiddot -~I middotbull I 0 middot r middot- bull ibull I
bull
_ _ I I ~
middot I
bull bull
bull middot~r
- -middot- - -
bullI l middotI middot I bull r f I I
~_ Igt bull
bull f middot
t bull middot bullbull 8 _
~ 7 I r 9
-middot- bull bull I I ~
middot 1
bull ____________________________ ___ _ bull I
bullI 1 bull middot -~ bullr
---------r- -- -- middot~-~~~~middot--middot ~ f middoti middot
bull t ~
bull
middot j
1
-------- -------- ---------------------------- ti 1
bull ~---middot ------middot ~---middotmiddotmiddotmiddot-middot--middot-middot~---middot-- ___~------- middotmiddotmiddot middot middotrbull ~ ~--~~-~middot-~ 1 middotmiddotmiddot I
middot bull middot4J middotmiddot 1 middot
middotI 1
I
bull
bull
middot ~ middotimiddot 1 bull j-1 ~ bullbull bull I bull i ~
APPROXIMATE SCALE I DESIGNED
~ BY
bullIbull Imiddot bull SOURCEmiddot EC JORDON CO RlFS middot bull Central Maine Power Company Pre-Design Work Plans SOIL I ~ t
middot
middot bullmiddot I ~middotmiddot ( bull bull REPORT DATED JUNE 1989 bullL bullr middotmiddot bull ~I middotmiddot DRAWN BY I I bull 1 r bull ~ middotmiddot middot
bull r shy~middot r i Augusta Maine OConnor Site bull SAMPLING I Imiddot 0 middot bull
bullI
bull bull
r bull 40 80
J 1bullmiddot
CHECKED BY Augusta Maine middotLOCATIONS
h cf I ~ 1bull rmiddot_
1 Inch =~Feet t--~------~---_middotmiddot~ I ~middot bullgtIbull
) i _- DATE January1991 middot middot middotmiddotmiddot tbull middot1middotmiddot APPROVED BY GE I Consultants Inc
middot
middotmiddot middot t---P-R_O_J-EC_T_9_0_39-3-----4-S-H-E-ETmiddotmiddotOfFbull t DATE REVISION BYmiddotmiddot J middotFlg3 middot
1 nuovN( POST middot 1 Nl6~1 middot bullbull Ibull Ibull bull bull lomiddot bullbull -
I
I
I
------------ -
) bull middot i bull I
~ f I middot1 bull ~I r
I
middot
-middot- CJ middotYmiddotmiddot I
C bull
middot
I middot I
middot -shy bull bull middotmiddot~
J middot _ bull y
Ibull bull
~ bull ~~ r I bull middot bull
middot bull
I ~ I I ( I bull
JI t
- I
J l I
-~ 1 I
bull j middot middot~ ~ middot) __-_ bull i
Ibull I lt bull
middotmiddotmiddot
gtImiddotmiddot
I
I bull
middotmiddotmiddotmiddot_v -
~ bull J i 1 bullbull
r 1 I ~ middotbull middotbull
I I I l~_middotgt~~bullI~~~bull~middotmiddot jbull1111 1 bull~ - 1 111 middot~ bull1 middot 1middot I jbull I bullI _- middotmiddot 1 1t1 _ 1 (Imiddot 1 bull1 1gt middot~middotlt~middot middot
I l bull bull 1 r I bull bull middot
bull middot middot middot middot~middot ~middot middot~
- J ~J ~~ O lt hj I bull ~ bull bull 1 o t I lbull I
middotmiddot bull ~ middot I bull middot bull bull
middot bull - I middot ~middot
bull 11 ( _ I
middot I Ii lfI ltI
bull
I 1- bull_ II ~ I middot
I bull vmiddotmiddot
30 I ~middot middot bull bull
lt 1 I ---middot _ bull I ~ bull bull ~ bull
II ~
111
bull bulll3 bull ~ middotmiddot bull Ibull 0 I 1 bull 111 bull bull I rbull1 middot 0 I I I - Ibullmiddot 1 bull r middot middot __ -
i bullmiddot ~ ----middot yen ~ bull ~ j
--~middot
I
I
- -- ( middotmiddot~middotmiddot- - bullbull~ _ ~- I ~ bull--- shymiddot ----bull
1- -
bullbull I I - ~ I I bull middot middot ~ I middot
1
---- _ --
bull1 II I j
I bullbullbullbull
II ~
J 1bull ~
I
bull I I bull I ~ middot Tmiddot I 1 ~ bull JI I t Ibull bull ~ bull middot
I -
-----~_ middot1
-1
~
bullbull
-
bullbull I
middot---- a I AiLWO _ middotshy
I
bull f l
I bullbull - middot I - bullbullbull
SVf1
S~D1- -0 sih3 0
I I 0 1 i ---shy (]
middot bullgt I
I J middot bull bull IIbull Iamp middot P I 177
r o ~ 0 SEol l-middot J~ I - -- ltl
f bull bull
gt1 bullI 1 V bull ~ II ~ tJ middot -middot-
I
middot1 - bull bull bull -middot
bullmiddot -bull wmiddot ~ ~ ~
bull IA1 gtW2 - gt1
- - ~ -
middotmiddotmiddot----- ~r=02 bull bullmiddot I __ i Ctt1rr--shy
bullI
Q bull _
1
D I bullbull middot - bull
SW2
I middot- bull
bullI ~middot
rl
~ se02 I bullbullbull I bullbull ~ L-lf L-- I
- ___ bull bull___ I bullbullbull
I bull ) I f IIUZ middot___ ---- bull cu bull
I gt
bullbull -shyI bull Ii bull f
~ middotmiddot~ ~ middot - I
I bull ~ ) I~ shy bullfmiddot~ ~ i ~ ~middot
~ I 1
bull 4 Ot f I
1 i f ~ bull lt
1
bull bull I
___ - ~)____ - ------~ -------middot-middot-r--middot-middot ----middot- - ---middot-middot-middot-middotbull
t t - -- a
I middot bull -- middot - __ __--~~~=--~---_-~= _ _ middot - I ii- - ~~=-=~==--=~middotmiddot-~=~~~~~~=-~~~======middot=middot~middot== middotmiddot-- _ - I
bull -------------------~_
t ~middot middot middot middotbull bull middot i------------1I Imiddot ~~f~=-~~J~i~~~f~U+--f~~~===~~-~~middot~f~=~=~=~~fi~-~-~==~~-==~==~~==~====~==~-=-==~=~=2~~~~~~~77=~=~=~~-=~s)middot==~~~--=-=~~~=~=~====-=====~~=~~~~~=~=~=~==~==-=~=~=middot
middot 7gt JloltGKLA lllD --- shy l lf-nt RT n bull middotl bull
I
-i~------ - -- -------- -- --= bull (
( ei -~ ---- -------- - - - - - bull - shyI bull middot 1 ------
--------~____-____ bull SSmiddotsmiddot~middot2-iJi_8plusmn~plusmn-~~plusmn=+=~==-=-==~~===~~~~~~=-=s~~2~-~s-==~~~z--==~=~~t-=-=-=-==-=---~34~~~-==-=-==-==~=middot==---~=-middot~i~middotmiddot~ middot)~ f ________bull _
~--- __ - ____ - bull shyI I
bull __ _ ~ ~ ~ middott1 middot_
J(J--_ 11bull middot ------deg gt
middot -f ~~~se~middot~ARm~OMAarra~PERfOAMagtBY 0 middot~ bullO ( l r
r-------------liDElmiNEiiiiY-r---Amiddot----------________---~-------------_____ __________middotmiddot_lIbull middotmiddotmiddot ACHERON ENOINEERINCI 8ERVJCED COMPLIED IU8lo BASll MAP
(middot VERIFIED TO MEET NATIONAL MAP ACCUAACI 8TANOARD8(NMJ) middot Tl1ROUQltATEaT GURVltY CONOUCIED Df JORDM 121aa LEG~ APPROXJMATESCALE DESIGNED BY
-----------_ ---------~ CentralMalnePowerCompany p D W kPI middotSURFACEWATERANDmiddotmiddot_-~middotmiddot~~~middotFitow~middot~(TOO~MEETNMAamp DRAwN BY re- es1gn or ans middot middot middot shy bull bull bull - bull
bull Aug~sta Maine OConnor Sitamiddot SEDIMENT SAMPLING middot3middot~~~middot~--~~amCla~~~~~~usa-o middot O GEISEDIMEITTSAMPUN~LOCATI~Ns o 40 middot 80 1
BY LOCATIONS ~middot)~middot ~ bull 11i GEISURFACEWATERSAMPUNGLOCATIONS middot CHECKE
rh A~gustaMalne lt middotmiddot( middotmiddot 11nch-40Feet DATEmiddot January 1991
middot APPRovED BY -V GEi Consultants Inc ~ Imiddotgtmiddotgt middotmiddot middot middot souRCE EC JORDON co RlFS bull middot GEi COMPOSITE SEDIMENT SAMPLE bull DATE REVISION BY - PROJECT 90393 SHEET OF middotI middotmiddot middotI middotAEPORTDATEDJUNE1989 v COUECTEDFORBENCH-SCAIETESTING
I J ~ I
i I bull I )__ )
I I ilo I Ibull
X -4 mdashmdash-0shy
W A Elec-Zl lt4W
Meters Shelves ^ Pickup
A CapAntique a)
W WAutomobile W J
ia iW Y
W A o
LEGEND C w
Stove - wBoat X Designated Wall Label w
-e- -fr bulleshybull Cement SlabDust Sample
0 Wooden Wall Sample ZTaping Reference Origin
W Wipe Sample
Approximate Scale
NOTES 30 Feet
1 Ail locations on this plan are approximate
2 Sample locations are general Central Maine Power Company Pre-Design Work Hans EXAMPLE examples of the type of sampling Augusta Maine OConnor Site BARN SAMPLINGand the distribution Augusta Maine LOCATIONS
3 Revision No 1 (3-28-91) ltP G E I C o n s u l t a n t s I n c Project 90393336 January 1990 Fig 5
I I I I
I
I I
I
I
I
I
I
Document VoL II SC SAP Appendix A Revision 0
Date January 171991 Page 1
V
APPENDIX A zgt
s HEALTH AND SAFETY-PLAN
Source Control PrampDesign Studies CConnorCO^Site
Augusta Mkine shy_ lt
lt
NT lt
Document Vol II SC SAP Appendix A Revision 0
Date January 171991 Page 2
GEI CONSULTANTS INC SITE HEALTH AND SAFETY PLAN
Site Name OConnor Co Site
Site address Street Route 17 Qty Augusta State Maine
Proposed Site Activities Source Controlsampling of surface andsubsurface soilssediments surface water and the on-site barn
Proposed Date of Work April 1991 gt S
Original Safety Plan YES
Site Safety Coordinator Thomas S Bobowski
Client Central Maine Power Company^(CMP)
Site Contact Charles Nickerson (CMP)
Team PERSONNEL ^ IRESPONSIBILITIES Robert E Stetkar lt ^mjectManager Joanne O Morin Work Tlans and Pre-Design Studies Manager Richard F Murdock Qhality Assurance Officer Benjamin YSu Treatability Studies Manager Joseph G Engels Technical Consultant Steven R fcambx Source Control Sampling Task Manager Thomas S Bobowski7 Barn Sampling Coordinator Sampling Boyd P Smith Sampling Christopher L Covel Sampling William J Haswell Sampling Charles Blodgett Field Screening Analytical
Background Information
The OConnor Co Site (Site) covers approximately a 9-acre portion of a 65-acre parcel within the city limits of Augusta Maine The Site is surrounded by sparsely-developed residential or agricultural properties or undeveloped woods and wetlands (Riggs Brook and associated wetlands border the Site to the east) The F OConnor Co operated a transformer stripping and recycling operation on theSite from the1950s through the 1970s
Document VoL II SC SAP Appendix A Revision 0
Date January 171991 Page 3
During operations releases of wastes including PCB-laden oils resulted in contamination of water and soil on the site Principal features of the Site include a barn which formerly housed scrap operations an upland marsh formed by man-made disruption of natural surface water drainage upper and lower surfacewater impoundments (lagoons) constructed to control migration of oils from the Site a low area where excavated lagoon sediments were deposited within a clay liner three former transformer work areas a former scrap yard and a wetland associated with Riggs Brook A site plan depicting some of the major features of the site is shown in Figure HS-1
Ax In 1986 and 1987 remedial investigations were performed byECvJdrdan Co for Central Maine Power Company (CMP) These investigations included over^OQ soil samples 11 monitoring wells and analysesof surface water ground water sediment and biota for PCBs organic and inorganic chemicals The primary contaminantsdetected in soil and sediments at the Site were PCBs PAHs and Lead Chlorinated benzenes PCBs phthalates and to a lesser extent volatile organics and metals were detected in ground water and PCBs and metals were detected in surface water Using these data Clement AssociatesInc performed an Endangerment Assessment in 1988 for EPA^evaluating risks to human health and the environment associated with existing condiuoi^ra^Tuture conditions related to a noshyaction remedial alternative In 1989 EC JordabCoi acting as consultant to CMP completed a Feasibility Study which evaluated remedial alternatives based on information provided in their earlier Remedial Investigation Report and in the EPA Risk Assessment Report After receipt of the Feasibility^Stiidy Report EPA issued a Record of Decision (ROD) in September 1989 describihg the^EPA^elected remedial alternatives for source control and management of migration
Site Status Waste Types
Includes the followin
Ground water Surface water Sediment Soils On-site structures
Refer to Table1for listing of chemicals of concern during Source Control studies per media sampled
Document VoL H SC SAP Appendix A Revision 0
Date January 171991 Page 4
Hazard Evaluation
Known orSuspected HazardousToxicMaterials Polychlorinated biphenyls (PCBs)volatile organic compounds (VOCs) polycyclic aromatic hydrocarbons (PAHs) and metals (especially Lead) The ranges of concentrations of chemicals detected in all source control media on-site are presented in the attached Tables 1C through 1L from previous studies Concentrations of PCBs PAHs and Lead detected in surficial soikduring previous studies (including the on-site Barn) are shown in Figures HS-2 HS^3 and HS-4 respectively Concentrations of chemicals detected in surface water and sediihentsduring previousstudies are shown in Figure HS-5 lt( x
The primary concern at the Site is contamination of surface soils by spillage or leakage of transformer oils containing PCBs The potential forencountering concentrated wastes in the transformer work areas (TWA I TWA II andltTWAIlI) is high In addition wastes have also been identified in soils and sediments associatedwith the lagoons and drainage swales Within a short distance of these discrete areas of the site the potential for encountering significant concentrations of wastes-is low ToYeduce the likelihood of being exposed by wastes associated with these areasduring~source control sampling activities efforts should be made to avoid walking unnecessgrilyriiv these areas
Exposure to hazards from chemiealsduiing test plying and environmental sampling and analysis tasks are most likely to occurbyone-or more of the following
1 Direct contact with contaminated surficial and subsurface soils sediments or surface-water x N
mdashN2 Inhalation of fu^Uve^ust carrying contaminants
3 Inhalation of volatile orgsuuc compound vapors while test pitting or sampling the various media on-site
Toxic and Pharmacological Effects Refer to the NIOSH Guide to Chemical Hazard Table 2 lists the major chemicals of concern and their toxic and pharmacological effects Acute exposure to PCBs PAHs Lead and VOCs may result in dizziness or nausea The results of chronic exposure may include but are not limited to central nervous system depression liver and kidney damage and irritation of skin eyes and respiratory passages Many PCBs PAHs and VOCs are known or suspected carcinogens Routes of exposure include inhalation topical and ingestion
Document Vol II SC SAP Appendix A Revision 1
Date March 28 1991 Page 5
Heat-related illnesses range from heat fatigue to heat stroke the latter being the most serious Heat stroke requires prompt treatment to prevent irreversible damage to health Protective clothing may have to be cut off Less serious forms of heat stress require prompt attention to prevent further complications which may lead to heat stroke Unless the victim is obviously contaminated decontamination procedures should be omitted or minimized so that treatment may begin immediately
Hypothermia may result from personnel exposed to excessive cold during sampling operations Hypothermia requires prompt treatment to prevent serious damage to health Damp or wet clothing may have to be cut off and the persons body temperature must be elevated as soon as possible through the use of warm blankets or another persons body warmth Unless the victim is obviously contaminated decontamination procedures should be omitted or minimized so that treatment may begin immediately
Area Within Augusta Maine city limits
Proposed On-Site Activities Test pitting boring or hand augering for collection of surface and subsurface soil samples collection of sediment and surface water samples from an inflatable boat or from wading into the water with hip-boots and collection of samples from within the on-site Barn Potential physical safety hazards during each of the four proposed Source Control site activities are discussed per activity below
Test Pitting and Borings for Surface and Subsurface Soil Samples A backhoe will be used during test pitting operations to excavate soil for collection of samples The most significant hazard during this sampling effort is the potential for collapse of the excavation while sampling Therefore in accordance with OSHA and 29CFR1926 Subpart P if personnel are required to enter an excavation the excavation will be no deeper than 5 feet unless it is braced or sloped back For the Type A soils documented on-site (eg clay and glacial till) the required slope from the ground surface to the top of unbraced portion of the excavation in all directions is 05 HORIZONTAL 1 VERTICAL Short-term excavations of this type will not exceed 12 feet in depth In general a drilling rig will likely be used to obtain samples from depths below 5 feet by augering to a specified depth and using a split-spoon sampler
Document Vol H SC SAP Appendix A Revision 1
Date March 28 1991 Page 6
Other physical hazards during test pitting and boring operations include the presence of overhead objects (eg backhoe bucket) so hard hats must be worn during these tasks at all times In addition the potential for spreading contamination with fugitive dust during excavation and mobilization between sampling locations is much greater than during other Source Control sampling efforts Therefore Level C dermal and respiratory equipment must be worn during all test pitting and boring operations (see below) Additional decontamination procedures will be required between sampling areas to limit the potential for cross-contamination (see below)
Sediment and Surface Water Sampling These operations will be conducted using Level C dermal protection only The need for respiratory protection will be based on criteria discussed in the next section In order to collect sediment and surface water samples in interior portions of the Upland Marsh and Upper and Lower Lagoons an inflatable boat or hip-boots will be used Further sampling will be performed by walking along the shores of the surface water bodies while dragging a sediment sampler These operations involve the risk of falling in relatively deep water while equipped with Level C dermal protection This equipment may limit movement and may inhibit a person from swimming easily to safety Therefore while sampling with the boat a Coast Guard Approved life vest will be worn at all times In addition one person will standby on-shore to observe the boat operation and to assist in the event of a mishap Depending on the water and air temperature at the time of sampling it is possible that a person who had fallen in water may require treatment for hypothermia or shock
Barn Sampling The barn can be classified as a confined work space since it is fully enclosed and has a limited number of exits In order to operate safely in a confined work space special considerations are necessary Unlike some confined spaces the barn has numerous small openings in the wooden structure to allow for an adequate supply of air while collecting samples However the sampling effort will likely generate a significant amount of airborne dust within the barn which means that Level C dermal and respiratory protection must be worn at all times while in the barn One person will remain outside the barn during the sampling effort to observe the sampling personnel and to provide backup services Two Combination Type A-B-C fire extinguishers capable of extinguishing wood and paper flammable liquidis or electrical fires will be available (one inside and one outside the barn with the standby person) in the unlikely event of a fire occurring during sampling
Document VoL H SC SAP Appendix A Revision 0
Date January 171991 Page 7
In accordance with OSHA 29CFR1910120 a minimum lighting intensity of 5 foot
candles will be provided within the barn during sampling The creation of dust and the
low lighting which may be available in some areas of the barn is likely to limit vision
some of the time Special care must be taken to avoid tripping over the numerous
objects disposed of within the barn No electricity is available in the barn so power
will come from outside the barn to supply power for lighting and tools to be used in
the sampling effort This means that electrical extension cords will be laid out on the
floor to various sampling locations In addition a large amount of metal and wooden
debris exists within die barn which may become obstacles to free movement in certain
areas The wooden floors of the second story and loft ofxthe^arn are extremely
deteriorated in some places and should not be accessed unless authorized by the Site
Safety Coordinator v
The use of electric power tools to collect samples ^wobd boring and concrete drills) require special care The use of Level C dermal protection such as loose fitting gloves may make handling the drills more difficult Use speciaLcare to avoid contacting the moving bits of the drills while in operation tonvoid tearing tyveks or gloves If dermal protection is torn replace or patch it immediatelybefare proceeding with the sampling operation
Perimeter Establishment
MapSketch Attached See bdquo Perimeter Identified Access to site is restricted at all entry points via a locked
8-foot high cyclone fence^- x y
Zone(S) of contamination identified See Figure HS-1 through HS-5
Document Vol II SC SAP Appendix A Revision 1
Date March 28 1991 Page 8
Recommended Level(s) of Protection On-site personnel will use Level C dermal protection at all times See below for respiratory use
1 Protective Clothing
Sampling and decontamination personnel in these areas will wear
bull Disposable Tyvek coveralls over cotton coveralls bull Tyvek hoods bull Safety glasses or face shield bull Hard Hat bull Disposable booties over workbooks or waders for sampling surface water and
sediments bull Butyl rubber gloves over surgical gloves bull All gloves and booties will be taped to the Tyvek coveralls
2 Respiratory Protection
Air purifying respirators will be worn at all times while sampling during test pitting and boring operations and while inside the barn Otherwise the need for respiratory protection will be determined by on-site monitoring for organic vapors and the daily potential for exposure to airborne particulates The decision to utilize air-purifying respirators due to airborne particulates will be made by monitoring with a MIE MINIRAM Hand-held Aerosol Monitor (HAM) Based on previous studies (Endangerment Assessment Appendix F) an action level for worker safety of 10 mgm3 of respirable dust was established for the site Therefore when readings on the MINIRAM of 10 mgm3or greater are experienced Level C respirators will be worn Initial on-site monitoring for organic vapors will be conducted using an HNu Photoionization Detector (PID) Ambient vapor levels of 5 to 10 ppm above background in the breathing space will require the use of full-face cartridge respirators (Level C Protection) Background levels will be determined at the edge of the Site (ie fence line) before the initiation of the days activities Air quality will be monitored at the upwind boundary of the site at three locationsfor a duration of one minute at each location The maximum PID reading at each location will be recorded and the three readings will be averaged to determine the background level for that day Respiratory protection will be full-face respirators fitted with combined organic vapor and high-efficiency particulate cartridges (MSA Type GMA-F) Respirator cartridges will be replaced at a minimum on a daily basis Depending on readings obtained with the MINIRAM cartridges may be replaced at mid-day on windy days
Levels of organic vapors greater than 10 ppm above background in working areas will necessitate utilization of self-contained breathing apparatus (Level B Protection) During sampling HNu monitoring should be utilized to detect any changes in organic vapor levels Changes in fugitive dust or vapor level detection at any time may warrant appropriate alteration of required respiratory protection
Document VoL H SC SAP Appendix A Revision 0
Date January 171991 Page 9
Decontamination and Disposal
A decontamination areawill be assembled at the entrance to the site The decontamination zones will be established such that personnel and equipment are fully decontaminated prior to leaving the fenced area In addition all personnel will be familiar with proper decontamination procedures prior to going on site All personnel entering and exiting the hot zone shall pass through the decontamination zone
1 Personnel Decontamination
The personnel decontamination sequence is as follows
a Samples and equipment are dropped on plastic sheets
b Disposable booties Tyvek coveralls and contaminated outer gloves are first brushed off with soapy water then rinsed with clean water by decontamination personnel Thedisposable equipmenfis^then removed baggedand placed in a 55shygallon drum marked Dry Deconv
c Neoprene boots and outer gloves are washed if they were not drummed in Step b with soapy water and ririseck with clean water An additional rinse with methanol followed by a firiak water-rinse completes the sequence
lt d Neoprene boots and glovesare -removed
e Respirators (cartridge-change) are removed if necessary and disposed in the Dry Decon drum
f Surgical gloves are temovfedand disposed in the Diy Decon drum
Document Vol M SC SAP Appendix A Revision 0
Date January 17 1991 Page 10
2 Equipment Decontamination
The equipment decontamination procedure for Source Control sampling work performed inside the fenced area of the site is as follows
a All disposable items (eg surgical gloves plastic sheeting nylon brushes etc) will be discarded in the Dry Decon drum
b Heavy equipment such as the backhoe and drilling jig will be steam-cleaned on a specially constructed decontamination pad located east bfthermain site access gate and north of the ground water monitoring well couplet MW1Q2A and MW102B (see Figure HS-7) The pad will be constructed to allow for drainage of steam-cleaning solutions onto a bermed multi-layer -impermeable barrier consisting of several layers of at least 6-mil-thick polyethylene sheeting overlain and underlain by geotextile fabric The geotextile fabricwilfbe designed to collect contaminated sediments which may have collected on tires or excavating equipment Rinse water from the decontamination processwill then fre pumped through hoses or channelled for drainage into the Uppei^La^oomafter completion of surface water and sediment sampling The decontamination pad will be left in place after completion of field sampling
c All other equipment contacting surface or subsurface soils sediments surface water or materials within thebarm(egtrowels spatulas templates drill bits etc) will be decontaminated by rinsing with clean water scrubbing with methanol and re-rinsing with distilledwater Solutions which contain methanol will be collected for disposal into tHeJWet Decon drum Equipment used during barn sampling will then be drted^with paper towels and the towels will be disposed in the Dry Decon drum ^
3 Decontamination Station Closure
The procedure for decontamination station closure will be as follows
a Decontamination personnel shall be responsible for closing the station at the end of each workday
b All solid wastes such as plastic tarps bags and Tyveks will be placed in the Dry Decon drum and will be closed at die end of each workday
Document Vol IISC SAP Appendix A Revision 0
Date January 171991 Page 11
All spent decontamination solutions containing methanol will bedisposed of in the Wet Decon drum Decontamination solutions which are not composed of methanol and exhibiting PID readings below 1 ppm will be poured into surficial soils on the edge of TWA I within the fenced area of the site If PID readings are greater than 1 ppm the solutions will be disposed in the Wet Decon drum These drums will be closed at the end of each workday
d Drums shall be secured on-site until proper disposal is arranged after consultation with EPA
7 Air Monitoring Procedures X
Site Monitoring Equipment PID HNu PI-101 HAM MIE MINIRAM
Since Level C respirators will be used during test pitting and barn sampling air at the test pit and barn sampling areas will be monitoredfegularly with a PID and HAM primarily for future reference of the levels of VOCs and dustto^be expected during remedial activities During the other sampling efforts air monitoring wiH form the basis for whether an upgrade to Level C respiratory equipment is necessary TheltPID will be used regularly during soil sediment and surface water sampling^ TKampHAM will be used at least twice per hour while on-site to monitor for dust levels in air^Whenunusually windy conditions are experienced additional monitoring for dust levels wilLbe^erfbrmed When ambient temperatures in air are below 32deg F the chart recorderattachment for the MINIRAM must be used as the LED readout on the instrument may not operate below freezing All PID and HAM readings will be recorded in theJield Log Book
Document VoL H SC SAP Appendix A Revision 0
Date January 171991 Page 12
Emergency Information
Location Phone
FIRE Augusta (207) 623-2511
POLICE Augusta (207) 623-2511 State Police (Augusta) (207) 621-1200
AMBULANCE Augusta (207) 623-25tlx N
HOSPITAL Kennebec Valley Medical Center (207) 626-1000 Augusta Division N 6 East Chestnut Augusta ME
Chemical Trauma Capability Yes
EPA (Michael Jasinski) 7) 573-5786
DEP (Thomas Benn) (207) 289-2651
CMP (Charles Nickerson) (207) 623-3521
Directions to Hospital (See Fig HS-6)
Primary route to hospital is west on Route17 (Eastern Avenue) to Arsenal Avenue turn right on Arsenal Avenue and go3 blocks to E Chestnut street then right Emergency room entrance is 6 East Chestnut Street Alternate route - west on Route 17 (100 yards) to Cony Road turn right on Cony Road take^rst left (Cony Street Ext) to Riverside Drive go left on Riverside Drive the second mtejsection will be Arsenal Street goleft on Arsenal Street East Chestnut Street will be second left
Document VoL H SC SAP Appendix A Revision 0
Date January 171991 Page 13
Additional Emergency Contacts
DR DAVID EGILMAN (617) 935-8581 HEALTH RESOURCES WOBURN MASSACHUSETTS
GEI CONSULTANTS INC
ROBERT E STETKAR (603) 224-7979 JOSEPH G ENGELS (617)721^4022 s
TSCA HOTLINE (800)424-9065
AT amp F (EXPLOSIVES INFO) (800^424-9555 V
NATIONAL RESPONSE CENTER x(8W) 424-8802
PESTICIDE INFORMATION SERVICE (800)845-7633
RCRA HOTLINE y -(800) 424-9346
CMA CHEMICAL REFERRAL CENTER (800) 262-8200V NATIONAL POISON CONTROL CENTER (800) 942-5969-y
US DOT bdquo (202) 366-0656
GEI CONSULTANTS ^ (603) 224-7979
Prepared by Thomas S Bobowski Date January 7 1991
Reviewed by Robert E Stetkar Date January 9 1991
All personnel working at this site have received OSHA required health and safety training Personnel are enrolled in a medical monitoring program A summary of training completed for all GEI personnel involved in the Source Control sampling program is provided in Table 3
Use of Common Sense is Required
I have read and understand this safety plan
Name (printed) Signature Date
Table 1A Organic and Inorganic Chemicals Detected in the Shallow Aquifer
Groundwater Samples at the F OConnor Site Maximum
Concentration Geometric Background
Range Mean[a] Concentration (ugL)
Chemical Frequency (ugL) (ugL)
ND(b]-2300B[c] 150 NDAcetone 211 ND-15J[d] NA[e] NDBenzene 211 ND-45 143 ND2-Butanone 17 ND-83 53 NDChlorobenzene 311 ND-53 NA NDToluene 27 ND-12J NA NDTriehloroethene 1P ND-11 81 NDBis(2-Ethylhexyl)Phthalate 411 ND-25 1deglaquo2 ND12-Dichlorobenzene 411 ND-14J 97 ND13-Dichlorobenzene 311 ND-13J 96 ND14-Dichlorobenzene 311 ND-29 94 ND124-Trichlorobenzene 17 ND-19 07 NDTotal PCBs 111 27-5085 06 49Aluminum 55 27-805 24 42Barium 55 13700-125451 38300 26600Calcium 55 ND-145 53 NDChromium 25 ND-37 NA NDCobalt 15 ND-285 66 14Copper 35 33-4952J 590 3Iron 55 ND-18 37 NDLead 15 21-2906 260 24Manganese 55 ND-154 10 NDNickel 15 ND-17 37 NDSilver 15 10593-72812 33400 14000Sodium 55 ND-71 71 NDVanadium 15 17-946 263 91Zinc 55
a) Calculated using detected concentrations and one-half of EPAs contract laboratory program (CLP) detection limits for the organics For the inorganic
chemicals the aqueous CLP detection limits were used
b) ND - Not Detected
c) B designates Chat substance was also found in the blank though the
sample level was significantly higher to prove a positive detect
d) J designates estimated value
e) NA - Not applicable Chemical was detected infrequently and the use of
one-half of the detection limit in calculating a mean results in a mean
concentration that exceeds the maximum Therefore a mean is not used
SourceEndangerment Assessment dated Jan 29 1988 by CDM
Table IB Organic and Inorganic Chemicals Detected in Bedrock Aquifer
Groundwater Samples at the F OConnor Site
Mean Concentration Geometric Background
Chemical Frequency Range (ugL)
Mean[a] (ugL)
Concentration (ugL)
Acetone 220 ND[b]-1200 68 ND Benzene 220 ND-27J[c] NA(d] ND Chloroblt ene 620 ND-16 36 ND Toluene 215 ND-27J NA ND Bis(2-E vlhexyl)Phthalate 1320 ND-64 Hi 61 12-Dich 13-Dic^
irobenzene jrobenzene
720 120
ND-26 ND-24J NA
66 ND ND
14-Dic^ robenzene 620 ND-44 82 ND Di-n-Bu phthalate 120 ND-22J NA ND 124-Tr hlorooenzene 720 ND-310 161 ND N-Nitros iiphenvlamine 25 ND-4J NA ND 3eta-BHC 110 ND-04 004 ND Gamma-BH (Lindane) 110 ND-006 003 ND Total PC 320 ND-50 LO ND Antimony 110 ND-55 19 ND Barium 1010 15-129 138 56 Chromium 410 ND-268 54 ND Cobalt 110 ND-115 92 ND Iron 1010 61-384301 837 152 Magnesiu Manganes
1010 810
5960-46250 ND-5895
15220 661
4203
27 Nickel 310 ND-345 125 ND Potassiu 1010 3504-16046 6560 4340 Vanadium 110 ND-52 NA ND
a) Calcul ted using detected concentrations and one-half of EPAs contract labor 3ry program (CLP) detection limits for the organics For the inorganic chemic Is the aqueous CLP detection limits were used
b) ND mdash F detected
c) J de Ignates estimated value
d) NA - N applicable Chemical was detected infrequently and the use of one-ha of the detection limit in calculating a mean-results in a mean concern ation that exceeds the maximum Therefore a mean is not used
Source Endangerment Assessment dated Jan 29 1988 by COM
Table 1C Organic and Inorganic Chemicals Detected in In-Fence Surface Soil
Samples at the F OConnor Site Mean
Concentration Geometric Background Range Mean[a] Concentration
Chemical Frequency (ugAg) (ugkg) (ugAg)
19 ND[b]-19J[c] NA[d] ND Chicroform ND29 ND-150B[e] 63Methylene Chloride
ND19 ND-30J NAToluene 260J19 ND-917J 260Bis(2-Ethylhexyl)Phrhalate
Carcinogenic PAHs ND19 ND-2700J 290BenzoltAgtAnthracene ND29 ND-12000J ^10BenzoltB or KgtFluoranthene ND39 ND-11000J 540Chrysene ND39 ND-23183Total CPAHs
Non-carcinogenic PAHs ND39 ND-12000J 540Pvrene ND39 ND-12000 540Total NCPAHs ND118186 ND-6205600 3400 Total PCBs 4001419 ND-64000 1900Cadmium 292001919 17000-29480000 275000
Copper 570001919 29000-2681000 213000Lead 252001919 19000-90000 35000Nickel ND219 ND-12000 650Silver 738001919 45000-1160000 183000Zinc
aj Calculated using detected concentrations and one-half of EPAs contract UboSto program (CLP) detection Unite for the organic For the inorgar-c chemicals the detection limits for soils were based on aqueous CLP
detection limit
b) ND - Not Detected
c) J designates estimated value
d) NA - Not applicable Chemical was detected infrequently and the use of one-half of the detection limit in calculating a mean results in a mean concentration that exceeds the maximum Therefore a mean is not used
e) B designates that substance was also found inthe blank though the sample level was significantly higher to prove a positive detect
Source Endangerment Assessment dated Jan 29 1988 by Clement Associates Inc
Table ID
Organic and Inorganic Chemicals Detected in the TVA III Surface Soil Samples at the F OConnor Site
Concentration Geometric Background Range Meanfa] Concentration
Chemical Frequency (ugAg) (ugAg) (ugAg)
44-DDT 13 ND[b]-5200 150 ND 44-DDE 13 ND-260 56 ND Total PCBs 2131 ND-620000 2940 ND
Antimony 11 189000 41000
Cadmium 11 11000 400 Copper 11 230000 29200 Iron 11 60900000 22200000 Lead 11 634000 57000 Zinc 11 799000 73800
a) Calculated using detected concentrations and one-half of
ErAs contract laboratory program (CLP) detection limits
b) ND - Not Detected
Source Endangerment Assessment dated Jan 29 1988 by Clement Associates Inc
Table IE irganic Chemicals Detected in Upland Marsh Sediment
Samples at the F OConnor Site[a] Maximum
Concentration Geometric Background Range Mean[b] Concentration
Che ical Frequency (ugAg) (ugAg) (ugAg)
To ane 11 23J[c] - ND[d] To- 1 PCBs 33 1300-34000 6425 ND
a) norganic chemicals were also analyzed for but none were itected significantly above background concentration
b) alculated using detected concentrations and one-half of PAs contract laboratory program (CLP) detection limits
c) J designates estimated value
d) D - Not Detected
Source Endangerment Assessment dated Jan 29 1988 by Clement Associates Inc
Chemical
Acetone 11 408B[c] ND[d]
Bis(2-EthyIhexy1)Phthalate 11 2082 ND
Toluene 11 28J[e](f] ND
Total PCBs 44 30000-1100000 381000 ND
a) Inorganic chemicals were also analyzed for but none were detected
significantly above background concentration
b) Calculated using detected concentrations and one-half of EPAs contract
laboratory program (CLP) detection limits
c) B designates that substance was also found in the blank though the sample
level was significantly higher to prove a positive detect
d) ND - Not Detected
e) J designates estimated value
f) In a duplicate sample toluene was not detected A geometric mean of the detected value and one-half of the detection limit would have resulted
in a mean concentration exceeding the detected value Therefore only
the detected value is listed
Source Endangerment Assessment dated Jan 29 1988 by Clement Associates Inc
Table 1G Organic and Inorganic Chemicals Detected in Lower Lagoon Sediment
Samples at the F OConnor Site Maximum
Concentration Geometric Background Range Mean(a] Concentration
Chemical Frequency (ugAg) (ugAg) (ugAg)
Bis(2-Ethylhexyl)Phthalate 12 ND[b]-100J[c] NA[d] ND
Benzoic Acid 22 120J-190J 150 ND Total PCBs 77 3202-40100 8660 ND
Cadmium 12 ND-2500 790 ND c 22 27000-59000 40000 20000
Lead 22 17000-70000 34500 ND
Manganese 22 525000-982000 718000 474000
Selenium 12 ND-760 436 ND Zinc 22 103000-249000 160000 108000
a)Calculated using detected concentrations and one-half of EPAs contract laboratory program (CLP) detection limits for the organic For the inorgan chemicals the detection limits for sediments were based on the aqueous CLP
detection limit
b) ND - Not Detected
c) J designates estimated value
d) NA - Not Applicable Chemical was detected infrequently and the use of
one-half of the detection limit in calculating a mean results in a mean
concentration that exceeds the maximum Therefore a mean is not used
Source Endangerment Assessment dated Jan 29 1988 by Clement Associates Inc
Table 1H Organic and Inorganic Chemicals Detected in Riggs Brook Sediment
Samples at the F OConnor Site Maximum
Concentration Geometric Background
Range Mean[a] Concentration
Frequency (ugAg) (ugkg) (ugAg)Chemical
12 ND[b]-30 12 NDMethylene Chloride
Carcinogenic PAHs 22 160J[c]-790 360 230JBenzoltAgtAnthracene 22 220J-800 420 290JBenzoltAgtPyrene 22 2-63J-1600 650 710J3enzoltB or KgtFluoranthene 22 280J-960 520 400J
Chrysene 12 ND-190J NA[d] NDDibenzltAHgtAnthraeene 12 ND-400J 340 NDIndenoCl23-CDgtPyrene 22 1507-4740 2670 2402Total CPAHs
Non-carcinogenic PAHs 12 ND-110J NA NDAcenapthy1ene 12 ND-200J NA NDAnthracene 12 ND-410J 350 ND
BenzoltGHIgtPerylene 22 280J-1200 580 420J
Fluoranthene 12 ND-80J NA NDFluorene 22 72J-680 220 150J
Phenanthrene 22 290J-1500 660 470J
Pyrene 22 1810-4180 2750 2584Total NCPAHs 615 ND-6481 870 NDTotal PCBs 12 ND-1200 775 NDSilver
a) Calculated using detected concentrations and one-half of EPAs contract laboratory program (CLP) detection limits for the organics For the degrgan chemicals the detection limits for sediments were based on the aqueous CLP
detection limits
b) ND - Not detected
c) J designates estimated value
d) NA - Not applicable Chemical was detected infrequently and the use of one-half of the detection limit in calculating a mean results in a mean
concentration that exceeds the maximum Therefore a mean is not used
Source Endangerment Assessment dated Jan 29 1988 by Clement Associates Inc
Table II Inorganic Chemicals Detected in Upland Marsh Surface
Water Samples at the F OConnor Site[a]
Sample Background
Concentration Concentration
Chemical Frequency (ugL) (ugL)
Aluminum 11 884 104 Arsenic 11 35 ND(10)[b]
Barium 11 12 47 Iron 11 3540 1160 Lead 11 36 ND(5)
Manganese 11 ^29 134 Potassium 11 7260 3610
a) Organic chemicals were also analyzed for but
none were detected
b) ND - Not Detected Limits of detection are
given in parentheses
Table 1J Organic and Inorganic Chemicals Detected in Upper Lagoon
Surface Water Samples at the F OConnor Site
Sample Background
Concentration Concentration
Chemical Frequency (ugL) (ugL)
108 ND(10)[a]Total PCBs 11 47Barium 11 23
6 ND(5)Lead 11 Manganese 11 1450 134
25 ND(40)Nickel 11
a) ND - Not Detected Limits of detection are given in
parentheses
Source Endangerment Assessment dated Jan 29 1988 by Clement Associates Inc
Table IK Organic and Inorganic Chemicals Detected in Lover Lagoon
Surface Water Samples at the F OConnor Site Maximum
Concentration Geometric Background Range Mean[a] Concentration
Chemical Frequency (ugL) (ugL) (ugL)
Total PCBs 22 13-375 221 ND[b] Aluminum 22 56-3740 458 104
Arsenic 12 ND-4 NA[c] ND
Barium 22 12-37 67 47
Cobalt 12 ND-9 NA ND Iron 22 1970-8260 4030 1160
Lead 22 91-13 109 ND
Manganese 22 137-2330 565 134 Potassium 22 5200-6220 5690 3610
a) Calculated using detected concentrations and one-half of EPAs
contract laboratory program (CLP) detection limits for the organics For the inorganic chemicals the aqueous CLP detection
limits were used
b) ND - Not Detected
c) NA - Not Applicable Chemical was detected infrequently and the
use of one-half of the detection limit in calculating a mean
results in a mean concentration that exceeds the maximum
Therefore a mean is not used
Table 1L
Inorganic Chemicals Detected in Riggs Brook Surface Water Samples at the F OConnor Site[a]
Maximum
Concentration Geometric Background Range Mean[b] Concentration
Chemical Frequency (ugL) (ugL) (UgL)
32 NDAntimony 13 ND[c]-35 5 NDLead 13 ND-16
a) Organic chemicals were also analyzed for but none were detected
b) Calculated using detected concentrations and one-half of EPA s
contract laboratory program (CLP) aqueous detection limits
c) ND - Not Detected
Source Endangerment Assessment dated Jan 29 1988 by Clement Associates Inc
Chemical
Acetone |CHCOCH3l Dimethyl ketone ketone propane
Toluene |CHCHJ _ e bull bull a O J Jtoluol phenyl aethane aethyl benzene
Cblorobcnzene (CHC1) aonochlorobenzene chlorobenzol
Ethyl benzene |C_HCH| phenyl ethane ethyl benzol
ACC TLV or STEL
ltPPB) (PfB)
750 1000
100 150 skin
75 (550agaraquo)
100 125
TABLE 2 CHEMICAL TOXICITY AND OTHER INFORMATION
Physical Skill Dcraal LD^ (mgkg) State Penetration Tonicity Potency ofraquoI(rat)
bullbullbull local it 9750liquid Bint-like odor
1297(nice)
liquid t local 5000
TC|Huosn =Ml00 ppa
colorless liquid 2910
colorless liquid local H 3500 with aromatic odor
syatcaatic bullbullbull TCu(Kiais) c 100 ppa
A hrs
Page 1 of 4
Remarks
Syaptoas Irritates eyea none throat narcotic in high concentrations
Target Organ respiratory aystea skin
First Aid Swallow water voait Skin soap wash
Incoapatibilities oxidizing materials acids Fire hazard when csposed to beat or flame
Tonicity 1 Persistence1 0
Syaptoas fatigue confusion euphoria dizzy headache dialated pupils lack of appetite nervousness insoania
Target organ CNS liver kidneys skin
First Aid Swallow NO VOHIT 8kln soap waah
Incoapatibilities strong ozldizers
Toxicity1 2 Persistence 1
Syaptoas irritates eyes nose causes drowsiness incoordination skin irritation
Target organ respiratory systea eyes skin cars liver
First Aid NO VOMIT
Incoapatibilities strong oxidizers reacts violently with AgClO^
Toxicity 2 Persistence 2
Syaptoas irritant to eyes and aucous aembrane headache narcotic
Target organ eyes upper respiratory systea
First Aid NO VOHIT
Incoapatibilities oxiding asterisks dangerous when exposed to heat or flame
TABU 2 Page 2 of 4 CHEMICAL TOXICITY AND OTHER INFORMATION
(continued)
ACC TLV or STEL Physical Skin Dcraal ID (agkg)
Cheaical (PPff) (PPB) State Penetration Toxicity Potency orsl(rat) Rcnarks
Benzene benzol
IC^H) 10 23 colorless liquid with aroaatic odor
local systeaatic
bullbull
bullbullbull Poisoning occurs aost coasaonly through lnhalationi also penetrates through akin
Syaptoass lrritatea eyes nose respiratory systea giddiness head nausea staggered gait fatigue depresesion sbdoaioal pain
Target organs bloody CNS skin bone narrow eyes respiratory systea
First Aids Swallows 8kins
NO VOMIT soap wash
Inconpatibilitiess strong oxidizers chlorine hronine with iron Dangerous when exposed to beat or flaae
Toxicitys 2 Persistences 1
Trichloroctbylcne ethylene trichloride tridene TCE
30 200 colorless liquid sweet odor
4820
1900(dog)
Syaptoass headache vertigo vision distortion treaors soanolcnce nausea voait irritates eyes cardiac errytbaiss paresthesias
Target organs respiratory systea heart liver kidneys CNS skin
First Aids Swallows Skins
Ipecac voait soap wash immediately
incoapatibless strong caustics chemically active actalss Da Li Ra Hg liquid O
Al 02 KN03 Ti
Persistences 3
Polychlorlasted biphenyi PCB Arocblor 1242 CjjHjClj(approx)
Arcblor 1234
C6H2C3C6M3C12
03
colorless to dark brown liquid with aild hydrocarbon odor
local systeaatic
local
Poisoning occurred Boat coaaonly through investigation or penetration of skin
Sypatoaas Irritates eyes (discbarge) skin scne-fora dernitatis Jaundice dark urine Target organs liver eyes skin First Aids Swallows Ipecac voait
Skins soap wash isnediately Incoapatibless strong oxidizers
TABU 2 CHEHICAL TOXICITY AND OTHER INFORMATION Page 3 of 4
ACC
Chulcil TLV or STEL (ppa) (POO)
Physical State
Skin Penetration
Derail Tonicity Potency
U)n (ngkg) of Reaarka
Dloctyl phtbalate di-acc-octyl pblbalata
5 aga1
light colored liquid
31000 Tonicity low to none via oral and derail routca produce 01 ayaptoas
12 Bichlorobenzene (C^H CI ) o-OCB
50 none liquid ++ local systemic
Symptoms irritates eyes and nose Target Organs liverkidneysskineyes First Aid Swallow salt water vomit
Skin soap wash Incompatabilities strong oxidizers
14 bichlorobenzene (CHbdquoC1 ) 7 2
P-OCB 75 110 solid ++ local
systemic ++ Symptoms irritates eyesheadachesnauseavomiting
Target Organs liverkidneyskineyesrespiratory system
first Aid Swallow water vomit skin soap wash
Incompatablities none
Lead (Pb) 015 mgm
none solid systemic t Symptoms Fatigue headaches abdominal pain Target Organs kidneys 61 central nervous system First Aid Swallow water vomit
Skin soap wash
Polycyclic Aromatic Hydrocarbons (PAHs)
015 mgm
none liquid systemic + Symptoms No obvious symptoms Carcinogenic to tissue following prolonged contact
First Aid Swallow water vomit Skin soap wash
Page 4 of4TABU 2 CHEMICAL TOXICITY AND OTHER INFORMATION
(continued)
NOTES
TLV - Threshold Unit Value ACC - Acceptable Ceiling Concentration STEL - Short Tera Exposure Limit
Suspected carcinogens teratogens or mutagens Firat Aid Unless specified flrat aid for oil of the liated cbeaicala are aa followa
Eyeai iaaedlatcly waab with copious quantity of cold water Skins Flush with water proaptly Breath Artificial respiration Swallowi Water voait
a Slight Hazard aa Hoderate Hasard aalaquo Extreme Hasard
Toxicity Ratiosa
Toxicity Rating
No toxicity (none) Material causes no hara in any condition or produces
tosic effects on buaana in very unusual circumstances or
in very large dosage
Slight toxicity (low)
Moderate toxicity
Severe toxicity
Persistence or each hazardous substance ia evaluated on its blodegradabllity aa follows
Assigned Value
Easily biodegradable coapounds 0
Straight chain hydrocprbons 1
Substituted and other ring compounds 2
Metals polycyclic coapounds and halogenated hydrocarbons 3
Adapted with modifications from EC Jordon Co RIFS Work Plan
TABLE 3 - PERSONNEL TRAINING AND MEDICAL MONITORING HEALTH AND SAFETY PLAN Field Sampling Plan OConnor Co Site Augusta Maine
personnel1
Robert E Stetkar
Joanne O Morin
Richard F Murdock
Benjamin Y Su
Joseph G Engeis
Steven R Lamb
Thomas S Bobowski
Boyd P Smith
Christopher L Covel
William J Haswell
Charles Blodgett
NOTES
ANNUALreg MEDICAL
MONITORING
yes
yes
yes
yes
yes
yes
yes
yes
yes
yes
yes
lt
y
OSHA 40shyHOURreg HAZMAT TRAINING
yes
yes
yes
yes
yes
yes
yes
yes
yes
yes
yes
ANNUALreg RESPIRATOR
FITTEST
yes
no
no
no
no
yes
yes
yes
es Yes
yltes
-y
CARDIOshyPULMONARY
FIRST AID RESUSCITATION TRAINING TRAINING
no no
yes yes
nov no
no no
no no
yes yes
yes yes
yes yes
yes yes
no no
yes yes
1 Only GEI personnel assigpedttfdo work on the OConnor site included on this list
2 Includes baseline and annual physicals lilood testing etc
3 In accordance with 29CFR191012tkncludes annual 8-hour refresher course
4 Includes annual respirator fit testing procedures
Project 90393 GEI Consultants Inc January 17 1991
TOW MAXARJM PCS CONCENTRATION (gtbullraquo) 8Y AREA
Central Maine Power Company Pre-Design Work Plans INTERPRETED CONTOURS Scale 1 inch = 180 feet Augusta Maine OConnor Site OF PGBs IN
Augusta Maine IN SURFICIAL SOILS From EC Jordon Co RIFS
Report dated June 1989 0 G E I C o n s u l t a n t s I n c Project 90393 January 1991 FigHS-2
Central Maine Power Company Pre-Design Work Plans DISTRIBUTION OF PAHs Scale 1 inch = 180 feet Augusta Maine OConnor Site IN SURFACE AND
Augusta Maine SUBSURFACE SOILS From EC Jordon Co RIFS
Report dated June 1989 0 G E I C o n s u l t a n t s I n c Project 90393 January 1991 FigHS-3
Central Maine Power Company Pre-Design Work Plans INTERPRETED DISTRIBUTION Scale 1 inch = 180 feet Augusta Maine OConnor Site OF LEAD IN SOILS
Augusta Maine From E C Jordon Co RIFS
Report dated June 1989 ltD G E I C o n s u l t a n t s I n c Project 90393 January 1991 FigHS-4
Central Maine Power Company Pre-Design Work Plans ANALYTICAL RESULTS FROM Scale 1 inch = 160 feet Augusta Maine OConnor Site SEDIMENT AND SURFACE
Augusta Maine WATER LOCATIONS From EC JOrdon Co RIFS lttgtReport dated June 1989 G E I C o n s u l t a n t s I n c Project 90393 January 1991 FigHS-5
Contamination 80 Feet
Control Line
Central Maine Power Company Pre-Design Work Plans SITE ACCESS AND Augusta Maine OConnor Site DECONTAMINATION
Revision 1 March 281991 Augusta Maine AREA
laquo G E I C o n s u l t a n t s I n c Project 90393 March 1991 KgHS-7
bull
Document Vol II SC SAP Appendix B Revision 0
Date January 17 1991 Page 1
APPENDIX B
FieldtogjL
FIELD LOGS
Project Field Log Book Equipment Calibration Logs
HNu Pl-101 MIE MINIRAM MARKSON CONDUCTIVITY METER MARKSON DIGITAL pHTEMPERATURE
Photograph Log Health and Safety QA Logs
Chain-of-Custody Forms Sample Assignment Forms Non-Conformance Report Forms Test Pit Log Forms Barn Sampling Forms Dexsil L-2000 PCB analyzer Calibration Boring Log Forms
lt
Document Vol II SC SAP Appendix B Revision 0
Date January 17 1991 Page 2
(OCONNORFL1)
(OCONNORFL2) (OCONNORFL3) (OCONNORFL4) (OCQNNORFL5) pound0CONNORFL6) (OCONNORFL7)
-(OCONNORFL9) (OCONNORFLIO) (OCONNORFL11) (OCONNORFL12) fOCONNORFL13) (OCONNORFL14) (OCONNORFL15)
Note Field Log OCONNORFLampisassigned to ground water sampling described in the Management of Migration Sampling andiAnalysis Plan
Document Vol II SC SAP Appendix B Revision 0
Date January 17 1991 Page 3
PROJECT LOGBOOKS (OCONNORFL1)
Serialized project logbooks are to be issued by the site contractor to all personnel at the site who have been designated to perform specific field tasks Individuals must sign their logbooks upon receipt and use them to record all pertinent information until the project is completed y
Logbook entries should be dated legible and contain accurate and inclusive documentation of an individuals project activities Because the logbook forms the basisfor the later written reports it must contain only facts and observations Entries made by individuals other than the person to whom the logbook was assigned are dated andsigned by the individual making the entry bull
CALIBRATION LOG Document No OCONNOR FT1 HNu Photoionization Device Model Pl-101 Page 1 of 1
Instrument Serial No
Lamp Date Span Setting Time Calibration Temperature User
Standard Introduced Meter Response (parts per million (ppm))
Comments (See Summary of Calibration Procedures attached7
X x
User Signature Date
Task Manager Signatures Date
CALIBRATION LOG Document No OCONNORFI3 MIE MINIRAM Hand-held Aerosol Monitor Page 1 of 1
Instrument
Serial No
Date
Time
User
Standard used (zero-bag)
Meter Display
Comments
User Signature lt Date X
Task Manager Signature l Date
CALIBRATION LOG Document No OCONNORFL4 Markson Conductivity Meter Model 103 Page 1 of 1
Instrument Serial No
Date Time User
Standard Used_ Meter Display^
Comments
s
v
lt
y xy ^y
User Signature Date z V
Task Manager Signature ) i Date
CALIBRATION LOG Document No OCONNORFU5 Markson Digital pHtemperature Meter Model 95 Page 1 of 1
Instrument Serial No
Date Time User
Temperature check vs mercury thermometer
Probe reading Thermometer reading
Upon completion of calibration procedure does pH probe checkout vs pH 40 buffer Reading bull lt x pH 70 buffer Reading bull
Comments v
X x
User Signature X^ Date
Task Manager Signature Date
Document No QCONNORFT f
Page
PHOTOGRAPH LOG
Project Name
Project No
Camera and Film Specifications
FILM
ROLL FRAME
DATE nTIME PHOTOGRAPHER PHOTO NUMBER
DESCRIPTION
lt3
ni
I X
V
V
gt
Document No QOONNORm7
HEALTH amp SAFETY QUALITY ASSURANCE CHECKLIST
Page 1 of 2 Project No Site Date Completed by
A On-site Operations During Hazardous Waste Site Investigations
yes no Team understands task procedures safety plan individual roles and site history contaminants
yes no Team knowledgeable to hospital route nearest phone location and who is responsible for health and safety on site
yes no Establishment of command post and decon station with Health amp Safety Plan readily available
yes no Establish communication or line-of-site maintained
yes no Field operations conformed environmental monitoring respiratory protection or emergency response
yes no Protective clothing and respiratory protection maintained
yes no Decontamination procedures performed on the following sample containers sampling equipment and personnel
yes no Equipment protected clean calibrated and being used properly by site personnel
yes no First Aid Equipment readily available at site with checklist and eye wash
yes no Site personnel trained in CPR and First Aid
yes no Site Records maintained such as field logbooks respirator usage log incident reports in place and up-to-date and any deviations or modifications to Safety Plan
GEI Consultants Inc
uocutrenc uujmutvrLz
HEALTH amp SAFETY QUALITY ASSURANCE CHECKLIST
Page 2 of 2 Project No Site Date Completed by
B Health amp Safety Follow-up Reports
o Adherence to procedures o Accidents o Unsafe practices or conditions o Results of environmental monitoring o Corrective action
GEI Consultants Inc
Document No Q00NN0RFL9 CHAIN OF CUSTODY RECORD
DOCUMENT NUMBFR rn tLORD
RELINQUISHED DYISiONruRE OATETJMD RECEIVED DY (SIGNATURE) RELINQUISHED DY (SIOHATURER DATETI^IE RECEIVED BY (SIGNATURE)
IIElINOUISIIEO BY(SIGNATURE) DATETIMf DATETIME gt REMARKS lcNAruDn^nLADOnATonvorI
P a g e o f
Document No OCONNORFLIO
Page of G E I C o n s u l t a n t s I n c
Project No
Project Name _
Laboratory Contact
Sampler ( s ) Date Assigned Date Sampled
GEI Sample No
Sample Medium
Quantity
Sample Container
Type
Analyses Requested Remarks
Special Instructions Remarks
Document No 0CQNNDRFL11
NONCONFORMANCE REPORT
Project Project No
Auditor Audit Date Finding No
FINDING
Where found Check Lit Item
ControllingDocument Section
Task Description
Noncenformanee
Discussed with
Recommended Corrective Action
Is system correction needed to prevent recurrence Yes No If yes state recommended action
Schedule Completion Date By
CORRECTION ACTION
Correction Action by Date
QA Approval of Correction Action by Date
Date Completed Submitted by
Correction Action Verified by Date
I T E S T P I T L O G QCONNORFL12
PROJECT
LOCATIONI CLIENT
CONTRACTOR EQUIPMENTI OBSERVED BY
I DEPTH BELOW
GROUND SURFACE
I (FT)
I
I
I
1
1
1
1
I
1 REMARKS
PROJECT NO
LOCATION
GROUND EL
DATE DATUM
SOIL DESCRIPTION
PIT DIMENSIONS (FT) LENGTH WIDTH DEPTH
ltJgt G E I 1
I Docuaent No 0C0NNCRFL13
bull GEI CONSULTANTS IMC 53 Regional Drive Concord New Hampshire 03301-8500 (603)224-7979
BARN SAMPLING FORM Serial I
PROJECT INFORMATION
Project Name Source Control Pre-Oesion Studies
I Site Name(if different) OConnor Co site
Project Number
I Analytical Lab(s) ERCO EPA
GEI GC screen Other(Specify)
I METHOD OF SAMPLING
WIPE SAMPLING OF HON-POROUS SURFACES
I U000EH UALL SAMPLING UITH DRILL BIT
OUSTSOIL SAMPLING OH FLOOR SLAB
( CONCRETE SAMPLIHG ITH MORTAR BIT
(OTHER-Explain)
I
DESCRIPTION OF SAMPLE
Brief Description of Type of Material or Item Sampled
Visible Staining NO Visible Staining
Approximate Area of Stain(if any) X
LOCATION OF SAMPLE
Ground Floor Second Floor Loft
(All Measurements in Feet to 010 Foot)
Distance Along Z Axis from Reference Origin
Distance Along M Axis from Reference Origin
Height of Sample Above Floor Slab
SKETCH IN APPROXIMATE HORIZONTAL LOCATION OF THE SAMPLE COLLECTED ON FIGURE BELOU
I UALL X
I
I
UALL U UALL Y
I
I Reference Origin UALL Z
I Approximate Scale 1 inchbull 15 feet
I Sample I0(s) SIGNATURE OF SAMPLER CERTIFIES ABOVE SAMPLING RECORD
Date Time
I Sampler(s) COC Docunent Signature Date
I
CALIBRATION LOG Document No OCONNOR FL14 Dexsil L-2000 PCB Analyzer Page 1 of 1
Instrument
Serial No
Date
Time
User
Ambient Temperature deg C
Standard used (50 ppm chloride)
Reading beforeadjustingCALIBRATE knob
Reading after adjusting CALIBRATE knob
Comments
User Signature Date
Task Manager Signature Date
Document No OCONNORFL15 I BORING LOCATION DATE START FINISH
GROUND ELEVATION (NGVO ) DRILLED BY
GROUNDWATER El DATE LOGGED BY TOTAL DEPTH (FT) PG OF
I EL DEPTH S A M P L E
Its TYPE BLOWS PEN REC R E M A R K S QO SOIL ANO ROCK DESCRIPTIONSlt_land PER aFT FT NO 6 IN IN IN lt9
I
I
I
I
I
1
1
I
1
I
I
I
I
I
I BLOWS PER (-140IBHAMMER FALUNS 30T0 DRIVE NOTES A 20 IN 00 SPLIT SPOON SAMPLER
PEN-PENETRATION LENGTH OF SAMPLER OR CORE BARREL REC-RECOVERY LENOTH OF SAMPLE ROO-LENOTM OF SOUND CORES gt4INLENSTH COREO S-SPLIT SPOON SAMPLE PROJECT
I U-UNOtSTURBCO SAMPLES UF-FIXEO PISTON _ UO-OSTER8ERO bully OROUNOWATER 0 G E I
I
I
I
I
I
I
I
I
I
1 1 1 1 1 1 1 I 1 1 I
Document VoL H SC SAP Appendix C Revision 0
Date January 17 1991 Page 1
APPENDIX C
EQUIPMENT CALIBRATION PROCEDURES
Document Vol II SC SAP Appendix C Revision 0
Date January 171991 Page 2
HNu PI-101
The HNu PI-101 is factory calibrated twice a year andor if the instrument is malfunctioning Prior to field use and at the end of each day the user of the instrument will check that the instrument is still holding calibration using the following procedures
1 Prior to the calibration check check the instrument with an Organic point source (ie magic marker) prior to use to verify that it is functioning
2 Connect the rubber sampling hose from the span gas cylinder regulator to the sampling
probe of the HNu gt
3 Fully open the regulator valve gt vy
4 Note the instrument meter response after 5 to 10 Seconds y
5 If the response deviates + 15 from the coneentration of the calibration gas (this figure appears on the cylinder label) the instruihehtTeq^es factory maintenance and will not be utilized in the field until factory calibratiori^Tah alternate meter will be used after calibration checking v (
V 6 Document the calibration information Oik the appropriate equipment calibration log
(OCONNORFL2) ~y
Document VoL IISC SAP Appendix C Revision 0
Date January 17 1991 Page 3
MIE MINIRAM Model PDM-3
The MINIRAM will be factory calibrated once a year andor if the instrument is malfunctioning Prior to field use and at the end of each day the user will zero the instrument using the following procedure
1 With the MINIRAM off insert MINIRAM into Zerobag andseal the Zerobag
2 Inflate Zerobag with filtered air containing no particulates using-attached hand pumpx- V
S
3 Press ZERO button on MINIRAM and wait 30 seconds MINIRAMshould read OFF
4 Pull MINIRAM out of Zerobag
5 Press MEAS button and wait 60 seconds for MINIRAM to go through self-tests
6 The MINIRAM is now functioning and wilJLtake-readings every 10 seconds
7 Document the calibration information onthe appropriate equipment calibration log (OCONNORFL3) V
lt
v
Document VoL II SC SAP Appendix C Revision 0
Date January 171991 Page 4
MARKSON DIGITAL MODEL 103 CONDUCTIVITY METER
The Markson Conductivity meter will be calibrated prior to and following each days field use using the following procedures
1 Rinse the conductivity probe with distilled water gt
2 Pour enough Cole-Parmer conductivity calibration solution (1413 xS 25degC) in a clean plastic Ziploc bag to be able to completely immerse the conductivity probe
3 Immerse the conductivity probe in the standard solution and shakdTree any bubbles that may cling to the cell
4 Allow about 1 minute for the cell to reach equilibrium temperature x X
5 Set the cell adjust control at the bottom of the meter to display the value of 141
6 Carefully rinse cell with water after calibration and after each use V~
7 Document the calibration process onjlie equipment calibration log (OCONNORFL4)
Document VoL H SC SAP Appendix C Revision 0
Date January 17 1991 Page 5
MARKSON MODEL 95
Combined Digital pHtemperature Meter
The Markson 95 combined digital pHtemperature meter will be calibrated prior to and following each days field use using the following procedures
1 Insert electrode into digital meter The reference pin should also be properly connected Temperature probe should be plugged all the way into the ATC jack
2 Remove protective cap and push rubber sleeve such that the potassium chloride filling hole is exposed gt
3 Rinse both pH and temperature probe in distilled water 4 Immerse both pH and temperature probe into buffer 700 solution 5 Set FUNCTION switch to TEMPERATURE to read temperature 6 Set FUNCTION switch to ATC and adjust the readout to the pH value of buffer 700 corresponding
to the temperature measured in E with the CALIBRATE control See Chart 1 7 Rinse electrode and temperature probe withdistilled water 8 Immerse both pH and temperature probe into buffer^401 9 Repeat E V ~ 10 Set the FUNCTION switch to ATC and adjust the readout to the pH value of the buffer 401
corresponding to the temperature measured in Iwith the SLOPE control See Chart 1 11 Rinse the electrodes and temperatureprobe-with distilled water Model 95 is calibrated and ready
for use 12 Document the calibration process on the equipment calibration log (OCONNORFL5)
^ CHART
Temp (C) Buffer Solution 70 X -X
Buffer Solution 40
5 y 700 401 10 708 399 15 706 399 20 703 399 25 701 399 30 700 400 35 699 401 40 698 402 50 698 403 60 697 405
Document VoL II SC SAP Appendix C Revision 0
Date January 171991 Page 6
Dexsil Model L-2009 PCB Analyzer
The Dexsil PCB Analyzer will be calibrated prior to each days field use using the following procedures
Initial Preparation
1 The electrode must be filled with Orion filling solution before it is operational Fill the electrode up to the hole in the side of the epoxy body by-placing the nozzle of the filling solution in the hole and squeezing the bottle 7
2 Drain the electrode while holding it upright over thewaste beaker Grasp the epoxy body firmly in one hand and push down on the white cap which is connected to the cord The solution will then drain out of the bottom of the electrode
Vgt 3 Refill the electrode and check to makesure that the liquid is making contact between the black
cone and the plastic shell at the bottom of theelectrode If it is not making contact at all points drain the electrode again and refill
4 Plug the electrode into the back of the L-200Qj)laeeJt in a vial or rinse solution and turn the instrument on Switch the analysis knobtdfnVand wait a few minutes until the reading stabilizes
Calibration O Imdash^
1 Fill a vial about half way with 50 parts per million calibration solution
2 Turn the analysis selectQrJcnob to CAL
3 Remove the electrode from the rinse solution dry it carefully with a tissue and place it in the calibration solution SWiri the electrode gently for a few seconds and then stop Push the start button on the instrument^
4 When the READ light comes on adjust the CAL knob so that the instrument reads 50
5 Remove the electrode from the calibration solution wipe it dry and place in the rinse solution
6 If this is the first calibration since the instrument has been turned on or since the electrode has been filled repeat steps 34 and 5
7 Document the calibration information on the appropriate equipment Calibration Log (OCONNORFL14)
Document Vol II SC SAP Appendix D Revision 0
Date January 17 1991 Page 1
APPENDIX D X
list of Acronyms
Document Vol II SC SAP Appendix D Revision 0
Date January 17 1991 Page 2
ACRONYMS
ASTM American Society for Testing and Materials CLP Contract Laboratory Program CMP Central Maine Power Company DEP Department of Environmental Protection (Maine) DQO Data Quality Objectives EPA Environmental Protection Agency [US) FL Field Log FSP Field Sampling Plan ltys GEI GEI Consultants Inc gt HSP Health and Safety Plan X
MIE Monitoring Instrumentsforthe Environment MOM Management of Migration NA Not Applicable X lt OSHA Occupational Safety anaHeakh Administration OSWER Officer of SolithWaste and Emergency Response PCB PolychlorinatecFBiphenyk ppb Parts per billion v7 ppm Parts per million QA QuaUtyAssuranck ) QAO QudU$~^sitraquoance Officer QAPP QualityAssurance Project Plan QC Qukkty Gontrof PIP -Thotoionization Detector RDRA -mdashRemedial DesignRemedial Action RI Remedial Investigation ROD x^XRecbrd of Decision RPD X^Relative Percent Difference RPM Remedial Project Manager RSD Relative Standard Deviation SAP Sampling and Analysis Plan SC Source Control SOW Statement of Work TPH Total Petroleum Hydrocarbons VOC Volatile Organic Chemical or Compound
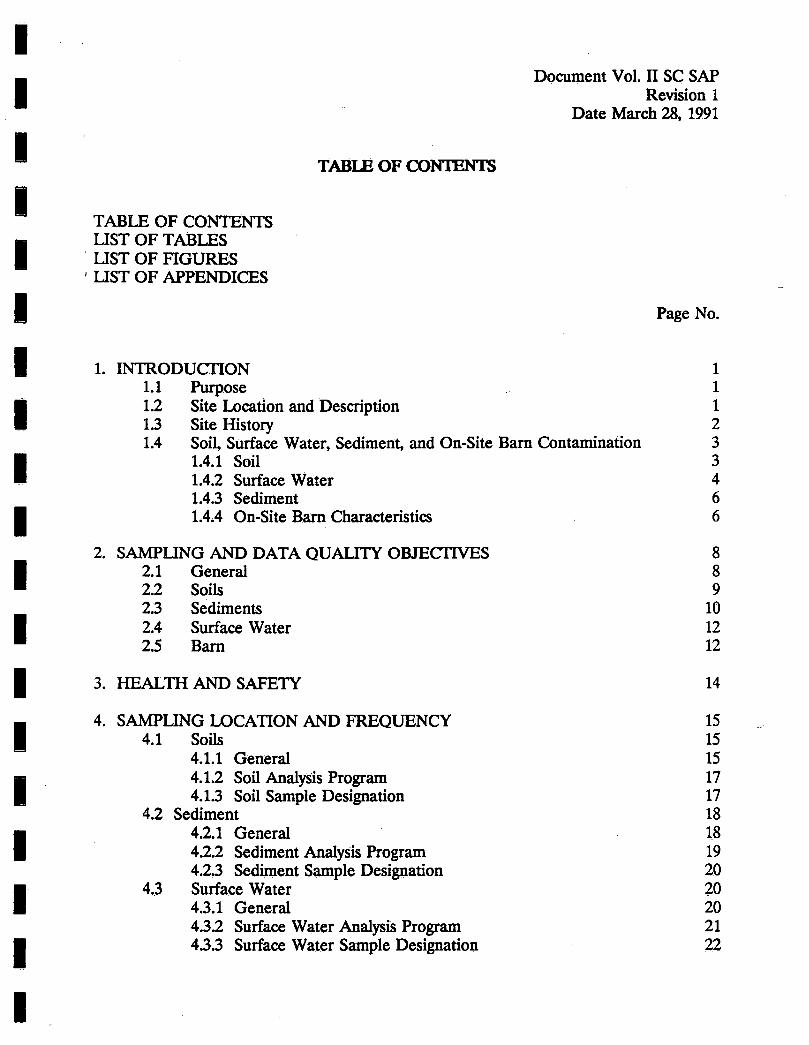
Document Vol II SC SAP Revision 1
Date March 28 1991
TABLE OF CONTENTS
TABLE OF CONTENTS LIST OF TABLES LIST OF FIGURES LIST OF APPENDICES
Page No
1 INTRODUCTION 1 11 Purpose 1 12 Site Location and Description 1 13 Site History 2 14 Soil Surface Water Sediment and On-Site Barn Contamination 3
141 Soil 3 142 Surface Water 4 143 Sediment 6 144 On-Site Barn Characteristics 6
2 SAMPLING AND DATA QUALITY OBJECTIVES 8 21 General 8 22 Soils 9 23 Sediments 10 24 Surface Water 12 25 Barn 12
3 HEALTH AND SAFETY 14
4 SAMPLING LOCATION AND FREQUENCY 15 41 Soils 15
411 General 15 412 Soil Analysis Program 17 413 Soil Sample Designation 17
42 Sediment 18 421 General 18 422 Sediment Analysis Program 19 423 Sediment Sample Designation 20
43 Surface Water 20 431 General 20 432 Surface Water Analysis Program 21 433 Surface Water Sample Designation 22
Document Vol II SC SAP Revision 1
Date March 28 1991
44 Barn 22 441 General 22 442 Barn Analysis Program 23
443 Barn Sample Designation 241
5 SAMPLING EQUIPMENT AND PROCEDURES 25 51 Air Monitoring 25
52 Soil Sampling 25 521 General 25 522 Soil Sampling Methods for Test Pits 26 523 Soil Sampling Methods for Borings 28
53 Surface Water 30 531 General 30 532 Surface Water Sampling Methods 31
54 Sediment 32 541 General 32 542 Sediment Sampling Methods 32
55 Barn 34 551 General 34 552 Barn Sampling Methods 34
6 SAMPLE HANDLING AND ANALYSIS 38 61 General 38 62 Sample Labeling and Documentation 38 63 Chain-of-CustodySample Assignment 38 64 Sample Shipments 39
TABLES FIGURES APPENDICES
Revision 1 includes additional Page 24a as an expansion to Section 4
LIST OF TABLES
TABLE 1 - Soil Sampling Schedule TABLE 2 - Soil Analysis Program TABLE 3 - Sediment Analysis Program TABLE 4 - Surface Water Analysis Program TABLE 5 - Barn Sampling Analysis Program TABLE 6 - Soil Sampling Equipment TABLE 7 - Sediment Sampling Equipment Requirements TABLE 8 - Surface Water Sampling Equipment Requirements TABLE 9 - Barn Sampling Equipment Requirements TABLE 10 - Sample Containers and Preservation Requirements
bullv LIST OF FIGURES
gtFIGURE 1 - Site Location Map lt FIGURE 2 - Location of Transformer Work Areas and Swales FIGURE 3 - Soil Sampling Locations FIGURE 4 - Surface Water and Sediment-Sampling Locations FIGURE 5 - Example Barn Sampling Locations
lt
LIST OF APPENDICES
APPENDIX A - and Safety Plan APPENDIX B - field Logs APPENDIX C - iquipmentiCalibration APPENDIX D - ^ofAc^onyms
Document Vol II SC SAP Revision 0
Date January 17 1991 Page 1
1 INTRODUCTION
11 Purpose
This document is the Field Sampling Plan (FSP) portion of the Sampling and Analysis Plan for Source Control components of Pre-Design Studies for Remedial DesignRemedial Action at the OConnor Co Superfund Site in Augusta Maine The overall objectives of the Source Control Sampling and Analysis Plan (SC SAP)are to document objectives procedures and rationales for sampling and analytical workprovide rationale for sampling and analytical protocols and provide a mechanism for planning anchapproving Pre-design Source Control field sampling and laboratory activities
gtThe Field Sampling Plan (FSP) defines the samplinganddata-gathering methods to be used during the Source Control component of the Pre-Desigp phase This FSP has been developed in accordance with the requirements of Part Bin Attachment A to the Statement of Work for Remedial DesignRemedial ActftmTbr the OConnor Superfund Site dated July 30 1990
The Quality Assurance Project Plan (QAPP) is provided as Volume I of the Source Control Sampling and Analysis Plan ^~N ygt
)
12 Site Location and Description J N ^
The OConnor Site (Site) is located along QS Route 17 near the eastern boundary of the city limits of Augusta Maine^Eigure 1) The Site covers approximately nine acres within a larger 65-acre parcelThe SiteXis currently surrounded by a chain link fence and is abutted by woodlands toHh^north) and west US Route 17 to the south and the west branch of Riggs Brook and itassociated wetlands to the east
The Site is situated on the crest of a low ridge which is aligned parallel to Riggs Brook Principal features on the property include a large barn that formerly housed scrap operations an Upland Marsh an adjacent low area of fill two surface water impoundments (lagoons) three former outdoor transformer work areas (TWAs) and a former scrap area (Figure 2) Site drainage is principally controlled by the slope extending downward toward Riggs Brook and man-made drainage features connecting the Upland Marsh on the top of the ridge to Riggs Brook
Access into the Site is via an unimproved gravel road from US Route 17 that passes through a wooden fence near the on-site barn and follows the ridge line of the property to die northeast for approximately one-quarter mile to the wooded area of the Site Three
Document Vol II SC SAP Revision 0
Date January 17 1991 Page 2
separate and distinct transformer disassembly areas are situated along the access road and are identified by oil-stained soils metal wire and porcelain fragments The three areas are identified as transformer work areas (TWAs) I n and HI A former scrap-yard (Scrap Area on Figure 2) is located within the wooded area beyond TWA in Empty tanks white goods automobile bodies tires sheet metal and other items were stored or discarded in this Scrap Area
gtThe barn consists of a three-story wooden structure with a plan area of approximately 3100
square feet The barn has a concrete floor slab and contains ^large-variety of items These
items consist chiefly of the following furniture metal racksand doors lumber electric
meters automobile parts a wood stove heating registers an antiqueautomobile a boat
and a large amount of miscellaneous metal scrap debris gt v
13 Site History lt ltvy
lt
The Site was primarily used as grazing land until the l950sgtrhen the F OConnor Co started a salvage and transformer recyclingbusiness ThV salvage processes included stripping and recycling transformers that contaibedpblyehlorinated biphenyl (PCB)-laden oils As a result Of the uncontrolled releases ofPCB afthe Site the Site was placed on the National Priorities List (NPL) On March 231985 United States Environmental Protection Agency (EPA) and Maine DepartmenTof Environmental Protection (DEP) issued an Administrative Order to the OCohndPs and Central Maine Power Company (CMP) (Docket No 1-86-1031) identifying eachas-aPotentially Responsible Party (PRP) to (1) remove known threats to the public health or welfare which exist on-site (tanks of oil) (2) secure the areas of the Site thaLhave known contaminated soils (3) conduct a Remedial Investigation (RI) and (4jyjrepare a Feasibility Study (FS) In response to the Administrative Order CMPberformed the following interim remedial actions
bull Construction of a chai compassing TWA I and TWA II (approximately 75 acres) and the majority of the^sit^-related chemicals (1985)
bull Sampling cleaning and removal of 20 on-site storage tanks (1986)
bull Removal of over 500 tons of material from the scrap area and sampling of soils beneath the scrap (1987)
bull Extension of the chain link fence to secure TWA HI and part of the TWA II drainage swale
Currently two lagoons located on the slope leading down to Riggs Brook serve as detention basins for surface water flow from the Upland Marsh The portion of the Site currently
Document Vol II SC SAP Revision 0
Date January 17 1991 Page 3
fenced includes TWA I n and III part of the scrap area and all areas in which residual PCBs are present in soils The RI and FS were conducted by CMP and their consultant EC Jordan Co The objectives of the RIFS were to provide the necessary information to 1) identify and assess the existing and potential public health andor environmental risks which may be caused by the release or threatened release of hazardous substances pollutants or contaminants and (2) formulate and evaluate alternative recommendations for the remedial actions needed if any to prevent or mitigate the migration release or threatened release of hazardous substances
14 Soil Surface Water Sediment and On-Site Barnc Contamination and Remedy Description )
141 Soil s lt w
During the RI approximately 500 surface and Subsurface soil samples were collected by grab sampling shallow borings or test pits PCBs and lead were the principal contaminants found in the surface pTno^05-feet deep) soils and PCBs and carcinogenic polycyclic aromatic hydrocarbons-^(cPAHs) were the principal contaminants detected in the subsurface (05lO12-feet deep) soils
The highest concentrations of PpB^contaminated soils were found primarily within the former transformer work areas (TWAS)r-and the drainage areas associated with these TWAs (Figure 2) Contaminatedsoikinthe TWAs were found to contain up to 200000 parts per million (ppm^PCBs However the most contaminated soils (greater than 500 ppm) constitutelless than 125 of the total estimated volume of soil contamination (23500-trubic yards) and most of the contaminated soil contains PCBs at concentrations le^sthan 50 ^pm Lead was detected above background (ie approximately 70 ppm^average) principally in the surface soils within TWAs I and II with the maximum leachc^neentfation occurring at 4100 ppm within TWA II
Subsurface soil samples taken from TWAs I and II and the low area hear the Upland Marsh contained cPAHs The low area is an area where sediment dredged from the Upper Lagoon in 1977 was deposited adjacent to the area currently containing the Upland Marsh Disposal of this sediment resulted in blockage of natural drainage and formation of the Upland Marsh The depth of vertical migration of the cPAHs appeared to be limited to the upper 6-feet within TWA I and the low area while a small pocket of cPAHs was found to exceed 8 feet within TWA II The maximum cPAH concentration of 30 ppm was found within the low area Depth of PCB contamination in the subsurface soils outside of the TWAs was typically limited to less than 2 feet while PCBs were detected within TWAs I and II at depths of up to 12 feet
Document Vol II SC SAP Revision 0
Date January 17 1991 Page 4
Cleanup standards for soil were determined based on a public Health Environmental Risk Assessment performed by the EPA Cleanup standards are summarized below compared to maximum concentrations of chemicals encountered at the site
Maximum Concentration Soil Cleanup Chemicals Detected Standards
(ppm) (ppm)
Lead 4100 248 x
cPAHs 30 dX X PCBs 200000 1 gt bull
bullX
The RODspecifies that approximately23500 cubicyardsjof contaminated soils contain PCBs cPAHs and lead above the established Cleanup standards are to be treated on site using a solvent extraction technology This technology principally involves the use of a solvent to extract the PCBs and cPAHs from the contaminated soils The contaminated liquids containing the extracted PCBs and cPAHs will be destroyed at a licensed off-site TSCA incinerator AddkionaHyr-soil treatment residues resulting from the solvent extraction process that haveJlacNevels above the 248 ppm cleanup standard will undergo further treatment using n solidificationstabilization treatment technology Those solid treatmentNresidues jesulting from the solvent extraction process that do not achieve the cleahup-standards and that have undergone additional treatment through solidificationstabilization will be transported off-site to a licensed landfill It is currently estimated by the EPA that 5000 cubic yards of the total 23500 cubic yards of contaminated soils undergoing solvent extraction will require off-site disposal
142 Surface Wateiv
The on-site surface waterNirainage features include an Upland Marsh an Upper Lagoon and a Lower Lagoon (see Figure 2) The Upland Marsh drains to the Upper Lagoon via a subsurface drainage pipe The Upper Lagoon drains to the Lower Lagoon via a drainage swale The water that flows out of the Lower Lagoon follows a drainage swale to Riggs Brook
In 1976 under the advice of Maine DEP the two lagoons were constructed in an attempt to control oil migration The Upper Lagoon was constructed with a concrete retaining wall and an inverted siphon to prevent migration of oils floating on the lagoon surface Floating oils were collected and contained in six large on-site storage tanks The lower lagoon was excavated at the base of the slope and constructed with an earthen berm and a horizontal pipe discharge
Document Vol n SC SAP Revision 0
Date January 17 1991 Page 5
In 1977 under the direction of the Maine DEP the use of the lagoons was discontinued The water from the Upper Lagoon was placed in storage tanks and the sediments were excavated and placed in the low area shown on Figure 2 The sediments placed in the low1- area were underlain by a 1-foot-thick layer of marine clay and then covered with a clayey soil less than 6 inches thick The filling of the low area created a barrier to the previous natural surface water drainage and resulted in the formation of the Upland Marsh In an attemptto drain the marsh the subsurface drainage pipe was installed between the marsh and the Upper Lagoon in September 1978 The saturated area of the Upland Marsh presently still exists
On-site surface water quality was measured at five sampling locations These include one surface water sample from each of the lagoons and one from the Upland Marsh The surface water quality data in the RI indicated that PCBs (from unfiltered samples) were detectable in the Upper and Lower Lagponsyand in drainage from the Lower Lagoon but were not detected in surfacewater samples taken from Riggs Brook PCB concentrations in the on-site surface waters for the EowersLagoon the Upper Lagoon and Upland Marsh were 055 ppb 16 ppb^jand non-detected respectively Other contaminants of concern in the on-site urfkceTwaters were the inorganic chemicals lead and aluminum Lead was found at concentrations ranging from 36 to 13 ppb in all the on-site surface waters Additionally aluminum was detected in the on-site surface waters at concentrationsrangfog from 236 to 3740 ppb
O V Cleanup standards for surface water were determined based upon a Public Health
Environmental Risk Assessment performed by the EPA Cleanup standards are
summarized below compared to themaximum concentration of chemicals encountered
at the site N v
Surface Water Maximum Concentration Cleanup
Chemicals xD6tected Standards (PPb) (ppb)
Lead 13 194 Aluminum 3740 87
PCBs 16 0065
The selected remedy for surface water remediation at the site is pumping of surface water from the Upper and Lower Lagoons and Upland Marsh and disposal off-site unless otherwise approved by EPA The ROD indicates that the approximately 150000 to 195000 gallons of surface water are contained in the Upland Marsh and Upper and Lower Lagoons
Document Vol II SC SAP Revision 0
Date January 17 1991 Page 6
143 Sediment
The sediment sampling program conducted during the RI consisted of a total of 23 sediment samples from 19 locations both at on-site and off-site locations A total of six sediment samples were collected from the Upland Marsh Upper Lagoon and Lower Lagoon consisting of two samples from each of these surface water bodies Other samples were collected from Riggs Brook and drainage swales between the lagoons and Riggs Brook
xPCBs were detected in the sediment samples obtained from thexdge of the Upland Marsh both on-site lagoons and the Lower Lagoon drainage area leading into Riggs Brook PCB concentrations were highest in the Upper Lagoon (up to 1100 ppm) but decreased significantly downstream in the Lower iiigoon PCB concentrations were lowest in the drainage swale downstream fronii dieLower Lagoon (approximately 4 ppm) Cleanup standards for the sedimentswere~detennined based on a Public Health Environmental Risk Assessment performed by the ERA Cleanup standards are summarized below compared to maximiimgtCQncentrations of chemicals encountered in sediment samples from the Upland MSrsh Upper Lagoon and Lower Lagoon
Vmdash ( Sediment
MaximumConcentration gt Cleanup Chemicals Detected-^ v Standards
( (PPF1) -mdash (PPm)
Lead 28 248 cPAHs y 1 PCBs 1100 1
The ROD indicates that the cm-site sediments will be dredged and the sediment containing chemicals above^tbe established cleanup standards will be treated using the solvent extraction technology as described in Section 141
144 On-Site Barn Characteristics
The barn has been reported to formerly house scrap operations A surficial soil sample taken from within the barn (JSS1) during the RI was collected and analyzed for the presence of PCBs and lead The exact nature or matrix of the surficial soil (eg dust concrete wood) collected from within the barn could not be ascertained from the available documents The results of the PCB screening indicated a concentration of 96 ppm PCBs Lead was detected at a concentration of 1610 ppm No analysis for cPAHs was performed on the sample from the barn
Document Vol II SC SAP Revision 0
Date January 17 1991 Page 7
In the ROD EPA set soil cleanup standards for the site of 1ppm PCBs 1ppm cPAHs and 248 ppm lead The cleanup standards for barn materials were not specified in the ROD by EPA However the ROD specified that the barn would undergo decontamination procedure if contamination was present above cleanup standards (to be determined) through collection of soil dust and other loose material and these materials would be combined with the other contaminated soils and sediments for on-site solvent extraction treatment Large scrap items in the barn would then be removed for disposal off-site and the barn structure would be sampled for detection of the presence of contamination Following sampling and analysis of the barn structure the barn would be demolished and transported to an off-site facility for appropriate disposal ^gt
N
Document Vol II SC SAP Revision 0
Date January 17 1991 Page 8
2 SAMPLING AND DATA QUALITY OBJECTIVES
21 General
Sampling of soils surface water sediments and the on-site barn and its contents will be performed during the Source Control (SC) component of the Pre-Design Study Pre-Design SC sampling results will be used in the design of the SourceControl component of the remedy and development of the treatability testing program for soil and sediment
Pre-Design SC sampling will include N
Collection of surface water samples from the Upland Marsh and Upper and Lower Lagoons in April 1991 V
x
Collection of sediment samples from the Upland Marslkahd Upper and Lower Lagoons in April 1991 ^
Collection of soil samples from test pits and^Orihgsrin April 1991
bull Collection of samples of soil woodimckconcrete from the on-site barn floor and Walls and wipe samples from debris andlquipment located within the barn in May 1991
V-X7EPAs guidance document Data Quality Objectives for Remedial Response Activities (OSWER Directive 93550-78Jdarch 1987) identifies four analytical levels
Level I - field screeningoranalysis using portable instruments Results are often not compound specific and o^ qualitative in nature
Level II - field analyses using mbresophisticated portable analytical instruments Results are more reliable in terms of compound identification and may be semi-quantitative
Level El - laboratory analyses by established referenced methods Results are quantitative and compound specific
Level TV - EPA Contract Laboratory Program (CLP) services utilizing rigorous QAQC protocols and documentation
Level V - Laboratory analyses by non-standard methods Identified in the CLP asspecial analytical services
Document Vol II SC SAP Revision 1
Date March 28 1991 Page 9
A combination of Level I Level in and Level IV analytical protocols will be specified during Pre-Design SC sampling EPA Contract Laboratory Program (CLP) protocols prescribed in the 1988 Organic and Inorganic Statement of Works will be utilized for laboratory analysis of target compounds (PCBs cPAHs lead and aluminum) in surface water sediment soil and barn samples The analytical protocols that will be utilized for Pre-Design SC sampling are detailed in the SC Quality Assurance Project Plan (QAPP) included as Volume I of the SC SAP
22 Soils
Soil samples will be collected and analyzed to provide additional data for comparison with cleanup standards for design of the Source Control program at the OConnor Site Data will be used to refine the previously estimated volume of soils contaminated at various concentrations above the cleanup standards and to provide additional information at areas with apparent data gaps on the lateral and vertical extent of soil with PCB concentrations greater than 1 ppm Soil also will be collected at specified locations to provide samples for solvent extraction treatability bench-scale testing Samples selected for treatability testing will contain PCBs at concentrations previously not examined during limited bench-scale testing performed during the Feasibility Study (FS) The effectiveness of solvent extraction on removal of lead cPAH and PCB contamination will be examined during the bench-scale treatability studies performed during Pre-Design
The soil sampling program performed during the RI was designed to estimate the horizontal and vertical distribution of soils contaminated with PCBs lead and cPAHs above the cleanup standards The distribution of PCBs lead and cPAHs are summarized in the RI on Figures 4-8 4-10 and 1-10 respectively GEI identified several inconsistencies in the distribution of contaminated soils within the summary figures For instance the distributions of PCB contamination shown on Figures 1-6 and 4-8 in the RI in the northern portion of the site near TWA III do not agree Also previous soil sampling did not consistently confirm the horizontal and vertical limits of PCB contamination The vertical limits of the PCB contaminationwere not adequately identified for remedial design purposes near transformer work areas and along drainage pathways where PCB migration has occurred
The effectiveness of solvent extraction as the selected remedy for treating the on-site soils was not fully demonstrated during the FS The bench-scale testing that was performed during the FS did not investigate the full range of contamination levels and recovery efficiencies from different soil types that exist on the site
There are three primary objectives for collection of soil quality data during the Pre-Design studies
Document Vol II SG SAP Revision 1
Date March 28 1991 Page 10
1 Collect additional data with close control of analytical precision to evaluate datagaps and inconsistencies reported during the RI The collection of these data will primarily be performed near TWAs and drainage pathways
2 Refine the previously estimated volume of soils contaminated at various concentrations above the cleanup standards
3 Evaluate theselected remedy of solvent extraction through bench-scale testingof soils with specific ranges of PCB concentrations
All soil samples collected for treatability bench-scale testing will also have an aliquot collected for PCB analyses by Ceimic Corporation of Narragansett Rhode Island This will provide added confidence that designated samples are within the specified ranges of PCB concentrations for solvent extraction bench-scale testing
In order to facilitate comparison of Pre-Design Study soil quality with RI study soil quality rigorous QAQC protocols and documentation will be needed All sampleswill be analyzed by Ceimic Corporation using 1988 CLP protocols Analytical Level IV (CLP QAQC and documentation) will be utilized on 20 percent of the soil samples collected The remaining 80 percent will be analyzed according to 1988 CLP protocols utilizing Analytical Level III (CLP QAQC butwithout CLPdocumentation) These serviceswill provide detection limits at or below the ROD Cleanup Standards
During Pre-Design sampling equipment blanks will be collected and analyzed after decontamination of sampling equipment to identify artifact contamination that could result from incomplete decontamination of equipment Trip blanks will also be included during sample shipment to identify cross-contamination during transportation to Ceimic Corporation The laboratory and field QAQC procedures described above will enable the precision required to satisfy the objectives of the soil sampling component of this study
23 Sediments
Sediment samples will be collected and analyzed to provide additional data for comparison with the cleanup standards for design of the Source Control program at the OConnor site Data will be used to supplement the sediment quality data previously collected in the RI for a refined estimate of the levels of lead cPAH and PCB contamination in the sediments of the Upland Marsh Upper Lagoon and Lower Lagoon In addition a composite sediment sample from the Upper Lagoon and a composite sediment sample from the Lower Lagoon will be collected for solvent extraction treatability bench-scale testing Treatability testing on contaminated sediments was not performed during the FS The effectiveness of solvent extraction on removal of lead cPAHs and PCBs from sediments will be examined during the bench-scale treatability studies performed during Pre-Design
Document Vol II SC SAP Revision 1
Date March 28 1991 Page 11
The sediment quality data collected during the RI was limited Only two sediment samples were collected from the Upland Marsh Upper Lagoon and Lower Lagoon In addition limited data have been previously collected regarding the volume of contaminated sediment on-site
There are three primary objectives for sediment quality data to be collected during Pre-Design studies
1 Collect additional data with close control of analytical precision to examine levels of contamination in sediment at locations previously not investigated This will include two additional samples from the Upper Lagoon two additional samples from the Lower Lagoon and six additionalsamples from the Upland Marsh The investigation in the Upland Marsh will be directed towards delineating the extent of contamination in the westerly (upstream) direction
2 Refine the previously estimated volume of sediment in the Upland Marsh Upper Lagoon and Lower Lagoon
3 Evaluate the solvent extraction remedy effectiveness on treatment of sediment through bench-scale testing
In order to facilitate comparison of Pre-Design Study sediment quality with RI study sediment quality rigorous QAQC protocols and documentation will be needed Only sediment samples containing greater than 30 percent solids (based on visual observations) will be submitted for analysis After sample collection in the field percent volume of settled sediment in the sample container will be compared to the percent volume of free water Samples will be submitted to the laboratory for analysis if the volume of settled sediment in the sample container exceeds 50 percent of the total volume of the sample All samples will be analyzed by Ceimic Corporation of Narragansett Rhode Island following 1988 CLP protocols Analytical Level IV (CLP QAQC and documentation) will be performed by Ceimic on 20 percent of the sediment samples collected The remaining 80 percent will be analyzed by Ceimic utilizing Analytical Level in (CLP QAQC but without CLP documentation) These services will provide the detection limits at or below the ROD Cleanup Standards
During Pre-Design sampling equipment blanks will be collected and analyzed after decontamination of sampling equipment to identify artifact contamination that could result from incomplete decontamination of equipment Trip blanks will also be included during sample shipment to identify cross-contamination during transportation to Ceimic
The laboratory and field QAQC procedures described above will enable the precision required to satisfy the objectives of the sediment sampling component of this study
Document Vol II SC SAP Revision 1
Date March 28 1991 Page 12
24 Surface Water
The OConnor SiteStatement of Work for Remedial DesignRemedial Action requires that surface water contained within the Upper and Lower Lagoon and in the Upland Marsh be drained collected and transported off-sitefor treatment unlessotherwise instructed by EPA
The three primary objectives for surface water data to be collected during the Pre-Design Studies are to
1 Probe surface water depths in Lagoons and Upland Marsh to obtain a better estimate of surface Water volumes to be handled during remediation
2 Evaluate changes in surface water quality that may have occurred during the approximately three-year period since sampling during the RI and evaluate extent of surface water contamination in the Upland Marsh which is at the upstream edge of the PGB contamination area
3 Collect additional data to design an appropriate program for surface water diversion pumping treatment and disposal Off-site disposal destinations as well as on-site treatment and disposal options will be examined in more detail during the Pre-Design Study
All surface water samples will be submitted to Ceimic Corporation for analysis of PCBs aluminum and lead All of these samples will be analyzed following 1988 CLP protocols including CLP QAQC and CLP documentation (Analytical Level IV) One additional sample will be collected from each surface water body and submitted to Ceimic for Total Suspended Solids Analysis (EPA Method 1602) utilizing Analytical Level III
2JS Barn
The available data for the extent of contamination of barn materials consists of one sample point The surficial soil sample collected was not described such that it is known whether the sample consisted of dust the concrete slab soil within cracks of the slab or debris samples within the barn The elevated levels of PCBs and lead within the sample may not be representative of the majority of the loose materials within the barn Furthermore no wipe sampling on non-porous debris or sampling of the wooden barn structure was performed during the RI
Document Vol II SC SAP Revision 0
Date January 17 1991 Page 13
Cleanup standards for target chemicals listed in the ROD have not yet been established by EPA for barn materials The ROD indicates that the Toxic Substance Control Act (TSCA) Spill Cleanup Policy and Disposal Regulations (40 CFR Part 761) may be used in lieu of site-specific determination of acceptable levels
Samples of selected media within the barn will be collected and analyzed to provide an initial data set to establish the degree of contamination present within the barn Data will be used in developing the work plan for decontamination and demolition of the barn and to determine appropriate disposal sites for barn demolition debriSNand loose debris within the barn Depending on data results an evaluation will be made tbvdetermine whether additional sampling will be required prior to demolition to betterseqnence demolition activities so that PCB-contaminated material can beSeparated from non-contaminated building materials and debris
ltx All soil wood and concrete barnsamples will besubmitted to Ceimic Corporation (Ceimic) of Narragansett Rhode Island for analysis of PCBs cPAHsgtand lead Wipe samples of debris will be submitted to Ceimic for analySis-ofPCBs All samples will be analyzed following CLP protocols Analytical LeveK IV-requiring CLP QAQC and reporting requirements will be utilized for 20 percent of the5amples Analytical Level in utilizing CLP analytical protocols but without the documentation requirements of CLP will be specified for the remainder of the
Document Vol II SC SAP Revision 0
Date January 17 1991 Page 14
3 HEALTH AND SAFETY
A Health and Safety Plan for the Source Control Field Sampling Plan is presented in Appendix A All personnel involved in the sampling program have been trained in accordance with the requirements of the Occupational Safety and Health Administration Regulation OSHA 1910120 Hazardous Operations and Emergency Response and are enrolled in a comprehensive medical monitoring program
A list of personnel authorized to perform work on this project ^and listing of their participation in personnel training and health monitoring programs^arepresented in the Health and Safety Plan gt
Document Vol II SC SAP Revision 1
Date March 28 1991 Page 15
4 SAMPLING LOCATION AND FREQUENCY
41 Soils
411 General
In general the soil sampling program includes collection of the following two basic categories of samples
1 Soil samples collected from test pits for possible bench-scale testing and
2 Soil samples collected from test pits and borings to fill data gaps on the lateral and vertical extent of soil contamination above cleanup standards and to refine estimates of the quantity of contaminated soils
Figure 3 shows the locations of test pits and borings planned for this investigation These locations were based on the depth delineation of 1 ppm for Total PCBs presented in the Remedial Investigation Table 1provides ageneral sampling rationale including test pit and boring identification numbers target sampling depth and elevation anticipated PCB concentration level and soil type A summary of the analyses to be performed on soil samples including replicates and blanks is shown in Table 2
A total of 12 soil samples for possible bench-scale testing will be collected from test pits during April 1991 Two samples of each soil type indicated below will be collected within the specified ranges of PCB concentrations Each sample will have a minimum volume of about 05 cubic feet (about 60 lb weight) to provide sufficient soil for bench-scale testing
PCB Concentration Range fppml Soil Types
1 to 10 Clay and Fill 10 to 20 Clay 20 to 50 Clay 50 to 500 Clay and FiU
During the RI three soil samples were collected for bench-scale treatability testing with initial PCB concentrations of 1000 4000 and 22000 ppm However sample locations had been selected to obtain samples with PCB concentrations in the range of 250 to 700 ppm based on PCB concentration contours developed during the RI
Document Vol II SC SAP Revision 1
Date March 28 1991 Page 16
Therefore PCB concentration contours developed from the RI data do not precisely indicate the extent and level of contamination
In order to gain a higher degree of confidence that samples within each specific PCB concentration range have been collected GEI will perform field PCB screening with a Dexsil L-2000 PCB analyzer to estimate the soil PCB concentration range prior to collecting the soilsample Aliquots of the 12 bench-scale soilsamples will be collected for confirmatory testing for PCB concentrations by Ceimic of Narragansett Rhode Island utilizing 1988 CLP protocols
GEI will select the soil samples for bench-scale testing after receiving the CLP laboratory results of the PCB concentrations If the laboratory data do not indicate that at least one of the two soil samples was collected from the targeted concentration ranges and soil types an additional contingency round of soil sampling may occur Sampling locations for this contingency sampling round will be selected based Upon the PCB data summarized in the RI and the data collected by GEI during the previous SC sampling round
A total of 40 soil samples (including replicates) will be collected from test pits and borings during April 1991 to fill data gaps on the extent and quantity of contaminated soil The soil sampleswill be collected at the approximate elevation specified for each sampling location as indicated in Table 1 Sample elevations of the bench-scale samples may vary if PCB concentrations in samples screened with the Dexsil L-2000 PCB analyzer are not within the ranges indicated below
Acceptable Screening Target PCB Concentrations Range PCB Concentration Range
(ppm) (ppm)
1 to 10 1 to 10 10 to 20 10 to 20 20 to 50 25 to 45
50 to 500 200 to 350
The soil samples will be analyzed for PCBs ePAHs and lead by Ceimic of Narragansett Rhode Island utilizing CLP protocols Four soil samples (including two selected for bench-scale treatability testing) will also be analyzed for total organic carbon (TOC) cation exchange capacity (CEC) and pH
Document Vol II SC SAP Revision 1
Date March 28 1991 Page 17
Detailed descriptions of the soil sampling and decontamination methods are provided in Section 5 Appendix A and the QAPP Contractors will be used for surveying performance of test pits and drilling of borings All contractors will be required to document that they have completed health and safety training that complies with OSHA Standard 1910120 In generalstakes marking the planned locationsof test pits will be surveyed by a registered surveyor prior to test pit excavation The Stakes will serve as temporary bench marks for reference during location of test pit samples A rubber-tired type backhoe will be used to excavate test pits for planned sampling locations less than or equal to5 feet below ground surface The backhoe and operator will be supplied by HE Sargent Inc of Lewiston Maine capable of operating at hazardous waste sites under Level C personnel protection Soil samples will be collected from in-situ test pit excavations by GEI personnel using a stainless steel shovel or trowel
Due to anticipated shallow ground water conditions a drill rig will be used to advance test borings for soil sampling at locations where the target sampling location is greater than 5 feet below ground surface The soil samples will be collected using a split-spoon sampler Drilling and sampling will be performed by Northeast Diamond Drilling Company of Union Maine capable of working on hazardouswaste sites under Level C personnel protection
412 Soil Analysis Program
Analytical procedures are identified in the Quality Assurance Project Plan (QAPP) The samples will be analyzed using 1988 CLP methods for PCB cPAHs and lead by Ceimic of Narragansett Rhode Island EPA methods 9045 9060 and 9080 will be used to analyze soils for pH TOC and CEC respectively A summary of the analyses to be performed on soil samples including replicates and blanks is shown in Table 2 Samples will be collected in I-Chem glassware or equivalent and stored at 4 deg C as described in Section 6
A series of quality control blanks (replicates and blanks) will be collected by GEI and analyzed by the laboratory to aid in data assessment as discussed in the Quality Assurance Project Plan (QAPP) All quality control samples will be labelled with false sample identification as shown in Table 2 in order to avoid laboratory bias
Sampling equipment blanks and aqueous trip blanks will be submitted for every ten soil samples during the sampling program to check for the presence of cross-contamination These will provide a quality control check for decontamination and handling practices The trip blanks will contain laboratory-supplied organic-free water and will accompany the shipment of soil samples during storage and shipment The trip blanks will be analyzed for PCBs (sample identification will be TP26-TP29) Wipe
Document Vol II SC SAP Revision 1
Date March 28 1991 Page 18
samples will be collected from the shovel or hand trowel and split-spoon sampler (sample identification numbers TP30-TP33 and TP34-TP37 respectively) after decontamination and will be analyzed for PCBs Wipe sampling procedures are described as part of barn sampling procedures in Section 562 One replicate sample will be collected for every ten soil samples Replicate sample locations and identification numbers are indicated on Table 2
413 Soil Sample Designation
Each piece of soil sample glassware will be affixed with a self-sticking adhesive label Each label will be completed with an indelible marker to contain the following information
GEI Consultants Inc Site Name Project Number Sampling Date and Time Sample Number Samplers Initials Analysis Requested
The sample number is composed of a series of information to identify the sample as unique to the sampling point and sampling event The sample number labelled in the field and referred to on all associated documents is composed of the following
Matrix Project Sampling Location Sample Number
Soil - 90393 -TP2-SS1
The example sample number above indicates that soil sample SSI was collected from Test Pit No 2 under project number 90393
4JZ Sediment
431 General
Sediment samples will be collected by GEI from the Upland Marsh the Upper Lagoon and the Lower Lagoon during April 1991 A summary of the laboratory analyses of sediment samples is listed on Table 3 Procedures for sampling and equipment decontamination are provided in Section 5 Appendix A and the QAPP
Document Vol II SC SAP Revision 1
Date March 28 1991 Page 19
In general the sediment sampling program includes collection of the following two basic categories of samples
1 Two composite sediment samples collected using a clam-shell sampler for bench-scale testing
2 Eleven sediment samples (including one replicate) collected with a tube sediment sampler to provide additional data on sediment quality and for estimating the quantity of contaminated sediments
The two composite sediment samples collected using a clam-shell type sampler for bench-scale testing will be collected within the Upper Lagoon and Lower Lagoon at the locations shown on Figure 4 Based on the data in the RI the Upper Lagoon contained the higher sediment concentrations of PCBs
The eleven sediment samples collected to provide additional data on sediment quality and for estimating the quantity of sediments will be collected at the locations shown on Figure 4 As shown on the figure six sediment sampling locations were chosen for the Upland Marsh two locations were chosen for the Upper Lagoon and two locations for the Lower Lagoon
Detailed descriptions of the methods and equipment to be used during the sampling program are provided in Section 5 In general a temporary reference bench mark will be surveyed and staked adjacent to each surface water body by a surveyor licensed in the State of Maine and OSHA-approved for working on a hazardous waste site The actual sediment sampling locations will be measured by tape and compass bearings from the reference bench mark prior to sampling For the bench-scale sample a 5shygallon sample container will be filled with sediment from the dredge type sample The samples for providing additional data on sediment PCB concentrations will be collected with a tubesediment sampler pushed into the complete thickness of sediment at the sampling location All sampling equipment will be decontaminated using methanol and distilled water rinses before each use
4SL2 Sediment Analysis Program
Analytical procedures are identified in the Quality Assurance Project Plan (QAPP) Sediment samples will be submitted to Ceimic of Narragansett Rhode Island for laboratory analysis utilizing CLP protocols The samples collected for bench-scale testing will be analyzed for PCBs The remainder of the sediment samples will be analyzed for PCBs cPAHs and lead One sediment sample will also be analyzed for total organic carbon (TOC) cation exchange capacity (CEC) and pH by EPA methods 9060 9080 and 9045 respectively A summary of analyses to be performed on
Document Vol II SC SAP Revision 1
Date March 28 1991 Page 20
sediment samples including replicates and blanks is shown in Table 3 Samples will be collected in I-Chem glassware or equivalent and stored at 4degC as described in Section 6
A series of quality control samples (replicates and blanks) Will be collected by GEI and analyzed by the laboratory to aid in data assessment as discussed in the Quality Assurance Project Plan (QAPP) All qualitycontrol samples will be labelled withfalse sample identification as shown in Table 3 in order to avoid laboratory bias
Two sampling equipment blanks and one aqueous trip blank will be submitted during the sampling program to check for the presence of cross-contamination These will provide a quality control check for decontamination and sample handling practices The trip blank containing laboratory-supplied organic free water will accompany the shipment of sediment samples and will be analyzed for PCBs (Sample ID SED7) Wipe samples will be collected from the tube sediment sampler and dredge sampler after decontamination and will be analyzed for PCBs (sample identification numbers SED9 and SED8 respectively) Wipe sampling procedures are described as part of barn sampling procedures in Section 562 One replicate sample will be collected during sediment sampling Replicate sample location and identification is indicated on Table 3
423 Sediment Sample Designation
Each piece of sediment sample glassware will be affixed with a self-sticking adhesive label Each label will be completed with an indelible marker to contain the following information
GEI Consultants Inc Site Name Project Number Sampling Date and Time Sample Number Samplers Initials Analysis Requested
The sample number is composed of a series of information to identify the sample as unique to the sampling point and sampling event The sample number labelled in the field and referred to on all associated documents is composed of the following
Matrix Project Surface Water Body Sample Location
SED - 90393 - UM - SED1
Document Vol II SC SAP Revision 1
Date March 28 1991 Page 21
The example sample was obtained from sample location SED1 in the Upland Marsh under project number 90393 The surface water body designations for the Upper Lagoon and the Lower Lagoon will be UL and LL respectively
43 Surface Water
431 General
Surface water quality data consisting of two samples each from the Upland Marsh Upper Lagoon and the Lower Lagoon will be collected by GEI in April 1991 Sampling locations are shown on Figure 4 Surface water sampling locations will be determined in the field by tape and compass bearings from the temporary reference bench mark established for sediment sampling A summary of the analyses to be performed on surface water samples including duplicates and blanks is shown on Table 4 Detailed descriptions of the sampling methods to be used during surface water sampling are provided in Section 5 In general the depth of the water at the sampling location will be measured at each sampling location with a weighted tape measure prior to collecting the surface water sample A water sample will be collected after lowering a stainless steel Kemmerer sampling device one-half the total depth of the water column All sampling equipment will be decontaminated using methanol and distilled water rinses before each sampling event
433 Surface Water Analysis Program
Analytical procedures are identified in the Quality Assurance Project Plan (QAPP) All of the surface water samples will be analyzed using 1988 CLP methods for PCBs aluminum and lead One sample from each surface water body will also be Submitted for Total Suspended Solids Analysis (EPA Method 1602) A summary of the analyses to be performed on surface water samples including duplicates and blanks is shown on Table 4 Surface water samples will be submitted to Ceimic Corporation for laboratory analysis Samples will be collected in I-Chem glassware or equivalent and stored at 40 C as described in Section 6
A series of quality control samples (duplicates and blanks) will be collected by GEI and analyzed by the laboratory to aid in data assessment as discussed in the Quality Assurance Project Plan (QAPP) All quality control samples will be labelled with false sample identification as shown in Table 4 and described below in order to avoid laboratory bias
One sampling equipment blank and a trip blank will be submitted during each sampling round to Check for the presence of cross-contamination These will provide a quality control check for decontamination and handling practices One trip blank
Document Vol II SC SAP Revision 1
Date March 28 1991 Page 22
sample consisting of laboratory-supplied organic-free and de-ionized water will accompany the samples during storage and shipment and will be analyzed for PCBs aluminum and lead (sample identificationwill be SW4) A samplingequipment blank will be collected by pouring laboratory-supplied organic-free and de-ionized water through the Kemmerer sampler at the end of the sampling program The sampling equipment blank will then be analyzed for PCBs aluminum and lead (sample identification will be SW5)
One surface water duplicate will also be collected each sampling round Duplicate sample location and identification is indicated on Table 4
433 Surface Water Sample Designation
Each piece of sample glassware will be affixed With a self-sticking adhesive label Each label will be completed with an indelible marker to contain the following information
GEI Consultants Inc Site Name Project Number Sampling Date and Time Samplers Initials Analyses Requested
The sample number is composed of a series of information to identify the sample as unique to the sampling point and sampling event The sample number labelled in the field and referred to on all associated documents is composed of the following
Matrix Project Surface Water Body Sampling Location
SW - 90393 - UM - SW1
The example sample number above indicates thata surface water sample was obtained from the Upland Marsh at location SW1 under Project Number 90393 The surface water body designations for the Upper Lagoon and the Lower Lagoon will be UL and LL respectively
Document Vol II SC SAP Revision 1
Date March 28 1991 Page 23
44 Barn
441 General
A total of approximately 30 samples of various media within the barn will be collected by GEI during May 1991 The types of media collected will generally consist of wood fragments from barn walls dust concrete and wipes on non-porous debris within the barn The exact sample locations will be primarily determined in the field based on observations during sampling (eg staining on soils concrete or wood) Based on a site visit by GEI on December 19 1990 preliminary sample locations for barn materials were chosen as shown in Figure 5 These preliminary locations will enable representative sampling of general debris and staining in the barn and indicates the general sampling strategy which will be employed during Pre-Design Final sampling locations may be modified during the program based on closer observation of equipment barn materials and evidence of staining
Detailed descriptions of the methods to be used during the barn sampling program are provided in Section 5 In general a survey of the general types of materials present in the bam and locations of apparent staining of surficiial materials or debris will be recorded on a plan Following the survey representative areas within the barn will be sampled A total of 12 wipe samples will be collected (eg steel shelves boat wood stove electric meters etc) by wiping a 100 cm2 area with laboratory-prepared sampling wipes A total of ten samples of Wood from the walls of the barn will be collected by using a wood boring bit and wood chisel A total of four samples of loose dust will be collected from the floor of the concrete slab of the barn using disposable nylon brushes and stainless steel trowels Finally a total of four samples of concrete will be collected from areas of visible staining and one unstained area by drilling the concrete to a maximum depth of 12 inch in a 100 cm2 area All non-disposal steel sampling equipment will be decontaminated using methanol and distilled water rinses before use at each sampling location
442 Barn Analysis Program
Analytical procedures are identified in the Quality Assurance Project Plan (QAPP) Three field equipment blanks and three trip blanks will be submitted during the barn sampling program to check for the presence of cross-contamination These will provide aquality control check on decontamination and handling practicesAsummary of the analyses to be performed on each sample matrix and the quality controlsamples is shown in Table 5
Document Vol II SC SAP Revision 1
Date March 28 1991 Page 24
Wipe wood dust and concrete samples will be submitted to Ceimic in Narragansett Rhode Island for laboratory analysis Wood dust and concrete samples will be analyzed for PCBs cPAHs and lead Samples will be collected in I-Chem glassware or equivalent provided by Ceimic and preserved and stored as described in Section 6
The objective of the barn sampling program is to provide a preliminary assessment of the degree of contamination present within the barn (see Section 2) It may be difficult to ensure that representative replicates can be made of the various matrices during sampling Therefore no replicate samples of barn materials will be collected during this initial sampling effort
Aqueous trip blank wipe samples will accompany the samples during storage and shipment and will be analyzed for PCBs (sample identification will be PTB1-PTB3) Sampling equipment blank wipes will be made following decontamination of all steel sampling equipment at various times during the sampling program The steel equipment wiped will include the hole saw trowel and the drill bit used for barn wall dust and concrete sampling respectively The equipment wipe samples will then be analyzed for PCBs (sample identification will be PEB1-PEB3)gt
443 Barn Sample Designation
Each piece of sample glassware will be affixed with a self-sticking adhesive label Each label will be completed with an indelible marker to contain the following information
GEI Consultants Inc Site Name Project Number Sampling Data and Time Sample Number Samplers Initials Analysis Requested
The sample number is composed of a series of information to identify the sample as unique to the sampling point and sampling event The sample number labelled in the field and referred to on all associated documents is composed of the following
General Sample Location Project Sample Type Sample
BARN - 90393 - D2
Document Vol II SC SAP Revision 1
Date March 28 1991 Page 24a
The example sample number above indicates that a barn sample was obtained under project number 90393 and was the second dust sample collected The designations for the wipe samples will be P wooden samples W dust samples D concrete samples C and other samples O
Document Vol II SC SAP Revision 1
Date March 28 1991 Page 25
5 SAMPLING EQUIPMENT AND PROCEDURES
51 Air Monitoring
Short-term air monitoring will be performed regularly on-site during the Source Control (SC) sampling program A HNu photoionization detector (PID) and an MIE Model MINIRAM hand-held aerosol monitor (HAM) will be used for air monitoring The PID is capable of detecting total ionizable compounds (typically VOCs) and the HAM detects solid or liquid particulates in air which often take the form of dust smoke fumes and mists Each air monitoring instrument will be operated in accordance with the requirements specified in the Health and Safety Plan provided in Appendix A Readings from the PID and HAM will be recorded in the Project Field Log Book (see Appendix B) Calibration procedures for the PID (HNu Model PI-101) and the HAM (MIE Model MINIRAM) are provided in Appendix C
52 Soil Sampling
521 General
Soil sampling locations are shown on Figure 3 Table 1 lists each soil sampling location planned approximate sample depth and rationale for sample collection
Prior to sampling a surveyor registered in the State of Maine will survey the exact location of each test pit and boring location and provide a temporary stake that will function as a bench mark for horizontal and vertical control within 20 feet of each test pit and at each boring Sample locations within test pits will be by tape and compass bearing methods
Soil sampling will be performed with strict adherence to the procedures described below A list of equipment requirements for the soil sampling program is provided in Table 6 In general excavation of soil to the target depth in test pits will be performed with a backhoe for sampling to 5 feet below ground surface The backhoe and operator will be supplied by HE Sargent Inc and the operator will be equipped with Level C personnel protection (see Appendix A) A bombardier or truck-mounted drill rig operated by Northeast Diamond Drilling by personnel equipped with Level C protection will be utilized for sampling points greater than 5 feet below ground surface Soil samples collected by GEI for possible bench-scale testing will be obtained only at test pit locations Ambient air monitoring will be performed by GEI regularly while working on-site for health and safety monitoring Mobilization
Document VoL II SC SAP Revision 1
Date March 28 1991 Page 26
of equipment and transportation of materials over the site during the soil sampling program will avoid heavily contaminated transformer work areas when possible to reduce dispersing PCBs to other areas Drilling and excavating equipment will be decontaminated under the supervision of GEI prior to use at each sampling location following strict decontamination procedures described in Appendix A and below Sampling equipment will be decontaminated by GEI prior to each sampling event as described below All soil sampling operations within the site will be performed using Level C dermal and respiratory personnel protective equipment to protect against PCB-contaminated dust levels which are likely to exceed 1 mgm3 during sampling The detailed Health and Safety Plan that will be followed during soil sampling is provided in Appendix A
522 Soil Sampling Methods for Test Pits
A minimum of a two-person crew in addition to the backhoe operator or the drill rig crew will be provided by GEI during the sampling program
All soil samples will be collected from test pits by GEI with a shovel or trowel following excavation to the appropriate depth with a rubber tire backhoe as follows
1 Check the survey stakes for the proper test pit number identification and location
2 Place polyethylene sheeting on each side of the test pit for staging the excavated soils from the test pit
3 A standard rubber tire type backhoe will perform the soil excavation to the planned sampling depth All soil excavated from the test pit will be placed on the plastic sheeting adjacent to the test pit The top 2 feet of excavated soil will be cast to one side of the test pit on the sheeting and the bottom 3 feet of soil will be cast to the opposite side to avoid mixing soils with potentially significantly different levels of contamination After completion of sampling soil will be backfilled at a similar depth from which it was excavated
4 All excavation activities will be continuously observed by an engineer or geologist from GEI A test pit log form (OCONNORFL12) will be completed by GEI for each test pit performed and will include the following information
Document Vol II SC SAP Revision 0
Date January 17 1991 Page 27
Name and Location of Job Date Excavation and Test Pit Number Approximate Ground Surface Elevation at Test Pit Total Depth of Test Pit Dimensions of Test Pit Location and Depth of Soil Sample Relative to Stake Reference Method of Soil Sample Acquisition (Shovel Trowel) Volume of Soil Sample J Soil and Stratigraphic Descriptions x
Ground Water Levels (if encountered) y ^v Air Monitoring Information v Other observations Such as soil staining buried debris etc
5 At least one photograph will be taken oflta wall of each test pit from within the test pit with a scale for comparison to indicate soil layering or staining In addition one photograph shall be taken of thertesVpit from the ground surface also showing sample locations withinthe-test pit Photographs of the test pits will be marked to include site locationxjdbmumber^test pit number date and time A photograph log sheet will be maintained fampMuture reference
6 The target soil sampling elevation will be determined by GEI using a level and rod
7 Soil sampling will begin from within the test pit only after the side walls of the pit have been properly^sloped back in accordance with OSHA requirements (see Health and Safety Plan^ Appendix A) All samples collected will be identified on the test pit logazid in the field book Information about the sample including sample number^de^th voiuine and soil description will be recorded The soil sample will be colleetedTrotn an undisturbed area of the test pit floor or wall by means of scraping or digging with a stainless steel shovel or trowel The number of clean sampling utensils for each test pit shall be equal to the number of soil samples collected at the test pit Shovels or trowels used to clean sloughed material from the sampling location will not be used to collect the sample unless decontaminated before use in sampling Care will be taken to assure that the sample is taken from the actual soil unit desired mid does not include slough or scraped material from the sides of the trench The desired soil sample will be immediately placed into the sample container within the test pit A portion of the sample will be retained for screening with the Dexsil L-2000 PCB analyzer The containers will then be sealed labelled and stored in asecure area until Shipment to the laboratory
Document Vol II SC SAP Revision 1
Date March 28 1991 Page 28
8 When collecting a larger volume sample for bench-scale testing a smaller soil sample will first be collected for field screening using the Dexsil L-2000 PCB Analyzer If the analyzer indicates that the PCB concentration is within the target range the bench-scale soil sample will be collected If the Analyzer indicates that the PCB concentration is outside the target range the test pit will be expanded if necessary and another sample will be collected for PCB screening This procedure will be continued until a sample within the target range is identified The test pit will be expanded no more than 2 feet in all directions and to the maximum depth of 5 feet below ground surface If after this over-excavation the soil within the target concentration range has not been identified with the Dexsil L-2000 PCB Analyzer a new test pit location will be selected near the original test pit in an area indicated by the Remedial Investigation to contain soil contamination within the target range
9 Once the targeted PCB concentration has been indicated by field screening the desired soil sample will be collected with a clean stainless steel trowel or shovel at a sufficient quantity to fill a 5-gallon container An aliquot from the 5-gallon sample container will be collected and placed in an appropriate sample container for laboratory analysis for PCBs The 5-gallon containers will then be sealed labelled and appropriately stored in a secure area until transported off-site The laboratory samples will be sealed labelled and stored with the other soil samples awaiting shipment to the laboratory
10 Upon completion of sample collection the excavated soil material will then be backfilled into the test pit The backfilled area will be compacted to the approximate original ground elevation
11 Equipment will be decontaminated after backfilling the test pit (ie shovel trowels measuring equipment) byscrubbing and With methanol and distilled water rinses Portions of the backhoe (bucket bucket arm etc) will be decontaminated with a high-pressure steam rinse on the decontamination pad (see Appendix A)
523 Soil Sampling Methods for Borings
Selected soil samples are planned to be collected at depths greater than 5 feet below ground surface to obtain additional data on the depth of PCB contaminationexceeding cleanup standards in Transformer Work Areas Samples will be obtained using split-spoon sampling techniques within 3-inch ID hollow stem augers in test borings generally following procedures specified by American Society for Testing Materials (ASTM) D1586-84 Test borings will be performed by Northeast Diamond Drilling
Document Vol II SC SAP Revision 1
Date March 28 1991 Page 29
under the observation of an engineer or geologist from GEI The following procedures not specified in ASTM D1586-84 will be used
1 Place a polyethylene sheet on one side of the boring location for temporarily staging drilling cuttings during borehole advancement All drilling equipment shall be decontaminated with a high pressure steam rinse on the decontamination pad prior to beginning drilling
2 Advance hollow-stem augers without split-spoon sampling to a depth about 5 feet above the sampling depth specified in Table 1
3 Begin continuous split-spoon sampling with 18-inch-long samples Collect a specimen from the middle of each sample for screening with the Dexsil L-2000 PCB analyzer and the HNu photoionization detector Rinse the split-spoon sampler with methanol and distilled water rinses before each sample
4 Collect a split-spoon sample at the designated sample depth Divide the split-spoon sample vertically Place a minimum of 4 inches of sample recovered from the bottom right half of the sample into the glass sample container Seal and label the sample container as indicated in Section 4 and store the container in a cooler with ice in a secure area until shipment to the laboratory Retain the left half of the split-spoon sample for screening with the Dexsil 1^2000 PCB analyzer and the HNu photoionization detector
5 After collecting the final soil sample in the boring measure depth to ground water below ground surface using a decontaminated Solinst battery-operated water level indicator Record the time elapsed after completion of the boring when the ground water level was measured
6 Remove augers from borehole If the borehole remains open and evidence of ground water was encountered during sampling collect additional measurements of depth to ground water prior to backfilling until the ground water level appears to stabilize Note occurrence of precipitation or other events which could effect water level measurements in the project log book
7 Backfill borehole within 24 hours after completion of the boring with drill cuttings staged adjacent to the borehole If the borehole collapses and cuttings cannot be backfilled in the borehole store staged cuttings in a steel drum to be left on site Label outside of drum to indicate contents are borehole cuttings from the designated boring number and affix labelindicating PCB-contaminated materials Cuttings from more than one boring can be combined in a single drum
Document Vol II SC SAP Revision 0
Date January 17 1991 Page 30
8 Decontaminate measuring and sampling equipment with methanol and distilled water rinses Decontaminate downhole drilling equipment on the decontamination pad with a high-pressure steam rinse before starting the next boring
A log will be prepared by GEI for each boring and will include the following
information 7
Name and Location of Project
Boring Number lt Date of Boring Ground Surface Elevation x-Boring Diameter and Depth Sample Numbers and Depths Soil Screening Data Visual Soil Descriptions Water Level Measurements Air Monitoring Levels Other Observations
The boring log form is provrdedin Appendix B (OCONNORFL15)V
i
Surface Water ^^7
531 General
N
Surface water sam^les^will becollected at the locations shown in Figure 4 If water is too deep for safe aecess^with hip-waders andor access with hip waders will severely disturb sediment an inflatableboat will be used to access Surface water sampling locations
The surface water sampling program will be performed following strict adherence to the following procedures A list of the equipment requirements for surface water sampling is provided in Table 8 In general ambient air monitoring will be performed regularly while working on-site for health and safety considerations Areas of the site which have been determined by previous studies to have elevated concentrations of PCBs in soils (for example TWAs) will be avoided while traversing the site to reduce the likelihood of dispersing PCBs to other areas The depth of water at the sampling stations will be measured and the surface water elevation will be surveyed on each water body Equipment will be decontaminated prior to use at each sampling station following decontamination procedures
Document Vol II SC SAP Revision 0
Date January 17 1991 Page 31
532 Surface Water Sampling Methods
Surface water samples will be collected during the Pre-Design Study at the locations shown on Figure 4 Surface water samples will be collected during the initial stage of the Source Control sampling program prior to soil and sediment sampling An inflatable boat will be used to access surface water sampling locations if there is sufficient water depth The boat will be cleaned with methanol and distilled water rinses before sampling in each water body The surface water sampling procedures will be as follows ltX1 Determine the location of the sampling station by tape^and compass from a
temporary bench mark at the edge of the surface water body x
2 Measure the depth of water at the sampling station with a weighted tape measure x (
^ 3 Gently lower a clean Kemmerer sample^bottle to the desired depth (one-half
water depth) so as not to remove th^stoppeisprematurely V^
4 Pull out the stopper with a sharp jerk ofdhe sampler line
5 Allow the bottle to fill completelyras evidenced by the cessation of air bubbles
6 Raise the sample and capdhe nottle X x
7 Pour the sampl^fromthe bottle into the appropriate sample container The container willbesealedlabelled and stored in a secure area until shipment to the laboratory
8 Fill a beaker with water remaining in the sampler and measure specific conductance pH and temperature
9 Decontaminate the sampling apparatus measuring tape and Kemmerer sampler by scrubbing internally and externally with methanol and distilled water rinses
10 Record the following surface water sampling information in the project log book (OCONNORFL1)
Document Vol II SC SAP Revision 0
Date January 17 1991 Page 32
Date Time Total Depth of Water Location and Depth of Sample pH Conductivity Measurements Air monitoring levels detected Other observations
Sediment
541 General x
gt The locations of the sediment sampling stations are shown on Figure 4 Table 3 lists the various sampling stations and sampling methods for the sampling program Sediment sampling during the project will beperformed with strict adherence to the following procedures A list of equipment requirements for the sediment sampling program is provided in Table7 In general ambientw monitoring will be performed regularly while working on-site for health-and safetymonitoring Mobilization of equipment and materials over the sitdduring^he-sediment sampling program will follow specific routes to reduce the likelihoocKPfdispersing PCBs to other areas Equipment will be decontaminated prior to sampling at each location following strict decontamination procedures described belowy All sediment sampling operations within the site will be performed fusing level C dermal personnel protective equipment and Level D respiratory^protective equipment will be worn
v ^
542 Sediment Sampling Methods gtSN
The sediment sampling^vili be performed after collection of surface water samples and will consist of rivo primary components
1 Tube sediment smiling to provide additional data on sediment quality and to estimate the thickness of sediment
2 Dredge sediment sampling to obtain a sample for laboratory for bench-scale treatability testing
The tube sediment sampling program will be performed as follows
Document Vol II SC SAP Revision 0
Date January 17 1991 Page 33
1 Determine the sampling locations by tape and compass measurements from a temporary bench mark (reference stake) surveyed near the edge of the surface water body Access locations in interior portions of the water bodies using an inflatable rubber boat The boat will be decontaminated with methanol and distilled water rinses before use in each surface water body
2 Measure the depth of water with a weighted tape measure
3 Lower the hand tube sediment sampler to the desired ctepth Sediment entering the tube is trapped by a plastic core retainer allbyringlheunit to be retrieved a n d t h e s a m p l e r e m o v e d w i t h o u t s a m p l e l o s s X x y
4 Extract the sediment samplefrom the sampler and^immediately place the sample
into the sample container The containers ywllthen be sealed labelled and stored on ice in a cooler in a secure area until shipment to the laboratory
5 Decontaminate the sampling apparatua and measuring tape by scrubbing with methanol and distilled water rinses
vw 7 Record sediment sampling record information in the project log book
(OCONNORFL2) after collecting a sediment sample at each sampling station The information that will beuro~documenteamp includes the following
Date and Time ^ Total Depth of Water N Thickness of Sediment Location of Sample Length and Vblume^of Simple Sample Description x- Air Monitoring LevetesDeteeted Other Observations
The sediment sampling procedure for collecting samples for bench-scale treatability testing will be as follows
1 Determine the location of the dredge traverse line by tape and compass bearings from the temporarily bench mark adjacent to the surface water body
2 Pull the sediment dredge along the planned traverse with a wire line from the edge of the surface water body
Document Vol II SC SAP Revision 0
Date January 17 1991 Page 34
3 Repeat sampling until 5 gallons of sediment have been collected and placed in the 5-gallon sample container The containers will then be sealed labelled and stored in a secure area until shipment to the laboratory
4 Decontaminate the sampling apparatusand drag line by scrubbing with methanol and distilled water rinses
S6 Record the following sedimentsampling informationin die project log book after
sample collection X nXx
Date and Time X gt Total Depth of Water Location and Volume of Sample Number of Grab Samples Collected to Form Composite Volume Sample Description Air Monitoring Levels Detected x X Other Observations
Barn
5-51 General
Sampling within the barn will4gteperformed with strict adherence to the following procedures A list of equipment requirements for the barn sampling program is provided in Table 9 Areas of the Site which have been determined by previous studies to have elevatedconcentrations of PCBs in soils (for example TWAs) will be avoided during bam sampling to reduce the likelihood of dispersing PCBs to other areas within the barnXEquipment will be decontaminated prior to use at each sampling location inside thetarn following strict decontamination procedures All sampling operations withfaMhe barn will be performed with Level C personnel protective equipment due to dust levels which may to exceed 1 mgm3 during sampling (see Appendix A) A detailed Health and Safety Plan which will be followed during barn sampling is provided in Appendix A
552 Barn Sampling Methods
If power is not available on-site a gasoline-powered generator capable of supplying electricity for lighting and sampling equipment will be positioned outside the fenced area of the site prior to sampling Extension cords will be run to the barn (avoiding TWAI) for power supply In order to reduce the potential for cross-contamination due to dust generation the sampling of different matrices will proceed in the
Document Vol II SC SAP Revision 0
Date January 17 1991 Page 35
following sequence 1) wipe samplingof non-porous debris 2)wood sampling of barn walls 3) dust sampling from top of floor slab 4) concrete sampling of floor slab Areas to be sampled will be chosen based on the presence of apparent oil-type staining and to obtainan even distributionof representative samples with no apparent staining
Following sampling at each location a self-sticking adhesive label marked with the sample number will be placed at the sample location for future reference Each label will then be located by taping relative to a reference point Established at the western corner of the barn (W-Z corner) as shown in Figure 5 Walls W and Z will be used as orthogonal axes similar to a typical coordinate system For samples collected above the concrete floor slab (eg wipe and wooden wall samples the height above the floor slab will also be recorded All samples willbe collected between the floor slab and a maximum height of seven feet All location measurements and a brief description of the area sampled will be recorded on the Barn Sampling Form (OCONNORFL13) provided in Appendix B Imaddition a photograph of each sampling location will be taken and^ recordedy on the Photograph Log (OCONNORFL6) Detailed procedures-for each type of sample to be collected during the barn sampling program follows
lt Win Samnlino N
1 Identify the non-porous item within the barn selected to be sampled which has an area of at least 100 cm2 which maybe wiped Examples include sheet metal fiberglass cleanly painted wooden surfaces glass etc
2 Place a decontaminated stainless steel or plastic 100 cm2 (10 cm X 10 cm) template at t^desired sampling location
Note For smaller areas such as on electric meters use the quarter template of 25 cm2 area and make four wipes to compose one sample
3 Remove the laboratory-supplied gauze from within the glassware with stainless steel forceps The gauze should be moist with solvent as prepared by the laboratory
4 While holding the appropriate template in place thoroughly swab the 100 cm2 area with the gauze using forceps or bufyl rubber gloves Inspect the area to ensure that all loose dust has been wiped with the Alter paper
Document Vol II SC SAP Revision 0
Date January 17 1991 Page 36
5 Fold the gauze over to ensure that the dust is contained on the inside of the gauze Place in the appropriate sample container seal label and store in a secure area until shipment to the laboratory
6 Decontaminate the forceps and templates by scrubbing with methanol rinsing with distilled water and wiping dry with paper towels
7 Label the sample location photograph and complete^he Barn Sampling Form
(see Appendix B) and other necessary documentation after each sample is
c o l l e c t e d lt X x x y x x
xWooden Wall Sampling X
1 Select the sampling area of at least 100 cm2 on the inside wall of the barn and secure a decontaminated 100cm2 template at the location Place a steel pan below the sampling area to catch sawdust ancLwood chips
2 Using an electric drill equipped withra-one-ineh diameter wood-boring bit drill out wood within the template area to arnaximum depth of 12 inch
3 Place sawdust and wood chips man appropriate sample container seal label and store in a secure area untiLsRipinent to the laboratory
4 Decontaminate the drilTbit and pan by scrubbing with methanol rinsing with distilled water and jwiping dry with paper towels
5 Label the samplelocatidn photograph and complete the Barn Sampling Form (see Appendix^)
Dust on Floor Slab Sampling
1 Select an area to sample such that at least 100 grams of dust or soil may be obtained This will vary depending on thickness of the dust or soil
2 Using a disposable nylon brush or stainlesssteel trowel brush or scrape dustsoil toward the center of the area chosen minimizing the creation of airborne dust
3 After the dustsoil has been centralized use a flat stainless steel trowel to collect the material and place in laboratory-supplied glassware seal and label
Document Vol II SC SAP Revision 0
Date January 17 1991 Page 37
4 Dispose of the nylon brush with other containerized PCB-waste materials and decontaminate the stainless steel trowelsby scrubbingwith methanol rinsingwith distilled water and wiping dry with paper towels
5 Label the sample location photograph and complete the Barn Sampling Form
Concrete Slab Sampling
1 Identify three areas of visible staining and one area of no visible staining on the floor slab Using a disposable nylon brush carefulfy brushxaway loose dust and soil from an approximately 1-square-foot area
2 Place a pre-cut 10-square-foot sheet of clean polyethylene sheeting with a 1shysquare foot hole cut in the center over thevsampling area and secure in place with duct tape Place a decontaminated lOO cmr template in the center where t h e s a m p l e i s t o b e o b t a i n e d X v N
3 Using an electric hammer drill eqi^pedwitlra^ungsten-carbide mortar bit drill the four corners established by the tempfate^to a maximum depth of 12 inch
4 Remove the template ancLdrilL the remaining 100 cm2 within the established square to a maximum dep^fof l2Jnch
-vFollowing drilling brush the concrete chips and dust from the plastic sheeting toward the center otlhe sarhplihggtarea Collect sample with a clean disposable nylon brush andtrowel and place in an appropriate sample container seal label and store in aSecure area until shipment to the laboratory
6 Dispose of the nylon oriish with other containerized PCB-contaminated waste materials and decontaminate the stainless steel trowel and template by scrubbing with methanol rinsing with distilled water and wiping dry with paper towels
7 Remove and dispose of the polyethylene sheeting and duct tape in an appropriately marked barrel that will remain on the site with other sampling waste disposal materials Label the samplinglocation photograph and complete the Barn Sampling Form
Document Vol II SC SAP Revision 0
Date January 17 1991 Page 38
6 SAMPLE HANDLING AND ANALYSIS
61 General
GEI has established a program of sample chain-of-custody that is followed during sample handling activities in both field and laboratory operations Thisvprogram is designed to assure that each sample is accounted for at all times To accomplish this objective sample container labels sampling records chain-of-custody records sample assignment forms shipping airbill records and laboratory receipt sheets must be completed by the appropriate sampling and laboratory personnel ^ y gt
62 Sample Labeling and Documentation gt
The plastic 5-gallon containers for bench-scale testingsWilKbe cleaned with methanol and distilled water rinses prior to use All other sample containers^will be pre-cleaned by EPA-approved methods and provided by the laboratory^ A summary of the sample containers and preservation requirements for each of thamp^analytieal parameters to be measured is shown in Table 10 Each piece of sample gl^sware^will be affixed with a self-sticking adhesive label Each label will contain the information described in Sections 4 and 5 of this document ^
To further document the samplingprogr^mand Sample handling procedures the project log book (OCONNORFL1) will containinformation regarding the activities on-site and sample handling In addition photographs of each type of field procedure will be taken The photographs will be representative of thetechniques employed throughout the sampling program A record ofeach photograph Will be made on the Photograph Log (OCONNORFL6) as stiown 4i^Appendix B
63 Chain-of-CustodySample^Assignment
Chain-of-custody will be maintained at all times as described in more detail in the Quality Assurance Project Plan (QAPP) A copy of the chain-of-custody form (OCONNORFL9) to be used is provided in Appendix B
In general the chain-of-custody record must be used such that it includes the following information
Document Vol II SC SAP Revision 0
Date January 17 1991 Page 39
Project name and number Names of the sampler(s) and person shipping the samples Station number or well identification Date and time the samples were collected Composited or grab sample designation Sample number (eg 1GU-90393-MW101A) Total number of containers Analysis requested Date and time the samples were delivered for shipping Names of those responsible for receiving the sampled at the laboratory
Prior to shipment of the samples a sample assignment form will be completed (see OCONNORFLIO in Appendix B) The sample assignmenrform will provide the contract laboratory sufficient information to process the samples and perform the appropriate analysis
The chain-of-custody record and sample assignment fornr will both be completed in duplicate in the field through the use of carbon paperT The original copy of the forms will be enclosed in a plastic bag and placed in the coolersWith the samples for shipment to the laboratory The carbon copy of the forms will be retained by GEL
VSoil samples for bench-scale testing ynH be-stored on site in a locked storage shed until samples are selected for the bench-scale7testing^ This decision will be made after receipt of the laboratory PCB analyses results and approval of the Source Control Work Plan by the EPA Soil samples not usecLfor bench-scale testing will remain in the locked storage shed and will be included with-other soil for treatment during the Remedial Action
lt v 64 Sample Shipments
Sample containers are generally packed in coolers for shipment Prior to packing organic analysis samples will be placed in plastic bags Bottles are to be packed tightly so that no motion is possible Styrofoam vermiculite and bubble pack are suitable for most instances Ice Will be placed in sealed plastic bags or ice packs in order to keep samples at 4degC at all times Samples will be protected against freezing during cold weather The original chain-of-custody and sample assignment forms will be sealed in plastic bags and placed in the cooler with the samples The cooler will be closed and a signed self-sticking label with the words Custody Seal will placed between the body of the cooler and the cover The cover will then be sealed with clear tape Samples will be shipped so that they are received by the laboratory no later than 60 hours from the time of sample collection
Document Vol II SC SAP Revision 0
Date January 17 1991 Page 40
All shipping of samples will be done through Federal Express or equivalent overnight delivery service Samples will be shipped in accordance with Department of Transportation (DOT) regulations If prompt arrival of the samples cannot be guaranteed the samplers will be responsible for proper storage of the samples until adequate transportation arrangements can be made The laboratory will be notified prior to shipment to arrange for receiving the samples and to prepare for the analyses requested Based on the low concentrations of chemicals detected during previous studies theSamples will be classified as environmental samples The air bill for the samples will speeiiythat the contents of the cooler are environmental or hazardoussamples as appropriated When samples are received by the laboratory they will notify the Task Manager of theccondition of the samples
H craTrsi
TABLE 1 - SOIL SAMPLING SCHEDULE Field Sampling Plan OConnor Co Site Augusta Maine
DEPTH APPROXIMATE BELOW ANTICIPATED
SAMPLE NUMBER SAMPLE GROUND PCS GENERAL LOCATION OF ELEVATION SURFACE CONCENTRATION SOIL
ID SAMPLES (MSL) (PPm) TYPE COMMENTS
TP1 2175 25 ND ClaySandy Till Confirm contours 215 35 ND
TP2 217 15 50 ClaySandy Till Confirm contours TP3 212 ND Siltv Clav Confirm horizontal extent toward marsh TP4 211 5-50 Clav Obtain bench scale 20-50 ppm
TP5 213 50-500 Clay Confirm lateral extent
TP6 215 15 5-50 Fill Obtain bench test sample In 1-10 ppm
TP7 210 35 0-5 Siltv Fine Sand Confirm vertical extent in drainage area
217 3 0-5 FillClay Confirm contours TP8 219 1 0-5 TP9 207 35 0-5 Siltv Fine Sand Confirm vertical extent In drainage area
TP10 1175 15 50-5000 Fill Bench scale test sample 50 to 500 ppm
TP11 218 0-5 SandClay Confirm horizontal extent toward marsh
TP12 218 0-5 SandPay Confirm horizontal extent toward marsh
TP13 221 5-50 Clav Bench-scale test sample 10-20 ppm
TP14 206 0-5 Gray Silty Clay Confirm vertical extent
TP15 200 0-5 Gray Silty Clay Confirm vertical extent
TP16 2185 15 5-50 Clay Bench-scale test sample 1-10 ppm
228 4 TP17 230 2 Confirm contouring in north end of site
231 4 TP18 233 2 Confirm contourtng in north end of site
236 4 TP19 238 2 Confirm contouring in north end Of site
Project 90393 GEI Consultants Inc Page 1 of 2 March 28 1991
SAMPLE NUMBER LOCATION OF
SAMPLES
TP20 TP21 TP22 TP23
TP24 TP25
B1
B2
1 B3 2
B4
B5
ND = Not Detected
TABLE 1
APPROXIMATE SAMPLE
ELEVATION MSLJ
231 233
2275 237 237 235 236 222 210 215 210 215
215 220
218 220 220 222
- SOIL SAMPLING SCHEDULE Field Sampling Plan OConnor Co Site Augusta Maine
DHTH BELOW
GROUND SURFACE
4 2
15
2 1
8 3 8 3
12 6
8 6 6 4
ANTICIPATED PC8
CONCENTRATION
ND ND 0-5
500-5000 5-50
50-5000 0-5
50-500
0-5 50-500
0-5 0-5 0-5 0-5
GENERAL SOIL TYPE
Clavev Silt Silty Clay
Clay
Till or Clay
Till or Clay
Gray Silt
Gray Clavev Silt
Gray Clayey Silt
i
Confirm contouring in north end of site Confirm contours Confirm contours Confirm contours
Confirm contours Bench scale sample 50-500 ppm
Confirm contouring and vertical extent
Confirm Contouring and vertical extent
Confirm contours and vertical extent
Confirm contours and vertical extent
Confirm contours
Project 90393 GEI Consultants Inc Page 2 of 2 March 28 1991
TABLE 2 SOIL ANALYSIS PROGRAM Field Sampling Plan OConnor Co Site Augusta Maine
Sample Depth
Sample Location ID
SoB Sample Number
(ft below ground surface) Lead cPAHs PCBs
pH TOC CEC
Anatyticsd Level IV
TEST PITS TP1 SS1 TP2 SS1 15
SS2 35 TP3 SS1 TP4 SSI
SS2 TP5 SSI TP6 SS1 15
SS2 15 TP7 SS2 35 TP8 SSI
SS2 TP9 SSI 35
replicate of SS2 SSI
TP10 SS1 15 SS2 15
TP11 SSI TP12 SSI TP13 SS1
SS2 TP14 SS1 TP15 SS1
replicate of SS2 SS1
TP16 551 15 552 15
TP17 551 552
TP18 551 552
TP19 551 552
TP20 551 552
TP21 SS1 15 TP22 SS1
Project 90393 GEI Consultants Inc Page 1 of 2 March 281991
TABLE 2 SOIL ANALYSIS PROGRAM Field Sampling Plan OConnor Co Site Augusta Maine
Sample Depth
Sample Location ID
SoB Sample Number
(ft below ground surface) Lead cPAHs PCBs
pHTOC CEC
Analytical Level IV
Bench Scale
Sample
replicate of SS2 SS1
TP23 SS1 TP24 SS1
SS2 TP25 SSI
SS2 BORINGS
B1 SS1 SS2
B2 SS1 SS2
B3 SS1 6 replicate of
SS2 SS1 SS3 12
B4 551 552
B5 551 552
QUALITY CONTROL TP26-TP29
(trip blank) SS1-SS4 TP30-TP33 (shovel or
hand trowel SS1-SS4 blank)
TP34-TP37 (split-spoon
blank) SS1-SS4 TOTAL
ANALYSES 40 40 64 15 12
TOC - Total Oraanic Carbon CEC - Cation Exchange Capacity
Will be designated to the laboratory as matrix spikematrix spike duplicate
Additional trip blanks may be needed to ensure one trip blank per cooler
Project 90393 GEI Consultants Inc Page 2 of 2 March 281991
TABLE 3 SEDIMENT ANALYSIS PROGRAM Field Sampling Plan OConnor Company Site Augusta Maine
PH Bench Sample TOC Analytical Scale
Sample Location Number Lead cPAHs PCBs CEC Level IV Sample
Surface Water Body
SED1
SED2
SED3Upland Marsh (UM) SED4
SED5
SED6
SED1
SED2Upper Lagoon (UL)
SED3
SED4
Lower Lagoon (LL) SED1
SED2
SED3
SED7 (trip blank)
SED8Quality Control (dredge
blank)
SED9 (tube
samples blank)
Total Analyses 11 11 16
TOC - Total Organic Carbon CEC - Cation Exchange Capacity
UL SED2 is a replicate sample of UL SED1
Will be designated to the laboratory as matrix spikematrix spike duplicate
Additional trip blanks may be needed to ensure one trip blank per cooler
Project 90393 GEI Consultants Inc March 281991
TABLE 4 - SURFACE WATER ANALYSIS PROGRAM Field Sampling Plan OConnor Co Site Augusta Maine
SAMPLE SAMPLE LOCATION NUMBER Lead Aluminum PCBs
Upland SW1 X X X Marsh (UM) SW2 X X X
Upper SW1 X X X Lagoon (UL) SW2 X X X
SW3 X X X
Lower SW1 X X X Lagoon (LL) SW2 X X X
Quality Control Samples
Trip Blank SW4
Sampler Blank SW5
TOTAL ANALYSES
TSD - Total Suspended Solids
SW2 is a duplicate of SW1
Will be designated to the laboratory as matrix spikematrix spike duplicate
Additional trip blanks may be needed to ensure one trip blank per cooler
Project 90393 GEI Consultants Inc Page 1 of 1 March 28 1991
TABLE 5 - BARN SAMPLING ANALYSIS PROGRAM Field Sampling Plan OConnor Co Site Augusta Maine
SAMPLE MATRIX PCBS CPAHS Lead
Analytical Level IV
Wipe samples PTB (trip blank) PEB (equipment blank)
12 3 3
Wooden wall samples 10 10 10
Dustsoil on floor slab
Concrete slab
Total Analyses 36 18 18
Additional trip blanks may be needed to ensure one trip blank per cooler
One sample will be designated to the laboratory as a matrix spikematrix spike duplicate
Project 90393 GEI Consultants Inc Page 1 of 1 March 281991
TABLE 6 - SOIL SAMPLING EQUIPMENT REQUIREMENTS Field Sampling Plan OConnor Co Site Augusta Maine
Safety Equipment (Level C - Dermal)
Health and Safety Plan (copy) Portable Photoionization Detector (HNu) Hand-held Aerosol Monitor (HAM) Disposable Tyvek Coveralls Tyvek Hoods Duct Tape Safety Goggles Safety Boots Surgical Gloves Butyl Sampling Gloves n gt Rubber Boots or DisposableBooties Hard Hats (when near qverhead objects)
Safety Equipment (Level C - Respiratory)
Sampling and Measuring Equipment
Other
Full-face Respirators Combined Organic Vapor and
High-efficientcy particulate Cartridges Dust Prefilters
Level and Rod Measuring^Tape Stainless -SteeLShovels Stainless Stee^T rowels 165-foot Measuring Tape Methanol V
Distilled Water Paper Towels
SafopltngjSlassware (See Table 10) xCo6lers with Ice or Ice Pack
Clear Plastic Tape Re-sealable Plastic Bags
Gallon Drums
ite Maps Project Log Books Marking Pens Camera Photograph Log Forms Test Pit Log Forms Boring Log Forms Chain-of-Custody Forms Sample Assignment Forms Equipment Calibration Logs Extra Bottle Labels Spare AA Batteries for Meters Blank Federal Express Airbills
Project 90393 GEI Consultants Inc Page 1 of 1 January 171991
TABLE 7 - SEDIMENT SAMPLING EQUIPMENT REQUIREMENTS Field Sampling Plan OConnor Co Site Augusta Maine
Safety Equipment (Level C - Dermal)
Safety Equipment (Level C - Respiratory)
Sampling and Measuring Equipment
Other
GEI Consultants Inc
Health and Safety Plan (copy) Portable Photoionization Detector (HNu) Hand-held Aerosol Monitor (HAM) Disposable Tyvek Coveralls Tyvek Hoods Duct Tape Floatation Vest Inflatable Boat Safety Goggles Safety Boots Surgical Gloves Butyl Sampling Gloves Rubber Boots or Disposable obties Hard Hats (when near overheackobjepts)
V Full-face Respirators Combined Organic Vaporand
High-efficiencyHPartjculate Cartridges Dust Prefilters
Level andRod Measuring Tapp 165-foot MPasuririgTape Methanol V Distilled Water jper tpwels V
SjE(mplinsect~Glassware (See Table 10) Cdolbrs wlthjbe or Ice Pack
Clear Plastic Tape Re-sealable Plastic Bags
-Galloh Drums fghted Measuring Tape e Sediment Sampler dge Sediment Sampler
Site Maps Project Log Books Marking Pens Camera Photograph Log Forms Chain-of-Custody Forms Sample Assignment Forms Equipment Calibration Logs Extra Bottle Labels Spare AA Batteries for Meters Blank Federal Express Airbills
Project 90393 Page 1 of 1 January 17 1991
TABLE 8 - SURFACE WATER SAMPLING EQUIPMENT REQUIREMENTS Field Sampling Plan OConnor Co Site Augusta Maine
Safety Equipment (Level C - Dermal)
Safety Equipment (Level C - Respiratory)
Sampling and Measuring Equipment
Health and Safety Plan (copy) Portable Photoionization Detector (HNu) Hand-held Aerosol Monitor (HAM) Disposable Tyvek Coveralls Floatation Vest Inflatable Boat Tyvek Hoods Duct Tape Safety Goggles Safety Boots Surgical Gloves Butyl Sampling Gloves Rubber Boots or Disposable Booties Hard Hats (when nearOverhead objects)
w Full-face Respirators Combined OrganicVaporand
High-efficiency Particulate Cartridges Dust Pi
Level and Rod
Measuring Tape M3amp-foot Measuring Tape JsopropyhAlcohol Mbthanol DistlHed Water PaperTowels Sampling Glassware (See Table 6)
oolers with Ice or Ice Pack tear Plastic Tape
Re-sealable Plastic Bags 55-Gallon Drums Weighted Measuring Tape Kenmerer Sampler Disposable 045 Micron Field Filters Pressure Pump for Field Filtering pH Meter with Temperature Probe Cole-Parmer pH-40 70 Calibration Solutions Cole-Parmer 1413 Micromhoscm Calibration Solution
Project 90393 GEI Consultants Inc Page 1 of 2 January 171991
TABLE 8 - SURFACE WATER SAMPLING EQUIPMENT REQUIREMENTS Field Sampling Plan OConnor Co Site Augusta Maine
Other Site Maps Project Log Books Marking Pens Camera Photograph Log Forms Chain-of-Custody Forms Sample Assignment Forms Equipment Calibration Logs lt Extra Bottle Labels Spare AA Batteries forM6ters Blank Federal Express Airbills Xy
Project 90393 GEI Consultants Inc Page 2 of 2 January 171991
TABLE 9 - BARN SAMPLING EQUIPMENT REQUIREMENTS Field Sampling Plan OConnor Co Site Augusta Maine
Safety Equipment (Level C - Dermal)
Safety Equipment (Level C - Respiratory)
Sampling and Measuring Equipment
Other
Health and Safety Plan (copy) Portable Photoionization Detector (HNu) Hand-held Aerosol Monitor (HAM) Disposable Tyvek Coveralls Floatation Vest Tyvek Hoods Duct Tape Safety Goggles Safety Boots Surgical Gloves Butyl Sampling Gloves Rubber Boots or Disposable Bboties Hard Hats (when near overheackpbjects)
Full-face Respirators Combined OrganicVapor and
High-efficiencyParticutale Cartridges Dust Prefilters
Gas powered electrfcgenerator 5 gallonsgaspline 350 feetNplectricahextfnsion cord Self-standin^work-larnps (200 watts minimum) Electric 38drilkwith two 1-inch wood boring bits ElectricBoschhammer drillwtungsten-carbidemortar bit Hpound-cut polyethylene sheeting and duct tape
Steel blaRing sheet X^vdiSpdsabfe nylon brushes
Stainless steel trowels Three 100 cm templates andone 25 cm template Forceps Peper towels Silf-sticking adhesive labels and push pins
Site Maps Project Log Books Marking Pens Camera Photograph Log Forms Bam Sampling Forms Chain-of-Custody Forms Sample Assignment Forms Equipment Calibration Logs Extra Bottle Labels Spare AA Batteries for Meters Blank Federal Express Airbills
Project 90393 GEI Consultants Inc Page 1 of 1 January 171991
TABLE 10 - SAMPLE CONTAINERS AND PRESERVATION REQUIREMENTS Field Sampling Plan OConnor Co Site Augusta Maine
Holding Media Parameter Container Preservation Time
PCBs 8 oz glass jar 4deg C 14 days-with Teflon- extraction lined lid 40 days shy
analysis
cPAHs 8 oz glass jar 4deg C 14 days-SOIL with Teflon- extractionSEDIMENT lined lid 40 days shyWOOD
analysisCONCRETE AND WIPE Lead 8 oz glass jar 4deg C 6 months SAMPLES with Teflon-
lined lid
Bench-scale 5 gallon high NA NA testing density
polyethylene bucket
PCBs Two 1-liter 4deg C 7 days shyamber glass extraction bottles 40 days shy
SURFACE analysis WATER
Lead 500mi HN03 4deg C 6 monthsSAMPLES polyethylene to pH bottle lt20
Aluminum 500ml HN03 4deg C 6 months polyethylene to pH bottle lt20
NOTE All standard sample containers will be l-CHEM equivalent bottles supplied by the laboratory The 5-gallon polyethylene bucket will be rinsed with methanol and distilled water prior to use
NA = Not applicable
Project 90393 GEI Consultants Inc March 28 1991
gt 1I L )
i bullbullbull j bullgti sil- j-V
poundP
A C
jfr35
QUAOnANQLE LOCATIONTOOU9 POND MAINEJI881)N4416-W37-307B
bull4000 FEET
Central Maine Power Company Pre-Design Work Plans SITE Augusta Maine OConnor Site LOCATIONFrom EC Jordon Co RIFS
Augusta Maine MAPReport dated June 1989
C D Project 90393 January 1991 Fig 1 G E I C o n s u l t a n t s I n c
b-r
p pp l-I 0 x foooo^ _^_ZZZ~~r^-^
UpoundEtpound 1IMA iRAMWOfMII NOW AM A OAAMAG IWAllrj WWEOfOHAMMS MHICUOn Central Maine Power Company Pre-Design Work Plans LOCAIION Oh
in cuelt^KL2 Augusta Maine OConnor Site TRANSFORMER
Scale 1 inch = 142 feet Augusta Maine WORK AREAS AND SWALESFrom EC Jordon Co RIFS
Report dated June 1989 C D G E I C o n s u l t a n t s I n c Prnjprf QfttM January 1QQ1 Fifl 0
~- bull middot bull -middot r middot~middotmiddotmiddotIll middotmiddot t~r
I bull Imiddot
bull bull1 middotmiddot middotir-------~-------middot ~ bull middot middot-------------------middotmiddot ~ middotmiddotmiddotamiddot A middotimiddot r bull amiddot A I bull TWA I tmiddot LOW AREA A NO~TH) SOUTH) I
v
A middot
rmiddot---middot---middot~middot---- ----middot~middot [WEST) [W[ST) (EASr) middot I
middot middot middotmiddot AmiddotA D-D 220 SCRAP ARf-A 201 -
bull - I
nor 140 TWA I 2bull0
1 bull middotbullmiddot1~-~~ L~W AR1-A ---- middot-~ l0 ~
i r bull I -$-~middot
0 - )1 _~ ~ middot1~oi I EEltY
J I ~2J~ bullbull
bullf()omiddot middotmiddot middot~ bull0 2 i- 0
11bull I lo bull ~middotmiddotmiddot~middot ~ ~--middotmiddot~middotbull ~-8~-i~~jplusmny~f~=ii1 - ~ bull ___ I I- _5 middot~bull-tmiddoti~middot~ N ~ bullbull ~ i I o middot TP19 gt - ~ ~ Jmiddot ~I middot~middot~I bullJUI 215 middot 215~-I e bull TP23 if 21~ ~ middot middot middot_ ------ ~middot - L middot~ ~ ~~ 1 i i
235 middotQ1middot1middotmiddot ~ bullbull ~~middot~middot- Lil middot~ _~ middot f bulllto --- z middotmiddot middot
middotr
-lt lt -middot I ~ middot ~ I
1 c ~ __ ) bull bull bullmiddot bull --middot Q
middot bull bullbull - 1middotmiddot - bullbull ~middots middot- uPPfR 1middotmiddot T LAGOON 1middot middot -$- middot middotmiddotpoundpound~middotmiddotmiddotmiddotmiddot bull =lt middot
~ middot ~~ iP22 gt middotgt
w
210 I
-
------_7___ 210 1 _
w_ +-
middot middot w--~ J210 middot i~30 -- middot_
1 TP18 bull middotmiddotI middot~ ----shy middot-middotmiddot
middot~ I j
middot- t - I 1 I BEDROCK 11 I
1
lmiddotmiddotomiddotmiddotmiddotmiddotmiddot middot middot middot =middot _middotmiddot middotmiddotmiddotmiddot 1 I rI Th 205 bull 205
bull -middotmiddot bull_ 1 225 22 middot bullbullbull fltISmiddot middot middot ~ ~middot f4tmiddotmiddotmiddot I J205 1bull
middot OOTR10U1t0N craquo-middotPC~middot~oN~A~ SEL11r~~~TS H LO~ AR~A ------------------------------------------------bull1 BASEO IN PART ON QBSERVATION Of FILL PlACEMENTmiddot bullmiddot E~middot-1middot bull bullbullbull middotmiddot Q - _
_
-1 I
fmiddot bull bull
-middotmiddot I r-middot shy c bull
I omiddotmiddot
r- middotmiddotI ~I
1 middot1 r bull bullf-Sf1 TWA I middotbull middot ~ i1 bull bull middot (EASfJbullI middot-----bullI (WEST) middotI bull I 1I cmiddot middot~ I~ ~ I bull bullbullbullI 1bullbull
(EAST) - bull middot- - I
bull bull r ~middot l
~
~30 i
2io bull
middot) Ibullbull
I
- J l TPl7 bull- f ~j -middot middotmiddotmiddotmiddot I 1 J middotmiddot1
middot~ ~ bull middotimiddotmiddotch bull bull_ t-ROAOI cli middot bull ~ middot1middot
225
I bull ILmiddot i~A--middot1middot 225 bull
1225 middot I ~ CENTRAL DRAINAGE middotmiddotmiddot--Q-middot --middot _ --middot
~ I -- -shy A middot
bull B-B --- m
- _ - middoti-- 10bull ~ m
g r
220 220 I ~
I middot _
l MI r ~ I
middot middot 1bull bull1 111
I rbull bull
middot
bull bull l
215 BEOROC~ 215
bull I bull middot - -
) l
-middotshy- bull Il
I 5 -middot middot middottc bull bull gt f bull 110 1~ w 210 210 ~ middotmiddotmiddotmiddotmiddot middot-middot -
( bull
middotlt bull [ I
bull G -
-middot-
middot middotmiddot bull ~middot-middot-- -middot- t~middotmiddotmiddotmiddotmiddotmiddot middotmiddot middot L -middot 1 -middot~ bull bull - middotmiddot L middot-~ _ bull f middot middot1 I ~ l
205 bull bull ~middot JO~cmiddotimiddotmiddotmiddotmiddot middot--middotmiddotmiddot1 _~ middotmiddotmiddotmiddotmiddot middotmiddotmiddotmiddotmiddotmiddot bullI bull middot -middotmiddotmiddotmiddotmiddotmiddotg
bull -$-middotmiddotmiddot middot~middot iii~~- ~0 i TB-20 SUBSURFACE BORING NUMBER bull bull bull TPmiddot 105 TEST PIT NUMBER
middot
bull1
bull I TP16 middotmiddotmiddotmiddotmiddot~ Q G) ) mmiddot i GROUND SURFACEmiddot bull 1bull 1middot bull I i ~ u o I bullbullbull I~ bullbullbull bullbullbullbullbullbullbullbullbullbullbullbull bullbullbullbullbullbullbullbullbullbull bull middot bull
ll bull bullbullbull middotmiddotoz bull I 250 CONCENTRATION OF PCBs IN SCREENED SAMPLE lPPm) r lt bull bull I
middot CONCENTRATION CONTOUR middot middot bull - -- CROSS-SECTIONS CONTOURED AT 5ppm 50ppm ANO 500 ppm TOTAL PCBs
middotbull middotmiddot c- I bull ~~ ND NOT DElECTED -middot ~ I
middotmiddot middot--middot~ middot sect t I middot UNDERLINED VALUES ARE CLP RESULTS (ppm)bull
middot -____ bull ~~ - -- I
bull bull middot -middot middot bull Ibullbull middot ~- middot --- LEGEND (ISOPACH MAP) bull lmiddot I l
I
-middot 1 middot I
bull middot ~SUBSURFACE EJORING LOCATION middot
-t middot ( 10766 - 10 10186) middot middot J BORING NUMBER -2 middot THICKNESS OF SOIL CONTAINING PCBs IN EXCESS OF 5 ppm
I
bull ~ middot
LOW AREA BORING LOCTION (107187)
- I j
I
bull BORING LETTER - ~ THlC~NESS OF SOIL C011TAINING PCBs IN EXCESS oF Sppm middot middot middot middottmiddot=plusmn+ TEStPIT LOCATION 1 bull bull bullbullbull i 0~ Q G) I -$ ELECTRICAL EQUIPMENT SAMPLE POINl middot middot -middot bull 1-1 I ~ bull
If bull bull ) bullbull bullbullbullbullbullbullbullbullbullbull f4( middot~01 l - bullmiddotomiddot
middot - ( ~-~ SURFICIAL EXTENT OF SOILS CONTAINING gtSppm PCBs bull middot (
bull __ ~ -middot middot_ middotmiddotmiddotmiddotmiddotmiddotmiddotmiddot _ - middotmiddot --- bull bull -bull - ISOPACH LINE ILLUSTRATING THICKNESS OF SOILS CONTAMINATED BY middot middot middot -middot~middotmiddotbullmiddotmiddotmiddot middotmiddotmiddot bullbull middot middot bull middotmiddot middot 8 -- bull _CONTOURS [)RAWN _-- ~ _l bull abull lO_fEF lran_~OUllCStRF~CI gt~~~~ ~~~~bull
I bull middot T o o bull bull middot middotmiddot
) NOTES 1 -middot -middot bull
I1 THE ISOPACH CONTOURS WEREDRAWN TO DENOTE THE THICKNESS OF SOIL ~ Q iP1 middot 0 bullbull 5 bull GEi BORING LOCATIONS middotMEASURED FROM THE SURFACE CONTAMINATED BY GREATER THAN 5ppm TOTAL PCBs bullbull bull bull I THE VALUE OF 5ppm WAS CHOSEN ARBITRARILY AND IS NOT INTENDED TO REPRESENT
middot bullv middot-- - l A SITE-SPECIFIC CLEAN-UP LEVEJ GEi TEST PIT LOCATIONS
2 CRO~S-SECTIONS ILLUSTRAt EXTENT OF PCB CONTAMINATION WITH DEPTH I middot- -f j bull I
_ veRTt6l1 EXAGGEP1r10M m c~oss sicT1c~S 1s 61 middot
bull
middot
I middotshy1
middot J~uJt bull bull i ~ ~ _ - middot j
1 ~ middot bull bull bull middotmiddot l a )
0 gt bullmiddot -~I middotbull I 0 middot r middot- bull ibull I
bull
_ _ I I ~
middot I
bull bull
bull middot~r
- -middot- - -
bullI l middotI middot I bull r f I I
~_ Igt bull
bull f middot
t bull middot bullbull 8 _
~ 7 I r 9
-middot- bull bull I I ~
middot 1
bull ____________________________ ___ _ bull I
bullI 1 bull middot -~ bullr
---------r- -- -- middot~-~~~~middot--middot ~ f middoti middot
bull t ~
bull
middot j
1
-------- -------- ---------------------------- ti 1
bull ~---middot ------middot ~---middotmiddotmiddotmiddot-middot--middot-middot~---middot-- ___~------- middotmiddotmiddot middot middotrbull ~ ~--~~-~middot-~ 1 middotmiddotmiddot I
middot bull middot4J middotmiddot 1 middot
middotI 1
I
bull
bull
middot ~ middotimiddot 1 bull j-1 ~ bullbull bull I bull i ~
APPROXIMATE SCALE I DESIGNED
~ BY
bullIbull Imiddot bull SOURCEmiddot EC JORDON CO RlFS middot bull Central Maine Power Company Pre-Design Work Plans SOIL I ~ t
middot
middot bullmiddot I ~middotmiddot ( bull bull REPORT DATED JUNE 1989 bullL bullr middotmiddot bull ~I middotmiddot DRAWN BY I I bull 1 r bull ~ middotmiddot middot
bull r shy~middot r i Augusta Maine OConnor Site bull SAMPLING I Imiddot 0 middot bull
bullI
bull bull
r bull 40 80
J 1bullmiddot
CHECKED BY Augusta Maine middotLOCATIONS
h cf I ~ 1bull rmiddot_
1 Inch =~Feet t--~------~---_middotmiddot~ I ~middot bullgtIbull
) i _- DATE January1991 middot middot middotmiddotmiddot tbull middot1middotmiddot APPROVED BY GE I Consultants Inc
middot
middotmiddot middot t---P-R_O_J-EC_T_9_0_39-3-----4-S-H-E-ETmiddotmiddotOfFbull t DATE REVISION BYmiddotmiddot J middotFlg3 middot
1 nuovN( POST middot 1 Nl6~1 middot bullbull Ibull Ibull bull bull lomiddot bullbull -
I
I
I
------------ -
) bull middot i bull I
~ f I middot1 bull ~I r
I
middot
-middot- CJ middotYmiddotmiddot I
C bull
middot
I middot I
middot -shy bull bull middotmiddot~
J middot _ bull y
Ibull bull
~ bull ~~ r I bull middot bull
middot bull
I ~ I I ( I bull
JI t
- I
J l I
-~ 1 I
bull j middot middot~ ~ middot) __-_ bull i
Ibull I lt bull
middotmiddotmiddot
gtImiddotmiddot
I
I bull
middotmiddotmiddotmiddot_v -
~ bull J i 1 bullbull
r 1 I ~ middotbull middotbull
I I I l~_middotgt~~bullI~~~bull~middotmiddot jbull1111 1 bull~ - 1 111 middot~ bull1 middot 1middot I jbull I bullI _- middotmiddot 1 1t1 _ 1 (Imiddot 1 bull1 1gt middot~middotlt~middot middot
I l bull bull 1 r I bull bull middot
bull middot middot middot middot~middot ~middot middot~
- J ~J ~~ O lt hj I bull ~ bull bull 1 o t I lbull I
middotmiddot bull ~ middot I bull middot bull bull
middot bull - I middot ~middot
bull 11 ( _ I
middot I Ii lfI ltI
bull
I 1- bull_ II ~ I middot
I bull vmiddotmiddot
30 I ~middot middot bull bull
lt 1 I ---middot _ bull I ~ bull bull ~ bull
II ~
111
bull bulll3 bull ~ middotmiddot bull Ibull 0 I 1 bull 111 bull bull I rbull1 middot 0 I I I - Ibullmiddot 1 bull r middot middot __ -
i bullmiddot ~ ----middot yen ~ bull ~ j
--~middot
I
I
- -- ( middotmiddot~middotmiddot- - bullbull~ _ ~- I ~ bull--- shymiddot ----bull
1- -
bullbull I I - ~ I I bull middot middot ~ I middot
1
---- _ --
bull1 II I j
I bullbullbullbull
II ~
J 1bull ~
I
bull I I bull I ~ middot Tmiddot I 1 ~ bull JI I t Ibull bull ~ bull middot
I -
-----~_ middot1
-1
~
bullbull
-
bullbull I
middot---- a I AiLWO _ middotshy
I
bull f l
I bullbull - middot I - bullbullbull
SVf1
S~D1- -0 sih3 0
I I 0 1 i ---shy (]
middot bullgt I
I J middot bull bull IIbull Iamp middot P I 177
r o ~ 0 SEol l-middot J~ I - -- ltl
f bull bull
gt1 bullI 1 V bull ~ II ~ tJ middot -middot-
I
middot1 - bull bull bull -middot
bullmiddot -bull wmiddot ~ ~ ~
bull IA1 gtW2 - gt1
- - ~ -
middotmiddotmiddot----- ~r=02 bull bullmiddot I __ i Ctt1rr--shy
bullI
Q bull _
1
D I bullbull middot - bull
SW2
I middot- bull
bullI ~middot
rl
~ se02 I bullbullbull I bullbull ~ L-lf L-- I
- ___ bull bull___ I bullbullbull
I bull ) I f IIUZ middot___ ---- bull cu bull
I gt
bullbull -shyI bull Ii bull f
~ middotmiddot~ ~ middot - I
I bull ~ ) I~ shy bullfmiddot~ ~ i ~ ~middot
~ I 1
bull 4 Ot f I
1 i f ~ bull lt
1
bull bull I
___ - ~)____ - ------~ -------middot-middot-r--middot-middot ----middot- - ---middot-middot-middot-middotbull
t t - -- a
I middot bull -- middot - __ __--~~~=--~---_-~= _ _ middot - I ii- - ~~=-=~==--=~middotmiddot-~=~~~~~~=-~~~======middot=middot~middot== middotmiddot-- _ - I
bull -------------------~_
t ~middot middot middot middotbull bull middot i------------1I Imiddot ~~f~=-~~J~i~~~f~U+--f~~~===~~-~~middot~f~=~=~=~~fi~-~-~==~~-==~==~~==~====~==~-=-==~=~=2~~~~~~~77=~=~=~~-=~s)middot==~~~--=-=~~~=~=~====-=====~~=~~~~~=~=~=~==~==-=~=~=middot
middot 7gt JloltGKLA lllD --- shy l lf-nt RT n bull middotl bull
I
-i~------ - -- -------- -- --= bull (
( ei -~ ---- -------- - - - - - bull - shyI bull middot 1 ------
--------~____-____ bull SSmiddotsmiddot~middot2-iJi_8plusmn~plusmn-~~plusmn=+=~==-=-==~~===~~~~~~=-=s~~2~-~s-==~~~z--==~=~~t-=-=-=-==-=---~34~~~-==-=-==-==~=middot==---~=-middot~i~middotmiddot~ middot)~ f ________bull _
~--- __ - ____ - bull shyI I
bull __ _ ~ ~ ~ middott1 middot_
J(J--_ 11bull middot ------deg gt
middot -f ~~~se~middot~ARm~OMAarra~PERfOAMagtBY 0 middot~ bullO ( l r
r-------------liDElmiNEiiiiY-r---Amiddot----------________---~-------------_____ __________middotmiddot_lIbull middotmiddotmiddot ACHERON ENOINEERINCI 8ERVJCED COMPLIED IU8lo BASll MAP
(middot VERIFIED TO MEET NATIONAL MAP ACCUAACI 8TANOARD8(NMJ) middot Tl1ROUQltATEaT GURVltY CONOUCIED Df JORDM 121aa LEG~ APPROXJMATESCALE DESIGNED BY
-----------_ ---------~ CentralMalnePowerCompany p D W kPI middotSURFACEWATERANDmiddotmiddot_-~middotmiddot~~~middotFitow~middot~(TOO~MEETNMAamp DRAwN BY re- es1gn or ans middot middot middot shy bull bull bull - bull
bull Aug~sta Maine OConnor Sitamiddot SEDIMENT SAMPLING middot3middot~~~middot~--~~amCla~~~~~~usa-o middot O GEISEDIMEITTSAMPUN~LOCATI~Ns o 40 middot 80 1
BY LOCATIONS ~middot)~middot ~ bull 11i GEISURFACEWATERSAMPUNGLOCATIONS middot CHECKE
rh A~gustaMalne lt middotmiddot( middotmiddot 11nch-40Feet DATEmiddot January 1991
middot APPRovED BY -V GEi Consultants Inc ~ Imiddotgtmiddotgt middotmiddot middot middot souRCE EC JORDON co RlFS bull middot GEi COMPOSITE SEDIMENT SAMPLE bull DATE REVISION BY - PROJECT 90393 SHEET OF middotI middotmiddot middotI middotAEPORTDATEDJUNE1989 v COUECTEDFORBENCH-SCAIETESTING
I J ~ I
i I bull I )__ )
I I ilo I Ibull
X -4 mdashmdash-0shy
W A Elec-Zl lt4W
Meters Shelves ^ Pickup
A CapAntique a)
W WAutomobile W J
ia iW Y
W A o
LEGEND C w
Stove - wBoat X Designated Wall Label w
-e- -fr bulleshybull Cement SlabDust Sample
0 Wooden Wall Sample ZTaping Reference Origin
W Wipe Sample
Approximate Scale
NOTES 30 Feet
1 Ail locations on this plan are approximate
2 Sample locations are general Central Maine Power Company Pre-Design Work Hans EXAMPLE examples of the type of sampling Augusta Maine OConnor Site BARN SAMPLINGand the distribution Augusta Maine LOCATIONS
3 Revision No 1 (3-28-91) ltP G E I C o n s u l t a n t s I n c Project 90393336 January 1990 Fig 5
I I I I
I
I I
I
I
I
I
I
Document VoL II SC SAP Appendix A Revision 0
Date January 171991 Page 1
V
APPENDIX A zgt
s HEALTH AND SAFETY-PLAN
Source Control PrampDesign Studies CConnorCO^Site
Augusta Mkine shy_ lt
lt
NT lt
Document Vol II SC SAP Appendix A Revision 0
Date January 171991 Page 2
GEI CONSULTANTS INC SITE HEALTH AND SAFETY PLAN
Site Name OConnor Co Site
Site address Street Route 17 Qty Augusta State Maine
Proposed Site Activities Source Controlsampling of surface andsubsurface soilssediments surface water and the on-site barn
Proposed Date of Work April 1991 gt S
Original Safety Plan YES
Site Safety Coordinator Thomas S Bobowski
Client Central Maine Power Company^(CMP)
Site Contact Charles Nickerson (CMP)
Team PERSONNEL ^ IRESPONSIBILITIES Robert E Stetkar lt ^mjectManager Joanne O Morin Work Tlans and Pre-Design Studies Manager Richard F Murdock Qhality Assurance Officer Benjamin YSu Treatability Studies Manager Joseph G Engels Technical Consultant Steven R fcambx Source Control Sampling Task Manager Thomas S Bobowski7 Barn Sampling Coordinator Sampling Boyd P Smith Sampling Christopher L Covel Sampling William J Haswell Sampling Charles Blodgett Field Screening Analytical
Background Information
The OConnor Co Site (Site) covers approximately a 9-acre portion of a 65-acre parcel within the city limits of Augusta Maine The Site is surrounded by sparsely-developed residential or agricultural properties or undeveloped woods and wetlands (Riggs Brook and associated wetlands border the Site to the east) The F OConnor Co operated a transformer stripping and recycling operation on theSite from the1950s through the 1970s
Document VoL II SC SAP Appendix A Revision 0
Date January 171991 Page 3
During operations releases of wastes including PCB-laden oils resulted in contamination of water and soil on the site Principal features of the Site include a barn which formerly housed scrap operations an upland marsh formed by man-made disruption of natural surface water drainage upper and lower surfacewater impoundments (lagoons) constructed to control migration of oils from the Site a low area where excavated lagoon sediments were deposited within a clay liner three former transformer work areas a former scrap yard and a wetland associated with Riggs Brook A site plan depicting some of the major features of the site is shown in Figure HS-1
Ax In 1986 and 1987 remedial investigations were performed byECvJdrdan Co for Central Maine Power Company (CMP) These investigations included over^OQ soil samples 11 monitoring wells and analysesof surface water ground water sediment and biota for PCBs organic and inorganic chemicals The primary contaminantsdetected in soil and sediments at the Site were PCBs PAHs and Lead Chlorinated benzenes PCBs phthalates and to a lesser extent volatile organics and metals were detected in ground water and PCBs and metals were detected in surface water Using these data Clement AssociatesInc performed an Endangerment Assessment in 1988 for EPA^evaluating risks to human health and the environment associated with existing condiuoi^ra^Tuture conditions related to a noshyaction remedial alternative In 1989 EC JordabCoi acting as consultant to CMP completed a Feasibility Study which evaluated remedial alternatives based on information provided in their earlier Remedial Investigation Report and in the EPA Risk Assessment Report After receipt of the Feasibility^Stiidy Report EPA issued a Record of Decision (ROD) in September 1989 describihg the^EPA^elected remedial alternatives for source control and management of migration
Site Status Waste Types
Includes the followin
Ground water Surface water Sediment Soils On-site structures
Refer to Table1for listing of chemicals of concern during Source Control studies per media sampled
Document VoL H SC SAP Appendix A Revision 0
Date January 171991 Page 4
Hazard Evaluation
Known orSuspected HazardousToxicMaterials Polychlorinated biphenyls (PCBs)volatile organic compounds (VOCs) polycyclic aromatic hydrocarbons (PAHs) and metals (especially Lead) The ranges of concentrations of chemicals detected in all source control media on-site are presented in the attached Tables 1C through 1L from previous studies Concentrations of PCBs PAHs and Lead detected in surficial soikduring previous studies (including the on-site Barn) are shown in Figures HS-2 HS^3 and HS-4 respectively Concentrations of chemicals detected in surface water and sediihentsduring previousstudies are shown in Figure HS-5 lt( x
The primary concern at the Site is contamination of surface soils by spillage or leakage of transformer oils containing PCBs The potential forencountering concentrated wastes in the transformer work areas (TWA I TWA II andltTWAIlI) is high In addition wastes have also been identified in soils and sediments associatedwith the lagoons and drainage swales Within a short distance of these discrete areas of the site the potential for encountering significant concentrations of wastes-is low ToYeduce the likelihood of being exposed by wastes associated with these areasduring~source control sampling activities efforts should be made to avoid walking unnecessgrilyriiv these areas
Exposure to hazards from chemiealsduiing test plying and environmental sampling and analysis tasks are most likely to occurbyone-or more of the following
1 Direct contact with contaminated surficial and subsurface soils sediments or surface-water x N
mdashN2 Inhalation of fu^Uve^ust carrying contaminants
3 Inhalation of volatile orgsuuc compound vapors while test pitting or sampling the various media on-site
Toxic and Pharmacological Effects Refer to the NIOSH Guide to Chemical Hazard Table 2 lists the major chemicals of concern and their toxic and pharmacological effects Acute exposure to PCBs PAHs Lead and VOCs may result in dizziness or nausea The results of chronic exposure may include but are not limited to central nervous system depression liver and kidney damage and irritation of skin eyes and respiratory passages Many PCBs PAHs and VOCs are known or suspected carcinogens Routes of exposure include inhalation topical and ingestion
Document Vol II SC SAP Appendix A Revision 1
Date March 28 1991 Page 5
Heat-related illnesses range from heat fatigue to heat stroke the latter being the most serious Heat stroke requires prompt treatment to prevent irreversible damage to health Protective clothing may have to be cut off Less serious forms of heat stress require prompt attention to prevent further complications which may lead to heat stroke Unless the victim is obviously contaminated decontamination procedures should be omitted or minimized so that treatment may begin immediately
Hypothermia may result from personnel exposed to excessive cold during sampling operations Hypothermia requires prompt treatment to prevent serious damage to health Damp or wet clothing may have to be cut off and the persons body temperature must be elevated as soon as possible through the use of warm blankets or another persons body warmth Unless the victim is obviously contaminated decontamination procedures should be omitted or minimized so that treatment may begin immediately
Area Within Augusta Maine city limits
Proposed On-Site Activities Test pitting boring or hand augering for collection of surface and subsurface soil samples collection of sediment and surface water samples from an inflatable boat or from wading into the water with hip-boots and collection of samples from within the on-site Barn Potential physical safety hazards during each of the four proposed Source Control site activities are discussed per activity below
Test Pitting and Borings for Surface and Subsurface Soil Samples A backhoe will be used during test pitting operations to excavate soil for collection of samples The most significant hazard during this sampling effort is the potential for collapse of the excavation while sampling Therefore in accordance with OSHA and 29CFR1926 Subpart P if personnel are required to enter an excavation the excavation will be no deeper than 5 feet unless it is braced or sloped back For the Type A soils documented on-site (eg clay and glacial till) the required slope from the ground surface to the top of unbraced portion of the excavation in all directions is 05 HORIZONTAL 1 VERTICAL Short-term excavations of this type will not exceed 12 feet in depth In general a drilling rig will likely be used to obtain samples from depths below 5 feet by augering to a specified depth and using a split-spoon sampler
Document Vol H SC SAP Appendix A Revision 1
Date March 28 1991 Page 6
Other physical hazards during test pitting and boring operations include the presence of overhead objects (eg backhoe bucket) so hard hats must be worn during these tasks at all times In addition the potential for spreading contamination with fugitive dust during excavation and mobilization between sampling locations is much greater than during other Source Control sampling efforts Therefore Level C dermal and respiratory equipment must be worn during all test pitting and boring operations (see below) Additional decontamination procedures will be required between sampling areas to limit the potential for cross-contamination (see below)
Sediment and Surface Water Sampling These operations will be conducted using Level C dermal protection only The need for respiratory protection will be based on criteria discussed in the next section In order to collect sediment and surface water samples in interior portions of the Upland Marsh and Upper and Lower Lagoons an inflatable boat or hip-boots will be used Further sampling will be performed by walking along the shores of the surface water bodies while dragging a sediment sampler These operations involve the risk of falling in relatively deep water while equipped with Level C dermal protection This equipment may limit movement and may inhibit a person from swimming easily to safety Therefore while sampling with the boat a Coast Guard Approved life vest will be worn at all times In addition one person will standby on-shore to observe the boat operation and to assist in the event of a mishap Depending on the water and air temperature at the time of sampling it is possible that a person who had fallen in water may require treatment for hypothermia or shock
Barn Sampling The barn can be classified as a confined work space since it is fully enclosed and has a limited number of exits In order to operate safely in a confined work space special considerations are necessary Unlike some confined spaces the barn has numerous small openings in the wooden structure to allow for an adequate supply of air while collecting samples However the sampling effort will likely generate a significant amount of airborne dust within the barn which means that Level C dermal and respiratory protection must be worn at all times while in the barn One person will remain outside the barn during the sampling effort to observe the sampling personnel and to provide backup services Two Combination Type A-B-C fire extinguishers capable of extinguishing wood and paper flammable liquidis or electrical fires will be available (one inside and one outside the barn with the standby person) in the unlikely event of a fire occurring during sampling
Document VoL H SC SAP Appendix A Revision 0
Date January 171991 Page 7
In accordance with OSHA 29CFR1910120 a minimum lighting intensity of 5 foot
candles will be provided within the barn during sampling The creation of dust and the
low lighting which may be available in some areas of the barn is likely to limit vision
some of the time Special care must be taken to avoid tripping over the numerous
objects disposed of within the barn No electricity is available in the barn so power
will come from outside the barn to supply power for lighting and tools to be used in
the sampling effort This means that electrical extension cords will be laid out on the
floor to various sampling locations In addition a large amount of metal and wooden
debris exists within die barn which may become obstacles to free movement in certain
areas The wooden floors of the second story and loft ofxthe^arn are extremely
deteriorated in some places and should not be accessed unless authorized by the Site
Safety Coordinator v
The use of electric power tools to collect samples ^wobd boring and concrete drills) require special care The use of Level C dermal protection such as loose fitting gloves may make handling the drills more difficult Use speciaLcare to avoid contacting the moving bits of the drills while in operation tonvoid tearing tyveks or gloves If dermal protection is torn replace or patch it immediatelybefare proceeding with the sampling operation
Perimeter Establishment
MapSketch Attached See bdquo Perimeter Identified Access to site is restricted at all entry points via a locked
8-foot high cyclone fence^- x y
Zone(S) of contamination identified See Figure HS-1 through HS-5
Document Vol II SC SAP Appendix A Revision 1
Date March 28 1991 Page 8
Recommended Level(s) of Protection On-site personnel will use Level C dermal protection at all times See below for respiratory use
1 Protective Clothing
Sampling and decontamination personnel in these areas will wear
bull Disposable Tyvek coveralls over cotton coveralls bull Tyvek hoods bull Safety glasses or face shield bull Hard Hat bull Disposable booties over workbooks or waders for sampling surface water and
sediments bull Butyl rubber gloves over surgical gloves bull All gloves and booties will be taped to the Tyvek coveralls
2 Respiratory Protection
Air purifying respirators will be worn at all times while sampling during test pitting and boring operations and while inside the barn Otherwise the need for respiratory protection will be determined by on-site monitoring for organic vapors and the daily potential for exposure to airborne particulates The decision to utilize air-purifying respirators due to airborne particulates will be made by monitoring with a MIE MINIRAM Hand-held Aerosol Monitor (HAM) Based on previous studies (Endangerment Assessment Appendix F) an action level for worker safety of 10 mgm3 of respirable dust was established for the site Therefore when readings on the MINIRAM of 10 mgm3or greater are experienced Level C respirators will be worn Initial on-site monitoring for organic vapors will be conducted using an HNu Photoionization Detector (PID) Ambient vapor levels of 5 to 10 ppm above background in the breathing space will require the use of full-face cartridge respirators (Level C Protection) Background levels will be determined at the edge of the Site (ie fence line) before the initiation of the days activities Air quality will be monitored at the upwind boundary of the site at three locationsfor a duration of one minute at each location The maximum PID reading at each location will be recorded and the three readings will be averaged to determine the background level for that day Respiratory protection will be full-face respirators fitted with combined organic vapor and high-efficiency particulate cartridges (MSA Type GMA-F) Respirator cartridges will be replaced at a minimum on a daily basis Depending on readings obtained with the MINIRAM cartridges may be replaced at mid-day on windy days
Levels of organic vapors greater than 10 ppm above background in working areas will necessitate utilization of self-contained breathing apparatus (Level B Protection) During sampling HNu monitoring should be utilized to detect any changes in organic vapor levels Changes in fugitive dust or vapor level detection at any time may warrant appropriate alteration of required respiratory protection
Document VoL H SC SAP Appendix A Revision 0
Date January 171991 Page 9
Decontamination and Disposal
A decontamination areawill be assembled at the entrance to the site The decontamination zones will be established such that personnel and equipment are fully decontaminated prior to leaving the fenced area In addition all personnel will be familiar with proper decontamination procedures prior to going on site All personnel entering and exiting the hot zone shall pass through the decontamination zone
1 Personnel Decontamination
The personnel decontamination sequence is as follows
a Samples and equipment are dropped on plastic sheets
b Disposable booties Tyvek coveralls and contaminated outer gloves are first brushed off with soapy water then rinsed with clean water by decontamination personnel Thedisposable equipmenfis^then removed baggedand placed in a 55shygallon drum marked Dry Deconv
c Neoprene boots and outer gloves are washed if they were not drummed in Step b with soapy water and ririseck with clean water An additional rinse with methanol followed by a firiak water-rinse completes the sequence
lt d Neoprene boots and glovesare -removed
e Respirators (cartridge-change) are removed if necessary and disposed in the Dry Decon drum
f Surgical gloves are temovfedand disposed in the Diy Decon drum
Document Vol M SC SAP Appendix A Revision 0
Date January 17 1991 Page 10
2 Equipment Decontamination
The equipment decontamination procedure for Source Control sampling work performed inside the fenced area of the site is as follows
a All disposable items (eg surgical gloves plastic sheeting nylon brushes etc) will be discarded in the Dry Decon drum
b Heavy equipment such as the backhoe and drilling jig will be steam-cleaned on a specially constructed decontamination pad located east bfthermain site access gate and north of the ground water monitoring well couplet MW1Q2A and MW102B (see Figure HS-7) The pad will be constructed to allow for drainage of steam-cleaning solutions onto a bermed multi-layer -impermeable barrier consisting of several layers of at least 6-mil-thick polyethylene sheeting overlain and underlain by geotextile fabric The geotextile fabricwilfbe designed to collect contaminated sediments which may have collected on tires or excavating equipment Rinse water from the decontamination processwill then fre pumped through hoses or channelled for drainage into the Uppei^La^oomafter completion of surface water and sediment sampling The decontamination pad will be left in place after completion of field sampling
c All other equipment contacting surface or subsurface soils sediments surface water or materials within thebarm(egtrowels spatulas templates drill bits etc) will be decontaminated by rinsing with clean water scrubbing with methanol and re-rinsing with distilledwater Solutions which contain methanol will be collected for disposal into tHeJWet Decon drum Equipment used during barn sampling will then be drted^with paper towels and the towels will be disposed in the Dry Decon drum ^
3 Decontamination Station Closure
The procedure for decontamination station closure will be as follows
a Decontamination personnel shall be responsible for closing the station at the end of each workday
b All solid wastes such as plastic tarps bags and Tyveks will be placed in the Dry Decon drum and will be closed at die end of each workday
Document Vol IISC SAP Appendix A Revision 0
Date January 171991 Page 11
All spent decontamination solutions containing methanol will bedisposed of in the Wet Decon drum Decontamination solutions which are not composed of methanol and exhibiting PID readings below 1 ppm will be poured into surficial soils on the edge of TWA I within the fenced area of the site If PID readings are greater than 1 ppm the solutions will be disposed in the Wet Decon drum These drums will be closed at the end of each workday
d Drums shall be secured on-site until proper disposal is arranged after consultation with EPA
7 Air Monitoring Procedures X
Site Monitoring Equipment PID HNu PI-101 HAM MIE MINIRAM
Since Level C respirators will be used during test pitting and barn sampling air at the test pit and barn sampling areas will be monitoredfegularly with a PID and HAM primarily for future reference of the levels of VOCs and dustto^be expected during remedial activities During the other sampling efforts air monitoring wiH form the basis for whether an upgrade to Level C respiratory equipment is necessary TheltPID will be used regularly during soil sediment and surface water sampling^ TKampHAM will be used at least twice per hour while on-site to monitor for dust levels in air^Whenunusually windy conditions are experienced additional monitoring for dust levels wilLbe^erfbrmed When ambient temperatures in air are below 32deg F the chart recorderattachment for the MINIRAM must be used as the LED readout on the instrument may not operate below freezing All PID and HAM readings will be recorded in theJield Log Book
Document VoL H SC SAP Appendix A Revision 0
Date January 171991 Page 12
Emergency Information
Location Phone
FIRE Augusta (207) 623-2511
POLICE Augusta (207) 623-2511 State Police (Augusta) (207) 621-1200
AMBULANCE Augusta (207) 623-25tlx N
HOSPITAL Kennebec Valley Medical Center (207) 626-1000 Augusta Division N 6 East Chestnut Augusta ME
Chemical Trauma Capability Yes
EPA (Michael Jasinski) 7) 573-5786
DEP (Thomas Benn) (207) 289-2651
CMP (Charles Nickerson) (207) 623-3521
Directions to Hospital (See Fig HS-6)
Primary route to hospital is west on Route17 (Eastern Avenue) to Arsenal Avenue turn right on Arsenal Avenue and go3 blocks to E Chestnut street then right Emergency room entrance is 6 East Chestnut Street Alternate route - west on Route 17 (100 yards) to Cony Road turn right on Cony Road take^rst left (Cony Street Ext) to Riverside Drive go left on Riverside Drive the second mtejsection will be Arsenal Street goleft on Arsenal Street East Chestnut Street will be second left
Document VoL H SC SAP Appendix A Revision 0
Date January 171991 Page 13
Additional Emergency Contacts
DR DAVID EGILMAN (617) 935-8581 HEALTH RESOURCES WOBURN MASSACHUSETTS
GEI CONSULTANTS INC
ROBERT E STETKAR (603) 224-7979 JOSEPH G ENGELS (617)721^4022 s
TSCA HOTLINE (800)424-9065
AT amp F (EXPLOSIVES INFO) (800^424-9555 V
NATIONAL RESPONSE CENTER x(8W) 424-8802
PESTICIDE INFORMATION SERVICE (800)845-7633
RCRA HOTLINE y -(800) 424-9346
CMA CHEMICAL REFERRAL CENTER (800) 262-8200V NATIONAL POISON CONTROL CENTER (800) 942-5969-y
US DOT bdquo (202) 366-0656
GEI CONSULTANTS ^ (603) 224-7979
Prepared by Thomas S Bobowski Date January 7 1991
Reviewed by Robert E Stetkar Date January 9 1991
All personnel working at this site have received OSHA required health and safety training Personnel are enrolled in a medical monitoring program A summary of training completed for all GEI personnel involved in the Source Control sampling program is provided in Table 3
Use of Common Sense is Required
I have read and understand this safety plan
Name (printed) Signature Date
Table 1A Organic and Inorganic Chemicals Detected in the Shallow Aquifer
Groundwater Samples at the F OConnor Site Maximum
Concentration Geometric Background
Range Mean[a] Concentration (ugL)
Chemical Frequency (ugL) (ugL)
ND(b]-2300B[c] 150 NDAcetone 211 ND-15J[d] NA[e] NDBenzene 211 ND-45 143 ND2-Butanone 17 ND-83 53 NDChlorobenzene 311 ND-53 NA NDToluene 27 ND-12J NA NDTriehloroethene 1P ND-11 81 NDBis(2-Ethylhexyl)Phthalate 411 ND-25 1deglaquo2 ND12-Dichlorobenzene 411 ND-14J 97 ND13-Dichlorobenzene 311 ND-13J 96 ND14-Dichlorobenzene 311 ND-29 94 ND124-Trichlorobenzene 17 ND-19 07 NDTotal PCBs 111 27-5085 06 49Aluminum 55 27-805 24 42Barium 55 13700-125451 38300 26600Calcium 55 ND-145 53 NDChromium 25 ND-37 NA NDCobalt 15 ND-285 66 14Copper 35 33-4952J 590 3Iron 55 ND-18 37 NDLead 15 21-2906 260 24Manganese 55 ND-154 10 NDNickel 15 ND-17 37 NDSilver 15 10593-72812 33400 14000Sodium 55 ND-71 71 NDVanadium 15 17-946 263 91Zinc 55
a) Calculated using detected concentrations and one-half of EPAs contract laboratory program (CLP) detection limits for the organics For the inorganic
chemicals the aqueous CLP detection limits were used
b) ND - Not Detected
c) B designates Chat substance was also found in the blank though the
sample level was significantly higher to prove a positive detect
d) J designates estimated value
e) NA - Not applicable Chemical was detected infrequently and the use of
one-half of the detection limit in calculating a mean results in a mean
concentration that exceeds the maximum Therefore a mean is not used
SourceEndangerment Assessment dated Jan 29 1988 by CDM
Table IB Organic and Inorganic Chemicals Detected in Bedrock Aquifer
Groundwater Samples at the F OConnor Site
Mean Concentration Geometric Background
Chemical Frequency Range (ugL)
Mean[a] (ugL)
Concentration (ugL)
Acetone 220 ND[b]-1200 68 ND Benzene 220 ND-27J[c] NA(d] ND Chloroblt ene 620 ND-16 36 ND Toluene 215 ND-27J NA ND Bis(2-E vlhexyl)Phthalate 1320 ND-64 Hi 61 12-Dich 13-Dic^
irobenzene jrobenzene
720 120
ND-26 ND-24J NA
66 ND ND
14-Dic^ robenzene 620 ND-44 82 ND Di-n-Bu phthalate 120 ND-22J NA ND 124-Tr hlorooenzene 720 ND-310 161 ND N-Nitros iiphenvlamine 25 ND-4J NA ND 3eta-BHC 110 ND-04 004 ND Gamma-BH (Lindane) 110 ND-006 003 ND Total PC 320 ND-50 LO ND Antimony 110 ND-55 19 ND Barium 1010 15-129 138 56 Chromium 410 ND-268 54 ND Cobalt 110 ND-115 92 ND Iron 1010 61-384301 837 152 Magnesiu Manganes
1010 810
5960-46250 ND-5895
15220 661
4203
27 Nickel 310 ND-345 125 ND Potassiu 1010 3504-16046 6560 4340 Vanadium 110 ND-52 NA ND
a) Calcul ted using detected concentrations and one-half of EPAs contract labor 3ry program (CLP) detection limits for the organics For the inorganic chemic Is the aqueous CLP detection limits were used
b) ND mdash F detected
c) J de Ignates estimated value
d) NA - N applicable Chemical was detected infrequently and the use of one-ha of the detection limit in calculating a mean-results in a mean concern ation that exceeds the maximum Therefore a mean is not used
Source Endangerment Assessment dated Jan 29 1988 by COM
Table 1C Organic and Inorganic Chemicals Detected in In-Fence Surface Soil
Samples at the F OConnor Site Mean
Concentration Geometric Background Range Mean[a] Concentration
Chemical Frequency (ugAg) (ugkg) (ugAg)
19 ND[b]-19J[c] NA[d] ND Chicroform ND29 ND-150B[e] 63Methylene Chloride
ND19 ND-30J NAToluene 260J19 ND-917J 260Bis(2-Ethylhexyl)Phrhalate
Carcinogenic PAHs ND19 ND-2700J 290BenzoltAgtAnthracene ND29 ND-12000J ^10BenzoltB or KgtFluoranthene ND39 ND-11000J 540Chrysene ND39 ND-23183Total CPAHs
Non-carcinogenic PAHs ND39 ND-12000J 540Pvrene ND39 ND-12000 540Total NCPAHs ND118186 ND-6205600 3400 Total PCBs 4001419 ND-64000 1900Cadmium 292001919 17000-29480000 275000
Copper 570001919 29000-2681000 213000Lead 252001919 19000-90000 35000Nickel ND219 ND-12000 650Silver 738001919 45000-1160000 183000Zinc
aj Calculated using detected concentrations and one-half of EPAs contract UboSto program (CLP) detection Unite for the organic For the inorgar-c chemicals the detection limits for soils were based on aqueous CLP
detection limit
b) ND - Not Detected
c) J designates estimated value
d) NA - Not applicable Chemical was detected infrequently and the use of one-half of the detection limit in calculating a mean results in a mean concentration that exceeds the maximum Therefore a mean is not used
e) B designates that substance was also found inthe blank though the sample level was significantly higher to prove a positive detect
Source Endangerment Assessment dated Jan 29 1988 by Clement Associates Inc
Table ID
Organic and Inorganic Chemicals Detected in the TVA III Surface Soil Samples at the F OConnor Site
Concentration Geometric Background Range Meanfa] Concentration
Chemical Frequency (ugAg) (ugAg) (ugAg)
44-DDT 13 ND[b]-5200 150 ND 44-DDE 13 ND-260 56 ND Total PCBs 2131 ND-620000 2940 ND
Antimony 11 189000 41000
Cadmium 11 11000 400 Copper 11 230000 29200 Iron 11 60900000 22200000 Lead 11 634000 57000 Zinc 11 799000 73800
a) Calculated using detected concentrations and one-half of
ErAs contract laboratory program (CLP) detection limits
b) ND - Not Detected
Source Endangerment Assessment dated Jan 29 1988 by Clement Associates Inc
Table IE irganic Chemicals Detected in Upland Marsh Sediment
Samples at the F OConnor Site[a] Maximum
Concentration Geometric Background Range Mean[b] Concentration
Che ical Frequency (ugAg) (ugAg) (ugAg)
To ane 11 23J[c] - ND[d] To- 1 PCBs 33 1300-34000 6425 ND
a) norganic chemicals were also analyzed for but none were itected significantly above background concentration
b) alculated using detected concentrations and one-half of PAs contract laboratory program (CLP) detection limits
c) J designates estimated value
d) D - Not Detected
Source Endangerment Assessment dated Jan 29 1988 by Clement Associates Inc
Chemical
Acetone 11 408B[c] ND[d]
Bis(2-EthyIhexy1)Phthalate 11 2082 ND
Toluene 11 28J[e](f] ND
Total PCBs 44 30000-1100000 381000 ND
a) Inorganic chemicals were also analyzed for but none were detected
significantly above background concentration
b) Calculated using detected concentrations and one-half of EPAs contract
laboratory program (CLP) detection limits
c) B designates that substance was also found in the blank though the sample
level was significantly higher to prove a positive detect
d) ND - Not Detected
e) J designates estimated value
f) In a duplicate sample toluene was not detected A geometric mean of the detected value and one-half of the detection limit would have resulted
in a mean concentration exceeding the detected value Therefore only
the detected value is listed
Source Endangerment Assessment dated Jan 29 1988 by Clement Associates Inc
Table 1G Organic and Inorganic Chemicals Detected in Lower Lagoon Sediment
Samples at the F OConnor Site Maximum
Concentration Geometric Background Range Mean(a] Concentration
Chemical Frequency (ugAg) (ugAg) (ugAg)
Bis(2-Ethylhexyl)Phthalate 12 ND[b]-100J[c] NA[d] ND
Benzoic Acid 22 120J-190J 150 ND Total PCBs 77 3202-40100 8660 ND
Cadmium 12 ND-2500 790 ND c 22 27000-59000 40000 20000
Lead 22 17000-70000 34500 ND
Manganese 22 525000-982000 718000 474000
Selenium 12 ND-760 436 ND Zinc 22 103000-249000 160000 108000
a)Calculated using detected concentrations and one-half of EPAs contract laboratory program (CLP) detection limits for the organic For the inorgan chemicals the detection limits for sediments were based on the aqueous CLP
detection limit
b) ND - Not Detected
c) J designates estimated value
d) NA - Not Applicable Chemical was detected infrequently and the use of
one-half of the detection limit in calculating a mean results in a mean
concentration that exceeds the maximum Therefore a mean is not used
Source Endangerment Assessment dated Jan 29 1988 by Clement Associates Inc
Table 1H Organic and Inorganic Chemicals Detected in Riggs Brook Sediment
Samples at the F OConnor Site Maximum
Concentration Geometric Background
Range Mean[a] Concentration
Frequency (ugAg) (ugkg) (ugAg)Chemical
12 ND[b]-30 12 NDMethylene Chloride
Carcinogenic PAHs 22 160J[c]-790 360 230JBenzoltAgtAnthracene 22 220J-800 420 290JBenzoltAgtPyrene 22 2-63J-1600 650 710J3enzoltB or KgtFluoranthene 22 280J-960 520 400J
Chrysene 12 ND-190J NA[d] NDDibenzltAHgtAnthraeene 12 ND-400J 340 NDIndenoCl23-CDgtPyrene 22 1507-4740 2670 2402Total CPAHs
Non-carcinogenic PAHs 12 ND-110J NA NDAcenapthy1ene 12 ND-200J NA NDAnthracene 12 ND-410J 350 ND
BenzoltGHIgtPerylene 22 280J-1200 580 420J
Fluoranthene 12 ND-80J NA NDFluorene 22 72J-680 220 150J
Phenanthrene 22 290J-1500 660 470J
Pyrene 22 1810-4180 2750 2584Total NCPAHs 615 ND-6481 870 NDTotal PCBs 12 ND-1200 775 NDSilver
a) Calculated using detected concentrations and one-half of EPAs contract laboratory program (CLP) detection limits for the organics For the degrgan chemicals the detection limits for sediments were based on the aqueous CLP
detection limits
b) ND - Not detected
c) J designates estimated value
d) NA - Not applicable Chemical was detected infrequently and the use of one-half of the detection limit in calculating a mean results in a mean
concentration that exceeds the maximum Therefore a mean is not used
Source Endangerment Assessment dated Jan 29 1988 by Clement Associates Inc
Table II Inorganic Chemicals Detected in Upland Marsh Surface
Water Samples at the F OConnor Site[a]
Sample Background
Concentration Concentration
Chemical Frequency (ugL) (ugL)
Aluminum 11 884 104 Arsenic 11 35 ND(10)[b]
Barium 11 12 47 Iron 11 3540 1160 Lead 11 36 ND(5)
Manganese 11 ^29 134 Potassium 11 7260 3610
a) Organic chemicals were also analyzed for but
none were detected
b) ND - Not Detected Limits of detection are
given in parentheses
Table 1J Organic and Inorganic Chemicals Detected in Upper Lagoon
Surface Water Samples at the F OConnor Site
Sample Background
Concentration Concentration
Chemical Frequency (ugL) (ugL)
108 ND(10)[a]Total PCBs 11 47Barium 11 23
6 ND(5)Lead 11 Manganese 11 1450 134
25 ND(40)Nickel 11
a) ND - Not Detected Limits of detection are given in
parentheses
Source Endangerment Assessment dated Jan 29 1988 by Clement Associates Inc
Table IK Organic and Inorganic Chemicals Detected in Lover Lagoon
Surface Water Samples at the F OConnor Site Maximum
Concentration Geometric Background Range Mean[a] Concentration
Chemical Frequency (ugL) (ugL) (ugL)
Total PCBs 22 13-375 221 ND[b] Aluminum 22 56-3740 458 104
Arsenic 12 ND-4 NA[c] ND
Barium 22 12-37 67 47
Cobalt 12 ND-9 NA ND Iron 22 1970-8260 4030 1160
Lead 22 91-13 109 ND
Manganese 22 137-2330 565 134 Potassium 22 5200-6220 5690 3610
a) Calculated using detected concentrations and one-half of EPAs
contract laboratory program (CLP) detection limits for the organics For the inorganic chemicals the aqueous CLP detection
limits were used
b) ND - Not Detected
c) NA - Not Applicable Chemical was detected infrequently and the
use of one-half of the detection limit in calculating a mean
results in a mean concentration that exceeds the maximum
Therefore a mean is not used
Table 1L
Inorganic Chemicals Detected in Riggs Brook Surface Water Samples at the F OConnor Site[a]
Maximum
Concentration Geometric Background Range Mean[b] Concentration
Chemical Frequency (ugL) (ugL) (UgL)
32 NDAntimony 13 ND[c]-35 5 NDLead 13 ND-16
a) Organic chemicals were also analyzed for but none were detected
b) Calculated using detected concentrations and one-half of EPA s
contract laboratory program (CLP) aqueous detection limits
c) ND - Not Detected
Source Endangerment Assessment dated Jan 29 1988 by Clement Associates Inc
Chemical
Acetone |CHCOCH3l Dimethyl ketone ketone propane
Toluene |CHCHJ _ e bull bull a O J Jtoluol phenyl aethane aethyl benzene
Cblorobcnzene (CHC1) aonochlorobenzene chlorobenzol
Ethyl benzene |C_HCH| phenyl ethane ethyl benzol
ACC TLV or STEL
ltPPB) (PfB)
750 1000
100 150 skin
75 (550agaraquo)
100 125
TABLE 2 CHEMICAL TOXICITY AND OTHER INFORMATION
Physical Skill Dcraal LD^ (mgkg) State Penetration Tonicity Potency ofraquoI(rat)
bullbullbull local it 9750liquid Bint-like odor
1297(nice)
liquid t local 5000
TC|Huosn =Ml00 ppa
colorless liquid 2910
colorless liquid local H 3500 with aromatic odor
syatcaatic bullbullbull TCu(Kiais) c 100 ppa
A hrs
Page 1 of 4
Remarks
Syaptoas Irritates eyea none throat narcotic in high concentrations
Target Organ respiratory aystea skin
First Aid Swallow water voait Skin soap wash
Incoapatibilities oxidizing materials acids Fire hazard when csposed to beat or flame
Tonicity 1 Persistence1 0
Syaptoas fatigue confusion euphoria dizzy headache dialated pupils lack of appetite nervousness insoania
Target organ CNS liver kidneys skin
First Aid Swallow NO VOHIT 8kln soap waah
Incoapatibilities strong ozldizers
Toxicity1 2 Persistence 1
Syaptoas irritates eyes nose causes drowsiness incoordination skin irritation
Target organ respiratory systea eyes skin cars liver
First Aid NO VOMIT
Incoapatibilities strong oxidizers reacts violently with AgClO^
Toxicity 2 Persistence 2
Syaptoas irritant to eyes and aucous aembrane headache narcotic
Target organ eyes upper respiratory systea
First Aid NO VOHIT
Incoapatibilities oxiding asterisks dangerous when exposed to heat or flame
TABU 2 Page 2 of 4 CHEMICAL TOXICITY AND OTHER INFORMATION
(continued)
ACC TLV or STEL Physical Skin Dcraal ID (agkg)
Cheaical (PPff) (PPB) State Penetration Toxicity Potency orsl(rat) Rcnarks
Benzene benzol
IC^H) 10 23 colorless liquid with aroaatic odor
local systeaatic
bullbull
bullbullbull Poisoning occurs aost coasaonly through lnhalationi also penetrates through akin
Syaptoass lrritatea eyes nose respiratory systea giddiness head nausea staggered gait fatigue depresesion sbdoaioal pain
Target organs bloody CNS skin bone narrow eyes respiratory systea
First Aids Swallows 8kins
NO VOMIT soap wash
Inconpatibilitiess strong oxidizers chlorine hronine with iron Dangerous when exposed to beat or flaae
Toxicitys 2 Persistences 1
Trichloroctbylcne ethylene trichloride tridene TCE
30 200 colorless liquid sweet odor
4820
1900(dog)
Syaptoass headache vertigo vision distortion treaors soanolcnce nausea voait irritates eyes cardiac errytbaiss paresthesias
Target organs respiratory systea heart liver kidneys CNS skin
First Aids Swallows Skins
Ipecac voait soap wash immediately
incoapatibless strong caustics chemically active actalss Da Li Ra Hg liquid O
Al 02 KN03 Ti
Persistences 3
Polychlorlasted biphenyi PCB Arocblor 1242 CjjHjClj(approx)
Arcblor 1234
C6H2C3C6M3C12
03
colorless to dark brown liquid with aild hydrocarbon odor
local systeaatic
local
Poisoning occurred Boat coaaonly through investigation or penetration of skin
Sypatoaas Irritates eyes (discbarge) skin scne-fora dernitatis Jaundice dark urine Target organs liver eyes skin First Aids Swallows Ipecac voait
Skins soap wash isnediately Incoapatibless strong oxidizers
TABU 2 CHEHICAL TOXICITY AND OTHER INFORMATION Page 3 of 4
ACC
Chulcil TLV or STEL (ppa) (POO)
Physical State
Skin Penetration
Derail Tonicity Potency
U)n (ngkg) of Reaarka
Dloctyl phtbalate di-acc-octyl pblbalata
5 aga1
light colored liquid
31000 Tonicity low to none via oral and derail routca produce 01 ayaptoas
12 Bichlorobenzene (C^H CI ) o-OCB
50 none liquid ++ local systemic
Symptoms irritates eyes and nose Target Organs liverkidneysskineyes First Aid Swallow salt water vomit
Skin soap wash Incompatabilities strong oxidizers
14 bichlorobenzene (CHbdquoC1 ) 7 2
P-OCB 75 110 solid ++ local
systemic ++ Symptoms irritates eyesheadachesnauseavomiting
Target Organs liverkidneyskineyesrespiratory system
first Aid Swallow water vomit skin soap wash
Incompatablities none
Lead (Pb) 015 mgm
none solid systemic t Symptoms Fatigue headaches abdominal pain Target Organs kidneys 61 central nervous system First Aid Swallow water vomit
Skin soap wash
Polycyclic Aromatic Hydrocarbons (PAHs)
015 mgm
none liquid systemic + Symptoms No obvious symptoms Carcinogenic to tissue following prolonged contact
First Aid Swallow water vomit Skin soap wash
Page 4 of4TABU 2 CHEMICAL TOXICITY AND OTHER INFORMATION
(continued)
NOTES
TLV - Threshold Unit Value ACC - Acceptable Ceiling Concentration STEL - Short Tera Exposure Limit
Suspected carcinogens teratogens or mutagens Firat Aid Unless specified flrat aid for oil of the liated cbeaicala are aa followa
Eyeai iaaedlatcly waab with copious quantity of cold water Skins Flush with water proaptly Breath Artificial respiration Swallowi Water voait
a Slight Hazard aa Hoderate Hasard aalaquo Extreme Hasard
Toxicity Ratiosa
Toxicity Rating
No toxicity (none) Material causes no hara in any condition or produces
tosic effects on buaana in very unusual circumstances or
in very large dosage
Slight toxicity (low)
Moderate toxicity
Severe toxicity
Persistence or each hazardous substance ia evaluated on its blodegradabllity aa follows
Assigned Value
Easily biodegradable coapounds 0
Straight chain hydrocprbons 1
Substituted and other ring compounds 2
Metals polycyclic coapounds and halogenated hydrocarbons 3
Adapted with modifications from EC Jordon Co RIFS Work Plan
TABLE 3 - PERSONNEL TRAINING AND MEDICAL MONITORING HEALTH AND SAFETY PLAN Field Sampling Plan OConnor Co Site Augusta Maine
personnel1
Robert E Stetkar
Joanne O Morin
Richard F Murdock
Benjamin Y Su
Joseph G Engeis
Steven R Lamb
Thomas S Bobowski
Boyd P Smith
Christopher L Covel
William J Haswell
Charles Blodgett
NOTES
ANNUALreg MEDICAL
MONITORING
yes
yes
yes
yes
yes
yes
yes
yes
yes
yes
yes
lt
y
OSHA 40shyHOURreg HAZMAT TRAINING
yes
yes
yes
yes
yes
yes
yes
yes
yes
yes
yes
ANNUALreg RESPIRATOR
FITTEST
yes
no
no
no
no
yes
yes
yes
es Yes
yltes
-y
CARDIOshyPULMONARY
FIRST AID RESUSCITATION TRAINING TRAINING
no no
yes yes
nov no
no no
no no
yes yes
yes yes
yes yes
yes yes
no no
yes yes
1 Only GEI personnel assigpedttfdo work on the OConnor site included on this list
2 Includes baseline and annual physicals lilood testing etc
3 In accordance with 29CFR191012tkncludes annual 8-hour refresher course
4 Includes annual respirator fit testing procedures
Project 90393 GEI Consultants Inc January 17 1991
TOW MAXARJM PCS CONCENTRATION (gtbullraquo) 8Y AREA
Central Maine Power Company Pre-Design Work Plans INTERPRETED CONTOURS Scale 1 inch = 180 feet Augusta Maine OConnor Site OF PGBs IN
Augusta Maine IN SURFICIAL SOILS From EC Jordon Co RIFS
Report dated June 1989 0 G E I C o n s u l t a n t s I n c Project 90393 January 1991 FigHS-2
Central Maine Power Company Pre-Design Work Plans DISTRIBUTION OF PAHs Scale 1 inch = 180 feet Augusta Maine OConnor Site IN SURFACE AND
Augusta Maine SUBSURFACE SOILS From EC Jordon Co RIFS
Report dated June 1989 0 G E I C o n s u l t a n t s I n c Project 90393 January 1991 FigHS-3
Central Maine Power Company Pre-Design Work Plans INTERPRETED DISTRIBUTION Scale 1 inch = 180 feet Augusta Maine OConnor Site OF LEAD IN SOILS
Augusta Maine From E C Jordon Co RIFS
Report dated June 1989 ltD G E I C o n s u l t a n t s I n c Project 90393 January 1991 FigHS-4
Central Maine Power Company Pre-Design Work Plans ANALYTICAL RESULTS FROM Scale 1 inch = 160 feet Augusta Maine OConnor Site SEDIMENT AND SURFACE
Augusta Maine WATER LOCATIONS From EC JOrdon Co RIFS lttgtReport dated June 1989 G E I C o n s u l t a n t s I n c Project 90393 January 1991 FigHS-5
Contamination 80 Feet
Control Line
Central Maine Power Company Pre-Design Work Plans SITE ACCESS AND Augusta Maine OConnor Site DECONTAMINATION
Revision 1 March 281991 Augusta Maine AREA
laquo G E I C o n s u l t a n t s I n c Project 90393 March 1991 KgHS-7
bull
Document Vol II SC SAP Appendix B Revision 0
Date January 17 1991 Page 1
APPENDIX B
FieldtogjL
FIELD LOGS
Project Field Log Book Equipment Calibration Logs
HNu Pl-101 MIE MINIRAM MARKSON CONDUCTIVITY METER MARKSON DIGITAL pHTEMPERATURE
Photograph Log Health and Safety QA Logs
Chain-of-Custody Forms Sample Assignment Forms Non-Conformance Report Forms Test Pit Log Forms Barn Sampling Forms Dexsil L-2000 PCB analyzer Calibration Boring Log Forms
lt
Document Vol II SC SAP Appendix B Revision 0
Date January 17 1991 Page 2
(OCONNORFL1)
(OCONNORFL2) (OCONNORFL3) (OCONNORFL4) (OCQNNORFL5) pound0CONNORFL6) (OCONNORFL7)
-(OCONNORFL9) (OCONNORFLIO) (OCONNORFL11) (OCONNORFL12) fOCONNORFL13) (OCONNORFL14) (OCONNORFL15)
Note Field Log OCONNORFLampisassigned to ground water sampling described in the Management of Migration Sampling andiAnalysis Plan
Document Vol II SC SAP Appendix B Revision 0
Date January 17 1991 Page 3
PROJECT LOGBOOKS (OCONNORFL1)
Serialized project logbooks are to be issued by the site contractor to all personnel at the site who have been designated to perform specific field tasks Individuals must sign their logbooks upon receipt and use them to record all pertinent information until the project is completed y
Logbook entries should be dated legible and contain accurate and inclusive documentation of an individuals project activities Because the logbook forms the basisfor the later written reports it must contain only facts and observations Entries made by individuals other than the person to whom the logbook was assigned are dated andsigned by the individual making the entry bull
CALIBRATION LOG Document No OCONNOR FT1 HNu Photoionization Device Model Pl-101 Page 1 of 1
Instrument Serial No
Lamp Date Span Setting Time Calibration Temperature User
Standard Introduced Meter Response (parts per million (ppm))
Comments (See Summary of Calibration Procedures attached7
X x
User Signature Date
Task Manager Signatures Date
CALIBRATION LOG Document No OCONNORFI3 MIE MINIRAM Hand-held Aerosol Monitor Page 1 of 1
Instrument
Serial No
Date
Time
User
Standard used (zero-bag)
Meter Display
Comments
User Signature lt Date X
Task Manager Signature l Date
CALIBRATION LOG Document No OCONNORFL4 Markson Conductivity Meter Model 103 Page 1 of 1
Instrument Serial No
Date Time User
Standard Used_ Meter Display^
Comments
s
v
lt
y xy ^y
User Signature Date z V
Task Manager Signature ) i Date
CALIBRATION LOG Document No OCONNORFU5 Markson Digital pHtemperature Meter Model 95 Page 1 of 1
Instrument Serial No
Date Time User
Temperature check vs mercury thermometer
Probe reading Thermometer reading
Upon completion of calibration procedure does pH probe checkout vs pH 40 buffer Reading bull lt x pH 70 buffer Reading bull
Comments v
X x
User Signature X^ Date
Task Manager Signature Date
Document No QCONNORFT f
Page
PHOTOGRAPH LOG
Project Name
Project No
Camera and Film Specifications
FILM
ROLL FRAME
DATE nTIME PHOTOGRAPHER PHOTO NUMBER
DESCRIPTION
lt3
ni
I X
V
V
gt
Document No QOONNORm7
HEALTH amp SAFETY QUALITY ASSURANCE CHECKLIST
Page 1 of 2 Project No Site Date Completed by
A On-site Operations During Hazardous Waste Site Investigations
yes no Team understands task procedures safety plan individual roles and site history contaminants
yes no Team knowledgeable to hospital route nearest phone location and who is responsible for health and safety on site
yes no Establishment of command post and decon station with Health amp Safety Plan readily available
yes no Establish communication or line-of-site maintained
yes no Field operations conformed environmental monitoring respiratory protection or emergency response
yes no Protective clothing and respiratory protection maintained
yes no Decontamination procedures performed on the following sample containers sampling equipment and personnel
yes no Equipment protected clean calibrated and being used properly by site personnel
yes no First Aid Equipment readily available at site with checklist and eye wash
yes no Site personnel trained in CPR and First Aid
yes no Site Records maintained such as field logbooks respirator usage log incident reports in place and up-to-date and any deviations or modifications to Safety Plan
GEI Consultants Inc
uocutrenc uujmutvrLz
HEALTH amp SAFETY QUALITY ASSURANCE CHECKLIST
Page 2 of 2 Project No Site Date Completed by
B Health amp Safety Follow-up Reports
o Adherence to procedures o Accidents o Unsafe practices or conditions o Results of environmental monitoring o Corrective action
GEI Consultants Inc
Document No Q00NN0RFL9 CHAIN OF CUSTODY RECORD
DOCUMENT NUMBFR rn tLORD
RELINQUISHED DYISiONruRE OATETJMD RECEIVED DY (SIGNATURE) RELINQUISHED DY (SIOHATURER DATETI^IE RECEIVED BY (SIGNATURE)
IIElINOUISIIEO BY(SIGNATURE) DATETIMf DATETIME gt REMARKS lcNAruDn^nLADOnATonvorI
P a g e o f
Document No OCONNORFLIO
Page of G E I C o n s u l t a n t s I n c
Project No
Project Name _
Laboratory Contact
Sampler ( s ) Date Assigned Date Sampled
GEI Sample No
Sample Medium
Quantity
Sample Container
Type
Analyses Requested Remarks
Special Instructions Remarks
Document No 0CQNNDRFL11
NONCONFORMANCE REPORT
Project Project No
Auditor Audit Date Finding No
FINDING
Where found Check Lit Item
ControllingDocument Section
Task Description
Noncenformanee
Discussed with
Recommended Corrective Action
Is system correction needed to prevent recurrence Yes No If yes state recommended action
Schedule Completion Date By
CORRECTION ACTION
Correction Action by Date
QA Approval of Correction Action by Date
Date Completed Submitted by
Correction Action Verified by Date
I T E S T P I T L O G QCONNORFL12
PROJECT
LOCATIONI CLIENT
CONTRACTOR EQUIPMENTI OBSERVED BY
I DEPTH BELOW
GROUND SURFACE
I (FT)
I
I
I
1
1
1
1
I
1 REMARKS
PROJECT NO
LOCATION
GROUND EL
DATE DATUM
SOIL DESCRIPTION
PIT DIMENSIONS (FT) LENGTH WIDTH DEPTH
ltJgt G E I 1
I Docuaent No 0C0NNCRFL13
bull GEI CONSULTANTS IMC 53 Regional Drive Concord New Hampshire 03301-8500 (603)224-7979
BARN SAMPLING FORM Serial I
PROJECT INFORMATION
Project Name Source Control Pre-Oesion Studies
I Site Name(if different) OConnor Co site
Project Number
I Analytical Lab(s) ERCO EPA
GEI GC screen Other(Specify)
I METHOD OF SAMPLING
WIPE SAMPLING OF HON-POROUS SURFACES
I U000EH UALL SAMPLING UITH DRILL BIT
OUSTSOIL SAMPLING OH FLOOR SLAB
( CONCRETE SAMPLIHG ITH MORTAR BIT
(OTHER-Explain)
I
DESCRIPTION OF SAMPLE
Brief Description of Type of Material or Item Sampled
Visible Staining NO Visible Staining
Approximate Area of Stain(if any) X
LOCATION OF SAMPLE
Ground Floor Second Floor Loft
(All Measurements in Feet to 010 Foot)
Distance Along Z Axis from Reference Origin
Distance Along M Axis from Reference Origin
Height of Sample Above Floor Slab
SKETCH IN APPROXIMATE HORIZONTAL LOCATION OF THE SAMPLE COLLECTED ON FIGURE BELOU
I UALL X
I
I
UALL U UALL Y
I
I Reference Origin UALL Z
I Approximate Scale 1 inchbull 15 feet
I Sample I0(s) SIGNATURE OF SAMPLER CERTIFIES ABOVE SAMPLING RECORD
Date Time
I Sampler(s) COC Docunent Signature Date
I
CALIBRATION LOG Document No OCONNOR FL14 Dexsil L-2000 PCB Analyzer Page 1 of 1
Instrument
Serial No
Date
Time
User
Ambient Temperature deg C
Standard used (50 ppm chloride)
Reading beforeadjustingCALIBRATE knob
Reading after adjusting CALIBRATE knob
Comments
User Signature Date
Task Manager Signature Date
Document No OCONNORFL15 I BORING LOCATION DATE START FINISH
GROUND ELEVATION (NGVO ) DRILLED BY
GROUNDWATER El DATE LOGGED BY TOTAL DEPTH (FT) PG OF
I EL DEPTH S A M P L E
Its TYPE BLOWS PEN REC R E M A R K S QO SOIL ANO ROCK DESCRIPTIONSlt_land PER aFT FT NO 6 IN IN IN lt9
I
I
I
I
I
1
1
I
1
I
I
I
I
I
I BLOWS PER (-140IBHAMMER FALUNS 30T0 DRIVE NOTES A 20 IN 00 SPLIT SPOON SAMPLER
PEN-PENETRATION LENGTH OF SAMPLER OR CORE BARREL REC-RECOVERY LENOTH OF SAMPLE ROO-LENOTM OF SOUND CORES gt4INLENSTH COREO S-SPLIT SPOON SAMPLE PROJECT
I U-UNOtSTURBCO SAMPLES UF-FIXEO PISTON _ UO-OSTER8ERO bully OROUNOWATER 0 G E I
I
I
I
I
I
I
I
I
I
1 1 1 1 1 1 1 I 1 1 I
Document VoL H SC SAP Appendix C Revision 0
Date January 17 1991 Page 1
APPENDIX C
EQUIPMENT CALIBRATION PROCEDURES
Document Vol II SC SAP Appendix C Revision 0
Date January 171991 Page 2
HNu PI-101
The HNu PI-101 is factory calibrated twice a year andor if the instrument is malfunctioning Prior to field use and at the end of each day the user of the instrument will check that the instrument is still holding calibration using the following procedures
1 Prior to the calibration check check the instrument with an Organic point source (ie magic marker) prior to use to verify that it is functioning
2 Connect the rubber sampling hose from the span gas cylinder regulator to the sampling
probe of the HNu gt
3 Fully open the regulator valve gt vy
4 Note the instrument meter response after 5 to 10 Seconds y
5 If the response deviates + 15 from the coneentration of the calibration gas (this figure appears on the cylinder label) the instruihehtTeq^es factory maintenance and will not be utilized in the field until factory calibratiori^Tah alternate meter will be used after calibration checking v (
V 6 Document the calibration information Oik the appropriate equipment calibration log
(OCONNORFL2) ~y
Document VoL IISC SAP Appendix C Revision 0
Date January 17 1991 Page 3
MIE MINIRAM Model PDM-3
The MINIRAM will be factory calibrated once a year andor if the instrument is malfunctioning Prior to field use and at the end of each day the user will zero the instrument using the following procedure
1 With the MINIRAM off insert MINIRAM into Zerobag andseal the Zerobag
2 Inflate Zerobag with filtered air containing no particulates using-attached hand pumpx- V
S
3 Press ZERO button on MINIRAM and wait 30 seconds MINIRAMshould read OFF
4 Pull MINIRAM out of Zerobag
5 Press MEAS button and wait 60 seconds for MINIRAM to go through self-tests
6 The MINIRAM is now functioning and wilJLtake-readings every 10 seconds
7 Document the calibration information onthe appropriate equipment calibration log (OCONNORFL3) V
lt
v
Document VoL II SC SAP Appendix C Revision 0
Date January 171991 Page 4
MARKSON DIGITAL MODEL 103 CONDUCTIVITY METER
The Markson Conductivity meter will be calibrated prior to and following each days field use using the following procedures
1 Rinse the conductivity probe with distilled water gt
2 Pour enough Cole-Parmer conductivity calibration solution (1413 xS 25degC) in a clean plastic Ziploc bag to be able to completely immerse the conductivity probe
3 Immerse the conductivity probe in the standard solution and shakdTree any bubbles that may cling to the cell
4 Allow about 1 minute for the cell to reach equilibrium temperature x X
5 Set the cell adjust control at the bottom of the meter to display the value of 141
6 Carefully rinse cell with water after calibration and after each use V~
7 Document the calibration process onjlie equipment calibration log (OCONNORFL4)
Document VoL H SC SAP Appendix C Revision 0
Date January 17 1991 Page 5
MARKSON MODEL 95
Combined Digital pHtemperature Meter
The Markson 95 combined digital pHtemperature meter will be calibrated prior to and following each days field use using the following procedures
1 Insert electrode into digital meter The reference pin should also be properly connected Temperature probe should be plugged all the way into the ATC jack
2 Remove protective cap and push rubber sleeve such that the potassium chloride filling hole is exposed gt
3 Rinse both pH and temperature probe in distilled water 4 Immerse both pH and temperature probe into buffer 700 solution 5 Set FUNCTION switch to TEMPERATURE to read temperature 6 Set FUNCTION switch to ATC and adjust the readout to the pH value of buffer 700 corresponding
to the temperature measured in E with the CALIBRATE control See Chart 1 7 Rinse electrode and temperature probe withdistilled water 8 Immerse both pH and temperature probe into buffer^401 9 Repeat E V ~ 10 Set the FUNCTION switch to ATC and adjust the readout to the pH value of the buffer 401
corresponding to the temperature measured in Iwith the SLOPE control See Chart 1 11 Rinse the electrodes and temperatureprobe-with distilled water Model 95 is calibrated and ready
for use 12 Document the calibration process on the equipment calibration log (OCONNORFL5)
^ CHART
Temp (C) Buffer Solution 70 X -X
Buffer Solution 40
5 y 700 401 10 708 399 15 706 399 20 703 399 25 701 399 30 700 400 35 699 401 40 698 402 50 698 403 60 697 405
Document VoL II SC SAP Appendix C Revision 0
Date January 171991 Page 6
Dexsil Model L-2009 PCB Analyzer
The Dexsil PCB Analyzer will be calibrated prior to each days field use using the following procedures
Initial Preparation
1 The electrode must be filled with Orion filling solution before it is operational Fill the electrode up to the hole in the side of the epoxy body by-placing the nozzle of the filling solution in the hole and squeezing the bottle 7
2 Drain the electrode while holding it upright over thewaste beaker Grasp the epoxy body firmly in one hand and push down on the white cap which is connected to the cord The solution will then drain out of the bottom of the electrode
Vgt 3 Refill the electrode and check to makesure that the liquid is making contact between the black
cone and the plastic shell at the bottom of theelectrode If it is not making contact at all points drain the electrode again and refill
4 Plug the electrode into the back of the L-200Qj)laeeJt in a vial or rinse solution and turn the instrument on Switch the analysis knobtdfnVand wait a few minutes until the reading stabilizes
Calibration O Imdash^
1 Fill a vial about half way with 50 parts per million calibration solution
2 Turn the analysis selectQrJcnob to CAL
3 Remove the electrode from the rinse solution dry it carefully with a tissue and place it in the calibration solution SWiri the electrode gently for a few seconds and then stop Push the start button on the instrument^
4 When the READ light comes on adjust the CAL knob so that the instrument reads 50
5 Remove the electrode from the calibration solution wipe it dry and place in the rinse solution
6 If this is the first calibration since the instrument has been turned on or since the electrode has been filled repeat steps 34 and 5
7 Document the calibration information on the appropriate equipment Calibration Log (OCONNORFL14)
Document Vol II SC SAP Appendix D Revision 0
Date January 17 1991 Page 1
APPENDIX D X
list of Acronyms
Document Vol II SC SAP Appendix D Revision 0
Date January 17 1991 Page 2
ACRONYMS
ASTM American Society for Testing and Materials CLP Contract Laboratory Program CMP Central Maine Power Company DEP Department of Environmental Protection (Maine) DQO Data Quality Objectives EPA Environmental Protection Agency [US) FL Field Log FSP Field Sampling Plan ltys GEI GEI Consultants Inc gt HSP Health and Safety Plan X
MIE Monitoring Instrumentsforthe Environment MOM Management of Migration NA Not Applicable X lt OSHA Occupational Safety anaHeakh Administration OSWER Officer of SolithWaste and Emergency Response PCB PolychlorinatecFBiphenyk ppb Parts per billion v7 ppm Parts per million QA QuaUtyAssuranck ) QAO QudU$~^sitraquoance Officer QAPP QualityAssurance Project Plan QC Qukkty Gontrof PIP -Thotoionization Detector RDRA -mdashRemedial DesignRemedial Action RI Remedial Investigation ROD x^XRecbrd of Decision RPD X^Relative Percent Difference RPM Remedial Project Manager RSD Relative Standard Deviation SAP Sampling and Analysis Plan SC Source Control SOW Statement of Work TPH Total Petroleum Hydrocarbons VOC Volatile Organic Chemical or Compound

Document Vol II SC SAP Revision 1
Date March 28 1991
44 Barn 22 441 General 22 442 Barn Analysis Program 23
443 Barn Sample Designation 241
5 SAMPLING EQUIPMENT AND PROCEDURES 25 51 Air Monitoring 25
52 Soil Sampling 25 521 General 25 522 Soil Sampling Methods for Test Pits 26 523 Soil Sampling Methods for Borings 28
53 Surface Water 30 531 General 30 532 Surface Water Sampling Methods 31
54 Sediment 32 541 General 32 542 Sediment Sampling Methods 32
55 Barn 34 551 General 34 552 Barn Sampling Methods 34
6 SAMPLE HANDLING AND ANALYSIS 38 61 General 38 62 Sample Labeling and Documentation 38 63 Chain-of-CustodySample Assignment 38 64 Sample Shipments 39
TABLES FIGURES APPENDICES
Revision 1 includes additional Page 24a as an expansion to Section 4
LIST OF TABLES
TABLE 1 - Soil Sampling Schedule TABLE 2 - Soil Analysis Program TABLE 3 - Sediment Analysis Program TABLE 4 - Surface Water Analysis Program TABLE 5 - Barn Sampling Analysis Program TABLE 6 - Soil Sampling Equipment TABLE 7 - Sediment Sampling Equipment Requirements TABLE 8 - Surface Water Sampling Equipment Requirements TABLE 9 - Barn Sampling Equipment Requirements TABLE 10 - Sample Containers and Preservation Requirements
bullv LIST OF FIGURES
gtFIGURE 1 - Site Location Map lt FIGURE 2 - Location of Transformer Work Areas and Swales FIGURE 3 - Soil Sampling Locations FIGURE 4 - Surface Water and Sediment-Sampling Locations FIGURE 5 - Example Barn Sampling Locations
lt
LIST OF APPENDICES
APPENDIX A - and Safety Plan APPENDIX B - field Logs APPENDIX C - iquipmentiCalibration APPENDIX D - ^ofAc^onyms
Document Vol II SC SAP Revision 0
Date January 17 1991 Page 1
1 INTRODUCTION
11 Purpose
This document is the Field Sampling Plan (FSP) portion of the Sampling and Analysis Plan for Source Control components of Pre-Design Studies for Remedial DesignRemedial Action at the OConnor Co Superfund Site in Augusta Maine The overall objectives of the Source Control Sampling and Analysis Plan (SC SAP)are to document objectives procedures and rationales for sampling and analytical workprovide rationale for sampling and analytical protocols and provide a mechanism for planning anchapproving Pre-design Source Control field sampling and laboratory activities
gtThe Field Sampling Plan (FSP) defines the samplinganddata-gathering methods to be used during the Source Control component of the Pre-Desigp phase This FSP has been developed in accordance with the requirements of Part Bin Attachment A to the Statement of Work for Remedial DesignRemedial ActftmTbr the OConnor Superfund Site dated July 30 1990
The Quality Assurance Project Plan (QAPP) is provided as Volume I of the Source Control Sampling and Analysis Plan ^~N ygt
)
12 Site Location and Description J N ^
The OConnor Site (Site) is located along QS Route 17 near the eastern boundary of the city limits of Augusta Maine^Eigure 1) The Site covers approximately nine acres within a larger 65-acre parcelThe SiteXis currently surrounded by a chain link fence and is abutted by woodlands toHh^north) and west US Route 17 to the south and the west branch of Riggs Brook and itassociated wetlands to the east
The Site is situated on the crest of a low ridge which is aligned parallel to Riggs Brook Principal features on the property include a large barn that formerly housed scrap operations an Upland Marsh an adjacent low area of fill two surface water impoundments (lagoons) three former outdoor transformer work areas (TWAs) and a former scrap area (Figure 2) Site drainage is principally controlled by the slope extending downward toward Riggs Brook and man-made drainage features connecting the Upland Marsh on the top of the ridge to Riggs Brook
Access into the Site is via an unimproved gravel road from US Route 17 that passes through a wooden fence near the on-site barn and follows the ridge line of the property to die northeast for approximately one-quarter mile to the wooded area of the Site Three
Document Vol II SC SAP Revision 0
Date January 17 1991 Page 2
separate and distinct transformer disassembly areas are situated along the access road and are identified by oil-stained soils metal wire and porcelain fragments The three areas are identified as transformer work areas (TWAs) I n and HI A former scrap-yard (Scrap Area on Figure 2) is located within the wooded area beyond TWA in Empty tanks white goods automobile bodies tires sheet metal and other items were stored or discarded in this Scrap Area
gtThe barn consists of a three-story wooden structure with a plan area of approximately 3100
square feet The barn has a concrete floor slab and contains ^large-variety of items These
items consist chiefly of the following furniture metal racksand doors lumber electric
meters automobile parts a wood stove heating registers an antiqueautomobile a boat
and a large amount of miscellaneous metal scrap debris gt v
13 Site History lt ltvy
lt
The Site was primarily used as grazing land until the l950sgtrhen the F OConnor Co started a salvage and transformer recyclingbusiness ThV salvage processes included stripping and recycling transformers that contaibedpblyehlorinated biphenyl (PCB)-laden oils As a result Of the uncontrolled releases ofPCB afthe Site the Site was placed on the National Priorities List (NPL) On March 231985 United States Environmental Protection Agency (EPA) and Maine DepartmenTof Environmental Protection (DEP) issued an Administrative Order to the OCohndPs and Central Maine Power Company (CMP) (Docket No 1-86-1031) identifying eachas-aPotentially Responsible Party (PRP) to (1) remove known threats to the public health or welfare which exist on-site (tanks of oil) (2) secure the areas of the Site thaLhave known contaminated soils (3) conduct a Remedial Investigation (RI) and (4jyjrepare a Feasibility Study (FS) In response to the Administrative Order CMPberformed the following interim remedial actions
bull Construction of a chai compassing TWA I and TWA II (approximately 75 acres) and the majority of the^sit^-related chemicals (1985)
bull Sampling cleaning and removal of 20 on-site storage tanks (1986)
bull Removal of over 500 tons of material from the scrap area and sampling of soils beneath the scrap (1987)
bull Extension of the chain link fence to secure TWA HI and part of the TWA II drainage swale
Currently two lagoons located on the slope leading down to Riggs Brook serve as detention basins for surface water flow from the Upland Marsh The portion of the Site currently
Document Vol II SC SAP Revision 0
Date January 17 1991 Page 3
fenced includes TWA I n and III part of the scrap area and all areas in which residual PCBs are present in soils The RI and FS were conducted by CMP and their consultant EC Jordan Co The objectives of the RIFS were to provide the necessary information to 1) identify and assess the existing and potential public health andor environmental risks which may be caused by the release or threatened release of hazardous substances pollutants or contaminants and (2) formulate and evaluate alternative recommendations for the remedial actions needed if any to prevent or mitigate the migration release or threatened release of hazardous substances
14 Soil Surface Water Sediment and On-Site Barnc Contamination and Remedy Description )
141 Soil s lt w
During the RI approximately 500 surface and Subsurface soil samples were collected by grab sampling shallow borings or test pits PCBs and lead were the principal contaminants found in the surface pTno^05-feet deep) soils and PCBs and carcinogenic polycyclic aromatic hydrocarbons-^(cPAHs) were the principal contaminants detected in the subsurface (05lO12-feet deep) soils
The highest concentrations of PpB^contaminated soils were found primarily within the former transformer work areas (TWAS)r-and the drainage areas associated with these TWAs (Figure 2) Contaminatedsoikinthe TWAs were found to contain up to 200000 parts per million (ppm^PCBs However the most contaminated soils (greater than 500 ppm) constitutelless than 125 of the total estimated volume of soil contamination (23500-trubic yards) and most of the contaminated soil contains PCBs at concentrations le^sthan 50 ^pm Lead was detected above background (ie approximately 70 ppm^average) principally in the surface soils within TWAs I and II with the maximum leachc^neentfation occurring at 4100 ppm within TWA II
Subsurface soil samples taken from TWAs I and II and the low area hear the Upland Marsh contained cPAHs The low area is an area where sediment dredged from the Upper Lagoon in 1977 was deposited adjacent to the area currently containing the Upland Marsh Disposal of this sediment resulted in blockage of natural drainage and formation of the Upland Marsh The depth of vertical migration of the cPAHs appeared to be limited to the upper 6-feet within TWA I and the low area while a small pocket of cPAHs was found to exceed 8 feet within TWA II The maximum cPAH concentration of 30 ppm was found within the low area Depth of PCB contamination in the subsurface soils outside of the TWAs was typically limited to less than 2 feet while PCBs were detected within TWAs I and II at depths of up to 12 feet
Document Vol II SC SAP Revision 0
Date January 17 1991 Page 4
Cleanup standards for soil were determined based on a public Health Environmental Risk Assessment performed by the EPA Cleanup standards are summarized below compared to maximum concentrations of chemicals encountered at the site
Maximum Concentration Soil Cleanup Chemicals Detected Standards
(ppm) (ppm)
Lead 4100 248 x
cPAHs 30 dX X PCBs 200000 1 gt bull
bullX
The RODspecifies that approximately23500 cubicyardsjof contaminated soils contain PCBs cPAHs and lead above the established Cleanup standards are to be treated on site using a solvent extraction technology This technology principally involves the use of a solvent to extract the PCBs and cPAHs from the contaminated soils The contaminated liquids containing the extracted PCBs and cPAHs will be destroyed at a licensed off-site TSCA incinerator AddkionaHyr-soil treatment residues resulting from the solvent extraction process that haveJlacNevels above the 248 ppm cleanup standard will undergo further treatment using n solidificationstabilization treatment technology Those solid treatmentNresidues jesulting from the solvent extraction process that do not achieve the cleahup-standards and that have undergone additional treatment through solidificationstabilization will be transported off-site to a licensed landfill It is currently estimated by the EPA that 5000 cubic yards of the total 23500 cubic yards of contaminated soils undergoing solvent extraction will require off-site disposal
142 Surface Wateiv
The on-site surface waterNirainage features include an Upland Marsh an Upper Lagoon and a Lower Lagoon (see Figure 2) The Upland Marsh drains to the Upper Lagoon via a subsurface drainage pipe The Upper Lagoon drains to the Lower Lagoon via a drainage swale The water that flows out of the Lower Lagoon follows a drainage swale to Riggs Brook
In 1976 under the advice of Maine DEP the two lagoons were constructed in an attempt to control oil migration The Upper Lagoon was constructed with a concrete retaining wall and an inverted siphon to prevent migration of oils floating on the lagoon surface Floating oils were collected and contained in six large on-site storage tanks The lower lagoon was excavated at the base of the slope and constructed with an earthen berm and a horizontal pipe discharge
Document Vol n SC SAP Revision 0
Date January 17 1991 Page 5
In 1977 under the direction of the Maine DEP the use of the lagoons was discontinued The water from the Upper Lagoon was placed in storage tanks and the sediments were excavated and placed in the low area shown on Figure 2 The sediments placed in the low1- area were underlain by a 1-foot-thick layer of marine clay and then covered with a clayey soil less than 6 inches thick The filling of the low area created a barrier to the previous natural surface water drainage and resulted in the formation of the Upland Marsh In an attemptto drain the marsh the subsurface drainage pipe was installed between the marsh and the Upper Lagoon in September 1978 The saturated area of the Upland Marsh presently still exists
On-site surface water quality was measured at five sampling locations These include one surface water sample from each of the lagoons and one from the Upland Marsh The surface water quality data in the RI indicated that PCBs (from unfiltered samples) were detectable in the Upper and Lower Lagponsyand in drainage from the Lower Lagoon but were not detected in surfacewater samples taken from Riggs Brook PCB concentrations in the on-site surface waters for the EowersLagoon the Upper Lagoon and Upland Marsh were 055 ppb 16 ppb^jand non-detected respectively Other contaminants of concern in the on-site urfkceTwaters were the inorganic chemicals lead and aluminum Lead was found at concentrations ranging from 36 to 13 ppb in all the on-site surface waters Additionally aluminum was detected in the on-site surface waters at concentrationsrangfog from 236 to 3740 ppb
O V Cleanup standards for surface water were determined based upon a Public Health
Environmental Risk Assessment performed by the EPA Cleanup standards are
summarized below compared to themaximum concentration of chemicals encountered
at the site N v
Surface Water Maximum Concentration Cleanup
Chemicals xD6tected Standards (PPb) (ppb)
Lead 13 194 Aluminum 3740 87
PCBs 16 0065
The selected remedy for surface water remediation at the site is pumping of surface water from the Upper and Lower Lagoons and Upland Marsh and disposal off-site unless otherwise approved by EPA The ROD indicates that the approximately 150000 to 195000 gallons of surface water are contained in the Upland Marsh and Upper and Lower Lagoons
Document Vol II SC SAP Revision 0
Date January 17 1991 Page 6
143 Sediment
The sediment sampling program conducted during the RI consisted of a total of 23 sediment samples from 19 locations both at on-site and off-site locations A total of six sediment samples were collected from the Upland Marsh Upper Lagoon and Lower Lagoon consisting of two samples from each of these surface water bodies Other samples were collected from Riggs Brook and drainage swales between the lagoons and Riggs Brook
xPCBs were detected in the sediment samples obtained from thexdge of the Upland Marsh both on-site lagoons and the Lower Lagoon drainage area leading into Riggs Brook PCB concentrations were highest in the Upper Lagoon (up to 1100 ppm) but decreased significantly downstream in the Lower iiigoon PCB concentrations were lowest in the drainage swale downstream fronii dieLower Lagoon (approximately 4 ppm) Cleanup standards for the sedimentswere~detennined based on a Public Health Environmental Risk Assessment performed by the ERA Cleanup standards are summarized below compared to maximiimgtCQncentrations of chemicals encountered in sediment samples from the Upland MSrsh Upper Lagoon and Lower Lagoon
Vmdash ( Sediment
MaximumConcentration gt Cleanup Chemicals Detected-^ v Standards
( (PPF1) -mdash (PPm)
Lead 28 248 cPAHs y 1 PCBs 1100 1
The ROD indicates that the cm-site sediments will be dredged and the sediment containing chemicals above^tbe established cleanup standards will be treated using the solvent extraction technology as described in Section 141
144 On-Site Barn Characteristics
The barn has been reported to formerly house scrap operations A surficial soil sample taken from within the barn (JSS1) during the RI was collected and analyzed for the presence of PCBs and lead The exact nature or matrix of the surficial soil (eg dust concrete wood) collected from within the barn could not be ascertained from the available documents The results of the PCB screening indicated a concentration of 96 ppm PCBs Lead was detected at a concentration of 1610 ppm No analysis for cPAHs was performed on the sample from the barn
Document Vol II SC SAP Revision 0
Date January 17 1991 Page 7
In the ROD EPA set soil cleanup standards for the site of 1ppm PCBs 1ppm cPAHs and 248 ppm lead The cleanup standards for barn materials were not specified in the ROD by EPA However the ROD specified that the barn would undergo decontamination procedure if contamination was present above cleanup standards (to be determined) through collection of soil dust and other loose material and these materials would be combined with the other contaminated soils and sediments for on-site solvent extraction treatment Large scrap items in the barn would then be removed for disposal off-site and the barn structure would be sampled for detection of the presence of contamination Following sampling and analysis of the barn structure the barn would be demolished and transported to an off-site facility for appropriate disposal ^gt
N
Document Vol II SC SAP Revision 0
Date January 17 1991 Page 8
2 SAMPLING AND DATA QUALITY OBJECTIVES
21 General
Sampling of soils surface water sediments and the on-site barn and its contents will be performed during the Source Control (SC) component of the Pre-Design Study Pre-Design SC sampling results will be used in the design of the SourceControl component of the remedy and development of the treatability testing program for soil and sediment
Pre-Design SC sampling will include N
Collection of surface water samples from the Upland Marsh and Upper and Lower Lagoons in April 1991 V
x
Collection of sediment samples from the Upland Marslkahd Upper and Lower Lagoons in April 1991 ^
Collection of soil samples from test pits and^Orihgsrin April 1991
bull Collection of samples of soil woodimckconcrete from the on-site barn floor and Walls and wipe samples from debris andlquipment located within the barn in May 1991
V-X7EPAs guidance document Data Quality Objectives for Remedial Response Activities (OSWER Directive 93550-78Jdarch 1987) identifies four analytical levels
Level I - field screeningoranalysis using portable instruments Results are often not compound specific and o^ qualitative in nature
Level II - field analyses using mbresophisticated portable analytical instruments Results are more reliable in terms of compound identification and may be semi-quantitative
Level El - laboratory analyses by established referenced methods Results are quantitative and compound specific
Level TV - EPA Contract Laboratory Program (CLP) services utilizing rigorous QAQC protocols and documentation
Level V - Laboratory analyses by non-standard methods Identified in the CLP asspecial analytical services
Document Vol II SC SAP Revision 1
Date March 28 1991 Page 9
A combination of Level I Level in and Level IV analytical protocols will be specified during Pre-Design SC sampling EPA Contract Laboratory Program (CLP) protocols prescribed in the 1988 Organic and Inorganic Statement of Works will be utilized for laboratory analysis of target compounds (PCBs cPAHs lead and aluminum) in surface water sediment soil and barn samples The analytical protocols that will be utilized for Pre-Design SC sampling are detailed in the SC Quality Assurance Project Plan (QAPP) included as Volume I of the SC SAP
22 Soils
Soil samples will be collected and analyzed to provide additional data for comparison with cleanup standards for design of the Source Control program at the OConnor Site Data will be used to refine the previously estimated volume of soils contaminated at various concentrations above the cleanup standards and to provide additional information at areas with apparent data gaps on the lateral and vertical extent of soil with PCB concentrations greater than 1 ppm Soil also will be collected at specified locations to provide samples for solvent extraction treatability bench-scale testing Samples selected for treatability testing will contain PCBs at concentrations previously not examined during limited bench-scale testing performed during the Feasibility Study (FS) The effectiveness of solvent extraction on removal of lead cPAH and PCB contamination will be examined during the bench-scale treatability studies performed during Pre-Design
The soil sampling program performed during the RI was designed to estimate the horizontal and vertical distribution of soils contaminated with PCBs lead and cPAHs above the cleanup standards The distribution of PCBs lead and cPAHs are summarized in the RI on Figures 4-8 4-10 and 1-10 respectively GEI identified several inconsistencies in the distribution of contaminated soils within the summary figures For instance the distributions of PCB contamination shown on Figures 1-6 and 4-8 in the RI in the northern portion of the site near TWA III do not agree Also previous soil sampling did not consistently confirm the horizontal and vertical limits of PCB contamination The vertical limits of the PCB contaminationwere not adequately identified for remedial design purposes near transformer work areas and along drainage pathways where PCB migration has occurred
The effectiveness of solvent extraction as the selected remedy for treating the on-site soils was not fully demonstrated during the FS The bench-scale testing that was performed during the FS did not investigate the full range of contamination levels and recovery efficiencies from different soil types that exist on the site
There are three primary objectives for collection of soil quality data during the Pre-Design studies
Document Vol II SG SAP Revision 1
Date March 28 1991 Page 10
1 Collect additional data with close control of analytical precision to evaluate datagaps and inconsistencies reported during the RI The collection of these data will primarily be performed near TWAs and drainage pathways
2 Refine the previously estimated volume of soils contaminated at various concentrations above the cleanup standards
3 Evaluate theselected remedy of solvent extraction through bench-scale testingof soils with specific ranges of PCB concentrations
All soil samples collected for treatability bench-scale testing will also have an aliquot collected for PCB analyses by Ceimic Corporation of Narragansett Rhode Island This will provide added confidence that designated samples are within the specified ranges of PCB concentrations for solvent extraction bench-scale testing
In order to facilitate comparison of Pre-Design Study soil quality with RI study soil quality rigorous QAQC protocols and documentation will be needed All sampleswill be analyzed by Ceimic Corporation using 1988 CLP protocols Analytical Level IV (CLP QAQC and documentation) will be utilized on 20 percent of the soil samples collected The remaining 80 percent will be analyzed according to 1988 CLP protocols utilizing Analytical Level III (CLP QAQC butwithout CLPdocumentation) These serviceswill provide detection limits at or below the ROD Cleanup Standards
During Pre-Design sampling equipment blanks will be collected and analyzed after decontamination of sampling equipment to identify artifact contamination that could result from incomplete decontamination of equipment Trip blanks will also be included during sample shipment to identify cross-contamination during transportation to Ceimic Corporation The laboratory and field QAQC procedures described above will enable the precision required to satisfy the objectives of the soil sampling component of this study
23 Sediments
Sediment samples will be collected and analyzed to provide additional data for comparison with the cleanup standards for design of the Source Control program at the OConnor site Data will be used to supplement the sediment quality data previously collected in the RI for a refined estimate of the levels of lead cPAH and PCB contamination in the sediments of the Upland Marsh Upper Lagoon and Lower Lagoon In addition a composite sediment sample from the Upper Lagoon and a composite sediment sample from the Lower Lagoon will be collected for solvent extraction treatability bench-scale testing Treatability testing on contaminated sediments was not performed during the FS The effectiveness of solvent extraction on removal of lead cPAHs and PCBs from sediments will be examined during the bench-scale treatability studies performed during Pre-Design
Document Vol II SC SAP Revision 1
Date March 28 1991 Page 11
The sediment quality data collected during the RI was limited Only two sediment samples were collected from the Upland Marsh Upper Lagoon and Lower Lagoon In addition limited data have been previously collected regarding the volume of contaminated sediment on-site
There are three primary objectives for sediment quality data to be collected during Pre-Design studies
1 Collect additional data with close control of analytical precision to examine levels of contamination in sediment at locations previously not investigated This will include two additional samples from the Upper Lagoon two additional samples from the Lower Lagoon and six additionalsamples from the Upland Marsh The investigation in the Upland Marsh will be directed towards delineating the extent of contamination in the westerly (upstream) direction
2 Refine the previously estimated volume of sediment in the Upland Marsh Upper Lagoon and Lower Lagoon
3 Evaluate the solvent extraction remedy effectiveness on treatment of sediment through bench-scale testing
In order to facilitate comparison of Pre-Design Study sediment quality with RI study sediment quality rigorous QAQC protocols and documentation will be needed Only sediment samples containing greater than 30 percent solids (based on visual observations) will be submitted for analysis After sample collection in the field percent volume of settled sediment in the sample container will be compared to the percent volume of free water Samples will be submitted to the laboratory for analysis if the volume of settled sediment in the sample container exceeds 50 percent of the total volume of the sample All samples will be analyzed by Ceimic Corporation of Narragansett Rhode Island following 1988 CLP protocols Analytical Level IV (CLP QAQC and documentation) will be performed by Ceimic on 20 percent of the sediment samples collected The remaining 80 percent will be analyzed by Ceimic utilizing Analytical Level in (CLP QAQC but without CLP documentation) These services will provide the detection limits at or below the ROD Cleanup Standards
During Pre-Design sampling equipment blanks will be collected and analyzed after decontamination of sampling equipment to identify artifact contamination that could result from incomplete decontamination of equipment Trip blanks will also be included during sample shipment to identify cross-contamination during transportation to Ceimic
The laboratory and field QAQC procedures described above will enable the precision required to satisfy the objectives of the sediment sampling component of this study
Document Vol II SC SAP Revision 1
Date March 28 1991 Page 12
24 Surface Water
The OConnor SiteStatement of Work for Remedial DesignRemedial Action requires that surface water contained within the Upper and Lower Lagoon and in the Upland Marsh be drained collected and transported off-sitefor treatment unlessotherwise instructed by EPA
The three primary objectives for surface water data to be collected during the Pre-Design Studies are to
1 Probe surface water depths in Lagoons and Upland Marsh to obtain a better estimate of surface Water volumes to be handled during remediation
2 Evaluate changes in surface water quality that may have occurred during the approximately three-year period since sampling during the RI and evaluate extent of surface water contamination in the Upland Marsh which is at the upstream edge of the PGB contamination area
3 Collect additional data to design an appropriate program for surface water diversion pumping treatment and disposal Off-site disposal destinations as well as on-site treatment and disposal options will be examined in more detail during the Pre-Design Study
All surface water samples will be submitted to Ceimic Corporation for analysis of PCBs aluminum and lead All of these samples will be analyzed following 1988 CLP protocols including CLP QAQC and CLP documentation (Analytical Level IV) One additional sample will be collected from each surface water body and submitted to Ceimic for Total Suspended Solids Analysis (EPA Method 1602) utilizing Analytical Level III
2JS Barn
The available data for the extent of contamination of barn materials consists of one sample point The surficial soil sample collected was not described such that it is known whether the sample consisted of dust the concrete slab soil within cracks of the slab or debris samples within the barn The elevated levels of PCBs and lead within the sample may not be representative of the majority of the loose materials within the barn Furthermore no wipe sampling on non-porous debris or sampling of the wooden barn structure was performed during the RI
Document Vol II SC SAP Revision 0
Date January 17 1991 Page 13
Cleanup standards for target chemicals listed in the ROD have not yet been established by EPA for barn materials The ROD indicates that the Toxic Substance Control Act (TSCA) Spill Cleanup Policy and Disposal Regulations (40 CFR Part 761) may be used in lieu of site-specific determination of acceptable levels
Samples of selected media within the barn will be collected and analyzed to provide an initial data set to establish the degree of contamination present within the barn Data will be used in developing the work plan for decontamination and demolition of the barn and to determine appropriate disposal sites for barn demolition debriSNand loose debris within the barn Depending on data results an evaluation will be made tbvdetermine whether additional sampling will be required prior to demolition to betterseqnence demolition activities so that PCB-contaminated material can beSeparated from non-contaminated building materials and debris
ltx All soil wood and concrete barnsamples will besubmitted to Ceimic Corporation (Ceimic) of Narragansett Rhode Island for analysis of PCBs cPAHsgtand lead Wipe samples of debris will be submitted to Ceimic for analySis-ofPCBs All samples will be analyzed following CLP protocols Analytical LeveK IV-requiring CLP QAQC and reporting requirements will be utilized for 20 percent of the5amples Analytical Level in utilizing CLP analytical protocols but without the documentation requirements of CLP will be specified for the remainder of the
Document Vol II SC SAP Revision 0
Date January 17 1991 Page 14
3 HEALTH AND SAFETY
A Health and Safety Plan for the Source Control Field Sampling Plan is presented in Appendix A All personnel involved in the sampling program have been trained in accordance with the requirements of the Occupational Safety and Health Administration Regulation OSHA 1910120 Hazardous Operations and Emergency Response and are enrolled in a comprehensive medical monitoring program
A list of personnel authorized to perform work on this project ^and listing of their participation in personnel training and health monitoring programs^arepresented in the Health and Safety Plan gt
Document Vol II SC SAP Revision 1
Date March 28 1991 Page 15
4 SAMPLING LOCATION AND FREQUENCY
41 Soils
411 General
In general the soil sampling program includes collection of the following two basic categories of samples
1 Soil samples collected from test pits for possible bench-scale testing and
2 Soil samples collected from test pits and borings to fill data gaps on the lateral and vertical extent of soil contamination above cleanup standards and to refine estimates of the quantity of contaminated soils
Figure 3 shows the locations of test pits and borings planned for this investigation These locations were based on the depth delineation of 1 ppm for Total PCBs presented in the Remedial Investigation Table 1provides ageneral sampling rationale including test pit and boring identification numbers target sampling depth and elevation anticipated PCB concentration level and soil type A summary of the analyses to be performed on soil samples including replicates and blanks is shown in Table 2
A total of 12 soil samples for possible bench-scale testing will be collected from test pits during April 1991 Two samples of each soil type indicated below will be collected within the specified ranges of PCB concentrations Each sample will have a minimum volume of about 05 cubic feet (about 60 lb weight) to provide sufficient soil for bench-scale testing
PCB Concentration Range fppml Soil Types
1 to 10 Clay and Fill 10 to 20 Clay 20 to 50 Clay 50 to 500 Clay and FiU
During the RI three soil samples were collected for bench-scale treatability testing with initial PCB concentrations of 1000 4000 and 22000 ppm However sample locations had been selected to obtain samples with PCB concentrations in the range of 250 to 700 ppm based on PCB concentration contours developed during the RI
Document Vol II SC SAP Revision 1
Date March 28 1991 Page 16
Therefore PCB concentration contours developed from the RI data do not precisely indicate the extent and level of contamination
In order to gain a higher degree of confidence that samples within each specific PCB concentration range have been collected GEI will perform field PCB screening with a Dexsil L-2000 PCB analyzer to estimate the soil PCB concentration range prior to collecting the soilsample Aliquots of the 12 bench-scale soilsamples will be collected for confirmatory testing for PCB concentrations by Ceimic of Narragansett Rhode Island utilizing 1988 CLP protocols
GEI will select the soil samples for bench-scale testing after receiving the CLP laboratory results of the PCB concentrations If the laboratory data do not indicate that at least one of the two soil samples was collected from the targeted concentration ranges and soil types an additional contingency round of soil sampling may occur Sampling locations for this contingency sampling round will be selected based Upon the PCB data summarized in the RI and the data collected by GEI during the previous SC sampling round
A total of 40 soil samples (including replicates) will be collected from test pits and borings during April 1991 to fill data gaps on the extent and quantity of contaminated soil The soil sampleswill be collected at the approximate elevation specified for each sampling location as indicated in Table 1 Sample elevations of the bench-scale samples may vary if PCB concentrations in samples screened with the Dexsil L-2000 PCB analyzer are not within the ranges indicated below
Acceptable Screening Target PCB Concentrations Range PCB Concentration Range
(ppm) (ppm)
1 to 10 1 to 10 10 to 20 10 to 20 20 to 50 25 to 45
50 to 500 200 to 350
The soil samples will be analyzed for PCBs ePAHs and lead by Ceimic of Narragansett Rhode Island utilizing CLP protocols Four soil samples (including two selected for bench-scale treatability testing) will also be analyzed for total organic carbon (TOC) cation exchange capacity (CEC) and pH
Document Vol II SC SAP Revision 1
Date March 28 1991 Page 17
Detailed descriptions of the soil sampling and decontamination methods are provided in Section 5 Appendix A and the QAPP Contractors will be used for surveying performance of test pits and drilling of borings All contractors will be required to document that they have completed health and safety training that complies with OSHA Standard 1910120 In generalstakes marking the planned locationsof test pits will be surveyed by a registered surveyor prior to test pit excavation The Stakes will serve as temporary bench marks for reference during location of test pit samples A rubber-tired type backhoe will be used to excavate test pits for planned sampling locations less than or equal to5 feet below ground surface The backhoe and operator will be supplied by HE Sargent Inc of Lewiston Maine capable of operating at hazardous waste sites under Level C personnel protection Soil samples will be collected from in-situ test pit excavations by GEI personnel using a stainless steel shovel or trowel
Due to anticipated shallow ground water conditions a drill rig will be used to advance test borings for soil sampling at locations where the target sampling location is greater than 5 feet below ground surface The soil samples will be collected using a split-spoon sampler Drilling and sampling will be performed by Northeast Diamond Drilling Company of Union Maine capable of working on hazardouswaste sites under Level C personnel protection
412 Soil Analysis Program
Analytical procedures are identified in the Quality Assurance Project Plan (QAPP) The samples will be analyzed using 1988 CLP methods for PCB cPAHs and lead by Ceimic of Narragansett Rhode Island EPA methods 9045 9060 and 9080 will be used to analyze soils for pH TOC and CEC respectively A summary of the analyses to be performed on soil samples including replicates and blanks is shown in Table 2 Samples will be collected in I-Chem glassware or equivalent and stored at 4 deg C as described in Section 6
A series of quality control blanks (replicates and blanks) will be collected by GEI and analyzed by the laboratory to aid in data assessment as discussed in the Quality Assurance Project Plan (QAPP) All quality control samples will be labelled with false sample identification as shown in Table 2 in order to avoid laboratory bias
Sampling equipment blanks and aqueous trip blanks will be submitted for every ten soil samples during the sampling program to check for the presence of cross-contamination These will provide a quality control check for decontamination and handling practices The trip blanks will contain laboratory-supplied organic-free water and will accompany the shipment of soil samples during storage and shipment The trip blanks will be analyzed for PCBs (sample identification will be TP26-TP29) Wipe
Document Vol II SC SAP Revision 1
Date March 28 1991 Page 18
samples will be collected from the shovel or hand trowel and split-spoon sampler (sample identification numbers TP30-TP33 and TP34-TP37 respectively) after decontamination and will be analyzed for PCBs Wipe sampling procedures are described as part of barn sampling procedures in Section 562 One replicate sample will be collected for every ten soil samples Replicate sample locations and identification numbers are indicated on Table 2
413 Soil Sample Designation
Each piece of soil sample glassware will be affixed with a self-sticking adhesive label Each label will be completed with an indelible marker to contain the following information
GEI Consultants Inc Site Name Project Number Sampling Date and Time Sample Number Samplers Initials Analysis Requested
The sample number is composed of a series of information to identify the sample as unique to the sampling point and sampling event The sample number labelled in the field and referred to on all associated documents is composed of the following
Matrix Project Sampling Location Sample Number
Soil - 90393 -TP2-SS1
The example sample number above indicates that soil sample SSI was collected from Test Pit No 2 under project number 90393
4JZ Sediment
431 General
Sediment samples will be collected by GEI from the Upland Marsh the Upper Lagoon and the Lower Lagoon during April 1991 A summary of the laboratory analyses of sediment samples is listed on Table 3 Procedures for sampling and equipment decontamination are provided in Section 5 Appendix A and the QAPP
Document Vol II SC SAP Revision 1
Date March 28 1991 Page 19
In general the sediment sampling program includes collection of the following two basic categories of samples
1 Two composite sediment samples collected using a clam-shell sampler for bench-scale testing
2 Eleven sediment samples (including one replicate) collected with a tube sediment sampler to provide additional data on sediment quality and for estimating the quantity of contaminated sediments
The two composite sediment samples collected using a clam-shell type sampler for bench-scale testing will be collected within the Upper Lagoon and Lower Lagoon at the locations shown on Figure 4 Based on the data in the RI the Upper Lagoon contained the higher sediment concentrations of PCBs
The eleven sediment samples collected to provide additional data on sediment quality and for estimating the quantity of sediments will be collected at the locations shown on Figure 4 As shown on the figure six sediment sampling locations were chosen for the Upland Marsh two locations were chosen for the Upper Lagoon and two locations for the Lower Lagoon
Detailed descriptions of the methods and equipment to be used during the sampling program are provided in Section 5 In general a temporary reference bench mark will be surveyed and staked adjacent to each surface water body by a surveyor licensed in the State of Maine and OSHA-approved for working on a hazardous waste site The actual sediment sampling locations will be measured by tape and compass bearings from the reference bench mark prior to sampling For the bench-scale sample a 5shygallon sample container will be filled with sediment from the dredge type sample The samples for providing additional data on sediment PCB concentrations will be collected with a tubesediment sampler pushed into the complete thickness of sediment at the sampling location All sampling equipment will be decontaminated using methanol and distilled water rinses before each use
4SL2 Sediment Analysis Program
Analytical procedures are identified in the Quality Assurance Project Plan (QAPP) Sediment samples will be submitted to Ceimic of Narragansett Rhode Island for laboratory analysis utilizing CLP protocols The samples collected for bench-scale testing will be analyzed for PCBs The remainder of the sediment samples will be analyzed for PCBs cPAHs and lead One sediment sample will also be analyzed for total organic carbon (TOC) cation exchange capacity (CEC) and pH by EPA methods 9060 9080 and 9045 respectively A summary of analyses to be performed on
Document Vol II SC SAP Revision 1
Date March 28 1991 Page 20
sediment samples including replicates and blanks is shown in Table 3 Samples will be collected in I-Chem glassware or equivalent and stored at 4degC as described in Section 6
A series of quality control samples (replicates and blanks) Will be collected by GEI and analyzed by the laboratory to aid in data assessment as discussed in the Quality Assurance Project Plan (QAPP) All qualitycontrol samples will be labelled withfalse sample identification as shown in Table 3 in order to avoid laboratory bias
Two sampling equipment blanks and one aqueous trip blank will be submitted during the sampling program to check for the presence of cross-contamination These will provide a quality control check for decontamination and sample handling practices The trip blank containing laboratory-supplied organic free water will accompany the shipment of sediment samples and will be analyzed for PCBs (Sample ID SED7) Wipe samples will be collected from the tube sediment sampler and dredge sampler after decontamination and will be analyzed for PCBs (sample identification numbers SED9 and SED8 respectively) Wipe sampling procedures are described as part of barn sampling procedures in Section 562 One replicate sample will be collected during sediment sampling Replicate sample location and identification is indicated on Table 3
423 Sediment Sample Designation
Each piece of sediment sample glassware will be affixed with a self-sticking adhesive label Each label will be completed with an indelible marker to contain the following information
GEI Consultants Inc Site Name Project Number Sampling Date and Time Sample Number Samplers Initials Analysis Requested
The sample number is composed of a series of information to identify the sample as unique to the sampling point and sampling event The sample number labelled in the field and referred to on all associated documents is composed of the following
Matrix Project Surface Water Body Sample Location
SED - 90393 - UM - SED1
Document Vol II SC SAP Revision 1
Date March 28 1991 Page 21
The example sample was obtained from sample location SED1 in the Upland Marsh under project number 90393 The surface water body designations for the Upper Lagoon and the Lower Lagoon will be UL and LL respectively
43 Surface Water
431 General
Surface water quality data consisting of two samples each from the Upland Marsh Upper Lagoon and the Lower Lagoon will be collected by GEI in April 1991 Sampling locations are shown on Figure 4 Surface water sampling locations will be determined in the field by tape and compass bearings from the temporary reference bench mark established for sediment sampling A summary of the analyses to be performed on surface water samples including duplicates and blanks is shown on Table 4 Detailed descriptions of the sampling methods to be used during surface water sampling are provided in Section 5 In general the depth of the water at the sampling location will be measured at each sampling location with a weighted tape measure prior to collecting the surface water sample A water sample will be collected after lowering a stainless steel Kemmerer sampling device one-half the total depth of the water column All sampling equipment will be decontaminated using methanol and distilled water rinses before each sampling event
433 Surface Water Analysis Program
Analytical procedures are identified in the Quality Assurance Project Plan (QAPP) All of the surface water samples will be analyzed using 1988 CLP methods for PCBs aluminum and lead One sample from each surface water body will also be Submitted for Total Suspended Solids Analysis (EPA Method 1602) A summary of the analyses to be performed on surface water samples including duplicates and blanks is shown on Table 4 Surface water samples will be submitted to Ceimic Corporation for laboratory analysis Samples will be collected in I-Chem glassware or equivalent and stored at 40 C as described in Section 6
A series of quality control samples (duplicates and blanks) will be collected by GEI and analyzed by the laboratory to aid in data assessment as discussed in the Quality Assurance Project Plan (QAPP) All quality control samples will be labelled with false sample identification as shown in Table 4 and described below in order to avoid laboratory bias
One sampling equipment blank and a trip blank will be submitted during each sampling round to Check for the presence of cross-contamination These will provide a quality control check for decontamination and handling practices One trip blank
Document Vol II SC SAP Revision 1
Date March 28 1991 Page 22
sample consisting of laboratory-supplied organic-free and de-ionized water will accompany the samples during storage and shipment and will be analyzed for PCBs aluminum and lead (sample identificationwill be SW4) A samplingequipment blank will be collected by pouring laboratory-supplied organic-free and de-ionized water through the Kemmerer sampler at the end of the sampling program The sampling equipment blank will then be analyzed for PCBs aluminum and lead (sample identification will be SW5)
One surface water duplicate will also be collected each sampling round Duplicate sample location and identification is indicated on Table 4
433 Surface Water Sample Designation
Each piece of sample glassware will be affixed With a self-sticking adhesive label Each label will be completed with an indelible marker to contain the following information
GEI Consultants Inc Site Name Project Number Sampling Date and Time Samplers Initials Analyses Requested
The sample number is composed of a series of information to identify the sample as unique to the sampling point and sampling event The sample number labelled in the field and referred to on all associated documents is composed of the following
Matrix Project Surface Water Body Sampling Location
SW - 90393 - UM - SW1
The example sample number above indicates thata surface water sample was obtained from the Upland Marsh at location SW1 under Project Number 90393 The surface water body designations for the Upper Lagoon and the Lower Lagoon will be UL and LL respectively
Document Vol II SC SAP Revision 1
Date March 28 1991 Page 23
44 Barn
441 General
A total of approximately 30 samples of various media within the barn will be collected by GEI during May 1991 The types of media collected will generally consist of wood fragments from barn walls dust concrete and wipes on non-porous debris within the barn The exact sample locations will be primarily determined in the field based on observations during sampling (eg staining on soils concrete or wood) Based on a site visit by GEI on December 19 1990 preliminary sample locations for barn materials were chosen as shown in Figure 5 These preliminary locations will enable representative sampling of general debris and staining in the barn and indicates the general sampling strategy which will be employed during Pre-Design Final sampling locations may be modified during the program based on closer observation of equipment barn materials and evidence of staining
Detailed descriptions of the methods to be used during the barn sampling program are provided in Section 5 In general a survey of the general types of materials present in the bam and locations of apparent staining of surficiial materials or debris will be recorded on a plan Following the survey representative areas within the barn will be sampled A total of 12 wipe samples will be collected (eg steel shelves boat wood stove electric meters etc) by wiping a 100 cm2 area with laboratory-prepared sampling wipes A total of ten samples of Wood from the walls of the barn will be collected by using a wood boring bit and wood chisel A total of four samples of loose dust will be collected from the floor of the concrete slab of the barn using disposable nylon brushes and stainless steel trowels Finally a total of four samples of concrete will be collected from areas of visible staining and one unstained area by drilling the concrete to a maximum depth of 12 inch in a 100 cm2 area All non-disposal steel sampling equipment will be decontaminated using methanol and distilled water rinses before use at each sampling location
442 Barn Analysis Program
Analytical procedures are identified in the Quality Assurance Project Plan (QAPP) Three field equipment blanks and three trip blanks will be submitted during the barn sampling program to check for the presence of cross-contamination These will provide aquality control check on decontamination and handling practicesAsummary of the analyses to be performed on each sample matrix and the quality controlsamples is shown in Table 5
Document Vol II SC SAP Revision 1
Date March 28 1991 Page 24
Wipe wood dust and concrete samples will be submitted to Ceimic in Narragansett Rhode Island for laboratory analysis Wood dust and concrete samples will be analyzed for PCBs cPAHs and lead Samples will be collected in I-Chem glassware or equivalent provided by Ceimic and preserved and stored as described in Section 6
The objective of the barn sampling program is to provide a preliminary assessment of the degree of contamination present within the barn (see Section 2) It may be difficult to ensure that representative replicates can be made of the various matrices during sampling Therefore no replicate samples of barn materials will be collected during this initial sampling effort
Aqueous trip blank wipe samples will accompany the samples during storage and shipment and will be analyzed for PCBs (sample identification will be PTB1-PTB3) Sampling equipment blank wipes will be made following decontamination of all steel sampling equipment at various times during the sampling program The steel equipment wiped will include the hole saw trowel and the drill bit used for barn wall dust and concrete sampling respectively The equipment wipe samples will then be analyzed for PCBs (sample identification will be PEB1-PEB3)gt
443 Barn Sample Designation
Each piece of sample glassware will be affixed with a self-sticking adhesive label Each label will be completed with an indelible marker to contain the following information
GEI Consultants Inc Site Name Project Number Sampling Data and Time Sample Number Samplers Initials Analysis Requested
The sample number is composed of a series of information to identify the sample as unique to the sampling point and sampling event The sample number labelled in the field and referred to on all associated documents is composed of the following
General Sample Location Project Sample Type Sample
BARN - 90393 - D2
Document Vol II SC SAP Revision 1
Date March 28 1991 Page 24a
The example sample number above indicates that a barn sample was obtained under project number 90393 and was the second dust sample collected The designations for the wipe samples will be P wooden samples W dust samples D concrete samples C and other samples O
Document Vol II SC SAP Revision 1
Date March 28 1991 Page 25
5 SAMPLING EQUIPMENT AND PROCEDURES
51 Air Monitoring
Short-term air monitoring will be performed regularly on-site during the Source Control (SC) sampling program A HNu photoionization detector (PID) and an MIE Model MINIRAM hand-held aerosol monitor (HAM) will be used for air monitoring The PID is capable of detecting total ionizable compounds (typically VOCs) and the HAM detects solid or liquid particulates in air which often take the form of dust smoke fumes and mists Each air monitoring instrument will be operated in accordance with the requirements specified in the Health and Safety Plan provided in Appendix A Readings from the PID and HAM will be recorded in the Project Field Log Book (see Appendix B) Calibration procedures for the PID (HNu Model PI-101) and the HAM (MIE Model MINIRAM) are provided in Appendix C
52 Soil Sampling
521 General
Soil sampling locations are shown on Figure 3 Table 1 lists each soil sampling location planned approximate sample depth and rationale for sample collection
Prior to sampling a surveyor registered in the State of Maine will survey the exact location of each test pit and boring location and provide a temporary stake that will function as a bench mark for horizontal and vertical control within 20 feet of each test pit and at each boring Sample locations within test pits will be by tape and compass bearing methods
Soil sampling will be performed with strict adherence to the procedures described below A list of equipment requirements for the soil sampling program is provided in Table 6 In general excavation of soil to the target depth in test pits will be performed with a backhoe for sampling to 5 feet below ground surface The backhoe and operator will be supplied by HE Sargent Inc and the operator will be equipped with Level C personnel protection (see Appendix A) A bombardier or truck-mounted drill rig operated by Northeast Diamond Drilling by personnel equipped with Level C protection will be utilized for sampling points greater than 5 feet below ground surface Soil samples collected by GEI for possible bench-scale testing will be obtained only at test pit locations Ambient air monitoring will be performed by GEI regularly while working on-site for health and safety monitoring Mobilization
Document VoL II SC SAP Revision 1
Date March 28 1991 Page 26
of equipment and transportation of materials over the site during the soil sampling program will avoid heavily contaminated transformer work areas when possible to reduce dispersing PCBs to other areas Drilling and excavating equipment will be decontaminated under the supervision of GEI prior to use at each sampling location following strict decontamination procedures described in Appendix A and below Sampling equipment will be decontaminated by GEI prior to each sampling event as described below All soil sampling operations within the site will be performed using Level C dermal and respiratory personnel protective equipment to protect against PCB-contaminated dust levels which are likely to exceed 1 mgm3 during sampling The detailed Health and Safety Plan that will be followed during soil sampling is provided in Appendix A
522 Soil Sampling Methods for Test Pits
A minimum of a two-person crew in addition to the backhoe operator or the drill rig crew will be provided by GEI during the sampling program
All soil samples will be collected from test pits by GEI with a shovel or trowel following excavation to the appropriate depth with a rubber tire backhoe as follows
1 Check the survey stakes for the proper test pit number identification and location
2 Place polyethylene sheeting on each side of the test pit for staging the excavated soils from the test pit
3 A standard rubber tire type backhoe will perform the soil excavation to the planned sampling depth All soil excavated from the test pit will be placed on the plastic sheeting adjacent to the test pit The top 2 feet of excavated soil will be cast to one side of the test pit on the sheeting and the bottom 3 feet of soil will be cast to the opposite side to avoid mixing soils with potentially significantly different levels of contamination After completion of sampling soil will be backfilled at a similar depth from which it was excavated
4 All excavation activities will be continuously observed by an engineer or geologist from GEI A test pit log form (OCONNORFL12) will be completed by GEI for each test pit performed and will include the following information
Document Vol II SC SAP Revision 0
Date January 17 1991 Page 27
Name and Location of Job Date Excavation and Test Pit Number Approximate Ground Surface Elevation at Test Pit Total Depth of Test Pit Dimensions of Test Pit Location and Depth of Soil Sample Relative to Stake Reference Method of Soil Sample Acquisition (Shovel Trowel) Volume of Soil Sample J Soil and Stratigraphic Descriptions x
Ground Water Levels (if encountered) y ^v Air Monitoring Information v Other observations Such as soil staining buried debris etc
5 At least one photograph will be taken oflta wall of each test pit from within the test pit with a scale for comparison to indicate soil layering or staining In addition one photograph shall be taken of thertesVpit from the ground surface also showing sample locations withinthe-test pit Photographs of the test pits will be marked to include site locationxjdbmumber^test pit number date and time A photograph log sheet will be maintained fampMuture reference
6 The target soil sampling elevation will be determined by GEI using a level and rod
7 Soil sampling will begin from within the test pit only after the side walls of the pit have been properly^sloped back in accordance with OSHA requirements (see Health and Safety Plan^ Appendix A) All samples collected will be identified on the test pit logazid in the field book Information about the sample including sample number^de^th voiuine and soil description will be recorded The soil sample will be colleetedTrotn an undisturbed area of the test pit floor or wall by means of scraping or digging with a stainless steel shovel or trowel The number of clean sampling utensils for each test pit shall be equal to the number of soil samples collected at the test pit Shovels or trowels used to clean sloughed material from the sampling location will not be used to collect the sample unless decontaminated before use in sampling Care will be taken to assure that the sample is taken from the actual soil unit desired mid does not include slough or scraped material from the sides of the trench The desired soil sample will be immediately placed into the sample container within the test pit A portion of the sample will be retained for screening with the Dexsil L-2000 PCB analyzer The containers will then be sealed labelled and stored in asecure area until Shipment to the laboratory
Document Vol II SC SAP Revision 1
Date March 28 1991 Page 28
8 When collecting a larger volume sample for bench-scale testing a smaller soil sample will first be collected for field screening using the Dexsil L-2000 PCB Analyzer If the analyzer indicates that the PCB concentration is within the target range the bench-scale soil sample will be collected If the Analyzer indicates that the PCB concentration is outside the target range the test pit will be expanded if necessary and another sample will be collected for PCB screening This procedure will be continued until a sample within the target range is identified The test pit will be expanded no more than 2 feet in all directions and to the maximum depth of 5 feet below ground surface If after this over-excavation the soil within the target concentration range has not been identified with the Dexsil L-2000 PCB Analyzer a new test pit location will be selected near the original test pit in an area indicated by the Remedial Investigation to contain soil contamination within the target range
9 Once the targeted PCB concentration has been indicated by field screening the desired soil sample will be collected with a clean stainless steel trowel or shovel at a sufficient quantity to fill a 5-gallon container An aliquot from the 5-gallon sample container will be collected and placed in an appropriate sample container for laboratory analysis for PCBs The 5-gallon containers will then be sealed labelled and appropriately stored in a secure area until transported off-site The laboratory samples will be sealed labelled and stored with the other soil samples awaiting shipment to the laboratory
10 Upon completion of sample collection the excavated soil material will then be backfilled into the test pit The backfilled area will be compacted to the approximate original ground elevation
11 Equipment will be decontaminated after backfilling the test pit (ie shovel trowels measuring equipment) byscrubbing and With methanol and distilled water rinses Portions of the backhoe (bucket bucket arm etc) will be decontaminated with a high-pressure steam rinse on the decontamination pad (see Appendix A)
523 Soil Sampling Methods for Borings
Selected soil samples are planned to be collected at depths greater than 5 feet below ground surface to obtain additional data on the depth of PCB contaminationexceeding cleanup standards in Transformer Work Areas Samples will be obtained using split-spoon sampling techniques within 3-inch ID hollow stem augers in test borings generally following procedures specified by American Society for Testing Materials (ASTM) D1586-84 Test borings will be performed by Northeast Diamond Drilling
Document Vol II SC SAP Revision 1
Date March 28 1991 Page 29
under the observation of an engineer or geologist from GEI The following procedures not specified in ASTM D1586-84 will be used
1 Place a polyethylene sheet on one side of the boring location for temporarily staging drilling cuttings during borehole advancement All drilling equipment shall be decontaminated with a high pressure steam rinse on the decontamination pad prior to beginning drilling
2 Advance hollow-stem augers without split-spoon sampling to a depth about 5 feet above the sampling depth specified in Table 1
3 Begin continuous split-spoon sampling with 18-inch-long samples Collect a specimen from the middle of each sample for screening with the Dexsil L-2000 PCB analyzer and the HNu photoionization detector Rinse the split-spoon sampler with methanol and distilled water rinses before each sample
4 Collect a split-spoon sample at the designated sample depth Divide the split-spoon sample vertically Place a minimum of 4 inches of sample recovered from the bottom right half of the sample into the glass sample container Seal and label the sample container as indicated in Section 4 and store the container in a cooler with ice in a secure area until shipment to the laboratory Retain the left half of the split-spoon sample for screening with the Dexsil 1^2000 PCB analyzer and the HNu photoionization detector
5 After collecting the final soil sample in the boring measure depth to ground water below ground surface using a decontaminated Solinst battery-operated water level indicator Record the time elapsed after completion of the boring when the ground water level was measured
6 Remove augers from borehole If the borehole remains open and evidence of ground water was encountered during sampling collect additional measurements of depth to ground water prior to backfilling until the ground water level appears to stabilize Note occurrence of precipitation or other events which could effect water level measurements in the project log book
7 Backfill borehole within 24 hours after completion of the boring with drill cuttings staged adjacent to the borehole If the borehole collapses and cuttings cannot be backfilled in the borehole store staged cuttings in a steel drum to be left on site Label outside of drum to indicate contents are borehole cuttings from the designated boring number and affix labelindicating PCB-contaminated materials Cuttings from more than one boring can be combined in a single drum
Document Vol II SC SAP Revision 0
Date January 17 1991 Page 30
8 Decontaminate measuring and sampling equipment with methanol and distilled water rinses Decontaminate downhole drilling equipment on the decontamination pad with a high-pressure steam rinse before starting the next boring
A log will be prepared by GEI for each boring and will include the following
information 7
Name and Location of Project
Boring Number lt Date of Boring Ground Surface Elevation x-Boring Diameter and Depth Sample Numbers and Depths Soil Screening Data Visual Soil Descriptions Water Level Measurements Air Monitoring Levels Other Observations
The boring log form is provrdedin Appendix B (OCONNORFL15)V
i
Surface Water ^^7
531 General
N
Surface water sam^les^will becollected at the locations shown in Figure 4 If water is too deep for safe aecess^with hip-waders andor access with hip waders will severely disturb sediment an inflatableboat will be used to access Surface water sampling locations
The surface water sampling program will be performed following strict adherence to the following procedures A list of the equipment requirements for surface water sampling is provided in Table 8 In general ambient air monitoring will be performed regularly while working on-site for health and safety considerations Areas of the site which have been determined by previous studies to have elevated concentrations of PCBs in soils (for example TWAs) will be avoided while traversing the site to reduce the likelihood of dispersing PCBs to other areas The depth of water at the sampling stations will be measured and the surface water elevation will be surveyed on each water body Equipment will be decontaminated prior to use at each sampling station following decontamination procedures
Document Vol II SC SAP Revision 0
Date January 17 1991 Page 31
532 Surface Water Sampling Methods
Surface water samples will be collected during the Pre-Design Study at the locations shown on Figure 4 Surface water samples will be collected during the initial stage of the Source Control sampling program prior to soil and sediment sampling An inflatable boat will be used to access surface water sampling locations if there is sufficient water depth The boat will be cleaned with methanol and distilled water rinses before sampling in each water body The surface water sampling procedures will be as follows ltX1 Determine the location of the sampling station by tape^and compass from a
temporary bench mark at the edge of the surface water body x
2 Measure the depth of water at the sampling station with a weighted tape measure x (
^ 3 Gently lower a clean Kemmerer sample^bottle to the desired depth (one-half
water depth) so as not to remove th^stoppeisprematurely V^
4 Pull out the stopper with a sharp jerk ofdhe sampler line
5 Allow the bottle to fill completelyras evidenced by the cessation of air bubbles
6 Raise the sample and capdhe nottle X x
7 Pour the sampl^fromthe bottle into the appropriate sample container The container willbesealedlabelled and stored in a secure area until shipment to the laboratory
8 Fill a beaker with water remaining in the sampler and measure specific conductance pH and temperature
9 Decontaminate the sampling apparatus measuring tape and Kemmerer sampler by scrubbing internally and externally with methanol and distilled water rinses
10 Record the following surface water sampling information in the project log book (OCONNORFL1)
Document Vol II SC SAP Revision 0
Date January 17 1991 Page 32
Date Time Total Depth of Water Location and Depth of Sample pH Conductivity Measurements Air monitoring levels detected Other observations
Sediment
541 General x
gt The locations of the sediment sampling stations are shown on Figure 4 Table 3 lists the various sampling stations and sampling methods for the sampling program Sediment sampling during the project will beperformed with strict adherence to the following procedures A list of equipment requirements for the sediment sampling program is provided in Table7 In general ambientw monitoring will be performed regularly while working on-site for health-and safetymonitoring Mobilization of equipment and materials over the sitdduring^he-sediment sampling program will follow specific routes to reduce the likelihoocKPfdispersing PCBs to other areas Equipment will be decontaminated prior to sampling at each location following strict decontamination procedures described belowy All sediment sampling operations within the site will be performed fusing level C dermal personnel protective equipment and Level D respiratory^protective equipment will be worn
v ^
542 Sediment Sampling Methods gtSN
The sediment sampling^vili be performed after collection of surface water samples and will consist of rivo primary components
1 Tube sediment smiling to provide additional data on sediment quality and to estimate the thickness of sediment
2 Dredge sediment sampling to obtain a sample for laboratory for bench-scale treatability testing
The tube sediment sampling program will be performed as follows
Document Vol II SC SAP Revision 0
Date January 17 1991 Page 33
1 Determine the sampling locations by tape and compass measurements from a temporary bench mark (reference stake) surveyed near the edge of the surface water body Access locations in interior portions of the water bodies using an inflatable rubber boat The boat will be decontaminated with methanol and distilled water rinses before use in each surface water body
2 Measure the depth of water with a weighted tape measure
3 Lower the hand tube sediment sampler to the desired ctepth Sediment entering the tube is trapped by a plastic core retainer allbyringlheunit to be retrieved a n d t h e s a m p l e r e m o v e d w i t h o u t s a m p l e l o s s X x y
4 Extract the sediment samplefrom the sampler and^immediately place the sample
into the sample container The containers ywllthen be sealed labelled and stored on ice in a cooler in a secure area until shipment to the laboratory
5 Decontaminate the sampling apparatua and measuring tape by scrubbing with methanol and distilled water rinses
vw 7 Record sediment sampling record information in the project log book
(OCONNORFL2) after collecting a sediment sample at each sampling station The information that will beuro~documenteamp includes the following
Date and Time ^ Total Depth of Water N Thickness of Sediment Location of Sample Length and Vblume^of Simple Sample Description x- Air Monitoring LevetesDeteeted Other Observations
The sediment sampling procedure for collecting samples for bench-scale treatability testing will be as follows
1 Determine the location of the dredge traverse line by tape and compass bearings from the temporarily bench mark adjacent to the surface water body
2 Pull the sediment dredge along the planned traverse with a wire line from the edge of the surface water body
Document Vol II SC SAP Revision 0
Date January 17 1991 Page 34
3 Repeat sampling until 5 gallons of sediment have been collected and placed in the 5-gallon sample container The containers will then be sealed labelled and stored in a secure area until shipment to the laboratory
4 Decontaminate the sampling apparatusand drag line by scrubbing with methanol and distilled water rinses
S6 Record the following sedimentsampling informationin die project log book after
sample collection X nXx
Date and Time X gt Total Depth of Water Location and Volume of Sample Number of Grab Samples Collected to Form Composite Volume Sample Description Air Monitoring Levels Detected x X Other Observations
Barn
5-51 General
Sampling within the barn will4gteperformed with strict adherence to the following procedures A list of equipment requirements for the barn sampling program is provided in Table 9 Areas of the Site which have been determined by previous studies to have elevatedconcentrations of PCBs in soils (for example TWAs) will be avoided during bam sampling to reduce the likelihood of dispersing PCBs to other areas within the barnXEquipment will be decontaminated prior to use at each sampling location inside thetarn following strict decontamination procedures All sampling operations withfaMhe barn will be performed with Level C personnel protective equipment due to dust levels which may to exceed 1 mgm3 during sampling (see Appendix A) A detailed Health and Safety Plan which will be followed during barn sampling is provided in Appendix A
552 Barn Sampling Methods
If power is not available on-site a gasoline-powered generator capable of supplying electricity for lighting and sampling equipment will be positioned outside the fenced area of the site prior to sampling Extension cords will be run to the barn (avoiding TWAI) for power supply In order to reduce the potential for cross-contamination due to dust generation the sampling of different matrices will proceed in the
Document Vol II SC SAP Revision 0
Date January 17 1991 Page 35
following sequence 1) wipe samplingof non-porous debris 2)wood sampling of barn walls 3) dust sampling from top of floor slab 4) concrete sampling of floor slab Areas to be sampled will be chosen based on the presence of apparent oil-type staining and to obtainan even distributionof representative samples with no apparent staining
Following sampling at each location a self-sticking adhesive label marked with the sample number will be placed at the sample location for future reference Each label will then be located by taping relative to a reference point Established at the western corner of the barn (W-Z corner) as shown in Figure 5 Walls W and Z will be used as orthogonal axes similar to a typical coordinate system For samples collected above the concrete floor slab (eg wipe and wooden wall samples the height above the floor slab will also be recorded All samples willbe collected between the floor slab and a maximum height of seven feet All location measurements and a brief description of the area sampled will be recorded on the Barn Sampling Form (OCONNORFL13) provided in Appendix B Imaddition a photograph of each sampling location will be taken and^ recordedy on the Photograph Log (OCONNORFL6) Detailed procedures-for each type of sample to be collected during the barn sampling program follows
lt Win Samnlino N
1 Identify the non-porous item within the barn selected to be sampled which has an area of at least 100 cm2 which maybe wiped Examples include sheet metal fiberglass cleanly painted wooden surfaces glass etc
2 Place a decontaminated stainless steel or plastic 100 cm2 (10 cm X 10 cm) template at t^desired sampling location
Note For smaller areas such as on electric meters use the quarter template of 25 cm2 area and make four wipes to compose one sample
3 Remove the laboratory-supplied gauze from within the glassware with stainless steel forceps The gauze should be moist with solvent as prepared by the laboratory
4 While holding the appropriate template in place thoroughly swab the 100 cm2 area with the gauze using forceps or bufyl rubber gloves Inspect the area to ensure that all loose dust has been wiped with the Alter paper
Document Vol II SC SAP Revision 0
Date January 17 1991 Page 36
5 Fold the gauze over to ensure that the dust is contained on the inside of the gauze Place in the appropriate sample container seal label and store in a secure area until shipment to the laboratory
6 Decontaminate the forceps and templates by scrubbing with methanol rinsing with distilled water and wiping dry with paper towels
7 Label the sample location photograph and complete^he Barn Sampling Form
(see Appendix B) and other necessary documentation after each sample is
c o l l e c t e d lt X x x y x x
xWooden Wall Sampling X
1 Select the sampling area of at least 100 cm2 on the inside wall of the barn and secure a decontaminated 100cm2 template at the location Place a steel pan below the sampling area to catch sawdust ancLwood chips
2 Using an electric drill equipped withra-one-ineh diameter wood-boring bit drill out wood within the template area to arnaximum depth of 12 inch
3 Place sawdust and wood chips man appropriate sample container seal label and store in a secure area untiLsRipinent to the laboratory
4 Decontaminate the drilTbit and pan by scrubbing with methanol rinsing with distilled water and jwiping dry with paper towels
5 Label the samplelocatidn photograph and complete the Barn Sampling Form (see Appendix^)
Dust on Floor Slab Sampling
1 Select an area to sample such that at least 100 grams of dust or soil may be obtained This will vary depending on thickness of the dust or soil
2 Using a disposable nylon brush or stainlesssteel trowel brush or scrape dustsoil toward the center of the area chosen minimizing the creation of airborne dust
3 After the dustsoil has been centralized use a flat stainless steel trowel to collect the material and place in laboratory-supplied glassware seal and label
Document Vol II SC SAP Revision 0
Date January 17 1991 Page 37
4 Dispose of the nylon brush with other containerized PCB-waste materials and decontaminate the stainless steel trowelsby scrubbingwith methanol rinsingwith distilled water and wiping dry with paper towels
5 Label the sample location photograph and complete the Barn Sampling Form
Concrete Slab Sampling
1 Identify three areas of visible staining and one area of no visible staining on the floor slab Using a disposable nylon brush carefulfy brushxaway loose dust and soil from an approximately 1-square-foot area
2 Place a pre-cut 10-square-foot sheet of clean polyethylene sheeting with a 1shysquare foot hole cut in the center over thevsampling area and secure in place with duct tape Place a decontaminated lOO cmr template in the center where t h e s a m p l e i s t o b e o b t a i n e d X v N
3 Using an electric hammer drill eqi^pedwitlra^ungsten-carbide mortar bit drill the four corners established by the tempfate^to a maximum depth of 12 inch
4 Remove the template ancLdrilL the remaining 100 cm2 within the established square to a maximum dep^fof l2Jnch
-vFollowing drilling brush the concrete chips and dust from the plastic sheeting toward the center otlhe sarhplihggtarea Collect sample with a clean disposable nylon brush andtrowel and place in an appropriate sample container seal label and store in aSecure area until shipment to the laboratory
6 Dispose of the nylon oriish with other containerized PCB-contaminated waste materials and decontaminate the stainless steel trowel and template by scrubbing with methanol rinsing with distilled water and wiping dry with paper towels
7 Remove and dispose of the polyethylene sheeting and duct tape in an appropriately marked barrel that will remain on the site with other sampling waste disposal materials Label the samplinglocation photograph and complete the Barn Sampling Form
Document Vol II SC SAP Revision 0
Date January 17 1991 Page 38
6 SAMPLE HANDLING AND ANALYSIS
61 General
GEI has established a program of sample chain-of-custody that is followed during sample handling activities in both field and laboratory operations Thisvprogram is designed to assure that each sample is accounted for at all times To accomplish this objective sample container labels sampling records chain-of-custody records sample assignment forms shipping airbill records and laboratory receipt sheets must be completed by the appropriate sampling and laboratory personnel ^ y gt
62 Sample Labeling and Documentation gt
The plastic 5-gallon containers for bench-scale testingsWilKbe cleaned with methanol and distilled water rinses prior to use All other sample containers^will be pre-cleaned by EPA-approved methods and provided by the laboratory^ A summary of the sample containers and preservation requirements for each of thamp^analytieal parameters to be measured is shown in Table 10 Each piece of sample gl^sware^will be affixed with a self-sticking adhesive label Each label will contain the information described in Sections 4 and 5 of this document ^
To further document the samplingprogr^mand Sample handling procedures the project log book (OCONNORFL1) will containinformation regarding the activities on-site and sample handling In addition photographs of each type of field procedure will be taken The photographs will be representative of thetechniques employed throughout the sampling program A record ofeach photograph Will be made on the Photograph Log (OCONNORFL6) as stiown 4i^Appendix B
63 Chain-of-CustodySample^Assignment
Chain-of-custody will be maintained at all times as described in more detail in the Quality Assurance Project Plan (QAPP) A copy of the chain-of-custody form (OCONNORFL9) to be used is provided in Appendix B
In general the chain-of-custody record must be used such that it includes the following information
Document Vol II SC SAP Revision 0
Date January 17 1991 Page 39
Project name and number Names of the sampler(s) and person shipping the samples Station number or well identification Date and time the samples were collected Composited or grab sample designation Sample number (eg 1GU-90393-MW101A) Total number of containers Analysis requested Date and time the samples were delivered for shipping Names of those responsible for receiving the sampled at the laboratory
Prior to shipment of the samples a sample assignment form will be completed (see OCONNORFLIO in Appendix B) The sample assignmenrform will provide the contract laboratory sufficient information to process the samples and perform the appropriate analysis
The chain-of-custody record and sample assignment fornr will both be completed in duplicate in the field through the use of carbon paperT The original copy of the forms will be enclosed in a plastic bag and placed in the coolersWith the samples for shipment to the laboratory The carbon copy of the forms will be retained by GEL
VSoil samples for bench-scale testing ynH be-stored on site in a locked storage shed until samples are selected for the bench-scale7testing^ This decision will be made after receipt of the laboratory PCB analyses results and approval of the Source Control Work Plan by the EPA Soil samples not usecLfor bench-scale testing will remain in the locked storage shed and will be included with-other soil for treatment during the Remedial Action
lt v 64 Sample Shipments
Sample containers are generally packed in coolers for shipment Prior to packing organic analysis samples will be placed in plastic bags Bottles are to be packed tightly so that no motion is possible Styrofoam vermiculite and bubble pack are suitable for most instances Ice Will be placed in sealed plastic bags or ice packs in order to keep samples at 4degC at all times Samples will be protected against freezing during cold weather The original chain-of-custody and sample assignment forms will be sealed in plastic bags and placed in the cooler with the samples The cooler will be closed and a signed self-sticking label with the words Custody Seal will placed between the body of the cooler and the cover The cover will then be sealed with clear tape Samples will be shipped so that they are received by the laboratory no later than 60 hours from the time of sample collection
Document Vol II SC SAP Revision 0
Date January 17 1991 Page 40
All shipping of samples will be done through Federal Express or equivalent overnight delivery service Samples will be shipped in accordance with Department of Transportation (DOT) regulations If prompt arrival of the samples cannot be guaranteed the samplers will be responsible for proper storage of the samples until adequate transportation arrangements can be made The laboratory will be notified prior to shipment to arrange for receiving the samples and to prepare for the analyses requested Based on the low concentrations of chemicals detected during previous studies theSamples will be classified as environmental samples The air bill for the samples will speeiiythat the contents of the cooler are environmental or hazardoussamples as appropriated When samples are received by the laboratory they will notify the Task Manager of theccondition of the samples
H craTrsi
TABLE 1 - SOIL SAMPLING SCHEDULE Field Sampling Plan OConnor Co Site Augusta Maine
DEPTH APPROXIMATE BELOW ANTICIPATED
SAMPLE NUMBER SAMPLE GROUND PCS GENERAL LOCATION OF ELEVATION SURFACE CONCENTRATION SOIL
ID SAMPLES (MSL) (PPm) TYPE COMMENTS
TP1 2175 25 ND ClaySandy Till Confirm contours 215 35 ND
TP2 217 15 50 ClaySandy Till Confirm contours TP3 212 ND Siltv Clav Confirm horizontal extent toward marsh TP4 211 5-50 Clav Obtain bench scale 20-50 ppm
TP5 213 50-500 Clay Confirm lateral extent
TP6 215 15 5-50 Fill Obtain bench test sample In 1-10 ppm
TP7 210 35 0-5 Siltv Fine Sand Confirm vertical extent in drainage area
217 3 0-5 FillClay Confirm contours TP8 219 1 0-5 TP9 207 35 0-5 Siltv Fine Sand Confirm vertical extent In drainage area
TP10 1175 15 50-5000 Fill Bench scale test sample 50 to 500 ppm
TP11 218 0-5 SandClay Confirm horizontal extent toward marsh
TP12 218 0-5 SandPay Confirm horizontal extent toward marsh
TP13 221 5-50 Clav Bench-scale test sample 10-20 ppm
TP14 206 0-5 Gray Silty Clay Confirm vertical extent
TP15 200 0-5 Gray Silty Clay Confirm vertical extent
TP16 2185 15 5-50 Clay Bench-scale test sample 1-10 ppm
228 4 TP17 230 2 Confirm contouring in north end of site
231 4 TP18 233 2 Confirm contourtng in north end of site
236 4 TP19 238 2 Confirm contouring in north end Of site
Project 90393 GEI Consultants Inc Page 1 of 2 March 28 1991
SAMPLE NUMBER LOCATION OF
SAMPLES
TP20 TP21 TP22 TP23
TP24 TP25
B1
B2
1 B3 2
B4
B5
ND = Not Detected
TABLE 1
APPROXIMATE SAMPLE
ELEVATION MSLJ
231 233
2275 237 237 235 236 222 210 215 210 215
215 220
218 220 220 222
- SOIL SAMPLING SCHEDULE Field Sampling Plan OConnor Co Site Augusta Maine
DHTH BELOW
GROUND SURFACE
4 2
15
2 1
8 3 8 3
12 6
8 6 6 4
ANTICIPATED PC8
CONCENTRATION
ND ND 0-5
500-5000 5-50
50-5000 0-5
50-500
0-5 50-500
0-5 0-5 0-5 0-5
GENERAL SOIL TYPE
Clavev Silt Silty Clay
Clay
Till or Clay
Till or Clay
Gray Silt
Gray Clavev Silt
Gray Clayey Silt
i
Confirm contouring in north end of site Confirm contours Confirm contours Confirm contours
Confirm contours Bench scale sample 50-500 ppm
Confirm contouring and vertical extent
Confirm Contouring and vertical extent
Confirm contours and vertical extent
Confirm contours and vertical extent
Confirm contours
Project 90393 GEI Consultants Inc Page 2 of 2 March 28 1991
TABLE 2 SOIL ANALYSIS PROGRAM Field Sampling Plan OConnor Co Site Augusta Maine
Sample Depth
Sample Location ID
SoB Sample Number
(ft below ground surface) Lead cPAHs PCBs
pH TOC CEC
Anatyticsd Level IV
TEST PITS TP1 SS1 TP2 SS1 15
SS2 35 TP3 SS1 TP4 SSI
SS2 TP5 SSI TP6 SS1 15
SS2 15 TP7 SS2 35 TP8 SSI
SS2 TP9 SSI 35
replicate of SS2 SSI
TP10 SS1 15 SS2 15
TP11 SSI TP12 SSI TP13 SS1
SS2 TP14 SS1 TP15 SS1
replicate of SS2 SS1
TP16 551 15 552 15
TP17 551 552
TP18 551 552
TP19 551 552
TP20 551 552
TP21 SS1 15 TP22 SS1
Project 90393 GEI Consultants Inc Page 1 of 2 March 281991
TABLE 2 SOIL ANALYSIS PROGRAM Field Sampling Plan OConnor Co Site Augusta Maine
Sample Depth
Sample Location ID
SoB Sample Number
(ft below ground surface) Lead cPAHs PCBs
pHTOC CEC
Analytical Level IV
Bench Scale
Sample
replicate of SS2 SS1
TP23 SS1 TP24 SS1
SS2 TP25 SSI
SS2 BORINGS
B1 SS1 SS2
B2 SS1 SS2
B3 SS1 6 replicate of
SS2 SS1 SS3 12
B4 551 552
B5 551 552
QUALITY CONTROL TP26-TP29
(trip blank) SS1-SS4 TP30-TP33 (shovel or
hand trowel SS1-SS4 blank)
TP34-TP37 (split-spoon
blank) SS1-SS4 TOTAL
ANALYSES 40 40 64 15 12
TOC - Total Oraanic Carbon CEC - Cation Exchange Capacity
Will be designated to the laboratory as matrix spikematrix spike duplicate
Additional trip blanks may be needed to ensure one trip blank per cooler
Project 90393 GEI Consultants Inc Page 2 of 2 March 281991
TABLE 3 SEDIMENT ANALYSIS PROGRAM Field Sampling Plan OConnor Company Site Augusta Maine
PH Bench Sample TOC Analytical Scale
Sample Location Number Lead cPAHs PCBs CEC Level IV Sample
Surface Water Body
SED1
SED2
SED3Upland Marsh (UM) SED4
SED5
SED6
SED1
SED2Upper Lagoon (UL)
SED3
SED4
Lower Lagoon (LL) SED1
SED2
SED3
SED7 (trip blank)
SED8Quality Control (dredge
blank)
SED9 (tube
samples blank)
Total Analyses 11 11 16
TOC - Total Organic Carbon CEC - Cation Exchange Capacity
UL SED2 is a replicate sample of UL SED1
Will be designated to the laboratory as matrix spikematrix spike duplicate
Additional trip blanks may be needed to ensure one trip blank per cooler
Project 90393 GEI Consultants Inc March 281991
TABLE 4 - SURFACE WATER ANALYSIS PROGRAM Field Sampling Plan OConnor Co Site Augusta Maine
SAMPLE SAMPLE LOCATION NUMBER Lead Aluminum PCBs
Upland SW1 X X X Marsh (UM) SW2 X X X
Upper SW1 X X X Lagoon (UL) SW2 X X X
SW3 X X X
Lower SW1 X X X Lagoon (LL) SW2 X X X
Quality Control Samples
Trip Blank SW4
Sampler Blank SW5
TOTAL ANALYSES
TSD - Total Suspended Solids
SW2 is a duplicate of SW1
Will be designated to the laboratory as matrix spikematrix spike duplicate
Additional trip blanks may be needed to ensure one trip blank per cooler
Project 90393 GEI Consultants Inc Page 1 of 1 March 28 1991
TABLE 5 - BARN SAMPLING ANALYSIS PROGRAM Field Sampling Plan OConnor Co Site Augusta Maine
SAMPLE MATRIX PCBS CPAHS Lead
Analytical Level IV
Wipe samples PTB (trip blank) PEB (equipment blank)
12 3 3
Wooden wall samples 10 10 10
Dustsoil on floor slab
Concrete slab
Total Analyses 36 18 18
Additional trip blanks may be needed to ensure one trip blank per cooler
One sample will be designated to the laboratory as a matrix spikematrix spike duplicate
Project 90393 GEI Consultants Inc Page 1 of 1 March 281991
TABLE 6 - SOIL SAMPLING EQUIPMENT REQUIREMENTS Field Sampling Plan OConnor Co Site Augusta Maine
Safety Equipment (Level C - Dermal)
Health and Safety Plan (copy) Portable Photoionization Detector (HNu) Hand-held Aerosol Monitor (HAM) Disposable Tyvek Coveralls Tyvek Hoods Duct Tape Safety Goggles Safety Boots Surgical Gloves Butyl Sampling Gloves n gt Rubber Boots or DisposableBooties Hard Hats (when near qverhead objects)
Safety Equipment (Level C - Respiratory)
Sampling and Measuring Equipment
Other
Full-face Respirators Combined Organic Vapor and
High-efficientcy particulate Cartridges Dust Prefilters
Level and Rod Measuring^Tape Stainless -SteeLShovels Stainless Stee^T rowels 165-foot Measuring Tape Methanol V
Distilled Water Paper Towels
SafopltngjSlassware (See Table 10) xCo6lers with Ice or Ice Pack
Clear Plastic Tape Re-sealable Plastic Bags
Gallon Drums
ite Maps Project Log Books Marking Pens Camera Photograph Log Forms Test Pit Log Forms Boring Log Forms Chain-of-Custody Forms Sample Assignment Forms Equipment Calibration Logs Extra Bottle Labels Spare AA Batteries for Meters Blank Federal Express Airbills
Project 90393 GEI Consultants Inc Page 1 of 1 January 171991
TABLE 7 - SEDIMENT SAMPLING EQUIPMENT REQUIREMENTS Field Sampling Plan OConnor Co Site Augusta Maine
Safety Equipment (Level C - Dermal)
Safety Equipment (Level C - Respiratory)
Sampling and Measuring Equipment
Other
GEI Consultants Inc
Health and Safety Plan (copy) Portable Photoionization Detector (HNu) Hand-held Aerosol Monitor (HAM) Disposable Tyvek Coveralls Tyvek Hoods Duct Tape Floatation Vest Inflatable Boat Safety Goggles Safety Boots Surgical Gloves Butyl Sampling Gloves Rubber Boots or Disposable obties Hard Hats (when near overheackobjepts)
V Full-face Respirators Combined Organic Vaporand
High-efficiencyHPartjculate Cartridges Dust Prefilters
Level andRod Measuring Tapp 165-foot MPasuririgTape Methanol V Distilled Water jper tpwels V
SjE(mplinsect~Glassware (See Table 10) Cdolbrs wlthjbe or Ice Pack
Clear Plastic Tape Re-sealable Plastic Bags
-Galloh Drums fghted Measuring Tape e Sediment Sampler dge Sediment Sampler
Site Maps Project Log Books Marking Pens Camera Photograph Log Forms Chain-of-Custody Forms Sample Assignment Forms Equipment Calibration Logs Extra Bottle Labels Spare AA Batteries for Meters Blank Federal Express Airbills
Project 90393 Page 1 of 1 January 17 1991
TABLE 8 - SURFACE WATER SAMPLING EQUIPMENT REQUIREMENTS Field Sampling Plan OConnor Co Site Augusta Maine
Safety Equipment (Level C - Dermal)
Safety Equipment (Level C - Respiratory)
Sampling and Measuring Equipment
Health and Safety Plan (copy) Portable Photoionization Detector (HNu) Hand-held Aerosol Monitor (HAM) Disposable Tyvek Coveralls Floatation Vest Inflatable Boat Tyvek Hoods Duct Tape Safety Goggles Safety Boots Surgical Gloves Butyl Sampling Gloves Rubber Boots or Disposable Booties Hard Hats (when nearOverhead objects)
w Full-face Respirators Combined OrganicVaporand
High-efficiency Particulate Cartridges Dust Pi
Level and Rod
Measuring Tape M3amp-foot Measuring Tape JsopropyhAlcohol Mbthanol DistlHed Water PaperTowels Sampling Glassware (See Table 6)
oolers with Ice or Ice Pack tear Plastic Tape
Re-sealable Plastic Bags 55-Gallon Drums Weighted Measuring Tape Kenmerer Sampler Disposable 045 Micron Field Filters Pressure Pump for Field Filtering pH Meter with Temperature Probe Cole-Parmer pH-40 70 Calibration Solutions Cole-Parmer 1413 Micromhoscm Calibration Solution
Project 90393 GEI Consultants Inc Page 1 of 2 January 171991
TABLE 8 - SURFACE WATER SAMPLING EQUIPMENT REQUIREMENTS Field Sampling Plan OConnor Co Site Augusta Maine
Other Site Maps Project Log Books Marking Pens Camera Photograph Log Forms Chain-of-Custody Forms Sample Assignment Forms Equipment Calibration Logs lt Extra Bottle Labels Spare AA Batteries forM6ters Blank Federal Express Airbills Xy
Project 90393 GEI Consultants Inc Page 2 of 2 January 171991
TABLE 9 - BARN SAMPLING EQUIPMENT REQUIREMENTS Field Sampling Plan OConnor Co Site Augusta Maine
Safety Equipment (Level C - Dermal)
Safety Equipment (Level C - Respiratory)
Sampling and Measuring Equipment
Other
Health and Safety Plan (copy) Portable Photoionization Detector (HNu) Hand-held Aerosol Monitor (HAM) Disposable Tyvek Coveralls Floatation Vest Tyvek Hoods Duct Tape Safety Goggles Safety Boots Surgical Gloves Butyl Sampling Gloves Rubber Boots or Disposable Bboties Hard Hats (when near overheackpbjects)
Full-face Respirators Combined OrganicVapor and
High-efficiencyParticutale Cartridges Dust Prefilters
Gas powered electrfcgenerator 5 gallonsgaspline 350 feetNplectricahextfnsion cord Self-standin^work-larnps (200 watts minimum) Electric 38drilkwith two 1-inch wood boring bits ElectricBoschhammer drillwtungsten-carbidemortar bit Hpound-cut polyethylene sheeting and duct tape
Steel blaRing sheet X^vdiSpdsabfe nylon brushes
Stainless steel trowels Three 100 cm templates andone 25 cm template Forceps Peper towels Silf-sticking adhesive labels and push pins
Site Maps Project Log Books Marking Pens Camera Photograph Log Forms Bam Sampling Forms Chain-of-Custody Forms Sample Assignment Forms Equipment Calibration Logs Extra Bottle Labels Spare AA Batteries for Meters Blank Federal Express Airbills
Project 90393 GEI Consultants Inc Page 1 of 1 January 171991
TABLE 10 - SAMPLE CONTAINERS AND PRESERVATION REQUIREMENTS Field Sampling Plan OConnor Co Site Augusta Maine
Holding Media Parameter Container Preservation Time
PCBs 8 oz glass jar 4deg C 14 days-with Teflon- extraction lined lid 40 days shy
analysis
cPAHs 8 oz glass jar 4deg C 14 days-SOIL with Teflon- extractionSEDIMENT lined lid 40 days shyWOOD
analysisCONCRETE AND WIPE Lead 8 oz glass jar 4deg C 6 months SAMPLES with Teflon-
lined lid
Bench-scale 5 gallon high NA NA testing density
polyethylene bucket
PCBs Two 1-liter 4deg C 7 days shyamber glass extraction bottles 40 days shy
SURFACE analysis WATER
Lead 500mi HN03 4deg C 6 monthsSAMPLES polyethylene to pH bottle lt20
Aluminum 500ml HN03 4deg C 6 months polyethylene to pH bottle lt20
NOTE All standard sample containers will be l-CHEM equivalent bottles supplied by the laboratory The 5-gallon polyethylene bucket will be rinsed with methanol and distilled water prior to use
NA = Not applicable
Project 90393 GEI Consultants Inc March 28 1991
gt 1I L )
i bullbullbull j bullgti sil- j-V
poundP
A C
jfr35
QUAOnANQLE LOCATIONTOOU9 POND MAINEJI881)N4416-W37-307B
bull4000 FEET
Central Maine Power Company Pre-Design Work Plans SITE Augusta Maine OConnor Site LOCATIONFrom EC Jordon Co RIFS
Augusta Maine MAPReport dated June 1989
C D Project 90393 January 1991 Fig 1 G E I C o n s u l t a n t s I n c
b-r
p pp l-I 0 x foooo^ _^_ZZZ~~r^-^
UpoundEtpound 1IMA iRAMWOfMII NOW AM A OAAMAG IWAllrj WWEOfOHAMMS MHICUOn Central Maine Power Company Pre-Design Work Plans LOCAIION Oh
in cuelt^KL2 Augusta Maine OConnor Site TRANSFORMER
Scale 1 inch = 142 feet Augusta Maine WORK AREAS AND SWALESFrom EC Jordon Co RIFS
Report dated June 1989 C D G E I C o n s u l t a n t s I n c Prnjprf QfttM January 1QQ1 Fifl 0
~- bull middot bull -middot r middot~middotmiddotmiddotIll middotmiddot t~r
I bull Imiddot
bull bull1 middotmiddot middotir-------~-------middot ~ bull middot middot-------------------middotmiddot ~ middotmiddotmiddotamiddot A middotimiddot r bull amiddot A I bull TWA I tmiddot LOW AREA A NO~TH) SOUTH) I
v
A middot
rmiddot---middot---middot~middot---- ----middot~middot [WEST) [W[ST) (EASr) middot I
middot middot middotmiddot AmiddotA D-D 220 SCRAP ARf-A 201 -
bull - I
nor 140 TWA I 2bull0
1 bull middotbullmiddot1~-~~ L~W AR1-A ---- middot-~ l0 ~
i r bull I -$-~middot
0 - )1 _~ ~ middot1~oi I EEltY
J I ~2J~ bullbull
bullf()omiddot middotmiddot middot~ bull0 2 i- 0
11bull I lo bull ~middotmiddotmiddot~middot ~ ~--middotmiddot~middotbull ~-8~-i~~jplusmny~f~=ii1 - ~ bull ___ I I- _5 middot~bull-tmiddoti~middot~ N ~ bullbull ~ i I o middot TP19 gt - ~ ~ Jmiddot ~I middot~middot~I bullJUI 215 middot 215~-I e bull TP23 if 21~ ~ middot middot middot_ ------ ~middot - L middot~ ~ ~~ 1 i i
235 middotQ1middot1middotmiddot ~ bullbull ~~middot~middot- Lil middot~ _~ middot f bulllto --- z middotmiddot middot
middotr
-lt lt -middot I ~ middot ~ I
1 c ~ __ ) bull bull bullmiddot bull --middot Q
middot bull bullbull - 1middotmiddot - bullbull ~middots middot- uPPfR 1middotmiddot T LAGOON 1middot middot -$- middot middotmiddotpoundpound~middotmiddotmiddotmiddotmiddot bull =lt middot
~ middot ~~ iP22 gt middotgt
w
210 I
-
------_7___ 210 1 _
w_ +-
middot middot w--~ J210 middot i~30 -- middot_
1 TP18 bull middotmiddotI middot~ ----shy middot-middotmiddot
middot~ I j
middot- t - I 1 I BEDROCK 11 I
1
lmiddotmiddotomiddotmiddotmiddotmiddotmiddot middot middot middot =middot _middotmiddot middotmiddotmiddotmiddot 1 I rI Th 205 bull 205
bull -middotmiddot bull_ 1 225 22 middot bullbullbull fltISmiddot middot middot ~ ~middot f4tmiddotmiddotmiddot I J205 1bull
middot OOTR10U1t0N craquo-middotPC~middot~oN~A~ SEL11r~~~TS H LO~ AR~A ------------------------------------------------bull1 BASEO IN PART ON QBSERVATION Of FILL PlACEMENTmiddot bullmiddot E~middot-1middot bull bullbullbull middotmiddot Q - _
_
-1 I
fmiddot bull bull
-middotmiddot I r-middot shy c bull
I omiddotmiddot
r- middotmiddotI ~I
1 middot1 r bull bullf-Sf1 TWA I middotbull middot ~ i1 bull bull middot (EASfJbullI middot-----bullI (WEST) middotI bull I 1I cmiddot middot~ I~ ~ I bull bullbullbullI 1bullbull
(EAST) - bull middot- - I
bull bull r ~middot l
~
~30 i
2io bull
middot) Ibullbull
I
- J l TPl7 bull- f ~j -middot middotmiddotmiddotmiddot I 1 J middotmiddot1
middot~ ~ bull middotimiddotmiddotch bull bull_ t-ROAOI cli middot bull ~ middot1middot
225
I bull ILmiddot i~A--middot1middot 225 bull
1225 middot I ~ CENTRAL DRAINAGE middotmiddotmiddot--Q-middot --middot _ --middot
~ I -- -shy A middot
bull B-B --- m
- _ - middoti-- 10bull ~ m
g r
220 220 I ~
I middot _
l MI r ~ I
middot middot 1bull bull1 111
I rbull bull
middot
bull bull l
215 BEOROC~ 215
bull I bull middot - -
) l
-middotshy- bull Il
I 5 -middot middot middottc bull bull gt f bull 110 1~ w 210 210 ~ middotmiddotmiddotmiddotmiddot middot-middot -
( bull
middotlt bull [ I
bull G -
-middot-
middot middotmiddot bull ~middot-middot-- -middot- t~middotmiddotmiddotmiddotmiddotmiddot middotmiddot middot L -middot 1 -middot~ bull bull - middotmiddot L middot-~ _ bull f middot middot1 I ~ l
205 bull bull ~middot JO~cmiddotimiddotmiddotmiddotmiddot middot--middotmiddotmiddot1 _~ middotmiddotmiddotmiddotmiddot middotmiddotmiddotmiddotmiddotmiddot bullI bull middot -middotmiddotmiddotmiddotmiddotmiddotg
bull -$-middotmiddotmiddot middot~middot iii~~- ~0 i TB-20 SUBSURFACE BORING NUMBER bull bull bull TPmiddot 105 TEST PIT NUMBER
middot
bull1
bull I TP16 middotmiddotmiddotmiddotmiddot~ Q G) ) mmiddot i GROUND SURFACEmiddot bull 1bull 1middot bull I i ~ u o I bullbullbull I~ bullbullbull bullbullbullbullbullbullbullbullbullbullbullbull bullbullbullbullbullbullbullbullbullbull bull middot bull
ll bull bullbullbull middotmiddotoz bull I 250 CONCENTRATION OF PCBs IN SCREENED SAMPLE lPPm) r lt bull bull I
middot CONCENTRATION CONTOUR middot middot bull - -- CROSS-SECTIONS CONTOURED AT 5ppm 50ppm ANO 500 ppm TOTAL PCBs
middotbull middotmiddot c- I bull ~~ ND NOT DElECTED -middot ~ I
middotmiddot middot--middot~ middot sect t I middot UNDERLINED VALUES ARE CLP RESULTS (ppm)bull
middot -____ bull ~~ - -- I
bull bull middot -middot middot bull Ibullbull middot ~- middot --- LEGEND (ISOPACH MAP) bull lmiddot I l
I
-middot 1 middot I
bull middot ~SUBSURFACE EJORING LOCATION middot
-t middot ( 10766 - 10 10186) middot middot J BORING NUMBER -2 middot THICKNESS OF SOIL CONTAINING PCBs IN EXCESS OF 5 ppm
I
bull ~ middot
LOW AREA BORING LOCTION (107187)
- I j
I
bull BORING LETTER - ~ THlC~NESS OF SOIL C011TAINING PCBs IN EXCESS oF Sppm middot middot middot middottmiddot=plusmn+ TEStPIT LOCATION 1 bull bull bullbullbull i 0~ Q G) I -$ ELECTRICAL EQUIPMENT SAMPLE POINl middot middot -middot bull 1-1 I ~ bull
If bull bull ) bullbull bullbullbullbullbullbullbullbullbullbull f4( middot~01 l - bullmiddotomiddot
middot - ( ~-~ SURFICIAL EXTENT OF SOILS CONTAINING gtSppm PCBs bull middot (
bull __ ~ -middot middot_ middotmiddotmiddotmiddotmiddotmiddotmiddotmiddot _ - middotmiddot --- bull bull -bull - ISOPACH LINE ILLUSTRATING THICKNESS OF SOILS CONTAMINATED BY middot middot middot -middot~middotmiddotbullmiddotmiddotmiddot middotmiddotmiddot bullbull middot middot bull middotmiddot middot 8 -- bull _CONTOURS [)RAWN _-- ~ _l bull abull lO_fEF lran_~OUllCStRF~CI gt~~~~ ~~~~bull
I bull middot T o o bull bull middot middotmiddot
) NOTES 1 -middot -middot bull
I1 THE ISOPACH CONTOURS WEREDRAWN TO DENOTE THE THICKNESS OF SOIL ~ Q iP1 middot 0 bullbull 5 bull GEi BORING LOCATIONS middotMEASURED FROM THE SURFACE CONTAMINATED BY GREATER THAN 5ppm TOTAL PCBs bullbull bull bull I THE VALUE OF 5ppm WAS CHOSEN ARBITRARILY AND IS NOT INTENDED TO REPRESENT
middot bullv middot-- - l A SITE-SPECIFIC CLEAN-UP LEVEJ GEi TEST PIT LOCATIONS
2 CRO~S-SECTIONS ILLUSTRAt EXTENT OF PCB CONTAMINATION WITH DEPTH I middot- -f j bull I
_ veRTt6l1 EXAGGEP1r10M m c~oss sicT1c~S 1s 61 middot
bull
middot
I middotshy1
middot J~uJt bull bull i ~ ~ _ - middot j
1 ~ middot bull bull bull middotmiddot l a )
0 gt bullmiddot -~I middotbull I 0 middot r middot- bull ibull I
bull
_ _ I I ~
middot I
bull bull
bull middot~r
- -middot- - -
bullI l middotI middot I bull r f I I
~_ Igt bull
bull f middot
t bull middot bullbull 8 _
~ 7 I r 9
-middot- bull bull I I ~
middot 1
bull ____________________________ ___ _ bull I
bullI 1 bull middot -~ bullr
---------r- -- -- middot~-~~~~middot--middot ~ f middoti middot
bull t ~
bull
middot j
1
-------- -------- ---------------------------- ti 1
bull ~---middot ------middot ~---middotmiddotmiddotmiddot-middot--middot-middot~---middot-- ___~------- middotmiddotmiddot middot middotrbull ~ ~--~~-~middot-~ 1 middotmiddotmiddot I
middot bull middot4J middotmiddot 1 middot
middotI 1
I
bull
bull
middot ~ middotimiddot 1 bull j-1 ~ bullbull bull I bull i ~
APPROXIMATE SCALE I DESIGNED
~ BY
bullIbull Imiddot bull SOURCEmiddot EC JORDON CO RlFS middot bull Central Maine Power Company Pre-Design Work Plans SOIL I ~ t
middot
middot bullmiddot I ~middotmiddot ( bull bull REPORT DATED JUNE 1989 bullL bullr middotmiddot bull ~I middotmiddot DRAWN BY I I bull 1 r bull ~ middotmiddot middot
bull r shy~middot r i Augusta Maine OConnor Site bull SAMPLING I Imiddot 0 middot bull
bullI
bull bull
r bull 40 80
J 1bullmiddot
CHECKED BY Augusta Maine middotLOCATIONS
h cf I ~ 1bull rmiddot_
1 Inch =~Feet t--~------~---_middotmiddot~ I ~middot bullgtIbull
) i _- DATE January1991 middot middot middotmiddotmiddot tbull middot1middotmiddot APPROVED BY GE I Consultants Inc
middot
middotmiddot middot t---P-R_O_J-EC_T_9_0_39-3-----4-S-H-E-ETmiddotmiddotOfFbull t DATE REVISION BYmiddotmiddot J middotFlg3 middot
1 nuovN( POST middot 1 Nl6~1 middot bullbull Ibull Ibull bull bull lomiddot bullbull -
I
I
I
------------ -
) bull middot i bull I
~ f I middot1 bull ~I r
I
middot
-middot- CJ middotYmiddotmiddot I
C bull
middot
I middot I
middot -shy bull bull middotmiddot~
J middot _ bull y
Ibull bull
~ bull ~~ r I bull middot bull
middot bull
I ~ I I ( I bull
JI t
- I
J l I
-~ 1 I
bull j middot middot~ ~ middot) __-_ bull i
Ibull I lt bull
middotmiddotmiddot
gtImiddotmiddot
I
I bull
middotmiddotmiddotmiddot_v -
~ bull J i 1 bullbull
r 1 I ~ middotbull middotbull
I I I l~_middotgt~~bullI~~~bull~middotmiddot jbull1111 1 bull~ - 1 111 middot~ bull1 middot 1middot I jbull I bullI _- middotmiddot 1 1t1 _ 1 (Imiddot 1 bull1 1gt middot~middotlt~middot middot
I l bull bull 1 r I bull bull middot
bull middot middot middot middot~middot ~middot middot~
- J ~J ~~ O lt hj I bull ~ bull bull 1 o t I lbull I
middotmiddot bull ~ middot I bull middot bull bull
middot bull - I middot ~middot
bull 11 ( _ I
middot I Ii lfI ltI
bull
I 1- bull_ II ~ I middot
I bull vmiddotmiddot
30 I ~middot middot bull bull
lt 1 I ---middot _ bull I ~ bull bull ~ bull
II ~
111
bull bulll3 bull ~ middotmiddot bull Ibull 0 I 1 bull 111 bull bull I rbull1 middot 0 I I I - Ibullmiddot 1 bull r middot middot __ -
i bullmiddot ~ ----middot yen ~ bull ~ j
--~middot
I
I
- -- ( middotmiddot~middotmiddot- - bullbull~ _ ~- I ~ bull--- shymiddot ----bull
1- -
bullbull I I - ~ I I bull middot middot ~ I middot
1
---- _ --
bull1 II I j
I bullbullbullbull
II ~
J 1bull ~
I
bull I I bull I ~ middot Tmiddot I 1 ~ bull JI I t Ibull bull ~ bull middot
I -
-----~_ middot1
-1
~
bullbull
-
bullbull I
middot---- a I AiLWO _ middotshy
I
bull f l
I bullbull - middot I - bullbullbull
SVf1
S~D1- -0 sih3 0
I I 0 1 i ---shy (]
middot bullgt I
I J middot bull bull IIbull Iamp middot P I 177
r o ~ 0 SEol l-middot J~ I - -- ltl
f bull bull
gt1 bullI 1 V bull ~ II ~ tJ middot -middot-
I
middot1 - bull bull bull -middot
bullmiddot -bull wmiddot ~ ~ ~
bull IA1 gtW2 - gt1
- - ~ -
middotmiddotmiddot----- ~r=02 bull bullmiddot I __ i Ctt1rr--shy
bullI
Q bull _
1
D I bullbull middot - bull
SW2
I middot- bull
bullI ~middot
rl
~ se02 I bullbullbull I bullbull ~ L-lf L-- I
- ___ bull bull___ I bullbullbull
I bull ) I f IIUZ middot___ ---- bull cu bull
I gt
bullbull -shyI bull Ii bull f
~ middotmiddot~ ~ middot - I
I bull ~ ) I~ shy bullfmiddot~ ~ i ~ ~middot
~ I 1
bull 4 Ot f I
1 i f ~ bull lt
1
bull bull I
___ - ~)____ - ------~ -------middot-middot-r--middot-middot ----middot- - ---middot-middot-middot-middotbull
t t - -- a
I middot bull -- middot - __ __--~~~=--~---_-~= _ _ middot - I ii- - ~~=-=~==--=~middotmiddot-~=~~~~~~=-~~~======middot=middot~middot== middotmiddot-- _ - I
bull -------------------~_
t ~middot middot middot middotbull bull middot i------------1I Imiddot ~~f~=-~~J~i~~~f~U+--f~~~===~~-~~middot~f~=~=~=~~fi~-~-~==~~-==~==~~==~====~==~-=-==~=~=2~~~~~~~77=~=~=~~-=~s)middot==~~~--=-=~~~=~=~====-=====~~=~~~~~=~=~=~==~==-=~=~=middot
middot 7gt JloltGKLA lllD --- shy l lf-nt RT n bull middotl bull
I
-i~------ - -- -------- -- --= bull (
( ei -~ ---- -------- - - - - - bull - shyI bull middot 1 ------
--------~____-____ bull SSmiddotsmiddot~middot2-iJi_8plusmn~plusmn-~~plusmn=+=~==-=-==~~===~~~~~~=-=s~~2~-~s-==~~~z--==~=~~t-=-=-=-==-=---~34~~~-==-=-==-==~=middot==---~=-middot~i~middotmiddot~ middot)~ f ________bull _
~--- __ - ____ - bull shyI I
bull __ _ ~ ~ ~ middott1 middot_
J(J--_ 11bull middot ------deg gt
middot -f ~~~se~middot~ARm~OMAarra~PERfOAMagtBY 0 middot~ bullO ( l r
r-------------liDElmiNEiiiiY-r---Amiddot----------________---~-------------_____ __________middotmiddot_lIbull middotmiddotmiddot ACHERON ENOINEERINCI 8ERVJCED COMPLIED IU8lo BASll MAP
(middot VERIFIED TO MEET NATIONAL MAP ACCUAACI 8TANOARD8(NMJ) middot Tl1ROUQltATEaT GURVltY CONOUCIED Df JORDM 121aa LEG~ APPROXJMATESCALE DESIGNED BY
-----------_ ---------~ CentralMalnePowerCompany p D W kPI middotSURFACEWATERANDmiddotmiddot_-~middotmiddot~~~middotFitow~middot~(TOO~MEETNMAamp DRAwN BY re- es1gn or ans middot middot middot shy bull bull bull - bull
bull Aug~sta Maine OConnor Sitamiddot SEDIMENT SAMPLING middot3middot~~~middot~--~~amCla~~~~~~usa-o middot O GEISEDIMEITTSAMPUN~LOCATI~Ns o 40 middot 80 1
BY LOCATIONS ~middot)~middot ~ bull 11i GEISURFACEWATERSAMPUNGLOCATIONS middot CHECKE
rh A~gustaMalne lt middotmiddot( middotmiddot 11nch-40Feet DATEmiddot January 1991
middot APPRovED BY -V GEi Consultants Inc ~ Imiddotgtmiddotgt middotmiddot middot middot souRCE EC JORDON co RlFS bull middot GEi COMPOSITE SEDIMENT SAMPLE bull DATE REVISION BY - PROJECT 90393 SHEET OF middotI middotmiddot middotI middotAEPORTDATEDJUNE1989 v COUECTEDFORBENCH-SCAIETESTING
I J ~ I
i I bull I )__ )
I I ilo I Ibull
X -4 mdashmdash-0shy
W A Elec-Zl lt4W
Meters Shelves ^ Pickup
A CapAntique a)
W WAutomobile W J
ia iW Y
W A o
LEGEND C w
Stove - wBoat X Designated Wall Label w
-e- -fr bulleshybull Cement SlabDust Sample
0 Wooden Wall Sample ZTaping Reference Origin
W Wipe Sample
Approximate Scale
NOTES 30 Feet
1 Ail locations on this plan are approximate
2 Sample locations are general Central Maine Power Company Pre-Design Work Hans EXAMPLE examples of the type of sampling Augusta Maine OConnor Site BARN SAMPLINGand the distribution Augusta Maine LOCATIONS
3 Revision No 1 (3-28-91) ltP G E I C o n s u l t a n t s I n c Project 90393336 January 1990 Fig 5
I I I I
I
I I
I
I
I
I
I
Document VoL II SC SAP Appendix A Revision 0
Date January 171991 Page 1
V
APPENDIX A zgt
s HEALTH AND SAFETY-PLAN
Source Control PrampDesign Studies CConnorCO^Site
Augusta Mkine shy_ lt
lt
NT lt
Document Vol II SC SAP Appendix A Revision 0
Date January 171991 Page 2
GEI CONSULTANTS INC SITE HEALTH AND SAFETY PLAN
Site Name OConnor Co Site
Site address Street Route 17 Qty Augusta State Maine
Proposed Site Activities Source Controlsampling of surface andsubsurface soilssediments surface water and the on-site barn
Proposed Date of Work April 1991 gt S
Original Safety Plan YES
Site Safety Coordinator Thomas S Bobowski
Client Central Maine Power Company^(CMP)
Site Contact Charles Nickerson (CMP)
Team PERSONNEL ^ IRESPONSIBILITIES Robert E Stetkar lt ^mjectManager Joanne O Morin Work Tlans and Pre-Design Studies Manager Richard F Murdock Qhality Assurance Officer Benjamin YSu Treatability Studies Manager Joseph G Engels Technical Consultant Steven R fcambx Source Control Sampling Task Manager Thomas S Bobowski7 Barn Sampling Coordinator Sampling Boyd P Smith Sampling Christopher L Covel Sampling William J Haswell Sampling Charles Blodgett Field Screening Analytical
Background Information
The OConnor Co Site (Site) covers approximately a 9-acre portion of a 65-acre parcel within the city limits of Augusta Maine The Site is surrounded by sparsely-developed residential or agricultural properties or undeveloped woods and wetlands (Riggs Brook and associated wetlands border the Site to the east) The F OConnor Co operated a transformer stripping and recycling operation on theSite from the1950s through the 1970s
Document VoL II SC SAP Appendix A Revision 0
Date January 171991 Page 3
During operations releases of wastes including PCB-laden oils resulted in contamination of water and soil on the site Principal features of the Site include a barn which formerly housed scrap operations an upland marsh formed by man-made disruption of natural surface water drainage upper and lower surfacewater impoundments (lagoons) constructed to control migration of oils from the Site a low area where excavated lagoon sediments were deposited within a clay liner three former transformer work areas a former scrap yard and a wetland associated with Riggs Brook A site plan depicting some of the major features of the site is shown in Figure HS-1
Ax In 1986 and 1987 remedial investigations were performed byECvJdrdan Co for Central Maine Power Company (CMP) These investigations included over^OQ soil samples 11 monitoring wells and analysesof surface water ground water sediment and biota for PCBs organic and inorganic chemicals The primary contaminantsdetected in soil and sediments at the Site were PCBs PAHs and Lead Chlorinated benzenes PCBs phthalates and to a lesser extent volatile organics and metals were detected in ground water and PCBs and metals were detected in surface water Using these data Clement AssociatesInc performed an Endangerment Assessment in 1988 for EPA^evaluating risks to human health and the environment associated with existing condiuoi^ra^Tuture conditions related to a noshyaction remedial alternative In 1989 EC JordabCoi acting as consultant to CMP completed a Feasibility Study which evaluated remedial alternatives based on information provided in their earlier Remedial Investigation Report and in the EPA Risk Assessment Report After receipt of the Feasibility^Stiidy Report EPA issued a Record of Decision (ROD) in September 1989 describihg the^EPA^elected remedial alternatives for source control and management of migration
Site Status Waste Types
Includes the followin
Ground water Surface water Sediment Soils On-site structures
Refer to Table1for listing of chemicals of concern during Source Control studies per media sampled
Document VoL H SC SAP Appendix A Revision 0
Date January 171991 Page 4
Hazard Evaluation
Known orSuspected HazardousToxicMaterials Polychlorinated biphenyls (PCBs)volatile organic compounds (VOCs) polycyclic aromatic hydrocarbons (PAHs) and metals (especially Lead) The ranges of concentrations of chemicals detected in all source control media on-site are presented in the attached Tables 1C through 1L from previous studies Concentrations of PCBs PAHs and Lead detected in surficial soikduring previous studies (including the on-site Barn) are shown in Figures HS-2 HS^3 and HS-4 respectively Concentrations of chemicals detected in surface water and sediihentsduring previousstudies are shown in Figure HS-5 lt( x
The primary concern at the Site is contamination of surface soils by spillage or leakage of transformer oils containing PCBs The potential forencountering concentrated wastes in the transformer work areas (TWA I TWA II andltTWAIlI) is high In addition wastes have also been identified in soils and sediments associatedwith the lagoons and drainage swales Within a short distance of these discrete areas of the site the potential for encountering significant concentrations of wastes-is low ToYeduce the likelihood of being exposed by wastes associated with these areasduring~source control sampling activities efforts should be made to avoid walking unnecessgrilyriiv these areas
Exposure to hazards from chemiealsduiing test plying and environmental sampling and analysis tasks are most likely to occurbyone-or more of the following
1 Direct contact with contaminated surficial and subsurface soils sediments or surface-water x N
mdashN2 Inhalation of fu^Uve^ust carrying contaminants
3 Inhalation of volatile orgsuuc compound vapors while test pitting or sampling the various media on-site
Toxic and Pharmacological Effects Refer to the NIOSH Guide to Chemical Hazard Table 2 lists the major chemicals of concern and their toxic and pharmacological effects Acute exposure to PCBs PAHs Lead and VOCs may result in dizziness or nausea The results of chronic exposure may include but are not limited to central nervous system depression liver and kidney damage and irritation of skin eyes and respiratory passages Many PCBs PAHs and VOCs are known or suspected carcinogens Routes of exposure include inhalation topical and ingestion
Document Vol II SC SAP Appendix A Revision 1
Date March 28 1991 Page 5
Heat-related illnesses range from heat fatigue to heat stroke the latter being the most serious Heat stroke requires prompt treatment to prevent irreversible damage to health Protective clothing may have to be cut off Less serious forms of heat stress require prompt attention to prevent further complications which may lead to heat stroke Unless the victim is obviously contaminated decontamination procedures should be omitted or minimized so that treatment may begin immediately
Hypothermia may result from personnel exposed to excessive cold during sampling operations Hypothermia requires prompt treatment to prevent serious damage to health Damp or wet clothing may have to be cut off and the persons body temperature must be elevated as soon as possible through the use of warm blankets or another persons body warmth Unless the victim is obviously contaminated decontamination procedures should be omitted or minimized so that treatment may begin immediately
Area Within Augusta Maine city limits
Proposed On-Site Activities Test pitting boring or hand augering for collection of surface and subsurface soil samples collection of sediment and surface water samples from an inflatable boat or from wading into the water with hip-boots and collection of samples from within the on-site Barn Potential physical safety hazards during each of the four proposed Source Control site activities are discussed per activity below
Test Pitting and Borings for Surface and Subsurface Soil Samples A backhoe will be used during test pitting operations to excavate soil for collection of samples The most significant hazard during this sampling effort is the potential for collapse of the excavation while sampling Therefore in accordance with OSHA and 29CFR1926 Subpart P if personnel are required to enter an excavation the excavation will be no deeper than 5 feet unless it is braced or sloped back For the Type A soils documented on-site (eg clay and glacial till) the required slope from the ground surface to the top of unbraced portion of the excavation in all directions is 05 HORIZONTAL 1 VERTICAL Short-term excavations of this type will not exceed 12 feet in depth In general a drilling rig will likely be used to obtain samples from depths below 5 feet by augering to a specified depth and using a split-spoon sampler
Document Vol H SC SAP Appendix A Revision 1
Date March 28 1991 Page 6
Other physical hazards during test pitting and boring operations include the presence of overhead objects (eg backhoe bucket) so hard hats must be worn during these tasks at all times In addition the potential for spreading contamination with fugitive dust during excavation and mobilization between sampling locations is much greater than during other Source Control sampling efforts Therefore Level C dermal and respiratory equipment must be worn during all test pitting and boring operations (see below) Additional decontamination procedures will be required between sampling areas to limit the potential for cross-contamination (see below)
Sediment and Surface Water Sampling These operations will be conducted using Level C dermal protection only The need for respiratory protection will be based on criteria discussed in the next section In order to collect sediment and surface water samples in interior portions of the Upland Marsh and Upper and Lower Lagoons an inflatable boat or hip-boots will be used Further sampling will be performed by walking along the shores of the surface water bodies while dragging a sediment sampler These operations involve the risk of falling in relatively deep water while equipped with Level C dermal protection This equipment may limit movement and may inhibit a person from swimming easily to safety Therefore while sampling with the boat a Coast Guard Approved life vest will be worn at all times In addition one person will standby on-shore to observe the boat operation and to assist in the event of a mishap Depending on the water and air temperature at the time of sampling it is possible that a person who had fallen in water may require treatment for hypothermia or shock
Barn Sampling The barn can be classified as a confined work space since it is fully enclosed and has a limited number of exits In order to operate safely in a confined work space special considerations are necessary Unlike some confined spaces the barn has numerous small openings in the wooden structure to allow for an adequate supply of air while collecting samples However the sampling effort will likely generate a significant amount of airborne dust within the barn which means that Level C dermal and respiratory protection must be worn at all times while in the barn One person will remain outside the barn during the sampling effort to observe the sampling personnel and to provide backup services Two Combination Type A-B-C fire extinguishers capable of extinguishing wood and paper flammable liquidis or electrical fires will be available (one inside and one outside the barn with the standby person) in the unlikely event of a fire occurring during sampling
Document VoL H SC SAP Appendix A Revision 0
Date January 171991 Page 7
In accordance with OSHA 29CFR1910120 a minimum lighting intensity of 5 foot
candles will be provided within the barn during sampling The creation of dust and the
low lighting which may be available in some areas of the barn is likely to limit vision
some of the time Special care must be taken to avoid tripping over the numerous
objects disposed of within the barn No electricity is available in the barn so power
will come from outside the barn to supply power for lighting and tools to be used in
the sampling effort This means that electrical extension cords will be laid out on the
floor to various sampling locations In addition a large amount of metal and wooden
debris exists within die barn which may become obstacles to free movement in certain
areas The wooden floors of the second story and loft ofxthe^arn are extremely
deteriorated in some places and should not be accessed unless authorized by the Site
Safety Coordinator v
The use of electric power tools to collect samples ^wobd boring and concrete drills) require special care The use of Level C dermal protection such as loose fitting gloves may make handling the drills more difficult Use speciaLcare to avoid contacting the moving bits of the drills while in operation tonvoid tearing tyveks or gloves If dermal protection is torn replace or patch it immediatelybefare proceeding with the sampling operation
Perimeter Establishment
MapSketch Attached See bdquo Perimeter Identified Access to site is restricted at all entry points via a locked
8-foot high cyclone fence^- x y
Zone(S) of contamination identified See Figure HS-1 through HS-5
Document Vol II SC SAP Appendix A Revision 1
Date March 28 1991 Page 8
Recommended Level(s) of Protection On-site personnel will use Level C dermal protection at all times See below for respiratory use
1 Protective Clothing
Sampling and decontamination personnel in these areas will wear
bull Disposable Tyvek coveralls over cotton coveralls bull Tyvek hoods bull Safety glasses or face shield bull Hard Hat bull Disposable booties over workbooks or waders for sampling surface water and
sediments bull Butyl rubber gloves over surgical gloves bull All gloves and booties will be taped to the Tyvek coveralls
2 Respiratory Protection
Air purifying respirators will be worn at all times while sampling during test pitting and boring operations and while inside the barn Otherwise the need for respiratory protection will be determined by on-site monitoring for organic vapors and the daily potential for exposure to airborne particulates The decision to utilize air-purifying respirators due to airborne particulates will be made by monitoring with a MIE MINIRAM Hand-held Aerosol Monitor (HAM) Based on previous studies (Endangerment Assessment Appendix F) an action level for worker safety of 10 mgm3 of respirable dust was established for the site Therefore when readings on the MINIRAM of 10 mgm3or greater are experienced Level C respirators will be worn Initial on-site monitoring for organic vapors will be conducted using an HNu Photoionization Detector (PID) Ambient vapor levels of 5 to 10 ppm above background in the breathing space will require the use of full-face cartridge respirators (Level C Protection) Background levels will be determined at the edge of the Site (ie fence line) before the initiation of the days activities Air quality will be monitored at the upwind boundary of the site at three locationsfor a duration of one minute at each location The maximum PID reading at each location will be recorded and the three readings will be averaged to determine the background level for that day Respiratory protection will be full-face respirators fitted with combined organic vapor and high-efficiency particulate cartridges (MSA Type GMA-F) Respirator cartridges will be replaced at a minimum on a daily basis Depending on readings obtained with the MINIRAM cartridges may be replaced at mid-day on windy days
Levels of organic vapors greater than 10 ppm above background in working areas will necessitate utilization of self-contained breathing apparatus (Level B Protection) During sampling HNu monitoring should be utilized to detect any changes in organic vapor levels Changes in fugitive dust or vapor level detection at any time may warrant appropriate alteration of required respiratory protection
Document VoL H SC SAP Appendix A Revision 0
Date January 171991 Page 9
Decontamination and Disposal
A decontamination areawill be assembled at the entrance to the site The decontamination zones will be established such that personnel and equipment are fully decontaminated prior to leaving the fenced area In addition all personnel will be familiar with proper decontamination procedures prior to going on site All personnel entering and exiting the hot zone shall pass through the decontamination zone
1 Personnel Decontamination
The personnel decontamination sequence is as follows
a Samples and equipment are dropped on plastic sheets
b Disposable booties Tyvek coveralls and contaminated outer gloves are first brushed off with soapy water then rinsed with clean water by decontamination personnel Thedisposable equipmenfis^then removed baggedand placed in a 55shygallon drum marked Dry Deconv
c Neoprene boots and outer gloves are washed if they were not drummed in Step b with soapy water and ririseck with clean water An additional rinse with methanol followed by a firiak water-rinse completes the sequence
lt d Neoprene boots and glovesare -removed
e Respirators (cartridge-change) are removed if necessary and disposed in the Dry Decon drum
f Surgical gloves are temovfedand disposed in the Diy Decon drum
Document Vol M SC SAP Appendix A Revision 0
Date January 17 1991 Page 10
2 Equipment Decontamination
The equipment decontamination procedure for Source Control sampling work performed inside the fenced area of the site is as follows
a All disposable items (eg surgical gloves plastic sheeting nylon brushes etc) will be discarded in the Dry Decon drum
b Heavy equipment such as the backhoe and drilling jig will be steam-cleaned on a specially constructed decontamination pad located east bfthermain site access gate and north of the ground water monitoring well couplet MW1Q2A and MW102B (see Figure HS-7) The pad will be constructed to allow for drainage of steam-cleaning solutions onto a bermed multi-layer -impermeable barrier consisting of several layers of at least 6-mil-thick polyethylene sheeting overlain and underlain by geotextile fabric The geotextile fabricwilfbe designed to collect contaminated sediments which may have collected on tires or excavating equipment Rinse water from the decontamination processwill then fre pumped through hoses or channelled for drainage into the Uppei^La^oomafter completion of surface water and sediment sampling The decontamination pad will be left in place after completion of field sampling
c All other equipment contacting surface or subsurface soils sediments surface water or materials within thebarm(egtrowels spatulas templates drill bits etc) will be decontaminated by rinsing with clean water scrubbing with methanol and re-rinsing with distilledwater Solutions which contain methanol will be collected for disposal into tHeJWet Decon drum Equipment used during barn sampling will then be drted^with paper towels and the towels will be disposed in the Dry Decon drum ^
3 Decontamination Station Closure
The procedure for decontamination station closure will be as follows
a Decontamination personnel shall be responsible for closing the station at the end of each workday
b All solid wastes such as plastic tarps bags and Tyveks will be placed in the Dry Decon drum and will be closed at die end of each workday
Document Vol IISC SAP Appendix A Revision 0
Date January 171991 Page 11
All spent decontamination solutions containing methanol will bedisposed of in the Wet Decon drum Decontamination solutions which are not composed of methanol and exhibiting PID readings below 1 ppm will be poured into surficial soils on the edge of TWA I within the fenced area of the site If PID readings are greater than 1 ppm the solutions will be disposed in the Wet Decon drum These drums will be closed at the end of each workday
d Drums shall be secured on-site until proper disposal is arranged after consultation with EPA
7 Air Monitoring Procedures X
Site Monitoring Equipment PID HNu PI-101 HAM MIE MINIRAM
Since Level C respirators will be used during test pitting and barn sampling air at the test pit and barn sampling areas will be monitoredfegularly with a PID and HAM primarily for future reference of the levels of VOCs and dustto^be expected during remedial activities During the other sampling efforts air monitoring wiH form the basis for whether an upgrade to Level C respiratory equipment is necessary TheltPID will be used regularly during soil sediment and surface water sampling^ TKampHAM will be used at least twice per hour while on-site to monitor for dust levels in air^Whenunusually windy conditions are experienced additional monitoring for dust levels wilLbe^erfbrmed When ambient temperatures in air are below 32deg F the chart recorderattachment for the MINIRAM must be used as the LED readout on the instrument may not operate below freezing All PID and HAM readings will be recorded in theJield Log Book
Document VoL H SC SAP Appendix A Revision 0
Date January 171991 Page 12
Emergency Information
Location Phone
FIRE Augusta (207) 623-2511
POLICE Augusta (207) 623-2511 State Police (Augusta) (207) 621-1200
AMBULANCE Augusta (207) 623-25tlx N
HOSPITAL Kennebec Valley Medical Center (207) 626-1000 Augusta Division N 6 East Chestnut Augusta ME
Chemical Trauma Capability Yes
EPA (Michael Jasinski) 7) 573-5786
DEP (Thomas Benn) (207) 289-2651
CMP (Charles Nickerson) (207) 623-3521
Directions to Hospital (See Fig HS-6)
Primary route to hospital is west on Route17 (Eastern Avenue) to Arsenal Avenue turn right on Arsenal Avenue and go3 blocks to E Chestnut street then right Emergency room entrance is 6 East Chestnut Street Alternate route - west on Route 17 (100 yards) to Cony Road turn right on Cony Road take^rst left (Cony Street Ext) to Riverside Drive go left on Riverside Drive the second mtejsection will be Arsenal Street goleft on Arsenal Street East Chestnut Street will be second left
Document VoL H SC SAP Appendix A Revision 0
Date January 171991 Page 13
Additional Emergency Contacts
DR DAVID EGILMAN (617) 935-8581 HEALTH RESOURCES WOBURN MASSACHUSETTS
GEI CONSULTANTS INC
ROBERT E STETKAR (603) 224-7979 JOSEPH G ENGELS (617)721^4022 s
TSCA HOTLINE (800)424-9065
AT amp F (EXPLOSIVES INFO) (800^424-9555 V
NATIONAL RESPONSE CENTER x(8W) 424-8802
PESTICIDE INFORMATION SERVICE (800)845-7633
RCRA HOTLINE y -(800) 424-9346
CMA CHEMICAL REFERRAL CENTER (800) 262-8200V NATIONAL POISON CONTROL CENTER (800) 942-5969-y
US DOT bdquo (202) 366-0656
GEI CONSULTANTS ^ (603) 224-7979
Prepared by Thomas S Bobowski Date January 7 1991
Reviewed by Robert E Stetkar Date January 9 1991
All personnel working at this site have received OSHA required health and safety training Personnel are enrolled in a medical monitoring program A summary of training completed for all GEI personnel involved in the Source Control sampling program is provided in Table 3
Use of Common Sense is Required
I have read and understand this safety plan
Name (printed) Signature Date
Table 1A Organic and Inorganic Chemicals Detected in the Shallow Aquifer
Groundwater Samples at the F OConnor Site Maximum
Concentration Geometric Background
Range Mean[a] Concentration (ugL)
Chemical Frequency (ugL) (ugL)
ND(b]-2300B[c] 150 NDAcetone 211 ND-15J[d] NA[e] NDBenzene 211 ND-45 143 ND2-Butanone 17 ND-83 53 NDChlorobenzene 311 ND-53 NA NDToluene 27 ND-12J NA NDTriehloroethene 1P ND-11 81 NDBis(2-Ethylhexyl)Phthalate 411 ND-25 1deglaquo2 ND12-Dichlorobenzene 411 ND-14J 97 ND13-Dichlorobenzene 311 ND-13J 96 ND14-Dichlorobenzene 311 ND-29 94 ND124-Trichlorobenzene 17 ND-19 07 NDTotal PCBs 111 27-5085 06 49Aluminum 55 27-805 24 42Barium 55 13700-125451 38300 26600Calcium 55 ND-145 53 NDChromium 25 ND-37 NA NDCobalt 15 ND-285 66 14Copper 35 33-4952J 590 3Iron 55 ND-18 37 NDLead 15 21-2906 260 24Manganese 55 ND-154 10 NDNickel 15 ND-17 37 NDSilver 15 10593-72812 33400 14000Sodium 55 ND-71 71 NDVanadium 15 17-946 263 91Zinc 55
a) Calculated using detected concentrations and one-half of EPAs contract laboratory program (CLP) detection limits for the organics For the inorganic
chemicals the aqueous CLP detection limits were used
b) ND - Not Detected
c) B designates Chat substance was also found in the blank though the
sample level was significantly higher to prove a positive detect
d) J designates estimated value
e) NA - Not applicable Chemical was detected infrequently and the use of
one-half of the detection limit in calculating a mean results in a mean
concentration that exceeds the maximum Therefore a mean is not used
SourceEndangerment Assessment dated Jan 29 1988 by CDM
Table IB Organic and Inorganic Chemicals Detected in Bedrock Aquifer
Groundwater Samples at the F OConnor Site
Mean Concentration Geometric Background
Chemical Frequency Range (ugL)
Mean[a] (ugL)
Concentration (ugL)
Acetone 220 ND[b]-1200 68 ND Benzene 220 ND-27J[c] NA(d] ND Chloroblt ene 620 ND-16 36 ND Toluene 215 ND-27J NA ND Bis(2-E vlhexyl)Phthalate 1320 ND-64 Hi 61 12-Dich 13-Dic^
irobenzene jrobenzene
720 120
ND-26 ND-24J NA
66 ND ND
14-Dic^ robenzene 620 ND-44 82 ND Di-n-Bu phthalate 120 ND-22J NA ND 124-Tr hlorooenzene 720 ND-310 161 ND N-Nitros iiphenvlamine 25 ND-4J NA ND 3eta-BHC 110 ND-04 004 ND Gamma-BH (Lindane) 110 ND-006 003 ND Total PC 320 ND-50 LO ND Antimony 110 ND-55 19 ND Barium 1010 15-129 138 56 Chromium 410 ND-268 54 ND Cobalt 110 ND-115 92 ND Iron 1010 61-384301 837 152 Magnesiu Manganes
1010 810
5960-46250 ND-5895
15220 661
4203
27 Nickel 310 ND-345 125 ND Potassiu 1010 3504-16046 6560 4340 Vanadium 110 ND-52 NA ND
a) Calcul ted using detected concentrations and one-half of EPAs contract labor 3ry program (CLP) detection limits for the organics For the inorganic chemic Is the aqueous CLP detection limits were used
b) ND mdash F detected
c) J de Ignates estimated value
d) NA - N applicable Chemical was detected infrequently and the use of one-ha of the detection limit in calculating a mean-results in a mean concern ation that exceeds the maximum Therefore a mean is not used
Source Endangerment Assessment dated Jan 29 1988 by COM
Table 1C Organic and Inorganic Chemicals Detected in In-Fence Surface Soil
Samples at the F OConnor Site Mean
Concentration Geometric Background Range Mean[a] Concentration
Chemical Frequency (ugAg) (ugkg) (ugAg)
19 ND[b]-19J[c] NA[d] ND Chicroform ND29 ND-150B[e] 63Methylene Chloride
ND19 ND-30J NAToluene 260J19 ND-917J 260Bis(2-Ethylhexyl)Phrhalate
Carcinogenic PAHs ND19 ND-2700J 290BenzoltAgtAnthracene ND29 ND-12000J ^10BenzoltB or KgtFluoranthene ND39 ND-11000J 540Chrysene ND39 ND-23183Total CPAHs
Non-carcinogenic PAHs ND39 ND-12000J 540Pvrene ND39 ND-12000 540Total NCPAHs ND118186 ND-6205600 3400 Total PCBs 4001419 ND-64000 1900Cadmium 292001919 17000-29480000 275000
Copper 570001919 29000-2681000 213000Lead 252001919 19000-90000 35000Nickel ND219 ND-12000 650Silver 738001919 45000-1160000 183000Zinc
aj Calculated using detected concentrations and one-half of EPAs contract UboSto program (CLP) detection Unite for the organic For the inorgar-c chemicals the detection limits for soils were based on aqueous CLP
detection limit
b) ND - Not Detected
c) J designates estimated value
d) NA - Not applicable Chemical was detected infrequently and the use of one-half of the detection limit in calculating a mean results in a mean concentration that exceeds the maximum Therefore a mean is not used
e) B designates that substance was also found inthe blank though the sample level was significantly higher to prove a positive detect
Source Endangerment Assessment dated Jan 29 1988 by Clement Associates Inc
Table ID
Organic and Inorganic Chemicals Detected in the TVA III Surface Soil Samples at the F OConnor Site
Concentration Geometric Background Range Meanfa] Concentration
Chemical Frequency (ugAg) (ugAg) (ugAg)
44-DDT 13 ND[b]-5200 150 ND 44-DDE 13 ND-260 56 ND Total PCBs 2131 ND-620000 2940 ND
Antimony 11 189000 41000
Cadmium 11 11000 400 Copper 11 230000 29200 Iron 11 60900000 22200000 Lead 11 634000 57000 Zinc 11 799000 73800
a) Calculated using detected concentrations and one-half of
ErAs contract laboratory program (CLP) detection limits
b) ND - Not Detected
Source Endangerment Assessment dated Jan 29 1988 by Clement Associates Inc
Table IE irganic Chemicals Detected in Upland Marsh Sediment
Samples at the F OConnor Site[a] Maximum
Concentration Geometric Background Range Mean[b] Concentration
Che ical Frequency (ugAg) (ugAg) (ugAg)
To ane 11 23J[c] - ND[d] To- 1 PCBs 33 1300-34000 6425 ND
a) norganic chemicals were also analyzed for but none were itected significantly above background concentration
b) alculated using detected concentrations and one-half of PAs contract laboratory program (CLP) detection limits
c) J designates estimated value
d) D - Not Detected
Source Endangerment Assessment dated Jan 29 1988 by Clement Associates Inc
Chemical
Acetone 11 408B[c] ND[d]
Bis(2-EthyIhexy1)Phthalate 11 2082 ND
Toluene 11 28J[e](f] ND
Total PCBs 44 30000-1100000 381000 ND
a) Inorganic chemicals were also analyzed for but none were detected
significantly above background concentration
b) Calculated using detected concentrations and one-half of EPAs contract
laboratory program (CLP) detection limits
c) B designates that substance was also found in the blank though the sample
level was significantly higher to prove a positive detect
d) ND - Not Detected
e) J designates estimated value
f) In a duplicate sample toluene was not detected A geometric mean of the detected value and one-half of the detection limit would have resulted
in a mean concentration exceeding the detected value Therefore only
the detected value is listed
Source Endangerment Assessment dated Jan 29 1988 by Clement Associates Inc
Table 1G Organic and Inorganic Chemicals Detected in Lower Lagoon Sediment
Samples at the F OConnor Site Maximum
Concentration Geometric Background Range Mean(a] Concentration
Chemical Frequency (ugAg) (ugAg) (ugAg)
Bis(2-Ethylhexyl)Phthalate 12 ND[b]-100J[c] NA[d] ND
Benzoic Acid 22 120J-190J 150 ND Total PCBs 77 3202-40100 8660 ND
Cadmium 12 ND-2500 790 ND c 22 27000-59000 40000 20000
Lead 22 17000-70000 34500 ND
Manganese 22 525000-982000 718000 474000
Selenium 12 ND-760 436 ND Zinc 22 103000-249000 160000 108000
a)Calculated using detected concentrations and one-half of EPAs contract laboratory program (CLP) detection limits for the organic For the inorgan chemicals the detection limits for sediments were based on the aqueous CLP
detection limit
b) ND - Not Detected
c) J designates estimated value
d) NA - Not Applicable Chemical was detected infrequently and the use of
one-half of the detection limit in calculating a mean results in a mean
concentration that exceeds the maximum Therefore a mean is not used
Source Endangerment Assessment dated Jan 29 1988 by Clement Associates Inc
Table 1H Organic and Inorganic Chemicals Detected in Riggs Brook Sediment
Samples at the F OConnor Site Maximum
Concentration Geometric Background
Range Mean[a] Concentration
Frequency (ugAg) (ugkg) (ugAg)Chemical
12 ND[b]-30 12 NDMethylene Chloride
Carcinogenic PAHs 22 160J[c]-790 360 230JBenzoltAgtAnthracene 22 220J-800 420 290JBenzoltAgtPyrene 22 2-63J-1600 650 710J3enzoltB or KgtFluoranthene 22 280J-960 520 400J
Chrysene 12 ND-190J NA[d] NDDibenzltAHgtAnthraeene 12 ND-400J 340 NDIndenoCl23-CDgtPyrene 22 1507-4740 2670 2402Total CPAHs
Non-carcinogenic PAHs 12 ND-110J NA NDAcenapthy1ene 12 ND-200J NA NDAnthracene 12 ND-410J 350 ND
BenzoltGHIgtPerylene 22 280J-1200 580 420J
Fluoranthene 12 ND-80J NA NDFluorene 22 72J-680 220 150J
Phenanthrene 22 290J-1500 660 470J
Pyrene 22 1810-4180 2750 2584Total NCPAHs 615 ND-6481 870 NDTotal PCBs 12 ND-1200 775 NDSilver
a) Calculated using detected concentrations and one-half of EPAs contract laboratory program (CLP) detection limits for the organics For the degrgan chemicals the detection limits for sediments were based on the aqueous CLP
detection limits
b) ND - Not detected
c) J designates estimated value
d) NA - Not applicable Chemical was detected infrequently and the use of one-half of the detection limit in calculating a mean results in a mean
concentration that exceeds the maximum Therefore a mean is not used
Source Endangerment Assessment dated Jan 29 1988 by Clement Associates Inc
Table II Inorganic Chemicals Detected in Upland Marsh Surface
Water Samples at the F OConnor Site[a]
Sample Background
Concentration Concentration
Chemical Frequency (ugL) (ugL)
Aluminum 11 884 104 Arsenic 11 35 ND(10)[b]
Barium 11 12 47 Iron 11 3540 1160 Lead 11 36 ND(5)
Manganese 11 ^29 134 Potassium 11 7260 3610
a) Organic chemicals were also analyzed for but
none were detected
b) ND - Not Detected Limits of detection are
given in parentheses
Table 1J Organic and Inorganic Chemicals Detected in Upper Lagoon
Surface Water Samples at the F OConnor Site
Sample Background
Concentration Concentration
Chemical Frequency (ugL) (ugL)
108 ND(10)[a]Total PCBs 11 47Barium 11 23
6 ND(5)Lead 11 Manganese 11 1450 134
25 ND(40)Nickel 11
a) ND - Not Detected Limits of detection are given in
parentheses
Source Endangerment Assessment dated Jan 29 1988 by Clement Associates Inc
Table IK Organic and Inorganic Chemicals Detected in Lover Lagoon
Surface Water Samples at the F OConnor Site Maximum
Concentration Geometric Background Range Mean[a] Concentration
Chemical Frequency (ugL) (ugL) (ugL)
Total PCBs 22 13-375 221 ND[b] Aluminum 22 56-3740 458 104
Arsenic 12 ND-4 NA[c] ND
Barium 22 12-37 67 47
Cobalt 12 ND-9 NA ND Iron 22 1970-8260 4030 1160
Lead 22 91-13 109 ND
Manganese 22 137-2330 565 134 Potassium 22 5200-6220 5690 3610
a) Calculated using detected concentrations and one-half of EPAs
contract laboratory program (CLP) detection limits for the organics For the inorganic chemicals the aqueous CLP detection
limits were used
b) ND - Not Detected
c) NA - Not Applicable Chemical was detected infrequently and the
use of one-half of the detection limit in calculating a mean
results in a mean concentration that exceeds the maximum
Therefore a mean is not used
Table 1L
Inorganic Chemicals Detected in Riggs Brook Surface Water Samples at the F OConnor Site[a]
Maximum
Concentration Geometric Background Range Mean[b] Concentration
Chemical Frequency (ugL) (ugL) (UgL)
32 NDAntimony 13 ND[c]-35 5 NDLead 13 ND-16
a) Organic chemicals were also analyzed for but none were detected
b) Calculated using detected concentrations and one-half of EPA s
contract laboratory program (CLP) aqueous detection limits
c) ND - Not Detected
Source Endangerment Assessment dated Jan 29 1988 by Clement Associates Inc
Chemical
Acetone |CHCOCH3l Dimethyl ketone ketone propane
Toluene |CHCHJ _ e bull bull a O J Jtoluol phenyl aethane aethyl benzene
Cblorobcnzene (CHC1) aonochlorobenzene chlorobenzol
Ethyl benzene |C_HCH| phenyl ethane ethyl benzol
ACC TLV or STEL
ltPPB) (PfB)
750 1000
100 150 skin
75 (550agaraquo)
100 125
TABLE 2 CHEMICAL TOXICITY AND OTHER INFORMATION
Physical Skill Dcraal LD^ (mgkg) State Penetration Tonicity Potency ofraquoI(rat)
bullbullbull local it 9750liquid Bint-like odor
1297(nice)
liquid t local 5000
TC|Huosn =Ml00 ppa
colorless liquid 2910
colorless liquid local H 3500 with aromatic odor
syatcaatic bullbullbull TCu(Kiais) c 100 ppa
A hrs
Page 1 of 4
Remarks
Syaptoas Irritates eyea none throat narcotic in high concentrations
Target Organ respiratory aystea skin
First Aid Swallow water voait Skin soap wash
Incoapatibilities oxidizing materials acids Fire hazard when csposed to beat or flame
Tonicity 1 Persistence1 0
Syaptoas fatigue confusion euphoria dizzy headache dialated pupils lack of appetite nervousness insoania
Target organ CNS liver kidneys skin
First Aid Swallow NO VOHIT 8kln soap waah
Incoapatibilities strong ozldizers
Toxicity1 2 Persistence 1
Syaptoas irritates eyes nose causes drowsiness incoordination skin irritation
Target organ respiratory systea eyes skin cars liver
First Aid NO VOMIT
Incoapatibilities strong oxidizers reacts violently with AgClO^
Toxicity 2 Persistence 2
Syaptoas irritant to eyes and aucous aembrane headache narcotic
Target organ eyes upper respiratory systea
First Aid NO VOHIT
Incoapatibilities oxiding asterisks dangerous when exposed to heat or flame
TABU 2 Page 2 of 4 CHEMICAL TOXICITY AND OTHER INFORMATION
(continued)
ACC TLV or STEL Physical Skin Dcraal ID (agkg)
Cheaical (PPff) (PPB) State Penetration Toxicity Potency orsl(rat) Rcnarks
Benzene benzol
IC^H) 10 23 colorless liquid with aroaatic odor
local systeaatic
bullbull
bullbullbull Poisoning occurs aost coasaonly through lnhalationi also penetrates through akin
Syaptoass lrritatea eyes nose respiratory systea giddiness head nausea staggered gait fatigue depresesion sbdoaioal pain
Target organs bloody CNS skin bone narrow eyes respiratory systea
First Aids Swallows 8kins
NO VOMIT soap wash
Inconpatibilitiess strong oxidizers chlorine hronine with iron Dangerous when exposed to beat or flaae
Toxicitys 2 Persistences 1
Trichloroctbylcne ethylene trichloride tridene TCE
30 200 colorless liquid sweet odor
4820
1900(dog)
Syaptoass headache vertigo vision distortion treaors soanolcnce nausea voait irritates eyes cardiac errytbaiss paresthesias
Target organs respiratory systea heart liver kidneys CNS skin
First Aids Swallows Skins
Ipecac voait soap wash immediately
incoapatibless strong caustics chemically active actalss Da Li Ra Hg liquid O
Al 02 KN03 Ti
Persistences 3
Polychlorlasted biphenyi PCB Arocblor 1242 CjjHjClj(approx)
Arcblor 1234
C6H2C3C6M3C12
03
colorless to dark brown liquid with aild hydrocarbon odor
local systeaatic
local
Poisoning occurred Boat coaaonly through investigation or penetration of skin
Sypatoaas Irritates eyes (discbarge) skin scne-fora dernitatis Jaundice dark urine Target organs liver eyes skin First Aids Swallows Ipecac voait
Skins soap wash isnediately Incoapatibless strong oxidizers
TABU 2 CHEHICAL TOXICITY AND OTHER INFORMATION Page 3 of 4
ACC
Chulcil TLV or STEL (ppa) (POO)
Physical State
Skin Penetration
Derail Tonicity Potency
U)n (ngkg) of Reaarka
Dloctyl phtbalate di-acc-octyl pblbalata
5 aga1
light colored liquid
31000 Tonicity low to none via oral and derail routca produce 01 ayaptoas
12 Bichlorobenzene (C^H CI ) o-OCB
50 none liquid ++ local systemic
Symptoms irritates eyes and nose Target Organs liverkidneysskineyes First Aid Swallow salt water vomit
Skin soap wash Incompatabilities strong oxidizers
14 bichlorobenzene (CHbdquoC1 ) 7 2
P-OCB 75 110 solid ++ local
systemic ++ Symptoms irritates eyesheadachesnauseavomiting
Target Organs liverkidneyskineyesrespiratory system
first Aid Swallow water vomit skin soap wash
Incompatablities none
Lead (Pb) 015 mgm
none solid systemic t Symptoms Fatigue headaches abdominal pain Target Organs kidneys 61 central nervous system First Aid Swallow water vomit
Skin soap wash
Polycyclic Aromatic Hydrocarbons (PAHs)
015 mgm
none liquid systemic + Symptoms No obvious symptoms Carcinogenic to tissue following prolonged contact
First Aid Swallow water vomit Skin soap wash
Page 4 of4TABU 2 CHEMICAL TOXICITY AND OTHER INFORMATION
(continued)
NOTES
TLV - Threshold Unit Value ACC - Acceptable Ceiling Concentration STEL - Short Tera Exposure Limit
Suspected carcinogens teratogens or mutagens Firat Aid Unless specified flrat aid for oil of the liated cbeaicala are aa followa
Eyeai iaaedlatcly waab with copious quantity of cold water Skins Flush with water proaptly Breath Artificial respiration Swallowi Water voait
a Slight Hazard aa Hoderate Hasard aalaquo Extreme Hasard
Toxicity Ratiosa
Toxicity Rating
No toxicity (none) Material causes no hara in any condition or produces
tosic effects on buaana in very unusual circumstances or
in very large dosage
Slight toxicity (low)
Moderate toxicity
Severe toxicity
Persistence or each hazardous substance ia evaluated on its blodegradabllity aa follows
Assigned Value
Easily biodegradable coapounds 0
Straight chain hydrocprbons 1
Substituted and other ring compounds 2
Metals polycyclic coapounds and halogenated hydrocarbons 3
Adapted with modifications from EC Jordon Co RIFS Work Plan
TABLE 3 - PERSONNEL TRAINING AND MEDICAL MONITORING HEALTH AND SAFETY PLAN Field Sampling Plan OConnor Co Site Augusta Maine
personnel1
Robert E Stetkar
Joanne O Morin
Richard F Murdock
Benjamin Y Su
Joseph G Engeis
Steven R Lamb
Thomas S Bobowski
Boyd P Smith
Christopher L Covel
William J Haswell
Charles Blodgett
NOTES
ANNUALreg MEDICAL
MONITORING
yes
yes
yes
yes
yes
yes
yes
yes
yes
yes
yes
lt
y
OSHA 40shyHOURreg HAZMAT TRAINING
yes
yes
yes
yes
yes
yes
yes
yes
yes
yes
yes
ANNUALreg RESPIRATOR
FITTEST
yes
no
no
no
no
yes
yes
yes
es Yes
yltes
-y
CARDIOshyPULMONARY
FIRST AID RESUSCITATION TRAINING TRAINING
no no
yes yes
nov no
no no
no no
yes yes
yes yes
yes yes
yes yes
no no
yes yes
1 Only GEI personnel assigpedttfdo work on the OConnor site included on this list
2 Includes baseline and annual physicals lilood testing etc
3 In accordance with 29CFR191012tkncludes annual 8-hour refresher course
4 Includes annual respirator fit testing procedures
Project 90393 GEI Consultants Inc January 17 1991
TOW MAXARJM PCS CONCENTRATION (gtbullraquo) 8Y AREA
Central Maine Power Company Pre-Design Work Plans INTERPRETED CONTOURS Scale 1 inch = 180 feet Augusta Maine OConnor Site OF PGBs IN
Augusta Maine IN SURFICIAL SOILS From EC Jordon Co RIFS
Report dated June 1989 0 G E I C o n s u l t a n t s I n c Project 90393 January 1991 FigHS-2
Central Maine Power Company Pre-Design Work Plans DISTRIBUTION OF PAHs Scale 1 inch = 180 feet Augusta Maine OConnor Site IN SURFACE AND
Augusta Maine SUBSURFACE SOILS From EC Jordon Co RIFS
Report dated June 1989 0 G E I C o n s u l t a n t s I n c Project 90393 January 1991 FigHS-3
Central Maine Power Company Pre-Design Work Plans INTERPRETED DISTRIBUTION Scale 1 inch = 180 feet Augusta Maine OConnor Site OF LEAD IN SOILS
Augusta Maine From E C Jordon Co RIFS
Report dated June 1989 ltD G E I C o n s u l t a n t s I n c Project 90393 January 1991 FigHS-4
Central Maine Power Company Pre-Design Work Plans ANALYTICAL RESULTS FROM Scale 1 inch = 160 feet Augusta Maine OConnor Site SEDIMENT AND SURFACE
Augusta Maine WATER LOCATIONS From EC JOrdon Co RIFS lttgtReport dated June 1989 G E I C o n s u l t a n t s I n c Project 90393 January 1991 FigHS-5
Contamination 80 Feet
Control Line
Central Maine Power Company Pre-Design Work Plans SITE ACCESS AND Augusta Maine OConnor Site DECONTAMINATION
Revision 1 March 281991 Augusta Maine AREA
laquo G E I C o n s u l t a n t s I n c Project 90393 March 1991 KgHS-7
bull
Document Vol II SC SAP Appendix B Revision 0
Date January 17 1991 Page 1
APPENDIX B
FieldtogjL
FIELD LOGS
Project Field Log Book Equipment Calibration Logs
HNu Pl-101 MIE MINIRAM MARKSON CONDUCTIVITY METER MARKSON DIGITAL pHTEMPERATURE
Photograph Log Health and Safety QA Logs
Chain-of-Custody Forms Sample Assignment Forms Non-Conformance Report Forms Test Pit Log Forms Barn Sampling Forms Dexsil L-2000 PCB analyzer Calibration Boring Log Forms
lt
Document Vol II SC SAP Appendix B Revision 0
Date January 17 1991 Page 2
(OCONNORFL1)
(OCONNORFL2) (OCONNORFL3) (OCONNORFL4) (OCQNNORFL5) pound0CONNORFL6) (OCONNORFL7)
-(OCONNORFL9) (OCONNORFLIO) (OCONNORFL11) (OCONNORFL12) fOCONNORFL13) (OCONNORFL14) (OCONNORFL15)
Note Field Log OCONNORFLampisassigned to ground water sampling described in the Management of Migration Sampling andiAnalysis Plan
Document Vol II SC SAP Appendix B Revision 0
Date January 17 1991 Page 3
PROJECT LOGBOOKS (OCONNORFL1)
Serialized project logbooks are to be issued by the site contractor to all personnel at the site who have been designated to perform specific field tasks Individuals must sign their logbooks upon receipt and use them to record all pertinent information until the project is completed y
Logbook entries should be dated legible and contain accurate and inclusive documentation of an individuals project activities Because the logbook forms the basisfor the later written reports it must contain only facts and observations Entries made by individuals other than the person to whom the logbook was assigned are dated andsigned by the individual making the entry bull
CALIBRATION LOG Document No OCONNOR FT1 HNu Photoionization Device Model Pl-101 Page 1 of 1
Instrument Serial No
Lamp Date Span Setting Time Calibration Temperature User
Standard Introduced Meter Response (parts per million (ppm))
Comments (See Summary of Calibration Procedures attached7
X x
User Signature Date
Task Manager Signatures Date
CALIBRATION LOG Document No OCONNORFI3 MIE MINIRAM Hand-held Aerosol Monitor Page 1 of 1
Instrument
Serial No
Date
Time
User
Standard used (zero-bag)
Meter Display
Comments
User Signature lt Date X
Task Manager Signature l Date
CALIBRATION LOG Document No OCONNORFL4 Markson Conductivity Meter Model 103 Page 1 of 1
Instrument Serial No
Date Time User
Standard Used_ Meter Display^
Comments
s
v
lt
y xy ^y
User Signature Date z V
Task Manager Signature ) i Date
CALIBRATION LOG Document No OCONNORFU5 Markson Digital pHtemperature Meter Model 95 Page 1 of 1
Instrument Serial No
Date Time User
Temperature check vs mercury thermometer
Probe reading Thermometer reading
Upon completion of calibration procedure does pH probe checkout vs pH 40 buffer Reading bull lt x pH 70 buffer Reading bull
Comments v
X x
User Signature X^ Date
Task Manager Signature Date
Document No QCONNORFT f
Page
PHOTOGRAPH LOG
Project Name
Project No
Camera and Film Specifications
FILM
ROLL FRAME
DATE nTIME PHOTOGRAPHER PHOTO NUMBER
DESCRIPTION
lt3
ni
I X
V
V
gt
Document No QOONNORm7
HEALTH amp SAFETY QUALITY ASSURANCE CHECKLIST
Page 1 of 2 Project No Site Date Completed by
A On-site Operations During Hazardous Waste Site Investigations
yes no Team understands task procedures safety plan individual roles and site history contaminants
yes no Team knowledgeable to hospital route nearest phone location and who is responsible for health and safety on site
yes no Establishment of command post and decon station with Health amp Safety Plan readily available
yes no Establish communication or line-of-site maintained
yes no Field operations conformed environmental monitoring respiratory protection or emergency response
yes no Protective clothing and respiratory protection maintained
yes no Decontamination procedures performed on the following sample containers sampling equipment and personnel
yes no Equipment protected clean calibrated and being used properly by site personnel
yes no First Aid Equipment readily available at site with checklist and eye wash
yes no Site personnel trained in CPR and First Aid
yes no Site Records maintained such as field logbooks respirator usage log incident reports in place and up-to-date and any deviations or modifications to Safety Plan
GEI Consultants Inc
uocutrenc uujmutvrLz
HEALTH amp SAFETY QUALITY ASSURANCE CHECKLIST
Page 2 of 2 Project No Site Date Completed by
B Health amp Safety Follow-up Reports
o Adherence to procedures o Accidents o Unsafe practices or conditions o Results of environmental monitoring o Corrective action
GEI Consultants Inc
Document No Q00NN0RFL9 CHAIN OF CUSTODY RECORD
DOCUMENT NUMBFR rn tLORD
RELINQUISHED DYISiONruRE OATETJMD RECEIVED DY (SIGNATURE) RELINQUISHED DY (SIOHATURER DATETI^IE RECEIVED BY (SIGNATURE)
IIElINOUISIIEO BY(SIGNATURE) DATETIMf DATETIME gt REMARKS lcNAruDn^nLADOnATonvorI
P a g e o f
Document No OCONNORFLIO
Page of G E I C o n s u l t a n t s I n c
Project No
Project Name _
Laboratory Contact
Sampler ( s ) Date Assigned Date Sampled
GEI Sample No
Sample Medium
Quantity
Sample Container
Type
Analyses Requested Remarks
Special Instructions Remarks
Document No 0CQNNDRFL11
NONCONFORMANCE REPORT
Project Project No
Auditor Audit Date Finding No
FINDING
Where found Check Lit Item
ControllingDocument Section
Task Description
Noncenformanee
Discussed with
Recommended Corrective Action
Is system correction needed to prevent recurrence Yes No If yes state recommended action
Schedule Completion Date By
CORRECTION ACTION
Correction Action by Date
QA Approval of Correction Action by Date
Date Completed Submitted by
Correction Action Verified by Date
I T E S T P I T L O G QCONNORFL12
PROJECT
LOCATIONI CLIENT
CONTRACTOR EQUIPMENTI OBSERVED BY
I DEPTH BELOW
GROUND SURFACE
I (FT)
I
I
I
1
1
1
1
I
1 REMARKS
PROJECT NO
LOCATION
GROUND EL
DATE DATUM
SOIL DESCRIPTION
PIT DIMENSIONS (FT) LENGTH WIDTH DEPTH
ltJgt G E I 1
I Docuaent No 0C0NNCRFL13
bull GEI CONSULTANTS IMC 53 Regional Drive Concord New Hampshire 03301-8500 (603)224-7979
BARN SAMPLING FORM Serial I
PROJECT INFORMATION
Project Name Source Control Pre-Oesion Studies
I Site Name(if different) OConnor Co site
Project Number
I Analytical Lab(s) ERCO EPA
GEI GC screen Other(Specify)
I METHOD OF SAMPLING
WIPE SAMPLING OF HON-POROUS SURFACES
I U000EH UALL SAMPLING UITH DRILL BIT
OUSTSOIL SAMPLING OH FLOOR SLAB
( CONCRETE SAMPLIHG ITH MORTAR BIT
(OTHER-Explain)
I
DESCRIPTION OF SAMPLE
Brief Description of Type of Material or Item Sampled
Visible Staining NO Visible Staining
Approximate Area of Stain(if any) X
LOCATION OF SAMPLE
Ground Floor Second Floor Loft
(All Measurements in Feet to 010 Foot)
Distance Along Z Axis from Reference Origin
Distance Along M Axis from Reference Origin
Height of Sample Above Floor Slab
SKETCH IN APPROXIMATE HORIZONTAL LOCATION OF THE SAMPLE COLLECTED ON FIGURE BELOU
I UALL X
I
I
UALL U UALL Y
I
I Reference Origin UALL Z
I Approximate Scale 1 inchbull 15 feet
I Sample I0(s) SIGNATURE OF SAMPLER CERTIFIES ABOVE SAMPLING RECORD
Date Time
I Sampler(s) COC Docunent Signature Date
I
CALIBRATION LOG Document No OCONNOR FL14 Dexsil L-2000 PCB Analyzer Page 1 of 1
Instrument
Serial No
Date
Time
User
Ambient Temperature deg C
Standard used (50 ppm chloride)
Reading beforeadjustingCALIBRATE knob
Reading after adjusting CALIBRATE knob
Comments
User Signature Date
Task Manager Signature Date
Document No OCONNORFL15 I BORING LOCATION DATE START FINISH
GROUND ELEVATION (NGVO ) DRILLED BY
GROUNDWATER El DATE LOGGED BY TOTAL DEPTH (FT) PG OF
I EL DEPTH S A M P L E
Its TYPE BLOWS PEN REC R E M A R K S QO SOIL ANO ROCK DESCRIPTIONSlt_land PER aFT FT NO 6 IN IN IN lt9
I
I
I
I
I
1
1
I
1
I
I
I
I
I
I BLOWS PER (-140IBHAMMER FALUNS 30T0 DRIVE NOTES A 20 IN 00 SPLIT SPOON SAMPLER
PEN-PENETRATION LENGTH OF SAMPLER OR CORE BARREL REC-RECOVERY LENOTH OF SAMPLE ROO-LENOTM OF SOUND CORES gt4INLENSTH COREO S-SPLIT SPOON SAMPLE PROJECT
I U-UNOtSTURBCO SAMPLES UF-FIXEO PISTON _ UO-OSTER8ERO bully OROUNOWATER 0 G E I
I
I
I
I
I
I
I
I
I
1 1 1 1 1 1 1 I 1 1 I
Document VoL H SC SAP Appendix C Revision 0
Date January 17 1991 Page 1
APPENDIX C
EQUIPMENT CALIBRATION PROCEDURES
Document Vol II SC SAP Appendix C Revision 0
Date January 171991 Page 2
HNu PI-101
The HNu PI-101 is factory calibrated twice a year andor if the instrument is malfunctioning Prior to field use and at the end of each day the user of the instrument will check that the instrument is still holding calibration using the following procedures
1 Prior to the calibration check check the instrument with an Organic point source (ie magic marker) prior to use to verify that it is functioning
2 Connect the rubber sampling hose from the span gas cylinder regulator to the sampling
probe of the HNu gt
3 Fully open the regulator valve gt vy
4 Note the instrument meter response after 5 to 10 Seconds y
5 If the response deviates + 15 from the coneentration of the calibration gas (this figure appears on the cylinder label) the instruihehtTeq^es factory maintenance and will not be utilized in the field until factory calibratiori^Tah alternate meter will be used after calibration checking v (
V 6 Document the calibration information Oik the appropriate equipment calibration log
(OCONNORFL2) ~y
Document VoL IISC SAP Appendix C Revision 0
Date January 17 1991 Page 3
MIE MINIRAM Model PDM-3
The MINIRAM will be factory calibrated once a year andor if the instrument is malfunctioning Prior to field use and at the end of each day the user will zero the instrument using the following procedure
1 With the MINIRAM off insert MINIRAM into Zerobag andseal the Zerobag
2 Inflate Zerobag with filtered air containing no particulates using-attached hand pumpx- V
S
3 Press ZERO button on MINIRAM and wait 30 seconds MINIRAMshould read OFF
4 Pull MINIRAM out of Zerobag
5 Press MEAS button and wait 60 seconds for MINIRAM to go through self-tests
6 The MINIRAM is now functioning and wilJLtake-readings every 10 seconds
7 Document the calibration information onthe appropriate equipment calibration log (OCONNORFL3) V
lt
v
Document VoL II SC SAP Appendix C Revision 0
Date January 171991 Page 4
MARKSON DIGITAL MODEL 103 CONDUCTIVITY METER
The Markson Conductivity meter will be calibrated prior to and following each days field use using the following procedures
1 Rinse the conductivity probe with distilled water gt
2 Pour enough Cole-Parmer conductivity calibration solution (1413 xS 25degC) in a clean plastic Ziploc bag to be able to completely immerse the conductivity probe
3 Immerse the conductivity probe in the standard solution and shakdTree any bubbles that may cling to the cell
4 Allow about 1 minute for the cell to reach equilibrium temperature x X
5 Set the cell adjust control at the bottom of the meter to display the value of 141
6 Carefully rinse cell with water after calibration and after each use V~
7 Document the calibration process onjlie equipment calibration log (OCONNORFL4)
Document VoL H SC SAP Appendix C Revision 0
Date January 17 1991 Page 5
MARKSON MODEL 95
Combined Digital pHtemperature Meter
The Markson 95 combined digital pHtemperature meter will be calibrated prior to and following each days field use using the following procedures
1 Insert electrode into digital meter The reference pin should also be properly connected Temperature probe should be plugged all the way into the ATC jack
2 Remove protective cap and push rubber sleeve such that the potassium chloride filling hole is exposed gt
3 Rinse both pH and temperature probe in distilled water 4 Immerse both pH and temperature probe into buffer 700 solution 5 Set FUNCTION switch to TEMPERATURE to read temperature 6 Set FUNCTION switch to ATC and adjust the readout to the pH value of buffer 700 corresponding
to the temperature measured in E with the CALIBRATE control See Chart 1 7 Rinse electrode and temperature probe withdistilled water 8 Immerse both pH and temperature probe into buffer^401 9 Repeat E V ~ 10 Set the FUNCTION switch to ATC and adjust the readout to the pH value of the buffer 401
corresponding to the temperature measured in Iwith the SLOPE control See Chart 1 11 Rinse the electrodes and temperatureprobe-with distilled water Model 95 is calibrated and ready
for use 12 Document the calibration process on the equipment calibration log (OCONNORFL5)
^ CHART
Temp (C) Buffer Solution 70 X -X
Buffer Solution 40
5 y 700 401 10 708 399 15 706 399 20 703 399 25 701 399 30 700 400 35 699 401 40 698 402 50 698 403 60 697 405
Document VoL II SC SAP Appendix C Revision 0
Date January 171991 Page 6
Dexsil Model L-2009 PCB Analyzer
The Dexsil PCB Analyzer will be calibrated prior to each days field use using the following procedures
Initial Preparation
1 The electrode must be filled with Orion filling solution before it is operational Fill the electrode up to the hole in the side of the epoxy body by-placing the nozzle of the filling solution in the hole and squeezing the bottle 7
2 Drain the electrode while holding it upright over thewaste beaker Grasp the epoxy body firmly in one hand and push down on the white cap which is connected to the cord The solution will then drain out of the bottom of the electrode
Vgt 3 Refill the electrode and check to makesure that the liquid is making contact between the black
cone and the plastic shell at the bottom of theelectrode If it is not making contact at all points drain the electrode again and refill
4 Plug the electrode into the back of the L-200Qj)laeeJt in a vial or rinse solution and turn the instrument on Switch the analysis knobtdfnVand wait a few minutes until the reading stabilizes
Calibration O Imdash^
1 Fill a vial about half way with 50 parts per million calibration solution
2 Turn the analysis selectQrJcnob to CAL
3 Remove the electrode from the rinse solution dry it carefully with a tissue and place it in the calibration solution SWiri the electrode gently for a few seconds and then stop Push the start button on the instrument^
4 When the READ light comes on adjust the CAL knob so that the instrument reads 50
5 Remove the electrode from the calibration solution wipe it dry and place in the rinse solution
6 If this is the first calibration since the instrument has been turned on or since the electrode has been filled repeat steps 34 and 5
7 Document the calibration information on the appropriate equipment Calibration Log (OCONNORFL14)
Document Vol II SC SAP Appendix D Revision 0
Date January 17 1991 Page 1
APPENDIX D X
list of Acronyms
Document Vol II SC SAP Appendix D Revision 0
Date January 17 1991 Page 2
ACRONYMS
ASTM American Society for Testing and Materials CLP Contract Laboratory Program CMP Central Maine Power Company DEP Department of Environmental Protection (Maine) DQO Data Quality Objectives EPA Environmental Protection Agency [US) FL Field Log FSP Field Sampling Plan ltys GEI GEI Consultants Inc gt HSP Health and Safety Plan X
MIE Monitoring Instrumentsforthe Environment MOM Management of Migration NA Not Applicable X lt OSHA Occupational Safety anaHeakh Administration OSWER Officer of SolithWaste and Emergency Response PCB PolychlorinatecFBiphenyk ppb Parts per billion v7 ppm Parts per million QA QuaUtyAssuranck ) QAO QudU$~^sitraquoance Officer QAPP QualityAssurance Project Plan QC Qukkty Gontrof PIP -Thotoionization Detector RDRA -mdashRemedial DesignRemedial Action RI Remedial Investigation ROD x^XRecbrd of Decision RPD X^Relative Percent Difference RPM Remedial Project Manager RSD Relative Standard Deviation SAP Sampling and Analysis Plan SC Source Control SOW Statement of Work TPH Total Petroleum Hydrocarbons VOC Volatile Organic Chemical or Compound
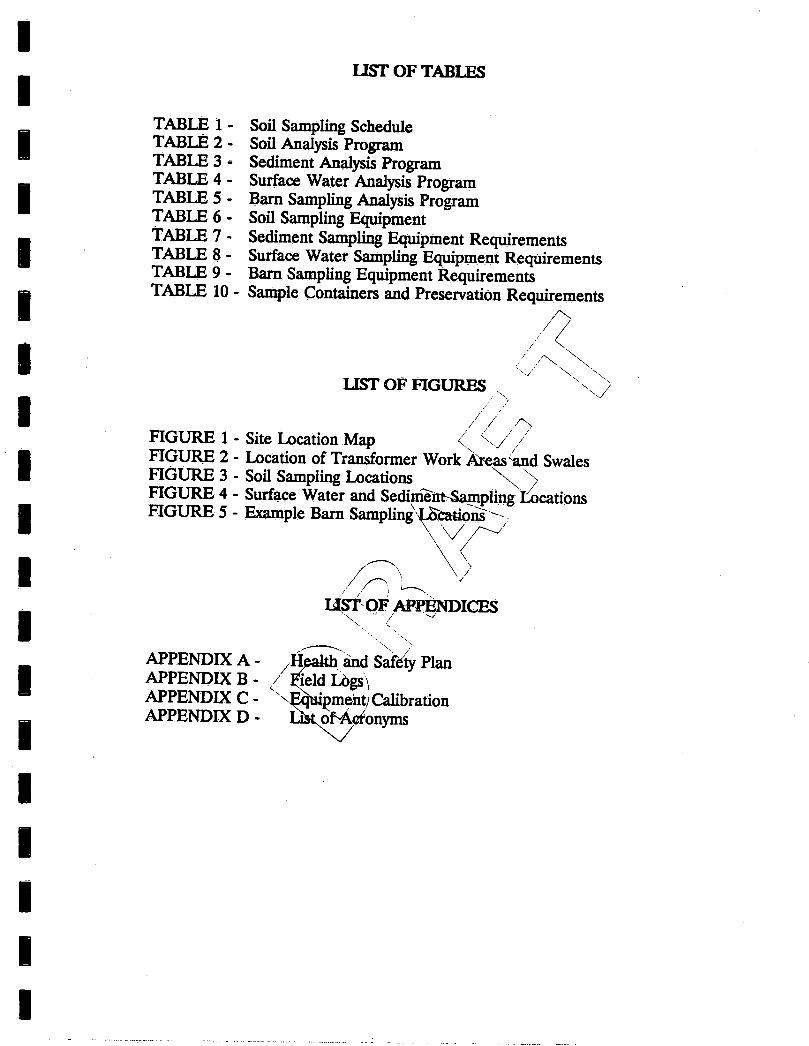

Document Vol II SC SAP Revision 0
Date January 17 1991 Page 1
1 INTRODUCTION
11 Purpose
This document is the Field Sampling Plan (FSP) portion of the Sampling and Analysis Plan for Source Control components of Pre-Design Studies for Remedial DesignRemedial Action at the OConnor Co Superfund Site in Augusta Maine The overall objectives of the Source Control Sampling and Analysis Plan (SC SAP)are to document objectives procedures and rationales for sampling and analytical workprovide rationale for sampling and analytical protocols and provide a mechanism for planning anchapproving Pre-design Source Control field sampling and laboratory activities
gtThe Field Sampling Plan (FSP) defines the samplinganddata-gathering methods to be used during the Source Control component of the Pre-Desigp phase This FSP has been developed in accordance with the requirements of Part Bin Attachment A to the Statement of Work for Remedial DesignRemedial ActftmTbr the OConnor Superfund Site dated July 30 1990
The Quality Assurance Project Plan (QAPP) is provided as Volume I of the Source Control Sampling and Analysis Plan ^~N ygt
)
12 Site Location and Description J N ^
The OConnor Site (Site) is located along QS Route 17 near the eastern boundary of the city limits of Augusta Maine^Eigure 1) The Site covers approximately nine acres within a larger 65-acre parcelThe SiteXis currently surrounded by a chain link fence and is abutted by woodlands toHh^north) and west US Route 17 to the south and the west branch of Riggs Brook and itassociated wetlands to the east
The Site is situated on the crest of a low ridge which is aligned parallel to Riggs Brook Principal features on the property include a large barn that formerly housed scrap operations an Upland Marsh an adjacent low area of fill two surface water impoundments (lagoons) three former outdoor transformer work areas (TWAs) and a former scrap area (Figure 2) Site drainage is principally controlled by the slope extending downward toward Riggs Brook and man-made drainage features connecting the Upland Marsh on the top of the ridge to Riggs Brook
Access into the Site is via an unimproved gravel road from US Route 17 that passes through a wooden fence near the on-site barn and follows the ridge line of the property to die northeast for approximately one-quarter mile to the wooded area of the Site Three
Document Vol II SC SAP Revision 0
Date January 17 1991 Page 2
separate and distinct transformer disassembly areas are situated along the access road and are identified by oil-stained soils metal wire and porcelain fragments The three areas are identified as transformer work areas (TWAs) I n and HI A former scrap-yard (Scrap Area on Figure 2) is located within the wooded area beyond TWA in Empty tanks white goods automobile bodies tires sheet metal and other items were stored or discarded in this Scrap Area
gtThe barn consists of a three-story wooden structure with a plan area of approximately 3100
square feet The barn has a concrete floor slab and contains ^large-variety of items These
items consist chiefly of the following furniture metal racksand doors lumber electric
meters automobile parts a wood stove heating registers an antiqueautomobile a boat
and a large amount of miscellaneous metal scrap debris gt v
13 Site History lt ltvy
lt
The Site was primarily used as grazing land until the l950sgtrhen the F OConnor Co started a salvage and transformer recyclingbusiness ThV salvage processes included stripping and recycling transformers that contaibedpblyehlorinated biphenyl (PCB)-laden oils As a result Of the uncontrolled releases ofPCB afthe Site the Site was placed on the National Priorities List (NPL) On March 231985 United States Environmental Protection Agency (EPA) and Maine DepartmenTof Environmental Protection (DEP) issued an Administrative Order to the OCohndPs and Central Maine Power Company (CMP) (Docket No 1-86-1031) identifying eachas-aPotentially Responsible Party (PRP) to (1) remove known threats to the public health or welfare which exist on-site (tanks of oil) (2) secure the areas of the Site thaLhave known contaminated soils (3) conduct a Remedial Investigation (RI) and (4jyjrepare a Feasibility Study (FS) In response to the Administrative Order CMPberformed the following interim remedial actions
bull Construction of a chai compassing TWA I and TWA II (approximately 75 acres) and the majority of the^sit^-related chemicals (1985)
bull Sampling cleaning and removal of 20 on-site storage tanks (1986)
bull Removal of over 500 tons of material from the scrap area and sampling of soils beneath the scrap (1987)
bull Extension of the chain link fence to secure TWA HI and part of the TWA II drainage swale
Currently two lagoons located on the slope leading down to Riggs Brook serve as detention basins for surface water flow from the Upland Marsh The portion of the Site currently
Document Vol II SC SAP Revision 0
Date January 17 1991 Page 3
fenced includes TWA I n and III part of the scrap area and all areas in which residual PCBs are present in soils The RI and FS were conducted by CMP and their consultant EC Jordan Co The objectives of the RIFS were to provide the necessary information to 1) identify and assess the existing and potential public health andor environmental risks which may be caused by the release or threatened release of hazardous substances pollutants or contaminants and (2) formulate and evaluate alternative recommendations for the remedial actions needed if any to prevent or mitigate the migration release or threatened release of hazardous substances
14 Soil Surface Water Sediment and On-Site Barnc Contamination and Remedy Description )
141 Soil s lt w
During the RI approximately 500 surface and Subsurface soil samples were collected by grab sampling shallow borings or test pits PCBs and lead were the principal contaminants found in the surface pTno^05-feet deep) soils and PCBs and carcinogenic polycyclic aromatic hydrocarbons-^(cPAHs) were the principal contaminants detected in the subsurface (05lO12-feet deep) soils
The highest concentrations of PpB^contaminated soils were found primarily within the former transformer work areas (TWAS)r-and the drainage areas associated with these TWAs (Figure 2) Contaminatedsoikinthe TWAs were found to contain up to 200000 parts per million (ppm^PCBs However the most contaminated soils (greater than 500 ppm) constitutelless than 125 of the total estimated volume of soil contamination (23500-trubic yards) and most of the contaminated soil contains PCBs at concentrations le^sthan 50 ^pm Lead was detected above background (ie approximately 70 ppm^average) principally in the surface soils within TWAs I and II with the maximum leachc^neentfation occurring at 4100 ppm within TWA II
Subsurface soil samples taken from TWAs I and II and the low area hear the Upland Marsh contained cPAHs The low area is an area where sediment dredged from the Upper Lagoon in 1977 was deposited adjacent to the area currently containing the Upland Marsh Disposal of this sediment resulted in blockage of natural drainage and formation of the Upland Marsh The depth of vertical migration of the cPAHs appeared to be limited to the upper 6-feet within TWA I and the low area while a small pocket of cPAHs was found to exceed 8 feet within TWA II The maximum cPAH concentration of 30 ppm was found within the low area Depth of PCB contamination in the subsurface soils outside of the TWAs was typically limited to less than 2 feet while PCBs were detected within TWAs I and II at depths of up to 12 feet
Document Vol II SC SAP Revision 0
Date January 17 1991 Page 4
Cleanup standards for soil were determined based on a public Health Environmental Risk Assessment performed by the EPA Cleanup standards are summarized below compared to maximum concentrations of chemicals encountered at the site
Maximum Concentration Soil Cleanup Chemicals Detected Standards
(ppm) (ppm)
Lead 4100 248 x
cPAHs 30 dX X PCBs 200000 1 gt bull
bullX
The RODspecifies that approximately23500 cubicyardsjof contaminated soils contain PCBs cPAHs and lead above the established Cleanup standards are to be treated on site using a solvent extraction technology This technology principally involves the use of a solvent to extract the PCBs and cPAHs from the contaminated soils The contaminated liquids containing the extracted PCBs and cPAHs will be destroyed at a licensed off-site TSCA incinerator AddkionaHyr-soil treatment residues resulting from the solvent extraction process that haveJlacNevels above the 248 ppm cleanup standard will undergo further treatment using n solidificationstabilization treatment technology Those solid treatmentNresidues jesulting from the solvent extraction process that do not achieve the cleahup-standards and that have undergone additional treatment through solidificationstabilization will be transported off-site to a licensed landfill It is currently estimated by the EPA that 5000 cubic yards of the total 23500 cubic yards of contaminated soils undergoing solvent extraction will require off-site disposal
142 Surface Wateiv
The on-site surface waterNirainage features include an Upland Marsh an Upper Lagoon and a Lower Lagoon (see Figure 2) The Upland Marsh drains to the Upper Lagoon via a subsurface drainage pipe The Upper Lagoon drains to the Lower Lagoon via a drainage swale The water that flows out of the Lower Lagoon follows a drainage swale to Riggs Brook
In 1976 under the advice of Maine DEP the two lagoons were constructed in an attempt to control oil migration The Upper Lagoon was constructed with a concrete retaining wall and an inverted siphon to prevent migration of oils floating on the lagoon surface Floating oils were collected and contained in six large on-site storage tanks The lower lagoon was excavated at the base of the slope and constructed with an earthen berm and a horizontal pipe discharge
Document Vol n SC SAP Revision 0
Date January 17 1991 Page 5
In 1977 under the direction of the Maine DEP the use of the lagoons was discontinued The water from the Upper Lagoon was placed in storage tanks and the sediments were excavated and placed in the low area shown on Figure 2 The sediments placed in the low1- area were underlain by a 1-foot-thick layer of marine clay and then covered with a clayey soil less than 6 inches thick The filling of the low area created a barrier to the previous natural surface water drainage and resulted in the formation of the Upland Marsh In an attemptto drain the marsh the subsurface drainage pipe was installed between the marsh and the Upper Lagoon in September 1978 The saturated area of the Upland Marsh presently still exists
On-site surface water quality was measured at five sampling locations These include one surface water sample from each of the lagoons and one from the Upland Marsh The surface water quality data in the RI indicated that PCBs (from unfiltered samples) were detectable in the Upper and Lower Lagponsyand in drainage from the Lower Lagoon but were not detected in surfacewater samples taken from Riggs Brook PCB concentrations in the on-site surface waters for the EowersLagoon the Upper Lagoon and Upland Marsh were 055 ppb 16 ppb^jand non-detected respectively Other contaminants of concern in the on-site urfkceTwaters were the inorganic chemicals lead and aluminum Lead was found at concentrations ranging from 36 to 13 ppb in all the on-site surface waters Additionally aluminum was detected in the on-site surface waters at concentrationsrangfog from 236 to 3740 ppb
O V Cleanup standards for surface water were determined based upon a Public Health
Environmental Risk Assessment performed by the EPA Cleanup standards are
summarized below compared to themaximum concentration of chemicals encountered
at the site N v
Surface Water Maximum Concentration Cleanup
Chemicals xD6tected Standards (PPb) (ppb)
Lead 13 194 Aluminum 3740 87
PCBs 16 0065
The selected remedy for surface water remediation at the site is pumping of surface water from the Upper and Lower Lagoons and Upland Marsh and disposal off-site unless otherwise approved by EPA The ROD indicates that the approximately 150000 to 195000 gallons of surface water are contained in the Upland Marsh and Upper and Lower Lagoons
Document Vol II SC SAP Revision 0
Date January 17 1991 Page 6
143 Sediment
The sediment sampling program conducted during the RI consisted of a total of 23 sediment samples from 19 locations both at on-site and off-site locations A total of six sediment samples were collected from the Upland Marsh Upper Lagoon and Lower Lagoon consisting of two samples from each of these surface water bodies Other samples were collected from Riggs Brook and drainage swales between the lagoons and Riggs Brook
xPCBs were detected in the sediment samples obtained from thexdge of the Upland Marsh both on-site lagoons and the Lower Lagoon drainage area leading into Riggs Brook PCB concentrations were highest in the Upper Lagoon (up to 1100 ppm) but decreased significantly downstream in the Lower iiigoon PCB concentrations were lowest in the drainage swale downstream fronii dieLower Lagoon (approximately 4 ppm) Cleanup standards for the sedimentswere~detennined based on a Public Health Environmental Risk Assessment performed by the ERA Cleanup standards are summarized below compared to maximiimgtCQncentrations of chemicals encountered in sediment samples from the Upland MSrsh Upper Lagoon and Lower Lagoon
Vmdash ( Sediment
MaximumConcentration gt Cleanup Chemicals Detected-^ v Standards
( (PPF1) -mdash (PPm)
Lead 28 248 cPAHs y 1 PCBs 1100 1
The ROD indicates that the cm-site sediments will be dredged and the sediment containing chemicals above^tbe established cleanup standards will be treated using the solvent extraction technology as described in Section 141
144 On-Site Barn Characteristics
The barn has been reported to formerly house scrap operations A surficial soil sample taken from within the barn (JSS1) during the RI was collected and analyzed for the presence of PCBs and lead The exact nature or matrix of the surficial soil (eg dust concrete wood) collected from within the barn could not be ascertained from the available documents The results of the PCB screening indicated a concentration of 96 ppm PCBs Lead was detected at a concentration of 1610 ppm No analysis for cPAHs was performed on the sample from the barn
Document Vol II SC SAP Revision 0
Date January 17 1991 Page 7
In the ROD EPA set soil cleanup standards for the site of 1ppm PCBs 1ppm cPAHs and 248 ppm lead The cleanup standards for barn materials were not specified in the ROD by EPA However the ROD specified that the barn would undergo decontamination procedure if contamination was present above cleanup standards (to be determined) through collection of soil dust and other loose material and these materials would be combined with the other contaminated soils and sediments for on-site solvent extraction treatment Large scrap items in the barn would then be removed for disposal off-site and the barn structure would be sampled for detection of the presence of contamination Following sampling and analysis of the barn structure the barn would be demolished and transported to an off-site facility for appropriate disposal ^gt
N
Document Vol II SC SAP Revision 0
Date January 17 1991 Page 8
2 SAMPLING AND DATA QUALITY OBJECTIVES
21 General
Sampling of soils surface water sediments and the on-site barn and its contents will be performed during the Source Control (SC) component of the Pre-Design Study Pre-Design SC sampling results will be used in the design of the SourceControl component of the remedy and development of the treatability testing program for soil and sediment
Pre-Design SC sampling will include N
Collection of surface water samples from the Upland Marsh and Upper and Lower Lagoons in April 1991 V
x
Collection of sediment samples from the Upland Marslkahd Upper and Lower Lagoons in April 1991 ^
Collection of soil samples from test pits and^Orihgsrin April 1991
bull Collection of samples of soil woodimckconcrete from the on-site barn floor and Walls and wipe samples from debris andlquipment located within the barn in May 1991
V-X7EPAs guidance document Data Quality Objectives for Remedial Response Activities (OSWER Directive 93550-78Jdarch 1987) identifies four analytical levels
Level I - field screeningoranalysis using portable instruments Results are often not compound specific and o^ qualitative in nature
Level II - field analyses using mbresophisticated portable analytical instruments Results are more reliable in terms of compound identification and may be semi-quantitative
Level El - laboratory analyses by established referenced methods Results are quantitative and compound specific
Level TV - EPA Contract Laboratory Program (CLP) services utilizing rigorous QAQC protocols and documentation
Level V - Laboratory analyses by non-standard methods Identified in the CLP asspecial analytical services
Document Vol II SC SAP Revision 1
Date March 28 1991 Page 9
A combination of Level I Level in and Level IV analytical protocols will be specified during Pre-Design SC sampling EPA Contract Laboratory Program (CLP) protocols prescribed in the 1988 Organic and Inorganic Statement of Works will be utilized for laboratory analysis of target compounds (PCBs cPAHs lead and aluminum) in surface water sediment soil and barn samples The analytical protocols that will be utilized for Pre-Design SC sampling are detailed in the SC Quality Assurance Project Plan (QAPP) included as Volume I of the SC SAP
22 Soils
Soil samples will be collected and analyzed to provide additional data for comparison with cleanup standards for design of the Source Control program at the OConnor Site Data will be used to refine the previously estimated volume of soils contaminated at various concentrations above the cleanup standards and to provide additional information at areas with apparent data gaps on the lateral and vertical extent of soil with PCB concentrations greater than 1 ppm Soil also will be collected at specified locations to provide samples for solvent extraction treatability bench-scale testing Samples selected for treatability testing will contain PCBs at concentrations previously not examined during limited bench-scale testing performed during the Feasibility Study (FS) The effectiveness of solvent extraction on removal of lead cPAH and PCB contamination will be examined during the bench-scale treatability studies performed during Pre-Design
The soil sampling program performed during the RI was designed to estimate the horizontal and vertical distribution of soils contaminated with PCBs lead and cPAHs above the cleanup standards The distribution of PCBs lead and cPAHs are summarized in the RI on Figures 4-8 4-10 and 1-10 respectively GEI identified several inconsistencies in the distribution of contaminated soils within the summary figures For instance the distributions of PCB contamination shown on Figures 1-6 and 4-8 in the RI in the northern portion of the site near TWA III do not agree Also previous soil sampling did not consistently confirm the horizontal and vertical limits of PCB contamination The vertical limits of the PCB contaminationwere not adequately identified for remedial design purposes near transformer work areas and along drainage pathways where PCB migration has occurred
The effectiveness of solvent extraction as the selected remedy for treating the on-site soils was not fully demonstrated during the FS The bench-scale testing that was performed during the FS did not investigate the full range of contamination levels and recovery efficiencies from different soil types that exist on the site
There are three primary objectives for collection of soil quality data during the Pre-Design studies
Document Vol II SG SAP Revision 1
Date March 28 1991 Page 10
1 Collect additional data with close control of analytical precision to evaluate datagaps and inconsistencies reported during the RI The collection of these data will primarily be performed near TWAs and drainage pathways
2 Refine the previously estimated volume of soils contaminated at various concentrations above the cleanup standards
3 Evaluate theselected remedy of solvent extraction through bench-scale testingof soils with specific ranges of PCB concentrations
All soil samples collected for treatability bench-scale testing will also have an aliquot collected for PCB analyses by Ceimic Corporation of Narragansett Rhode Island This will provide added confidence that designated samples are within the specified ranges of PCB concentrations for solvent extraction bench-scale testing
In order to facilitate comparison of Pre-Design Study soil quality with RI study soil quality rigorous QAQC protocols and documentation will be needed All sampleswill be analyzed by Ceimic Corporation using 1988 CLP protocols Analytical Level IV (CLP QAQC and documentation) will be utilized on 20 percent of the soil samples collected The remaining 80 percent will be analyzed according to 1988 CLP protocols utilizing Analytical Level III (CLP QAQC butwithout CLPdocumentation) These serviceswill provide detection limits at or below the ROD Cleanup Standards
During Pre-Design sampling equipment blanks will be collected and analyzed after decontamination of sampling equipment to identify artifact contamination that could result from incomplete decontamination of equipment Trip blanks will also be included during sample shipment to identify cross-contamination during transportation to Ceimic Corporation The laboratory and field QAQC procedures described above will enable the precision required to satisfy the objectives of the soil sampling component of this study
23 Sediments
Sediment samples will be collected and analyzed to provide additional data for comparison with the cleanup standards for design of the Source Control program at the OConnor site Data will be used to supplement the sediment quality data previously collected in the RI for a refined estimate of the levels of lead cPAH and PCB contamination in the sediments of the Upland Marsh Upper Lagoon and Lower Lagoon In addition a composite sediment sample from the Upper Lagoon and a composite sediment sample from the Lower Lagoon will be collected for solvent extraction treatability bench-scale testing Treatability testing on contaminated sediments was not performed during the FS The effectiveness of solvent extraction on removal of lead cPAHs and PCBs from sediments will be examined during the bench-scale treatability studies performed during Pre-Design
Document Vol II SC SAP Revision 1
Date March 28 1991 Page 11
The sediment quality data collected during the RI was limited Only two sediment samples were collected from the Upland Marsh Upper Lagoon and Lower Lagoon In addition limited data have been previously collected regarding the volume of contaminated sediment on-site
There are three primary objectives for sediment quality data to be collected during Pre-Design studies
1 Collect additional data with close control of analytical precision to examine levels of contamination in sediment at locations previously not investigated This will include two additional samples from the Upper Lagoon two additional samples from the Lower Lagoon and six additionalsamples from the Upland Marsh The investigation in the Upland Marsh will be directed towards delineating the extent of contamination in the westerly (upstream) direction
2 Refine the previously estimated volume of sediment in the Upland Marsh Upper Lagoon and Lower Lagoon
3 Evaluate the solvent extraction remedy effectiveness on treatment of sediment through bench-scale testing
In order to facilitate comparison of Pre-Design Study sediment quality with RI study sediment quality rigorous QAQC protocols and documentation will be needed Only sediment samples containing greater than 30 percent solids (based on visual observations) will be submitted for analysis After sample collection in the field percent volume of settled sediment in the sample container will be compared to the percent volume of free water Samples will be submitted to the laboratory for analysis if the volume of settled sediment in the sample container exceeds 50 percent of the total volume of the sample All samples will be analyzed by Ceimic Corporation of Narragansett Rhode Island following 1988 CLP protocols Analytical Level IV (CLP QAQC and documentation) will be performed by Ceimic on 20 percent of the sediment samples collected The remaining 80 percent will be analyzed by Ceimic utilizing Analytical Level in (CLP QAQC but without CLP documentation) These services will provide the detection limits at or below the ROD Cleanup Standards
During Pre-Design sampling equipment blanks will be collected and analyzed after decontamination of sampling equipment to identify artifact contamination that could result from incomplete decontamination of equipment Trip blanks will also be included during sample shipment to identify cross-contamination during transportation to Ceimic
The laboratory and field QAQC procedures described above will enable the precision required to satisfy the objectives of the sediment sampling component of this study
Document Vol II SC SAP Revision 1
Date March 28 1991 Page 12
24 Surface Water
The OConnor SiteStatement of Work for Remedial DesignRemedial Action requires that surface water contained within the Upper and Lower Lagoon and in the Upland Marsh be drained collected and transported off-sitefor treatment unlessotherwise instructed by EPA
The three primary objectives for surface water data to be collected during the Pre-Design Studies are to
1 Probe surface water depths in Lagoons and Upland Marsh to obtain a better estimate of surface Water volumes to be handled during remediation
2 Evaluate changes in surface water quality that may have occurred during the approximately three-year period since sampling during the RI and evaluate extent of surface water contamination in the Upland Marsh which is at the upstream edge of the PGB contamination area
3 Collect additional data to design an appropriate program for surface water diversion pumping treatment and disposal Off-site disposal destinations as well as on-site treatment and disposal options will be examined in more detail during the Pre-Design Study
All surface water samples will be submitted to Ceimic Corporation for analysis of PCBs aluminum and lead All of these samples will be analyzed following 1988 CLP protocols including CLP QAQC and CLP documentation (Analytical Level IV) One additional sample will be collected from each surface water body and submitted to Ceimic for Total Suspended Solids Analysis (EPA Method 1602) utilizing Analytical Level III
2JS Barn
The available data for the extent of contamination of barn materials consists of one sample point The surficial soil sample collected was not described such that it is known whether the sample consisted of dust the concrete slab soil within cracks of the slab or debris samples within the barn The elevated levels of PCBs and lead within the sample may not be representative of the majority of the loose materials within the barn Furthermore no wipe sampling on non-porous debris or sampling of the wooden barn structure was performed during the RI
Document Vol II SC SAP Revision 0
Date January 17 1991 Page 13
Cleanup standards for target chemicals listed in the ROD have not yet been established by EPA for barn materials The ROD indicates that the Toxic Substance Control Act (TSCA) Spill Cleanup Policy and Disposal Regulations (40 CFR Part 761) may be used in lieu of site-specific determination of acceptable levels
Samples of selected media within the barn will be collected and analyzed to provide an initial data set to establish the degree of contamination present within the barn Data will be used in developing the work plan for decontamination and demolition of the barn and to determine appropriate disposal sites for barn demolition debriSNand loose debris within the barn Depending on data results an evaluation will be made tbvdetermine whether additional sampling will be required prior to demolition to betterseqnence demolition activities so that PCB-contaminated material can beSeparated from non-contaminated building materials and debris
ltx All soil wood and concrete barnsamples will besubmitted to Ceimic Corporation (Ceimic) of Narragansett Rhode Island for analysis of PCBs cPAHsgtand lead Wipe samples of debris will be submitted to Ceimic for analySis-ofPCBs All samples will be analyzed following CLP protocols Analytical LeveK IV-requiring CLP QAQC and reporting requirements will be utilized for 20 percent of the5amples Analytical Level in utilizing CLP analytical protocols but without the documentation requirements of CLP will be specified for the remainder of the
Document Vol II SC SAP Revision 0
Date January 17 1991 Page 14
3 HEALTH AND SAFETY
A Health and Safety Plan for the Source Control Field Sampling Plan is presented in Appendix A All personnel involved in the sampling program have been trained in accordance with the requirements of the Occupational Safety and Health Administration Regulation OSHA 1910120 Hazardous Operations and Emergency Response and are enrolled in a comprehensive medical monitoring program
A list of personnel authorized to perform work on this project ^and listing of their participation in personnel training and health monitoring programs^arepresented in the Health and Safety Plan gt
Document Vol II SC SAP Revision 1
Date March 28 1991 Page 15
4 SAMPLING LOCATION AND FREQUENCY
41 Soils
411 General
In general the soil sampling program includes collection of the following two basic categories of samples
1 Soil samples collected from test pits for possible bench-scale testing and
2 Soil samples collected from test pits and borings to fill data gaps on the lateral and vertical extent of soil contamination above cleanup standards and to refine estimates of the quantity of contaminated soils
Figure 3 shows the locations of test pits and borings planned for this investigation These locations were based on the depth delineation of 1 ppm for Total PCBs presented in the Remedial Investigation Table 1provides ageneral sampling rationale including test pit and boring identification numbers target sampling depth and elevation anticipated PCB concentration level and soil type A summary of the analyses to be performed on soil samples including replicates and blanks is shown in Table 2
A total of 12 soil samples for possible bench-scale testing will be collected from test pits during April 1991 Two samples of each soil type indicated below will be collected within the specified ranges of PCB concentrations Each sample will have a minimum volume of about 05 cubic feet (about 60 lb weight) to provide sufficient soil for bench-scale testing
PCB Concentration Range fppml Soil Types
1 to 10 Clay and Fill 10 to 20 Clay 20 to 50 Clay 50 to 500 Clay and FiU
During the RI three soil samples were collected for bench-scale treatability testing with initial PCB concentrations of 1000 4000 and 22000 ppm However sample locations had been selected to obtain samples with PCB concentrations in the range of 250 to 700 ppm based on PCB concentration contours developed during the RI
Document Vol II SC SAP Revision 1
Date March 28 1991 Page 16
Therefore PCB concentration contours developed from the RI data do not precisely indicate the extent and level of contamination
In order to gain a higher degree of confidence that samples within each specific PCB concentration range have been collected GEI will perform field PCB screening with a Dexsil L-2000 PCB analyzer to estimate the soil PCB concentration range prior to collecting the soilsample Aliquots of the 12 bench-scale soilsamples will be collected for confirmatory testing for PCB concentrations by Ceimic of Narragansett Rhode Island utilizing 1988 CLP protocols
GEI will select the soil samples for bench-scale testing after receiving the CLP laboratory results of the PCB concentrations If the laboratory data do not indicate that at least one of the two soil samples was collected from the targeted concentration ranges and soil types an additional contingency round of soil sampling may occur Sampling locations for this contingency sampling round will be selected based Upon the PCB data summarized in the RI and the data collected by GEI during the previous SC sampling round
A total of 40 soil samples (including replicates) will be collected from test pits and borings during April 1991 to fill data gaps on the extent and quantity of contaminated soil The soil sampleswill be collected at the approximate elevation specified for each sampling location as indicated in Table 1 Sample elevations of the bench-scale samples may vary if PCB concentrations in samples screened with the Dexsil L-2000 PCB analyzer are not within the ranges indicated below
Acceptable Screening Target PCB Concentrations Range PCB Concentration Range
(ppm) (ppm)
1 to 10 1 to 10 10 to 20 10 to 20 20 to 50 25 to 45
50 to 500 200 to 350
The soil samples will be analyzed for PCBs ePAHs and lead by Ceimic of Narragansett Rhode Island utilizing CLP protocols Four soil samples (including two selected for bench-scale treatability testing) will also be analyzed for total organic carbon (TOC) cation exchange capacity (CEC) and pH
Document Vol II SC SAP Revision 1
Date March 28 1991 Page 17
Detailed descriptions of the soil sampling and decontamination methods are provided in Section 5 Appendix A and the QAPP Contractors will be used for surveying performance of test pits and drilling of borings All contractors will be required to document that they have completed health and safety training that complies with OSHA Standard 1910120 In generalstakes marking the planned locationsof test pits will be surveyed by a registered surveyor prior to test pit excavation The Stakes will serve as temporary bench marks for reference during location of test pit samples A rubber-tired type backhoe will be used to excavate test pits for planned sampling locations less than or equal to5 feet below ground surface The backhoe and operator will be supplied by HE Sargent Inc of Lewiston Maine capable of operating at hazardous waste sites under Level C personnel protection Soil samples will be collected from in-situ test pit excavations by GEI personnel using a stainless steel shovel or trowel
Due to anticipated shallow ground water conditions a drill rig will be used to advance test borings for soil sampling at locations where the target sampling location is greater than 5 feet below ground surface The soil samples will be collected using a split-spoon sampler Drilling and sampling will be performed by Northeast Diamond Drilling Company of Union Maine capable of working on hazardouswaste sites under Level C personnel protection
412 Soil Analysis Program
Analytical procedures are identified in the Quality Assurance Project Plan (QAPP) The samples will be analyzed using 1988 CLP methods for PCB cPAHs and lead by Ceimic of Narragansett Rhode Island EPA methods 9045 9060 and 9080 will be used to analyze soils for pH TOC and CEC respectively A summary of the analyses to be performed on soil samples including replicates and blanks is shown in Table 2 Samples will be collected in I-Chem glassware or equivalent and stored at 4 deg C as described in Section 6
A series of quality control blanks (replicates and blanks) will be collected by GEI and analyzed by the laboratory to aid in data assessment as discussed in the Quality Assurance Project Plan (QAPP) All quality control samples will be labelled with false sample identification as shown in Table 2 in order to avoid laboratory bias
Sampling equipment blanks and aqueous trip blanks will be submitted for every ten soil samples during the sampling program to check for the presence of cross-contamination These will provide a quality control check for decontamination and handling practices The trip blanks will contain laboratory-supplied organic-free water and will accompany the shipment of soil samples during storage and shipment The trip blanks will be analyzed for PCBs (sample identification will be TP26-TP29) Wipe
Document Vol II SC SAP Revision 1
Date March 28 1991 Page 18
samples will be collected from the shovel or hand trowel and split-spoon sampler (sample identification numbers TP30-TP33 and TP34-TP37 respectively) after decontamination and will be analyzed for PCBs Wipe sampling procedures are described as part of barn sampling procedures in Section 562 One replicate sample will be collected for every ten soil samples Replicate sample locations and identification numbers are indicated on Table 2
413 Soil Sample Designation
Each piece of soil sample glassware will be affixed with a self-sticking adhesive label Each label will be completed with an indelible marker to contain the following information
GEI Consultants Inc Site Name Project Number Sampling Date and Time Sample Number Samplers Initials Analysis Requested
The sample number is composed of a series of information to identify the sample as unique to the sampling point and sampling event The sample number labelled in the field and referred to on all associated documents is composed of the following
Matrix Project Sampling Location Sample Number
Soil - 90393 -TP2-SS1
The example sample number above indicates that soil sample SSI was collected from Test Pit No 2 under project number 90393
4JZ Sediment
431 General
Sediment samples will be collected by GEI from the Upland Marsh the Upper Lagoon and the Lower Lagoon during April 1991 A summary of the laboratory analyses of sediment samples is listed on Table 3 Procedures for sampling and equipment decontamination are provided in Section 5 Appendix A and the QAPP
Document Vol II SC SAP Revision 1
Date March 28 1991 Page 19
In general the sediment sampling program includes collection of the following two basic categories of samples
1 Two composite sediment samples collected using a clam-shell sampler for bench-scale testing
2 Eleven sediment samples (including one replicate) collected with a tube sediment sampler to provide additional data on sediment quality and for estimating the quantity of contaminated sediments
The two composite sediment samples collected using a clam-shell type sampler for bench-scale testing will be collected within the Upper Lagoon and Lower Lagoon at the locations shown on Figure 4 Based on the data in the RI the Upper Lagoon contained the higher sediment concentrations of PCBs
The eleven sediment samples collected to provide additional data on sediment quality and for estimating the quantity of sediments will be collected at the locations shown on Figure 4 As shown on the figure six sediment sampling locations were chosen for the Upland Marsh two locations were chosen for the Upper Lagoon and two locations for the Lower Lagoon
Detailed descriptions of the methods and equipment to be used during the sampling program are provided in Section 5 In general a temporary reference bench mark will be surveyed and staked adjacent to each surface water body by a surveyor licensed in the State of Maine and OSHA-approved for working on a hazardous waste site The actual sediment sampling locations will be measured by tape and compass bearings from the reference bench mark prior to sampling For the bench-scale sample a 5shygallon sample container will be filled with sediment from the dredge type sample The samples for providing additional data on sediment PCB concentrations will be collected with a tubesediment sampler pushed into the complete thickness of sediment at the sampling location All sampling equipment will be decontaminated using methanol and distilled water rinses before each use
4SL2 Sediment Analysis Program
Analytical procedures are identified in the Quality Assurance Project Plan (QAPP) Sediment samples will be submitted to Ceimic of Narragansett Rhode Island for laboratory analysis utilizing CLP protocols The samples collected for bench-scale testing will be analyzed for PCBs The remainder of the sediment samples will be analyzed for PCBs cPAHs and lead One sediment sample will also be analyzed for total organic carbon (TOC) cation exchange capacity (CEC) and pH by EPA methods 9060 9080 and 9045 respectively A summary of analyses to be performed on
Document Vol II SC SAP Revision 1
Date March 28 1991 Page 20
sediment samples including replicates and blanks is shown in Table 3 Samples will be collected in I-Chem glassware or equivalent and stored at 4degC as described in Section 6
A series of quality control samples (replicates and blanks) Will be collected by GEI and analyzed by the laboratory to aid in data assessment as discussed in the Quality Assurance Project Plan (QAPP) All qualitycontrol samples will be labelled withfalse sample identification as shown in Table 3 in order to avoid laboratory bias
Two sampling equipment blanks and one aqueous trip blank will be submitted during the sampling program to check for the presence of cross-contamination These will provide a quality control check for decontamination and sample handling practices The trip blank containing laboratory-supplied organic free water will accompany the shipment of sediment samples and will be analyzed for PCBs (Sample ID SED7) Wipe samples will be collected from the tube sediment sampler and dredge sampler after decontamination and will be analyzed for PCBs (sample identification numbers SED9 and SED8 respectively) Wipe sampling procedures are described as part of barn sampling procedures in Section 562 One replicate sample will be collected during sediment sampling Replicate sample location and identification is indicated on Table 3
423 Sediment Sample Designation
Each piece of sediment sample glassware will be affixed with a self-sticking adhesive label Each label will be completed with an indelible marker to contain the following information
GEI Consultants Inc Site Name Project Number Sampling Date and Time Sample Number Samplers Initials Analysis Requested
The sample number is composed of a series of information to identify the sample as unique to the sampling point and sampling event The sample number labelled in the field and referred to on all associated documents is composed of the following
Matrix Project Surface Water Body Sample Location
SED - 90393 - UM - SED1
Document Vol II SC SAP Revision 1
Date March 28 1991 Page 21
The example sample was obtained from sample location SED1 in the Upland Marsh under project number 90393 The surface water body designations for the Upper Lagoon and the Lower Lagoon will be UL and LL respectively
43 Surface Water
431 General
Surface water quality data consisting of two samples each from the Upland Marsh Upper Lagoon and the Lower Lagoon will be collected by GEI in April 1991 Sampling locations are shown on Figure 4 Surface water sampling locations will be determined in the field by tape and compass bearings from the temporary reference bench mark established for sediment sampling A summary of the analyses to be performed on surface water samples including duplicates and blanks is shown on Table 4 Detailed descriptions of the sampling methods to be used during surface water sampling are provided in Section 5 In general the depth of the water at the sampling location will be measured at each sampling location with a weighted tape measure prior to collecting the surface water sample A water sample will be collected after lowering a stainless steel Kemmerer sampling device one-half the total depth of the water column All sampling equipment will be decontaminated using methanol and distilled water rinses before each sampling event
433 Surface Water Analysis Program
Analytical procedures are identified in the Quality Assurance Project Plan (QAPP) All of the surface water samples will be analyzed using 1988 CLP methods for PCBs aluminum and lead One sample from each surface water body will also be Submitted for Total Suspended Solids Analysis (EPA Method 1602) A summary of the analyses to be performed on surface water samples including duplicates and blanks is shown on Table 4 Surface water samples will be submitted to Ceimic Corporation for laboratory analysis Samples will be collected in I-Chem glassware or equivalent and stored at 40 C as described in Section 6
A series of quality control samples (duplicates and blanks) will be collected by GEI and analyzed by the laboratory to aid in data assessment as discussed in the Quality Assurance Project Plan (QAPP) All quality control samples will be labelled with false sample identification as shown in Table 4 and described below in order to avoid laboratory bias
One sampling equipment blank and a trip blank will be submitted during each sampling round to Check for the presence of cross-contamination These will provide a quality control check for decontamination and handling practices One trip blank
Document Vol II SC SAP Revision 1
Date March 28 1991 Page 22
sample consisting of laboratory-supplied organic-free and de-ionized water will accompany the samples during storage and shipment and will be analyzed for PCBs aluminum and lead (sample identificationwill be SW4) A samplingequipment blank will be collected by pouring laboratory-supplied organic-free and de-ionized water through the Kemmerer sampler at the end of the sampling program The sampling equipment blank will then be analyzed for PCBs aluminum and lead (sample identification will be SW5)
One surface water duplicate will also be collected each sampling round Duplicate sample location and identification is indicated on Table 4
433 Surface Water Sample Designation
Each piece of sample glassware will be affixed With a self-sticking adhesive label Each label will be completed with an indelible marker to contain the following information
GEI Consultants Inc Site Name Project Number Sampling Date and Time Samplers Initials Analyses Requested
The sample number is composed of a series of information to identify the sample as unique to the sampling point and sampling event The sample number labelled in the field and referred to on all associated documents is composed of the following
Matrix Project Surface Water Body Sampling Location
SW - 90393 - UM - SW1
The example sample number above indicates thata surface water sample was obtained from the Upland Marsh at location SW1 under Project Number 90393 The surface water body designations for the Upper Lagoon and the Lower Lagoon will be UL and LL respectively
Document Vol II SC SAP Revision 1
Date March 28 1991 Page 23
44 Barn
441 General
A total of approximately 30 samples of various media within the barn will be collected by GEI during May 1991 The types of media collected will generally consist of wood fragments from barn walls dust concrete and wipes on non-porous debris within the barn The exact sample locations will be primarily determined in the field based on observations during sampling (eg staining on soils concrete or wood) Based on a site visit by GEI on December 19 1990 preliminary sample locations for barn materials were chosen as shown in Figure 5 These preliminary locations will enable representative sampling of general debris and staining in the barn and indicates the general sampling strategy which will be employed during Pre-Design Final sampling locations may be modified during the program based on closer observation of equipment barn materials and evidence of staining
Detailed descriptions of the methods to be used during the barn sampling program are provided in Section 5 In general a survey of the general types of materials present in the bam and locations of apparent staining of surficiial materials or debris will be recorded on a plan Following the survey representative areas within the barn will be sampled A total of 12 wipe samples will be collected (eg steel shelves boat wood stove electric meters etc) by wiping a 100 cm2 area with laboratory-prepared sampling wipes A total of ten samples of Wood from the walls of the barn will be collected by using a wood boring bit and wood chisel A total of four samples of loose dust will be collected from the floor of the concrete slab of the barn using disposable nylon brushes and stainless steel trowels Finally a total of four samples of concrete will be collected from areas of visible staining and one unstained area by drilling the concrete to a maximum depth of 12 inch in a 100 cm2 area All non-disposal steel sampling equipment will be decontaminated using methanol and distilled water rinses before use at each sampling location
442 Barn Analysis Program
Analytical procedures are identified in the Quality Assurance Project Plan (QAPP) Three field equipment blanks and three trip blanks will be submitted during the barn sampling program to check for the presence of cross-contamination These will provide aquality control check on decontamination and handling practicesAsummary of the analyses to be performed on each sample matrix and the quality controlsamples is shown in Table 5
Document Vol II SC SAP Revision 1
Date March 28 1991 Page 24
Wipe wood dust and concrete samples will be submitted to Ceimic in Narragansett Rhode Island for laboratory analysis Wood dust and concrete samples will be analyzed for PCBs cPAHs and lead Samples will be collected in I-Chem glassware or equivalent provided by Ceimic and preserved and stored as described in Section 6
The objective of the barn sampling program is to provide a preliminary assessment of the degree of contamination present within the barn (see Section 2) It may be difficult to ensure that representative replicates can be made of the various matrices during sampling Therefore no replicate samples of barn materials will be collected during this initial sampling effort
Aqueous trip blank wipe samples will accompany the samples during storage and shipment and will be analyzed for PCBs (sample identification will be PTB1-PTB3) Sampling equipment blank wipes will be made following decontamination of all steel sampling equipment at various times during the sampling program The steel equipment wiped will include the hole saw trowel and the drill bit used for barn wall dust and concrete sampling respectively The equipment wipe samples will then be analyzed for PCBs (sample identification will be PEB1-PEB3)gt
443 Barn Sample Designation
Each piece of sample glassware will be affixed with a self-sticking adhesive label Each label will be completed with an indelible marker to contain the following information
GEI Consultants Inc Site Name Project Number Sampling Data and Time Sample Number Samplers Initials Analysis Requested
The sample number is composed of a series of information to identify the sample as unique to the sampling point and sampling event The sample number labelled in the field and referred to on all associated documents is composed of the following
General Sample Location Project Sample Type Sample
BARN - 90393 - D2
Document Vol II SC SAP Revision 1
Date March 28 1991 Page 24a
The example sample number above indicates that a barn sample was obtained under project number 90393 and was the second dust sample collected The designations for the wipe samples will be P wooden samples W dust samples D concrete samples C and other samples O
Document Vol II SC SAP Revision 1
Date March 28 1991 Page 25
5 SAMPLING EQUIPMENT AND PROCEDURES
51 Air Monitoring
Short-term air monitoring will be performed regularly on-site during the Source Control (SC) sampling program A HNu photoionization detector (PID) and an MIE Model MINIRAM hand-held aerosol monitor (HAM) will be used for air monitoring The PID is capable of detecting total ionizable compounds (typically VOCs) and the HAM detects solid or liquid particulates in air which often take the form of dust smoke fumes and mists Each air monitoring instrument will be operated in accordance with the requirements specified in the Health and Safety Plan provided in Appendix A Readings from the PID and HAM will be recorded in the Project Field Log Book (see Appendix B) Calibration procedures for the PID (HNu Model PI-101) and the HAM (MIE Model MINIRAM) are provided in Appendix C
52 Soil Sampling
521 General
Soil sampling locations are shown on Figure 3 Table 1 lists each soil sampling location planned approximate sample depth and rationale for sample collection
Prior to sampling a surveyor registered in the State of Maine will survey the exact location of each test pit and boring location and provide a temporary stake that will function as a bench mark for horizontal and vertical control within 20 feet of each test pit and at each boring Sample locations within test pits will be by tape and compass bearing methods
Soil sampling will be performed with strict adherence to the procedures described below A list of equipment requirements for the soil sampling program is provided in Table 6 In general excavation of soil to the target depth in test pits will be performed with a backhoe for sampling to 5 feet below ground surface The backhoe and operator will be supplied by HE Sargent Inc and the operator will be equipped with Level C personnel protection (see Appendix A) A bombardier or truck-mounted drill rig operated by Northeast Diamond Drilling by personnel equipped with Level C protection will be utilized for sampling points greater than 5 feet below ground surface Soil samples collected by GEI for possible bench-scale testing will be obtained only at test pit locations Ambient air monitoring will be performed by GEI regularly while working on-site for health and safety monitoring Mobilization
Document VoL II SC SAP Revision 1
Date March 28 1991 Page 26
of equipment and transportation of materials over the site during the soil sampling program will avoid heavily contaminated transformer work areas when possible to reduce dispersing PCBs to other areas Drilling and excavating equipment will be decontaminated under the supervision of GEI prior to use at each sampling location following strict decontamination procedures described in Appendix A and below Sampling equipment will be decontaminated by GEI prior to each sampling event as described below All soil sampling operations within the site will be performed using Level C dermal and respiratory personnel protective equipment to protect against PCB-contaminated dust levels which are likely to exceed 1 mgm3 during sampling The detailed Health and Safety Plan that will be followed during soil sampling is provided in Appendix A
522 Soil Sampling Methods for Test Pits
A minimum of a two-person crew in addition to the backhoe operator or the drill rig crew will be provided by GEI during the sampling program
All soil samples will be collected from test pits by GEI with a shovel or trowel following excavation to the appropriate depth with a rubber tire backhoe as follows
1 Check the survey stakes for the proper test pit number identification and location
2 Place polyethylene sheeting on each side of the test pit for staging the excavated soils from the test pit
3 A standard rubber tire type backhoe will perform the soil excavation to the planned sampling depth All soil excavated from the test pit will be placed on the plastic sheeting adjacent to the test pit The top 2 feet of excavated soil will be cast to one side of the test pit on the sheeting and the bottom 3 feet of soil will be cast to the opposite side to avoid mixing soils with potentially significantly different levels of contamination After completion of sampling soil will be backfilled at a similar depth from which it was excavated
4 All excavation activities will be continuously observed by an engineer or geologist from GEI A test pit log form (OCONNORFL12) will be completed by GEI for each test pit performed and will include the following information
Document Vol II SC SAP Revision 0
Date January 17 1991 Page 27
Name and Location of Job Date Excavation and Test Pit Number Approximate Ground Surface Elevation at Test Pit Total Depth of Test Pit Dimensions of Test Pit Location and Depth of Soil Sample Relative to Stake Reference Method of Soil Sample Acquisition (Shovel Trowel) Volume of Soil Sample J Soil and Stratigraphic Descriptions x
Ground Water Levels (if encountered) y ^v Air Monitoring Information v Other observations Such as soil staining buried debris etc
5 At least one photograph will be taken oflta wall of each test pit from within the test pit with a scale for comparison to indicate soil layering or staining In addition one photograph shall be taken of thertesVpit from the ground surface also showing sample locations withinthe-test pit Photographs of the test pits will be marked to include site locationxjdbmumber^test pit number date and time A photograph log sheet will be maintained fampMuture reference
6 The target soil sampling elevation will be determined by GEI using a level and rod
7 Soil sampling will begin from within the test pit only after the side walls of the pit have been properly^sloped back in accordance with OSHA requirements (see Health and Safety Plan^ Appendix A) All samples collected will be identified on the test pit logazid in the field book Information about the sample including sample number^de^th voiuine and soil description will be recorded The soil sample will be colleetedTrotn an undisturbed area of the test pit floor or wall by means of scraping or digging with a stainless steel shovel or trowel The number of clean sampling utensils for each test pit shall be equal to the number of soil samples collected at the test pit Shovels or trowels used to clean sloughed material from the sampling location will not be used to collect the sample unless decontaminated before use in sampling Care will be taken to assure that the sample is taken from the actual soil unit desired mid does not include slough or scraped material from the sides of the trench The desired soil sample will be immediately placed into the sample container within the test pit A portion of the sample will be retained for screening with the Dexsil L-2000 PCB analyzer The containers will then be sealed labelled and stored in asecure area until Shipment to the laboratory
Document Vol II SC SAP Revision 1
Date March 28 1991 Page 28
8 When collecting a larger volume sample for bench-scale testing a smaller soil sample will first be collected for field screening using the Dexsil L-2000 PCB Analyzer If the analyzer indicates that the PCB concentration is within the target range the bench-scale soil sample will be collected If the Analyzer indicates that the PCB concentration is outside the target range the test pit will be expanded if necessary and another sample will be collected for PCB screening This procedure will be continued until a sample within the target range is identified The test pit will be expanded no more than 2 feet in all directions and to the maximum depth of 5 feet below ground surface If after this over-excavation the soil within the target concentration range has not been identified with the Dexsil L-2000 PCB Analyzer a new test pit location will be selected near the original test pit in an area indicated by the Remedial Investigation to contain soil contamination within the target range
9 Once the targeted PCB concentration has been indicated by field screening the desired soil sample will be collected with a clean stainless steel trowel or shovel at a sufficient quantity to fill a 5-gallon container An aliquot from the 5-gallon sample container will be collected and placed in an appropriate sample container for laboratory analysis for PCBs The 5-gallon containers will then be sealed labelled and appropriately stored in a secure area until transported off-site The laboratory samples will be sealed labelled and stored with the other soil samples awaiting shipment to the laboratory
10 Upon completion of sample collection the excavated soil material will then be backfilled into the test pit The backfilled area will be compacted to the approximate original ground elevation
11 Equipment will be decontaminated after backfilling the test pit (ie shovel trowels measuring equipment) byscrubbing and With methanol and distilled water rinses Portions of the backhoe (bucket bucket arm etc) will be decontaminated with a high-pressure steam rinse on the decontamination pad (see Appendix A)
523 Soil Sampling Methods for Borings
Selected soil samples are planned to be collected at depths greater than 5 feet below ground surface to obtain additional data on the depth of PCB contaminationexceeding cleanup standards in Transformer Work Areas Samples will be obtained using split-spoon sampling techniques within 3-inch ID hollow stem augers in test borings generally following procedures specified by American Society for Testing Materials (ASTM) D1586-84 Test borings will be performed by Northeast Diamond Drilling
Document Vol II SC SAP Revision 1
Date March 28 1991 Page 29
under the observation of an engineer or geologist from GEI The following procedures not specified in ASTM D1586-84 will be used
1 Place a polyethylene sheet on one side of the boring location for temporarily staging drilling cuttings during borehole advancement All drilling equipment shall be decontaminated with a high pressure steam rinse on the decontamination pad prior to beginning drilling
2 Advance hollow-stem augers without split-spoon sampling to a depth about 5 feet above the sampling depth specified in Table 1
3 Begin continuous split-spoon sampling with 18-inch-long samples Collect a specimen from the middle of each sample for screening with the Dexsil L-2000 PCB analyzer and the HNu photoionization detector Rinse the split-spoon sampler with methanol and distilled water rinses before each sample
4 Collect a split-spoon sample at the designated sample depth Divide the split-spoon sample vertically Place a minimum of 4 inches of sample recovered from the bottom right half of the sample into the glass sample container Seal and label the sample container as indicated in Section 4 and store the container in a cooler with ice in a secure area until shipment to the laboratory Retain the left half of the split-spoon sample for screening with the Dexsil 1^2000 PCB analyzer and the HNu photoionization detector
5 After collecting the final soil sample in the boring measure depth to ground water below ground surface using a decontaminated Solinst battery-operated water level indicator Record the time elapsed after completion of the boring when the ground water level was measured
6 Remove augers from borehole If the borehole remains open and evidence of ground water was encountered during sampling collect additional measurements of depth to ground water prior to backfilling until the ground water level appears to stabilize Note occurrence of precipitation or other events which could effect water level measurements in the project log book
7 Backfill borehole within 24 hours after completion of the boring with drill cuttings staged adjacent to the borehole If the borehole collapses and cuttings cannot be backfilled in the borehole store staged cuttings in a steel drum to be left on site Label outside of drum to indicate contents are borehole cuttings from the designated boring number and affix labelindicating PCB-contaminated materials Cuttings from more than one boring can be combined in a single drum
Document Vol II SC SAP Revision 0
Date January 17 1991 Page 30
8 Decontaminate measuring and sampling equipment with methanol and distilled water rinses Decontaminate downhole drilling equipment on the decontamination pad with a high-pressure steam rinse before starting the next boring
A log will be prepared by GEI for each boring and will include the following
information 7
Name and Location of Project
Boring Number lt Date of Boring Ground Surface Elevation x-Boring Diameter and Depth Sample Numbers and Depths Soil Screening Data Visual Soil Descriptions Water Level Measurements Air Monitoring Levels Other Observations
The boring log form is provrdedin Appendix B (OCONNORFL15)V
i
Surface Water ^^7
531 General
N
Surface water sam^les^will becollected at the locations shown in Figure 4 If water is too deep for safe aecess^with hip-waders andor access with hip waders will severely disturb sediment an inflatableboat will be used to access Surface water sampling locations
The surface water sampling program will be performed following strict adherence to the following procedures A list of the equipment requirements for surface water sampling is provided in Table 8 In general ambient air monitoring will be performed regularly while working on-site for health and safety considerations Areas of the site which have been determined by previous studies to have elevated concentrations of PCBs in soils (for example TWAs) will be avoided while traversing the site to reduce the likelihood of dispersing PCBs to other areas The depth of water at the sampling stations will be measured and the surface water elevation will be surveyed on each water body Equipment will be decontaminated prior to use at each sampling station following decontamination procedures
Document Vol II SC SAP Revision 0
Date January 17 1991 Page 31
532 Surface Water Sampling Methods
Surface water samples will be collected during the Pre-Design Study at the locations shown on Figure 4 Surface water samples will be collected during the initial stage of the Source Control sampling program prior to soil and sediment sampling An inflatable boat will be used to access surface water sampling locations if there is sufficient water depth The boat will be cleaned with methanol and distilled water rinses before sampling in each water body The surface water sampling procedures will be as follows ltX1 Determine the location of the sampling station by tape^and compass from a
temporary bench mark at the edge of the surface water body x
2 Measure the depth of water at the sampling station with a weighted tape measure x (
^ 3 Gently lower a clean Kemmerer sample^bottle to the desired depth (one-half
water depth) so as not to remove th^stoppeisprematurely V^
4 Pull out the stopper with a sharp jerk ofdhe sampler line
5 Allow the bottle to fill completelyras evidenced by the cessation of air bubbles
6 Raise the sample and capdhe nottle X x
7 Pour the sampl^fromthe bottle into the appropriate sample container The container willbesealedlabelled and stored in a secure area until shipment to the laboratory
8 Fill a beaker with water remaining in the sampler and measure specific conductance pH and temperature
9 Decontaminate the sampling apparatus measuring tape and Kemmerer sampler by scrubbing internally and externally with methanol and distilled water rinses
10 Record the following surface water sampling information in the project log book (OCONNORFL1)
Document Vol II SC SAP Revision 0
Date January 17 1991 Page 32
Date Time Total Depth of Water Location and Depth of Sample pH Conductivity Measurements Air monitoring levels detected Other observations
Sediment
541 General x
gt The locations of the sediment sampling stations are shown on Figure 4 Table 3 lists the various sampling stations and sampling methods for the sampling program Sediment sampling during the project will beperformed with strict adherence to the following procedures A list of equipment requirements for the sediment sampling program is provided in Table7 In general ambientw monitoring will be performed regularly while working on-site for health-and safetymonitoring Mobilization of equipment and materials over the sitdduring^he-sediment sampling program will follow specific routes to reduce the likelihoocKPfdispersing PCBs to other areas Equipment will be decontaminated prior to sampling at each location following strict decontamination procedures described belowy All sediment sampling operations within the site will be performed fusing level C dermal personnel protective equipment and Level D respiratory^protective equipment will be worn
v ^
542 Sediment Sampling Methods gtSN
The sediment sampling^vili be performed after collection of surface water samples and will consist of rivo primary components
1 Tube sediment smiling to provide additional data on sediment quality and to estimate the thickness of sediment
2 Dredge sediment sampling to obtain a sample for laboratory for bench-scale treatability testing
The tube sediment sampling program will be performed as follows
Document Vol II SC SAP Revision 0
Date January 17 1991 Page 33
1 Determine the sampling locations by tape and compass measurements from a temporary bench mark (reference stake) surveyed near the edge of the surface water body Access locations in interior portions of the water bodies using an inflatable rubber boat The boat will be decontaminated with methanol and distilled water rinses before use in each surface water body
2 Measure the depth of water with a weighted tape measure
3 Lower the hand tube sediment sampler to the desired ctepth Sediment entering the tube is trapped by a plastic core retainer allbyringlheunit to be retrieved a n d t h e s a m p l e r e m o v e d w i t h o u t s a m p l e l o s s X x y
4 Extract the sediment samplefrom the sampler and^immediately place the sample
into the sample container The containers ywllthen be sealed labelled and stored on ice in a cooler in a secure area until shipment to the laboratory
5 Decontaminate the sampling apparatua and measuring tape by scrubbing with methanol and distilled water rinses
vw 7 Record sediment sampling record information in the project log book
(OCONNORFL2) after collecting a sediment sample at each sampling station The information that will beuro~documenteamp includes the following
Date and Time ^ Total Depth of Water N Thickness of Sediment Location of Sample Length and Vblume^of Simple Sample Description x- Air Monitoring LevetesDeteeted Other Observations
The sediment sampling procedure for collecting samples for bench-scale treatability testing will be as follows
1 Determine the location of the dredge traverse line by tape and compass bearings from the temporarily bench mark adjacent to the surface water body
2 Pull the sediment dredge along the planned traverse with a wire line from the edge of the surface water body
Document Vol II SC SAP Revision 0
Date January 17 1991 Page 34
3 Repeat sampling until 5 gallons of sediment have been collected and placed in the 5-gallon sample container The containers will then be sealed labelled and stored in a secure area until shipment to the laboratory
4 Decontaminate the sampling apparatusand drag line by scrubbing with methanol and distilled water rinses
S6 Record the following sedimentsampling informationin die project log book after
sample collection X nXx
Date and Time X gt Total Depth of Water Location and Volume of Sample Number of Grab Samples Collected to Form Composite Volume Sample Description Air Monitoring Levels Detected x X Other Observations
Barn
5-51 General
Sampling within the barn will4gteperformed with strict adherence to the following procedures A list of equipment requirements for the barn sampling program is provided in Table 9 Areas of the Site which have been determined by previous studies to have elevatedconcentrations of PCBs in soils (for example TWAs) will be avoided during bam sampling to reduce the likelihood of dispersing PCBs to other areas within the barnXEquipment will be decontaminated prior to use at each sampling location inside thetarn following strict decontamination procedures All sampling operations withfaMhe barn will be performed with Level C personnel protective equipment due to dust levels which may to exceed 1 mgm3 during sampling (see Appendix A) A detailed Health and Safety Plan which will be followed during barn sampling is provided in Appendix A
552 Barn Sampling Methods
If power is not available on-site a gasoline-powered generator capable of supplying electricity for lighting and sampling equipment will be positioned outside the fenced area of the site prior to sampling Extension cords will be run to the barn (avoiding TWAI) for power supply In order to reduce the potential for cross-contamination due to dust generation the sampling of different matrices will proceed in the
Document Vol II SC SAP Revision 0
Date January 17 1991 Page 35
following sequence 1) wipe samplingof non-porous debris 2)wood sampling of barn walls 3) dust sampling from top of floor slab 4) concrete sampling of floor slab Areas to be sampled will be chosen based on the presence of apparent oil-type staining and to obtainan even distributionof representative samples with no apparent staining
Following sampling at each location a self-sticking adhesive label marked with the sample number will be placed at the sample location for future reference Each label will then be located by taping relative to a reference point Established at the western corner of the barn (W-Z corner) as shown in Figure 5 Walls W and Z will be used as orthogonal axes similar to a typical coordinate system For samples collected above the concrete floor slab (eg wipe and wooden wall samples the height above the floor slab will also be recorded All samples willbe collected between the floor slab and a maximum height of seven feet All location measurements and a brief description of the area sampled will be recorded on the Barn Sampling Form (OCONNORFL13) provided in Appendix B Imaddition a photograph of each sampling location will be taken and^ recordedy on the Photograph Log (OCONNORFL6) Detailed procedures-for each type of sample to be collected during the barn sampling program follows
lt Win Samnlino N
1 Identify the non-porous item within the barn selected to be sampled which has an area of at least 100 cm2 which maybe wiped Examples include sheet metal fiberglass cleanly painted wooden surfaces glass etc
2 Place a decontaminated stainless steel or plastic 100 cm2 (10 cm X 10 cm) template at t^desired sampling location
Note For smaller areas such as on electric meters use the quarter template of 25 cm2 area and make four wipes to compose one sample
3 Remove the laboratory-supplied gauze from within the glassware with stainless steel forceps The gauze should be moist with solvent as prepared by the laboratory
4 While holding the appropriate template in place thoroughly swab the 100 cm2 area with the gauze using forceps or bufyl rubber gloves Inspect the area to ensure that all loose dust has been wiped with the Alter paper
Document Vol II SC SAP Revision 0
Date January 17 1991 Page 36
5 Fold the gauze over to ensure that the dust is contained on the inside of the gauze Place in the appropriate sample container seal label and store in a secure area until shipment to the laboratory
6 Decontaminate the forceps and templates by scrubbing with methanol rinsing with distilled water and wiping dry with paper towels
7 Label the sample location photograph and complete^he Barn Sampling Form
(see Appendix B) and other necessary documentation after each sample is
c o l l e c t e d lt X x x y x x
xWooden Wall Sampling X
1 Select the sampling area of at least 100 cm2 on the inside wall of the barn and secure a decontaminated 100cm2 template at the location Place a steel pan below the sampling area to catch sawdust ancLwood chips
2 Using an electric drill equipped withra-one-ineh diameter wood-boring bit drill out wood within the template area to arnaximum depth of 12 inch
3 Place sawdust and wood chips man appropriate sample container seal label and store in a secure area untiLsRipinent to the laboratory
4 Decontaminate the drilTbit and pan by scrubbing with methanol rinsing with distilled water and jwiping dry with paper towels
5 Label the samplelocatidn photograph and complete the Barn Sampling Form (see Appendix^)
Dust on Floor Slab Sampling
1 Select an area to sample such that at least 100 grams of dust or soil may be obtained This will vary depending on thickness of the dust or soil
2 Using a disposable nylon brush or stainlesssteel trowel brush or scrape dustsoil toward the center of the area chosen minimizing the creation of airborne dust
3 After the dustsoil has been centralized use a flat stainless steel trowel to collect the material and place in laboratory-supplied glassware seal and label
Document Vol II SC SAP Revision 0
Date January 17 1991 Page 37
4 Dispose of the nylon brush with other containerized PCB-waste materials and decontaminate the stainless steel trowelsby scrubbingwith methanol rinsingwith distilled water and wiping dry with paper towels
5 Label the sample location photograph and complete the Barn Sampling Form
Concrete Slab Sampling
1 Identify three areas of visible staining and one area of no visible staining on the floor slab Using a disposable nylon brush carefulfy brushxaway loose dust and soil from an approximately 1-square-foot area
2 Place a pre-cut 10-square-foot sheet of clean polyethylene sheeting with a 1shysquare foot hole cut in the center over thevsampling area and secure in place with duct tape Place a decontaminated lOO cmr template in the center where t h e s a m p l e i s t o b e o b t a i n e d X v N
3 Using an electric hammer drill eqi^pedwitlra^ungsten-carbide mortar bit drill the four corners established by the tempfate^to a maximum depth of 12 inch
4 Remove the template ancLdrilL the remaining 100 cm2 within the established square to a maximum dep^fof l2Jnch
-vFollowing drilling brush the concrete chips and dust from the plastic sheeting toward the center otlhe sarhplihggtarea Collect sample with a clean disposable nylon brush andtrowel and place in an appropriate sample container seal label and store in aSecure area until shipment to the laboratory
6 Dispose of the nylon oriish with other containerized PCB-contaminated waste materials and decontaminate the stainless steel trowel and template by scrubbing with methanol rinsing with distilled water and wiping dry with paper towels
7 Remove and dispose of the polyethylene sheeting and duct tape in an appropriately marked barrel that will remain on the site with other sampling waste disposal materials Label the samplinglocation photograph and complete the Barn Sampling Form
Document Vol II SC SAP Revision 0
Date January 17 1991 Page 38
6 SAMPLE HANDLING AND ANALYSIS
61 General
GEI has established a program of sample chain-of-custody that is followed during sample handling activities in both field and laboratory operations Thisvprogram is designed to assure that each sample is accounted for at all times To accomplish this objective sample container labels sampling records chain-of-custody records sample assignment forms shipping airbill records and laboratory receipt sheets must be completed by the appropriate sampling and laboratory personnel ^ y gt
62 Sample Labeling and Documentation gt
The plastic 5-gallon containers for bench-scale testingsWilKbe cleaned with methanol and distilled water rinses prior to use All other sample containers^will be pre-cleaned by EPA-approved methods and provided by the laboratory^ A summary of the sample containers and preservation requirements for each of thamp^analytieal parameters to be measured is shown in Table 10 Each piece of sample gl^sware^will be affixed with a self-sticking adhesive label Each label will contain the information described in Sections 4 and 5 of this document ^
To further document the samplingprogr^mand Sample handling procedures the project log book (OCONNORFL1) will containinformation regarding the activities on-site and sample handling In addition photographs of each type of field procedure will be taken The photographs will be representative of thetechniques employed throughout the sampling program A record ofeach photograph Will be made on the Photograph Log (OCONNORFL6) as stiown 4i^Appendix B
63 Chain-of-CustodySample^Assignment
Chain-of-custody will be maintained at all times as described in more detail in the Quality Assurance Project Plan (QAPP) A copy of the chain-of-custody form (OCONNORFL9) to be used is provided in Appendix B
In general the chain-of-custody record must be used such that it includes the following information
Document Vol II SC SAP Revision 0
Date January 17 1991 Page 39
Project name and number Names of the sampler(s) and person shipping the samples Station number or well identification Date and time the samples were collected Composited or grab sample designation Sample number (eg 1GU-90393-MW101A) Total number of containers Analysis requested Date and time the samples were delivered for shipping Names of those responsible for receiving the sampled at the laboratory
Prior to shipment of the samples a sample assignment form will be completed (see OCONNORFLIO in Appendix B) The sample assignmenrform will provide the contract laboratory sufficient information to process the samples and perform the appropriate analysis
The chain-of-custody record and sample assignment fornr will both be completed in duplicate in the field through the use of carbon paperT The original copy of the forms will be enclosed in a plastic bag and placed in the coolersWith the samples for shipment to the laboratory The carbon copy of the forms will be retained by GEL
VSoil samples for bench-scale testing ynH be-stored on site in a locked storage shed until samples are selected for the bench-scale7testing^ This decision will be made after receipt of the laboratory PCB analyses results and approval of the Source Control Work Plan by the EPA Soil samples not usecLfor bench-scale testing will remain in the locked storage shed and will be included with-other soil for treatment during the Remedial Action
lt v 64 Sample Shipments
Sample containers are generally packed in coolers for shipment Prior to packing organic analysis samples will be placed in plastic bags Bottles are to be packed tightly so that no motion is possible Styrofoam vermiculite and bubble pack are suitable for most instances Ice Will be placed in sealed plastic bags or ice packs in order to keep samples at 4degC at all times Samples will be protected against freezing during cold weather The original chain-of-custody and sample assignment forms will be sealed in plastic bags and placed in the cooler with the samples The cooler will be closed and a signed self-sticking label with the words Custody Seal will placed between the body of the cooler and the cover The cover will then be sealed with clear tape Samples will be shipped so that they are received by the laboratory no later than 60 hours from the time of sample collection
Document Vol II SC SAP Revision 0
Date January 17 1991 Page 40
All shipping of samples will be done through Federal Express or equivalent overnight delivery service Samples will be shipped in accordance with Department of Transportation (DOT) regulations If prompt arrival of the samples cannot be guaranteed the samplers will be responsible for proper storage of the samples until adequate transportation arrangements can be made The laboratory will be notified prior to shipment to arrange for receiving the samples and to prepare for the analyses requested Based on the low concentrations of chemicals detected during previous studies theSamples will be classified as environmental samples The air bill for the samples will speeiiythat the contents of the cooler are environmental or hazardoussamples as appropriated When samples are received by the laboratory they will notify the Task Manager of theccondition of the samples
H craTrsi
TABLE 1 - SOIL SAMPLING SCHEDULE Field Sampling Plan OConnor Co Site Augusta Maine
DEPTH APPROXIMATE BELOW ANTICIPATED
SAMPLE NUMBER SAMPLE GROUND PCS GENERAL LOCATION OF ELEVATION SURFACE CONCENTRATION SOIL
ID SAMPLES (MSL) (PPm) TYPE COMMENTS
TP1 2175 25 ND ClaySandy Till Confirm contours 215 35 ND
TP2 217 15 50 ClaySandy Till Confirm contours TP3 212 ND Siltv Clav Confirm horizontal extent toward marsh TP4 211 5-50 Clav Obtain bench scale 20-50 ppm
TP5 213 50-500 Clay Confirm lateral extent
TP6 215 15 5-50 Fill Obtain bench test sample In 1-10 ppm
TP7 210 35 0-5 Siltv Fine Sand Confirm vertical extent in drainage area
217 3 0-5 FillClay Confirm contours TP8 219 1 0-5 TP9 207 35 0-5 Siltv Fine Sand Confirm vertical extent In drainage area
TP10 1175 15 50-5000 Fill Bench scale test sample 50 to 500 ppm
TP11 218 0-5 SandClay Confirm horizontal extent toward marsh
TP12 218 0-5 SandPay Confirm horizontal extent toward marsh
TP13 221 5-50 Clav Bench-scale test sample 10-20 ppm
TP14 206 0-5 Gray Silty Clay Confirm vertical extent
TP15 200 0-5 Gray Silty Clay Confirm vertical extent
TP16 2185 15 5-50 Clay Bench-scale test sample 1-10 ppm
228 4 TP17 230 2 Confirm contouring in north end of site
231 4 TP18 233 2 Confirm contourtng in north end of site
236 4 TP19 238 2 Confirm contouring in north end Of site
Project 90393 GEI Consultants Inc Page 1 of 2 March 28 1991
SAMPLE NUMBER LOCATION OF
SAMPLES
TP20 TP21 TP22 TP23
TP24 TP25
B1
B2
1 B3 2
B4
B5
ND = Not Detected
TABLE 1
APPROXIMATE SAMPLE
ELEVATION MSLJ
231 233
2275 237 237 235 236 222 210 215 210 215
215 220
218 220 220 222
- SOIL SAMPLING SCHEDULE Field Sampling Plan OConnor Co Site Augusta Maine
DHTH BELOW
GROUND SURFACE
4 2
15
2 1
8 3 8 3
12 6
8 6 6 4
ANTICIPATED PC8
CONCENTRATION
ND ND 0-5
500-5000 5-50
50-5000 0-5
50-500
0-5 50-500
0-5 0-5 0-5 0-5
GENERAL SOIL TYPE
Clavev Silt Silty Clay
Clay
Till or Clay
Till or Clay
Gray Silt
Gray Clavev Silt
Gray Clayey Silt
i
Confirm contouring in north end of site Confirm contours Confirm contours Confirm contours
Confirm contours Bench scale sample 50-500 ppm
Confirm contouring and vertical extent
Confirm Contouring and vertical extent
Confirm contours and vertical extent
Confirm contours and vertical extent
Confirm contours
Project 90393 GEI Consultants Inc Page 2 of 2 March 28 1991
TABLE 2 SOIL ANALYSIS PROGRAM Field Sampling Plan OConnor Co Site Augusta Maine
Sample Depth
Sample Location ID
SoB Sample Number
(ft below ground surface) Lead cPAHs PCBs
pH TOC CEC
Anatyticsd Level IV
TEST PITS TP1 SS1 TP2 SS1 15
SS2 35 TP3 SS1 TP4 SSI
SS2 TP5 SSI TP6 SS1 15
SS2 15 TP7 SS2 35 TP8 SSI
SS2 TP9 SSI 35
replicate of SS2 SSI
TP10 SS1 15 SS2 15
TP11 SSI TP12 SSI TP13 SS1
SS2 TP14 SS1 TP15 SS1
replicate of SS2 SS1
TP16 551 15 552 15
TP17 551 552
TP18 551 552
TP19 551 552
TP20 551 552
TP21 SS1 15 TP22 SS1
Project 90393 GEI Consultants Inc Page 1 of 2 March 281991
TABLE 2 SOIL ANALYSIS PROGRAM Field Sampling Plan OConnor Co Site Augusta Maine
Sample Depth
Sample Location ID
SoB Sample Number
(ft below ground surface) Lead cPAHs PCBs
pHTOC CEC
Analytical Level IV
Bench Scale
Sample
replicate of SS2 SS1
TP23 SS1 TP24 SS1
SS2 TP25 SSI
SS2 BORINGS
B1 SS1 SS2
B2 SS1 SS2
B3 SS1 6 replicate of
SS2 SS1 SS3 12
B4 551 552
B5 551 552
QUALITY CONTROL TP26-TP29
(trip blank) SS1-SS4 TP30-TP33 (shovel or
hand trowel SS1-SS4 blank)
TP34-TP37 (split-spoon
blank) SS1-SS4 TOTAL
ANALYSES 40 40 64 15 12
TOC - Total Oraanic Carbon CEC - Cation Exchange Capacity
Will be designated to the laboratory as matrix spikematrix spike duplicate
Additional trip blanks may be needed to ensure one trip blank per cooler
Project 90393 GEI Consultants Inc Page 2 of 2 March 281991
TABLE 3 SEDIMENT ANALYSIS PROGRAM Field Sampling Plan OConnor Company Site Augusta Maine
PH Bench Sample TOC Analytical Scale
Sample Location Number Lead cPAHs PCBs CEC Level IV Sample
Surface Water Body
SED1
SED2
SED3Upland Marsh (UM) SED4
SED5
SED6
SED1
SED2Upper Lagoon (UL)
SED3
SED4
Lower Lagoon (LL) SED1
SED2
SED3
SED7 (trip blank)
SED8Quality Control (dredge
blank)
SED9 (tube
samples blank)
Total Analyses 11 11 16
TOC - Total Organic Carbon CEC - Cation Exchange Capacity
UL SED2 is a replicate sample of UL SED1
Will be designated to the laboratory as matrix spikematrix spike duplicate
Additional trip blanks may be needed to ensure one trip blank per cooler
Project 90393 GEI Consultants Inc March 281991
TABLE 4 - SURFACE WATER ANALYSIS PROGRAM Field Sampling Plan OConnor Co Site Augusta Maine
SAMPLE SAMPLE LOCATION NUMBER Lead Aluminum PCBs
Upland SW1 X X X Marsh (UM) SW2 X X X
Upper SW1 X X X Lagoon (UL) SW2 X X X
SW3 X X X
Lower SW1 X X X Lagoon (LL) SW2 X X X
Quality Control Samples
Trip Blank SW4
Sampler Blank SW5
TOTAL ANALYSES
TSD - Total Suspended Solids
SW2 is a duplicate of SW1
Will be designated to the laboratory as matrix spikematrix spike duplicate
Additional trip blanks may be needed to ensure one trip blank per cooler
Project 90393 GEI Consultants Inc Page 1 of 1 March 28 1991
TABLE 5 - BARN SAMPLING ANALYSIS PROGRAM Field Sampling Plan OConnor Co Site Augusta Maine
SAMPLE MATRIX PCBS CPAHS Lead
Analytical Level IV
Wipe samples PTB (trip blank) PEB (equipment blank)
12 3 3
Wooden wall samples 10 10 10
Dustsoil on floor slab
Concrete slab
Total Analyses 36 18 18
Additional trip blanks may be needed to ensure one trip blank per cooler
One sample will be designated to the laboratory as a matrix spikematrix spike duplicate
Project 90393 GEI Consultants Inc Page 1 of 1 March 281991
TABLE 6 - SOIL SAMPLING EQUIPMENT REQUIREMENTS Field Sampling Plan OConnor Co Site Augusta Maine
Safety Equipment (Level C - Dermal)
Health and Safety Plan (copy) Portable Photoionization Detector (HNu) Hand-held Aerosol Monitor (HAM) Disposable Tyvek Coveralls Tyvek Hoods Duct Tape Safety Goggles Safety Boots Surgical Gloves Butyl Sampling Gloves n gt Rubber Boots or DisposableBooties Hard Hats (when near qverhead objects)
Safety Equipment (Level C - Respiratory)
Sampling and Measuring Equipment
Other
Full-face Respirators Combined Organic Vapor and
High-efficientcy particulate Cartridges Dust Prefilters
Level and Rod Measuring^Tape Stainless -SteeLShovels Stainless Stee^T rowels 165-foot Measuring Tape Methanol V
Distilled Water Paper Towels
SafopltngjSlassware (See Table 10) xCo6lers with Ice or Ice Pack
Clear Plastic Tape Re-sealable Plastic Bags
Gallon Drums
ite Maps Project Log Books Marking Pens Camera Photograph Log Forms Test Pit Log Forms Boring Log Forms Chain-of-Custody Forms Sample Assignment Forms Equipment Calibration Logs Extra Bottle Labels Spare AA Batteries for Meters Blank Federal Express Airbills
Project 90393 GEI Consultants Inc Page 1 of 1 January 171991
TABLE 7 - SEDIMENT SAMPLING EQUIPMENT REQUIREMENTS Field Sampling Plan OConnor Co Site Augusta Maine
Safety Equipment (Level C - Dermal)
Safety Equipment (Level C - Respiratory)
Sampling and Measuring Equipment
Other
GEI Consultants Inc
Health and Safety Plan (copy) Portable Photoionization Detector (HNu) Hand-held Aerosol Monitor (HAM) Disposable Tyvek Coveralls Tyvek Hoods Duct Tape Floatation Vest Inflatable Boat Safety Goggles Safety Boots Surgical Gloves Butyl Sampling Gloves Rubber Boots or Disposable obties Hard Hats (when near overheackobjepts)
V Full-face Respirators Combined Organic Vaporand
High-efficiencyHPartjculate Cartridges Dust Prefilters
Level andRod Measuring Tapp 165-foot MPasuririgTape Methanol V Distilled Water jper tpwels V
SjE(mplinsect~Glassware (See Table 10) Cdolbrs wlthjbe or Ice Pack
Clear Plastic Tape Re-sealable Plastic Bags
-Galloh Drums fghted Measuring Tape e Sediment Sampler dge Sediment Sampler
Site Maps Project Log Books Marking Pens Camera Photograph Log Forms Chain-of-Custody Forms Sample Assignment Forms Equipment Calibration Logs Extra Bottle Labels Spare AA Batteries for Meters Blank Federal Express Airbills
Project 90393 Page 1 of 1 January 17 1991
TABLE 8 - SURFACE WATER SAMPLING EQUIPMENT REQUIREMENTS Field Sampling Plan OConnor Co Site Augusta Maine
Safety Equipment (Level C - Dermal)
Safety Equipment (Level C - Respiratory)
Sampling and Measuring Equipment
Health and Safety Plan (copy) Portable Photoionization Detector (HNu) Hand-held Aerosol Monitor (HAM) Disposable Tyvek Coveralls Floatation Vest Inflatable Boat Tyvek Hoods Duct Tape Safety Goggles Safety Boots Surgical Gloves Butyl Sampling Gloves Rubber Boots or Disposable Booties Hard Hats (when nearOverhead objects)
w Full-face Respirators Combined OrganicVaporand
High-efficiency Particulate Cartridges Dust Pi
Level and Rod
Measuring Tape M3amp-foot Measuring Tape JsopropyhAlcohol Mbthanol DistlHed Water PaperTowels Sampling Glassware (See Table 6)
oolers with Ice or Ice Pack tear Plastic Tape
Re-sealable Plastic Bags 55-Gallon Drums Weighted Measuring Tape Kenmerer Sampler Disposable 045 Micron Field Filters Pressure Pump for Field Filtering pH Meter with Temperature Probe Cole-Parmer pH-40 70 Calibration Solutions Cole-Parmer 1413 Micromhoscm Calibration Solution
Project 90393 GEI Consultants Inc Page 1 of 2 January 171991
TABLE 8 - SURFACE WATER SAMPLING EQUIPMENT REQUIREMENTS Field Sampling Plan OConnor Co Site Augusta Maine
Other Site Maps Project Log Books Marking Pens Camera Photograph Log Forms Chain-of-Custody Forms Sample Assignment Forms Equipment Calibration Logs lt Extra Bottle Labels Spare AA Batteries forM6ters Blank Federal Express Airbills Xy
Project 90393 GEI Consultants Inc Page 2 of 2 January 171991
TABLE 9 - BARN SAMPLING EQUIPMENT REQUIREMENTS Field Sampling Plan OConnor Co Site Augusta Maine
Safety Equipment (Level C - Dermal)
Safety Equipment (Level C - Respiratory)
Sampling and Measuring Equipment
Other
Health and Safety Plan (copy) Portable Photoionization Detector (HNu) Hand-held Aerosol Monitor (HAM) Disposable Tyvek Coveralls Floatation Vest Tyvek Hoods Duct Tape Safety Goggles Safety Boots Surgical Gloves Butyl Sampling Gloves Rubber Boots or Disposable Bboties Hard Hats (when near overheackpbjects)
Full-face Respirators Combined OrganicVapor and
High-efficiencyParticutale Cartridges Dust Prefilters
Gas powered electrfcgenerator 5 gallonsgaspline 350 feetNplectricahextfnsion cord Self-standin^work-larnps (200 watts minimum) Electric 38drilkwith two 1-inch wood boring bits ElectricBoschhammer drillwtungsten-carbidemortar bit Hpound-cut polyethylene sheeting and duct tape
Steel blaRing sheet X^vdiSpdsabfe nylon brushes
Stainless steel trowels Three 100 cm templates andone 25 cm template Forceps Peper towels Silf-sticking adhesive labels and push pins
Site Maps Project Log Books Marking Pens Camera Photograph Log Forms Bam Sampling Forms Chain-of-Custody Forms Sample Assignment Forms Equipment Calibration Logs Extra Bottle Labels Spare AA Batteries for Meters Blank Federal Express Airbills
Project 90393 GEI Consultants Inc Page 1 of 1 January 171991
TABLE 10 - SAMPLE CONTAINERS AND PRESERVATION REQUIREMENTS Field Sampling Plan OConnor Co Site Augusta Maine
Holding Media Parameter Container Preservation Time
PCBs 8 oz glass jar 4deg C 14 days-with Teflon- extraction lined lid 40 days shy
analysis
cPAHs 8 oz glass jar 4deg C 14 days-SOIL with Teflon- extractionSEDIMENT lined lid 40 days shyWOOD
analysisCONCRETE AND WIPE Lead 8 oz glass jar 4deg C 6 months SAMPLES with Teflon-
lined lid
Bench-scale 5 gallon high NA NA testing density
polyethylene bucket
PCBs Two 1-liter 4deg C 7 days shyamber glass extraction bottles 40 days shy
SURFACE analysis WATER
Lead 500mi HN03 4deg C 6 monthsSAMPLES polyethylene to pH bottle lt20
Aluminum 500ml HN03 4deg C 6 months polyethylene to pH bottle lt20
NOTE All standard sample containers will be l-CHEM equivalent bottles supplied by the laboratory The 5-gallon polyethylene bucket will be rinsed with methanol and distilled water prior to use
NA = Not applicable
Project 90393 GEI Consultants Inc March 28 1991
gt 1I L )
i bullbullbull j bullgti sil- j-V
poundP
A C
jfr35
QUAOnANQLE LOCATIONTOOU9 POND MAINEJI881)N4416-W37-307B
bull4000 FEET
Central Maine Power Company Pre-Design Work Plans SITE Augusta Maine OConnor Site LOCATIONFrom EC Jordon Co RIFS
Augusta Maine MAPReport dated June 1989
C D Project 90393 January 1991 Fig 1 G E I C o n s u l t a n t s I n c
b-r
p pp l-I 0 x foooo^ _^_ZZZ~~r^-^
UpoundEtpound 1IMA iRAMWOfMII NOW AM A OAAMAG IWAllrj WWEOfOHAMMS MHICUOn Central Maine Power Company Pre-Design Work Plans LOCAIION Oh
in cuelt^KL2 Augusta Maine OConnor Site TRANSFORMER
Scale 1 inch = 142 feet Augusta Maine WORK AREAS AND SWALESFrom EC Jordon Co RIFS
Report dated June 1989 C D G E I C o n s u l t a n t s I n c Prnjprf QfttM January 1QQ1 Fifl 0
~- bull middot bull -middot r middot~middotmiddotmiddotIll middotmiddot t~r
I bull Imiddot
bull bull1 middotmiddot middotir-------~-------middot ~ bull middot middot-------------------middotmiddot ~ middotmiddotmiddotamiddot A middotimiddot r bull amiddot A I bull TWA I tmiddot LOW AREA A NO~TH) SOUTH) I
v
A middot
rmiddot---middot---middot~middot---- ----middot~middot [WEST) [W[ST) (EASr) middot I
middot middot middotmiddot AmiddotA D-D 220 SCRAP ARf-A 201 -
bull - I
nor 140 TWA I 2bull0
1 bull middotbullmiddot1~-~~ L~W AR1-A ---- middot-~ l0 ~
i r bull I -$-~middot
0 - )1 _~ ~ middot1~oi I EEltY
J I ~2J~ bullbull
bullf()omiddot middotmiddot middot~ bull0 2 i- 0
11bull I lo bull ~middotmiddotmiddot~middot ~ ~--middotmiddot~middotbull ~-8~-i~~jplusmny~f~=ii1 - ~ bull ___ I I- _5 middot~bull-tmiddoti~middot~ N ~ bullbull ~ i I o middot TP19 gt - ~ ~ Jmiddot ~I middot~middot~I bullJUI 215 middot 215~-I e bull TP23 if 21~ ~ middot middot middot_ ------ ~middot - L middot~ ~ ~~ 1 i i
235 middotQ1middot1middotmiddot ~ bullbull ~~middot~middot- Lil middot~ _~ middot f bulllto --- z middotmiddot middot
middotr
-lt lt -middot I ~ middot ~ I
1 c ~ __ ) bull bull bullmiddot bull --middot Q
middot bull bullbull - 1middotmiddot - bullbull ~middots middot- uPPfR 1middotmiddot T LAGOON 1middot middot -$- middot middotmiddotpoundpound~middotmiddotmiddotmiddotmiddot bull =lt middot
~ middot ~~ iP22 gt middotgt
w
210 I
-
------_7___ 210 1 _
w_ +-
middot middot w--~ J210 middot i~30 -- middot_
1 TP18 bull middotmiddotI middot~ ----shy middot-middotmiddot
middot~ I j
middot- t - I 1 I BEDROCK 11 I
1
lmiddotmiddotomiddotmiddotmiddotmiddotmiddot middot middot middot =middot _middotmiddot middotmiddotmiddotmiddot 1 I rI Th 205 bull 205
bull -middotmiddot bull_ 1 225 22 middot bullbullbull fltISmiddot middot middot ~ ~middot f4tmiddotmiddotmiddot I J205 1bull
middot OOTR10U1t0N craquo-middotPC~middot~oN~A~ SEL11r~~~TS H LO~ AR~A ------------------------------------------------bull1 BASEO IN PART ON QBSERVATION Of FILL PlACEMENTmiddot bullmiddot E~middot-1middot bull bullbullbull middotmiddot Q - _
_
-1 I
fmiddot bull bull
-middotmiddot I r-middot shy c bull
I omiddotmiddot
r- middotmiddotI ~I
1 middot1 r bull bullf-Sf1 TWA I middotbull middot ~ i1 bull bull middot (EASfJbullI middot-----bullI (WEST) middotI bull I 1I cmiddot middot~ I~ ~ I bull bullbullbullI 1bullbull
(EAST) - bull middot- - I
bull bull r ~middot l
~
~30 i
2io bull
middot) Ibullbull
I
- J l TPl7 bull- f ~j -middot middotmiddotmiddotmiddot I 1 J middotmiddot1
middot~ ~ bull middotimiddotmiddotch bull bull_ t-ROAOI cli middot bull ~ middot1middot
225
I bull ILmiddot i~A--middot1middot 225 bull
1225 middot I ~ CENTRAL DRAINAGE middotmiddotmiddot--Q-middot --middot _ --middot
~ I -- -shy A middot
bull B-B --- m
- _ - middoti-- 10bull ~ m
g r
220 220 I ~
I middot _
l MI r ~ I
middot middot 1bull bull1 111
I rbull bull
middot
bull bull l
215 BEOROC~ 215
bull I bull middot - -
) l
-middotshy- bull Il
I 5 -middot middot middottc bull bull gt f bull 110 1~ w 210 210 ~ middotmiddotmiddotmiddotmiddot middot-middot -
( bull
middotlt bull [ I
bull G -
-middot-
middot middotmiddot bull ~middot-middot-- -middot- t~middotmiddotmiddotmiddotmiddotmiddot middotmiddot middot L -middot 1 -middot~ bull bull - middotmiddot L middot-~ _ bull f middot middot1 I ~ l
205 bull bull ~middot JO~cmiddotimiddotmiddotmiddotmiddot middot--middotmiddotmiddot1 _~ middotmiddotmiddotmiddotmiddot middotmiddotmiddotmiddotmiddotmiddot bullI bull middot -middotmiddotmiddotmiddotmiddotmiddotg
bull -$-middotmiddotmiddot middot~middot iii~~- ~0 i TB-20 SUBSURFACE BORING NUMBER bull bull bull TPmiddot 105 TEST PIT NUMBER
middot
bull1
bull I TP16 middotmiddotmiddotmiddotmiddot~ Q G) ) mmiddot i GROUND SURFACEmiddot bull 1bull 1middot bull I i ~ u o I bullbullbull I~ bullbullbull bullbullbullbullbullbullbullbullbullbullbullbull bullbullbullbullbullbullbullbullbullbull bull middot bull
ll bull bullbullbull middotmiddotoz bull I 250 CONCENTRATION OF PCBs IN SCREENED SAMPLE lPPm) r lt bull bull I
middot CONCENTRATION CONTOUR middot middot bull - -- CROSS-SECTIONS CONTOURED AT 5ppm 50ppm ANO 500 ppm TOTAL PCBs
middotbull middotmiddot c- I bull ~~ ND NOT DElECTED -middot ~ I
middotmiddot middot--middot~ middot sect t I middot UNDERLINED VALUES ARE CLP RESULTS (ppm)bull
middot -____ bull ~~ - -- I
bull bull middot -middot middot bull Ibullbull middot ~- middot --- LEGEND (ISOPACH MAP) bull lmiddot I l
I
-middot 1 middot I
bull middot ~SUBSURFACE EJORING LOCATION middot
-t middot ( 10766 - 10 10186) middot middot J BORING NUMBER -2 middot THICKNESS OF SOIL CONTAINING PCBs IN EXCESS OF 5 ppm
I
bull ~ middot
LOW AREA BORING LOCTION (107187)
- I j
I
bull BORING LETTER - ~ THlC~NESS OF SOIL C011TAINING PCBs IN EXCESS oF Sppm middot middot middot middottmiddot=plusmn+ TEStPIT LOCATION 1 bull bull bullbullbull i 0~ Q G) I -$ ELECTRICAL EQUIPMENT SAMPLE POINl middot middot -middot bull 1-1 I ~ bull
If bull bull ) bullbull bullbullbullbullbullbullbullbullbullbull f4( middot~01 l - bullmiddotomiddot
middot - ( ~-~ SURFICIAL EXTENT OF SOILS CONTAINING gtSppm PCBs bull middot (
bull __ ~ -middot middot_ middotmiddotmiddotmiddotmiddotmiddotmiddotmiddot _ - middotmiddot --- bull bull -bull - ISOPACH LINE ILLUSTRATING THICKNESS OF SOILS CONTAMINATED BY middot middot middot -middot~middotmiddotbullmiddotmiddotmiddot middotmiddotmiddot bullbull middot middot bull middotmiddot middot 8 -- bull _CONTOURS [)RAWN _-- ~ _l bull abull lO_fEF lran_~OUllCStRF~CI gt~~~~ ~~~~bull
I bull middot T o o bull bull middot middotmiddot
) NOTES 1 -middot -middot bull
I1 THE ISOPACH CONTOURS WEREDRAWN TO DENOTE THE THICKNESS OF SOIL ~ Q iP1 middot 0 bullbull 5 bull GEi BORING LOCATIONS middotMEASURED FROM THE SURFACE CONTAMINATED BY GREATER THAN 5ppm TOTAL PCBs bullbull bull bull I THE VALUE OF 5ppm WAS CHOSEN ARBITRARILY AND IS NOT INTENDED TO REPRESENT
middot bullv middot-- - l A SITE-SPECIFIC CLEAN-UP LEVEJ GEi TEST PIT LOCATIONS
2 CRO~S-SECTIONS ILLUSTRAt EXTENT OF PCB CONTAMINATION WITH DEPTH I middot- -f j bull I
_ veRTt6l1 EXAGGEP1r10M m c~oss sicT1c~S 1s 61 middot
bull
middot
I middotshy1
middot J~uJt bull bull i ~ ~ _ - middot j
1 ~ middot bull bull bull middotmiddot l a )
0 gt bullmiddot -~I middotbull I 0 middot r middot- bull ibull I
bull
_ _ I I ~
middot I
bull bull
bull middot~r
- -middot- - -
bullI l middotI middot I bull r f I I
~_ Igt bull
bull f middot
t bull middot bullbull 8 _
~ 7 I r 9
-middot- bull bull I I ~
middot 1
bull ____________________________ ___ _ bull I
bullI 1 bull middot -~ bullr
---------r- -- -- middot~-~~~~middot--middot ~ f middoti middot
bull t ~
bull
middot j
1
-------- -------- ---------------------------- ti 1
bull ~---middot ------middot ~---middotmiddotmiddotmiddot-middot--middot-middot~---middot-- ___~------- middotmiddotmiddot middot middotrbull ~ ~--~~-~middot-~ 1 middotmiddotmiddot I
middot bull middot4J middotmiddot 1 middot
middotI 1
I
bull
bull
middot ~ middotimiddot 1 bull j-1 ~ bullbull bull I bull i ~
APPROXIMATE SCALE I DESIGNED
~ BY
bullIbull Imiddot bull SOURCEmiddot EC JORDON CO RlFS middot bull Central Maine Power Company Pre-Design Work Plans SOIL I ~ t
middot
middot bullmiddot I ~middotmiddot ( bull bull REPORT DATED JUNE 1989 bullL bullr middotmiddot bull ~I middotmiddot DRAWN BY I I bull 1 r bull ~ middotmiddot middot
bull r shy~middot r i Augusta Maine OConnor Site bull SAMPLING I Imiddot 0 middot bull
bullI
bull bull
r bull 40 80
J 1bullmiddot
CHECKED BY Augusta Maine middotLOCATIONS
h cf I ~ 1bull rmiddot_
1 Inch =~Feet t--~------~---_middotmiddot~ I ~middot bullgtIbull
) i _- DATE January1991 middot middot middotmiddotmiddot tbull middot1middotmiddot APPROVED BY GE I Consultants Inc
middot
middotmiddot middot t---P-R_O_J-EC_T_9_0_39-3-----4-S-H-E-ETmiddotmiddotOfFbull t DATE REVISION BYmiddotmiddot J middotFlg3 middot
1 nuovN( POST middot 1 Nl6~1 middot bullbull Ibull Ibull bull bull lomiddot bullbull -
I
I
I
------------ -
) bull middot i bull I
~ f I middot1 bull ~I r
I
middot
-middot- CJ middotYmiddotmiddot I
C bull
middot
I middot I
middot -shy bull bull middotmiddot~
J middot _ bull y
Ibull bull
~ bull ~~ r I bull middot bull
middot bull
I ~ I I ( I bull
JI t
- I
J l I
-~ 1 I
bull j middot middot~ ~ middot) __-_ bull i
Ibull I lt bull
middotmiddotmiddot
gtImiddotmiddot
I
I bull
middotmiddotmiddotmiddot_v -
~ bull J i 1 bullbull
r 1 I ~ middotbull middotbull
I I I l~_middotgt~~bullI~~~bull~middotmiddot jbull1111 1 bull~ - 1 111 middot~ bull1 middot 1middot I jbull I bullI _- middotmiddot 1 1t1 _ 1 (Imiddot 1 bull1 1gt middot~middotlt~middot middot
I l bull bull 1 r I bull bull middot
bull middot middot middot middot~middot ~middot middot~
- J ~J ~~ O lt hj I bull ~ bull bull 1 o t I lbull I
middotmiddot bull ~ middot I bull middot bull bull
middot bull - I middot ~middot
bull 11 ( _ I
middot I Ii lfI ltI
bull
I 1- bull_ II ~ I middot
I bull vmiddotmiddot
30 I ~middot middot bull bull
lt 1 I ---middot _ bull I ~ bull bull ~ bull
II ~
111
bull bulll3 bull ~ middotmiddot bull Ibull 0 I 1 bull 111 bull bull I rbull1 middot 0 I I I - Ibullmiddot 1 bull r middot middot __ -
i bullmiddot ~ ----middot yen ~ bull ~ j
--~middot
I
I
- -- ( middotmiddot~middotmiddot- - bullbull~ _ ~- I ~ bull--- shymiddot ----bull
1- -
bullbull I I - ~ I I bull middot middot ~ I middot
1
---- _ --
bull1 II I j
I bullbullbullbull
II ~
J 1bull ~
I
bull I I bull I ~ middot Tmiddot I 1 ~ bull JI I t Ibull bull ~ bull middot
I -
-----~_ middot1
-1
~
bullbull
-
bullbull I
middot---- a I AiLWO _ middotshy
I
bull f l
I bullbull - middot I - bullbullbull
SVf1
S~D1- -0 sih3 0
I I 0 1 i ---shy (]
middot bullgt I
I J middot bull bull IIbull Iamp middot P I 177
r o ~ 0 SEol l-middot J~ I - -- ltl
f bull bull
gt1 bullI 1 V bull ~ II ~ tJ middot -middot-
I
middot1 - bull bull bull -middot
bullmiddot -bull wmiddot ~ ~ ~
bull IA1 gtW2 - gt1
- - ~ -
middotmiddotmiddot----- ~r=02 bull bullmiddot I __ i Ctt1rr--shy
bullI
Q bull _
1
D I bullbull middot - bull
SW2
I middot- bull
bullI ~middot
rl
~ se02 I bullbullbull I bullbull ~ L-lf L-- I
- ___ bull bull___ I bullbullbull
I bull ) I f IIUZ middot___ ---- bull cu bull
I gt
bullbull -shyI bull Ii bull f
~ middotmiddot~ ~ middot - I
I bull ~ ) I~ shy bullfmiddot~ ~ i ~ ~middot
~ I 1
bull 4 Ot f I
1 i f ~ bull lt
1
bull bull I
___ - ~)____ - ------~ -------middot-middot-r--middot-middot ----middot- - ---middot-middot-middot-middotbull
t t - -- a
I middot bull -- middot - __ __--~~~=--~---_-~= _ _ middot - I ii- - ~~=-=~==--=~middotmiddot-~=~~~~~~=-~~~======middot=middot~middot== middotmiddot-- _ - I
bull -------------------~_
t ~middot middot middot middotbull bull middot i------------1I Imiddot ~~f~=-~~J~i~~~f~U+--f~~~===~~-~~middot~f~=~=~=~~fi~-~-~==~~-==~==~~==~====~==~-=-==~=~=2~~~~~~~77=~=~=~~-=~s)middot==~~~--=-=~~~=~=~====-=====~~=~~~~~=~=~=~==~==-=~=~=middot
middot 7gt JloltGKLA lllD --- shy l lf-nt RT n bull middotl bull
I
-i~------ - -- -------- -- --= bull (
( ei -~ ---- -------- - - - - - bull - shyI bull middot 1 ------
--------~____-____ bull SSmiddotsmiddot~middot2-iJi_8plusmn~plusmn-~~plusmn=+=~==-=-==~~===~~~~~~=-=s~~2~-~s-==~~~z--==~=~~t-=-=-=-==-=---~34~~~-==-=-==-==~=middot==---~=-middot~i~middotmiddot~ middot)~ f ________bull _
~--- __ - ____ - bull shyI I
bull __ _ ~ ~ ~ middott1 middot_
J(J--_ 11bull middot ------deg gt
middot -f ~~~se~middot~ARm~OMAarra~PERfOAMagtBY 0 middot~ bullO ( l r
r-------------liDElmiNEiiiiY-r---Amiddot----------________---~-------------_____ __________middotmiddot_lIbull middotmiddotmiddot ACHERON ENOINEERINCI 8ERVJCED COMPLIED IU8lo BASll MAP
(middot VERIFIED TO MEET NATIONAL MAP ACCUAACI 8TANOARD8(NMJ) middot Tl1ROUQltATEaT GURVltY CONOUCIED Df JORDM 121aa LEG~ APPROXJMATESCALE DESIGNED BY
-----------_ ---------~ CentralMalnePowerCompany p D W kPI middotSURFACEWATERANDmiddotmiddot_-~middotmiddot~~~middotFitow~middot~(TOO~MEETNMAamp DRAwN BY re- es1gn or ans middot middot middot shy bull bull bull - bull
bull Aug~sta Maine OConnor Sitamiddot SEDIMENT SAMPLING middot3middot~~~middot~--~~amCla~~~~~~usa-o middot O GEISEDIMEITTSAMPUN~LOCATI~Ns o 40 middot 80 1
BY LOCATIONS ~middot)~middot ~ bull 11i GEISURFACEWATERSAMPUNGLOCATIONS middot CHECKE
rh A~gustaMalne lt middotmiddot( middotmiddot 11nch-40Feet DATEmiddot January 1991
middot APPRovED BY -V GEi Consultants Inc ~ Imiddotgtmiddotgt middotmiddot middot middot souRCE EC JORDON co RlFS bull middot GEi COMPOSITE SEDIMENT SAMPLE bull DATE REVISION BY - PROJECT 90393 SHEET OF middotI middotmiddot middotI middotAEPORTDATEDJUNE1989 v COUECTEDFORBENCH-SCAIETESTING
I J ~ I
i I bull I )__ )
I I ilo I Ibull
X -4 mdashmdash-0shy
W A Elec-Zl lt4W
Meters Shelves ^ Pickup
A CapAntique a)
W WAutomobile W J
ia iW Y
W A o
LEGEND C w
Stove - wBoat X Designated Wall Label w
-e- -fr bulleshybull Cement SlabDust Sample
0 Wooden Wall Sample ZTaping Reference Origin
W Wipe Sample
Approximate Scale
NOTES 30 Feet
1 Ail locations on this plan are approximate
2 Sample locations are general Central Maine Power Company Pre-Design Work Hans EXAMPLE examples of the type of sampling Augusta Maine OConnor Site BARN SAMPLINGand the distribution Augusta Maine LOCATIONS
3 Revision No 1 (3-28-91) ltP G E I C o n s u l t a n t s I n c Project 90393336 January 1990 Fig 5
I I I I
I
I I
I
I
I
I
I
Document VoL II SC SAP Appendix A Revision 0
Date January 171991 Page 1
V
APPENDIX A zgt
s HEALTH AND SAFETY-PLAN
Source Control PrampDesign Studies CConnorCO^Site
Augusta Mkine shy_ lt
lt
NT lt
Document Vol II SC SAP Appendix A Revision 0
Date January 171991 Page 2
GEI CONSULTANTS INC SITE HEALTH AND SAFETY PLAN
Site Name OConnor Co Site
Site address Street Route 17 Qty Augusta State Maine
Proposed Site Activities Source Controlsampling of surface andsubsurface soilssediments surface water and the on-site barn
Proposed Date of Work April 1991 gt S
Original Safety Plan YES
Site Safety Coordinator Thomas S Bobowski
Client Central Maine Power Company^(CMP)
Site Contact Charles Nickerson (CMP)
Team PERSONNEL ^ IRESPONSIBILITIES Robert E Stetkar lt ^mjectManager Joanne O Morin Work Tlans and Pre-Design Studies Manager Richard F Murdock Qhality Assurance Officer Benjamin YSu Treatability Studies Manager Joseph G Engels Technical Consultant Steven R fcambx Source Control Sampling Task Manager Thomas S Bobowski7 Barn Sampling Coordinator Sampling Boyd P Smith Sampling Christopher L Covel Sampling William J Haswell Sampling Charles Blodgett Field Screening Analytical
Background Information
The OConnor Co Site (Site) covers approximately a 9-acre portion of a 65-acre parcel within the city limits of Augusta Maine The Site is surrounded by sparsely-developed residential or agricultural properties or undeveloped woods and wetlands (Riggs Brook and associated wetlands border the Site to the east) The F OConnor Co operated a transformer stripping and recycling operation on theSite from the1950s through the 1970s
Document VoL II SC SAP Appendix A Revision 0
Date January 171991 Page 3
During operations releases of wastes including PCB-laden oils resulted in contamination of water and soil on the site Principal features of the Site include a barn which formerly housed scrap operations an upland marsh formed by man-made disruption of natural surface water drainage upper and lower surfacewater impoundments (lagoons) constructed to control migration of oils from the Site a low area where excavated lagoon sediments were deposited within a clay liner three former transformer work areas a former scrap yard and a wetland associated with Riggs Brook A site plan depicting some of the major features of the site is shown in Figure HS-1
Ax In 1986 and 1987 remedial investigations were performed byECvJdrdan Co for Central Maine Power Company (CMP) These investigations included over^OQ soil samples 11 monitoring wells and analysesof surface water ground water sediment and biota for PCBs organic and inorganic chemicals The primary contaminantsdetected in soil and sediments at the Site were PCBs PAHs and Lead Chlorinated benzenes PCBs phthalates and to a lesser extent volatile organics and metals were detected in ground water and PCBs and metals were detected in surface water Using these data Clement AssociatesInc performed an Endangerment Assessment in 1988 for EPA^evaluating risks to human health and the environment associated with existing condiuoi^ra^Tuture conditions related to a noshyaction remedial alternative In 1989 EC JordabCoi acting as consultant to CMP completed a Feasibility Study which evaluated remedial alternatives based on information provided in their earlier Remedial Investigation Report and in the EPA Risk Assessment Report After receipt of the Feasibility^Stiidy Report EPA issued a Record of Decision (ROD) in September 1989 describihg the^EPA^elected remedial alternatives for source control and management of migration
Site Status Waste Types
Includes the followin
Ground water Surface water Sediment Soils On-site structures
Refer to Table1for listing of chemicals of concern during Source Control studies per media sampled
Document VoL H SC SAP Appendix A Revision 0
Date January 171991 Page 4
Hazard Evaluation
Known orSuspected HazardousToxicMaterials Polychlorinated biphenyls (PCBs)volatile organic compounds (VOCs) polycyclic aromatic hydrocarbons (PAHs) and metals (especially Lead) The ranges of concentrations of chemicals detected in all source control media on-site are presented in the attached Tables 1C through 1L from previous studies Concentrations of PCBs PAHs and Lead detected in surficial soikduring previous studies (including the on-site Barn) are shown in Figures HS-2 HS^3 and HS-4 respectively Concentrations of chemicals detected in surface water and sediihentsduring previousstudies are shown in Figure HS-5 lt( x
The primary concern at the Site is contamination of surface soils by spillage or leakage of transformer oils containing PCBs The potential forencountering concentrated wastes in the transformer work areas (TWA I TWA II andltTWAIlI) is high In addition wastes have also been identified in soils and sediments associatedwith the lagoons and drainage swales Within a short distance of these discrete areas of the site the potential for encountering significant concentrations of wastes-is low ToYeduce the likelihood of being exposed by wastes associated with these areasduring~source control sampling activities efforts should be made to avoid walking unnecessgrilyriiv these areas
Exposure to hazards from chemiealsduiing test plying and environmental sampling and analysis tasks are most likely to occurbyone-or more of the following
1 Direct contact with contaminated surficial and subsurface soils sediments or surface-water x N
mdashN2 Inhalation of fu^Uve^ust carrying contaminants
3 Inhalation of volatile orgsuuc compound vapors while test pitting or sampling the various media on-site
Toxic and Pharmacological Effects Refer to the NIOSH Guide to Chemical Hazard Table 2 lists the major chemicals of concern and their toxic and pharmacological effects Acute exposure to PCBs PAHs Lead and VOCs may result in dizziness or nausea The results of chronic exposure may include but are not limited to central nervous system depression liver and kidney damage and irritation of skin eyes and respiratory passages Many PCBs PAHs and VOCs are known or suspected carcinogens Routes of exposure include inhalation topical and ingestion
Document Vol II SC SAP Appendix A Revision 1
Date March 28 1991 Page 5
Heat-related illnesses range from heat fatigue to heat stroke the latter being the most serious Heat stroke requires prompt treatment to prevent irreversible damage to health Protective clothing may have to be cut off Less serious forms of heat stress require prompt attention to prevent further complications which may lead to heat stroke Unless the victim is obviously contaminated decontamination procedures should be omitted or minimized so that treatment may begin immediately
Hypothermia may result from personnel exposed to excessive cold during sampling operations Hypothermia requires prompt treatment to prevent serious damage to health Damp or wet clothing may have to be cut off and the persons body temperature must be elevated as soon as possible through the use of warm blankets or another persons body warmth Unless the victim is obviously contaminated decontamination procedures should be omitted or minimized so that treatment may begin immediately
Area Within Augusta Maine city limits
Proposed On-Site Activities Test pitting boring or hand augering for collection of surface and subsurface soil samples collection of sediment and surface water samples from an inflatable boat or from wading into the water with hip-boots and collection of samples from within the on-site Barn Potential physical safety hazards during each of the four proposed Source Control site activities are discussed per activity below
Test Pitting and Borings for Surface and Subsurface Soil Samples A backhoe will be used during test pitting operations to excavate soil for collection of samples The most significant hazard during this sampling effort is the potential for collapse of the excavation while sampling Therefore in accordance with OSHA and 29CFR1926 Subpart P if personnel are required to enter an excavation the excavation will be no deeper than 5 feet unless it is braced or sloped back For the Type A soils documented on-site (eg clay and glacial till) the required slope from the ground surface to the top of unbraced portion of the excavation in all directions is 05 HORIZONTAL 1 VERTICAL Short-term excavations of this type will not exceed 12 feet in depth In general a drilling rig will likely be used to obtain samples from depths below 5 feet by augering to a specified depth and using a split-spoon sampler
Document Vol H SC SAP Appendix A Revision 1
Date March 28 1991 Page 6
Other physical hazards during test pitting and boring operations include the presence of overhead objects (eg backhoe bucket) so hard hats must be worn during these tasks at all times In addition the potential for spreading contamination with fugitive dust during excavation and mobilization between sampling locations is much greater than during other Source Control sampling efforts Therefore Level C dermal and respiratory equipment must be worn during all test pitting and boring operations (see below) Additional decontamination procedures will be required between sampling areas to limit the potential for cross-contamination (see below)
Sediment and Surface Water Sampling These operations will be conducted using Level C dermal protection only The need for respiratory protection will be based on criteria discussed in the next section In order to collect sediment and surface water samples in interior portions of the Upland Marsh and Upper and Lower Lagoons an inflatable boat or hip-boots will be used Further sampling will be performed by walking along the shores of the surface water bodies while dragging a sediment sampler These operations involve the risk of falling in relatively deep water while equipped with Level C dermal protection This equipment may limit movement and may inhibit a person from swimming easily to safety Therefore while sampling with the boat a Coast Guard Approved life vest will be worn at all times In addition one person will standby on-shore to observe the boat operation and to assist in the event of a mishap Depending on the water and air temperature at the time of sampling it is possible that a person who had fallen in water may require treatment for hypothermia or shock
Barn Sampling The barn can be classified as a confined work space since it is fully enclosed and has a limited number of exits In order to operate safely in a confined work space special considerations are necessary Unlike some confined spaces the barn has numerous small openings in the wooden structure to allow for an adequate supply of air while collecting samples However the sampling effort will likely generate a significant amount of airborne dust within the barn which means that Level C dermal and respiratory protection must be worn at all times while in the barn One person will remain outside the barn during the sampling effort to observe the sampling personnel and to provide backup services Two Combination Type A-B-C fire extinguishers capable of extinguishing wood and paper flammable liquidis or electrical fires will be available (one inside and one outside the barn with the standby person) in the unlikely event of a fire occurring during sampling
Document VoL H SC SAP Appendix A Revision 0
Date January 171991 Page 7
In accordance with OSHA 29CFR1910120 a minimum lighting intensity of 5 foot
candles will be provided within the barn during sampling The creation of dust and the
low lighting which may be available in some areas of the barn is likely to limit vision
some of the time Special care must be taken to avoid tripping over the numerous
objects disposed of within the barn No electricity is available in the barn so power
will come from outside the barn to supply power for lighting and tools to be used in
the sampling effort This means that electrical extension cords will be laid out on the
floor to various sampling locations In addition a large amount of metal and wooden
debris exists within die barn which may become obstacles to free movement in certain
areas The wooden floors of the second story and loft ofxthe^arn are extremely
deteriorated in some places and should not be accessed unless authorized by the Site
Safety Coordinator v
The use of electric power tools to collect samples ^wobd boring and concrete drills) require special care The use of Level C dermal protection such as loose fitting gloves may make handling the drills more difficult Use speciaLcare to avoid contacting the moving bits of the drills while in operation tonvoid tearing tyveks or gloves If dermal protection is torn replace or patch it immediatelybefare proceeding with the sampling operation
Perimeter Establishment
MapSketch Attached See bdquo Perimeter Identified Access to site is restricted at all entry points via a locked
8-foot high cyclone fence^- x y
Zone(S) of contamination identified See Figure HS-1 through HS-5
Document Vol II SC SAP Appendix A Revision 1
Date March 28 1991 Page 8
Recommended Level(s) of Protection On-site personnel will use Level C dermal protection at all times See below for respiratory use
1 Protective Clothing
Sampling and decontamination personnel in these areas will wear
bull Disposable Tyvek coveralls over cotton coveralls bull Tyvek hoods bull Safety glasses or face shield bull Hard Hat bull Disposable booties over workbooks or waders for sampling surface water and
sediments bull Butyl rubber gloves over surgical gloves bull All gloves and booties will be taped to the Tyvek coveralls
2 Respiratory Protection
Air purifying respirators will be worn at all times while sampling during test pitting and boring operations and while inside the barn Otherwise the need for respiratory protection will be determined by on-site monitoring for organic vapors and the daily potential for exposure to airborne particulates The decision to utilize air-purifying respirators due to airborne particulates will be made by monitoring with a MIE MINIRAM Hand-held Aerosol Monitor (HAM) Based on previous studies (Endangerment Assessment Appendix F) an action level for worker safety of 10 mgm3 of respirable dust was established for the site Therefore when readings on the MINIRAM of 10 mgm3or greater are experienced Level C respirators will be worn Initial on-site monitoring for organic vapors will be conducted using an HNu Photoionization Detector (PID) Ambient vapor levels of 5 to 10 ppm above background in the breathing space will require the use of full-face cartridge respirators (Level C Protection) Background levels will be determined at the edge of the Site (ie fence line) before the initiation of the days activities Air quality will be monitored at the upwind boundary of the site at three locationsfor a duration of one minute at each location The maximum PID reading at each location will be recorded and the three readings will be averaged to determine the background level for that day Respiratory protection will be full-face respirators fitted with combined organic vapor and high-efficiency particulate cartridges (MSA Type GMA-F) Respirator cartridges will be replaced at a minimum on a daily basis Depending on readings obtained with the MINIRAM cartridges may be replaced at mid-day on windy days
Levels of organic vapors greater than 10 ppm above background in working areas will necessitate utilization of self-contained breathing apparatus (Level B Protection) During sampling HNu monitoring should be utilized to detect any changes in organic vapor levels Changes in fugitive dust or vapor level detection at any time may warrant appropriate alteration of required respiratory protection
Document VoL H SC SAP Appendix A Revision 0
Date January 171991 Page 9
Decontamination and Disposal
A decontamination areawill be assembled at the entrance to the site The decontamination zones will be established such that personnel and equipment are fully decontaminated prior to leaving the fenced area In addition all personnel will be familiar with proper decontamination procedures prior to going on site All personnel entering and exiting the hot zone shall pass through the decontamination zone
1 Personnel Decontamination
The personnel decontamination sequence is as follows
a Samples and equipment are dropped on plastic sheets
b Disposable booties Tyvek coveralls and contaminated outer gloves are first brushed off with soapy water then rinsed with clean water by decontamination personnel Thedisposable equipmenfis^then removed baggedand placed in a 55shygallon drum marked Dry Deconv
c Neoprene boots and outer gloves are washed if they were not drummed in Step b with soapy water and ririseck with clean water An additional rinse with methanol followed by a firiak water-rinse completes the sequence
lt d Neoprene boots and glovesare -removed
e Respirators (cartridge-change) are removed if necessary and disposed in the Dry Decon drum
f Surgical gloves are temovfedand disposed in the Diy Decon drum
Document Vol M SC SAP Appendix A Revision 0
Date January 17 1991 Page 10
2 Equipment Decontamination
The equipment decontamination procedure for Source Control sampling work performed inside the fenced area of the site is as follows
a All disposable items (eg surgical gloves plastic sheeting nylon brushes etc) will be discarded in the Dry Decon drum
b Heavy equipment such as the backhoe and drilling jig will be steam-cleaned on a specially constructed decontamination pad located east bfthermain site access gate and north of the ground water monitoring well couplet MW1Q2A and MW102B (see Figure HS-7) The pad will be constructed to allow for drainage of steam-cleaning solutions onto a bermed multi-layer -impermeable barrier consisting of several layers of at least 6-mil-thick polyethylene sheeting overlain and underlain by geotextile fabric The geotextile fabricwilfbe designed to collect contaminated sediments which may have collected on tires or excavating equipment Rinse water from the decontamination processwill then fre pumped through hoses or channelled for drainage into the Uppei^La^oomafter completion of surface water and sediment sampling The decontamination pad will be left in place after completion of field sampling
c All other equipment contacting surface or subsurface soils sediments surface water or materials within thebarm(egtrowels spatulas templates drill bits etc) will be decontaminated by rinsing with clean water scrubbing with methanol and re-rinsing with distilledwater Solutions which contain methanol will be collected for disposal into tHeJWet Decon drum Equipment used during barn sampling will then be drted^with paper towels and the towels will be disposed in the Dry Decon drum ^
3 Decontamination Station Closure
The procedure for decontamination station closure will be as follows
a Decontamination personnel shall be responsible for closing the station at the end of each workday
b All solid wastes such as plastic tarps bags and Tyveks will be placed in the Dry Decon drum and will be closed at die end of each workday
Document Vol IISC SAP Appendix A Revision 0
Date January 171991 Page 11
All spent decontamination solutions containing methanol will bedisposed of in the Wet Decon drum Decontamination solutions which are not composed of methanol and exhibiting PID readings below 1 ppm will be poured into surficial soils on the edge of TWA I within the fenced area of the site If PID readings are greater than 1 ppm the solutions will be disposed in the Wet Decon drum These drums will be closed at the end of each workday
d Drums shall be secured on-site until proper disposal is arranged after consultation with EPA
7 Air Monitoring Procedures X
Site Monitoring Equipment PID HNu PI-101 HAM MIE MINIRAM
Since Level C respirators will be used during test pitting and barn sampling air at the test pit and barn sampling areas will be monitoredfegularly with a PID and HAM primarily for future reference of the levels of VOCs and dustto^be expected during remedial activities During the other sampling efforts air monitoring wiH form the basis for whether an upgrade to Level C respiratory equipment is necessary TheltPID will be used regularly during soil sediment and surface water sampling^ TKampHAM will be used at least twice per hour while on-site to monitor for dust levels in air^Whenunusually windy conditions are experienced additional monitoring for dust levels wilLbe^erfbrmed When ambient temperatures in air are below 32deg F the chart recorderattachment for the MINIRAM must be used as the LED readout on the instrument may not operate below freezing All PID and HAM readings will be recorded in theJield Log Book
Document VoL H SC SAP Appendix A Revision 0
Date January 171991 Page 12
Emergency Information
Location Phone
FIRE Augusta (207) 623-2511
POLICE Augusta (207) 623-2511 State Police (Augusta) (207) 621-1200
AMBULANCE Augusta (207) 623-25tlx N
HOSPITAL Kennebec Valley Medical Center (207) 626-1000 Augusta Division N 6 East Chestnut Augusta ME
Chemical Trauma Capability Yes
EPA (Michael Jasinski) 7) 573-5786
DEP (Thomas Benn) (207) 289-2651
CMP (Charles Nickerson) (207) 623-3521
Directions to Hospital (See Fig HS-6)
Primary route to hospital is west on Route17 (Eastern Avenue) to Arsenal Avenue turn right on Arsenal Avenue and go3 blocks to E Chestnut street then right Emergency room entrance is 6 East Chestnut Street Alternate route - west on Route 17 (100 yards) to Cony Road turn right on Cony Road take^rst left (Cony Street Ext) to Riverside Drive go left on Riverside Drive the second mtejsection will be Arsenal Street goleft on Arsenal Street East Chestnut Street will be second left
Document VoL H SC SAP Appendix A Revision 0
Date January 171991 Page 13
Additional Emergency Contacts
DR DAVID EGILMAN (617) 935-8581 HEALTH RESOURCES WOBURN MASSACHUSETTS
GEI CONSULTANTS INC
ROBERT E STETKAR (603) 224-7979 JOSEPH G ENGELS (617)721^4022 s
TSCA HOTLINE (800)424-9065
AT amp F (EXPLOSIVES INFO) (800^424-9555 V
NATIONAL RESPONSE CENTER x(8W) 424-8802
PESTICIDE INFORMATION SERVICE (800)845-7633
RCRA HOTLINE y -(800) 424-9346
CMA CHEMICAL REFERRAL CENTER (800) 262-8200V NATIONAL POISON CONTROL CENTER (800) 942-5969-y
US DOT bdquo (202) 366-0656
GEI CONSULTANTS ^ (603) 224-7979
Prepared by Thomas S Bobowski Date January 7 1991
Reviewed by Robert E Stetkar Date January 9 1991
All personnel working at this site have received OSHA required health and safety training Personnel are enrolled in a medical monitoring program A summary of training completed for all GEI personnel involved in the Source Control sampling program is provided in Table 3
Use of Common Sense is Required
I have read and understand this safety plan
Name (printed) Signature Date
Table 1A Organic and Inorganic Chemicals Detected in the Shallow Aquifer
Groundwater Samples at the F OConnor Site Maximum
Concentration Geometric Background
Range Mean[a] Concentration (ugL)
Chemical Frequency (ugL) (ugL)
ND(b]-2300B[c] 150 NDAcetone 211 ND-15J[d] NA[e] NDBenzene 211 ND-45 143 ND2-Butanone 17 ND-83 53 NDChlorobenzene 311 ND-53 NA NDToluene 27 ND-12J NA NDTriehloroethene 1P ND-11 81 NDBis(2-Ethylhexyl)Phthalate 411 ND-25 1deglaquo2 ND12-Dichlorobenzene 411 ND-14J 97 ND13-Dichlorobenzene 311 ND-13J 96 ND14-Dichlorobenzene 311 ND-29 94 ND124-Trichlorobenzene 17 ND-19 07 NDTotal PCBs 111 27-5085 06 49Aluminum 55 27-805 24 42Barium 55 13700-125451 38300 26600Calcium 55 ND-145 53 NDChromium 25 ND-37 NA NDCobalt 15 ND-285 66 14Copper 35 33-4952J 590 3Iron 55 ND-18 37 NDLead 15 21-2906 260 24Manganese 55 ND-154 10 NDNickel 15 ND-17 37 NDSilver 15 10593-72812 33400 14000Sodium 55 ND-71 71 NDVanadium 15 17-946 263 91Zinc 55
a) Calculated using detected concentrations and one-half of EPAs contract laboratory program (CLP) detection limits for the organics For the inorganic
chemicals the aqueous CLP detection limits were used
b) ND - Not Detected
c) B designates Chat substance was also found in the blank though the
sample level was significantly higher to prove a positive detect
d) J designates estimated value
e) NA - Not applicable Chemical was detected infrequently and the use of
one-half of the detection limit in calculating a mean results in a mean
concentration that exceeds the maximum Therefore a mean is not used
SourceEndangerment Assessment dated Jan 29 1988 by CDM
Table IB Organic and Inorganic Chemicals Detected in Bedrock Aquifer
Groundwater Samples at the F OConnor Site
Mean Concentration Geometric Background
Chemical Frequency Range (ugL)
Mean[a] (ugL)
Concentration (ugL)
Acetone 220 ND[b]-1200 68 ND Benzene 220 ND-27J[c] NA(d] ND Chloroblt ene 620 ND-16 36 ND Toluene 215 ND-27J NA ND Bis(2-E vlhexyl)Phthalate 1320 ND-64 Hi 61 12-Dich 13-Dic^
irobenzene jrobenzene
720 120
ND-26 ND-24J NA
66 ND ND
14-Dic^ robenzene 620 ND-44 82 ND Di-n-Bu phthalate 120 ND-22J NA ND 124-Tr hlorooenzene 720 ND-310 161 ND N-Nitros iiphenvlamine 25 ND-4J NA ND 3eta-BHC 110 ND-04 004 ND Gamma-BH (Lindane) 110 ND-006 003 ND Total PC 320 ND-50 LO ND Antimony 110 ND-55 19 ND Barium 1010 15-129 138 56 Chromium 410 ND-268 54 ND Cobalt 110 ND-115 92 ND Iron 1010 61-384301 837 152 Magnesiu Manganes
1010 810
5960-46250 ND-5895
15220 661
4203
27 Nickel 310 ND-345 125 ND Potassiu 1010 3504-16046 6560 4340 Vanadium 110 ND-52 NA ND
a) Calcul ted using detected concentrations and one-half of EPAs contract labor 3ry program (CLP) detection limits for the organics For the inorganic chemic Is the aqueous CLP detection limits were used
b) ND mdash F detected
c) J de Ignates estimated value
d) NA - N applicable Chemical was detected infrequently and the use of one-ha of the detection limit in calculating a mean-results in a mean concern ation that exceeds the maximum Therefore a mean is not used
Source Endangerment Assessment dated Jan 29 1988 by COM
Table 1C Organic and Inorganic Chemicals Detected in In-Fence Surface Soil
Samples at the F OConnor Site Mean
Concentration Geometric Background Range Mean[a] Concentration
Chemical Frequency (ugAg) (ugkg) (ugAg)
19 ND[b]-19J[c] NA[d] ND Chicroform ND29 ND-150B[e] 63Methylene Chloride
ND19 ND-30J NAToluene 260J19 ND-917J 260Bis(2-Ethylhexyl)Phrhalate
Carcinogenic PAHs ND19 ND-2700J 290BenzoltAgtAnthracene ND29 ND-12000J ^10BenzoltB or KgtFluoranthene ND39 ND-11000J 540Chrysene ND39 ND-23183Total CPAHs
Non-carcinogenic PAHs ND39 ND-12000J 540Pvrene ND39 ND-12000 540Total NCPAHs ND118186 ND-6205600 3400 Total PCBs 4001419 ND-64000 1900Cadmium 292001919 17000-29480000 275000
Copper 570001919 29000-2681000 213000Lead 252001919 19000-90000 35000Nickel ND219 ND-12000 650Silver 738001919 45000-1160000 183000Zinc
aj Calculated using detected concentrations and one-half of EPAs contract UboSto program (CLP) detection Unite for the organic For the inorgar-c chemicals the detection limits for soils were based on aqueous CLP
detection limit
b) ND - Not Detected
c) J designates estimated value
d) NA - Not applicable Chemical was detected infrequently and the use of one-half of the detection limit in calculating a mean results in a mean concentration that exceeds the maximum Therefore a mean is not used
e) B designates that substance was also found inthe blank though the sample level was significantly higher to prove a positive detect
Source Endangerment Assessment dated Jan 29 1988 by Clement Associates Inc
Table ID
Organic and Inorganic Chemicals Detected in the TVA III Surface Soil Samples at the F OConnor Site
Concentration Geometric Background Range Meanfa] Concentration
Chemical Frequency (ugAg) (ugAg) (ugAg)
44-DDT 13 ND[b]-5200 150 ND 44-DDE 13 ND-260 56 ND Total PCBs 2131 ND-620000 2940 ND
Antimony 11 189000 41000
Cadmium 11 11000 400 Copper 11 230000 29200 Iron 11 60900000 22200000 Lead 11 634000 57000 Zinc 11 799000 73800
a) Calculated using detected concentrations and one-half of
ErAs contract laboratory program (CLP) detection limits
b) ND - Not Detected
Source Endangerment Assessment dated Jan 29 1988 by Clement Associates Inc
Table IE irganic Chemicals Detected in Upland Marsh Sediment
Samples at the F OConnor Site[a] Maximum
Concentration Geometric Background Range Mean[b] Concentration
Che ical Frequency (ugAg) (ugAg) (ugAg)
To ane 11 23J[c] - ND[d] To- 1 PCBs 33 1300-34000 6425 ND
a) norganic chemicals were also analyzed for but none were itected significantly above background concentration
b) alculated using detected concentrations and one-half of PAs contract laboratory program (CLP) detection limits
c) J designates estimated value
d) D - Not Detected
Source Endangerment Assessment dated Jan 29 1988 by Clement Associates Inc
Chemical
Acetone 11 408B[c] ND[d]
Bis(2-EthyIhexy1)Phthalate 11 2082 ND
Toluene 11 28J[e](f] ND
Total PCBs 44 30000-1100000 381000 ND
a) Inorganic chemicals were also analyzed for but none were detected
significantly above background concentration
b) Calculated using detected concentrations and one-half of EPAs contract
laboratory program (CLP) detection limits
c) B designates that substance was also found in the blank though the sample
level was significantly higher to prove a positive detect
d) ND - Not Detected
e) J designates estimated value
f) In a duplicate sample toluene was not detected A geometric mean of the detected value and one-half of the detection limit would have resulted
in a mean concentration exceeding the detected value Therefore only
the detected value is listed
Source Endangerment Assessment dated Jan 29 1988 by Clement Associates Inc
Table 1G Organic and Inorganic Chemicals Detected in Lower Lagoon Sediment
Samples at the F OConnor Site Maximum
Concentration Geometric Background Range Mean(a] Concentration
Chemical Frequency (ugAg) (ugAg) (ugAg)
Bis(2-Ethylhexyl)Phthalate 12 ND[b]-100J[c] NA[d] ND
Benzoic Acid 22 120J-190J 150 ND Total PCBs 77 3202-40100 8660 ND
Cadmium 12 ND-2500 790 ND c 22 27000-59000 40000 20000
Lead 22 17000-70000 34500 ND
Manganese 22 525000-982000 718000 474000
Selenium 12 ND-760 436 ND Zinc 22 103000-249000 160000 108000
a)Calculated using detected concentrations and one-half of EPAs contract laboratory program (CLP) detection limits for the organic For the inorgan chemicals the detection limits for sediments were based on the aqueous CLP
detection limit
b) ND - Not Detected
c) J designates estimated value
d) NA - Not Applicable Chemical was detected infrequently and the use of
one-half of the detection limit in calculating a mean results in a mean
concentration that exceeds the maximum Therefore a mean is not used
Source Endangerment Assessment dated Jan 29 1988 by Clement Associates Inc
Table 1H Organic and Inorganic Chemicals Detected in Riggs Brook Sediment
Samples at the F OConnor Site Maximum
Concentration Geometric Background
Range Mean[a] Concentration
Frequency (ugAg) (ugkg) (ugAg)Chemical
12 ND[b]-30 12 NDMethylene Chloride
Carcinogenic PAHs 22 160J[c]-790 360 230JBenzoltAgtAnthracene 22 220J-800 420 290JBenzoltAgtPyrene 22 2-63J-1600 650 710J3enzoltB or KgtFluoranthene 22 280J-960 520 400J
Chrysene 12 ND-190J NA[d] NDDibenzltAHgtAnthraeene 12 ND-400J 340 NDIndenoCl23-CDgtPyrene 22 1507-4740 2670 2402Total CPAHs
Non-carcinogenic PAHs 12 ND-110J NA NDAcenapthy1ene 12 ND-200J NA NDAnthracene 12 ND-410J 350 ND
BenzoltGHIgtPerylene 22 280J-1200 580 420J
Fluoranthene 12 ND-80J NA NDFluorene 22 72J-680 220 150J
Phenanthrene 22 290J-1500 660 470J
Pyrene 22 1810-4180 2750 2584Total NCPAHs 615 ND-6481 870 NDTotal PCBs 12 ND-1200 775 NDSilver
a) Calculated using detected concentrations and one-half of EPAs contract laboratory program (CLP) detection limits for the organics For the degrgan chemicals the detection limits for sediments were based on the aqueous CLP
detection limits
b) ND - Not detected
c) J designates estimated value
d) NA - Not applicable Chemical was detected infrequently and the use of one-half of the detection limit in calculating a mean results in a mean
concentration that exceeds the maximum Therefore a mean is not used
Source Endangerment Assessment dated Jan 29 1988 by Clement Associates Inc
Table II Inorganic Chemicals Detected in Upland Marsh Surface
Water Samples at the F OConnor Site[a]
Sample Background
Concentration Concentration
Chemical Frequency (ugL) (ugL)
Aluminum 11 884 104 Arsenic 11 35 ND(10)[b]
Barium 11 12 47 Iron 11 3540 1160 Lead 11 36 ND(5)
Manganese 11 ^29 134 Potassium 11 7260 3610
a) Organic chemicals were also analyzed for but
none were detected
b) ND - Not Detected Limits of detection are
given in parentheses
Table 1J Organic and Inorganic Chemicals Detected in Upper Lagoon
Surface Water Samples at the F OConnor Site
Sample Background
Concentration Concentration
Chemical Frequency (ugL) (ugL)
108 ND(10)[a]Total PCBs 11 47Barium 11 23
6 ND(5)Lead 11 Manganese 11 1450 134
25 ND(40)Nickel 11
a) ND - Not Detected Limits of detection are given in
parentheses
Source Endangerment Assessment dated Jan 29 1988 by Clement Associates Inc
Table IK Organic and Inorganic Chemicals Detected in Lover Lagoon
Surface Water Samples at the F OConnor Site Maximum
Concentration Geometric Background Range Mean[a] Concentration
Chemical Frequency (ugL) (ugL) (ugL)
Total PCBs 22 13-375 221 ND[b] Aluminum 22 56-3740 458 104
Arsenic 12 ND-4 NA[c] ND
Barium 22 12-37 67 47
Cobalt 12 ND-9 NA ND Iron 22 1970-8260 4030 1160
Lead 22 91-13 109 ND
Manganese 22 137-2330 565 134 Potassium 22 5200-6220 5690 3610
a) Calculated using detected concentrations and one-half of EPAs
contract laboratory program (CLP) detection limits for the organics For the inorganic chemicals the aqueous CLP detection
limits were used
b) ND - Not Detected
c) NA - Not Applicable Chemical was detected infrequently and the
use of one-half of the detection limit in calculating a mean
results in a mean concentration that exceeds the maximum
Therefore a mean is not used
Table 1L
Inorganic Chemicals Detected in Riggs Brook Surface Water Samples at the F OConnor Site[a]
Maximum
Concentration Geometric Background Range Mean[b] Concentration
Chemical Frequency (ugL) (ugL) (UgL)
32 NDAntimony 13 ND[c]-35 5 NDLead 13 ND-16
a) Organic chemicals were also analyzed for but none were detected
b) Calculated using detected concentrations and one-half of EPA s
contract laboratory program (CLP) aqueous detection limits
c) ND - Not Detected
Source Endangerment Assessment dated Jan 29 1988 by Clement Associates Inc
Chemical
Acetone |CHCOCH3l Dimethyl ketone ketone propane
Toluene |CHCHJ _ e bull bull a O J Jtoluol phenyl aethane aethyl benzene
Cblorobcnzene (CHC1) aonochlorobenzene chlorobenzol
Ethyl benzene |C_HCH| phenyl ethane ethyl benzol
ACC TLV or STEL
ltPPB) (PfB)
750 1000
100 150 skin
75 (550agaraquo)
100 125
TABLE 2 CHEMICAL TOXICITY AND OTHER INFORMATION
Physical Skill Dcraal LD^ (mgkg) State Penetration Tonicity Potency ofraquoI(rat)
bullbullbull local it 9750liquid Bint-like odor
1297(nice)
liquid t local 5000
TC|Huosn =Ml00 ppa
colorless liquid 2910
colorless liquid local H 3500 with aromatic odor
syatcaatic bullbullbull TCu(Kiais) c 100 ppa
A hrs
Page 1 of 4
Remarks
Syaptoas Irritates eyea none throat narcotic in high concentrations
Target Organ respiratory aystea skin
First Aid Swallow water voait Skin soap wash
Incoapatibilities oxidizing materials acids Fire hazard when csposed to beat or flame
Tonicity 1 Persistence1 0
Syaptoas fatigue confusion euphoria dizzy headache dialated pupils lack of appetite nervousness insoania
Target organ CNS liver kidneys skin
First Aid Swallow NO VOHIT 8kln soap waah
Incoapatibilities strong ozldizers
Toxicity1 2 Persistence 1
Syaptoas irritates eyes nose causes drowsiness incoordination skin irritation
Target organ respiratory systea eyes skin cars liver
First Aid NO VOMIT
Incoapatibilities strong oxidizers reacts violently with AgClO^
Toxicity 2 Persistence 2
Syaptoas irritant to eyes and aucous aembrane headache narcotic
Target organ eyes upper respiratory systea
First Aid NO VOHIT
Incoapatibilities oxiding asterisks dangerous when exposed to heat or flame
TABU 2 Page 2 of 4 CHEMICAL TOXICITY AND OTHER INFORMATION
(continued)
ACC TLV or STEL Physical Skin Dcraal ID (agkg)
Cheaical (PPff) (PPB) State Penetration Toxicity Potency orsl(rat) Rcnarks
Benzene benzol
IC^H) 10 23 colorless liquid with aroaatic odor
local systeaatic
bullbull
bullbullbull Poisoning occurs aost coasaonly through lnhalationi also penetrates through akin
Syaptoass lrritatea eyes nose respiratory systea giddiness head nausea staggered gait fatigue depresesion sbdoaioal pain
Target organs bloody CNS skin bone narrow eyes respiratory systea
First Aids Swallows 8kins
NO VOMIT soap wash
Inconpatibilitiess strong oxidizers chlorine hronine with iron Dangerous when exposed to beat or flaae
Toxicitys 2 Persistences 1
Trichloroctbylcne ethylene trichloride tridene TCE
30 200 colorless liquid sweet odor
4820
1900(dog)
Syaptoass headache vertigo vision distortion treaors soanolcnce nausea voait irritates eyes cardiac errytbaiss paresthesias
Target organs respiratory systea heart liver kidneys CNS skin
First Aids Swallows Skins
Ipecac voait soap wash immediately
incoapatibless strong caustics chemically active actalss Da Li Ra Hg liquid O
Al 02 KN03 Ti
Persistences 3
Polychlorlasted biphenyi PCB Arocblor 1242 CjjHjClj(approx)
Arcblor 1234
C6H2C3C6M3C12
03
colorless to dark brown liquid with aild hydrocarbon odor
local systeaatic
local
Poisoning occurred Boat coaaonly through investigation or penetration of skin
Sypatoaas Irritates eyes (discbarge) skin scne-fora dernitatis Jaundice dark urine Target organs liver eyes skin First Aids Swallows Ipecac voait
Skins soap wash isnediately Incoapatibless strong oxidizers
TABU 2 CHEHICAL TOXICITY AND OTHER INFORMATION Page 3 of 4
ACC
Chulcil TLV or STEL (ppa) (POO)
Physical State
Skin Penetration
Derail Tonicity Potency
U)n (ngkg) of Reaarka
Dloctyl phtbalate di-acc-octyl pblbalata
5 aga1
light colored liquid
31000 Tonicity low to none via oral and derail routca produce 01 ayaptoas
12 Bichlorobenzene (C^H CI ) o-OCB
50 none liquid ++ local systemic
Symptoms irritates eyes and nose Target Organs liverkidneysskineyes First Aid Swallow salt water vomit
Skin soap wash Incompatabilities strong oxidizers
14 bichlorobenzene (CHbdquoC1 ) 7 2
P-OCB 75 110 solid ++ local
systemic ++ Symptoms irritates eyesheadachesnauseavomiting
Target Organs liverkidneyskineyesrespiratory system
first Aid Swallow water vomit skin soap wash
Incompatablities none
Lead (Pb) 015 mgm
none solid systemic t Symptoms Fatigue headaches abdominal pain Target Organs kidneys 61 central nervous system First Aid Swallow water vomit
Skin soap wash
Polycyclic Aromatic Hydrocarbons (PAHs)
015 mgm
none liquid systemic + Symptoms No obvious symptoms Carcinogenic to tissue following prolonged contact
First Aid Swallow water vomit Skin soap wash
Page 4 of4TABU 2 CHEMICAL TOXICITY AND OTHER INFORMATION
(continued)
NOTES
TLV - Threshold Unit Value ACC - Acceptable Ceiling Concentration STEL - Short Tera Exposure Limit
Suspected carcinogens teratogens or mutagens Firat Aid Unless specified flrat aid for oil of the liated cbeaicala are aa followa
Eyeai iaaedlatcly waab with copious quantity of cold water Skins Flush with water proaptly Breath Artificial respiration Swallowi Water voait
a Slight Hazard aa Hoderate Hasard aalaquo Extreme Hasard
Toxicity Ratiosa
Toxicity Rating
No toxicity (none) Material causes no hara in any condition or produces
tosic effects on buaana in very unusual circumstances or
in very large dosage
Slight toxicity (low)
Moderate toxicity
Severe toxicity
Persistence or each hazardous substance ia evaluated on its blodegradabllity aa follows
Assigned Value
Easily biodegradable coapounds 0
Straight chain hydrocprbons 1
Substituted and other ring compounds 2
Metals polycyclic coapounds and halogenated hydrocarbons 3
Adapted with modifications from EC Jordon Co RIFS Work Plan
TABLE 3 - PERSONNEL TRAINING AND MEDICAL MONITORING HEALTH AND SAFETY PLAN Field Sampling Plan OConnor Co Site Augusta Maine
personnel1
Robert E Stetkar
Joanne O Morin
Richard F Murdock
Benjamin Y Su
Joseph G Engeis
Steven R Lamb
Thomas S Bobowski
Boyd P Smith
Christopher L Covel
William J Haswell
Charles Blodgett
NOTES
ANNUALreg MEDICAL
MONITORING
yes
yes
yes
yes
yes
yes
yes
yes
yes
yes
yes
lt
y
OSHA 40shyHOURreg HAZMAT TRAINING
yes
yes
yes
yes
yes
yes
yes
yes
yes
yes
yes
ANNUALreg RESPIRATOR
FITTEST
yes
no
no
no
no
yes
yes
yes
es Yes
yltes
-y
CARDIOshyPULMONARY
FIRST AID RESUSCITATION TRAINING TRAINING
no no
yes yes
nov no
no no
no no
yes yes
yes yes
yes yes
yes yes
no no
yes yes
1 Only GEI personnel assigpedttfdo work on the OConnor site included on this list
2 Includes baseline and annual physicals lilood testing etc
3 In accordance with 29CFR191012tkncludes annual 8-hour refresher course
4 Includes annual respirator fit testing procedures
Project 90393 GEI Consultants Inc January 17 1991
TOW MAXARJM PCS CONCENTRATION (gtbullraquo) 8Y AREA
Central Maine Power Company Pre-Design Work Plans INTERPRETED CONTOURS Scale 1 inch = 180 feet Augusta Maine OConnor Site OF PGBs IN
Augusta Maine IN SURFICIAL SOILS From EC Jordon Co RIFS
Report dated June 1989 0 G E I C o n s u l t a n t s I n c Project 90393 January 1991 FigHS-2
Central Maine Power Company Pre-Design Work Plans DISTRIBUTION OF PAHs Scale 1 inch = 180 feet Augusta Maine OConnor Site IN SURFACE AND
Augusta Maine SUBSURFACE SOILS From EC Jordon Co RIFS
Report dated June 1989 0 G E I C o n s u l t a n t s I n c Project 90393 January 1991 FigHS-3
Central Maine Power Company Pre-Design Work Plans INTERPRETED DISTRIBUTION Scale 1 inch = 180 feet Augusta Maine OConnor Site OF LEAD IN SOILS
Augusta Maine From E C Jordon Co RIFS
Report dated June 1989 ltD G E I C o n s u l t a n t s I n c Project 90393 January 1991 FigHS-4
Central Maine Power Company Pre-Design Work Plans ANALYTICAL RESULTS FROM Scale 1 inch = 160 feet Augusta Maine OConnor Site SEDIMENT AND SURFACE
Augusta Maine WATER LOCATIONS From EC JOrdon Co RIFS lttgtReport dated June 1989 G E I C o n s u l t a n t s I n c Project 90393 January 1991 FigHS-5
Contamination 80 Feet
Control Line
Central Maine Power Company Pre-Design Work Plans SITE ACCESS AND Augusta Maine OConnor Site DECONTAMINATION
Revision 1 March 281991 Augusta Maine AREA
laquo G E I C o n s u l t a n t s I n c Project 90393 March 1991 KgHS-7
bull
Document Vol II SC SAP Appendix B Revision 0
Date January 17 1991 Page 1
APPENDIX B
FieldtogjL
FIELD LOGS
Project Field Log Book Equipment Calibration Logs
HNu Pl-101 MIE MINIRAM MARKSON CONDUCTIVITY METER MARKSON DIGITAL pHTEMPERATURE
Photograph Log Health and Safety QA Logs
Chain-of-Custody Forms Sample Assignment Forms Non-Conformance Report Forms Test Pit Log Forms Barn Sampling Forms Dexsil L-2000 PCB analyzer Calibration Boring Log Forms
lt
Document Vol II SC SAP Appendix B Revision 0
Date January 17 1991 Page 2
(OCONNORFL1)
(OCONNORFL2) (OCONNORFL3) (OCONNORFL4) (OCQNNORFL5) pound0CONNORFL6) (OCONNORFL7)
-(OCONNORFL9) (OCONNORFLIO) (OCONNORFL11) (OCONNORFL12) fOCONNORFL13) (OCONNORFL14) (OCONNORFL15)
Note Field Log OCONNORFLampisassigned to ground water sampling described in the Management of Migration Sampling andiAnalysis Plan
Document Vol II SC SAP Appendix B Revision 0
Date January 17 1991 Page 3
PROJECT LOGBOOKS (OCONNORFL1)
Serialized project logbooks are to be issued by the site contractor to all personnel at the site who have been designated to perform specific field tasks Individuals must sign their logbooks upon receipt and use them to record all pertinent information until the project is completed y
Logbook entries should be dated legible and contain accurate and inclusive documentation of an individuals project activities Because the logbook forms the basisfor the later written reports it must contain only facts and observations Entries made by individuals other than the person to whom the logbook was assigned are dated andsigned by the individual making the entry bull
CALIBRATION LOG Document No OCONNOR FT1 HNu Photoionization Device Model Pl-101 Page 1 of 1
Instrument Serial No
Lamp Date Span Setting Time Calibration Temperature User
Standard Introduced Meter Response (parts per million (ppm))
Comments (See Summary of Calibration Procedures attached7
X x
User Signature Date
Task Manager Signatures Date
CALIBRATION LOG Document No OCONNORFI3 MIE MINIRAM Hand-held Aerosol Monitor Page 1 of 1
Instrument
Serial No
Date
Time
User
Standard used (zero-bag)
Meter Display
Comments
User Signature lt Date X
Task Manager Signature l Date
CALIBRATION LOG Document No OCONNORFL4 Markson Conductivity Meter Model 103 Page 1 of 1
Instrument Serial No
Date Time User
Standard Used_ Meter Display^
Comments
s
v
lt
y xy ^y
User Signature Date z V
Task Manager Signature ) i Date
CALIBRATION LOG Document No OCONNORFU5 Markson Digital pHtemperature Meter Model 95 Page 1 of 1
Instrument Serial No
Date Time User
Temperature check vs mercury thermometer
Probe reading Thermometer reading
Upon completion of calibration procedure does pH probe checkout vs pH 40 buffer Reading bull lt x pH 70 buffer Reading bull
Comments v
X x
User Signature X^ Date
Task Manager Signature Date
Document No QCONNORFT f
Page
PHOTOGRAPH LOG
Project Name
Project No
Camera and Film Specifications
FILM
ROLL FRAME
DATE nTIME PHOTOGRAPHER PHOTO NUMBER
DESCRIPTION
lt3
ni
I X
V
V
gt
Document No QOONNORm7
HEALTH amp SAFETY QUALITY ASSURANCE CHECKLIST
Page 1 of 2 Project No Site Date Completed by
A On-site Operations During Hazardous Waste Site Investigations
yes no Team understands task procedures safety plan individual roles and site history contaminants
yes no Team knowledgeable to hospital route nearest phone location and who is responsible for health and safety on site
yes no Establishment of command post and decon station with Health amp Safety Plan readily available
yes no Establish communication or line-of-site maintained
yes no Field operations conformed environmental monitoring respiratory protection or emergency response
yes no Protective clothing and respiratory protection maintained
yes no Decontamination procedures performed on the following sample containers sampling equipment and personnel
yes no Equipment protected clean calibrated and being used properly by site personnel
yes no First Aid Equipment readily available at site with checklist and eye wash
yes no Site personnel trained in CPR and First Aid
yes no Site Records maintained such as field logbooks respirator usage log incident reports in place and up-to-date and any deviations or modifications to Safety Plan
GEI Consultants Inc
uocutrenc uujmutvrLz
HEALTH amp SAFETY QUALITY ASSURANCE CHECKLIST
Page 2 of 2 Project No Site Date Completed by
B Health amp Safety Follow-up Reports
o Adherence to procedures o Accidents o Unsafe practices or conditions o Results of environmental monitoring o Corrective action
GEI Consultants Inc
Document No Q00NN0RFL9 CHAIN OF CUSTODY RECORD
DOCUMENT NUMBFR rn tLORD
RELINQUISHED DYISiONruRE OATETJMD RECEIVED DY (SIGNATURE) RELINQUISHED DY (SIOHATURER DATETI^IE RECEIVED BY (SIGNATURE)
IIElINOUISIIEO BY(SIGNATURE) DATETIMf DATETIME gt REMARKS lcNAruDn^nLADOnATonvorI
P a g e o f
Document No OCONNORFLIO
Page of G E I C o n s u l t a n t s I n c
Project No
Project Name _
Laboratory Contact
Sampler ( s ) Date Assigned Date Sampled
GEI Sample No
Sample Medium
Quantity
Sample Container
Type
Analyses Requested Remarks
Special Instructions Remarks
Document No 0CQNNDRFL11
NONCONFORMANCE REPORT
Project Project No
Auditor Audit Date Finding No
FINDING
Where found Check Lit Item
ControllingDocument Section
Task Description
Noncenformanee
Discussed with
Recommended Corrective Action
Is system correction needed to prevent recurrence Yes No If yes state recommended action
Schedule Completion Date By
CORRECTION ACTION
Correction Action by Date
QA Approval of Correction Action by Date
Date Completed Submitted by
Correction Action Verified by Date
I T E S T P I T L O G QCONNORFL12
PROJECT
LOCATIONI CLIENT
CONTRACTOR EQUIPMENTI OBSERVED BY
I DEPTH BELOW
GROUND SURFACE
I (FT)
I
I
I
1
1
1
1
I
1 REMARKS
PROJECT NO
LOCATION
GROUND EL
DATE DATUM
SOIL DESCRIPTION
PIT DIMENSIONS (FT) LENGTH WIDTH DEPTH
ltJgt G E I 1
I Docuaent No 0C0NNCRFL13
bull GEI CONSULTANTS IMC 53 Regional Drive Concord New Hampshire 03301-8500 (603)224-7979
BARN SAMPLING FORM Serial I
PROJECT INFORMATION
Project Name Source Control Pre-Oesion Studies
I Site Name(if different) OConnor Co site
Project Number
I Analytical Lab(s) ERCO EPA
GEI GC screen Other(Specify)
I METHOD OF SAMPLING
WIPE SAMPLING OF HON-POROUS SURFACES
I U000EH UALL SAMPLING UITH DRILL BIT
OUSTSOIL SAMPLING OH FLOOR SLAB
( CONCRETE SAMPLIHG ITH MORTAR BIT
(OTHER-Explain)
I
DESCRIPTION OF SAMPLE
Brief Description of Type of Material or Item Sampled
Visible Staining NO Visible Staining
Approximate Area of Stain(if any) X
LOCATION OF SAMPLE
Ground Floor Second Floor Loft
(All Measurements in Feet to 010 Foot)
Distance Along Z Axis from Reference Origin
Distance Along M Axis from Reference Origin
Height of Sample Above Floor Slab
SKETCH IN APPROXIMATE HORIZONTAL LOCATION OF THE SAMPLE COLLECTED ON FIGURE BELOU
I UALL X
I
I
UALL U UALL Y
I
I Reference Origin UALL Z
I Approximate Scale 1 inchbull 15 feet
I Sample I0(s) SIGNATURE OF SAMPLER CERTIFIES ABOVE SAMPLING RECORD
Date Time
I Sampler(s) COC Docunent Signature Date
I
CALIBRATION LOG Document No OCONNOR FL14 Dexsil L-2000 PCB Analyzer Page 1 of 1
Instrument
Serial No
Date
Time
User
Ambient Temperature deg C
Standard used (50 ppm chloride)
Reading beforeadjustingCALIBRATE knob
Reading after adjusting CALIBRATE knob
Comments
User Signature Date
Task Manager Signature Date
Document No OCONNORFL15 I BORING LOCATION DATE START FINISH
GROUND ELEVATION (NGVO ) DRILLED BY
GROUNDWATER El DATE LOGGED BY TOTAL DEPTH (FT) PG OF
I EL DEPTH S A M P L E
Its TYPE BLOWS PEN REC R E M A R K S QO SOIL ANO ROCK DESCRIPTIONSlt_land PER aFT FT NO 6 IN IN IN lt9
I
I
I
I
I
1
1
I
1
I
I
I
I
I
I BLOWS PER (-140IBHAMMER FALUNS 30T0 DRIVE NOTES A 20 IN 00 SPLIT SPOON SAMPLER
PEN-PENETRATION LENGTH OF SAMPLER OR CORE BARREL REC-RECOVERY LENOTH OF SAMPLE ROO-LENOTM OF SOUND CORES gt4INLENSTH COREO S-SPLIT SPOON SAMPLE PROJECT
I U-UNOtSTURBCO SAMPLES UF-FIXEO PISTON _ UO-OSTER8ERO bully OROUNOWATER 0 G E I
I
I
I
I
I
I
I
I
I
1 1 1 1 1 1 1 I 1 1 I
Document VoL H SC SAP Appendix C Revision 0
Date January 17 1991 Page 1
APPENDIX C
EQUIPMENT CALIBRATION PROCEDURES
Document Vol II SC SAP Appendix C Revision 0
Date January 171991 Page 2
HNu PI-101
The HNu PI-101 is factory calibrated twice a year andor if the instrument is malfunctioning Prior to field use and at the end of each day the user of the instrument will check that the instrument is still holding calibration using the following procedures
1 Prior to the calibration check check the instrument with an Organic point source (ie magic marker) prior to use to verify that it is functioning
2 Connect the rubber sampling hose from the span gas cylinder regulator to the sampling
probe of the HNu gt
3 Fully open the regulator valve gt vy
4 Note the instrument meter response after 5 to 10 Seconds y
5 If the response deviates + 15 from the coneentration of the calibration gas (this figure appears on the cylinder label) the instruihehtTeq^es factory maintenance and will not be utilized in the field until factory calibratiori^Tah alternate meter will be used after calibration checking v (
V 6 Document the calibration information Oik the appropriate equipment calibration log
(OCONNORFL2) ~y
Document VoL IISC SAP Appendix C Revision 0
Date January 17 1991 Page 3
MIE MINIRAM Model PDM-3
The MINIRAM will be factory calibrated once a year andor if the instrument is malfunctioning Prior to field use and at the end of each day the user will zero the instrument using the following procedure
1 With the MINIRAM off insert MINIRAM into Zerobag andseal the Zerobag
2 Inflate Zerobag with filtered air containing no particulates using-attached hand pumpx- V
S
3 Press ZERO button on MINIRAM and wait 30 seconds MINIRAMshould read OFF
4 Pull MINIRAM out of Zerobag
5 Press MEAS button and wait 60 seconds for MINIRAM to go through self-tests
6 The MINIRAM is now functioning and wilJLtake-readings every 10 seconds
7 Document the calibration information onthe appropriate equipment calibration log (OCONNORFL3) V
lt
v
Document VoL II SC SAP Appendix C Revision 0
Date January 171991 Page 4
MARKSON DIGITAL MODEL 103 CONDUCTIVITY METER
The Markson Conductivity meter will be calibrated prior to and following each days field use using the following procedures
1 Rinse the conductivity probe with distilled water gt
2 Pour enough Cole-Parmer conductivity calibration solution (1413 xS 25degC) in a clean plastic Ziploc bag to be able to completely immerse the conductivity probe
3 Immerse the conductivity probe in the standard solution and shakdTree any bubbles that may cling to the cell
4 Allow about 1 minute for the cell to reach equilibrium temperature x X
5 Set the cell adjust control at the bottom of the meter to display the value of 141
6 Carefully rinse cell with water after calibration and after each use V~
7 Document the calibration process onjlie equipment calibration log (OCONNORFL4)
Document VoL H SC SAP Appendix C Revision 0
Date January 17 1991 Page 5
MARKSON MODEL 95
Combined Digital pHtemperature Meter
The Markson 95 combined digital pHtemperature meter will be calibrated prior to and following each days field use using the following procedures
1 Insert electrode into digital meter The reference pin should also be properly connected Temperature probe should be plugged all the way into the ATC jack
2 Remove protective cap and push rubber sleeve such that the potassium chloride filling hole is exposed gt
3 Rinse both pH and temperature probe in distilled water 4 Immerse both pH and temperature probe into buffer 700 solution 5 Set FUNCTION switch to TEMPERATURE to read temperature 6 Set FUNCTION switch to ATC and adjust the readout to the pH value of buffer 700 corresponding
to the temperature measured in E with the CALIBRATE control See Chart 1 7 Rinse electrode and temperature probe withdistilled water 8 Immerse both pH and temperature probe into buffer^401 9 Repeat E V ~ 10 Set the FUNCTION switch to ATC and adjust the readout to the pH value of the buffer 401
corresponding to the temperature measured in Iwith the SLOPE control See Chart 1 11 Rinse the electrodes and temperatureprobe-with distilled water Model 95 is calibrated and ready
for use 12 Document the calibration process on the equipment calibration log (OCONNORFL5)
^ CHART
Temp (C) Buffer Solution 70 X -X
Buffer Solution 40
5 y 700 401 10 708 399 15 706 399 20 703 399 25 701 399 30 700 400 35 699 401 40 698 402 50 698 403 60 697 405
Document VoL II SC SAP Appendix C Revision 0
Date January 171991 Page 6
Dexsil Model L-2009 PCB Analyzer
The Dexsil PCB Analyzer will be calibrated prior to each days field use using the following procedures
Initial Preparation
1 The electrode must be filled with Orion filling solution before it is operational Fill the electrode up to the hole in the side of the epoxy body by-placing the nozzle of the filling solution in the hole and squeezing the bottle 7
2 Drain the electrode while holding it upright over thewaste beaker Grasp the epoxy body firmly in one hand and push down on the white cap which is connected to the cord The solution will then drain out of the bottom of the electrode
Vgt 3 Refill the electrode and check to makesure that the liquid is making contact between the black
cone and the plastic shell at the bottom of theelectrode If it is not making contact at all points drain the electrode again and refill
4 Plug the electrode into the back of the L-200Qj)laeeJt in a vial or rinse solution and turn the instrument on Switch the analysis knobtdfnVand wait a few minutes until the reading stabilizes
Calibration O Imdash^
1 Fill a vial about half way with 50 parts per million calibration solution
2 Turn the analysis selectQrJcnob to CAL
3 Remove the electrode from the rinse solution dry it carefully with a tissue and place it in the calibration solution SWiri the electrode gently for a few seconds and then stop Push the start button on the instrument^
4 When the READ light comes on adjust the CAL knob so that the instrument reads 50
5 Remove the electrode from the calibration solution wipe it dry and place in the rinse solution
6 If this is the first calibration since the instrument has been turned on or since the electrode has been filled repeat steps 34 and 5
7 Document the calibration information on the appropriate equipment Calibration Log (OCONNORFL14)
Document Vol II SC SAP Appendix D Revision 0
Date January 17 1991 Page 1
APPENDIX D X
list of Acronyms
Document Vol II SC SAP Appendix D Revision 0
Date January 17 1991 Page 2
ACRONYMS
ASTM American Society for Testing and Materials CLP Contract Laboratory Program CMP Central Maine Power Company DEP Department of Environmental Protection (Maine) DQO Data Quality Objectives EPA Environmental Protection Agency [US) FL Field Log FSP Field Sampling Plan ltys GEI GEI Consultants Inc gt HSP Health and Safety Plan X
MIE Monitoring Instrumentsforthe Environment MOM Management of Migration NA Not Applicable X lt OSHA Occupational Safety anaHeakh Administration OSWER Officer of SolithWaste and Emergency Response PCB PolychlorinatecFBiphenyk ppb Parts per billion v7 ppm Parts per million QA QuaUtyAssuranck ) QAO QudU$~^sitraquoance Officer QAPP QualityAssurance Project Plan QC Qukkty Gontrof PIP -Thotoionization Detector RDRA -mdashRemedial DesignRemedial Action RI Remedial Investigation ROD x^XRecbrd of Decision RPD X^Relative Percent Difference RPM Remedial Project Manager RSD Relative Standard Deviation SAP Sampling and Analysis Plan SC Source Control SOW Statement of Work TPH Total Petroleum Hydrocarbons VOC Volatile Organic Chemical or Compound
Document Vol II SC SAP Revision 0
Date January 17 1991 Page 2
separate and distinct transformer disassembly areas are situated along the access road and are identified by oil-stained soils metal wire and porcelain fragments The three areas are identified as transformer work areas (TWAs) I n and HI A former scrap-yard (Scrap Area on Figure 2) is located within the wooded area beyond TWA in Empty tanks white goods automobile bodies tires sheet metal and other items were stored or discarded in this Scrap Area
gtThe barn consists of a three-story wooden structure with a plan area of approximately 3100
square feet The barn has a concrete floor slab and contains ^large-variety of items These
items consist chiefly of the following furniture metal racksand doors lumber electric
meters automobile parts a wood stove heating registers an antiqueautomobile a boat
and a large amount of miscellaneous metal scrap debris gt v
13 Site History lt ltvy
lt
The Site was primarily used as grazing land until the l950sgtrhen the F OConnor Co started a salvage and transformer recyclingbusiness ThV salvage processes included stripping and recycling transformers that contaibedpblyehlorinated biphenyl (PCB)-laden oils As a result Of the uncontrolled releases ofPCB afthe Site the Site was placed on the National Priorities List (NPL) On March 231985 United States Environmental Protection Agency (EPA) and Maine DepartmenTof Environmental Protection (DEP) issued an Administrative Order to the OCohndPs and Central Maine Power Company (CMP) (Docket No 1-86-1031) identifying eachas-aPotentially Responsible Party (PRP) to (1) remove known threats to the public health or welfare which exist on-site (tanks of oil) (2) secure the areas of the Site thaLhave known contaminated soils (3) conduct a Remedial Investigation (RI) and (4jyjrepare a Feasibility Study (FS) In response to the Administrative Order CMPberformed the following interim remedial actions
bull Construction of a chai compassing TWA I and TWA II (approximately 75 acres) and the majority of the^sit^-related chemicals (1985)
bull Sampling cleaning and removal of 20 on-site storage tanks (1986)
bull Removal of over 500 tons of material from the scrap area and sampling of soils beneath the scrap (1987)
bull Extension of the chain link fence to secure TWA HI and part of the TWA II drainage swale
Currently two lagoons located on the slope leading down to Riggs Brook serve as detention basins for surface water flow from the Upland Marsh The portion of the Site currently
Document Vol II SC SAP Revision 0
Date January 17 1991 Page 3
fenced includes TWA I n and III part of the scrap area and all areas in which residual PCBs are present in soils The RI and FS were conducted by CMP and their consultant EC Jordan Co The objectives of the RIFS were to provide the necessary information to 1) identify and assess the existing and potential public health andor environmental risks which may be caused by the release or threatened release of hazardous substances pollutants or contaminants and (2) formulate and evaluate alternative recommendations for the remedial actions needed if any to prevent or mitigate the migration release or threatened release of hazardous substances
14 Soil Surface Water Sediment and On-Site Barnc Contamination and Remedy Description )
141 Soil s lt w
During the RI approximately 500 surface and Subsurface soil samples were collected by grab sampling shallow borings or test pits PCBs and lead were the principal contaminants found in the surface pTno^05-feet deep) soils and PCBs and carcinogenic polycyclic aromatic hydrocarbons-^(cPAHs) were the principal contaminants detected in the subsurface (05lO12-feet deep) soils
The highest concentrations of PpB^contaminated soils were found primarily within the former transformer work areas (TWAS)r-and the drainage areas associated with these TWAs (Figure 2) Contaminatedsoikinthe TWAs were found to contain up to 200000 parts per million (ppm^PCBs However the most contaminated soils (greater than 500 ppm) constitutelless than 125 of the total estimated volume of soil contamination (23500-trubic yards) and most of the contaminated soil contains PCBs at concentrations le^sthan 50 ^pm Lead was detected above background (ie approximately 70 ppm^average) principally in the surface soils within TWAs I and II with the maximum leachc^neentfation occurring at 4100 ppm within TWA II
Subsurface soil samples taken from TWAs I and II and the low area hear the Upland Marsh contained cPAHs The low area is an area where sediment dredged from the Upper Lagoon in 1977 was deposited adjacent to the area currently containing the Upland Marsh Disposal of this sediment resulted in blockage of natural drainage and formation of the Upland Marsh The depth of vertical migration of the cPAHs appeared to be limited to the upper 6-feet within TWA I and the low area while a small pocket of cPAHs was found to exceed 8 feet within TWA II The maximum cPAH concentration of 30 ppm was found within the low area Depth of PCB contamination in the subsurface soils outside of the TWAs was typically limited to less than 2 feet while PCBs were detected within TWAs I and II at depths of up to 12 feet
Document Vol II SC SAP Revision 0
Date January 17 1991 Page 4
Cleanup standards for soil were determined based on a public Health Environmental Risk Assessment performed by the EPA Cleanup standards are summarized below compared to maximum concentrations of chemicals encountered at the site
Maximum Concentration Soil Cleanup Chemicals Detected Standards
(ppm) (ppm)
Lead 4100 248 x
cPAHs 30 dX X PCBs 200000 1 gt bull
bullX
The RODspecifies that approximately23500 cubicyardsjof contaminated soils contain PCBs cPAHs and lead above the established Cleanup standards are to be treated on site using a solvent extraction technology This technology principally involves the use of a solvent to extract the PCBs and cPAHs from the contaminated soils The contaminated liquids containing the extracted PCBs and cPAHs will be destroyed at a licensed off-site TSCA incinerator AddkionaHyr-soil treatment residues resulting from the solvent extraction process that haveJlacNevels above the 248 ppm cleanup standard will undergo further treatment using n solidificationstabilization treatment technology Those solid treatmentNresidues jesulting from the solvent extraction process that do not achieve the cleahup-standards and that have undergone additional treatment through solidificationstabilization will be transported off-site to a licensed landfill It is currently estimated by the EPA that 5000 cubic yards of the total 23500 cubic yards of contaminated soils undergoing solvent extraction will require off-site disposal
142 Surface Wateiv
The on-site surface waterNirainage features include an Upland Marsh an Upper Lagoon and a Lower Lagoon (see Figure 2) The Upland Marsh drains to the Upper Lagoon via a subsurface drainage pipe The Upper Lagoon drains to the Lower Lagoon via a drainage swale The water that flows out of the Lower Lagoon follows a drainage swale to Riggs Brook
In 1976 under the advice of Maine DEP the two lagoons were constructed in an attempt to control oil migration The Upper Lagoon was constructed with a concrete retaining wall and an inverted siphon to prevent migration of oils floating on the lagoon surface Floating oils were collected and contained in six large on-site storage tanks The lower lagoon was excavated at the base of the slope and constructed with an earthen berm and a horizontal pipe discharge
Document Vol n SC SAP Revision 0
Date January 17 1991 Page 5
In 1977 under the direction of the Maine DEP the use of the lagoons was discontinued The water from the Upper Lagoon was placed in storage tanks and the sediments were excavated and placed in the low area shown on Figure 2 The sediments placed in the low1- area were underlain by a 1-foot-thick layer of marine clay and then covered with a clayey soil less than 6 inches thick The filling of the low area created a barrier to the previous natural surface water drainage and resulted in the formation of the Upland Marsh In an attemptto drain the marsh the subsurface drainage pipe was installed between the marsh and the Upper Lagoon in September 1978 The saturated area of the Upland Marsh presently still exists
On-site surface water quality was measured at five sampling locations These include one surface water sample from each of the lagoons and one from the Upland Marsh The surface water quality data in the RI indicated that PCBs (from unfiltered samples) were detectable in the Upper and Lower Lagponsyand in drainage from the Lower Lagoon but were not detected in surfacewater samples taken from Riggs Brook PCB concentrations in the on-site surface waters for the EowersLagoon the Upper Lagoon and Upland Marsh were 055 ppb 16 ppb^jand non-detected respectively Other contaminants of concern in the on-site urfkceTwaters were the inorganic chemicals lead and aluminum Lead was found at concentrations ranging from 36 to 13 ppb in all the on-site surface waters Additionally aluminum was detected in the on-site surface waters at concentrationsrangfog from 236 to 3740 ppb
O V Cleanup standards for surface water were determined based upon a Public Health
Environmental Risk Assessment performed by the EPA Cleanup standards are
summarized below compared to themaximum concentration of chemicals encountered
at the site N v
Surface Water Maximum Concentration Cleanup
Chemicals xD6tected Standards (PPb) (ppb)
Lead 13 194 Aluminum 3740 87
PCBs 16 0065
The selected remedy for surface water remediation at the site is pumping of surface water from the Upper and Lower Lagoons and Upland Marsh and disposal off-site unless otherwise approved by EPA The ROD indicates that the approximately 150000 to 195000 gallons of surface water are contained in the Upland Marsh and Upper and Lower Lagoons
Document Vol II SC SAP Revision 0
Date January 17 1991 Page 6
143 Sediment
The sediment sampling program conducted during the RI consisted of a total of 23 sediment samples from 19 locations both at on-site and off-site locations A total of six sediment samples were collected from the Upland Marsh Upper Lagoon and Lower Lagoon consisting of two samples from each of these surface water bodies Other samples were collected from Riggs Brook and drainage swales between the lagoons and Riggs Brook
xPCBs were detected in the sediment samples obtained from thexdge of the Upland Marsh both on-site lagoons and the Lower Lagoon drainage area leading into Riggs Brook PCB concentrations were highest in the Upper Lagoon (up to 1100 ppm) but decreased significantly downstream in the Lower iiigoon PCB concentrations were lowest in the drainage swale downstream fronii dieLower Lagoon (approximately 4 ppm) Cleanup standards for the sedimentswere~detennined based on a Public Health Environmental Risk Assessment performed by the ERA Cleanup standards are summarized below compared to maximiimgtCQncentrations of chemicals encountered in sediment samples from the Upland MSrsh Upper Lagoon and Lower Lagoon
Vmdash ( Sediment
MaximumConcentration gt Cleanup Chemicals Detected-^ v Standards
( (PPF1) -mdash (PPm)
Lead 28 248 cPAHs y 1 PCBs 1100 1
The ROD indicates that the cm-site sediments will be dredged and the sediment containing chemicals above^tbe established cleanup standards will be treated using the solvent extraction technology as described in Section 141
144 On-Site Barn Characteristics
The barn has been reported to formerly house scrap operations A surficial soil sample taken from within the barn (JSS1) during the RI was collected and analyzed for the presence of PCBs and lead The exact nature or matrix of the surficial soil (eg dust concrete wood) collected from within the barn could not be ascertained from the available documents The results of the PCB screening indicated a concentration of 96 ppm PCBs Lead was detected at a concentration of 1610 ppm No analysis for cPAHs was performed on the sample from the barn
Document Vol II SC SAP Revision 0
Date January 17 1991 Page 7
In the ROD EPA set soil cleanup standards for the site of 1ppm PCBs 1ppm cPAHs and 248 ppm lead The cleanup standards for barn materials were not specified in the ROD by EPA However the ROD specified that the barn would undergo decontamination procedure if contamination was present above cleanup standards (to be determined) through collection of soil dust and other loose material and these materials would be combined with the other contaminated soils and sediments for on-site solvent extraction treatment Large scrap items in the barn would then be removed for disposal off-site and the barn structure would be sampled for detection of the presence of contamination Following sampling and analysis of the barn structure the barn would be demolished and transported to an off-site facility for appropriate disposal ^gt
N
Document Vol II SC SAP Revision 0
Date January 17 1991 Page 8
2 SAMPLING AND DATA QUALITY OBJECTIVES
21 General
Sampling of soils surface water sediments and the on-site barn and its contents will be performed during the Source Control (SC) component of the Pre-Design Study Pre-Design SC sampling results will be used in the design of the SourceControl component of the remedy and development of the treatability testing program for soil and sediment
Pre-Design SC sampling will include N
Collection of surface water samples from the Upland Marsh and Upper and Lower Lagoons in April 1991 V
x
Collection of sediment samples from the Upland Marslkahd Upper and Lower Lagoons in April 1991 ^
Collection of soil samples from test pits and^Orihgsrin April 1991
bull Collection of samples of soil woodimckconcrete from the on-site barn floor and Walls and wipe samples from debris andlquipment located within the barn in May 1991
V-X7EPAs guidance document Data Quality Objectives for Remedial Response Activities (OSWER Directive 93550-78Jdarch 1987) identifies four analytical levels
Level I - field screeningoranalysis using portable instruments Results are often not compound specific and o^ qualitative in nature
Level II - field analyses using mbresophisticated portable analytical instruments Results are more reliable in terms of compound identification and may be semi-quantitative
Level El - laboratory analyses by established referenced methods Results are quantitative and compound specific
Level TV - EPA Contract Laboratory Program (CLP) services utilizing rigorous QAQC protocols and documentation
Level V - Laboratory analyses by non-standard methods Identified in the CLP asspecial analytical services
Document Vol II SC SAP Revision 1
Date March 28 1991 Page 9
A combination of Level I Level in and Level IV analytical protocols will be specified during Pre-Design SC sampling EPA Contract Laboratory Program (CLP) protocols prescribed in the 1988 Organic and Inorganic Statement of Works will be utilized for laboratory analysis of target compounds (PCBs cPAHs lead and aluminum) in surface water sediment soil and barn samples The analytical protocols that will be utilized for Pre-Design SC sampling are detailed in the SC Quality Assurance Project Plan (QAPP) included as Volume I of the SC SAP
22 Soils
Soil samples will be collected and analyzed to provide additional data for comparison with cleanup standards for design of the Source Control program at the OConnor Site Data will be used to refine the previously estimated volume of soils contaminated at various concentrations above the cleanup standards and to provide additional information at areas with apparent data gaps on the lateral and vertical extent of soil with PCB concentrations greater than 1 ppm Soil also will be collected at specified locations to provide samples for solvent extraction treatability bench-scale testing Samples selected for treatability testing will contain PCBs at concentrations previously not examined during limited bench-scale testing performed during the Feasibility Study (FS) The effectiveness of solvent extraction on removal of lead cPAH and PCB contamination will be examined during the bench-scale treatability studies performed during Pre-Design
The soil sampling program performed during the RI was designed to estimate the horizontal and vertical distribution of soils contaminated with PCBs lead and cPAHs above the cleanup standards The distribution of PCBs lead and cPAHs are summarized in the RI on Figures 4-8 4-10 and 1-10 respectively GEI identified several inconsistencies in the distribution of contaminated soils within the summary figures For instance the distributions of PCB contamination shown on Figures 1-6 and 4-8 in the RI in the northern portion of the site near TWA III do not agree Also previous soil sampling did not consistently confirm the horizontal and vertical limits of PCB contamination The vertical limits of the PCB contaminationwere not adequately identified for remedial design purposes near transformer work areas and along drainage pathways where PCB migration has occurred
The effectiveness of solvent extraction as the selected remedy for treating the on-site soils was not fully demonstrated during the FS The bench-scale testing that was performed during the FS did not investigate the full range of contamination levels and recovery efficiencies from different soil types that exist on the site
There are three primary objectives for collection of soil quality data during the Pre-Design studies
Document Vol II SG SAP Revision 1
Date March 28 1991 Page 10
1 Collect additional data with close control of analytical precision to evaluate datagaps and inconsistencies reported during the RI The collection of these data will primarily be performed near TWAs and drainage pathways
2 Refine the previously estimated volume of soils contaminated at various concentrations above the cleanup standards
3 Evaluate theselected remedy of solvent extraction through bench-scale testingof soils with specific ranges of PCB concentrations
All soil samples collected for treatability bench-scale testing will also have an aliquot collected for PCB analyses by Ceimic Corporation of Narragansett Rhode Island This will provide added confidence that designated samples are within the specified ranges of PCB concentrations for solvent extraction bench-scale testing
In order to facilitate comparison of Pre-Design Study soil quality with RI study soil quality rigorous QAQC protocols and documentation will be needed All sampleswill be analyzed by Ceimic Corporation using 1988 CLP protocols Analytical Level IV (CLP QAQC and documentation) will be utilized on 20 percent of the soil samples collected The remaining 80 percent will be analyzed according to 1988 CLP protocols utilizing Analytical Level III (CLP QAQC butwithout CLPdocumentation) These serviceswill provide detection limits at or below the ROD Cleanup Standards
During Pre-Design sampling equipment blanks will be collected and analyzed after decontamination of sampling equipment to identify artifact contamination that could result from incomplete decontamination of equipment Trip blanks will also be included during sample shipment to identify cross-contamination during transportation to Ceimic Corporation The laboratory and field QAQC procedures described above will enable the precision required to satisfy the objectives of the soil sampling component of this study
23 Sediments
Sediment samples will be collected and analyzed to provide additional data for comparison with the cleanup standards for design of the Source Control program at the OConnor site Data will be used to supplement the sediment quality data previously collected in the RI for a refined estimate of the levels of lead cPAH and PCB contamination in the sediments of the Upland Marsh Upper Lagoon and Lower Lagoon In addition a composite sediment sample from the Upper Lagoon and a composite sediment sample from the Lower Lagoon will be collected for solvent extraction treatability bench-scale testing Treatability testing on contaminated sediments was not performed during the FS The effectiveness of solvent extraction on removal of lead cPAHs and PCBs from sediments will be examined during the bench-scale treatability studies performed during Pre-Design
Document Vol II SC SAP Revision 1
Date March 28 1991 Page 11
The sediment quality data collected during the RI was limited Only two sediment samples were collected from the Upland Marsh Upper Lagoon and Lower Lagoon In addition limited data have been previously collected regarding the volume of contaminated sediment on-site
There are three primary objectives for sediment quality data to be collected during Pre-Design studies
1 Collect additional data with close control of analytical precision to examine levels of contamination in sediment at locations previously not investigated This will include two additional samples from the Upper Lagoon two additional samples from the Lower Lagoon and six additionalsamples from the Upland Marsh The investigation in the Upland Marsh will be directed towards delineating the extent of contamination in the westerly (upstream) direction
2 Refine the previously estimated volume of sediment in the Upland Marsh Upper Lagoon and Lower Lagoon
3 Evaluate the solvent extraction remedy effectiveness on treatment of sediment through bench-scale testing
In order to facilitate comparison of Pre-Design Study sediment quality with RI study sediment quality rigorous QAQC protocols and documentation will be needed Only sediment samples containing greater than 30 percent solids (based on visual observations) will be submitted for analysis After sample collection in the field percent volume of settled sediment in the sample container will be compared to the percent volume of free water Samples will be submitted to the laboratory for analysis if the volume of settled sediment in the sample container exceeds 50 percent of the total volume of the sample All samples will be analyzed by Ceimic Corporation of Narragansett Rhode Island following 1988 CLP protocols Analytical Level IV (CLP QAQC and documentation) will be performed by Ceimic on 20 percent of the sediment samples collected The remaining 80 percent will be analyzed by Ceimic utilizing Analytical Level in (CLP QAQC but without CLP documentation) These services will provide the detection limits at or below the ROD Cleanup Standards
During Pre-Design sampling equipment blanks will be collected and analyzed after decontamination of sampling equipment to identify artifact contamination that could result from incomplete decontamination of equipment Trip blanks will also be included during sample shipment to identify cross-contamination during transportation to Ceimic
The laboratory and field QAQC procedures described above will enable the precision required to satisfy the objectives of the sediment sampling component of this study
Document Vol II SC SAP Revision 1
Date March 28 1991 Page 12
24 Surface Water
The OConnor SiteStatement of Work for Remedial DesignRemedial Action requires that surface water contained within the Upper and Lower Lagoon and in the Upland Marsh be drained collected and transported off-sitefor treatment unlessotherwise instructed by EPA
The three primary objectives for surface water data to be collected during the Pre-Design Studies are to
1 Probe surface water depths in Lagoons and Upland Marsh to obtain a better estimate of surface Water volumes to be handled during remediation
2 Evaluate changes in surface water quality that may have occurred during the approximately three-year period since sampling during the RI and evaluate extent of surface water contamination in the Upland Marsh which is at the upstream edge of the PGB contamination area
3 Collect additional data to design an appropriate program for surface water diversion pumping treatment and disposal Off-site disposal destinations as well as on-site treatment and disposal options will be examined in more detail during the Pre-Design Study
All surface water samples will be submitted to Ceimic Corporation for analysis of PCBs aluminum and lead All of these samples will be analyzed following 1988 CLP protocols including CLP QAQC and CLP documentation (Analytical Level IV) One additional sample will be collected from each surface water body and submitted to Ceimic for Total Suspended Solids Analysis (EPA Method 1602) utilizing Analytical Level III
2JS Barn
The available data for the extent of contamination of barn materials consists of one sample point The surficial soil sample collected was not described such that it is known whether the sample consisted of dust the concrete slab soil within cracks of the slab or debris samples within the barn The elevated levels of PCBs and lead within the sample may not be representative of the majority of the loose materials within the barn Furthermore no wipe sampling on non-porous debris or sampling of the wooden barn structure was performed during the RI
Document Vol II SC SAP Revision 0
Date January 17 1991 Page 13
Cleanup standards for target chemicals listed in the ROD have not yet been established by EPA for barn materials The ROD indicates that the Toxic Substance Control Act (TSCA) Spill Cleanup Policy and Disposal Regulations (40 CFR Part 761) may be used in lieu of site-specific determination of acceptable levels
Samples of selected media within the barn will be collected and analyzed to provide an initial data set to establish the degree of contamination present within the barn Data will be used in developing the work plan for decontamination and demolition of the barn and to determine appropriate disposal sites for barn demolition debriSNand loose debris within the barn Depending on data results an evaluation will be made tbvdetermine whether additional sampling will be required prior to demolition to betterseqnence demolition activities so that PCB-contaminated material can beSeparated from non-contaminated building materials and debris
ltx All soil wood and concrete barnsamples will besubmitted to Ceimic Corporation (Ceimic) of Narragansett Rhode Island for analysis of PCBs cPAHsgtand lead Wipe samples of debris will be submitted to Ceimic for analySis-ofPCBs All samples will be analyzed following CLP protocols Analytical LeveK IV-requiring CLP QAQC and reporting requirements will be utilized for 20 percent of the5amples Analytical Level in utilizing CLP analytical protocols but without the documentation requirements of CLP will be specified for the remainder of the
Document Vol II SC SAP Revision 0
Date January 17 1991 Page 14
3 HEALTH AND SAFETY
A Health and Safety Plan for the Source Control Field Sampling Plan is presented in Appendix A All personnel involved in the sampling program have been trained in accordance with the requirements of the Occupational Safety and Health Administration Regulation OSHA 1910120 Hazardous Operations and Emergency Response and are enrolled in a comprehensive medical monitoring program
A list of personnel authorized to perform work on this project ^and listing of their participation in personnel training and health monitoring programs^arepresented in the Health and Safety Plan gt
Document Vol II SC SAP Revision 1
Date March 28 1991 Page 15
4 SAMPLING LOCATION AND FREQUENCY
41 Soils
411 General
In general the soil sampling program includes collection of the following two basic categories of samples
1 Soil samples collected from test pits for possible bench-scale testing and
2 Soil samples collected from test pits and borings to fill data gaps on the lateral and vertical extent of soil contamination above cleanup standards and to refine estimates of the quantity of contaminated soils
Figure 3 shows the locations of test pits and borings planned for this investigation These locations were based on the depth delineation of 1 ppm for Total PCBs presented in the Remedial Investigation Table 1provides ageneral sampling rationale including test pit and boring identification numbers target sampling depth and elevation anticipated PCB concentration level and soil type A summary of the analyses to be performed on soil samples including replicates and blanks is shown in Table 2
A total of 12 soil samples for possible bench-scale testing will be collected from test pits during April 1991 Two samples of each soil type indicated below will be collected within the specified ranges of PCB concentrations Each sample will have a minimum volume of about 05 cubic feet (about 60 lb weight) to provide sufficient soil for bench-scale testing
PCB Concentration Range fppml Soil Types
1 to 10 Clay and Fill 10 to 20 Clay 20 to 50 Clay 50 to 500 Clay and FiU
During the RI three soil samples were collected for bench-scale treatability testing with initial PCB concentrations of 1000 4000 and 22000 ppm However sample locations had been selected to obtain samples with PCB concentrations in the range of 250 to 700 ppm based on PCB concentration contours developed during the RI
Document Vol II SC SAP Revision 1
Date March 28 1991 Page 16
Therefore PCB concentration contours developed from the RI data do not precisely indicate the extent and level of contamination
In order to gain a higher degree of confidence that samples within each specific PCB concentration range have been collected GEI will perform field PCB screening with a Dexsil L-2000 PCB analyzer to estimate the soil PCB concentration range prior to collecting the soilsample Aliquots of the 12 bench-scale soilsamples will be collected for confirmatory testing for PCB concentrations by Ceimic of Narragansett Rhode Island utilizing 1988 CLP protocols
GEI will select the soil samples for bench-scale testing after receiving the CLP laboratory results of the PCB concentrations If the laboratory data do not indicate that at least one of the two soil samples was collected from the targeted concentration ranges and soil types an additional contingency round of soil sampling may occur Sampling locations for this contingency sampling round will be selected based Upon the PCB data summarized in the RI and the data collected by GEI during the previous SC sampling round
A total of 40 soil samples (including replicates) will be collected from test pits and borings during April 1991 to fill data gaps on the extent and quantity of contaminated soil The soil sampleswill be collected at the approximate elevation specified for each sampling location as indicated in Table 1 Sample elevations of the bench-scale samples may vary if PCB concentrations in samples screened with the Dexsil L-2000 PCB analyzer are not within the ranges indicated below
Acceptable Screening Target PCB Concentrations Range PCB Concentration Range
(ppm) (ppm)
1 to 10 1 to 10 10 to 20 10 to 20 20 to 50 25 to 45
50 to 500 200 to 350
The soil samples will be analyzed for PCBs ePAHs and lead by Ceimic of Narragansett Rhode Island utilizing CLP protocols Four soil samples (including two selected for bench-scale treatability testing) will also be analyzed for total organic carbon (TOC) cation exchange capacity (CEC) and pH
Document Vol II SC SAP Revision 1
Date March 28 1991 Page 17
Detailed descriptions of the soil sampling and decontamination methods are provided in Section 5 Appendix A and the QAPP Contractors will be used for surveying performance of test pits and drilling of borings All contractors will be required to document that they have completed health and safety training that complies with OSHA Standard 1910120 In generalstakes marking the planned locationsof test pits will be surveyed by a registered surveyor prior to test pit excavation The Stakes will serve as temporary bench marks for reference during location of test pit samples A rubber-tired type backhoe will be used to excavate test pits for planned sampling locations less than or equal to5 feet below ground surface The backhoe and operator will be supplied by HE Sargent Inc of Lewiston Maine capable of operating at hazardous waste sites under Level C personnel protection Soil samples will be collected from in-situ test pit excavations by GEI personnel using a stainless steel shovel or trowel
Due to anticipated shallow ground water conditions a drill rig will be used to advance test borings for soil sampling at locations where the target sampling location is greater than 5 feet below ground surface The soil samples will be collected using a split-spoon sampler Drilling and sampling will be performed by Northeast Diamond Drilling Company of Union Maine capable of working on hazardouswaste sites under Level C personnel protection
412 Soil Analysis Program
Analytical procedures are identified in the Quality Assurance Project Plan (QAPP) The samples will be analyzed using 1988 CLP methods for PCB cPAHs and lead by Ceimic of Narragansett Rhode Island EPA methods 9045 9060 and 9080 will be used to analyze soils for pH TOC and CEC respectively A summary of the analyses to be performed on soil samples including replicates and blanks is shown in Table 2 Samples will be collected in I-Chem glassware or equivalent and stored at 4 deg C as described in Section 6
A series of quality control blanks (replicates and blanks) will be collected by GEI and analyzed by the laboratory to aid in data assessment as discussed in the Quality Assurance Project Plan (QAPP) All quality control samples will be labelled with false sample identification as shown in Table 2 in order to avoid laboratory bias
Sampling equipment blanks and aqueous trip blanks will be submitted for every ten soil samples during the sampling program to check for the presence of cross-contamination These will provide a quality control check for decontamination and handling practices The trip blanks will contain laboratory-supplied organic-free water and will accompany the shipment of soil samples during storage and shipment The trip blanks will be analyzed for PCBs (sample identification will be TP26-TP29) Wipe
Document Vol II SC SAP Revision 1
Date March 28 1991 Page 18
samples will be collected from the shovel or hand trowel and split-spoon sampler (sample identification numbers TP30-TP33 and TP34-TP37 respectively) after decontamination and will be analyzed for PCBs Wipe sampling procedures are described as part of barn sampling procedures in Section 562 One replicate sample will be collected for every ten soil samples Replicate sample locations and identification numbers are indicated on Table 2
413 Soil Sample Designation
Each piece of soil sample glassware will be affixed with a self-sticking adhesive label Each label will be completed with an indelible marker to contain the following information
GEI Consultants Inc Site Name Project Number Sampling Date and Time Sample Number Samplers Initials Analysis Requested
The sample number is composed of a series of information to identify the sample as unique to the sampling point and sampling event The sample number labelled in the field and referred to on all associated documents is composed of the following
Matrix Project Sampling Location Sample Number
Soil - 90393 -TP2-SS1
The example sample number above indicates that soil sample SSI was collected from Test Pit No 2 under project number 90393
4JZ Sediment
431 General
Sediment samples will be collected by GEI from the Upland Marsh the Upper Lagoon and the Lower Lagoon during April 1991 A summary of the laboratory analyses of sediment samples is listed on Table 3 Procedures for sampling and equipment decontamination are provided in Section 5 Appendix A and the QAPP
Document Vol II SC SAP Revision 1
Date March 28 1991 Page 19
In general the sediment sampling program includes collection of the following two basic categories of samples
1 Two composite sediment samples collected using a clam-shell sampler for bench-scale testing
2 Eleven sediment samples (including one replicate) collected with a tube sediment sampler to provide additional data on sediment quality and for estimating the quantity of contaminated sediments
The two composite sediment samples collected using a clam-shell type sampler for bench-scale testing will be collected within the Upper Lagoon and Lower Lagoon at the locations shown on Figure 4 Based on the data in the RI the Upper Lagoon contained the higher sediment concentrations of PCBs
The eleven sediment samples collected to provide additional data on sediment quality and for estimating the quantity of sediments will be collected at the locations shown on Figure 4 As shown on the figure six sediment sampling locations were chosen for the Upland Marsh two locations were chosen for the Upper Lagoon and two locations for the Lower Lagoon
Detailed descriptions of the methods and equipment to be used during the sampling program are provided in Section 5 In general a temporary reference bench mark will be surveyed and staked adjacent to each surface water body by a surveyor licensed in the State of Maine and OSHA-approved for working on a hazardous waste site The actual sediment sampling locations will be measured by tape and compass bearings from the reference bench mark prior to sampling For the bench-scale sample a 5shygallon sample container will be filled with sediment from the dredge type sample The samples for providing additional data on sediment PCB concentrations will be collected with a tubesediment sampler pushed into the complete thickness of sediment at the sampling location All sampling equipment will be decontaminated using methanol and distilled water rinses before each use
4SL2 Sediment Analysis Program
Analytical procedures are identified in the Quality Assurance Project Plan (QAPP) Sediment samples will be submitted to Ceimic of Narragansett Rhode Island for laboratory analysis utilizing CLP protocols The samples collected for bench-scale testing will be analyzed for PCBs The remainder of the sediment samples will be analyzed for PCBs cPAHs and lead One sediment sample will also be analyzed for total organic carbon (TOC) cation exchange capacity (CEC) and pH by EPA methods 9060 9080 and 9045 respectively A summary of analyses to be performed on
Document Vol II SC SAP Revision 1
Date March 28 1991 Page 20
sediment samples including replicates and blanks is shown in Table 3 Samples will be collected in I-Chem glassware or equivalent and stored at 4degC as described in Section 6
A series of quality control samples (replicates and blanks) Will be collected by GEI and analyzed by the laboratory to aid in data assessment as discussed in the Quality Assurance Project Plan (QAPP) All qualitycontrol samples will be labelled withfalse sample identification as shown in Table 3 in order to avoid laboratory bias
Two sampling equipment blanks and one aqueous trip blank will be submitted during the sampling program to check for the presence of cross-contamination These will provide a quality control check for decontamination and sample handling practices The trip blank containing laboratory-supplied organic free water will accompany the shipment of sediment samples and will be analyzed for PCBs (Sample ID SED7) Wipe samples will be collected from the tube sediment sampler and dredge sampler after decontamination and will be analyzed for PCBs (sample identification numbers SED9 and SED8 respectively) Wipe sampling procedures are described as part of barn sampling procedures in Section 562 One replicate sample will be collected during sediment sampling Replicate sample location and identification is indicated on Table 3
423 Sediment Sample Designation
Each piece of sediment sample glassware will be affixed with a self-sticking adhesive label Each label will be completed with an indelible marker to contain the following information
GEI Consultants Inc Site Name Project Number Sampling Date and Time Sample Number Samplers Initials Analysis Requested
The sample number is composed of a series of information to identify the sample as unique to the sampling point and sampling event The sample number labelled in the field and referred to on all associated documents is composed of the following
Matrix Project Surface Water Body Sample Location
SED - 90393 - UM - SED1
Document Vol II SC SAP Revision 1
Date March 28 1991 Page 21
The example sample was obtained from sample location SED1 in the Upland Marsh under project number 90393 The surface water body designations for the Upper Lagoon and the Lower Lagoon will be UL and LL respectively
43 Surface Water
431 General
Surface water quality data consisting of two samples each from the Upland Marsh Upper Lagoon and the Lower Lagoon will be collected by GEI in April 1991 Sampling locations are shown on Figure 4 Surface water sampling locations will be determined in the field by tape and compass bearings from the temporary reference bench mark established for sediment sampling A summary of the analyses to be performed on surface water samples including duplicates and blanks is shown on Table 4 Detailed descriptions of the sampling methods to be used during surface water sampling are provided in Section 5 In general the depth of the water at the sampling location will be measured at each sampling location with a weighted tape measure prior to collecting the surface water sample A water sample will be collected after lowering a stainless steel Kemmerer sampling device one-half the total depth of the water column All sampling equipment will be decontaminated using methanol and distilled water rinses before each sampling event
433 Surface Water Analysis Program
Analytical procedures are identified in the Quality Assurance Project Plan (QAPP) All of the surface water samples will be analyzed using 1988 CLP methods for PCBs aluminum and lead One sample from each surface water body will also be Submitted for Total Suspended Solids Analysis (EPA Method 1602) A summary of the analyses to be performed on surface water samples including duplicates and blanks is shown on Table 4 Surface water samples will be submitted to Ceimic Corporation for laboratory analysis Samples will be collected in I-Chem glassware or equivalent and stored at 40 C as described in Section 6
A series of quality control samples (duplicates and blanks) will be collected by GEI and analyzed by the laboratory to aid in data assessment as discussed in the Quality Assurance Project Plan (QAPP) All quality control samples will be labelled with false sample identification as shown in Table 4 and described below in order to avoid laboratory bias
One sampling equipment blank and a trip blank will be submitted during each sampling round to Check for the presence of cross-contamination These will provide a quality control check for decontamination and handling practices One trip blank
Document Vol II SC SAP Revision 1
Date March 28 1991 Page 22
sample consisting of laboratory-supplied organic-free and de-ionized water will accompany the samples during storage and shipment and will be analyzed for PCBs aluminum and lead (sample identificationwill be SW4) A samplingequipment blank will be collected by pouring laboratory-supplied organic-free and de-ionized water through the Kemmerer sampler at the end of the sampling program The sampling equipment blank will then be analyzed for PCBs aluminum and lead (sample identification will be SW5)
One surface water duplicate will also be collected each sampling round Duplicate sample location and identification is indicated on Table 4
433 Surface Water Sample Designation
Each piece of sample glassware will be affixed With a self-sticking adhesive label Each label will be completed with an indelible marker to contain the following information
GEI Consultants Inc Site Name Project Number Sampling Date and Time Samplers Initials Analyses Requested
The sample number is composed of a series of information to identify the sample as unique to the sampling point and sampling event The sample number labelled in the field and referred to on all associated documents is composed of the following
Matrix Project Surface Water Body Sampling Location
SW - 90393 - UM - SW1
The example sample number above indicates thata surface water sample was obtained from the Upland Marsh at location SW1 under Project Number 90393 The surface water body designations for the Upper Lagoon and the Lower Lagoon will be UL and LL respectively
Document Vol II SC SAP Revision 1
Date March 28 1991 Page 23
44 Barn
441 General
A total of approximately 30 samples of various media within the barn will be collected by GEI during May 1991 The types of media collected will generally consist of wood fragments from barn walls dust concrete and wipes on non-porous debris within the barn The exact sample locations will be primarily determined in the field based on observations during sampling (eg staining on soils concrete or wood) Based on a site visit by GEI on December 19 1990 preliminary sample locations for barn materials were chosen as shown in Figure 5 These preliminary locations will enable representative sampling of general debris and staining in the barn and indicates the general sampling strategy which will be employed during Pre-Design Final sampling locations may be modified during the program based on closer observation of equipment barn materials and evidence of staining
Detailed descriptions of the methods to be used during the barn sampling program are provided in Section 5 In general a survey of the general types of materials present in the bam and locations of apparent staining of surficiial materials or debris will be recorded on a plan Following the survey representative areas within the barn will be sampled A total of 12 wipe samples will be collected (eg steel shelves boat wood stove electric meters etc) by wiping a 100 cm2 area with laboratory-prepared sampling wipes A total of ten samples of Wood from the walls of the barn will be collected by using a wood boring bit and wood chisel A total of four samples of loose dust will be collected from the floor of the concrete slab of the barn using disposable nylon brushes and stainless steel trowels Finally a total of four samples of concrete will be collected from areas of visible staining and one unstained area by drilling the concrete to a maximum depth of 12 inch in a 100 cm2 area All non-disposal steel sampling equipment will be decontaminated using methanol and distilled water rinses before use at each sampling location
442 Barn Analysis Program
Analytical procedures are identified in the Quality Assurance Project Plan (QAPP) Three field equipment blanks and three trip blanks will be submitted during the barn sampling program to check for the presence of cross-contamination These will provide aquality control check on decontamination and handling practicesAsummary of the analyses to be performed on each sample matrix and the quality controlsamples is shown in Table 5
Document Vol II SC SAP Revision 1
Date March 28 1991 Page 24
Wipe wood dust and concrete samples will be submitted to Ceimic in Narragansett Rhode Island for laboratory analysis Wood dust and concrete samples will be analyzed for PCBs cPAHs and lead Samples will be collected in I-Chem glassware or equivalent provided by Ceimic and preserved and stored as described in Section 6
The objective of the barn sampling program is to provide a preliminary assessment of the degree of contamination present within the barn (see Section 2) It may be difficult to ensure that representative replicates can be made of the various matrices during sampling Therefore no replicate samples of barn materials will be collected during this initial sampling effort
Aqueous trip blank wipe samples will accompany the samples during storage and shipment and will be analyzed for PCBs (sample identification will be PTB1-PTB3) Sampling equipment blank wipes will be made following decontamination of all steel sampling equipment at various times during the sampling program The steel equipment wiped will include the hole saw trowel and the drill bit used for barn wall dust and concrete sampling respectively The equipment wipe samples will then be analyzed for PCBs (sample identification will be PEB1-PEB3)gt
443 Barn Sample Designation
Each piece of sample glassware will be affixed with a self-sticking adhesive label Each label will be completed with an indelible marker to contain the following information
GEI Consultants Inc Site Name Project Number Sampling Data and Time Sample Number Samplers Initials Analysis Requested
The sample number is composed of a series of information to identify the sample as unique to the sampling point and sampling event The sample number labelled in the field and referred to on all associated documents is composed of the following
General Sample Location Project Sample Type Sample
BARN - 90393 - D2
Document Vol II SC SAP Revision 1
Date March 28 1991 Page 24a
The example sample number above indicates that a barn sample was obtained under project number 90393 and was the second dust sample collected The designations for the wipe samples will be P wooden samples W dust samples D concrete samples C and other samples O
Document Vol II SC SAP Revision 1
Date March 28 1991 Page 25
5 SAMPLING EQUIPMENT AND PROCEDURES
51 Air Monitoring
Short-term air monitoring will be performed regularly on-site during the Source Control (SC) sampling program A HNu photoionization detector (PID) and an MIE Model MINIRAM hand-held aerosol monitor (HAM) will be used for air monitoring The PID is capable of detecting total ionizable compounds (typically VOCs) and the HAM detects solid or liquid particulates in air which often take the form of dust smoke fumes and mists Each air monitoring instrument will be operated in accordance with the requirements specified in the Health and Safety Plan provided in Appendix A Readings from the PID and HAM will be recorded in the Project Field Log Book (see Appendix B) Calibration procedures for the PID (HNu Model PI-101) and the HAM (MIE Model MINIRAM) are provided in Appendix C
52 Soil Sampling
521 General
Soil sampling locations are shown on Figure 3 Table 1 lists each soil sampling location planned approximate sample depth and rationale for sample collection
Prior to sampling a surveyor registered in the State of Maine will survey the exact location of each test pit and boring location and provide a temporary stake that will function as a bench mark for horizontal and vertical control within 20 feet of each test pit and at each boring Sample locations within test pits will be by tape and compass bearing methods
Soil sampling will be performed with strict adherence to the procedures described below A list of equipment requirements for the soil sampling program is provided in Table 6 In general excavation of soil to the target depth in test pits will be performed with a backhoe for sampling to 5 feet below ground surface The backhoe and operator will be supplied by HE Sargent Inc and the operator will be equipped with Level C personnel protection (see Appendix A) A bombardier or truck-mounted drill rig operated by Northeast Diamond Drilling by personnel equipped with Level C protection will be utilized for sampling points greater than 5 feet below ground surface Soil samples collected by GEI for possible bench-scale testing will be obtained only at test pit locations Ambient air monitoring will be performed by GEI regularly while working on-site for health and safety monitoring Mobilization
Document VoL II SC SAP Revision 1
Date March 28 1991 Page 26
of equipment and transportation of materials over the site during the soil sampling program will avoid heavily contaminated transformer work areas when possible to reduce dispersing PCBs to other areas Drilling and excavating equipment will be decontaminated under the supervision of GEI prior to use at each sampling location following strict decontamination procedures described in Appendix A and below Sampling equipment will be decontaminated by GEI prior to each sampling event as described below All soil sampling operations within the site will be performed using Level C dermal and respiratory personnel protective equipment to protect against PCB-contaminated dust levels which are likely to exceed 1 mgm3 during sampling The detailed Health and Safety Plan that will be followed during soil sampling is provided in Appendix A
522 Soil Sampling Methods for Test Pits
A minimum of a two-person crew in addition to the backhoe operator or the drill rig crew will be provided by GEI during the sampling program
All soil samples will be collected from test pits by GEI with a shovel or trowel following excavation to the appropriate depth with a rubber tire backhoe as follows
1 Check the survey stakes for the proper test pit number identification and location
2 Place polyethylene sheeting on each side of the test pit for staging the excavated soils from the test pit
3 A standard rubber tire type backhoe will perform the soil excavation to the planned sampling depth All soil excavated from the test pit will be placed on the plastic sheeting adjacent to the test pit The top 2 feet of excavated soil will be cast to one side of the test pit on the sheeting and the bottom 3 feet of soil will be cast to the opposite side to avoid mixing soils with potentially significantly different levels of contamination After completion of sampling soil will be backfilled at a similar depth from which it was excavated
4 All excavation activities will be continuously observed by an engineer or geologist from GEI A test pit log form (OCONNORFL12) will be completed by GEI for each test pit performed and will include the following information
Document Vol II SC SAP Revision 0
Date January 17 1991 Page 27
Name and Location of Job Date Excavation and Test Pit Number Approximate Ground Surface Elevation at Test Pit Total Depth of Test Pit Dimensions of Test Pit Location and Depth of Soil Sample Relative to Stake Reference Method of Soil Sample Acquisition (Shovel Trowel) Volume of Soil Sample J Soil and Stratigraphic Descriptions x
Ground Water Levels (if encountered) y ^v Air Monitoring Information v Other observations Such as soil staining buried debris etc
5 At least one photograph will be taken oflta wall of each test pit from within the test pit with a scale for comparison to indicate soil layering or staining In addition one photograph shall be taken of thertesVpit from the ground surface also showing sample locations withinthe-test pit Photographs of the test pits will be marked to include site locationxjdbmumber^test pit number date and time A photograph log sheet will be maintained fampMuture reference
6 The target soil sampling elevation will be determined by GEI using a level and rod
7 Soil sampling will begin from within the test pit only after the side walls of the pit have been properly^sloped back in accordance with OSHA requirements (see Health and Safety Plan^ Appendix A) All samples collected will be identified on the test pit logazid in the field book Information about the sample including sample number^de^th voiuine and soil description will be recorded The soil sample will be colleetedTrotn an undisturbed area of the test pit floor or wall by means of scraping or digging with a stainless steel shovel or trowel The number of clean sampling utensils for each test pit shall be equal to the number of soil samples collected at the test pit Shovels or trowels used to clean sloughed material from the sampling location will not be used to collect the sample unless decontaminated before use in sampling Care will be taken to assure that the sample is taken from the actual soil unit desired mid does not include slough or scraped material from the sides of the trench The desired soil sample will be immediately placed into the sample container within the test pit A portion of the sample will be retained for screening with the Dexsil L-2000 PCB analyzer The containers will then be sealed labelled and stored in asecure area until Shipment to the laboratory
Document Vol II SC SAP Revision 1
Date March 28 1991 Page 28
8 When collecting a larger volume sample for bench-scale testing a smaller soil sample will first be collected for field screening using the Dexsil L-2000 PCB Analyzer If the analyzer indicates that the PCB concentration is within the target range the bench-scale soil sample will be collected If the Analyzer indicates that the PCB concentration is outside the target range the test pit will be expanded if necessary and another sample will be collected for PCB screening This procedure will be continued until a sample within the target range is identified The test pit will be expanded no more than 2 feet in all directions and to the maximum depth of 5 feet below ground surface If after this over-excavation the soil within the target concentration range has not been identified with the Dexsil L-2000 PCB Analyzer a new test pit location will be selected near the original test pit in an area indicated by the Remedial Investigation to contain soil contamination within the target range
9 Once the targeted PCB concentration has been indicated by field screening the desired soil sample will be collected with a clean stainless steel trowel or shovel at a sufficient quantity to fill a 5-gallon container An aliquot from the 5-gallon sample container will be collected and placed in an appropriate sample container for laboratory analysis for PCBs The 5-gallon containers will then be sealed labelled and appropriately stored in a secure area until transported off-site The laboratory samples will be sealed labelled and stored with the other soil samples awaiting shipment to the laboratory
10 Upon completion of sample collection the excavated soil material will then be backfilled into the test pit The backfilled area will be compacted to the approximate original ground elevation
11 Equipment will be decontaminated after backfilling the test pit (ie shovel trowels measuring equipment) byscrubbing and With methanol and distilled water rinses Portions of the backhoe (bucket bucket arm etc) will be decontaminated with a high-pressure steam rinse on the decontamination pad (see Appendix A)
523 Soil Sampling Methods for Borings
Selected soil samples are planned to be collected at depths greater than 5 feet below ground surface to obtain additional data on the depth of PCB contaminationexceeding cleanup standards in Transformer Work Areas Samples will be obtained using split-spoon sampling techniques within 3-inch ID hollow stem augers in test borings generally following procedures specified by American Society for Testing Materials (ASTM) D1586-84 Test borings will be performed by Northeast Diamond Drilling
Document Vol II SC SAP Revision 1
Date March 28 1991 Page 29
under the observation of an engineer or geologist from GEI The following procedures not specified in ASTM D1586-84 will be used
1 Place a polyethylene sheet on one side of the boring location for temporarily staging drilling cuttings during borehole advancement All drilling equipment shall be decontaminated with a high pressure steam rinse on the decontamination pad prior to beginning drilling
2 Advance hollow-stem augers without split-spoon sampling to a depth about 5 feet above the sampling depth specified in Table 1
3 Begin continuous split-spoon sampling with 18-inch-long samples Collect a specimen from the middle of each sample for screening with the Dexsil L-2000 PCB analyzer and the HNu photoionization detector Rinse the split-spoon sampler with methanol and distilled water rinses before each sample
4 Collect a split-spoon sample at the designated sample depth Divide the split-spoon sample vertically Place a minimum of 4 inches of sample recovered from the bottom right half of the sample into the glass sample container Seal and label the sample container as indicated in Section 4 and store the container in a cooler with ice in a secure area until shipment to the laboratory Retain the left half of the split-spoon sample for screening with the Dexsil 1^2000 PCB analyzer and the HNu photoionization detector
5 After collecting the final soil sample in the boring measure depth to ground water below ground surface using a decontaminated Solinst battery-operated water level indicator Record the time elapsed after completion of the boring when the ground water level was measured
6 Remove augers from borehole If the borehole remains open and evidence of ground water was encountered during sampling collect additional measurements of depth to ground water prior to backfilling until the ground water level appears to stabilize Note occurrence of precipitation or other events which could effect water level measurements in the project log book
7 Backfill borehole within 24 hours after completion of the boring with drill cuttings staged adjacent to the borehole If the borehole collapses and cuttings cannot be backfilled in the borehole store staged cuttings in a steel drum to be left on site Label outside of drum to indicate contents are borehole cuttings from the designated boring number and affix labelindicating PCB-contaminated materials Cuttings from more than one boring can be combined in a single drum
Document Vol II SC SAP Revision 0
Date January 17 1991 Page 30
8 Decontaminate measuring and sampling equipment with methanol and distilled water rinses Decontaminate downhole drilling equipment on the decontamination pad with a high-pressure steam rinse before starting the next boring
A log will be prepared by GEI for each boring and will include the following
information 7
Name and Location of Project
Boring Number lt Date of Boring Ground Surface Elevation x-Boring Diameter and Depth Sample Numbers and Depths Soil Screening Data Visual Soil Descriptions Water Level Measurements Air Monitoring Levels Other Observations
The boring log form is provrdedin Appendix B (OCONNORFL15)V
i
Surface Water ^^7
531 General
N
Surface water sam^les^will becollected at the locations shown in Figure 4 If water is too deep for safe aecess^with hip-waders andor access with hip waders will severely disturb sediment an inflatableboat will be used to access Surface water sampling locations
The surface water sampling program will be performed following strict adherence to the following procedures A list of the equipment requirements for surface water sampling is provided in Table 8 In general ambient air monitoring will be performed regularly while working on-site for health and safety considerations Areas of the site which have been determined by previous studies to have elevated concentrations of PCBs in soils (for example TWAs) will be avoided while traversing the site to reduce the likelihood of dispersing PCBs to other areas The depth of water at the sampling stations will be measured and the surface water elevation will be surveyed on each water body Equipment will be decontaminated prior to use at each sampling station following decontamination procedures
Document Vol II SC SAP Revision 0
Date January 17 1991 Page 31
532 Surface Water Sampling Methods
Surface water samples will be collected during the Pre-Design Study at the locations shown on Figure 4 Surface water samples will be collected during the initial stage of the Source Control sampling program prior to soil and sediment sampling An inflatable boat will be used to access surface water sampling locations if there is sufficient water depth The boat will be cleaned with methanol and distilled water rinses before sampling in each water body The surface water sampling procedures will be as follows ltX1 Determine the location of the sampling station by tape^and compass from a
temporary bench mark at the edge of the surface water body x
2 Measure the depth of water at the sampling station with a weighted tape measure x (
^ 3 Gently lower a clean Kemmerer sample^bottle to the desired depth (one-half
water depth) so as not to remove th^stoppeisprematurely V^
4 Pull out the stopper with a sharp jerk ofdhe sampler line
5 Allow the bottle to fill completelyras evidenced by the cessation of air bubbles
6 Raise the sample and capdhe nottle X x
7 Pour the sampl^fromthe bottle into the appropriate sample container The container willbesealedlabelled and stored in a secure area until shipment to the laboratory
8 Fill a beaker with water remaining in the sampler and measure specific conductance pH and temperature
9 Decontaminate the sampling apparatus measuring tape and Kemmerer sampler by scrubbing internally and externally with methanol and distilled water rinses
10 Record the following surface water sampling information in the project log book (OCONNORFL1)
Document Vol II SC SAP Revision 0
Date January 17 1991 Page 32
Date Time Total Depth of Water Location and Depth of Sample pH Conductivity Measurements Air monitoring levels detected Other observations
Sediment
541 General x
gt The locations of the sediment sampling stations are shown on Figure 4 Table 3 lists the various sampling stations and sampling methods for the sampling program Sediment sampling during the project will beperformed with strict adherence to the following procedures A list of equipment requirements for the sediment sampling program is provided in Table7 In general ambientw monitoring will be performed regularly while working on-site for health-and safetymonitoring Mobilization of equipment and materials over the sitdduring^he-sediment sampling program will follow specific routes to reduce the likelihoocKPfdispersing PCBs to other areas Equipment will be decontaminated prior to sampling at each location following strict decontamination procedures described belowy All sediment sampling operations within the site will be performed fusing level C dermal personnel protective equipment and Level D respiratory^protective equipment will be worn
v ^
542 Sediment Sampling Methods gtSN
The sediment sampling^vili be performed after collection of surface water samples and will consist of rivo primary components
1 Tube sediment smiling to provide additional data on sediment quality and to estimate the thickness of sediment
2 Dredge sediment sampling to obtain a sample for laboratory for bench-scale treatability testing
The tube sediment sampling program will be performed as follows
Document Vol II SC SAP Revision 0
Date January 17 1991 Page 33
1 Determine the sampling locations by tape and compass measurements from a temporary bench mark (reference stake) surveyed near the edge of the surface water body Access locations in interior portions of the water bodies using an inflatable rubber boat The boat will be decontaminated with methanol and distilled water rinses before use in each surface water body
2 Measure the depth of water with a weighted tape measure
3 Lower the hand tube sediment sampler to the desired ctepth Sediment entering the tube is trapped by a plastic core retainer allbyringlheunit to be retrieved a n d t h e s a m p l e r e m o v e d w i t h o u t s a m p l e l o s s X x y
4 Extract the sediment samplefrom the sampler and^immediately place the sample
into the sample container The containers ywllthen be sealed labelled and stored on ice in a cooler in a secure area until shipment to the laboratory
5 Decontaminate the sampling apparatua and measuring tape by scrubbing with methanol and distilled water rinses
vw 7 Record sediment sampling record information in the project log book
(OCONNORFL2) after collecting a sediment sample at each sampling station The information that will beuro~documenteamp includes the following
Date and Time ^ Total Depth of Water N Thickness of Sediment Location of Sample Length and Vblume^of Simple Sample Description x- Air Monitoring LevetesDeteeted Other Observations
The sediment sampling procedure for collecting samples for bench-scale treatability testing will be as follows
1 Determine the location of the dredge traverse line by tape and compass bearings from the temporarily bench mark adjacent to the surface water body
2 Pull the sediment dredge along the planned traverse with a wire line from the edge of the surface water body
Document Vol II SC SAP Revision 0
Date January 17 1991 Page 34
3 Repeat sampling until 5 gallons of sediment have been collected and placed in the 5-gallon sample container The containers will then be sealed labelled and stored in a secure area until shipment to the laboratory
4 Decontaminate the sampling apparatusand drag line by scrubbing with methanol and distilled water rinses
S6 Record the following sedimentsampling informationin die project log book after
sample collection X nXx
Date and Time X gt Total Depth of Water Location and Volume of Sample Number of Grab Samples Collected to Form Composite Volume Sample Description Air Monitoring Levels Detected x X Other Observations
Barn
5-51 General
Sampling within the barn will4gteperformed with strict adherence to the following procedures A list of equipment requirements for the barn sampling program is provided in Table 9 Areas of the Site which have been determined by previous studies to have elevatedconcentrations of PCBs in soils (for example TWAs) will be avoided during bam sampling to reduce the likelihood of dispersing PCBs to other areas within the barnXEquipment will be decontaminated prior to use at each sampling location inside thetarn following strict decontamination procedures All sampling operations withfaMhe barn will be performed with Level C personnel protective equipment due to dust levels which may to exceed 1 mgm3 during sampling (see Appendix A) A detailed Health and Safety Plan which will be followed during barn sampling is provided in Appendix A
552 Barn Sampling Methods
If power is not available on-site a gasoline-powered generator capable of supplying electricity for lighting and sampling equipment will be positioned outside the fenced area of the site prior to sampling Extension cords will be run to the barn (avoiding TWAI) for power supply In order to reduce the potential for cross-contamination due to dust generation the sampling of different matrices will proceed in the
Document Vol II SC SAP Revision 0
Date January 17 1991 Page 35
following sequence 1) wipe samplingof non-porous debris 2)wood sampling of barn walls 3) dust sampling from top of floor slab 4) concrete sampling of floor slab Areas to be sampled will be chosen based on the presence of apparent oil-type staining and to obtainan even distributionof representative samples with no apparent staining
Following sampling at each location a self-sticking adhesive label marked with the sample number will be placed at the sample location for future reference Each label will then be located by taping relative to a reference point Established at the western corner of the barn (W-Z corner) as shown in Figure 5 Walls W and Z will be used as orthogonal axes similar to a typical coordinate system For samples collected above the concrete floor slab (eg wipe and wooden wall samples the height above the floor slab will also be recorded All samples willbe collected between the floor slab and a maximum height of seven feet All location measurements and a brief description of the area sampled will be recorded on the Barn Sampling Form (OCONNORFL13) provided in Appendix B Imaddition a photograph of each sampling location will be taken and^ recordedy on the Photograph Log (OCONNORFL6) Detailed procedures-for each type of sample to be collected during the barn sampling program follows
lt Win Samnlino N
1 Identify the non-porous item within the barn selected to be sampled which has an area of at least 100 cm2 which maybe wiped Examples include sheet metal fiberglass cleanly painted wooden surfaces glass etc
2 Place a decontaminated stainless steel or plastic 100 cm2 (10 cm X 10 cm) template at t^desired sampling location
Note For smaller areas such as on electric meters use the quarter template of 25 cm2 area and make four wipes to compose one sample
3 Remove the laboratory-supplied gauze from within the glassware with stainless steel forceps The gauze should be moist with solvent as prepared by the laboratory
4 While holding the appropriate template in place thoroughly swab the 100 cm2 area with the gauze using forceps or bufyl rubber gloves Inspect the area to ensure that all loose dust has been wiped with the Alter paper
Document Vol II SC SAP Revision 0
Date January 17 1991 Page 36
5 Fold the gauze over to ensure that the dust is contained on the inside of the gauze Place in the appropriate sample container seal label and store in a secure area until shipment to the laboratory
6 Decontaminate the forceps and templates by scrubbing with methanol rinsing with distilled water and wiping dry with paper towels
7 Label the sample location photograph and complete^he Barn Sampling Form
(see Appendix B) and other necessary documentation after each sample is
c o l l e c t e d lt X x x y x x
xWooden Wall Sampling X
1 Select the sampling area of at least 100 cm2 on the inside wall of the barn and secure a decontaminated 100cm2 template at the location Place a steel pan below the sampling area to catch sawdust ancLwood chips
2 Using an electric drill equipped withra-one-ineh diameter wood-boring bit drill out wood within the template area to arnaximum depth of 12 inch
3 Place sawdust and wood chips man appropriate sample container seal label and store in a secure area untiLsRipinent to the laboratory
4 Decontaminate the drilTbit and pan by scrubbing with methanol rinsing with distilled water and jwiping dry with paper towels
5 Label the samplelocatidn photograph and complete the Barn Sampling Form (see Appendix^)
Dust on Floor Slab Sampling
1 Select an area to sample such that at least 100 grams of dust or soil may be obtained This will vary depending on thickness of the dust or soil
2 Using a disposable nylon brush or stainlesssteel trowel brush or scrape dustsoil toward the center of the area chosen minimizing the creation of airborne dust
3 After the dustsoil has been centralized use a flat stainless steel trowel to collect the material and place in laboratory-supplied glassware seal and label
Document Vol II SC SAP Revision 0
Date January 17 1991 Page 37
4 Dispose of the nylon brush with other containerized PCB-waste materials and decontaminate the stainless steel trowelsby scrubbingwith methanol rinsingwith distilled water and wiping dry with paper towels
5 Label the sample location photograph and complete the Barn Sampling Form
Concrete Slab Sampling
1 Identify three areas of visible staining and one area of no visible staining on the floor slab Using a disposable nylon brush carefulfy brushxaway loose dust and soil from an approximately 1-square-foot area
2 Place a pre-cut 10-square-foot sheet of clean polyethylene sheeting with a 1shysquare foot hole cut in the center over thevsampling area and secure in place with duct tape Place a decontaminated lOO cmr template in the center where t h e s a m p l e i s t o b e o b t a i n e d X v N
3 Using an electric hammer drill eqi^pedwitlra^ungsten-carbide mortar bit drill the four corners established by the tempfate^to a maximum depth of 12 inch
4 Remove the template ancLdrilL the remaining 100 cm2 within the established square to a maximum dep^fof l2Jnch
-vFollowing drilling brush the concrete chips and dust from the plastic sheeting toward the center otlhe sarhplihggtarea Collect sample with a clean disposable nylon brush andtrowel and place in an appropriate sample container seal label and store in aSecure area until shipment to the laboratory
6 Dispose of the nylon oriish with other containerized PCB-contaminated waste materials and decontaminate the stainless steel trowel and template by scrubbing with methanol rinsing with distilled water and wiping dry with paper towels
7 Remove and dispose of the polyethylene sheeting and duct tape in an appropriately marked barrel that will remain on the site with other sampling waste disposal materials Label the samplinglocation photograph and complete the Barn Sampling Form
Document Vol II SC SAP Revision 0
Date January 17 1991 Page 38
6 SAMPLE HANDLING AND ANALYSIS
61 General
GEI has established a program of sample chain-of-custody that is followed during sample handling activities in both field and laboratory operations Thisvprogram is designed to assure that each sample is accounted for at all times To accomplish this objective sample container labels sampling records chain-of-custody records sample assignment forms shipping airbill records and laboratory receipt sheets must be completed by the appropriate sampling and laboratory personnel ^ y gt
62 Sample Labeling and Documentation gt
The plastic 5-gallon containers for bench-scale testingsWilKbe cleaned with methanol and distilled water rinses prior to use All other sample containers^will be pre-cleaned by EPA-approved methods and provided by the laboratory^ A summary of the sample containers and preservation requirements for each of thamp^analytieal parameters to be measured is shown in Table 10 Each piece of sample gl^sware^will be affixed with a self-sticking adhesive label Each label will contain the information described in Sections 4 and 5 of this document ^
To further document the samplingprogr^mand Sample handling procedures the project log book (OCONNORFL1) will containinformation regarding the activities on-site and sample handling In addition photographs of each type of field procedure will be taken The photographs will be representative of thetechniques employed throughout the sampling program A record ofeach photograph Will be made on the Photograph Log (OCONNORFL6) as stiown 4i^Appendix B
63 Chain-of-CustodySample^Assignment
Chain-of-custody will be maintained at all times as described in more detail in the Quality Assurance Project Plan (QAPP) A copy of the chain-of-custody form (OCONNORFL9) to be used is provided in Appendix B
In general the chain-of-custody record must be used such that it includes the following information
Document Vol II SC SAP Revision 0
Date January 17 1991 Page 39
Project name and number Names of the sampler(s) and person shipping the samples Station number or well identification Date and time the samples were collected Composited or grab sample designation Sample number (eg 1GU-90393-MW101A) Total number of containers Analysis requested Date and time the samples were delivered for shipping Names of those responsible for receiving the sampled at the laboratory
Prior to shipment of the samples a sample assignment form will be completed (see OCONNORFLIO in Appendix B) The sample assignmenrform will provide the contract laboratory sufficient information to process the samples and perform the appropriate analysis
The chain-of-custody record and sample assignment fornr will both be completed in duplicate in the field through the use of carbon paperT The original copy of the forms will be enclosed in a plastic bag and placed in the coolersWith the samples for shipment to the laboratory The carbon copy of the forms will be retained by GEL
VSoil samples for bench-scale testing ynH be-stored on site in a locked storage shed until samples are selected for the bench-scale7testing^ This decision will be made after receipt of the laboratory PCB analyses results and approval of the Source Control Work Plan by the EPA Soil samples not usecLfor bench-scale testing will remain in the locked storage shed and will be included with-other soil for treatment during the Remedial Action
lt v 64 Sample Shipments
Sample containers are generally packed in coolers for shipment Prior to packing organic analysis samples will be placed in plastic bags Bottles are to be packed tightly so that no motion is possible Styrofoam vermiculite and bubble pack are suitable for most instances Ice Will be placed in sealed plastic bags or ice packs in order to keep samples at 4degC at all times Samples will be protected against freezing during cold weather The original chain-of-custody and sample assignment forms will be sealed in plastic bags and placed in the cooler with the samples The cooler will be closed and a signed self-sticking label with the words Custody Seal will placed between the body of the cooler and the cover The cover will then be sealed with clear tape Samples will be shipped so that they are received by the laboratory no later than 60 hours from the time of sample collection
Document Vol II SC SAP Revision 0
Date January 17 1991 Page 40
All shipping of samples will be done through Federal Express or equivalent overnight delivery service Samples will be shipped in accordance with Department of Transportation (DOT) regulations If prompt arrival of the samples cannot be guaranteed the samplers will be responsible for proper storage of the samples until adequate transportation arrangements can be made The laboratory will be notified prior to shipment to arrange for receiving the samples and to prepare for the analyses requested Based on the low concentrations of chemicals detected during previous studies theSamples will be classified as environmental samples The air bill for the samples will speeiiythat the contents of the cooler are environmental or hazardoussamples as appropriated When samples are received by the laboratory they will notify the Task Manager of theccondition of the samples
H craTrsi
TABLE 1 - SOIL SAMPLING SCHEDULE Field Sampling Plan OConnor Co Site Augusta Maine
DEPTH APPROXIMATE BELOW ANTICIPATED
SAMPLE NUMBER SAMPLE GROUND PCS GENERAL LOCATION OF ELEVATION SURFACE CONCENTRATION SOIL
ID SAMPLES (MSL) (PPm) TYPE COMMENTS
TP1 2175 25 ND ClaySandy Till Confirm contours 215 35 ND
TP2 217 15 50 ClaySandy Till Confirm contours TP3 212 ND Siltv Clav Confirm horizontal extent toward marsh TP4 211 5-50 Clav Obtain bench scale 20-50 ppm
TP5 213 50-500 Clay Confirm lateral extent
TP6 215 15 5-50 Fill Obtain bench test sample In 1-10 ppm
TP7 210 35 0-5 Siltv Fine Sand Confirm vertical extent in drainage area
217 3 0-5 FillClay Confirm contours TP8 219 1 0-5 TP9 207 35 0-5 Siltv Fine Sand Confirm vertical extent In drainage area
TP10 1175 15 50-5000 Fill Bench scale test sample 50 to 500 ppm
TP11 218 0-5 SandClay Confirm horizontal extent toward marsh
TP12 218 0-5 SandPay Confirm horizontal extent toward marsh
TP13 221 5-50 Clav Bench-scale test sample 10-20 ppm
TP14 206 0-5 Gray Silty Clay Confirm vertical extent
TP15 200 0-5 Gray Silty Clay Confirm vertical extent
TP16 2185 15 5-50 Clay Bench-scale test sample 1-10 ppm
228 4 TP17 230 2 Confirm contouring in north end of site
231 4 TP18 233 2 Confirm contourtng in north end of site
236 4 TP19 238 2 Confirm contouring in north end Of site
Project 90393 GEI Consultants Inc Page 1 of 2 March 28 1991
SAMPLE NUMBER LOCATION OF
SAMPLES
TP20 TP21 TP22 TP23
TP24 TP25
B1
B2
1 B3 2
B4
B5
ND = Not Detected
TABLE 1
APPROXIMATE SAMPLE
ELEVATION MSLJ
231 233
2275 237 237 235 236 222 210 215 210 215
215 220
218 220 220 222
- SOIL SAMPLING SCHEDULE Field Sampling Plan OConnor Co Site Augusta Maine
DHTH BELOW
GROUND SURFACE
4 2
15
2 1
8 3 8 3
12 6
8 6 6 4
ANTICIPATED PC8
CONCENTRATION
ND ND 0-5
500-5000 5-50
50-5000 0-5
50-500
0-5 50-500
0-5 0-5 0-5 0-5
GENERAL SOIL TYPE
Clavev Silt Silty Clay
Clay
Till or Clay
Till or Clay
Gray Silt
Gray Clavev Silt
Gray Clayey Silt
i
Confirm contouring in north end of site Confirm contours Confirm contours Confirm contours
Confirm contours Bench scale sample 50-500 ppm
Confirm contouring and vertical extent
Confirm Contouring and vertical extent
Confirm contours and vertical extent
Confirm contours and vertical extent
Confirm contours
Project 90393 GEI Consultants Inc Page 2 of 2 March 28 1991
TABLE 2 SOIL ANALYSIS PROGRAM Field Sampling Plan OConnor Co Site Augusta Maine
Sample Depth
Sample Location ID
SoB Sample Number
(ft below ground surface) Lead cPAHs PCBs
pH TOC CEC
Anatyticsd Level IV
TEST PITS TP1 SS1 TP2 SS1 15
SS2 35 TP3 SS1 TP4 SSI
SS2 TP5 SSI TP6 SS1 15
SS2 15 TP7 SS2 35 TP8 SSI
SS2 TP9 SSI 35
replicate of SS2 SSI
TP10 SS1 15 SS2 15
TP11 SSI TP12 SSI TP13 SS1
SS2 TP14 SS1 TP15 SS1
replicate of SS2 SS1
TP16 551 15 552 15
TP17 551 552
TP18 551 552
TP19 551 552
TP20 551 552
TP21 SS1 15 TP22 SS1
Project 90393 GEI Consultants Inc Page 1 of 2 March 281991
TABLE 2 SOIL ANALYSIS PROGRAM Field Sampling Plan OConnor Co Site Augusta Maine
Sample Depth
Sample Location ID
SoB Sample Number
(ft below ground surface) Lead cPAHs PCBs
pHTOC CEC
Analytical Level IV
Bench Scale
Sample
replicate of SS2 SS1
TP23 SS1 TP24 SS1
SS2 TP25 SSI
SS2 BORINGS
B1 SS1 SS2
B2 SS1 SS2
B3 SS1 6 replicate of
SS2 SS1 SS3 12
B4 551 552
B5 551 552
QUALITY CONTROL TP26-TP29
(trip blank) SS1-SS4 TP30-TP33 (shovel or
hand trowel SS1-SS4 blank)
TP34-TP37 (split-spoon
blank) SS1-SS4 TOTAL
ANALYSES 40 40 64 15 12
TOC - Total Oraanic Carbon CEC - Cation Exchange Capacity
Will be designated to the laboratory as matrix spikematrix spike duplicate
Additional trip blanks may be needed to ensure one trip blank per cooler
Project 90393 GEI Consultants Inc Page 2 of 2 March 281991
TABLE 3 SEDIMENT ANALYSIS PROGRAM Field Sampling Plan OConnor Company Site Augusta Maine
PH Bench Sample TOC Analytical Scale
Sample Location Number Lead cPAHs PCBs CEC Level IV Sample
Surface Water Body
SED1
SED2
SED3Upland Marsh (UM) SED4
SED5
SED6
SED1
SED2Upper Lagoon (UL)
SED3
SED4
Lower Lagoon (LL) SED1
SED2
SED3
SED7 (trip blank)
SED8Quality Control (dredge
blank)
SED9 (tube
samples blank)
Total Analyses 11 11 16
TOC - Total Organic Carbon CEC - Cation Exchange Capacity
UL SED2 is a replicate sample of UL SED1
Will be designated to the laboratory as matrix spikematrix spike duplicate
Additional trip blanks may be needed to ensure one trip blank per cooler
Project 90393 GEI Consultants Inc March 281991
TABLE 4 - SURFACE WATER ANALYSIS PROGRAM Field Sampling Plan OConnor Co Site Augusta Maine
SAMPLE SAMPLE LOCATION NUMBER Lead Aluminum PCBs
Upland SW1 X X X Marsh (UM) SW2 X X X
Upper SW1 X X X Lagoon (UL) SW2 X X X
SW3 X X X
Lower SW1 X X X Lagoon (LL) SW2 X X X
Quality Control Samples
Trip Blank SW4
Sampler Blank SW5
TOTAL ANALYSES
TSD - Total Suspended Solids
SW2 is a duplicate of SW1
Will be designated to the laboratory as matrix spikematrix spike duplicate
Additional trip blanks may be needed to ensure one trip blank per cooler
Project 90393 GEI Consultants Inc Page 1 of 1 March 28 1991
TABLE 5 - BARN SAMPLING ANALYSIS PROGRAM Field Sampling Plan OConnor Co Site Augusta Maine
SAMPLE MATRIX PCBS CPAHS Lead
Analytical Level IV
Wipe samples PTB (trip blank) PEB (equipment blank)
12 3 3
Wooden wall samples 10 10 10
Dustsoil on floor slab
Concrete slab
Total Analyses 36 18 18
Additional trip blanks may be needed to ensure one trip blank per cooler
One sample will be designated to the laboratory as a matrix spikematrix spike duplicate
Project 90393 GEI Consultants Inc Page 1 of 1 March 281991
TABLE 6 - SOIL SAMPLING EQUIPMENT REQUIREMENTS Field Sampling Plan OConnor Co Site Augusta Maine
Safety Equipment (Level C - Dermal)
Health and Safety Plan (copy) Portable Photoionization Detector (HNu) Hand-held Aerosol Monitor (HAM) Disposable Tyvek Coveralls Tyvek Hoods Duct Tape Safety Goggles Safety Boots Surgical Gloves Butyl Sampling Gloves n gt Rubber Boots or DisposableBooties Hard Hats (when near qverhead objects)
Safety Equipment (Level C - Respiratory)
Sampling and Measuring Equipment
Other
Full-face Respirators Combined Organic Vapor and
High-efficientcy particulate Cartridges Dust Prefilters
Level and Rod Measuring^Tape Stainless -SteeLShovels Stainless Stee^T rowels 165-foot Measuring Tape Methanol V
Distilled Water Paper Towels
SafopltngjSlassware (See Table 10) xCo6lers with Ice or Ice Pack
Clear Plastic Tape Re-sealable Plastic Bags
Gallon Drums
ite Maps Project Log Books Marking Pens Camera Photograph Log Forms Test Pit Log Forms Boring Log Forms Chain-of-Custody Forms Sample Assignment Forms Equipment Calibration Logs Extra Bottle Labels Spare AA Batteries for Meters Blank Federal Express Airbills
Project 90393 GEI Consultants Inc Page 1 of 1 January 171991
TABLE 7 - SEDIMENT SAMPLING EQUIPMENT REQUIREMENTS Field Sampling Plan OConnor Co Site Augusta Maine
Safety Equipment (Level C - Dermal)
Safety Equipment (Level C - Respiratory)
Sampling and Measuring Equipment
Other
GEI Consultants Inc
Health and Safety Plan (copy) Portable Photoionization Detector (HNu) Hand-held Aerosol Monitor (HAM) Disposable Tyvek Coveralls Tyvek Hoods Duct Tape Floatation Vest Inflatable Boat Safety Goggles Safety Boots Surgical Gloves Butyl Sampling Gloves Rubber Boots or Disposable obties Hard Hats (when near overheackobjepts)
V Full-face Respirators Combined Organic Vaporand
High-efficiencyHPartjculate Cartridges Dust Prefilters
Level andRod Measuring Tapp 165-foot MPasuririgTape Methanol V Distilled Water jper tpwels V
SjE(mplinsect~Glassware (See Table 10) Cdolbrs wlthjbe or Ice Pack
Clear Plastic Tape Re-sealable Plastic Bags
-Galloh Drums fghted Measuring Tape e Sediment Sampler dge Sediment Sampler
Site Maps Project Log Books Marking Pens Camera Photograph Log Forms Chain-of-Custody Forms Sample Assignment Forms Equipment Calibration Logs Extra Bottle Labels Spare AA Batteries for Meters Blank Federal Express Airbills
Project 90393 Page 1 of 1 January 17 1991
TABLE 8 - SURFACE WATER SAMPLING EQUIPMENT REQUIREMENTS Field Sampling Plan OConnor Co Site Augusta Maine
Safety Equipment (Level C - Dermal)
Safety Equipment (Level C - Respiratory)
Sampling and Measuring Equipment
Health and Safety Plan (copy) Portable Photoionization Detector (HNu) Hand-held Aerosol Monitor (HAM) Disposable Tyvek Coveralls Floatation Vest Inflatable Boat Tyvek Hoods Duct Tape Safety Goggles Safety Boots Surgical Gloves Butyl Sampling Gloves Rubber Boots or Disposable Booties Hard Hats (when nearOverhead objects)
w Full-face Respirators Combined OrganicVaporand
High-efficiency Particulate Cartridges Dust Pi
Level and Rod
Measuring Tape M3amp-foot Measuring Tape JsopropyhAlcohol Mbthanol DistlHed Water PaperTowels Sampling Glassware (See Table 6)
oolers with Ice or Ice Pack tear Plastic Tape
Re-sealable Plastic Bags 55-Gallon Drums Weighted Measuring Tape Kenmerer Sampler Disposable 045 Micron Field Filters Pressure Pump for Field Filtering pH Meter with Temperature Probe Cole-Parmer pH-40 70 Calibration Solutions Cole-Parmer 1413 Micromhoscm Calibration Solution
Project 90393 GEI Consultants Inc Page 1 of 2 January 171991
TABLE 8 - SURFACE WATER SAMPLING EQUIPMENT REQUIREMENTS Field Sampling Plan OConnor Co Site Augusta Maine
Other Site Maps Project Log Books Marking Pens Camera Photograph Log Forms Chain-of-Custody Forms Sample Assignment Forms Equipment Calibration Logs lt Extra Bottle Labels Spare AA Batteries forM6ters Blank Federal Express Airbills Xy
Project 90393 GEI Consultants Inc Page 2 of 2 January 171991
TABLE 9 - BARN SAMPLING EQUIPMENT REQUIREMENTS Field Sampling Plan OConnor Co Site Augusta Maine
Safety Equipment (Level C - Dermal)
Safety Equipment (Level C - Respiratory)
Sampling and Measuring Equipment
Other
Health and Safety Plan (copy) Portable Photoionization Detector (HNu) Hand-held Aerosol Monitor (HAM) Disposable Tyvek Coveralls Floatation Vest Tyvek Hoods Duct Tape Safety Goggles Safety Boots Surgical Gloves Butyl Sampling Gloves Rubber Boots or Disposable Bboties Hard Hats (when near overheackpbjects)
Full-face Respirators Combined OrganicVapor and
High-efficiencyParticutale Cartridges Dust Prefilters
Gas powered electrfcgenerator 5 gallonsgaspline 350 feetNplectricahextfnsion cord Self-standin^work-larnps (200 watts minimum) Electric 38drilkwith two 1-inch wood boring bits ElectricBoschhammer drillwtungsten-carbidemortar bit Hpound-cut polyethylene sheeting and duct tape
Steel blaRing sheet X^vdiSpdsabfe nylon brushes
Stainless steel trowels Three 100 cm templates andone 25 cm template Forceps Peper towels Silf-sticking adhesive labels and push pins
Site Maps Project Log Books Marking Pens Camera Photograph Log Forms Bam Sampling Forms Chain-of-Custody Forms Sample Assignment Forms Equipment Calibration Logs Extra Bottle Labels Spare AA Batteries for Meters Blank Federal Express Airbills
Project 90393 GEI Consultants Inc Page 1 of 1 January 171991
TABLE 10 - SAMPLE CONTAINERS AND PRESERVATION REQUIREMENTS Field Sampling Plan OConnor Co Site Augusta Maine
Holding Media Parameter Container Preservation Time
PCBs 8 oz glass jar 4deg C 14 days-with Teflon- extraction lined lid 40 days shy
analysis
cPAHs 8 oz glass jar 4deg C 14 days-SOIL with Teflon- extractionSEDIMENT lined lid 40 days shyWOOD
analysisCONCRETE AND WIPE Lead 8 oz glass jar 4deg C 6 months SAMPLES with Teflon-
lined lid
Bench-scale 5 gallon high NA NA testing density
polyethylene bucket
PCBs Two 1-liter 4deg C 7 days shyamber glass extraction bottles 40 days shy
SURFACE analysis WATER
Lead 500mi HN03 4deg C 6 monthsSAMPLES polyethylene to pH bottle lt20
Aluminum 500ml HN03 4deg C 6 months polyethylene to pH bottle lt20
NOTE All standard sample containers will be l-CHEM equivalent bottles supplied by the laboratory The 5-gallon polyethylene bucket will be rinsed with methanol and distilled water prior to use
NA = Not applicable
Project 90393 GEI Consultants Inc March 28 1991
gt 1I L )
i bullbullbull j bullgti sil- j-V
poundP
A C
jfr35
QUAOnANQLE LOCATIONTOOU9 POND MAINEJI881)N4416-W37-307B
bull4000 FEET
Central Maine Power Company Pre-Design Work Plans SITE Augusta Maine OConnor Site LOCATIONFrom EC Jordon Co RIFS
Augusta Maine MAPReport dated June 1989
C D Project 90393 January 1991 Fig 1 G E I C o n s u l t a n t s I n c
b-r
p pp l-I 0 x foooo^ _^_ZZZ~~r^-^
UpoundEtpound 1IMA iRAMWOfMII NOW AM A OAAMAG IWAllrj WWEOfOHAMMS MHICUOn Central Maine Power Company Pre-Design Work Plans LOCAIION Oh
in cuelt^KL2 Augusta Maine OConnor Site TRANSFORMER
Scale 1 inch = 142 feet Augusta Maine WORK AREAS AND SWALESFrom EC Jordon Co RIFS
Report dated June 1989 C D G E I C o n s u l t a n t s I n c Prnjprf QfttM January 1QQ1 Fifl 0
~- bull middot bull -middot r middot~middotmiddotmiddotIll middotmiddot t~r
I bull Imiddot
bull bull1 middotmiddot middotir-------~-------middot ~ bull middot middot-------------------middotmiddot ~ middotmiddotmiddotamiddot A middotimiddot r bull amiddot A I bull TWA I tmiddot LOW AREA A NO~TH) SOUTH) I
v
A middot
rmiddot---middot---middot~middot---- ----middot~middot [WEST) [W[ST) (EASr) middot I
middot middot middotmiddot AmiddotA D-D 220 SCRAP ARf-A 201 -
bull - I
nor 140 TWA I 2bull0
1 bull middotbullmiddot1~-~~ L~W AR1-A ---- middot-~ l0 ~
i r bull I -$-~middot
0 - )1 _~ ~ middot1~oi I EEltY
J I ~2J~ bullbull
bullf()omiddot middotmiddot middot~ bull0 2 i- 0
11bull I lo bull ~middotmiddotmiddot~middot ~ ~--middotmiddot~middotbull ~-8~-i~~jplusmny~f~=ii1 - ~ bull ___ I I- _5 middot~bull-tmiddoti~middot~ N ~ bullbull ~ i I o middot TP19 gt - ~ ~ Jmiddot ~I middot~middot~I bullJUI 215 middot 215~-I e bull TP23 if 21~ ~ middot middot middot_ ------ ~middot - L middot~ ~ ~~ 1 i i
235 middotQ1middot1middotmiddot ~ bullbull ~~middot~middot- Lil middot~ _~ middot f bulllto --- z middotmiddot middot
middotr
-lt lt -middot I ~ middot ~ I
1 c ~ __ ) bull bull bullmiddot bull --middot Q
middot bull bullbull - 1middotmiddot - bullbull ~middots middot- uPPfR 1middotmiddot T LAGOON 1middot middot -$- middot middotmiddotpoundpound~middotmiddotmiddotmiddotmiddot bull =lt middot
~ middot ~~ iP22 gt middotgt
w
210 I
-
------_7___ 210 1 _
w_ +-
middot middot w--~ J210 middot i~30 -- middot_
1 TP18 bull middotmiddotI middot~ ----shy middot-middotmiddot
middot~ I j
middot- t - I 1 I BEDROCK 11 I
1
lmiddotmiddotomiddotmiddotmiddotmiddotmiddot middot middot middot =middot _middotmiddot middotmiddotmiddotmiddot 1 I rI Th 205 bull 205
bull -middotmiddot bull_ 1 225 22 middot bullbullbull fltISmiddot middot middot ~ ~middot f4tmiddotmiddotmiddot I J205 1bull
middot OOTR10U1t0N craquo-middotPC~middot~oN~A~ SEL11r~~~TS H LO~ AR~A ------------------------------------------------bull1 BASEO IN PART ON QBSERVATION Of FILL PlACEMENTmiddot bullmiddot E~middot-1middot bull bullbullbull middotmiddot Q - _
_
-1 I
fmiddot bull bull
-middotmiddot I r-middot shy c bull
I omiddotmiddot
r- middotmiddotI ~I
1 middot1 r bull bullf-Sf1 TWA I middotbull middot ~ i1 bull bull middot (EASfJbullI middot-----bullI (WEST) middotI bull I 1I cmiddot middot~ I~ ~ I bull bullbullbullI 1bullbull
(EAST) - bull middot- - I
bull bull r ~middot l
~
~30 i
2io bull
middot) Ibullbull
I
- J l TPl7 bull- f ~j -middot middotmiddotmiddotmiddot I 1 J middotmiddot1
middot~ ~ bull middotimiddotmiddotch bull bull_ t-ROAOI cli middot bull ~ middot1middot
225
I bull ILmiddot i~A--middot1middot 225 bull
1225 middot I ~ CENTRAL DRAINAGE middotmiddotmiddot--Q-middot --middot _ --middot
~ I -- -shy A middot
bull B-B --- m
- _ - middoti-- 10bull ~ m
g r
220 220 I ~
I middot _
l MI r ~ I
middot middot 1bull bull1 111
I rbull bull
middot
bull bull l
215 BEOROC~ 215
bull I bull middot - -
) l
-middotshy- bull Il
I 5 -middot middot middottc bull bull gt f bull 110 1~ w 210 210 ~ middotmiddotmiddotmiddotmiddot middot-middot -
( bull
middotlt bull [ I
bull G -
-middot-
middot middotmiddot bull ~middot-middot-- -middot- t~middotmiddotmiddotmiddotmiddotmiddot middotmiddot middot L -middot 1 -middot~ bull bull - middotmiddot L middot-~ _ bull f middot middot1 I ~ l
205 bull bull ~middot JO~cmiddotimiddotmiddotmiddotmiddot middot--middotmiddotmiddot1 _~ middotmiddotmiddotmiddotmiddot middotmiddotmiddotmiddotmiddotmiddot bullI bull middot -middotmiddotmiddotmiddotmiddotmiddotg
bull -$-middotmiddotmiddot middot~middot iii~~- ~0 i TB-20 SUBSURFACE BORING NUMBER bull bull bull TPmiddot 105 TEST PIT NUMBER
middot
bull1
bull I TP16 middotmiddotmiddotmiddotmiddot~ Q G) ) mmiddot i GROUND SURFACEmiddot bull 1bull 1middot bull I i ~ u o I bullbullbull I~ bullbullbull bullbullbullbullbullbullbullbullbullbullbullbull bullbullbullbullbullbullbullbullbullbull bull middot bull
ll bull bullbullbull middotmiddotoz bull I 250 CONCENTRATION OF PCBs IN SCREENED SAMPLE lPPm) r lt bull bull I
middot CONCENTRATION CONTOUR middot middot bull - -- CROSS-SECTIONS CONTOURED AT 5ppm 50ppm ANO 500 ppm TOTAL PCBs
middotbull middotmiddot c- I bull ~~ ND NOT DElECTED -middot ~ I
middotmiddot middot--middot~ middot sect t I middot UNDERLINED VALUES ARE CLP RESULTS (ppm)bull
middot -____ bull ~~ - -- I
bull bull middot -middot middot bull Ibullbull middot ~- middot --- LEGEND (ISOPACH MAP) bull lmiddot I l
I
-middot 1 middot I
bull middot ~SUBSURFACE EJORING LOCATION middot
-t middot ( 10766 - 10 10186) middot middot J BORING NUMBER -2 middot THICKNESS OF SOIL CONTAINING PCBs IN EXCESS OF 5 ppm
I
bull ~ middot
LOW AREA BORING LOCTION (107187)
- I j
I
bull BORING LETTER - ~ THlC~NESS OF SOIL C011TAINING PCBs IN EXCESS oF Sppm middot middot middot middottmiddot=plusmn+ TEStPIT LOCATION 1 bull bull bullbullbull i 0~ Q G) I -$ ELECTRICAL EQUIPMENT SAMPLE POINl middot middot -middot bull 1-1 I ~ bull
If bull bull ) bullbull bullbullbullbullbullbullbullbullbullbull f4( middot~01 l - bullmiddotomiddot
middot - ( ~-~ SURFICIAL EXTENT OF SOILS CONTAINING gtSppm PCBs bull middot (
bull __ ~ -middot middot_ middotmiddotmiddotmiddotmiddotmiddotmiddotmiddot _ - middotmiddot --- bull bull -bull - ISOPACH LINE ILLUSTRATING THICKNESS OF SOILS CONTAMINATED BY middot middot middot -middot~middotmiddotbullmiddotmiddotmiddot middotmiddotmiddot bullbull middot middot bull middotmiddot middot 8 -- bull _CONTOURS [)RAWN _-- ~ _l bull abull lO_fEF lran_~OUllCStRF~CI gt~~~~ ~~~~bull
I bull middot T o o bull bull middot middotmiddot
) NOTES 1 -middot -middot bull
I1 THE ISOPACH CONTOURS WEREDRAWN TO DENOTE THE THICKNESS OF SOIL ~ Q iP1 middot 0 bullbull 5 bull GEi BORING LOCATIONS middotMEASURED FROM THE SURFACE CONTAMINATED BY GREATER THAN 5ppm TOTAL PCBs bullbull bull bull I THE VALUE OF 5ppm WAS CHOSEN ARBITRARILY AND IS NOT INTENDED TO REPRESENT
middot bullv middot-- - l A SITE-SPECIFIC CLEAN-UP LEVEJ GEi TEST PIT LOCATIONS
2 CRO~S-SECTIONS ILLUSTRAt EXTENT OF PCB CONTAMINATION WITH DEPTH I middot- -f j bull I
_ veRTt6l1 EXAGGEP1r10M m c~oss sicT1c~S 1s 61 middot
bull
middot
I middotshy1
middot J~uJt bull bull i ~ ~ _ - middot j
1 ~ middot bull bull bull middotmiddot l a )
0 gt bullmiddot -~I middotbull I 0 middot r middot- bull ibull I
bull
_ _ I I ~
middot I
bull bull
bull middot~r
- -middot- - -
bullI l middotI middot I bull r f I I
~_ Igt bull
bull f middot
t bull middot bullbull 8 _
~ 7 I r 9
-middot- bull bull I I ~
middot 1
bull ____________________________ ___ _ bull I
bullI 1 bull middot -~ bullr
---------r- -- -- middot~-~~~~middot--middot ~ f middoti middot
bull t ~
bull
middot j
1
-------- -------- ---------------------------- ti 1
bull ~---middot ------middot ~---middotmiddotmiddotmiddot-middot--middot-middot~---middot-- ___~------- middotmiddotmiddot middot middotrbull ~ ~--~~-~middot-~ 1 middotmiddotmiddot I
middot bull middot4J middotmiddot 1 middot
middotI 1
I
bull
bull
middot ~ middotimiddot 1 bull j-1 ~ bullbull bull I bull i ~
APPROXIMATE SCALE I DESIGNED
~ BY
bullIbull Imiddot bull SOURCEmiddot EC JORDON CO RlFS middot bull Central Maine Power Company Pre-Design Work Plans SOIL I ~ t
middot
middot bullmiddot I ~middotmiddot ( bull bull REPORT DATED JUNE 1989 bullL bullr middotmiddot bull ~I middotmiddot DRAWN BY I I bull 1 r bull ~ middotmiddot middot
bull r shy~middot r i Augusta Maine OConnor Site bull SAMPLING I Imiddot 0 middot bull
bullI
bull bull
r bull 40 80
J 1bullmiddot
CHECKED BY Augusta Maine middotLOCATIONS
h cf I ~ 1bull rmiddot_
1 Inch =~Feet t--~------~---_middotmiddot~ I ~middot bullgtIbull
) i _- DATE January1991 middot middot middotmiddotmiddot tbull middot1middotmiddot APPROVED BY GE I Consultants Inc
middot
middotmiddot middot t---P-R_O_J-EC_T_9_0_39-3-----4-S-H-E-ETmiddotmiddotOfFbull t DATE REVISION BYmiddotmiddot J middotFlg3 middot
1 nuovN( POST middot 1 Nl6~1 middot bullbull Ibull Ibull bull bull lomiddot bullbull -
I
I
I
------------ -
) bull middot i bull I
~ f I middot1 bull ~I r
I
middot
-middot- CJ middotYmiddotmiddot I
C bull
middot
I middot I
middot -shy bull bull middotmiddot~
J middot _ bull y
Ibull bull
~ bull ~~ r I bull middot bull
middot bull
I ~ I I ( I bull
JI t
- I
J l I
-~ 1 I
bull j middot middot~ ~ middot) __-_ bull i
Ibull I lt bull
middotmiddotmiddot
gtImiddotmiddot
I
I bull
middotmiddotmiddotmiddot_v -
~ bull J i 1 bullbull
r 1 I ~ middotbull middotbull
I I I l~_middotgt~~bullI~~~bull~middotmiddot jbull1111 1 bull~ - 1 111 middot~ bull1 middot 1middot I jbull I bullI _- middotmiddot 1 1t1 _ 1 (Imiddot 1 bull1 1gt middot~middotlt~middot middot
I l bull bull 1 r I bull bull middot
bull middot middot middot middot~middot ~middot middot~
- J ~J ~~ O lt hj I bull ~ bull bull 1 o t I lbull I
middotmiddot bull ~ middot I bull middot bull bull
middot bull - I middot ~middot
bull 11 ( _ I
middot I Ii lfI ltI
bull
I 1- bull_ II ~ I middot
I bull vmiddotmiddot
30 I ~middot middot bull bull
lt 1 I ---middot _ bull I ~ bull bull ~ bull
II ~
111
bull bulll3 bull ~ middotmiddot bull Ibull 0 I 1 bull 111 bull bull I rbull1 middot 0 I I I - Ibullmiddot 1 bull r middot middot __ -
i bullmiddot ~ ----middot yen ~ bull ~ j
--~middot
I
I
- -- ( middotmiddot~middotmiddot- - bullbull~ _ ~- I ~ bull--- shymiddot ----bull
1- -
bullbull I I - ~ I I bull middot middot ~ I middot
1
---- _ --
bull1 II I j
I bullbullbullbull
II ~
J 1bull ~
I
bull I I bull I ~ middot Tmiddot I 1 ~ bull JI I t Ibull bull ~ bull middot
I -
-----~_ middot1
-1
~
bullbull
-
bullbull I
middot---- a I AiLWO _ middotshy
I
bull f l
I bullbull - middot I - bullbullbull
SVf1
S~D1- -0 sih3 0
I I 0 1 i ---shy (]
middot bullgt I
I J middot bull bull IIbull Iamp middot P I 177
r o ~ 0 SEol l-middot J~ I - -- ltl
f bull bull
gt1 bullI 1 V bull ~ II ~ tJ middot -middot-
I
middot1 - bull bull bull -middot
bullmiddot -bull wmiddot ~ ~ ~
bull IA1 gtW2 - gt1
- - ~ -
middotmiddotmiddot----- ~r=02 bull bullmiddot I __ i Ctt1rr--shy
bullI
Q bull _
1
D I bullbull middot - bull
SW2
I middot- bull
bullI ~middot
rl
~ se02 I bullbullbull I bullbull ~ L-lf L-- I
- ___ bull bull___ I bullbullbull
I bull ) I f IIUZ middot___ ---- bull cu bull
I gt
bullbull -shyI bull Ii bull f
~ middotmiddot~ ~ middot - I
I bull ~ ) I~ shy bullfmiddot~ ~ i ~ ~middot
~ I 1
bull 4 Ot f I
1 i f ~ bull lt
1
bull bull I
___ - ~)____ - ------~ -------middot-middot-r--middot-middot ----middot- - ---middot-middot-middot-middotbull
t t - -- a
I middot bull -- middot - __ __--~~~=--~---_-~= _ _ middot - I ii- - ~~=-=~==--=~middotmiddot-~=~~~~~~=-~~~======middot=middot~middot== middotmiddot-- _ - I
bull -------------------~_
t ~middot middot middot middotbull bull middot i------------1I Imiddot ~~f~=-~~J~i~~~f~U+--f~~~===~~-~~middot~f~=~=~=~~fi~-~-~==~~-==~==~~==~====~==~-=-==~=~=2~~~~~~~77=~=~=~~-=~s)middot==~~~--=-=~~~=~=~====-=====~~=~~~~~=~=~=~==~==-=~=~=middot
middot 7gt JloltGKLA lllD --- shy l lf-nt RT n bull middotl bull
I
-i~------ - -- -------- -- --= bull (
( ei -~ ---- -------- - - - - - bull - shyI bull middot 1 ------
--------~____-____ bull SSmiddotsmiddot~middot2-iJi_8plusmn~plusmn-~~plusmn=+=~==-=-==~~===~~~~~~=-=s~~2~-~s-==~~~z--==~=~~t-=-=-=-==-=---~34~~~-==-=-==-==~=middot==---~=-middot~i~middotmiddot~ middot)~ f ________bull _
~--- __ - ____ - bull shyI I
bull __ _ ~ ~ ~ middott1 middot_
J(J--_ 11bull middot ------deg gt
middot -f ~~~se~middot~ARm~OMAarra~PERfOAMagtBY 0 middot~ bullO ( l r
r-------------liDElmiNEiiiiY-r---Amiddot----------________---~-------------_____ __________middotmiddot_lIbull middotmiddotmiddot ACHERON ENOINEERINCI 8ERVJCED COMPLIED IU8lo BASll MAP
(middot VERIFIED TO MEET NATIONAL MAP ACCUAACI 8TANOARD8(NMJ) middot Tl1ROUQltATEaT GURVltY CONOUCIED Df JORDM 121aa LEG~ APPROXJMATESCALE DESIGNED BY
-----------_ ---------~ CentralMalnePowerCompany p D W kPI middotSURFACEWATERANDmiddotmiddot_-~middotmiddot~~~middotFitow~middot~(TOO~MEETNMAamp DRAwN BY re- es1gn or ans middot middot middot shy bull bull bull - bull
bull Aug~sta Maine OConnor Sitamiddot SEDIMENT SAMPLING middot3middot~~~middot~--~~amCla~~~~~~usa-o middot O GEISEDIMEITTSAMPUN~LOCATI~Ns o 40 middot 80 1
BY LOCATIONS ~middot)~middot ~ bull 11i GEISURFACEWATERSAMPUNGLOCATIONS middot CHECKE
rh A~gustaMalne lt middotmiddot( middotmiddot 11nch-40Feet DATEmiddot January 1991
middot APPRovED BY -V GEi Consultants Inc ~ Imiddotgtmiddotgt middotmiddot middot middot souRCE EC JORDON co RlFS bull middot GEi COMPOSITE SEDIMENT SAMPLE bull DATE REVISION BY - PROJECT 90393 SHEET OF middotI middotmiddot middotI middotAEPORTDATEDJUNE1989 v COUECTEDFORBENCH-SCAIETESTING
I J ~ I
i I bull I )__ )
I I ilo I Ibull
X -4 mdashmdash-0shy
W A Elec-Zl lt4W
Meters Shelves ^ Pickup
A CapAntique a)
W WAutomobile W J
ia iW Y
W A o
LEGEND C w
Stove - wBoat X Designated Wall Label w
-e- -fr bulleshybull Cement SlabDust Sample
0 Wooden Wall Sample ZTaping Reference Origin
W Wipe Sample
Approximate Scale
NOTES 30 Feet
1 Ail locations on this plan are approximate
2 Sample locations are general Central Maine Power Company Pre-Design Work Hans EXAMPLE examples of the type of sampling Augusta Maine OConnor Site BARN SAMPLINGand the distribution Augusta Maine LOCATIONS
3 Revision No 1 (3-28-91) ltP G E I C o n s u l t a n t s I n c Project 90393336 January 1990 Fig 5
I I I I
I
I I
I
I
I
I
I
Document VoL II SC SAP Appendix A Revision 0
Date January 171991 Page 1
V
APPENDIX A zgt
s HEALTH AND SAFETY-PLAN
Source Control PrampDesign Studies CConnorCO^Site
Augusta Mkine shy_ lt
lt
NT lt
Document Vol II SC SAP Appendix A Revision 0
Date January 171991 Page 2
GEI CONSULTANTS INC SITE HEALTH AND SAFETY PLAN
Site Name OConnor Co Site
Site address Street Route 17 Qty Augusta State Maine
Proposed Site Activities Source Controlsampling of surface andsubsurface soilssediments surface water and the on-site barn
Proposed Date of Work April 1991 gt S
Original Safety Plan YES
Site Safety Coordinator Thomas S Bobowski
Client Central Maine Power Company^(CMP)
Site Contact Charles Nickerson (CMP)
Team PERSONNEL ^ IRESPONSIBILITIES Robert E Stetkar lt ^mjectManager Joanne O Morin Work Tlans and Pre-Design Studies Manager Richard F Murdock Qhality Assurance Officer Benjamin YSu Treatability Studies Manager Joseph G Engels Technical Consultant Steven R fcambx Source Control Sampling Task Manager Thomas S Bobowski7 Barn Sampling Coordinator Sampling Boyd P Smith Sampling Christopher L Covel Sampling William J Haswell Sampling Charles Blodgett Field Screening Analytical
Background Information
The OConnor Co Site (Site) covers approximately a 9-acre portion of a 65-acre parcel within the city limits of Augusta Maine The Site is surrounded by sparsely-developed residential or agricultural properties or undeveloped woods and wetlands (Riggs Brook and associated wetlands border the Site to the east) The F OConnor Co operated a transformer stripping and recycling operation on theSite from the1950s through the 1970s
Document VoL II SC SAP Appendix A Revision 0
Date January 171991 Page 3
During operations releases of wastes including PCB-laden oils resulted in contamination of water and soil on the site Principal features of the Site include a barn which formerly housed scrap operations an upland marsh formed by man-made disruption of natural surface water drainage upper and lower surfacewater impoundments (lagoons) constructed to control migration of oils from the Site a low area where excavated lagoon sediments were deposited within a clay liner three former transformer work areas a former scrap yard and a wetland associated with Riggs Brook A site plan depicting some of the major features of the site is shown in Figure HS-1
Ax In 1986 and 1987 remedial investigations were performed byECvJdrdan Co for Central Maine Power Company (CMP) These investigations included over^OQ soil samples 11 monitoring wells and analysesof surface water ground water sediment and biota for PCBs organic and inorganic chemicals The primary contaminantsdetected in soil and sediments at the Site were PCBs PAHs and Lead Chlorinated benzenes PCBs phthalates and to a lesser extent volatile organics and metals were detected in ground water and PCBs and metals were detected in surface water Using these data Clement AssociatesInc performed an Endangerment Assessment in 1988 for EPA^evaluating risks to human health and the environment associated with existing condiuoi^ra^Tuture conditions related to a noshyaction remedial alternative In 1989 EC JordabCoi acting as consultant to CMP completed a Feasibility Study which evaluated remedial alternatives based on information provided in their earlier Remedial Investigation Report and in the EPA Risk Assessment Report After receipt of the Feasibility^Stiidy Report EPA issued a Record of Decision (ROD) in September 1989 describihg the^EPA^elected remedial alternatives for source control and management of migration
Site Status Waste Types
Includes the followin
Ground water Surface water Sediment Soils On-site structures
Refer to Table1for listing of chemicals of concern during Source Control studies per media sampled
Document VoL H SC SAP Appendix A Revision 0
Date January 171991 Page 4
Hazard Evaluation
Known orSuspected HazardousToxicMaterials Polychlorinated biphenyls (PCBs)volatile organic compounds (VOCs) polycyclic aromatic hydrocarbons (PAHs) and metals (especially Lead) The ranges of concentrations of chemicals detected in all source control media on-site are presented in the attached Tables 1C through 1L from previous studies Concentrations of PCBs PAHs and Lead detected in surficial soikduring previous studies (including the on-site Barn) are shown in Figures HS-2 HS^3 and HS-4 respectively Concentrations of chemicals detected in surface water and sediihentsduring previousstudies are shown in Figure HS-5 lt( x
The primary concern at the Site is contamination of surface soils by spillage or leakage of transformer oils containing PCBs The potential forencountering concentrated wastes in the transformer work areas (TWA I TWA II andltTWAIlI) is high In addition wastes have also been identified in soils and sediments associatedwith the lagoons and drainage swales Within a short distance of these discrete areas of the site the potential for encountering significant concentrations of wastes-is low ToYeduce the likelihood of being exposed by wastes associated with these areasduring~source control sampling activities efforts should be made to avoid walking unnecessgrilyriiv these areas
Exposure to hazards from chemiealsduiing test plying and environmental sampling and analysis tasks are most likely to occurbyone-or more of the following
1 Direct contact with contaminated surficial and subsurface soils sediments or surface-water x N
mdashN2 Inhalation of fu^Uve^ust carrying contaminants
3 Inhalation of volatile orgsuuc compound vapors while test pitting or sampling the various media on-site
Toxic and Pharmacological Effects Refer to the NIOSH Guide to Chemical Hazard Table 2 lists the major chemicals of concern and their toxic and pharmacological effects Acute exposure to PCBs PAHs Lead and VOCs may result in dizziness or nausea The results of chronic exposure may include but are not limited to central nervous system depression liver and kidney damage and irritation of skin eyes and respiratory passages Many PCBs PAHs and VOCs are known or suspected carcinogens Routes of exposure include inhalation topical and ingestion
Document Vol II SC SAP Appendix A Revision 1
Date March 28 1991 Page 5
Heat-related illnesses range from heat fatigue to heat stroke the latter being the most serious Heat stroke requires prompt treatment to prevent irreversible damage to health Protective clothing may have to be cut off Less serious forms of heat stress require prompt attention to prevent further complications which may lead to heat stroke Unless the victim is obviously contaminated decontamination procedures should be omitted or minimized so that treatment may begin immediately
Hypothermia may result from personnel exposed to excessive cold during sampling operations Hypothermia requires prompt treatment to prevent serious damage to health Damp or wet clothing may have to be cut off and the persons body temperature must be elevated as soon as possible through the use of warm blankets or another persons body warmth Unless the victim is obviously contaminated decontamination procedures should be omitted or minimized so that treatment may begin immediately
Area Within Augusta Maine city limits
Proposed On-Site Activities Test pitting boring or hand augering for collection of surface and subsurface soil samples collection of sediment and surface water samples from an inflatable boat or from wading into the water with hip-boots and collection of samples from within the on-site Barn Potential physical safety hazards during each of the four proposed Source Control site activities are discussed per activity below
Test Pitting and Borings for Surface and Subsurface Soil Samples A backhoe will be used during test pitting operations to excavate soil for collection of samples The most significant hazard during this sampling effort is the potential for collapse of the excavation while sampling Therefore in accordance with OSHA and 29CFR1926 Subpart P if personnel are required to enter an excavation the excavation will be no deeper than 5 feet unless it is braced or sloped back For the Type A soils documented on-site (eg clay and glacial till) the required slope from the ground surface to the top of unbraced portion of the excavation in all directions is 05 HORIZONTAL 1 VERTICAL Short-term excavations of this type will not exceed 12 feet in depth In general a drilling rig will likely be used to obtain samples from depths below 5 feet by augering to a specified depth and using a split-spoon sampler
Document Vol H SC SAP Appendix A Revision 1
Date March 28 1991 Page 6
Other physical hazards during test pitting and boring operations include the presence of overhead objects (eg backhoe bucket) so hard hats must be worn during these tasks at all times In addition the potential for spreading contamination with fugitive dust during excavation and mobilization between sampling locations is much greater than during other Source Control sampling efforts Therefore Level C dermal and respiratory equipment must be worn during all test pitting and boring operations (see below) Additional decontamination procedures will be required between sampling areas to limit the potential for cross-contamination (see below)
Sediment and Surface Water Sampling These operations will be conducted using Level C dermal protection only The need for respiratory protection will be based on criteria discussed in the next section In order to collect sediment and surface water samples in interior portions of the Upland Marsh and Upper and Lower Lagoons an inflatable boat or hip-boots will be used Further sampling will be performed by walking along the shores of the surface water bodies while dragging a sediment sampler These operations involve the risk of falling in relatively deep water while equipped with Level C dermal protection This equipment may limit movement and may inhibit a person from swimming easily to safety Therefore while sampling with the boat a Coast Guard Approved life vest will be worn at all times In addition one person will standby on-shore to observe the boat operation and to assist in the event of a mishap Depending on the water and air temperature at the time of sampling it is possible that a person who had fallen in water may require treatment for hypothermia or shock
Barn Sampling The barn can be classified as a confined work space since it is fully enclosed and has a limited number of exits In order to operate safely in a confined work space special considerations are necessary Unlike some confined spaces the barn has numerous small openings in the wooden structure to allow for an adequate supply of air while collecting samples However the sampling effort will likely generate a significant amount of airborne dust within the barn which means that Level C dermal and respiratory protection must be worn at all times while in the barn One person will remain outside the barn during the sampling effort to observe the sampling personnel and to provide backup services Two Combination Type A-B-C fire extinguishers capable of extinguishing wood and paper flammable liquidis or electrical fires will be available (one inside and one outside the barn with the standby person) in the unlikely event of a fire occurring during sampling
Document VoL H SC SAP Appendix A Revision 0
Date January 171991 Page 7
In accordance with OSHA 29CFR1910120 a minimum lighting intensity of 5 foot
candles will be provided within the barn during sampling The creation of dust and the
low lighting which may be available in some areas of the barn is likely to limit vision
some of the time Special care must be taken to avoid tripping over the numerous
objects disposed of within the barn No electricity is available in the barn so power
will come from outside the barn to supply power for lighting and tools to be used in
the sampling effort This means that electrical extension cords will be laid out on the
floor to various sampling locations In addition a large amount of metal and wooden
debris exists within die barn which may become obstacles to free movement in certain
areas The wooden floors of the second story and loft ofxthe^arn are extremely
deteriorated in some places and should not be accessed unless authorized by the Site
Safety Coordinator v
The use of electric power tools to collect samples ^wobd boring and concrete drills) require special care The use of Level C dermal protection such as loose fitting gloves may make handling the drills more difficult Use speciaLcare to avoid contacting the moving bits of the drills while in operation tonvoid tearing tyveks or gloves If dermal protection is torn replace or patch it immediatelybefare proceeding with the sampling operation
Perimeter Establishment
MapSketch Attached See bdquo Perimeter Identified Access to site is restricted at all entry points via a locked
8-foot high cyclone fence^- x y
Zone(S) of contamination identified See Figure HS-1 through HS-5
Document Vol II SC SAP Appendix A Revision 1
Date March 28 1991 Page 8
Recommended Level(s) of Protection On-site personnel will use Level C dermal protection at all times See below for respiratory use
1 Protective Clothing
Sampling and decontamination personnel in these areas will wear
bull Disposable Tyvek coveralls over cotton coveralls bull Tyvek hoods bull Safety glasses or face shield bull Hard Hat bull Disposable booties over workbooks or waders for sampling surface water and
sediments bull Butyl rubber gloves over surgical gloves bull All gloves and booties will be taped to the Tyvek coveralls
2 Respiratory Protection
Air purifying respirators will be worn at all times while sampling during test pitting and boring operations and while inside the barn Otherwise the need for respiratory protection will be determined by on-site monitoring for organic vapors and the daily potential for exposure to airborne particulates The decision to utilize air-purifying respirators due to airborne particulates will be made by monitoring with a MIE MINIRAM Hand-held Aerosol Monitor (HAM) Based on previous studies (Endangerment Assessment Appendix F) an action level for worker safety of 10 mgm3 of respirable dust was established for the site Therefore when readings on the MINIRAM of 10 mgm3or greater are experienced Level C respirators will be worn Initial on-site monitoring for organic vapors will be conducted using an HNu Photoionization Detector (PID) Ambient vapor levels of 5 to 10 ppm above background in the breathing space will require the use of full-face cartridge respirators (Level C Protection) Background levels will be determined at the edge of the Site (ie fence line) before the initiation of the days activities Air quality will be monitored at the upwind boundary of the site at three locationsfor a duration of one minute at each location The maximum PID reading at each location will be recorded and the three readings will be averaged to determine the background level for that day Respiratory protection will be full-face respirators fitted with combined organic vapor and high-efficiency particulate cartridges (MSA Type GMA-F) Respirator cartridges will be replaced at a minimum on a daily basis Depending on readings obtained with the MINIRAM cartridges may be replaced at mid-day on windy days
Levels of organic vapors greater than 10 ppm above background in working areas will necessitate utilization of self-contained breathing apparatus (Level B Protection) During sampling HNu monitoring should be utilized to detect any changes in organic vapor levels Changes in fugitive dust or vapor level detection at any time may warrant appropriate alteration of required respiratory protection
Document VoL H SC SAP Appendix A Revision 0
Date January 171991 Page 9
Decontamination and Disposal
A decontamination areawill be assembled at the entrance to the site The decontamination zones will be established such that personnel and equipment are fully decontaminated prior to leaving the fenced area In addition all personnel will be familiar with proper decontamination procedures prior to going on site All personnel entering and exiting the hot zone shall pass through the decontamination zone
1 Personnel Decontamination
The personnel decontamination sequence is as follows
a Samples and equipment are dropped on plastic sheets
b Disposable booties Tyvek coveralls and contaminated outer gloves are first brushed off with soapy water then rinsed with clean water by decontamination personnel Thedisposable equipmenfis^then removed baggedand placed in a 55shygallon drum marked Dry Deconv
c Neoprene boots and outer gloves are washed if they were not drummed in Step b with soapy water and ririseck with clean water An additional rinse with methanol followed by a firiak water-rinse completes the sequence
lt d Neoprene boots and glovesare -removed
e Respirators (cartridge-change) are removed if necessary and disposed in the Dry Decon drum
f Surgical gloves are temovfedand disposed in the Diy Decon drum
Document Vol M SC SAP Appendix A Revision 0
Date January 17 1991 Page 10
2 Equipment Decontamination
The equipment decontamination procedure for Source Control sampling work performed inside the fenced area of the site is as follows
a All disposable items (eg surgical gloves plastic sheeting nylon brushes etc) will be discarded in the Dry Decon drum
b Heavy equipment such as the backhoe and drilling jig will be steam-cleaned on a specially constructed decontamination pad located east bfthermain site access gate and north of the ground water monitoring well couplet MW1Q2A and MW102B (see Figure HS-7) The pad will be constructed to allow for drainage of steam-cleaning solutions onto a bermed multi-layer -impermeable barrier consisting of several layers of at least 6-mil-thick polyethylene sheeting overlain and underlain by geotextile fabric The geotextile fabricwilfbe designed to collect contaminated sediments which may have collected on tires or excavating equipment Rinse water from the decontamination processwill then fre pumped through hoses or channelled for drainage into the Uppei^La^oomafter completion of surface water and sediment sampling The decontamination pad will be left in place after completion of field sampling
c All other equipment contacting surface or subsurface soils sediments surface water or materials within thebarm(egtrowels spatulas templates drill bits etc) will be decontaminated by rinsing with clean water scrubbing with methanol and re-rinsing with distilledwater Solutions which contain methanol will be collected for disposal into tHeJWet Decon drum Equipment used during barn sampling will then be drted^with paper towels and the towels will be disposed in the Dry Decon drum ^
3 Decontamination Station Closure
The procedure for decontamination station closure will be as follows
a Decontamination personnel shall be responsible for closing the station at the end of each workday
b All solid wastes such as plastic tarps bags and Tyveks will be placed in the Dry Decon drum and will be closed at die end of each workday
Document Vol IISC SAP Appendix A Revision 0
Date January 171991 Page 11
All spent decontamination solutions containing methanol will bedisposed of in the Wet Decon drum Decontamination solutions which are not composed of methanol and exhibiting PID readings below 1 ppm will be poured into surficial soils on the edge of TWA I within the fenced area of the site If PID readings are greater than 1 ppm the solutions will be disposed in the Wet Decon drum These drums will be closed at the end of each workday
d Drums shall be secured on-site until proper disposal is arranged after consultation with EPA
7 Air Monitoring Procedures X
Site Monitoring Equipment PID HNu PI-101 HAM MIE MINIRAM
Since Level C respirators will be used during test pitting and barn sampling air at the test pit and barn sampling areas will be monitoredfegularly with a PID and HAM primarily for future reference of the levels of VOCs and dustto^be expected during remedial activities During the other sampling efforts air monitoring wiH form the basis for whether an upgrade to Level C respiratory equipment is necessary TheltPID will be used regularly during soil sediment and surface water sampling^ TKampHAM will be used at least twice per hour while on-site to monitor for dust levels in air^Whenunusually windy conditions are experienced additional monitoring for dust levels wilLbe^erfbrmed When ambient temperatures in air are below 32deg F the chart recorderattachment for the MINIRAM must be used as the LED readout on the instrument may not operate below freezing All PID and HAM readings will be recorded in theJield Log Book
Document VoL H SC SAP Appendix A Revision 0
Date January 171991 Page 12
Emergency Information
Location Phone
FIRE Augusta (207) 623-2511
POLICE Augusta (207) 623-2511 State Police (Augusta) (207) 621-1200
AMBULANCE Augusta (207) 623-25tlx N
HOSPITAL Kennebec Valley Medical Center (207) 626-1000 Augusta Division N 6 East Chestnut Augusta ME
Chemical Trauma Capability Yes
EPA (Michael Jasinski) 7) 573-5786
DEP (Thomas Benn) (207) 289-2651
CMP (Charles Nickerson) (207) 623-3521
Directions to Hospital (See Fig HS-6)
Primary route to hospital is west on Route17 (Eastern Avenue) to Arsenal Avenue turn right on Arsenal Avenue and go3 blocks to E Chestnut street then right Emergency room entrance is 6 East Chestnut Street Alternate route - west on Route 17 (100 yards) to Cony Road turn right on Cony Road take^rst left (Cony Street Ext) to Riverside Drive go left on Riverside Drive the second mtejsection will be Arsenal Street goleft on Arsenal Street East Chestnut Street will be second left
Document VoL H SC SAP Appendix A Revision 0
Date January 171991 Page 13
Additional Emergency Contacts
DR DAVID EGILMAN (617) 935-8581 HEALTH RESOURCES WOBURN MASSACHUSETTS
GEI CONSULTANTS INC
ROBERT E STETKAR (603) 224-7979 JOSEPH G ENGELS (617)721^4022 s
TSCA HOTLINE (800)424-9065
AT amp F (EXPLOSIVES INFO) (800^424-9555 V
NATIONAL RESPONSE CENTER x(8W) 424-8802
PESTICIDE INFORMATION SERVICE (800)845-7633
RCRA HOTLINE y -(800) 424-9346
CMA CHEMICAL REFERRAL CENTER (800) 262-8200V NATIONAL POISON CONTROL CENTER (800) 942-5969-y
US DOT bdquo (202) 366-0656
GEI CONSULTANTS ^ (603) 224-7979
Prepared by Thomas S Bobowski Date January 7 1991
Reviewed by Robert E Stetkar Date January 9 1991
All personnel working at this site have received OSHA required health and safety training Personnel are enrolled in a medical monitoring program A summary of training completed for all GEI personnel involved in the Source Control sampling program is provided in Table 3
Use of Common Sense is Required
I have read and understand this safety plan
Name (printed) Signature Date
Table 1A Organic and Inorganic Chemicals Detected in the Shallow Aquifer
Groundwater Samples at the F OConnor Site Maximum
Concentration Geometric Background
Range Mean[a] Concentration (ugL)
Chemical Frequency (ugL) (ugL)
ND(b]-2300B[c] 150 NDAcetone 211 ND-15J[d] NA[e] NDBenzene 211 ND-45 143 ND2-Butanone 17 ND-83 53 NDChlorobenzene 311 ND-53 NA NDToluene 27 ND-12J NA NDTriehloroethene 1P ND-11 81 NDBis(2-Ethylhexyl)Phthalate 411 ND-25 1deglaquo2 ND12-Dichlorobenzene 411 ND-14J 97 ND13-Dichlorobenzene 311 ND-13J 96 ND14-Dichlorobenzene 311 ND-29 94 ND124-Trichlorobenzene 17 ND-19 07 NDTotal PCBs 111 27-5085 06 49Aluminum 55 27-805 24 42Barium 55 13700-125451 38300 26600Calcium 55 ND-145 53 NDChromium 25 ND-37 NA NDCobalt 15 ND-285 66 14Copper 35 33-4952J 590 3Iron 55 ND-18 37 NDLead 15 21-2906 260 24Manganese 55 ND-154 10 NDNickel 15 ND-17 37 NDSilver 15 10593-72812 33400 14000Sodium 55 ND-71 71 NDVanadium 15 17-946 263 91Zinc 55
a) Calculated using detected concentrations and one-half of EPAs contract laboratory program (CLP) detection limits for the organics For the inorganic
chemicals the aqueous CLP detection limits were used
b) ND - Not Detected
c) B designates Chat substance was also found in the blank though the
sample level was significantly higher to prove a positive detect
d) J designates estimated value
e) NA - Not applicable Chemical was detected infrequently and the use of
one-half of the detection limit in calculating a mean results in a mean
concentration that exceeds the maximum Therefore a mean is not used
SourceEndangerment Assessment dated Jan 29 1988 by CDM
Table IB Organic and Inorganic Chemicals Detected in Bedrock Aquifer
Groundwater Samples at the F OConnor Site
Mean Concentration Geometric Background
Chemical Frequency Range (ugL)
Mean[a] (ugL)
Concentration (ugL)
Acetone 220 ND[b]-1200 68 ND Benzene 220 ND-27J[c] NA(d] ND Chloroblt ene 620 ND-16 36 ND Toluene 215 ND-27J NA ND Bis(2-E vlhexyl)Phthalate 1320 ND-64 Hi 61 12-Dich 13-Dic^
irobenzene jrobenzene
720 120
ND-26 ND-24J NA
66 ND ND
14-Dic^ robenzene 620 ND-44 82 ND Di-n-Bu phthalate 120 ND-22J NA ND 124-Tr hlorooenzene 720 ND-310 161 ND N-Nitros iiphenvlamine 25 ND-4J NA ND 3eta-BHC 110 ND-04 004 ND Gamma-BH (Lindane) 110 ND-006 003 ND Total PC 320 ND-50 LO ND Antimony 110 ND-55 19 ND Barium 1010 15-129 138 56 Chromium 410 ND-268 54 ND Cobalt 110 ND-115 92 ND Iron 1010 61-384301 837 152 Magnesiu Manganes
1010 810
5960-46250 ND-5895
15220 661
4203
27 Nickel 310 ND-345 125 ND Potassiu 1010 3504-16046 6560 4340 Vanadium 110 ND-52 NA ND
a) Calcul ted using detected concentrations and one-half of EPAs contract labor 3ry program (CLP) detection limits for the organics For the inorganic chemic Is the aqueous CLP detection limits were used
b) ND mdash F detected
c) J de Ignates estimated value
d) NA - N applicable Chemical was detected infrequently and the use of one-ha of the detection limit in calculating a mean-results in a mean concern ation that exceeds the maximum Therefore a mean is not used
Source Endangerment Assessment dated Jan 29 1988 by COM
Table 1C Organic and Inorganic Chemicals Detected in In-Fence Surface Soil
Samples at the F OConnor Site Mean
Concentration Geometric Background Range Mean[a] Concentration
Chemical Frequency (ugAg) (ugkg) (ugAg)
19 ND[b]-19J[c] NA[d] ND Chicroform ND29 ND-150B[e] 63Methylene Chloride
ND19 ND-30J NAToluene 260J19 ND-917J 260Bis(2-Ethylhexyl)Phrhalate
Carcinogenic PAHs ND19 ND-2700J 290BenzoltAgtAnthracene ND29 ND-12000J ^10BenzoltB or KgtFluoranthene ND39 ND-11000J 540Chrysene ND39 ND-23183Total CPAHs
Non-carcinogenic PAHs ND39 ND-12000J 540Pvrene ND39 ND-12000 540Total NCPAHs ND118186 ND-6205600 3400 Total PCBs 4001419 ND-64000 1900Cadmium 292001919 17000-29480000 275000
Copper 570001919 29000-2681000 213000Lead 252001919 19000-90000 35000Nickel ND219 ND-12000 650Silver 738001919 45000-1160000 183000Zinc
aj Calculated using detected concentrations and one-half of EPAs contract UboSto program (CLP) detection Unite for the organic For the inorgar-c chemicals the detection limits for soils were based on aqueous CLP
detection limit
b) ND - Not Detected
c) J designates estimated value
d) NA - Not applicable Chemical was detected infrequently and the use of one-half of the detection limit in calculating a mean results in a mean concentration that exceeds the maximum Therefore a mean is not used
e) B designates that substance was also found inthe blank though the sample level was significantly higher to prove a positive detect
Source Endangerment Assessment dated Jan 29 1988 by Clement Associates Inc
Table ID
Organic and Inorganic Chemicals Detected in the TVA III Surface Soil Samples at the F OConnor Site
Concentration Geometric Background Range Meanfa] Concentration
Chemical Frequency (ugAg) (ugAg) (ugAg)
44-DDT 13 ND[b]-5200 150 ND 44-DDE 13 ND-260 56 ND Total PCBs 2131 ND-620000 2940 ND
Antimony 11 189000 41000
Cadmium 11 11000 400 Copper 11 230000 29200 Iron 11 60900000 22200000 Lead 11 634000 57000 Zinc 11 799000 73800
a) Calculated using detected concentrations and one-half of
ErAs contract laboratory program (CLP) detection limits
b) ND - Not Detected
Source Endangerment Assessment dated Jan 29 1988 by Clement Associates Inc
Table IE irganic Chemicals Detected in Upland Marsh Sediment
Samples at the F OConnor Site[a] Maximum
Concentration Geometric Background Range Mean[b] Concentration
Che ical Frequency (ugAg) (ugAg) (ugAg)
To ane 11 23J[c] - ND[d] To- 1 PCBs 33 1300-34000 6425 ND
a) norganic chemicals were also analyzed for but none were itected significantly above background concentration
b) alculated using detected concentrations and one-half of PAs contract laboratory program (CLP) detection limits
c) J designates estimated value
d) D - Not Detected
Source Endangerment Assessment dated Jan 29 1988 by Clement Associates Inc
Chemical
Acetone 11 408B[c] ND[d]
Bis(2-EthyIhexy1)Phthalate 11 2082 ND
Toluene 11 28J[e](f] ND
Total PCBs 44 30000-1100000 381000 ND
a) Inorganic chemicals were also analyzed for but none were detected
significantly above background concentration
b) Calculated using detected concentrations and one-half of EPAs contract
laboratory program (CLP) detection limits
c) B designates that substance was also found in the blank though the sample
level was significantly higher to prove a positive detect
d) ND - Not Detected
e) J designates estimated value
f) In a duplicate sample toluene was not detected A geometric mean of the detected value and one-half of the detection limit would have resulted
in a mean concentration exceeding the detected value Therefore only
the detected value is listed
Source Endangerment Assessment dated Jan 29 1988 by Clement Associates Inc
Table 1G Organic and Inorganic Chemicals Detected in Lower Lagoon Sediment
Samples at the F OConnor Site Maximum
Concentration Geometric Background Range Mean(a] Concentration
Chemical Frequency (ugAg) (ugAg) (ugAg)
Bis(2-Ethylhexyl)Phthalate 12 ND[b]-100J[c] NA[d] ND
Benzoic Acid 22 120J-190J 150 ND Total PCBs 77 3202-40100 8660 ND
Cadmium 12 ND-2500 790 ND c 22 27000-59000 40000 20000
Lead 22 17000-70000 34500 ND
Manganese 22 525000-982000 718000 474000
Selenium 12 ND-760 436 ND Zinc 22 103000-249000 160000 108000
a)Calculated using detected concentrations and one-half of EPAs contract laboratory program (CLP) detection limits for the organic For the inorgan chemicals the detection limits for sediments were based on the aqueous CLP
detection limit
b) ND - Not Detected
c) J designates estimated value
d) NA - Not Applicable Chemical was detected infrequently and the use of
one-half of the detection limit in calculating a mean results in a mean
concentration that exceeds the maximum Therefore a mean is not used
Source Endangerment Assessment dated Jan 29 1988 by Clement Associates Inc
Table 1H Organic and Inorganic Chemicals Detected in Riggs Brook Sediment
Samples at the F OConnor Site Maximum
Concentration Geometric Background
Range Mean[a] Concentration
Frequency (ugAg) (ugkg) (ugAg)Chemical
12 ND[b]-30 12 NDMethylene Chloride
Carcinogenic PAHs 22 160J[c]-790 360 230JBenzoltAgtAnthracene 22 220J-800 420 290JBenzoltAgtPyrene 22 2-63J-1600 650 710J3enzoltB or KgtFluoranthene 22 280J-960 520 400J
Chrysene 12 ND-190J NA[d] NDDibenzltAHgtAnthraeene 12 ND-400J 340 NDIndenoCl23-CDgtPyrene 22 1507-4740 2670 2402Total CPAHs
Non-carcinogenic PAHs 12 ND-110J NA NDAcenapthy1ene 12 ND-200J NA NDAnthracene 12 ND-410J 350 ND
BenzoltGHIgtPerylene 22 280J-1200 580 420J
Fluoranthene 12 ND-80J NA NDFluorene 22 72J-680 220 150J
Phenanthrene 22 290J-1500 660 470J
Pyrene 22 1810-4180 2750 2584Total NCPAHs 615 ND-6481 870 NDTotal PCBs 12 ND-1200 775 NDSilver
a) Calculated using detected concentrations and one-half of EPAs contract laboratory program (CLP) detection limits for the organics For the degrgan chemicals the detection limits for sediments were based on the aqueous CLP
detection limits
b) ND - Not detected
c) J designates estimated value
d) NA - Not applicable Chemical was detected infrequently and the use of one-half of the detection limit in calculating a mean results in a mean
concentration that exceeds the maximum Therefore a mean is not used
Source Endangerment Assessment dated Jan 29 1988 by Clement Associates Inc
Table II Inorganic Chemicals Detected in Upland Marsh Surface
Water Samples at the F OConnor Site[a]
Sample Background
Concentration Concentration
Chemical Frequency (ugL) (ugL)
Aluminum 11 884 104 Arsenic 11 35 ND(10)[b]
Barium 11 12 47 Iron 11 3540 1160 Lead 11 36 ND(5)
Manganese 11 ^29 134 Potassium 11 7260 3610
a) Organic chemicals were also analyzed for but
none were detected
b) ND - Not Detected Limits of detection are
given in parentheses
Table 1J Organic and Inorganic Chemicals Detected in Upper Lagoon
Surface Water Samples at the F OConnor Site
Sample Background
Concentration Concentration
Chemical Frequency (ugL) (ugL)
108 ND(10)[a]Total PCBs 11 47Barium 11 23
6 ND(5)Lead 11 Manganese 11 1450 134
25 ND(40)Nickel 11
a) ND - Not Detected Limits of detection are given in
parentheses
Source Endangerment Assessment dated Jan 29 1988 by Clement Associates Inc
Table IK Organic and Inorganic Chemicals Detected in Lover Lagoon
Surface Water Samples at the F OConnor Site Maximum
Concentration Geometric Background Range Mean[a] Concentration
Chemical Frequency (ugL) (ugL) (ugL)
Total PCBs 22 13-375 221 ND[b] Aluminum 22 56-3740 458 104
Arsenic 12 ND-4 NA[c] ND
Barium 22 12-37 67 47
Cobalt 12 ND-9 NA ND Iron 22 1970-8260 4030 1160
Lead 22 91-13 109 ND
Manganese 22 137-2330 565 134 Potassium 22 5200-6220 5690 3610
a) Calculated using detected concentrations and one-half of EPAs
contract laboratory program (CLP) detection limits for the organics For the inorganic chemicals the aqueous CLP detection
limits were used
b) ND - Not Detected
c) NA - Not Applicable Chemical was detected infrequently and the
use of one-half of the detection limit in calculating a mean
results in a mean concentration that exceeds the maximum
Therefore a mean is not used
Table 1L
Inorganic Chemicals Detected in Riggs Brook Surface Water Samples at the F OConnor Site[a]
Maximum
Concentration Geometric Background Range Mean[b] Concentration
Chemical Frequency (ugL) (ugL) (UgL)
32 NDAntimony 13 ND[c]-35 5 NDLead 13 ND-16
a) Organic chemicals were also analyzed for but none were detected
b) Calculated using detected concentrations and one-half of EPA s
contract laboratory program (CLP) aqueous detection limits
c) ND - Not Detected
Source Endangerment Assessment dated Jan 29 1988 by Clement Associates Inc
Chemical
Acetone |CHCOCH3l Dimethyl ketone ketone propane
Toluene |CHCHJ _ e bull bull a O J Jtoluol phenyl aethane aethyl benzene
Cblorobcnzene (CHC1) aonochlorobenzene chlorobenzol
Ethyl benzene |C_HCH| phenyl ethane ethyl benzol
ACC TLV or STEL
ltPPB) (PfB)
750 1000
100 150 skin
75 (550agaraquo)
100 125
TABLE 2 CHEMICAL TOXICITY AND OTHER INFORMATION
Physical Skill Dcraal LD^ (mgkg) State Penetration Tonicity Potency ofraquoI(rat)
bullbullbull local it 9750liquid Bint-like odor
1297(nice)
liquid t local 5000
TC|Huosn =Ml00 ppa
colorless liquid 2910
colorless liquid local H 3500 with aromatic odor
syatcaatic bullbullbull TCu(Kiais) c 100 ppa
A hrs
Page 1 of 4
Remarks
Syaptoas Irritates eyea none throat narcotic in high concentrations
Target Organ respiratory aystea skin
First Aid Swallow water voait Skin soap wash
Incoapatibilities oxidizing materials acids Fire hazard when csposed to beat or flame
Tonicity 1 Persistence1 0
Syaptoas fatigue confusion euphoria dizzy headache dialated pupils lack of appetite nervousness insoania
Target organ CNS liver kidneys skin
First Aid Swallow NO VOHIT 8kln soap waah
Incoapatibilities strong ozldizers
Toxicity1 2 Persistence 1
Syaptoas irritates eyes nose causes drowsiness incoordination skin irritation
Target organ respiratory systea eyes skin cars liver
First Aid NO VOMIT
Incoapatibilities strong oxidizers reacts violently with AgClO^
Toxicity 2 Persistence 2
Syaptoas irritant to eyes and aucous aembrane headache narcotic
Target organ eyes upper respiratory systea
First Aid NO VOHIT
Incoapatibilities oxiding asterisks dangerous when exposed to heat or flame
TABU 2 Page 2 of 4 CHEMICAL TOXICITY AND OTHER INFORMATION
(continued)
ACC TLV or STEL Physical Skin Dcraal ID (agkg)
Cheaical (PPff) (PPB) State Penetration Toxicity Potency orsl(rat) Rcnarks
Benzene benzol
IC^H) 10 23 colorless liquid with aroaatic odor
local systeaatic
bullbull
bullbullbull Poisoning occurs aost coasaonly through lnhalationi also penetrates through akin
Syaptoass lrritatea eyes nose respiratory systea giddiness head nausea staggered gait fatigue depresesion sbdoaioal pain
Target organs bloody CNS skin bone narrow eyes respiratory systea
First Aids Swallows 8kins
NO VOMIT soap wash
Inconpatibilitiess strong oxidizers chlorine hronine with iron Dangerous when exposed to beat or flaae
Toxicitys 2 Persistences 1
Trichloroctbylcne ethylene trichloride tridene TCE
30 200 colorless liquid sweet odor
4820
1900(dog)
Syaptoass headache vertigo vision distortion treaors soanolcnce nausea voait irritates eyes cardiac errytbaiss paresthesias
Target organs respiratory systea heart liver kidneys CNS skin
First Aids Swallows Skins
Ipecac voait soap wash immediately
incoapatibless strong caustics chemically active actalss Da Li Ra Hg liquid O
Al 02 KN03 Ti
Persistences 3
Polychlorlasted biphenyi PCB Arocblor 1242 CjjHjClj(approx)
Arcblor 1234
C6H2C3C6M3C12
03
colorless to dark brown liquid with aild hydrocarbon odor
local systeaatic
local
Poisoning occurred Boat coaaonly through investigation or penetration of skin
Sypatoaas Irritates eyes (discbarge) skin scne-fora dernitatis Jaundice dark urine Target organs liver eyes skin First Aids Swallows Ipecac voait
Skins soap wash isnediately Incoapatibless strong oxidizers
TABU 2 CHEHICAL TOXICITY AND OTHER INFORMATION Page 3 of 4
ACC
Chulcil TLV or STEL (ppa) (POO)
Physical State
Skin Penetration
Derail Tonicity Potency
U)n (ngkg) of Reaarka
Dloctyl phtbalate di-acc-octyl pblbalata
5 aga1
light colored liquid
31000 Tonicity low to none via oral and derail routca produce 01 ayaptoas
12 Bichlorobenzene (C^H CI ) o-OCB
50 none liquid ++ local systemic
Symptoms irritates eyes and nose Target Organs liverkidneysskineyes First Aid Swallow salt water vomit
Skin soap wash Incompatabilities strong oxidizers
14 bichlorobenzene (CHbdquoC1 ) 7 2
P-OCB 75 110 solid ++ local
systemic ++ Symptoms irritates eyesheadachesnauseavomiting
Target Organs liverkidneyskineyesrespiratory system
first Aid Swallow water vomit skin soap wash
Incompatablities none
Lead (Pb) 015 mgm
none solid systemic t Symptoms Fatigue headaches abdominal pain Target Organs kidneys 61 central nervous system First Aid Swallow water vomit
Skin soap wash
Polycyclic Aromatic Hydrocarbons (PAHs)
015 mgm
none liquid systemic + Symptoms No obvious symptoms Carcinogenic to tissue following prolonged contact
First Aid Swallow water vomit Skin soap wash
Page 4 of4TABU 2 CHEMICAL TOXICITY AND OTHER INFORMATION
(continued)
NOTES
TLV - Threshold Unit Value ACC - Acceptable Ceiling Concentration STEL - Short Tera Exposure Limit
Suspected carcinogens teratogens or mutagens Firat Aid Unless specified flrat aid for oil of the liated cbeaicala are aa followa
Eyeai iaaedlatcly waab with copious quantity of cold water Skins Flush with water proaptly Breath Artificial respiration Swallowi Water voait
a Slight Hazard aa Hoderate Hasard aalaquo Extreme Hasard
Toxicity Ratiosa
Toxicity Rating
No toxicity (none) Material causes no hara in any condition or produces
tosic effects on buaana in very unusual circumstances or
in very large dosage
Slight toxicity (low)
Moderate toxicity
Severe toxicity
Persistence or each hazardous substance ia evaluated on its blodegradabllity aa follows
Assigned Value
Easily biodegradable coapounds 0
Straight chain hydrocprbons 1
Substituted and other ring compounds 2
Metals polycyclic coapounds and halogenated hydrocarbons 3
Adapted with modifications from EC Jordon Co RIFS Work Plan
TABLE 3 - PERSONNEL TRAINING AND MEDICAL MONITORING HEALTH AND SAFETY PLAN Field Sampling Plan OConnor Co Site Augusta Maine
personnel1
Robert E Stetkar
Joanne O Morin
Richard F Murdock
Benjamin Y Su
Joseph G Engeis
Steven R Lamb
Thomas S Bobowski
Boyd P Smith
Christopher L Covel
William J Haswell
Charles Blodgett
NOTES
ANNUALreg MEDICAL
MONITORING
yes
yes
yes
yes
yes
yes
yes
yes
yes
yes
yes
lt
y
OSHA 40shyHOURreg HAZMAT TRAINING
yes
yes
yes
yes
yes
yes
yes
yes
yes
yes
yes
ANNUALreg RESPIRATOR
FITTEST
yes
no
no
no
no
yes
yes
yes
es Yes
yltes
-y
CARDIOshyPULMONARY
FIRST AID RESUSCITATION TRAINING TRAINING
no no
yes yes
nov no
no no
no no
yes yes
yes yes
yes yes
yes yes
no no
yes yes
1 Only GEI personnel assigpedttfdo work on the OConnor site included on this list
2 Includes baseline and annual physicals lilood testing etc
3 In accordance with 29CFR191012tkncludes annual 8-hour refresher course
4 Includes annual respirator fit testing procedures
Project 90393 GEI Consultants Inc January 17 1991
TOW MAXARJM PCS CONCENTRATION (gtbullraquo) 8Y AREA
Central Maine Power Company Pre-Design Work Plans INTERPRETED CONTOURS Scale 1 inch = 180 feet Augusta Maine OConnor Site OF PGBs IN
Augusta Maine IN SURFICIAL SOILS From EC Jordon Co RIFS
Report dated June 1989 0 G E I C o n s u l t a n t s I n c Project 90393 January 1991 FigHS-2
Central Maine Power Company Pre-Design Work Plans DISTRIBUTION OF PAHs Scale 1 inch = 180 feet Augusta Maine OConnor Site IN SURFACE AND
Augusta Maine SUBSURFACE SOILS From EC Jordon Co RIFS
Report dated June 1989 0 G E I C o n s u l t a n t s I n c Project 90393 January 1991 FigHS-3
Central Maine Power Company Pre-Design Work Plans INTERPRETED DISTRIBUTION Scale 1 inch = 180 feet Augusta Maine OConnor Site OF LEAD IN SOILS
Augusta Maine From E C Jordon Co RIFS
Report dated June 1989 ltD G E I C o n s u l t a n t s I n c Project 90393 January 1991 FigHS-4
Central Maine Power Company Pre-Design Work Plans ANALYTICAL RESULTS FROM Scale 1 inch = 160 feet Augusta Maine OConnor Site SEDIMENT AND SURFACE
Augusta Maine WATER LOCATIONS From EC JOrdon Co RIFS lttgtReport dated June 1989 G E I C o n s u l t a n t s I n c Project 90393 January 1991 FigHS-5
Contamination 80 Feet
Control Line
Central Maine Power Company Pre-Design Work Plans SITE ACCESS AND Augusta Maine OConnor Site DECONTAMINATION
Revision 1 March 281991 Augusta Maine AREA
laquo G E I C o n s u l t a n t s I n c Project 90393 March 1991 KgHS-7
bull
Document Vol II SC SAP Appendix B Revision 0
Date January 17 1991 Page 1
APPENDIX B
FieldtogjL
FIELD LOGS
Project Field Log Book Equipment Calibration Logs
HNu Pl-101 MIE MINIRAM MARKSON CONDUCTIVITY METER MARKSON DIGITAL pHTEMPERATURE
Photograph Log Health and Safety QA Logs
Chain-of-Custody Forms Sample Assignment Forms Non-Conformance Report Forms Test Pit Log Forms Barn Sampling Forms Dexsil L-2000 PCB analyzer Calibration Boring Log Forms
lt
Document Vol II SC SAP Appendix B Revision 0
Date January 17 1991 Page 2
(OCONNORFL1)
(OCONNORFL2) (OCONNORFL3) (OCONNORFL4) (OCQNNORFL5) pound0CONNORFL6) (OCONNORFL7)
-(OCONNORFL9) (OCONNORFLIO) (OCONNORFL11) (OCONNORFL12) fOCONNORFL13) (OCONNORFL14) (OCONNORFL15)
Note Field Log OCONNORFLampisassigned to ground water sampling described in the Management of Migration Sampling andiAnalysis Plan
Document Vol II SC SAP Appendix B Revision 0
Date January 17 1991 Page 3
PROJECT LOGBOOKS (OCONNORFL1)
Serialized project logbooks are to be issued by the site contractor to all personnel at the site who have been designated to perform specific field tasks Individuals must sign their logbooks upon receipt and use them to record all pertinent information until the project is completed y
Logbook entries should be dated legible and contain accurate and inclusive documentation of an individuals project activities Because the logbook forms the basisfor the later written reports it must contain only facts and observations Entries made by individuals other than the person to whom the logbook was assigned are dated andsigned by the individual making the entry bull
CALIBRATION LOG Document No OCONNOR FT1 HNu Photoionization Device Model Pl-101 Page 1 of 1
Instrument Serial No
Lamp Date Span Setting Time Calibration Temperature User
Standard Introduced Meter Response (parts per million (ppm))
Comments (See Summary of Calibration Procedures attached7
X x
User Signature Date
Task Manager Signatures Date
CALIBRATION LOG Document No OCONNORFI3 MIE MINIRAM Hand-held Aerosol Monitor Page 1 of 1
Instrument
Serial No
Date
Time
User
Standard used (zero-bag)
Meter Display
Comments
User Signature lt Date X
Task Manager Signature l Date
CALIBRATION LOG Document No OCONNORFL4 Markson Conductivity Meter Model 103 Page 1 of 1
Instrument Serial No
Date Time User
Standard Used_ Meter Display^
Comments
s
v
lt
y xy ^y
User Signature Date z V
Task Manager Signature ) i Date
CALIBRATION LOG Document No OCONNORFU5 Markson Digital pHtemperature Meter Model 95 Page 1 of 1
Instrument Serial No
Date Time User
Temperature check vs mercury thermometer
Probe reading Thermometer reading
Upon completion of calibration procedure does pH probe checkout vs pH 40 buffer Reading bull lt x pH 70 buffer Reading bull
Comments v
X x
User Signature X^ Date
Task Manager Signature Date
Document No QCONNORFT f
Page
PHOTOGRAPH LOG
Project Name
Project No
Camera and Film Specifications
FILM
ROLL FRAME
DATE nTIME PHOTOGRAPHER PHOTO NUMBER
DESCRIPTION
lt3
ni
I X
V
V
gt
Document No QOONNORm7
HEALTH amp SAFETY QUALITY ASSURANCE CHECKLIST
Page 1 of 2 Project No Site Date Completed by
A On-site Operations During Hazardous Waste Site Investigations
yes no Team understands task procedures safety plan individual roles and site history contaminants
yes no Team knowledgeable to hospital route nearest phone location and who is responsible for health and safety on site
yes no Establishment of command post and decon station with Health amp Safety Plan readily available
yes no Establish communication or line-of-site maintained
yes no Field operations conformed environmental monitoring respiratory protection or emergency response
yes no Protective clothing and respiratory protection maintained
yes no Decontamination procedures performed on the following sample containers sampling equipment and personnel
yes no Equipment protected clean calibrated and being used properly by site personnel
yes no First Aid Equipment readily available at site with checklist and eye wash
yes no Site personnel trained in CPR and First Aid
yes no Site Records maintained such as field logbooks respirator usage log incident reports in place and up-to-date and any deviations or modifications to Safety Plan
GEI Consultants Inc
uocutrenc uujmutvrLz
HEALTH amp SAFETY QUALITY ASSURANCE CHECKLIST
Page 2 of 2 Project No Site Date Completed by
B Health amp Safety Follow-up Reports
o Adherence to procedures o Accidents o Unsafe practices or conditions o Results of environmental monitoring o Corrective action
GEI Consultants Inc
Document No Q00NN0RFL9 CHAIN OF CUSTODY RECORD
DOCUMENT NUMBFR rn tLORD
RELINQUISHED DYISiONruRE OATETJMD RECEIVED DY (SIGNATURE) RELINQUISHED DY (SIOHATURER DATETI^IE RECEIVED BY (SIGNATURE)
IIElINOUISIIEO BY(SIGNATURE) DATETIMf DATETIME gt REMARKS lcNAruDn^nLADOnATonvorI
P a g e o f
Document No OCONNORFLIO
Page of G E I C o n s u l t a n t s I n c
Project No
Project Name _
Laboratory Contact
Sampler ( s ) Date Assigned Date Sampled
GEI Sample No
Sample Medium
Quantity
Sample Container
Type
Analyses Requested Remarks
Special Instructions Remarks
Document No 0CQNNDRFL11
NONCONFORMANCE REPORT
Project Project No
Auditor Audit Date Finding No
FINDING
Where found Check Lit Item
ControllingDocument Section
Task Description
Noncenformanee
Discussed with
Recommended Corrective Action
Is system correction needed to prevent recurrence Yes No If yes state recommended action
Schedule Completion Date By
CORRECTION ACTION
Correction Action by Date
QA Approval of Correction Action by Date
Date Completed Submitted by
Correction Action Verified by Date
I T E S T P I T L O G QCONNORFL12
PROJECT
LOCATIONI CLIENT
CONTRACTOR EQUIPMENTI OBSERVED BY
I DEPTH BELOW
GROUND SURFACE
I (FT)
I
I
I
1
1
1
1
I
1 REMARKS
PROJECT NO
LOCATION
GROUND EL
DATE DATUM
SOIL DESCRIPTION
PIT DIMENSIONS (FT) LENGTH WIDTH DEPTH
ltJgt G E I 1
I Docuaent No 0C0NNCRFL13
bull GEI CONSULTANTS IMC 53 Regional Drive Concord New Hampshire 03301-8500 (603)224-7979
BARN SAMPLING FORM Serial I
PROJECT INFORMATION
Project Name Source Control Pre-Oesion Studies
I Site Name(if different) OConnor Co site
Project Number
I Analytical Lab(s) ERCO EPA
GEI GC screen Other(Specify)
I METHOD OF SAMPLING
WIPE SAMPLING OF HON-POROUS SURFACES
I U000EH UALL SAMPLING UITH DRILL BIT
OUSTSOIL SAMPLING OH FLOOR SLAB
( CONCRETE SAMPLIHG ITH MORTAR BIT
(OTHER-Explain)
I
DESCRIPTION OF SAMPLE
Brief Description of Type of Material or Item Sampled
Visible Staining NO Visible Staining
Approximate Area of Stain(if any) X
LOCATION OF SAMPLE
Ground Floor Second Floor Loft
(All Measurements in Feet to 010 Foot)
Distance Along Z Axis from Reference Origin
Distance Along M Axis from Reference Origin
Height of Sample Above Floor Slab
SKETCH IN APPROXIMATE HORIZONTAL LOCATION OF THE SAMPLE COLLECTED ON FIGURE BELOU
I UALL X
I
I
UALL U UALL Y
I
I Reference Origin UALL Z
I Approximate Scale 1 inchbull 15 feet
I Sample I0(s) SIGNATURE OF SAMPLER CERTIFIES ABOVE SAMPLING RECORD
Date Time
I Sampler(s) COC Docunent Signature Date
I
CALIBRATION LOG Document No OCONNOR FL14 Dexsil L-2000 PCB Analyzer Page 1 of 1
Instrument
Serial No
Date
Time
User
Ambient Temperature deg C
Standard used (50 ppm chloride)
Reading beforeadjustingCALIBRATE knob
Reading after adjusting CALIBRATE knob
Comments
User Signature Date
Task Manager Signature Date
Document No OCONNORFL15 I BORING LOCATION DATE START FINISH
GROUND ELEVATION (NGVO ) DRILLED BY
GROUNDWATER El DATE LOGGED BY TOTAL DEPTH (FT) PG OF
I EL DEPTH S A M P L E
Its TYPE BLOWS PEN REC R E M A R K S QO SOIL ANO ROCK DESCRIPTIONSlt_land PER aFT FT NO 6 IN IN IN lt9
I
I
I
I
I
1
1
I
1
I
I
I
I
I
I BLOWS PER (-140IBHAMMER FALUNS 30T0 DRIVE NOTES A 20 IN 00 SPLIT SPOON SAMPLER
PEN-PENETRATION LENGTH OF SAMPLER OR CORE BARREL REC-RECOVERY LENOTH OF SAMPLE ROO-LENOTM OF SOUND CORES gt4INLENSTH COREO S-SPLIT SPOON SAMPLE PROJECT
I U-UNOtSTURBCO SAMPLES UF-FIXEO PISTON _ UO-OSTER8ERO bully OROUNOWATER 0 G E I
I
I
I
I
I
I
I
I
I
1 1 1 1 1 1 1 I 1 1 I
Document VoL H SC SAP Appendix C Revision 0
Date January 17 1991 Page 1
APPENDIX C
EQUIPMENT CALIBRATION PROCEDURES
Document Vol II SC SAP Appendix C Revision 0
Date January 171991 Page 2
HNu PI-101
The HNu PI-101 is factory calibrated twice a year andor if the instrument is malfunctioning Prior to field use and at the end of each day the user of the instrument will check that the instrument is still holding calibration using the following procedures
1 Prior to the calibration check check the instrument with an Organic point source (ie magic marker) prior to use to verify that it is functioning
2 Connect the rubber sampling hose from the span gas cylinder regulator to the sampling
probe of the HNu gt
3 Fully open the regulator valve gt vy
4 Note the instrument meter response after 5 to 10 Seconds y
5 If the response deviates + 15 from the coneentration of the calibration gas (this figure appears on the cylinder label) the instruihehtTeq^es factory maintenance and will not be utilized in the field until factory calibratiori^Tah alternate meter will be used after calibration checking v (
V 6 Document the calibration information Oik the appropriate equipment calibration log
(OCONNORFL2) ~y
Document VoL IISC SAP Appendix C Revision 0
Date January 17 1991 Page 3
MIE MINIRAM Model PDM-3
The MINIRAM will be factory calibrated once a year andor if the instrument is malfunctioning Prior to field use and at the end of each day the user will zero the instrument using the following procedure
1 With the MINIRAM off insert MINIRAM into Zerobag andseal the Zerobag
2 Inflate Zerobag with filtered air containing no particulates using-attached hand pumpx- V
S
3 Press ZERO button on MINIRAM and wait 30 seconds MINIRAMshould read OFF
4 Pull MINIRAM out of Zerobag
5 Press MEAS button and wait 60 seconds for MINIRAM to go through self-tests
6 The MINIRAM is now functioning and wilJLtake-readings every 10 seconds
7 Document the calibration information onthe appropriate equipment calibration log (OCONNORFL3) V
lt
v
Document VoL II SC SAP Appendix C Revision 0
Date January 171991 Page 4
MARKSON DIGITAL MODEL 103 CONDUCTIVITY METER
The Markson Conductivity meter will be calibrated prior to and following each days field use using the following procedures
1 Rinse the conductivity probe with distilled water gt
2 Pour enough Cole-Parmer conductivity calibration solution (1413 xS 25degC) in a clean plastic Ziploc bag to be able to completely immerse the conductivity probe
3 Immerse the conductivity probe in the standard solution and shakdTree any bubbles that may cling to the cell
4 Allow about 1 minute for the cell to reach equilibrium temperature x X
5 Set the cell adjust control at the bottom of the meter to display the value of 141
6 Carefully rinse cell with water after calibration and after each use V~
7 Document the calibration process onjlie equipment calibration log (OCONNORFL4)
Document VoL H SC SAP Appendix C Revision 0
Date January 17 1991 Page 5
MARKSON MODEL 95
Combined Digital pHtemperature Meter
The Markson 95 combined digital pHtemperature meter will be calibrated prior to and following each days field use using the following procedures
1 Insert electrode into digital meter The reference pin should also be properly connected Temperature probe should be plugged all the way into the ATC jack
2 Remove protective cap and push rubber sleeve such that the potassium chloride filling hole is exposed gt
3 Rinse both pH and temperature probe in distilled water 4 Immerse both pH and temperature probe into buffer 700 solution 5 Set FUNCTION switch to TEMPERATURE to read temperature 6 Set FUNCTION switch to ATC and adjust the readout to the pH value of buffer 700 corresponding
to the temperature measured in E with the CALIBRATE control See Chart 1 7 Rinse electrode and temperature probe withdistilled water 8 Immerse both pH and temperature probe into buffer^401 9 Repeat E V ~ 10 Set the FUNCTION switch to ATC and adjust the readout to the pH value of the buffer 401
corresponding to the temperature measured in Iwith the SLOPE control See Chart 1 11 Rinse the electrodes and temperatureprobe-with distilled water Model 95 is calibrated and ready
for use 12 Document the calibration process on the equipment calibration log (OCONNORFL5)
^ CHART
Temp (C) Buffer Solution 70 X -X
Buffer Solution 40
5 y 700 401 10 708 399 15 706 399 20 703 399 25 701 399 30 700 400 35 699 401 40 698 402 50 698 403 60 697 405
Document VoL II SC SAP Appendix C Revision 0
Date January 171991 Page 6
Dexsil Model L-2009 PCB Analyzer
The Dexsil PCB Analyzer will be calibrated prior to each days field use using the following procedures
Initial Preparation
1 The electrode must be filled with Orion filling solution before it is operational Fill the electrode up to the hole in the side of the epoxy body by-placing the nozzle of the filling solution in the hole and squeezing the bottle 7
2 Drain the electrode while holding it upright over thewaste beaker Grasp the epoxy body firmly in one hand and push down on the white cap which is connected to the cord The solution will then drain out of the bottom of the electrode
Vgt 3 Refill the electrode and check to makesure that the liquid is making contact between the black
cone and the plastic shell at the bottom of theelectrode If it is not making contact at all points drain the electrode again and refill
4 Plug the electrode into the back of the L-200Qj)laeeJt in a vial or rinse solution and turn the instrument on Switch the analysis knobtdfnVand wait a few minutes until the reading stabilizes
Calibration O Imdash^
1 Fill a vial about half way with 50 parts per million calibration solution
2 Turn the analysis selectQrJcnob to CAL
3 Remove the electrode from the rinse solution dry it carefully with a tissue and place it in the calibration solution SWiri the electrode gently for a few seconds and then stop Push the start button on the instrument^
4 When the READ light comes on adjust the CAL knob so that the instrument reads 50
5 Remove the electrode from the calibration solution wipe it dry and place in the rinse solution
6 If this is the first calibration since the instrument has been turned on or since the electrode has been filled repeat steps 34 and 5
7 Document the calibration information on the appropriate equipment Calibration Log (OCONNORFL14)
Document Vol II SC SAP Appendix D Revision 0
Date January 17 1991 Page 1
APPENDIX D X
list of Acronyms
Document Vol II SC SAP Appendix D Revision 0
Date January 17 1991 Page 2
ACRONYMS
ASTM American Society for Testing and Materials CLP Contract Laboratory Program CMP Central Maine Power Company DEP Department of Environmental Protection (Maine) DQO Data Quality Objectives EPA Environmental Protection Agency [US) FL Field Log FSP Field Sampling Plan ltys GEI GEI Consultants Inc gt HSP Health and Safety Plan X
MIE Monitoring Instrumentsforthe Environment MOM Management of Migration NA Not Applicable X lt OSHA Occupational Safety anaHeakh Administration OSWER Officer of SolithWaste and Emergency Response PCB PolychlorinatecFBiphenyk ppb Parts per billion v7 ppm Parts per million QA QuaUtyAssuranck ) QAO QudU$~^sitraquoance Officer QAPP QualityAssurance Project Plan QC Qukkty Gontrof PIP -Thotoionization Detector RDRA -mdashRemedial DesignRemedial Action RI Remedial Investigation ROD x^XRecbrd of Decision RPD X^Relative Percent Difference RPM Remedial Project Manager RSD Relative Standard Deviation SAP Sampling and Analysis Plan SC Source Control SOW Statement of Work TPH Total Petroleum Hydrocarbons VOC Volatile Organic Chemical or Compound
Document Vol II SC SAP Revision 0
Date January 17 1991 Page 3
fenced includes TWA I n and III part of the scrap area and all areas in which residual PCBs are present in soils The RI and FS were conducted by CMP and their consultant EC Jordan Co The objectives of the RIFS were to provide the necessary information to 1) identify and assess the existing and potential public health andor environmental risks which may be caused by the release or threatened release of hazardous substances pollutants or contaminants and (2) formulate and evaluate alternative recommendations for the remedial actions needed if any to prevent or mitigate the migration release or threatened release of hazardous substances
14 Soil Surface Water Sediment and On-Site Barnc Contamination and Remedy Description )
141 Soil s lt w
During the RI approximately 500 surface and Subsurface soil samples were collected by grab sampling shallow borings or test pits PCBs and lead were the principal contaminants found in the surface pTno^05-feet deep) soils and PCBs and carcinogenic polycyclic aromatic hydrocarbons-^(cPAHs) were the principal contaminants detected in the subsurface (05lO12-feet deep) soils
The highest concentrations of PpB^contaminated soils were found primarily within the former transformer work areas (TWAS)r-and the drainage areas associated with these TWAs (Figure 2) Contaminatedsoikinthe TWAs were found to contain up to 200000 parts per million (ppm^PCBs However the most contaminated soils (greater than 500 ppm) constitutelless than 125 of the total estimated volume of soil contamination (23500-trubic yards) and most of the contaminated soil contains PCBs at concentrations le^sthan 50 ^pm Lead was detected above background (ie approximately 70 ppm^average) principally in the surface soils within TWAs I and II with the maximum leachc^neentfation occurring at 4100 ppm within TWA II
Subsurface soil samples taken from TWAs I and II and the low area hear the Upland Marsh contained cPAHs The low area is an area where sediment dredged from the Upper Lagoon in 1977 was deposited adjacent to the area currently containing the Upland Marsh Disposal of this sediment resulted in blockage of natural drainage and formation of the Upland Marsh The depth of vertical migration of the cPAHs appeared to be limited to the upper 6-feet within TWA I and the low area while a small pocket of cPAHs was found to exceed 8 feet within TWA II The maximum cPAH concentration of 30 ppm was found within the low area Depth of PCB contamination in the subsurface soils outside of the TWAs was typically limited to less than 2 feet while PCBs were detected within TWAs I and II at depths of up to 12 feet
Document Vol II SC SAP Revision 0
Date January 17 1991 Page 4
Cleanup standards for soil were determined based on a public Health Environmental Risk Assessment performed by the EPA Cleanup standards are summarized below compared to maximum concentrations of chemicals encountered at the site
Maximum Concentration Soil Cleanup Chemicals Detected Standards
(ppm) (ppm)
Lead 4100 248 x
cPAHs 30 dX X PCBs 200000 1 gt bull
bullX
The RODspecifies that approximately23500 cubicyardsjof contaminated soils contain PCBs cPAHs and lead above the established Cleanup standards are to be treated on site using a solvent extraction technology This technology principally involves the use of a solvent to extract the PCBs and cPAHs from the contaminated soils The contaminated liquids containing the extracted PCBs and cPAHs will be destroyed at a licensed off-site TSCA incinerator AddkionaHyr-soil treatment residues resulting from the solvent extraction process that haveJlacNevels above the 248 ppm cleanup standard will undergo further treatment using n solidificationstabilization treatment technology Those solid treatmentNresidues jesulting from the solvent extraction process that do not achieve the cleahup-standards and that have undergone additional treatment through solidificationstabilization will be transported off-site to a licensed landfill It is currently estimated by the EPA that 5000 cubic yards of the total 23500 cubic yards of contaminated soils undergoing solvent extraction will require off-site disposal
142 Surface Wateiv
The on-site surface waterNirainage features include an Upland Marsh an Upper Lagoon and a Lower Lagoon (see Figure 2) The Upland Marsh drains to the Upper Lagoon via a subsurface drainage pipe The Upper Lagoon drains to the Lower Lagoon via a drainage swale The water that flows out of the Lower Lagoon follows a drainage swale to Riggs Brook
In 1976 under the advice of Maine DEP the two lagoons were constructed in an attempt to control oil migration The Upper Lagoon was constructed with a concrete retaining wall and an inverted siphon to prevent migration of oils floating on the lagoon surface Floating oils were collected and contained in six large on-site storage tanks The lower lagoon was excavated at the base of the slope and constructed with an earthen berm and a horizontal pipe discharge
Document Vol n SC SAP Revision 0
Date January 17 1991 Page 5
In 1977 under the direction of the Maine DEP the use of the lagoons was discontinued The water from the Upper Lagoon was placed in storage tanks and the sediments were excavated and placed in the low area shown on Figure 2 The sediments placed in the low1- area were underlain by a 1-foot-thick layer of marine clay and then covered with a clayey soil less than 6 inches thick The filling of the low area created a barrier to the previous natural surface water drainage and resulted in the formation of the Upland Marsh In an attemptto drain the marsh the subsurface drainage pipe was installed between the marsh and the Upper Lagoon in September 1978 The saturated area of the Upland Marsh presently still exists
On-site surface water quality was measured at five sampling locations These include one surface water sample from each of the lagoons and one from the Upland Marsh The surface water quality data in the RI indicated that PCBs (from unfiltered samples) were detectable in the Upper and Lower Lagponsyand in drainage from the Lower Lagoon but were not detected in surfacewater samples taken from Riggs Brook PCB concentrations in the on-site surface waters for the EowersLagoon the Upper Lagoon and Upland Marsh were 055 ppb 16 ppb^jand non-detected respectively Other contaminants of concern in the on-site urfkceTwaters were the inorganic chemicals lead and aluminum Lead was found at concentrations ranging from 36 to 13 ppb in all the on-site surface waters Additionally aluminum was detected in the on-site surface waters at concentrationsrangfog from 236 to 3740 ppb
O V Cleanup standards for surface water were determined based upon a Public Health
Environmental Risk Assessment performed by the EPA Cleanup standards are
summarized below compared to themaximum concentration of chemicals encountered
at the site N v
Surface Water Maximum Concentration Cleanup
Chemicals xD6tected Standards (PPb) (ppb)
Lead 13 194 Aluminum 3740 87
PCBs 16 0065
The selected remedy for surface water remediation at the site is pumping of surface water from the Upper and Lower Lagoons and Upland Marsh and disposal off-site unless otherwise approved by EPA The ROD indicates that the approximately 150000 to 195000 gallons of surface water are contained in the Upland Marsh and Upper and Lower Lagoons
Document Vol II SC SAP Revision 0
Date January 17 1991 Page 6
143 Sediment
The sediment sampling program conducted during the RI consisted of a total of 23 sediment samples from 19 locations both at on-site and off-site locations A total of six sediment samples were collected from the Upland Marsh Upper Lagoon and Lower Lagoon consisting of two samples from each of these surface water bodies Other samples were collected from Riggs Brook and drainage swales between the lagoons and Riggs Brook
xPCBs were detected in the sediment samples obtained from thexdge of the Upland Marsh both on-site lagoons and the Lower Lagoon drainage area leading into Riggs Brook PCB concentrations were highest in the Upper Lagoon (up to 1100 ppm) but decreased significantly downstream in the Lower iiigoon PCB concentrations were lowest in the drainage swale downstream fronii dieLower Lagoon (approximately 4 ppm) Cleanup standards for the sedimentswere~detennined based on a Public Health Environmental Risk Assessment performed by the ERA Cleanup standards are summarized below compared to maximiimgtCQncentrations of chemicals encountered in sediment samples from the Upland MSrsh Upper Lagoon and Lower Lagoon
Vmdash ( Sediment
MaximumConcentration gt Cleanup Chemicals Detected-^ v Standards
( (PPF1) -mdash (PPm)
Lead 28 248 cPAHs y 1 PCBs 1100 1
The ROD indicates that the cm-site sediments will be dredged and the sediment containing chemicals above^tbe established cleanup standards will be treated using the solvent extraction technology as described in Section 141
144 On-Site Barn Characteristics
The barn has been reported to formerly house scrap operations A surficial soil sample taken from within the barn (JSS1) during the RI was collected and analyzed for the presence of PCBs and lead The exact nature or matrix of the surficial soil (eg dust concrete wood) collected from within the barn could not be ascertained from the available documents The results of the PCB screening indicated a concentration of 96 ppm PCBs Lead was detected at a concentration of 1610 ppm No analysis for cPAHs was performed on the sample from the barn
Document Vol II SC SAP Revision 0
Date January 17 1991 Page 7
In the ROD EPA set soil cleanup standards for the site of 1ppm PCBs 1ppm cPAHs and 248 ppm lead The cleanup standards for barn materials were not specified in the ROD by EPA However the ROD specified that the barn would undergo decontamination procedure if contamination was present above cleanup standards (to be determined) through collection of soil dust and other loose material and these materials would be combined with the other contaminated soils and sediments for on-site solvent extraction treatment Large scrap items in the barn would then be removed for disposal off-site and the barn structure would be sampled for detection of the presence of contamination Following sampling and analysis of the barn structure the barn would be demolished and transported to an off-site facility for appropriate disposal ^gt
N
Document Vol II SC SAP Revision 0
Date January 17 1991 Page 8
2 SAMPLING AND DATA QUALITY OBJECTIVES
21 General
Sampling of soils surface water sediments and the on-site barn and its contents will be performed during the Source Control (SC) component of the Pre-Design Study Pre-Design SC sampling results will be used in the design of the SourceControl component of the remedy and development of the treatability testing program for soil and sediment
Pre-Design SC sampling will include N
Collection of surface water samples from the Upland Marsh and Upper and Lower Lagoons in April 1991 V
x
Collection of sediment samples from the Upland Marslkahd Upper and Lower Lagoons in April 1991 ^
Collection of soil samples from test pits and^Orihgsrin April 1991
bull Collection of samples of soil woodimckconcrete from the on-site barn floor and Walls and wipe samples from debris andlquipment located within the barn in May 1991
V-X7EPAs guidance document Data Quality Objectives for Remedial Response Activities (OSWER Directive 93550-78Jdarch 1987) identifies four analytical levels
Level I - field screeningoranalysis using portable instruments Results are often not compound specific and o^ qualitative in nature
Level II - field analyses using mbresophisticated portable analytical instruments Results are more reliable in terms of compound identification and may be semi-quantitative
Level El - laboratory analyses by established referenced methods Results are quantitative and compound specific
Level TV - EPA Contract Laboratory Program (CLP) services utilizing rigorous QAQC protocols and documentation
Level V - Laboratory analyses by non-standard methods Identified in the CLP asspecial analytical services
Document Vol II SC SAP Revision 1
Date March 28 1991 Page 9
A combination of Level I Level in and Level IV analytical protocols will be specified during Pre-Design SC sampling EPA Contract Laboratory Program (CLP) protocols prescribed in the 1988 Organic and Inorganic Statement of Works will be utilized for laboratory analysis of target compounds (PCBs cPAHs lead and aluminum) in surface water sediment soil and barn samples The analytical protocols that will be utilized for Pre-Design SC sampling are detailed in the SC Quality Assurance Project Plan (QAPP) included as Volume I of the SC SAP
22 Soils
Soil samples will be collected and analyzed to provide additional data for comparison with cleanup standards for design of the Source Control program at the OConnor Site Data will be used to refine the previously estimated volume of soils contaminated at various concentrations above the cleanup standards and to provide additional information at areas with apparent data gaps on the lateral and vertical extent of soil with PCB concentrations greater than 1 ppm Soil also will be collected at specified locations to provide samples for solvent extraction treatability bench-scale testing Samples selected for treatability testing will contain PCBs at concentrations previously not examined during limited bench-scale testing performed during the Feasibility Study (FS) The effectiveness of solvent extraction on removal of lead cPAH and PCB contamination will be examined during the bench-scale treatability studies performed during Pre-Design
The soil sampling program performed during the RI was designed to estimate the horizontal and vertical distribution of soils contaminated with PCBs lead and cPAHs above the cleanup standards The distribution of PCBs lead and cPAHs are summarized in the RI on Figures 4-8 4-10 and 1-10 respectively GEI identified several inconsistencies in the distribution of contaminated soils within the summary figures For instance the distributions of PCB contamination shown on Figures 1-6 and 4-8 in the RI in the northern portion of the site near TWA III do not agree Also previous soil sampling did not consistently confirm the horizontal and vertical limits of PCB contamination The vertical limits of the PCB contaminationwere not adequately identified for remedial design purposes near transformer work areas and along drainage pathways where PCB migration has occurred
The effectiveness of solvent extraction as the selected remedy for treating the on-site soils was not fully demonstrated during the FS The bench-scale testing that was performed during the FS did not investigate the full range of contamination levels and recovery efficiencies from different soil types that exist on the site
There are three primary objectives for collection of soil quality data during the Pre-Design studies
Document Vol II SG SAP Revision 1
Date March 28 1991 Page 10
1 Collect additional data with close control of analytical precision to evaluate datagaps and inconsistencies reported during the RI The collection of these data will primarily be performed near TWAs and drainage pathways
2 Refine the previously estimated volume of soils contaminated at various concentrations above the cleanup standards
3 Evaluate theselected remedy of solvent extraction through bench-scale testingof soils with specific ranges of PCB concentrations
All soil samples collected for treatability bench-scale testing will also have an aliquot collected for PCB analyses by Ceimic Corporation of Narragansett Rhode Island This will provide added confidence that designated samples are within the specified ranges of PCB concentrations for solvent extraction bench-scale testing
In order to facilitate comparison of Pre-Design Study soil quality with RI study soil quality rigorous QAQC protocols and documentation will be needed All sampleswill be analyzed by Ceimic Corporation using 1988 CLP protocols Analytical Level IV (CLP QAQC and documentation) will be utilized on 20 percent of the soil samples collected The remaining 80 percent will be analyzed according to 1988 CLP protocols utilizing Analytical Level III (CLP QAQC butwithout CLPdocumentation) These serviceswill provide detection limits at or below the ROD Cleanup Standards
During Pre-Design sampling equipment blanks will be collected and analyzed after decontamination of sampling equipment to identify artifact contamination that could result from incomplete decontamination of equipment Trip blanks will also be included during sample shipment to identify cross-contamination during transportation to Ceimic Corporation The laboratory and field QAQC procedures described above will enable the precision required to satisfy the objectives of the soil sampling component of this study
23 Sediments
Sediment samples will be collected and analyzed to provide additional data for comparison with the cleanup standards for design of the Source Control program at the OConnor site Data will be used to supplement the sediment quality data previously collected in the RI for a refined estimate of the levels of lead cPAH and PCB contamination in the sediments of the Upland Marsh Upper Lagoon and Lower Lagoon In addition a composite sediment sample from the Upper Lagoon and a composite sediment sample from the Lower Lagoon will be collected for solvent extraction treatability bench-scale testing Treatability testing on contaminated sediments was not performed during the FS The effectiveness of solvent extraction on removal of lead cPAHs and PCBs from sediments will be examined during the bench-scale treatability studies performed during Pre-Design
Document Vol II SC SAP Revision 1
Date March 28 1991 Page 11
The sediment quality data collected during the RI was limited Only two sediment samples were collected from the Upland Marsh Upper Lagoon and Lower Lagoon In addition limited data have been previously collected regarding the volume of contaminated sediment on-site
There are three primary objectives for sediment quality data to be collected during Pre-Design studies
1 Collect additional data with close control of analytical precision to examine levels of contamination in sediment at locations previously not investigated This will include two additional samples from the Upper Lagoon two additional samples from the Lower Lagoon and six additionalsamples from the Upland Marsh The investigation in the Upland Marsh will be directed towards delineating the extent of contamination in the westerly (upstream) direction
2 Refine the previously estimated volume of sediment in the Upland Marsh Upper Lagoon and Lower Lagoon
3 Evaluate the solvent extraction remedy effectiveness on treatment of sediment through bench-scale testing
In order to facilitate comparison of Pre-Design Study sediment quality with RI study sediment quality rigorous QAQC protocols and documentation will be needed Only sediment samples containing greater than 30 percent solids (based on visual observations) will be submitted for analysis After sample collection in the field percent volume of settled sediment in the sample container will be compared to the percent volume of free water Samples will be submitted to the laboratory for analysis if the volume of settled sediment in the sample container exceeds 50 percent of the total volume of the sample All samples will be analyzed by Ceimic Corporation of Narragansett Rhode Island following 1988 CLP protocols Analytical Level IV (CLP QAQC and documentation) will be performed by Ceimic on 20 percent of the sediment samples collected The remaining 80 percent will be analyzed by Ceimic utilizing Analytical Level in (CLP QAQC but without CLP documentation) These services will provide the detection limits at or below the ROD Cleanup Standards
During Pre-Design sampling equipment blanks will be collected and analyzed after decontamination of sampling equipment to identify artifact contamination that could result from incomplete decontamination of equipment Trip blanks will also be included during sample shipment to identify cross-contamination during transportation to Ceimic
The laboratory and field QAQC procedures described above will enable the precision required to satisfy the objectives of the sediment sampling component of this study
Document Vol II SC SAP Revision 1
Date March 28 1991 Page 12
24 Surface Water
The OConnor SiteStatement of Work for Remedial DesignRemedial Action requires that surface water contained within the Upper and Lower Lagoon and in the Upland Marsh be drained collected and transported off-sitefor treatment unlessotherwise instructed by EPA
The three primary objectives for surface water data to be collected during the Pre-Design Studies are to
1 Probe surface water depths in Lagoons and Upland Marsh to obtain a better estimate of surface Water volumes to be handled during remediation
2 Evaluate changes in surface water quality that may have occurred during the approximately three-year period since sampling during the RI and evaluate extent of surface water contamination in the Upland Marsh which is at the upstream edge of the PGB contamination area
3 Collect additional data to design an appropriate program for surface water diversion pumping treatment and disposal Off-site disposal destinations as well as on-site treatment and disposal options will be examined in more detail during the Pre-Design Study
All surface water samples will be submitted to Ceimic Corporation for analysis of PCBs aluminum and lead All of these samples will be analyzed following 1988 CLP protocols including CLP QAQC and CLP documentation (Analytical Level IV) One additional sample will be collected from each surface water body and submitted to Ceimic for Total Suspended Solids Analysis (EPA Method 1602) utilizing Analytical Level III
2JS Barn
The available data for the extent of contamination of barn materials consists of one sample point The surficial soil sample collected was not described such that it is known whether the sample consisted of dust the concrete slab soil within cracks of the slab or debris samples within the barn The elevated levels of PCBs and lead within the sample may not be representative of the majority of the loose materials within the barn Furthermore no wipe sampling on non-porous debris or sampling of the wooden barn structure was performed during the RI
Document Vol II SC SAP Revision 0
Date January 17 1991 Page 13
Cleanup standards for target chemicals listed in the ROD have not yet been established by EPA for barn materials The ROD indicates that the Toxic Substance Control Act (TSCA) Spill Cleanup Policy and Disposal Regulations (40 CFR Part 761) may be used in lieu of site-specific determination of acceptable levels
Samples of selected media within the barn will be collected and analyzed to provide an initial data set to establish the degree of contamination present within the barn Data will be used in developing the work plan for decontamination and demolition of the barn and to determine appropriate disposal sites for barn demolition debriSNand loose debris within the barn Depending on data results an evaluation will be made tbvdetermine whether additional sampling will be required prior to demolition to betterseqnence demolition activities so that PCB-contaminated material can beSeparated from non-contaminated building materials and debris
ltx All soil wood and concrete barnsamples will besubmitted to Ceimic Corporation (Ceimic) of Narragansett Rhode Island for analysis of PCBs cPAHsgtand lead Wipe samples of debris will be submitted to Ceimic for analySis-ofPCBs All samples will be analyzed following CLP protocols Analytical LeveK IV-requiring CLP QAQC and reporting requirements will be utilized for 20 percent of the5amples Analytical Level in utilizing CLP analytical protocols but without the documentation requirements of CLP will be specified for the remainder of the
Document Vol II SC SAP Revision 0
Date January 17 1991 Page 14
3 HEALTH AND SAFETY
A Health and Safety Plan for the Source Control Field Sampling Plan is presented in Appendix A All personnel involved in the sampling program have been trained in accordance with the requirements of the Occupational Safety and Health Administration Regulation OSHA 1910120 Hazardous Operations and Emergency Response and are enrolled in a comprehensive medical monitoring program
A list of personnel authorized to perform work on this project ^and listing of their participation in personnel training and health monitoring programs^arepresented in the Health and Safety Plan gt
Document Vol II SC SAP Revision 1
Date March 28 1991 Page 15
4 SAMPLING LOCATION AND FREQUENCY
41 Soils
411 General
In general the soil sampling program includes collection of the following two basic categories of samples
1 Soil samples collected from test pits for possible bench-scale testing and
2 Soil samples collected from test pits and borings to fill data gaps on the lateral and vertical extent of soil contamination above cleanup standards and to refine estimates of the quantity of contaminated soils
Figure 3 shows the locations of test pits and borings planned for this investigation These locations were based on the depth delineation of 1 ppm for Total PCBs presented in the Remedial Investigation Table 1provides ageneral sampling rationale including test pit and boring identification numbers target sampling depth and elevation anticipated PCB concentration level and soil type A summary of the analyses to be performed on soil samples including replicates and blanks is shown in Table 2
A total of 12 soil samples for possible bench-scale testing will be collected from test pits during April 1991 Two samples of each soil type indicated below will be collected within the specified ranges of PCB concentrations Each sample will have a minimum volume of about 05 cubic feet (about 60 lb weight) to provide sufficient soil for bench-scale testing
PCB Concentration Range fppml Soil Types
1 to 10 Clay and Fill 10 to 20 Clay 20 to 50 Clay 50 to 500 Clay and FiU
During the RI three soil samples were collected for bench-scale treatability testing with initial PCB concentrations of 1000 4000 and 22000 ppm However sample locations had been selected to obtain samples with PCB concentrations in the range of 250 to 700 ppm based on PCB concentration contours developed during the RI
Document Vol II SC SAP Revision 1
Date March 28 1991 Page 16
Therefore PCB concentration contours developed from the RI data do not precisely indicate the extent and level of contamination
In order to gain a higher degree of confidence that samples within each specific PCB concentration range have been collected GEI will perform field PCB screening with a Dexsil L-2000 PCB analyzer to estimate the soil PCB concentration range prior to collecting the soilsample Aliquots of the 12 bench-scale soilsamples will be collected for confirmatory testing for PCB concentrations by Ceimic of Narragansett Rhode Island utilizing 1988 CLP protocols
GEI will select the soil samples for bench-scale testing after receiving the CLP laboratory results of the PCB concentrations If the laboratory data do not indicate that at least one of the two soil samples was collected from the targeted concentration ranges and soil types an additional contingency round of soil sampling may occur Sampling locations for this contingency sampling round will be selected based Upon the PCB data summarized in the RI and the data collected by GEI during the previous SC sampling round
A total of 40 soil samples (including replicates) will be collected from test pits and borings during April 1991 to fill data gaps on the extent and quantity of contaminated soil The soil sampleswill be collected at the approximate elevation specified for each sampling location as indicated in Table 1 Sample elevations of the bench-scale samples may vary if PCB concentrations in samples screened with the Dexsil L-2000 PCB analyzer are not within the ranges indicated below
Acceptable Screening Target PCB Concentrations Range PCB Concentration Range
(ppm) (ppm)
1 to 10 1 to 10 10 to 20 10 to 20 20 to 50 25 to 45
50 to 500 200 to 350
The soil samples will be analyzed for PCBs ePAHs and lead by Ceimic of Narragansett Rhode Island utilizing CLP protocols Four soil samples (including two selected for bench-scale treatability testing) will also be analyzed for total organic carbon (TOC) cation exchange capacity (CEC) and pH
Document Vol II SC SAP Revision 1
Date March 28 1991 Page 17
Detailed descriptions of the soil sampling and decontamination methods are provided in Section 5 Appendix A and the QAPP Contractors will be used for surveying performance of test pits and drilling of borings All contractors will be required to document that they have completed health and safety training that complies with OSHA Standard 1910120 In generalstakes marking the planned locationsof test pits will be surveyed by a registered surveyor prior to test pit excavation The Stakes will serve as temporary bench marks for reference during location of test pit samples A rubber-tired type backhoe will be used to excavate test pits for planned sampling locations less than or equal to5 feet below ground surface The backhoe and operator will be supplied by HE Sargent Inc of Lewiston Maine capable of operating at hazardous waste sites under Level C personnel protection Soil samples will be collected from in-situ test pit excavations by GEI personnel using a stainless steel shovel or trowel
Due to anticipated shallow ground water conditions a drill rig will be used to advance test borings for soil sampling at locations where the target sampling location is greater than 5 feet below ground surface The soil samples will be collected using a split-spoon sampler Drilling and sampling will be performed by Northeast Diamond Drilling Company of Union Maine capable of working on hazardouswaste sites under Level C personnel protection
412 Soil Analysis Program
Analytical procedures are identified in the Quality Assurance Project Plan (QAPP) The samples will be analyzed using 1988 CLP methods for PCB cPAHs and lead by Ceimic of Narragansett Rhode Island EPA methods 9045 9060 and 9080 will be used to analyze soils for pH TOC and CEC respectively A summary of the analyses to be performed on soil samples including replicates and blanks is shown in Table 2 Samples will be collected in I-Chem glassware or equivalent and stored at 4 deg C as described in Section 6
A series of quality control blanks (replicates and blanks) will be collected by GEI and analyzed by the laboratory to aid in data assessment as discussed in the Quality Assurance Project Plan (QAPP) All quality control samples will be labelled with false sample identification as shown in Table 2 in order to avoid laboratory bias
Sampling equipment blanks and aqueous trip blanks will be submitted for every ten soil samples during the sampling program to check for the presence of cross-contamination These will provide a quality control check for decontamination and handling practices The trip blanks will contain laboratory-supplied organic-free water and will accompany the shipment of soil samples during storage and shipment The trip blanks will be analyzed for PCBs (sample identification will be TP26-TP29) Wipe
Document Vol II SC SAP Revision 1
Date March 28 1991 Page 18
samples will be collected from the shovel or hand trowel and split-spoon sampler (sample identification numbers TP30-TP33 and TP34-TP37 respectively) after decontamination and will be analyzed for PCBs Wipe sampling procedures are described as part of barn sampling procedures in Section 562 One replicate sample will be collected for every ten soil samples Replicate sample locations and identification numbers are indicated on Table 2
413 Soil Sample Designation
Each piece of soil sample glassware will be affixed with a self-sticking adhesive label Each label will be completed with an indelible marker to contain the following information
GEI Consultants Inc Site Name Project Number Sampling Date and Time Sample Number Samplers Initials Analysis Requested
The sample number is composed of a series of information to identify the sample as unique to the sampling point and sampling event The sample number labelled in the field and referred to on all associated documents is composed of the following
Matrix Project Sampling Location Sample Number
Soil - 90393 -TP2-SS1
The example sample number above indicates that soil sample SSI was collected from Test Pit No 2 under project number 90393
4JZ Sediment
431 General
Sediment samples will be collected by GEI from the Upland Marsh the Upper Lagoon and the Lower Lagoon during April 1991 A summary of the laboratory analyses of sediment samples is listed on Table 3 Procedures for sampling and equipment decontamination are provided in Section 5 Appendix A and the QAPP
Document Vol II SC SAP Revision 1
Date March 28 1991 Page 19
In general the sediment sampling program includes collection of the following two basic categories of samples
1 Two composite sediment samples collected using a clam-shell sampler for bench-scale testing
2 Eleven sediment samples (including one replicate) collected with a tube sediment sampler to provide additional data on sediment quality and for estimating the quantity of contaminated sediments
The two composite sediment samples collected using a clam-shell type sampler for bench-scale testing will be collected within the Upper Lagoon and Lower Lagoon at the locations shown on Figure 4 Based on the data in the RI the Upper Lagoon contained the higher sediment concentrations of PCBs
The eleven sediment samples collected to provide additional data on sediment quality and for estimating the quantity of sediments will be collected at the locations shown on Figure 4 As shown on the figure six sediment sampling locations were chosen for the Upland Marsh two locations were chosen for the Upper Lagoon and two locations for the Lower Lagoon
Detailed descriptions of the methods and equipment to be used during the sampling program are provided in Section 5 In general a temporary reference bench mark will be surveyed and staked adjacent to each surface water body by a surveyor licensed in the State of Maine and OSHA-approved for working on a hazardous waste site The actual sediment sampling locations will be measured by tape and compass bearings from the reference bench mark prior to sampling For the bench-scale sample a 5shygallon sample container will be filled with sediment from the dredge type sample The samples for providing additional data on sediment PCB concentrations will be collected with a tubesediment sampler pushed into the complete thickness of sediment at the sampling location All sampling equipment will be decontaminated using methanol and distilled water rinses before each use
4SL2 Sediment Analysis Program
Analytical procedures are identified in the Quality Assurance Project Plan (QAPP) Sediment samples will be submitted to Ceimic of Narragansett Rhode Island for laboratory analysis utilizing CLP protocols The samples collected for bench-scale testing will be analyzed for PCBs The remainder of the sediment samples will be analyzed for PCBs cPAHs and lead One sediment sample will also be analyzed for total organic carbon (TOC) cation exchange capacity (CEC) and pH by EPA methods 9060 9080 and 9045 respectively A summary of analyses to be performed on
Document Vol II SC SAP Revision 1
Date March 28 1991 Page 20
sediment samples including replicates and blanks is shown in Table 3 Samples will be collected in I-Chem glassware or equivalent and stored at 4degC as described in Section 6
A series of quality control samples (replicates and blanks) Will be collected by GEI and analyzed by the laboratory to aid in data assessment as discussed in the Quality Assurance Project Plan (QAPP) All qualitycontrol samples will be labelled withfalse sample identification as shown in Table 3 in order to avoid laboratory bias
Two sampling equipment blanks and one aqueous trip blank will be submitted during the sampling program to check for the presence of cross-contamination These will provide a quality control check for decontamination and sample handling practices The trip blank containing laboratory-supplied organic free water will accompany the shipment of sediment samples and will be analyzed for PCBs (Sample ID SED7) Wipe samples will be collected from the tube sediment sampler and dredge sampler after decontamination and will be analyzed for PCBs (sample identification numbers SED9 and SED8 respectively) Wipe sampling procedures are described as part of barn sampling procedures in Section 562 One replicate sample will be collected during sediment sampling Replicate sample location and identification is indicated on Table 3
423 Sediment Sample Designation
Each piece of sediment sample glassware will be affixed with a self-sticking adhesive label Each label will be completed with an indelible marker to contain the following information
GEI Consultants Inc Site Name Project Number Sampling Date and Time Sample Number Samplers Initials Analysis Requested
The sample number is composed of a series of information to identify the sample as unique to the sampling point and sampling event The sample number labelled in the field and referred to on all associated documents is composed of the following
Matrix Project Surface Water Body Sample Location
SED - 90393 - UM - SED1
Document Vol II SC SAP Revision 1
Date March 28 1991 Page 21
The example sample was obtained from sample location SED1 in the Upland Marsh under project number 90393 The surface water body designations for the Upper Lagoon and the Lower Lagoon will be UL and LL respectively
43 Surface Water
431 General
Surface water quality data consisting of two samples each from the Upland Marsh Upper Lagoon and the Lower Lagoon will be collected by GEI in April 1991 Sampling locations are shown on Figure 4 Surface water sampling locations will be determined in the field by tape and compass bearings from the temporary reference bench mark established for sediment sampling A summary of the analyses to be performed on surface water samples including duplicates and blanks is shown on Table 4 Detailed descriptions of the sampling methods to be used during surface water sampling are provided in Section 5 In general the depth of the water at the sampling location will be measured at each sampling location with a weighted tape measure prior to collecting the surface water sample A water sample will be collected after lowering a stainless steel Kemmerer sampling device one-half the total depth of the water column All sampling equipment will be decontaminated using methanol and distilled water rinses before each sampling event
433 Surface Water Analysis Program
Analytical procedures are identified in the Quality Assurance Project Plan (QAPP) All of the surface water samples will be analyzed using 1988 CLP methods for PCBs aluminum and lead One sample from each surface water body will also be Submitted for Total Suspended Solids Analysis (EPA Method 1602) A summary of the analyses to be performed on surface water samples including duplicates and blanks is shown on Table 4 Surface water samples will be submitted to Ceimic Corporation for laboratory analysis Samples will be collected in I-Chem glassware or equivalent and stored at 40 C as described in Section 6
A series of quality control samples (duplicates and blanks) will be collected by GEI and analyzed by the laboratory to aid in data assessment as discussed in the Quality Assurance Project Plan (QAPP) All quality control samples will be labelled with false sample identification as shown in Table 4 and described below in order to avoid laboratory bias
One sampling equipment blank and a trip blank will be submitted during each sampling round to Check for the presence of cross-contamination These will provide a quality control check for decontamination and handling practices One trip blank
Document Vol II SC SAP Revision 1
Date March 28 1991 Page 22
sample consisting of laboratory-supplied organic-free and de-ionized water will accompany the samples during storage and shipment and will be analyzed for PCBs aluminum and lead (sample identificationwill be SW4) A samplingequipment blank will be collected by pouring laboratory-supplied organic-free and de-ionized water through the Kemmerer sampler at the end of the sampling program The sampling equipment blank will then be analyzed for PCBs aluminum and lead (sample identification will be SW5)
One surface water duplicate will also be collected each sampling round Duplicate sample location and identification is indicated on Table 4
433 Surface Water Sample Designation
Each piece of sample glassware will be affixed With a self-sticking adhesive label Each label will be completed with an indelible marker to contain the following information
GEI Consultants Inc Site Name Project Number Sampling Date and Time Samplers Initials Analyses Requested
The sample number is composed of a series of information to identify the sample as unique to the sampling point and sampling event The sample number labelled in the field and referred to on all associated documents is composed of the following
Matrix Project Surface Water Body Sampling Location
SW - 90393 - UM - SW1
The example sample number above indicates thata surface water sample was obtained from the Upland Marsh at location SW1 under Project Number 90393 The surface water body designations for the Upper Lagoon and the Lower Lagoon will be UL and LL respectively
Document Vol II SC SAP Revision 1
Date March 28 1991 Page 23
44 Barn
441 General
A total of approximately 30 samples of various media within the barn will be collected by GEI during May 1991 The types of media collected will generally consist of wood fragments from barn walls dust concrete and wipes on non-porous debris within the barn The exact sample locations will be primarily determined in the field based on observations during sampling (eg staining on soils concrete or wood) Based on a site visit by GEI on December 19 1990 preliminary sample locations for barn materials were chosen as shown in Figure 5 These preliminary locations will enable representative sampling of general debris and staining in the barn and indicates the general sampling strategy which will be employed during Pre-Design Final sampling locations may be modified during the program based on closer observation of equipment barn materials and evidence of staining
Detailed descriptions of the methods to be used during the barn sampling program are provided in Section 5 In general a survey of the general types of materials present in the bam and locations of apparent staining of surficiial materials or debris will be recorded on a plan Following the survey representative areas within the barn will be sampled A total of 12 wipe samples will be collected (eg steel shelves boat wood stove electric meters etc) by wiping a 100 cm2 area with laboratory-prepared sampling wipes A total of ten samples of Wood from the walls of the barn will be collected by using a wood boring bit and wood chisel A total of four samples of loose dust will be collected from the floor of the concrete slab of the barn using disposable nylon brushes and stainless steel trowels Finally a total of four samples of concrete will be collected from areas of visible staining and one unstained area by drilling the concrete to a maximum depth of 12 inch in a 100 cm2 area All non-disposal steel sampling equipment will be decontaminated using methanol and distilled water rinses before use at each sampling location
442 Barn Analysis Program
Analytical procedures are identified in the Quality Assurance Project Plan (QAPP) Three field equipment blanks and three trip blanks will be submitted during the barn sampling program to check for the presence of cross-contamination These will provide aquality control check on decontamination and handling practicesAsummary of the analyses to be performed on each sample matrix and the quality controlsamples is shown in Table 5
Document Vol II SC SAP Revision 1
Date March 28 1991 Page 24
Wipe wood dust and concrete samples will be submitted to Ceimic in Narragansett Rhode Island for laboratory analysis Wood dust and concrete samples will be analyzed for PCBs cPAHs and lead Samples will be collected in I-Chem glassware or equivalent provided by Ceimic and preserved and stored as described in Section 6
The objective of the barn sampling program is to provide a preliminary assessment of the degree of contamination present within the barn (see Section 2) It may be difficult to ensure that representative replicates can be made of the various matrices during sampling Therefore no replicate samples of barn materials will be collected during this initial sampling effort
Aqueous trip blank wipe samples will accompany the samples during storage and shipment and will be analyzed for PCBs (sample identification will be PTB1-PTB3) Sampling equipment blank wipes will be made following decontamination of all steel sampling equipment at various times during the sampling program The steel equipment wiped will include the hole saw trowel and the drill bit used for barn wall dust and concrete sampling respectively The equipment wipe samples will then be analyzed for PCBs (sample identification will be PEB1-PEB3)gt
443 Barn Sample Designation
Each piece of sample glassware will be affixed with a self-sticking adhesive label Each label will be completed with an indelible marker to contain the following information
GEI Consultants Inc Site Name Project Number Sampling Data and Time Sample Number Samplers Initials Analysis Requested
The sample number is composed of a series of information to identify the sample as unique to the sampling point and sampling event The sample number labelled in the field and referred to on all associated documents is composed of the following
General Sample Location Project Sample Type Sample
BARN - 90393 - D2
Document Vol II SC SAP Revision 1
Date March 28 1991 Page 24a
The example sample number above indicates that a barn sample was obtained under project number 90393 and was the second dust sample collected The designations for the wipe samples will be P wooden samples W dust samples D concrete samples C and other samples O
Document Vol II SC SAP Revision 1
Date March 28 1991 Page 25
5 SAMPLING EQUIPMENT AND PROCEDURES
51 Air Monitoring
Short-term air monitoring will be performed regularly on-site during the Source Control (SC) sampling program A HNu photoionization detector (PID) and an MIE Model MINIRAM hand-held aerosol monitor (HAM) will be used for air monitoring The PID is capable of detecting total ionizable compounds (typically VOCs) and the HAM detects solid or liquid particulates in air which often take the form of dust smoke fumes and mists Each air monitoring instrument will be operated in accordance with the requirements specified in the Health and Safety Plan provided in Appendix A Readings from the PID and HAM will be recorded in the Project Field Log Book (see Appendix B) Calibration procedures for the PID (HNu Model PI-101) and the HAM (MIE Model MINIRAM) are provided in Appendix C
52 Soil Sampling
521 General
Soil sampling locations are shown on Figure 3 Table 1 lists each soil sampling location planned approximate sample depth and rationale for sample collection
Prior to sampling a surveyor registered in the State of Maine will survey the exact location of each test pit and boring location and provide a temporary stake that will function as a bench mark for horizontal and vertical control within 20 feet of each test pit and at each boring Sample locations within test pits will be by tape and compass bearing methods
Soil sampling will be performed with strict adherence to the procedures described below A list of equipment requirements for the soil sampling program is provided in Table 6 In general excavation of soil to the target depth in test pits will be performed with a backhoe for sampling to 5 feet below ground surface The backhoe and operator will be supplied by HE Sargent Inc and the operator will be equipped with Level C personnel protection (see Appendix A) A bombardier or truck-mounted drill rig operated by Northeast Diamond Drilling by personnel equipped with Level C protection will be utilized for sampling points greater than 5 feet below ground surface Soil samples collected by GEI for possible bench-scale testing will be obtained only at test pit locations Ambient air monitoring will be performed by GEI regularly while working on-site for health and safety monitoring Mobilization
Document VoL II SC SAP Revision 1
Date March 28 1991 Page 26
of equipment and transportation of materials over the site during the soil sampling program will avoid heavily contaminated transformer work areas when possible to reduce dispersing PCBs to other areas Drilling and excavating equipment will be decontaminated under the supervision of GEI prior to use at each sampling location following strict decontamination procedures described in Appendix A and below Sampling equipment will be decontaminated by GEI prior to each sampling event as described below All soil sampling operations within the site will be performed using Level C dermal and respiratory personnel protective equipment to protect against PCB-contaminated dust levels which are likely to exceed 1 mgm3 during sampling The detailed Health and Safety Plan that will be followed during soil sampling is provided in Appendix A
522 Soil Sampling Methods for Test Pits
A minimum of a two-person crew in addition to the backhoe operator or the drill rig crew will be provided by GEI during the sampling program
All soil samples will be collected from test pits by GEI with a shovel or trowel following excavation to the appropriate depth with a rubber tire backhoe as follows
1 Check the survey stakes for the proper test pit number identification and location
2 Place polyethylene sheeting on each side of the test pit for staging the excavated soils from the test pit
3 A standard rubber tire type backhoe will perform the soil excavation to the planned sampling depth All soil excavated from the test pit will be placed on the plastic sheeting adjacent to the test pit The top 2 feet of excavated soil will be cast to one side of the test pit on the sheeting and the bottom 3 feet of soil will be cast to the opposite side to avoid mixing soils with potentially significantly different levels of contamination After completion of sampling soil will be backfilled at a similar depth from which it was excavated
4 All excavation activities will be continuously observed by an engineer or geologist from GEI A test pit log form (OCONNORFL12) will be completed by GEI for each test pit performed and will include the following information
Document Vol II SC SAP Revision 0
Date January 17 1991 Page 27
Name and Location of Job Date Excavation and Test Pit Number Approximate Ground Surface Elevation at Test Pit Total Depth of Test Pit Dimensions of Test Pit Location and Depth of Soil Sample Relative to Stake Reference Method of Soil Sample Acquisition (Shovel Trowel) Volume of Soil Sample J Soil and Stratigraphic Descriptions x
Ground Water Levels (if encountered) y ^v Air Monitoring Information v Other observations Such as soil staining buried debris etc
5 At least one photograph will be taken oflta wall of each test pit from within the test pit with a scale for comparison to indicate soil layering or staining In addition one photograph shall be taken of thertesVpit from the ground surface also showing sample locations withinthe-test pit Photographs of the test pits will be marked to include site locationxjdbmumber^test pit number date and time A photograph log sheet will be maintained fampMuture reference
6 The target soil sampling elevation will be determined by GEI using a level and rod
7 Soil sampling will begin from within the test pit only after the side walls of the pit have been properly^sloped back in accordance with OSHA requirements (see Health and Safety Plan^ Appendix A) All samples collected will be identified on the test pit logazid in the field book Information about the sample including sample number^de^th voiuine and soil description will be recorded The soil sample will be colleetedTrotn an undisturbed area of the test pit floor or wall by means of scraping or digging with a stainless steel shovel or trowel The number of clean sampling utensils for each test pit shall be equal to the number of soil samples collected at the test pit Shovels or trowels used to clean sloughed material from the sampling location will not be used to collect the sample unless decontaminated before use in sampling Care will be taken to assure that the sample is taken from the actual soil unit desired mid does not include slough or scraped material from the sides of the trench The desired soil sample will be immediately placed into the sample container within the test pit A portion of the sample will be retained for screening with the Dexsil L-2000 PCB analyzer The containers will then be sealed labelled and stored in asecure area until Shipment to the laboratory
Document Vol II SC SAP Revision 1
Date March 28 1991 Page 28
8 When collecting a larger volume sample for bench-scale testing a smaller soil sample will first be collected for field screening using the Dexsil L-2000 PCB Analyzer If the analyzer indicates that the PCB concentration is within the target range the bench-scale soil sample will be collected If the Analyzer indicates that the PCB concentration is outside the target range the test pit will be expanded if necessary and another sample will be collected for PCB screening This procedure will be continued until a sample within the target range is identified The test pit will be expanded no more than 2 feet in all directions and to the maximum depth of 5 feet below ground surface If after this over-excavation the soil within the target concentration range has not been identified with the Dexsil L-2000 PCB Analyzer a new test pit location will be selected near the original test pit in an area indicated by the Remedial Investigation to contain soil contamination within the target range
9 Once the targeted PCB concentration has been indicated by field screening the desired soil sample will be collected with a clean stainless steel trowel or shovel at a sufficient quantity to fill a 5-gallon container An aliquot from the 5-gallon sample container will be collected and placed in an appropriate sample container for laboratory analysis for PCBs The 5-gallon containers will then be sealed labelled and appropriately stored in a secure area until transported off-site The laboratory samples will be sealed labelled and stored with the other soil samples awaiting shipment to the laboratory
10 Upon completion of sample collection the excavated soil material will then be backfilled into the test pit The backfilled area will be compacted to the approximate original ground elevation
11 Equipment will be decontaminated after backfilling the test pit (ie shovel trowels measuring equipment) byscrubbing and With methanol and distilled water rinses Portions of the backhoe (bucket bucket arm etc) will be decontaminated with a high-pressure steam rinse on the decontamination pad (see Appendix A)
523 Soil Sampling Methods for Borings
Selected soil samples are planned to be collected at depths greater than 5 feet below ground surface to obtain additional data on the depth of PCB contaminationexceeding cleanup standards in Transformer Work Areas Samples will be obtained using split-spoon sampling techniques within 3-inch ID hollow stem augers in test borings generally following procedures specified by American Society for Testing Materials (ASTM) D1586-84 Test borings will be performed by Northeast Diamond Drilling
Document Vol II SC SAP Revision 1
Date March 28 1991 Page 29
under the observation of an engineer or geologist from GEI The following procedures not specified in ASTM D1586-84 will be used
1 Place a polyethylene sheet on one side of the boring location for temporarily staging drilling cuttings during borehole advancement All drilling equipment shall be decontaminated with a high pressure steam rinse on the decontamination pad prior to beginning drilling
2 Advance hollow-stem augers without split-spoon sampling to a depth about 5 feet above the sampling depth specified in Table 1
3 Begin continuous split-spoon sampling with 18-inch-long samples Collect a specimen from the middle of each sample for screening with the Dexsil L-2000 PCB analyzer and the HNu photoionization detector Rinse the split-spoon sampler with methanol and distilled water rinses before each sample
4 Collect a split-spoon sample at the designated sample depth Divide the split-spoon sample vertically Place a minimum of 4 inches of sample recovered from the bottom right half of the sample into the glass sample container Seal and label the sample container as indicated in Section 4 and store the container in a cooler with ice in a secure area until shipment to the laboratory Retain the left half of the split-spoon sample for screening with the Dexsil 1^2000 PCB analyzer and the HNu photoionization detector
5 After collecting the final soil sample in the boring measure depth to ground water below ground surface using a decontaminated Solinst battery-operated water level indicator Record the time elapsed after completion of the boring when the ground water level was measured
6 Remove augers from borehole If the borehole remains open and evidence of ground water was encountered during sampling collect additional measurements of depth to ground water prior to backfilling until the ground water level appears to stabilize Note occurrence of precipitation or other events which could effect water level measurements in the project log book
7 Backfill borehole within 24 hours after completion of the boring with drill cuttings staged adjacent to the borehole If the borehole collapses and cuttings cannot be backfilled in the borehole store staged cuttings in a steel drum to be left on site Label outside of drum to indicate contents are borehole cuttings from the designated boring number and affix labelindicating PCB-contaminated materials Cuttings from more than one boring can be combined in a single drum
Document Vol II SC SAP Revision 0
Date January 17 1991 Page 30
8 Decontaminate measuring and sampling equipment with methanol and distilled water rinses Decontaminate downhole drilling equipment on the decontamination pad with a high-pressure steam rinse before starting the next boring
A log will be prepared by GEI for each boring and will include the following
information 7
Name and Location of Project
Boring Number lt Date of Boring Ground Surface Elevation x-Boring Diameter and Depth Sample Numbers and Depths Soil Screening Data Visual Soil Descriptions Water Level Measurements Air Monitoring Levels Other Observations
The boring log form is provrdedin Appendix B (OCONNORFL15)V
i
Surface Water ^^7
531 General
N
Surface water sam^les^will becollected at the locations shown in Figure 4 If water is too deep for safe aecess^with hip-waders andor access with hip waders will severely disturb sediment an inflatableboat will be used to access Surface water sampling locations
The surface water sampling program will be performed following strict adherence to the following procedures A list of the equipment requirements for surface water sampling is provided in Table 8 In general ambient air monitoring will be performed regularly while working on-site for health and safety considerations Areas of the site which have been determined by previous studies to have elevated concentrations of PCBs in soils (for example TWAs) will be avoided while traversing the site to reduce the likelihood of dispersing PCBs to other areas The depth of water at the sampling stations will be measured and the surface water elevation will be surveyed on each water body Equipment will be decontaminated prior to use at each sampling station following decontamination procedures
Document Vol II SC SAP Revision 0
Date January 17 1991 Page 31
532 Surface Water Sampling Methods
Surface water samples will be collected during the Pre-Design Study at the locations shown on Figure 4 Surface water samples will be collected during the initial stage of the Source Control sampling program prior to soil and sediment sampling An inflatable boat will be used to access surface water sampling locations if there is sufficient water depth The boat will be cleaned with methanol and distilled water rinses before sampling in each water body The surface water sampling procedures will be as follows ltX1 Determine the location of the sampling station by tape^and compass from a
temporary bench mark at the edge of the surface water body x
2 Measure the depth of water at the sampling station with a weighted tape measure x (
^ 3 Gently lower a clean Kemmerer sample^bottle to the desired depth (one-half
water depth) so as not to remove th^stoppeisprematurely V^
4 Pull out the stopper with a sharp jerk ofdhe sampler line
5 Allow the bottle to fill completelyras evidenced by the cessation of air bubbles
6 Raise the sample and capdhe nottle X x
7 Pour the sampl^fromthe bottle into the appropriate sample container The container willbesealedlabelled and stored in a secure area until shipment to the laboratory
8 Fill a beaker with water remaining in the sampler and measure specific conductance pH and temperature
9 Decontaminate the sampling apparatus measuring tape and Kemmerer sampler by scrubbing internally and externally with methanol and distilled water rinses
10 Record the following surface water sampling information in the project log book (OCONNORFL1)
Document Vol II SC SAP Revision 0
Date January 17 1991 Page 32
Date Time Total Depth of Water Location and Depth of Sample pH Conductivity Measurements Air monitoring levels detected Other observations
Sediment
541 General x
gt The locations of the sediment sampling stations are shown on Figure 4 Table 3 lists the various sampling stations and sampling methods for the sampling program Sediment sampling during the project will beperformed with strict adherence to the following procedures A list of equipment requirements for the sediment sampling program is provided in Table7 In general ambientw monitoring will be performed regularly while working on-site for health-and safetymonitoring Mobilization of equipment and materials over the sitdduring^he-sediment sampling program will follow specific routes to reduce the likelihoocKPfdispersing PCBs to other areas Equipment will be decontaminated prior to sampling at each location following strict decontamination procedures described belowy All sediment sampling operations within the site will be performed fusing level C dermal personnel protective equipment and Level D respiratory^protective equipment will be worn
v ^
542 Sediment Sampling Methods gtSN
The sediment sampling^vili be performed after collection of surface water samples and will consist of rivo primary components
1 Tube sediment smiling to provide additional data on sediment quality and to estimate the thickness of sediment
2 Dredge sediment sampling to obtain a sample for laboratory for bench-scale treatability testing
The tube sediment sampling program will be performed as follows
Document Vol II SC SAP Revision 0
Date January 17 1991 Page 33
1 Determine the sampling locations by tape and compass measurements from a temporary bench mark (reference stake) surveyed near the edge of the surface water body Access locations in interior portions of the water bodies using an inflatable rubber boat The boat will be decontaminated with methanol and distilled water rinses before use in each surface water body
2 Measure the depth of water with a weighted tape measure
3 Lower the hand tube sediment sampler to the desired ctepth Sediment entering the tube is trapped by a plastic core retainer allbyringlheunit to be retrieved a n d t h e s a m p l e r e m o v e d w i t h o u t s a m p l e l o s s X x y
4 Extract the sediment samplefrom the sampler and^immediately place the sample
into the sample container The containers ywllthen be sealed labelled and stored on ice in a cooler in a secure area until shipment to the laboratory
5 Decontaminate the sampling apparatua and measuring tape by scrubbing with methanol and distilled water rinses
vw 7 Record sediment sampling record information in the project log book
(OCONNORFL2) after collecting a sediment sample at each sampling station The information that will beuro~documenteamp includes the following
Date and Time ^ Total Depth of Water N Thickness of Sediment Location of Sample Length and Vblume^of Simple Sample Description x- Air Monitoring LevetesDeteeted Other Observations
The sediment sampling procedure for collecting samples for bench-scale treatability testing will be as follows
1 Determine the location of the dredge traverse line by tape and compass bearings from the temporarily bench mark adjacent to the surface water body
2 Pull the sediment dredge along the planned traverse with a wire line from the edge of the surface water body
Document Vol II SC SAP Revision 0
Date January 17 1991 Page 34
3 Repeat sampling until 5 gallons of sediment have been collected and placed in the 5-gallon sample container The containers will then be sealed labelled and stored in a secure area until shipment to the laboratory
4 Decontaminate the sampling apparatusand drag line by scrubbing with methanol and distilled water rinses
S6 Record the following sedimentsampling informationin die project log book after
sample collection X nXx
Date and Time X gt Total Depth of Water Location and Volume of Sample Number of Grab Samples Collected to Form Composite Volume Sample Description Air Monitoring Levels Detected x X Other Observations
Barn
5-51 General
Sampling within the barn will4gteperformed with strict adherence to the following procedures A list of equipment requirements for the barn sampling program is provided in Table 9 Areas of the Site which have been determined by previous studies to have elevatedconcentrations of PCBs in soils (for example TWAs) will be avoided during bam sampling to reduce the likelihood of dispersing PCBs to other areas within the barnXEquipment will be decontaminated prior to use at each sampling location inside thetarn following strict decontamination procedures All sampling operations withfaMhe barn will be performed with Level C personnel protective equipment due to dust levels which may to exceed 1 mgm3 during sampling (see Appendix A) A detailed Health and Safety Plan which will be followed during barn sampling is provided in Appendix A
552 Barn Sampling Methods
If power is not available on-site a gasoline-powered generator capable of supplying electricity for lighting and sampling equipment will be positioned outside the fenced area of the site prior to sampling Extension cords will be run to the barn (avoiding TWAI) for power supply In order to reduce the potential for cross-contamination due to dust generation the sampling of different matrices will proceed in the
Document Vol II SC SAP Revision 0
Date January 17 1991 Page 35
following sequence 1) wipe samplingof non-porous debris 2)wood sampling of barn walls 3) dust sampling from top of floor slab 4) concrete sampling of floor slab Areas to be sampled will be chosen based on the presence of apparent oil-type staining and to obtainan even distributionof representative samples with no apparent staining
Following sampling at each location a self-sticking adhesive label marked with the sample number will be placed at the sample location for future reference Each label will then be located by taping relative to a reference point Established at the western corner of the barn (W-Z corner) as shown in Figure 5 Walls W and Z will be used as orthogonal axes similar to a typical coordinate system For samples collected above the concrete floor slab (eg wipe and wooden wall samples the height above the floor slab will also be recorded All samples willbe collected between the floor slab and a maximum height of seven feet All location measurements and a brief description of the area sampled will be recorded on the Barn Sampling Form (OCONNORFL13) provided in Appendix B Imaddition a photograph of each sampling location will be taken and^ recordedy on the Photograph Log (OCONNORFL6) Detailed procedures-for each type of sample to be collected during the barn sampling program follows
lt Win Samnlino N
1 Identify the non-porous item within the barn selected to be sampled which has an area of at least 100 cm2 which maybe wiped Examples include sheet metal fiberglass cleanly painted wooden surfaces glass etc
2 Place a decontaminated stainless steel or plastic 100 cm2 (10 cm X 10 cm) template at t^desired sampling location
Note For smaller areas such as on electric meters use the quarter template of 25 cm2 area and make four wipes to compose one sample
3 Remove the laboratory-supplied gauze from within the glassware with stainless steel forceps The gauze should be moist with solvent as prepared by the laboratory
4 While holding the appropriate template in place thoroughly swab the 100 cm2 area with the gauze using forceps or bufyl rubber gloves Inspect the area to ensure that all loose dust has been wiped with the Alter paper
Document Vol II SC SAP Revision 0
Date January 17 1991 Page 36
5 Fold the gauze over to ensure that the dust is contained on the inside of the gauze Place in the appropriate sample container seal label and store in a secure area until shipment to the laboratory
6 Decontaminate the forceps and templates by scrubbing with methanol rinsing with distilled water and wiping dry with paper towels
7 Label the sample location photograph and complete^he Barn Sampling Form
(see Appendix B) and other necessary documentation after each sample is
c o l l e c t e d lt X x x y x x
xWooden Wall Sampling X
1 Select the sampling area of at least 100 cm2 on the inside wall of the barn and secure a decontaminated 100cm2 template at the location Place a steel pan below the sampling area to catch sawdust ancLwood chips
2 Using an electric drill equipped withra-one-ineh diameter wood-boring bit drill out wood within the template area to arnaximum depth of 12 inch
3 Place sawdust and wood chips man appropriate sample container seal label and store in a secure area untiLsRipinent to the laboratory
4 Decontaminate the drilTbit and pan by scrubbing with methanol rinsing with distilled water and jwiping dry with paper towels
5 Label the samplelocatidn photograph and complete the Barn Sampling Form (see Appendix^)
Dust on Floor Slab Sampling
1 Select an area to sample such that at least 100 grams of dust or soil may be obtained This will vary depending on thickness of the dust or soil
2 Using a disposable nylon brush or stainlesssteel trowel brush or scrape dustsoil toward the center of the area chosen minimizing the creation of airborne dust
3 After the dustsoil has been centralized use a flat stainless steel trowel to collect the material and place in laboratory-supplied glassware seal and label
Document Vol II SC SAP Revision 0
Date January 17 1991 Page 37
4 Dispose of the nylon brush with other containerized PCB-waste materials and decontaminate the stainless steel trowelsby scrubbingwith methanol rinsingwith distilled water and wiping dry with paper towels
5 Label the sample location photograph and complete the Barn Sampling Form
Concrete Slab Sampling
1 Identify three areas of visible staining and one area of no visible staining on the floor slab Using a disposable nylon brush carefulfy brushxaway loose dust and soil from an approximately 1-square-foot area
2 Place a pre-cut 10-square-foot sheet of clean polyethylene sheeting with a 1shysquare foot hole cut in the center over thevsampling area and secure in place with duct tape Place a decontaminated lOO cmr template in the center where t h e s a m p l e i s t o b e o b t a i n e d X v N
3 Using an electric hammer drill eqi^pedwitlra^ungsten-carbide mortar bit drill the four corners established by the tempfate^to a maximum depth of 12 inch
4 Remove the template ancLdrilL the remaining 100 cm2 within the established square to a maximum dep^fof l2Jnch
-vFollowing drilling brush the concrete chips and dust from the plastic sheeting toward the center otlhe sarhplihggtarea Collect sample with a clean disposable nylon brush andtrowel and place in an appropriate sample container seal label and store in aSecure area until shipment to the laboratory
6 Dispose of the nylon oriish with other containerized PCB-contaminated waste materials and decontaminate the stainless steel trowel and template by scrubbing with methanol rinsing with distilled water and wiping dry with paper towels
7 Remove and dispose of the polyethylene sheeting and duct tape in an appropriately marked barrel that will remain on the site with other sampling waste disposal materials Label the samplinglocation photograph and complete the Barn Sampling Form
Document Vol II SC SAP Revision 0
Date January 17 1991 Page 38
6 SAMPLE HANDLING AND ANALYSIS
61 General
GEI has established a program of sample chain-of-custody that is followed during sample handling activities in both field and laboratory operations Thisvprogram is designed to assure that each sample is accounted for at all times To accomplish this objective sample container labels sampling records chain-of-custody records sample assignment forms shipping airbill records and laboratory receipt sheets must be completed by the appropriate sampling and laboratory personnel ^ y gt
62 Sample Labeling and Documentation gt
The plastic 5-gallon containers for bench-scale testingsWilKbe cleaned with methanol and distilled water rinses prior to use All other sample containers^will be pre-cleaned by EPA-approved methods and provided by the laboratory^ A summary of the sample containers and preservation requirements for each of thamp^analytieal parameters to be measured is shown in Table 10 Each piece of sample gl^sware^will be affixed with a self-sticking adhesive label Each label will contain the information described in Sections 4 and 5 of this document ^
To further document the samplingprogr^mand Sample handling procedures the project log book (OCONNORFL1) will containinformation regarding the activities on-site and sample handling In addition photographs of each type of field procedure will be taken The photographs will be representative of thetechniques employed throughout the sampling program A record ofeach photograph Will be made on the Photograph Log (OCONNORFL6) as stiown 4i^Appendix B
63 Chain-of-CustodySample^Assignment
Chain-of-custody will be maintained at all times as described in more detail in the Quality Assurance Project Plan (QAPP) A copy of the chain-of-custody form (OCONNORFL9) to be used is provided in Appendix B
In general the chain-of-custody record must be used such that it includes the following information
Document Vol II SC SAP Revision 0
Date January 17 1991 Page 39
Project name and number Names of the sampler(s) and person shipping the samples Station number or well identification Date and time the samples were collected Composited or grab sample designation Sample number (eg 1GU-90393-MW101A) Total number of containers Analysis requested Date and time the samples were delivered for shipping Names of those responsible for receiving the sampled at the laboratory
Prior to shipment of the samples a sample assignment form will be completed (see OCONNORFLIO in Appendix B) The sample assignmenrform will provide the contract laboratory sufficient information to process the samples and perform the appropriate analysis
The chain-of-custody record and sample assignment fornr will both be completed in duplicate in the field through the use of carbon paperT The original copy of the forms will be enclosed in a plastic bag and placed in the coolersWith the samples for shipment to the laboratory The carbon copy of the forms will be retained by GEL
VSoil samples for bench-scale testing ynH be-stored on site in a locked storage shed until samples are selected for the bench-scale7testing^ This decision will be made after receipt of the laboratory PCB analyses results and approval of the Source Control Work Plan by the EPA Soil samples not usecLfor bench-scale testing will remain in the locked storage shed and will be included with-other soil for treatment during the Remedial Action
lt v 64 Sample Shipments
Sample containers are generally packed in coolers for shipment Prior to packing organic analysis samples will be placed in plastic bags Bottles are to be packed tightly so that no motion is possible Styrofoam vermiculite and bubble pack are suitable for most instances Ice Will be placed in sealed plastic bags or ice packs in order to keep samples at 4degC at all times Samples will be protected against freezing during cold weather The original chain-of-custody and sample assignment forms will be sealed in plastic bags and placed in the cooler with the samples The cooler will be closed and a signed self-sticking label with the words Custody Seal will placed between the body of the cooler and the cover The cover will then be sealed with clear tape Samples will be shipped so that they are received by the laboratory no later than 60 hours from the time of sample collection
Document Vol II SC SAP Revision 0
Date January 17 1991 Page 40
All shipping of samples will be done through Federal Express or equivalent overnight delivery service Samples will be shipped in accordance with Department of Transportation (DOT) regulations If prompt arrival of the samples cannot be guaranteed the samplers will be responsible for proper storage of the samples until adequate transportation arrangements can be made The laboratory will be notified prior to shipment to arrange for receiving the samples and to prepare for the analyses requested Based on the low concentrations of chemicals detected during previous studies theSamples will be classified as environmental samples The air bill for the samples will speeiiythat the contents of the cooler are environmental or hazardoussamples as appropriated When samples are received by the laboratory they will notify the Task Manager of theccondition of the samples
H craTrsi
TABLE 1 - SOIL SAMPLING SCHEDULE Field Sampling Plan OConnor Co Site Augusta Maine
DEPTH APPROXIMATE BELOW ANTICIPATED
SAMPLE NUMBER SAMPLE GROUND PCS GENERAL LOCATION OF ELEVATION SURFACE CONCENTRATION SOIL
ID SAMPLES (MSL) (PPm) TYPE COMMENTS
TP1 2175 25 ND ClaySandy Till Confirm contours 215 35 ND
TP2 217 15 50 ClaySandy Till Confirm contours TP3 212 ND Siltv Clav Confirm horizontal extent toward marsh TP4 211 5-50 Clav Obtain bench scale 20-50 ppm
TP5 213 50-500 Clay Confirm lateral extent
TP6 215 15 5-50 Fill Obtain bench test sample In 1-10 ppm
TP7 210 35 0-5 Siltv Fine Sand Confirm vertical extent in drainage area
217 3 0-5 FillClay Confirm contours TP8 219 1 0-5 TP9 207 35 0-5 Siltv Fine Sand Confirm vertical extent In drainage area
TP10 1175 15 50-5000 Fill Bench scale test sample 50 to 500 ppm
TP11 218 0-5 SandClay Confirm horizontal extent toward marsh
TP12 218 0-5 SandPay Confirm horizontal extent toward marsh
TP13 221 5-50 Clav Bench-scale test sample 10-20 ppm
TP14 206 0-5 Gray Silty Clay Confirm vertical extent
TP15 200 0-5 Gray Silty Clay Confirm vertical extent
TP16 2185 15 5-50 Clay Bench-scale test sample 1-10 ppm
228 4 TP17 230 2 Confirm contouring in north end of site
231 4 TP18 233 2 Confirm contourtng in north end of site
236 4 TP19 238 2 Confirm contouring in north end Of site
Project 90393 GEI Consultants Inc Page 1 of 2 March 28 1991
SAMPLE NUMBER LOCATION OF
SAMPLES
TP20 TP21 TP22 TP23
TP24 TP25
B1
B2
1 B3 2
B4
B5
ND = Not Detected
TABLE 1
APPROXIMATE SAMPLE
ELEVATION MSLJ
231 233
2275 237 237 235 236 222 210 215 210 215
215 220
218 220 220 222
- SOIL SAMPLING SCHEDULE Field Sampling Plan OConnor Co Site Augusta Maine
DHTH BELOW
GROUND SURFACE
4 2
15
2 1
8 3 8 3
12 6
8 6 6 4
ANTICIPATED PC8
CONCENTRATION
ND ND 0-5
500-5000 5-50
50-5000 0-5
50-500
0-5 50-500
0-5 0-5 0-5 0-5
GENERAL SOIL TYPE
Clavev Silt Silty Clay
Clay
Till or Clay
Till or Clay
Gray Silt
Gray Clavev Silt
Gray Clayey Silt
i
Confirm contouring in north end of site Confirm contours Confirm contours Confirm contours
Confirm contours Bench scale sample 50-500 ppm
Confirm contouring and vertical extent
Confirm Contouring and vertical extent
Confirm contours and vertical extent
Confirm contours and vertical extent
Confirm contours
Project 90393 GEI Consultants Inc Page 2 of 2 March 28 1991
TABLE 2 SOIL ANALYSIS PROGRAM Field Sampling Plan OConnor Co Site Augusta Maine
Sample Depth
Sample Location ID
SoB Sample Number
(ft below ground surface) Lead cPAHs PCBs
pH TOC CEC
Anatyticsd Level IV
TEST PITS TP1 SS1 TP2 SS1 15
SS2 35 TP3 SS1 TP4 SSI
SS2 TP5 SSI TP6 SS1 15
SS2 15 TP7 SS2 35 TP8 SSI
SS2 TP9 SSI 35
replicate of SS2 SSI
TP10 SS1 15 SS2 15
TP11 SSI TP12 SSI TP13 SS1
SS2 TP14 SS1 TP15 SS1
replicate of SS2 SS1
TP16 551 15 552 15
TP17 551 552
TP18 551 552
TP19 551 552
TP20 551 552
TP21 SS1 15 TP22 SS1
Project 90393 GEI Consultants Inc Page 1 of 2 March 281991
TABLE 2 SOIL ANALYSIS PROGRAM Field Sampling Plan OConnor Co Site Augusta Maine
Sample Depth
Sample Location ID
SoB Sample Number
(ft below ground surface) Lead cPAHs PCBs
pHTOC CEC
Analytical Level IV
Bench Scale
Sample
replicate of SS2 SS1
TP23 SS1 TP24 SS1
SS2 TP25 SSI
SS2 BORINGS
B1 SS1 SS2
B2 SS1 SS2
B3 SS1 6 replicate of
SS2 SS1 SS3 12
B4 551 552
B5 551 552
QUALITY CONTROL TP26-TP29
(trip blank) SS1-SS4 TP30-TP33 (shovel or
hand trowel SS1-SS4 blank)
TP34-TP37 (split-spoon
blank) SS1-SS4 TOTAL
ANALYSES 40 40 64 15 12
TOC - Total Oraanic Carbon CEC - Cation Exchange Capacity
Will be designated to the laboratory as matrix spikematrix spike duplicate
Additional trip blanks may be needed to ensure one trip blank per cooler
Project 90393 GEI Consultants Inc Page 2 of 2 March 281991
TABLE 3 SEDIMENT ANALYSIS PROGRAM Field Sampling Plan OConnor Company Site Augusta Maine
PH Bench Sample TOC Analytical Scale
Sample Location Number Lead cPAHs PCBs CEC Level IV Sample
Surface Water Body
SED1
SED2
SED3Upland Marsh (UM) SED4
SED5
SED6
SED1
SED2Upper Lagoon (UL)
SED3
SED4
Lower Lagoon (LL) SED1
SED2
SED3
SED7 (trip blank)
SED8Quality Control (dredge
blank)
SED9 (tube
samples blank)
Total Analyses 11 11 16
TOC - Total Organic Carbon CEC - Cation Exchange Capacity
UL SED2 is a replicate sample of UL SED1
Will be designated to the laboratory as matrix spikematrix spike duplicate
Additional trip blanks may be needed to ensure one trip blank per cooler
Project 90393 GEI Consultants Inc March 281991
TABLE 4 - SURFACE WATER ANALYSIS PROGRAM Field Sampling Plan OConnor Co Site Augusta Maine
SAMPLE SAMPLE LOCATION NUMBER Lead Aluminum PCBs
Upland SW1 X X X Marsh (UM) SW2 X X X
Upper SW1 X X X Lagoon (UL) SW2 X X X
SW3 X X X
Lower SW1 X X X Lagoon (LL) SW2 X X X
Quality Control Samples
Trip Blank SW4
Sampler Blank SW5
TOTAL ANALYSES
TSD - Total Suspended Solids
SW2 is a duplicate of SW1
Will be designated to the laboratory as matrix spikematrix spike duplicate
Additional trip blanks may be needed to ensure one trip blank per cooler
Project 90393 GEI Consultants Inc Page 1 of 1 March 28 1991
TABLE 5 - BARN SAMPLING ANALYSIS PROGRAM Field Sampling Plan OConnor Co Site Augusta Maine
SAMPLE MATRIX PCBS CPAHS Lead
Analytical Level IV
Wipe samples PTB (trip blank) PEB (equipment blank)
12 3 3
Wooden wall samples 10 10 10
Dustsoil on floor slab
Concrete slab
Total Analyses 36 18 18
Additional trip blanks may be needed to ensure one trip blank per cooler
One sample will be designated to the laboratory as a matrix spikematrix spike duplicate
Project 90393 GEI Consultants Inc Page 1 of 1 March 281991
TABLE 6 - SOIL SAMPLING EQUIPMENT REQUIREMENTS Field Sampling Plan OConnor Co Site Augusta Maine
Safety Equipment (Level C - Dermal)
Health and Safety Plan (copy) Portable Photoionization Detector (HNu) Hand-held Aerosol Monitor (HAM) Disposable Tyvek Coveralls Tyvek Hoods Duct Tape Safety Goggles Safety Boots Surgical Gloves Butyl Sampling Gloves n gt Rubber Boots or DisposableBooties Hard Hats (when near qverhead objects)
Safety Equipment (Level C - Respiratory)
Sampling and Measuring Equipment
Other
Full-face Respirators Combined Organic Vapor and
High-efficientcy particulate Cartridges Dust Prefilters
Level and Rod Measuring^Tape Stainless -SteeLShovels Stainless Stee^T rowels 165-foot Measuring Tape Methanol V
Distilled Water Paper Towels
SafopltngjSlassware (See Table 10) xCo6lers with Ice or Ice Pack
Clear Plastic Tape Re-sealable Plastic Bags
Gallon Drums
ite Maps Project Log Books Marking Pens Camera Photograph Log Forms Test Pit Log Forms Boring Log Forms Chain-of-Custody Forms Sample Assignment Forms Equipment Calibration Logs Extra Bottle Labels Spare AA Batteries for Meters Blank Federal Express Airbills
Project 90393 GEI Consultants Inc Page 1 of 1 January 171991
TABLE 7 - SEDIMENT SAMPLING EQUIPMENT REQUIREMENTS Field Sampling Plan OConnor Co Site Augusta Maine
Safety Equipment (Level C - Dermal)
Safety Equipment (Level C - Respiratory)
Sampling and Measuring Equipment
Other
GEI Consultants Inc
Health and Safety Plan (copy) Portable Photoionization Detector (HNu) Hand-held Aerosol Monitor (HAM) Disposable Tyvek Coveralls Tyvek Hoods Duct Tape Floatation Vest Inflatable Boat Safety Goggles Safety Boots Surgical Gloves Butyl Sampling Gloves Rubber Boots or Disposable obties Hard Hats (when near overheackobjepts)
V Full-face Respirators Combined Organic Vaporand
High-efficiencyHPartjculate Cartridges Dust Prefilters
Level andRod Measuring Tapp 165-foot MPasuririgTape Methanol V Distilled Water jper tpwels V
SjE(mplinsect~Glassware (See Table 10) Cdolbrs wlthjbe or Ice Pack
Clear Plastic Tape Re-sealable Plastic Bags
-Galloh Drums fghted Measuring Tape e Sediment Sampler dge Sediment Sampler
Site Maps Project Log Books Marking Pens Camera Photograph Log Forms Chain-of-Custody Forms Sample Assignment Forms Equipment Calibration Logs Extra Bottle Labels Spare AA Batteries for Meters Blank Federal Express Airbills
Project 90393 Page 1 of 1 January 17 1991
TABLE 8 - SURFACE WATER SAMPLING EQUIPMENT REQUIREMENTS Field Sampling Plan OConnor Co Site Augusta Maine
Safety Equipment (Level C - Dermal)
Safety Equipment (Level C - Respiratory)
Sampling and Measuring Equipment
Health and Safety Plan (copy) Portable Photoionization Detector (HNu) Hand-held Aerosol Monitor (HAM) Disposable Tyvek Coveralls Floatation Vest Inflatable Boat Tyvek Hoods Duct Tape Safety Goggles Safety Boots Surgical Gloves Butyl Sampling Gloves Rubber Boots or Disposable Booties Hard Hats (when nearOverhead objects)
w Full-face Respirators Combined OrganicVaporand
High-efficiency Particulate Cartridges Dust Pi
Level and Rod
Measuring Tape M3amp-foot Measuring Tape JsopropyhAlcohol Mbthanol DistlHed Water PaperTowels Sampling Glassware (See Table 6)
oolers with Ice or Ice Pack tear Plastic Tape
Re-sealable Plastic Bags 55-Gallon Drums Weighted Measuring Tape Kenmerer Sampler Disposable 045 Micron Field Filters Pressure Pump for Field Filtering pH Meter with Temperature Probe Cole-Parmer pH-40 70 Calibration Solutions Cole-Parmer 1413 Micromhoscm Calibration Solution
Project 90393 GEI Consultants Inc Page 1 of 2 January 171991
TABLE 8 - SURFACE WATER SAMPLING EQUIPMENT REQUIREMENTS Field Sampling Plan OConnor Co Site Augusta Maine
Other Site Maps Project Log Books Marking Pens Camera Photograph Log Forms Chain-of-Custody Forms Sample Assignment Forms Equipment Calibration Logs lt Extra Bottle Labels Spare AA Batteries forM6ters Blank Federal Express Airbills Xy
Project 90393 GEI Consultants Inc Page 2 of 2 January 171991
TABLE 9 - BARN SAMPLING EQUIPMENT REQUIREMENTS Field Sampling Plan OConnor Co Site Augusta Maine
Safety Equipment (Level C - Dermal)
Safety Equipment (Level C - Respiratory)
Sampling and Measuring Equipment
Other
Health and Safety Plan (copy) Portable Photoionization Detector (HNu) Hand-held Aerosol Monitor (HAM) Disposable Tyvek Coveralls Floatation Vest Tyvek Hoods Duct Tape Safety Goggles Safety Boots Surgical Gloves Butyl Sampling Gloves Rubber Boots or Disposable Bboties Hard Hats (when near overheackpbjects)
Full-face Respirators Combined OrganicVapor and
High-efficiencyParticutale Cartridges Dust Prefilters
Gas powered electrfcgenerator 5 gallonsgaspline 350 feetNplectricahextfnsion cord Self-standin^work-larnps (200 watts minimum) Electric 38drilkwith two 1-inch wood boring bits ElectricBoschhammer drillwtungsten-carbidemortar bit Hpound-cut polyethylene sheeting and duct tape
Steel blaRing sheet X^vdiSpdsabfe nylon brushes
Stainless steel trowels Three 100 cm templates andone 25 cm template Forceps Peper towels Silf-sticking adhesive labels and push pins
Site Maps Project Log Books Marking Pens Camera Photograph Log Forms Bam Sampling Forms Chain-of-Custody Forms Sample Assignment Forms Equipment Calibration Logs Extra Bottle Labels Spare AA Batteries for Meters Blank Federal Express Airbills
Project 90393 GEI Consultants Inc Page 1 of 1 January 171991
TABLE 10 - SAMPLE CONTAINERS AND PRESERVATION REQUIREMENTS Field Sampling Plan OConnor Co Site Augusta Maine
Holding Media Parameter Container Preservation Time
PCBs 8 oz glass jar 4deg C 14 days-with Teflon- extraction lined lid 40 days shy
analysis
cPAHs 8 oz glass jar 4deg C 14 days-SOIL with Teflon- extractionSEDIMENT lined lid 40 days shyWOOD
analysisCONCRETE AND WIPE Lead 8 oz glass jar 4deg C 6 months SAMPLES with Teflon-
lined lid
Bench-scale 5 gallon high NA NA testing density
polyethylene bucket
PCBs Two 1-liter 4deg C 7 days shyamber glass extraction bottles 40 days shy
SURFACE analysis WATER
Lead 500mi HN03 4deg C 6 monthsSAMPLES polyethylene to pH bottle lt20
Aluminum 500ml HN03 4deg C 6 months polyethylene to pH bottle lt20
NOTE All standard sample containers will be l-CHEM equivalent bottles supplied by the laboratory The 5-gallon polyethylene bucket will be rinsed with methanol and distilled water prior to use
NA = Not applicable
Project 90393 GEI Consultants Inc March 28 1991
gt 1I L )
i bullbullbull j bullgti sil- j-V
poundP
A C
jfr35
QUAOnANQLE LOCATIONTOOU9 POND MAINEJI881)N4416-W37-307B
bull4000 FEET
Central Maine Power Company Pre-Design Work Plans SITE Augusta Maine OConnor Site LOCATIONFrom EC Jordon Co RIFS
Augusta Maine MAPReport dated June 1989
C D Project 90393 January 1991 Fig 1 G E I C o n s u l t a n t s I n c
b-r
p pp l-I 0 x foooo^ _^_ZZZ~~r^-^
UpoundEtpound 1IMA iRAMWOfMII NOW AM A OAAMAG IWAllrj WWEOfOHAMMS MHICUOn Central Maine Power Company Pre-Design Work Plans LOCAIION Oh
in cuelt^KL2 Augusta Maine OConnor Site TRANSFORMER
Scale 1 inch = 142 feet Augusta Maine WORK AREAS AND SWALESFrom EC Jordon Co RIFS
Report dated June 1989 C D G E I C o n s u l t a n t s I n c Prnjprf QfttM January 1QQ1 Fifl 0
~- bull middot bull -middot r middot~middotmiddotmiddotIll middotmiddot t~r
I bull Imiddot
bull bull1 middotmiddot middotir-------~-------middot ~ bull middot middot-------------------middotmiddot ~ middotmiddotmiddotamiddot A middotimiddot r bull amiddot A I bull TWA I tmiddot LOW AREA A NO~TH) SOUTH) I
v
A middot
rmiddot---middot---middot~middot---- ----middot~middot [WEST) [W[ST) (EASr) middot I
middot middot middotmiddot AmiddotA D-D 220 SCRAP ARf-A 201 -
bull - I
nor 140 TWA I 2bull0
1 bull middotbullmiddot1~-~~ L~W AR1-A ---- middot-~ l0 ~
i r bull I -$-~middot
0 - )1 _~ ~ middot1~oi I EEltY
J I ~2J~ bullbull
bullf()omiddot middotmiddot middot~ bull0 2 i- 0
11bull I lo bull ~middotmiddotmiddot~middot ~ ~--middotmiddot~middotbull ~-8~-i~~jplusmny~f~=ii1 - ~ bull ___ I I- _5 middot~bull-tmiddoti~middot~ N ~ bullbull ~ i I o middot TP19 gt - ~ ~ Jmiddot ~I middot~middot~I bullJUI 215 middot 215~-I e bull TP23 if 21~ ~ middot middot middot_ ------ ~middot - L middot~ ~ ~~ 1 i i
235 middotQ1middot1middotmiddot ~ bullbull ~~middot~middot- Lil middot~ _~ middot f bulllto --- z middotmiddot middot
middotr
-lt lt -middot I ~ middot ~ I
1 c ~ __ ) bull bull bullmiddot bull --middot Q
middot bull bullbull - 1middotmiddot - bullbull ~middots middot- uPPfR 1middotmiddot T LAGOON 1middot middot -$- middot middotmiddotpoundpound~middotmiddotmiddotmiddotmiddot bull =lt middot
~ middot ~~ iP22 gt middotgt
w
210 I
-
------_7___ 210 1 _
w_ +-
middot middot w--~ J210 middot i~30 -- middot_
1 TP18 bull middotmiddotI middot~ ----shy middot-middotmiddot
middot~ I j
middot- t - I 1 I BEDROCK 11 I
1
lmiddotmiddotomiddotmiddotmiddotmiddotmiddot middot middot middot =middot _middotmiddot middotmiddotmiddotmiddot 1 I rI Th 205 bull 205
bull -middotmiddot bull_ 1 225 22 middot bullbullbull fltISmiddot middot middot ~ ~middot f4tmiddotmiddotmiddot I J205 1bull
middot OOTR10U1t0N craquo-middotPC~middot~oN~A~ SEL11r~~~TS H LO~ AR~A ------------------------------------------------bull1 BASEO IN PART ON QBSERVATION Of FILL PlACEMENTmiddot bullmiddot E~middot-1middot bull bullbullbull middotmiddot Q - _
_
-1 I
fmiddot bull bull
-middotmiddot I r-middot shy c bull
I omiddotmiddot
r- middotmiddotI ~I
1 middot1 r bull bullf-Sf1 TWA I middotbull middot ~ i1 bull bull middot (EASfJbullI middot-----bullI (WEST) middotI bull I 1I cmiddot middot~ I~ ~ I bull bullbullbullI 1bullbull
(EAST) - bull middot- - I
bull bull r ~middot l
~
~30 i
2io bull
middot) Ibullbull
I
- J l TPl7 bull- f ~j -middot middotmiddotmiddotmiddot I 1 J middotmiddot1
middot~ ~ bull middotimiddotmiddotch bull bull_ t-ROAOI cli middot bull ~ middot1middot
225
I bull ILmiddot i~A--middot1middot 225 bull
1225 middot I ~ CENTRAL DRAINAGE middotmiddotmiddot--Q-middot --middot _ --middot
~ I -- -shy A middot
bull B-B --- m
- _ - middoti-- 10bull ~ m
g r
220 220 I ~
I middot _
l MI r ~ I
middot middot 1bull bull1 111
I rbull bull
middot
bull bull l
215 BEOROC~ 215
bull I bull middot - -
) l
-middotshy- bull Il
I 5 -middot middot middottc bull bull gt f bull 110 1~ w 210 210 ~ middotmiddotmiddotmiddotmiddot middot-middot -
( bull
middotlt bull [ I
bull G -
-middot-
middot middotmiddot bull ~middot-middot-- -middot- t~middotmiddotmiddotmiddotmiddotmiddot middotmiddot middot L -middot 1 -middot~ bull bull - middotmiddot L middot-~ _ bull f middot middot1 I ~ l
205 bull bull ~middot JO~cmiddotimiddotmiddotmiddotmiddot middot--middotmiddotmiddot1 _~ middotmiddotmiddotmiddotmiddot middotmiddotmiddotmiddotmiddotmiddot bullI bull middot -middotmiddotmiddotmiddotmiddotmiddotg
bull -$-middotmiddotmiddot middot~middot iii~~- ~0 i TB-20 SUBSURFACE BORING NUMBER bull bull bull TPmiddot 105 TEST PIT NUMBER
middot
bull1
bull I TP16 middotmiddotmiddotmiddotmiddot~ Q G) ) mmiddot i GROUND SURFACEmiddot bull 1bull 1middot bull I i ~ u o I bullbullbull I~ bullbullbull bullbullbullbullbullbullbullbullbullbullbullbull bullbullbullbullbullbullbullbullbullbull bull middot bull
ll bull bullbullbull middotmiddotoz bull I 250 CONCENTRATION OF PCBs IN SCREENED SAMPLE lPPm) r lt bull bull I
middot CONCENTRATION CONTOUR middot middot bull - -- CROSS-SECTIONS CONTOURED AT 5ppm 50ppm ANO 500 ppm TOTAL PCBs
middotbull middotmiddot c- I bull ~~ ND NOT DElECTED -middot ~ I
middotmiddot middot--middot~ middot sect t I middot UNDERLINED VALUES ARE CLP RESULTS (ppm)bull
middot -____ bull ~~ - -- I
bull bull middot -middot middot bull Ibullbull middot ~- middot --- LEGEND (ISOPACH MAP) bull lmiddot I l
I
-middot 1 middot I
bull middot ~SUBSURFACE EJORING LOCATION middot
-t middot ( 10766 - 10 10186) middot middot J BORING NUMBER -2 middot THICKNESS OF SOIL CONTAINING PCBs IN EXCESS OF 5 ppm
I
bull ~ middot
LOW AREA BORING LOCTION (107187)
- I j
I
bull BORING LETTER - ~ THlC~NESS OF SOIL C011TAINING PCBs IN EXCESS oF Sppm middot middot middot middottmiddot=plusmn+ TEStPIT LOCATION 1 bull bull bullbullbull i 0~ Q G) I -$ ELECTRICAL EQUIPMENT SAMPLE POINl middot middot -middot bull 1-1 I ~ bull
If bull bull ) bullbull bullbullbullbullbullbullbullbullbullbull f4( middot~01 l - bullmiddotomiddot
middot - ( ~-~ SURFICIAL EXTENT OF SOILS CONTAINING gtSppm PCBs bull middot (
bull __ ~ -middot middot_ middotmiddotmiddotmiddotmiddotmiddotmiddotmiddot _ - middotmiddot --- bull bull -bull - ISOPACH LINE ILLUSTRATING THICKNESS OF SOILS CONTAMINATED BY middot middot middot -middot~middotmiddotbullmiddotmiddotmiddot middotmiddotmiddot bullbull middot middot bull middotmiddot middot 8 -- bull _CONTOURS [)RAWN _-- ~ _l bull abull lO_fEF lran_~OUllCStRF~CI gt~~~~ ~~~~bull
I bull middot T o o bull bull middot middotmiddot
) NOTES 1 -middot -middot bull
I1 THE ISOPACH CONTOURS WEREDRAWN TO DENOTE THE THICKNESS OF SOIL ~ Q iP1 middot 0 bullbull 5 bull GEi BORING LOCATIONS middotMEASURED FROM THE SURFACE CONTAMINATED BY GREATER THAN 5ppm TOTAL PCBs bullbull bull bull I THE VALUE OF 5ppm WAS CHOSEN ARBITRARILY AND IS NOT INTENDED TO REPRESENT
middot bullv middot-- - l A SITE-SPECIFIC CLEAN-UP LEVEJ GEi TEST PIT LOCATIONS
2 CRO~S-SECTIONS ILLUSTRAt EXTENT OF PCB CONTAMINATION WITH DEPTH I middot- -f j bull I
_ veRTt6l1 EXAGGEP1r10M m c~oss sicT1c~S 1s 61 middot
bull
middot
I middotshy1
middot J~uJt bull bull i ~ ~ _ - middot j
1 ~ middot bull bull bull middotmiddot l a )
0 gt bullmiddot -~I middotbull I 0 middot r middot- bull ibull I
bull
_ _ I I ~
middot I
bull bull
bull middot~r
- -middot- - -
bullI l middotI middot I bull r f I I
~_ Igt bull
bull f middot
t bull middot bullbull 8 _
~ 7 I r 9
-middot- bull bull I I ~
middot 1
bull ____________________________ ___ _ bull I
bullI 1 bull middot -~ bullr
---------r- -- -- middot~-~~~~middot--middot ~ f middoti middot
bull t ~
bull
middot j
1
-------- -------- ---------------------------- ti 1
bull ~---middot ------middot ~---middotmiddotmiddotmiddot-middot--middot-middot~---middot-- ___~------- middotmiddotmiddot middot middotrbull ~ ~--~~-~middot-~ 1 middotmiddotmiddot I
middot bull middot4J middotmiddot 1 middot
middotI 1
I
bull
bull
middot ~ middotimiddot 1 bull j-1 ~ bullbull bull I bull i ~
APPROXIMATE SCALE I DESIGNED
~ BY
bullIbull Imiddot bull SOURCEmiddot EC JORDON CO RlFS middot bull Central Maine Power Company Pre-Design Work Plans SOIL I ~ t
middot
middot bullmiddot I ~middotmiddot ( bull bull REPORT DATED JUNE 1989 bullL bullr middotmiddot bull ~I middotmiddot DRAWN BY I I bull 1 r bull ~ middotmiddot middot
bull r shy~middot r i Augusta Maine OConnor Site bull SAMPLING I Imiddot 0 middot bull
bullI
bull bull
r bull 40 80
J 1bullmiddot
CHECKED BY Augusta Maine middotLOCATIONS
h cf I ~ 1bull rmiddot_
1 Inch =~Feet t--~------~---_middotmiddot~ I ~middot bullgtIbull
) i _- DATE January1991 middot middot middotmiddotmiddot tbull middot1middotmiddot APPROVED BY GE I Consultants Inc
middot
middotmiddot middot t---P-R_O_J-EC_T_9_0_39-3-----4-S-H-E-ETmiddotmiddotOfFbull t DATE REVISION BYmiddotmiddot J middotFlg3 middot
1 nuovN( POST middot 1 Nl6~1 middot bullbull Ibull Ibull bull bull lomiddot bullbull -
I
I
I
------------ -
) bull middot i bull I
~ f I middot1 bull ~I r
I
middot
-middot- CJ middotYmiddotmiddot I
C bull
middot
I middot I
middot -shy bull bull middotmiddot~
J middot _ bull y
Ibull bull
~ bull ~~ r I bull middot bull
middot bull
I ~ I I ( I bull
JI t
- I
J l I
-~ 1 I
bull j middot middot~ ~ middot) __-_ bull i
Ibull I lt bull
middotmiddotmiddot
gtImiddotmiddot
I
I bull
middotmiddotmiddotmiddot_v -
~ bull J i 1 bullbull
r 1 I ~ middotbull middotbull
I I I l~_middotgt~~bullI~~~bull~middotmiddot jbull1111 1 bull~ - 1 111 middot~ bull1 middot 1middot I jbull I bullI _- middotmiddot 1 1t1 _ 1 (Imiddot 1 bull1 1gt middot~middotlt~middot middot
I l bull bull 1 r I bull bull middot
bull middot middot middot middot~middot ~middot middot~
- J ~J ~~ O lt hj I bull ~ bull bull 1 o t I lbull I
middotmiddot bull ~ middot I bull middot bull bull
middot bull - I middot ~middot
bull 11 ( _ I
middot I Ii lfI ltI
bull
I 1- bull_ II ~ I middot
I bull vmiddotmiddot
30 I ~middot middot bull bull
lt 1 I ---middot _ bull I ~ bull bull ~ bull
II ~
111
bull bulll3 bull ~ middotmiddot bull Ibull 0 I 1 bull 111 bull bull I rbull1 middot 0 I I I - Ibullmiddot 1 bull r middot middot __ -
i bullmiddot ~ ----middot yen ~ bull ~ j
--~middot
I
I
- -- ( middotmiddot~middotmiddot- - bullbull~ _ ~- I ~ bull--- shymiddot ----bull
1- -
bullbull I I - ~ I I bull middot middot ~ I middot
1
---- _ --
bull1 II I j
I bullbullbullbull
II ~
J 1bull ~
I
bull I I bull I ~ middot Tmiddot I 1 ~ bull JI I t Ibull bull ~ bull middot
I -
-----~_ middot1
-1
~
bullbull
-
bullbull I
middot---- a I AiLWO _ middotshy
I
bull f l
I bullbull - middot I - bullbullbull
SVf1
S~D1- -0 sih3 0
I I 0 1 i ---shy (]
middot bullgt I
I J middot bull bull IIbull Iamp middot P I 177
r o ~ 0 SEol l-middot J~ I - -- ltl
f bull bull
gt1 bullI 1 V bull ~ II ~ tJ middot -middot-
I
middot1 - bull bull bull -middot
bullmiddot -bull wmiddot ~ ~ ~
bull IA1 gtW2 - gt1
- - ~ -
middotmiddotmiddot----- ~r=02 bull bullmiddot I __ i Ctt1rr--shy
bullI
Q bull _
1
D I bullbull middot - bull
SW2
I middot- bull
bullI ~middot
rl
~ se02 I bullbullbull I bullbull ~ L-lf L-- I
- ___ bull bull___ I bullbullbull
I bull ) I f IIUZ middot___ ---- bull cu bull
I gt
bullbull -shyI bull Ii bull f
~ middotmiddot~ ~ middot - I
I bull ~ ) I~ shy bullfmiddot~ ~ i ~ ~middot
~ I 1
bull 4 Ot f I
1 i f ~ bull lt
1
bull bull I
___ - ~)____ - ------~ -------middot-middot-r--middot-middot ----middot- - ---middot-middot-middot-middotbull
t t - -- a
I middot bull -- middot - __ __--~~~=--~---_-~= _ _ middot - I ii- - ~~=-=~==--=~middotmiddot-~=~~~~~~=-~~~======middot=middot~middot== middotmiddot-- _ - I
bull -------------------~_
t ~middot middot middot middotbull bull middot i------------1I Imiddot ~~f~=-~~J~i~~~f~U+--f~~~===~~-~~middot~f~=~=~=~~fi~-~-~==~~-==~==~~==~====~==~-=-==~=~=2~~~~~~~77=~=~=~~-=~s)middot==~~~--=-=~~~=~=~====-=====~~=~~~~~=~=~=~==~==-=~=~=middot
middot 7gt JloltGKLA lllD --- shy l lf-nt RT n bull middotl bull
I
-i~------ - -- -------- -- --= bull (
( ei -~ ---- -------- - - - - - bull - shyI bull middot 1 ------
--------~____-____ bull SSmiddotsmiddot~middot2-iJi_8plusmn~plusmn-~~plusmn=+=~==-=-==~~===~~~~~~=-=s~~2~-~s-==~~~z--==~=~~t-=-=-=-==-=---~34~~~-==-=-==-==~=middot==---~=-middot~i~middotmiddot~ middot)~ f ________bull _
~--- __ - ____ - bull shyI I
bull __ _ ~ ~ ~ middott1 middot_
J(J--_ 11bull middot ------deg gt
middot -f ~~~se~middot~ARm~OMAarra~PERfOAMagtBY 0 middot~ bullO ( l r
r-------------liDElmiNEiiiiY-r---Amiddot----------________---~-------------_____ __________middotmiddot_lIbull middotmiddotmiddot ACHERON ENOINEERINCI 8ERVJCED COMPLIED IU8lo BASll MAP
(middot VERIFIED TO MEET NATIONAL MAP ACCUAACI 8TANOARD8(NMJ) middot Tl1ROUQltATEaT GURVltY CONOUCIED Df JORDM 121aa LEG~ APPROXJMATESCALE DESIGNED BY
-----------_ ---------~ CentralMalnePowerCompany p D W kPI middotSURFACEWATERANDmiddotmiddot_-~middotmiddot~~~middotFitow~middot~(TOO~MEETNMAamp DRAwN BY re- es1gn or ans middot middot middot shy bull bull bull - bull
bull Aug~sta Maine OConnor Sitamiddot SEDIMENT SAMPLING middot3middot~~~middot~--~~amCla~~~~~~usa-o middot O GEISEDIMEITTSAMPUN~LOCATI~Ns o 40 middot 80 1
BY LOCATIONS ~middot)~middot ~ bull 11i GEISURFACEWATERSAMPUNGLOCATIONS middot CHECKE
rh A~gustaMalne lt middotmiddot( middotmiddot 11nch-40Feet DATEmiddot January 1991
middot APPRovED BY -V GEi Consultants Inc ~ Imiddotgtmiddotgt middotmiddot middot middot souRCE EC JORDON co RlFS bull middot GEi COMPOSITE SEDIMENT SAMPLE bull DATE REVISION BY - PROJECT 90393 SHEET OF middotI middotmiddot middotI middotAEPORTDATEDJUNE1989 v COUECTEDFORBENCH-SCAIETESTING
I J ~ I
i I bull I )__ )
I I ilo I Ibull
X -4 mdashmdash-0shy
W A Elec-Zl lt4W
Meters Shelves ^ Pickup
A CapAntique a)
W WAutomobile W J
ia iW Y
W A o
LEGEND C w
Stove - wBoat X Designated Wall Label w
-e- -fr bulleshybull Cement SlabDust Sample
0 Wooden Wall Sample ZTaping Reference Origin
W Wipe Sample
Approximate Scale
NOTES 30 Feet
1 Ail locations on this plan are approximate
2 Sample locations are general Central Maine Power Company Pre-Design Work Hans EXAMPLE examples of the type of sampling Augusta Maine OConnor Site BARN SAMPLINGand the distribution Augusta Maine LOCATIONS
3 Revision No 1 (3-28-91) ltP G E I C o n s u l t a n t s I n c Project 90393336 January 1990 Fig 5
I I I I
I
I I
I
I
I
I
I
Document VoL II SC SAP Appendix A Revision 0
Date January 171991 Page 1
V
APPENDIX A zgt
s HEALTH AND SAFETY-PLAN
Source Control PrampDesign Studies CConnorCO^Site
Augusta Mkine shy_ lt
lt
NT lt
Document Vol II SC SAP Appendix A Revision 0
Date January 171991 Page 2
GEI CONSULTANTS INC SITE HEALTH AND SAFETY PLAN
Site Name OConnor Co Site
Site address Street Route 17 Qty Augusta State Maine
Proposed Site Activities Source Controlsampling of surface andsubsurface soilssediments surface water and the on-site barn
Proposed Date of Work April 1991 gt S
Original Safety Plan YES
Site Safety Coordinator Thomas S Bobowski
Client Central Maine Power Company^(CMP)
Site Contact Charles Nickerson (CMP)
Team PERSONNEL ^ IRESPONSIBILITIES Robert E Stetkar lt ^mjectManager Joanne O Morin Work Tlans and Pre-Design Studies Manager Richard F Murdock Qhality Assurance Officer Benjamin YSu Treatability Studies Manager Joseph G Engels Technical Consultant Steven R fcambx Source Control Sampling Task Manager Thomas S Bobowski7 Barn Sampling Coordinator Sampling Boyd P Smith Sampling Christopher L Covel Sampling William J Haswell Sampling Charles Blodgett Field Screening Analytical
Background Information
The OConnor Co Site (Site) covers approximately a 9-acre portion of a 65-acre parcel within the city limits of Augusta Maine The Site is surrounded by sparsely-developed residential or agricultural properties or undeveloped woods and wetlands (Riggs Brook and associated wetlands border the Site to the east) The F OConnor Co operated a transformer stripping and recycling operation on theSite from the1950s through the 1970s
Document VoL II SC SAP Appendix A Revision 0
Date January 171991 Page 3
During operations releases of wastes including PCB-laden oils resulted in contamination of water and soil on the site Principal features of the Site include a barn which formerly housed scrap operations an upland marsh formed by man-made disruption of natural surface water drainage upper and lower surfacewater impoundments (lagoons) constructed to control migration of oils from the Site a low area where excavated lagoon sediments were deposited within a clay liner three former transformer work areas a former scrap yard and a wetland associated with Riggs Brook A site plan depicting some of the major features of the site is shown in Figure HS-1
Ax In 1986 and 1987 remedial investigations were performed byECvJdrdan Co for Central Maine Power Company (CMP) These investigations included over^OQ soil samples 11 monitoring wells and analysesof surface water ground water sediment and biota for PCBs organic and inorganic chemicals The primary contaminantsdetected in soil and sediments at the Site were PCBs PAHs and Lead Chlorinated benzenes PCBs phthalates and to a lesser extent volatile organics and metals were detected in ground water and PCBs and metals were detected in surface water Using these data Clement AssociatesInc performed an Endangerment Assessment in 1988 for EPA^evaluating risks to human health and the environment associated with existing condiuoi^ra^Tuture conditions related to a noshyaction remedial alternative In 1989 EC JordabCoi acting as consultant to CMP completed a Feasibility Study which evaluated remedial alternatives based on information provided in their earlier Remedial Investigation Report and in the EPA Risk Assessment Report After receipt of the Feasibility^Stiidy Report EPA issued a Record of Decision (ROD) in September 1989 describihg the^EPA^elected remedial alternatives for source control and management of migration
Site Status Waste Types
Includes the followin
Ground water Surface water Sediment Soils On-site structures
Refer to Table1for listing of chemicals of concern during Source Control studies per media sampled
Document VoL H SC SAP Appendix A Revision 0
Date January 171991 Page 4
Hazard Evaluation
Known orSuspected HazardousToxicMaterials Polychlorinated biphenyls (PCBs)volatile organic compounds (VOCs) polycyclic aromatic hydrocarbons (PAHs) and metals (especially Lead) The ranges of concentrations of chemicals detected in all source control media on-site are presented in the attached Tables 1C through 1L from previous studies Concentrations of PCBs PAHs and Lead detected in surficial soikduring previous studies (including the on-site Barn) are shown in Figures HS-2 HS^3 and HS-4 respectively Concentrations of chemicals detected in surface water and sediihentsduring previousstudies are shown in Figure HS-5 lt( x
The primary concern at the Site is contamination of surface soils by spillage or leakage of transformer oils containing PCBs The potential forencountering concentrated wastes in the transformer work areas (TWA I TWA II andltTWAIlI) is high In addition wastes have also been identified in soils and sediments associatedwith the lagoons and drainage swales Within a short distance of these discrete areas of the site the potential for encountering significant concentrations of wastes-is low ToYeduce the likelihood of being exposed by wastes associated with these areasduring~source control sampling activities efforts should be made to avoid walking unnecessgrilyriiv these areas
Exposure to hazards from chemiealsduiing test plying and environmental sampling and analysis tasks are most likely to occurbyone-or more of the following
1 Direct contact with contaminated surficial and subsurface soils sediments or surface-water x N
mdashN2 Inhalation of fu^Uve^ust carrying contaminants
3 Inhalation of volatile orgsuuc compound vapors while test pitting or sampling the various media on-site
Toxic and Pharmacological Effects Refer to the NIOSH Guide to Chemical Hazard Table 2 lists the major chemicals of concern and their toxic and pharmacological effects Acute exposure to PCBs PAHs Lead and VOCs may result in dizziness or nausea The results of chronic exposure may include but are not limited to central nervous system depression liver and kidney damage and irritation of skin eyes and respiratory passages Many PCBs PAHs and VOCs are known or suspected carcinogens Routes of exposure include inhalation topical and ingestion
Document Vol II SC SAP Appendix A Revision 1
Date March 28 1991 Page 5
Heat-related illnesses range from heat fatigue to heat stroke the latter being the most serious Heat stroke requires prompt treatment to prevent irreversible damage to health Protective clothing may have to be cut off Less serious forms of heat stress require prompt attention to prevent further complications which may lead to heat stroke Unless the victim is obviously contaminated decontamination procedures should be omitted or minimized so that treatment may begin immediately
Hypothermia may result from personnel exposed to excessive cold during sampling operations Hypothermia requires prompt treatment to prevent serious damage to health Damp or wet clothing may have to be cut off and the persons body temperature must be elevated as soon as possible through the use of warm blankets or another persons body warmth Unless the victim is obviously contaminated decontamination procedures should be omitted or minimized so that treatment may begin immediately
Area Within Augusta Maine city limits
Proposed On-Site Activities Test pitting boring or hand augering for collection of surface and subsurface soil samples collection of sediment and surface water samples from an inflatable boat or from wading into the water with hip-boots and collection of samples from within the on-site Barn Potential physical safety hazards during each of the four proposed Source Control site activities are discussed per activity below
Test Pitting and Borings for Surface and Subsurface Soil Samples A backhoe will be used during test pitting operations to excavate soil for collection of samples The most significant hazard during this sampling effort is the potential for collapse of the excavation while sampling Therefore in accordance with OSHA and 29CFR1926 Subpart P if personnel are required to enter an excavation the excavation will be no deeper than 5 feet unless it is braced or sloped back For the Type A soils documented on-site (eg clay and glacial till) the required slope from the ground surface to the top of unbraced portion of the excavation in all directions is 05 HORIZONTAL 1 VERTICAL Short-term excavations of this type will not exceed 12 feet in depth In general a drilling rig will likely be used to obtain samples from depths below 5 feet by augering to a specified depth and using a split-spoon sampler
Document Vol H SC SAP Appendix A Revision 1
Date March 28 1991 Page 6
Other physical hazards during test pitting and boring operations include the presence of overhead objects (eg backhoe bucket) so hard hats must be worn during these tasks at all times In addition the potential for spreading contamination with fugitive dust during excavation and mobilization between sampling locations is much greater than during other Source Control sampling efforts Therefore Level C dermal and respiratory equipment must be worn during all test pitting and boring operations (see below) Additional decontamination procedures will be required between sampling areas to limit the potential for cross-contamination (see below)
Sediment and Surface Water Sampling These operations will be conducted using Level C dermal protection only The need for respiratory protection will be based on criteria discussed in the next section In order to collect sediment and surface water samples in interior portions of the Upland Marsh and Upper and Lower Lagoons an inflatable boat or hip-boots will be used Further sampling will be performed by walking along the shores of the surface water bodies while dragging a sediment sampler These operations involve the risk of falling in relatively deep water while equipped with Level C dermal protection This equipment may limit movement and may inhibit a person from swimming easily to safety Therefore while sampling with the boat a Coast Guard Approved life vest will be worn at all times In addition one person will standby on-shore to observe the boat operation and to assist in the event of a mishap Depending on the water and air temperature at the time of sampling it is possible that a person who had fallen in water may require treatment for hypothermia or shock
Barn Sampling The barn can be classified as a confined work space since it is fully enclosed and has a limited number of exits In order to operate safely in a confined work space special considerations are necessary Unlike some confined spaces the barn has numerous small openings in the wooden structure to allow for an adequate supply of air while collecting samples However the sampling effort will likely generate a significant amount of airborne dust within the barn which means that Level C dermal and respiratory protection must be worn at all times while in the barn One person will remain outside the barn during the sampling effort to observe the sampling personnel and to provide backup services Two Combination Type A-B-C fire extinguishers capable of extinguishing wood and paper flammable liquidis or electrical fires will be available (one inside and one outside the barn with the standby person) in the unlikely event of a fire occurring during sampling
Document VoL H SC SAP Appendix A Revision 0
Date January 171991 Page 7
In accordance with OSHA 29CFR1910120 a minimum lighting intensity of 5 foot
candles will be provided within the barn during sampling The creation of dust and the
low lighting which may be available in some areas of the barn is likely to limit vision
some of the time Special care must be taken to avoid tripping over the numerous
objects disposed of within the barn No electricity is available in the barn so power
will come from outside the barn to supply power for lighting and tools to be used in
the sampling effort This means that electrical extension cords will be laid out on the
floor to various sampling locations In addition a large amount of metal and wooden
debris exists within die barn which may become obstacles to free movement in certain
areas The wooden floors of the second story and loft ofxthe^arn are extremely
deteriorated in some places and should not be accessed unless authorized by the Site
Safety Coordinator v
The use of electric power tools to collect samples ^wobd boring and concrete drills) require special care The use of Level C dermal protection such as loose fitting gloves may make handling the drills more difficult Use speciaLcare to avoid contacting the moving bits of the drills while in operation tonvoid tearing tyveks or gloves If dermal protection is torn replace or patch it immediatelybefare proceeding with the sampling operation
Perimeter Establishment
MapSketch Attached See bdquo Perimeter Identified Access to site is restricted at all entry points via a locked
8-foot high cyclone fence^- x y
Zone(S) of contamination identified See Figure HS-1 through HS-5
Document Vol II SC SAP Appendix A Revision 1
Date March 28 1991 Page 8
Recommended Level(s) of Protection On-site personnel will use Level C dermal protection at all times See below for respiratory use
1 Protective Clothing
Sampling and decontamination personnel in these areas will wear
bull Disposable Tyvek coveralls over cotton coveralls bull Tyvek hoods bull Safety glasses or face shield bull Hard Hat bull Disposable booties over workbooks or waders for sampling surface water and
sediments bull Butyl rubber gloves over surgical gloves bull All gloves and booties will be taped to the Tyvek coveralls
2 Respiratory Protection
Air purifying respirators will be worn at all times while sampling during test pitting and boring operations and while inside the barn Otherwise the need for respiratory protection will be determined by on-site monitoring for organic vapors and the daily potential for exposure to airborne particulates The decision to utilize air-purifying respirators due to airborne particulates will be made by monitoring with a MIE MINIRAM Hand-held Aerosol Monitor (HAM) Based on previous studies (Endangerment Assessment Appendix F) an action level for worker safety of 10 mgm3 of respirable dust was established for the site Therefore when readings on the MINIRAM of 10 mgm3or greater are experienced Level C respirators will be worn Initial on-site monitoring for organic vapors will be conducted using an HNu Photoionization Detector (PID) Ambient vapor levels of 5 to 10 ppm above background in the breathing space will require the use of full-face cartridge respirators (Level C Protection) Background levels will be determined at the edge of the Site (ie fence line) before the initiation of the days activities Air quality will be monitored at the upwind boundary of the site at three locationsfor a duration of one minute at each location The maximum PID reading at each location will be recorded and the three readings will be averaged to determine the background level for that day Respiratory protection will be full-face respirators fitted with combined organic vapor and high-efficiency particulate cartridges (MSA Type GMA-F) Respirator cartridges will be replaced at a minimum on a daily basis Depending on readings obtained with the MINIRAM cartridges may be replaced at mid-day on windy days
Levels of organic vapors greater than 10 ppm above background in working areas will necessitate utilization of self-contained breathing apparatus (Level B Protection) During sampling HNu monitoring should be utilized to detect any changes in organic vapor levels Changes in fugitive dust or vapor level detection at any time may warrant appropriate alteration of required respiratory protection
Document VoL H SC SAP Appendix A Revision 0
Date January 171991 Page 9
Decontamination and Disposal
A decontamination areawill be assembled at the entrance to the site The decontamination zones will be established such that personnel and equipment are fully decontaminated prior to leaving the fenced area In addition all personnel will be familiar with proper decontamination procedures prior to going on site All personnel entering and exiting the hot zone shall pass through the decontamination zone
1 Personnel Decontamination
The personnel decontamination sequence is as follows
a Samples and equipment are dropped on plastic sheets
b Disposable booties Tyvek coveralls and contaminated outer gloves are first brushed off with soapy water then rinsed with clean water by decontamination personnel Thedisposable equipmenfis^then removed baggedand placed in a 55shygallon drum marked Dry Deconv
c Neoprene boots and outer gloves are washed if they were not drummed in Step b with soapy water and ririseck with clean water An additional rinse with methanol followed by a firiak water-rinse completes the sequence
lt d Neoprene boots and glovesare -removed
e Respirators (cartridge-change) are removed if necessary and disposed in the Dry Decon drum
f Surgical gloves are temovfedand disposed in the Diy Decon drum
Document Vol M SC SAP Appendix A Revision 0
Date January 17 1991 Page 10
2 Equipment Decontamination
The equipment decontamination procedure for Source Control sampling work performed inside the fenced area of the site is as follows
a All disposable items (eg surgical gloves plastic sheeting nylon brushes etc) will be discarded in the Dry Decon drum
b Heavy equipment such as the backhoe and drilling jig will be steam-cleaned on a specially constructed decontamination pad located east bfthermain site access gate and north of the ground water monitoring well couplet MW1Q2A and MW102B (see Figure HS-7) The pad will be constructed to allow for drainage of steam-cleaning solutions onto a bermed multi-layer -impermeable barrier consisting of several layers of at least 6-mil-thick polyethylene sheeting overlain and underlain by geotextile fabric The geotextile fabricwilfbe designed to collect contaminated sediments which may have collected on tires or excavating equipment Rinse water from the decontamination processwill then fre pumped through hoses or channelled for drainage into the Uppei^La^oomafter completion of surface water and sediment sampling The decontamination pad will be left in place after completion of field sampling
c All other equipment contacting surface or subsurface soils sediments surface water or materials within thebarm(egtrowels spatulas templates drill bits etc) will be decontaminated by rinsing with clean water scrubbing with methanol and re-rinsing with distilledwater Solutions which contain methanol will be collected for disposal into tHeJWet Decon drum Equipment used during barn sampling will then be drted^with paper towels and the towels will be disposed in the Dry Decon drum ^
3 Decontamination Station Closure
The procedure for decontamination station closure will be as follows
a Decontamination personnel shall be responsible for closing the station at the end of each workday
b All solid wastes such as plastic tarps bags and Tyveks will be placed in the Dry Decon drum and will be closed at die end of each workday
Document Vol IISC SAP Appendix A Revision 0
Date January 171991 Page 11
All spent decontamination solutions containing methanol will bedisposed of in the Wet Decon drum Decontamination solutions which are not composed of methanol and exhibiting PID readings below 1 ppm will be poured into surficial soils on the edge of TWA I within the fenced area of the site If PID readings are greater than 1 ppm the solutions will be disposed in the Wet Decon drum These drums will be closed at the end of each workday
d Drums shall be secured on-site until proper disposal is arranged after consultation with EPA
7 Air Monitoring Procedures X
Site Monitoring Equipment PID HNu PI-101 HAM MIE MINIRAM
Since Level C respirators will be used during test pitting and barn sampling air at the test pit and barn sampling areas will be monitoredfegularly with a PID and HAM primarily for future reference of the levels of VOCs and dustto^be expected during remedial activities During the other sampling efforts air monitoring wiH form the basis for whether an upgrade to Level C respiratory equipment is necessary TheltPID will be used regularly during soil sediment and surface water sampling^ TKampHAM will be used at least twice per hour while on-site to monitor for dust levels in air^Whenunusually windy conditions are experienced additional monitoring for dust levels wilLbe^erfbrmed When ambient temperatures in air are below 32deg F the chart recorderattachment for the MINIRAM must be used as the LED readout on the instrument may not operate below freezing All PID and HAM readings will be recorded in theJield Log Book
Document VoL H SC SAP Appendix A Revision 0
Date January 171991 Page 12
Emergency Information
Location Phone
FIRE Augusta (207) 623-2511
POLICE Augusta (207) 623-2511 State Police (Augusta) (207) 621-1200
AMBULANCE Augusta (207) 623-25tlx N
HOSPITAL Kennebec Valley Medical Center (207) 626-1000 Augusta Division N 6 East Chestnut Augusta ME
Chemical Trauma Capability Yes
EPA (Michael Jasinski) 7) 573-5786
DEP (Thomas Benn) (207) 289-2651
CMP (Charles Nickerson) (207) 623-3521
Directions to Hospital (See Fig HS-6)
Primary route to hospital is west on Route17 (Eastern Avenue) to Arsenal Avenue turn right on Arsenal Avenue and go3 blocks to E Chestnut street then right Emergency room entrance is 6 East Chestnut Street Alternate route - west on Route 17 (100 yards) to Cony Road turn right on Cony Road take^rst left (Cony Street Ext) to Riverside Drive go left on Riverside Drive the second mtejsection will be Arsenal Street goleft on Arsenal Street East Chestnut Street will be second left
Document VoL H SC SAP Appendix A Revision 0
Date January 171991 Page 13
Additional Emergency Contacts
DR DAVID EGILMAN (617) 935-8581 HEALTH RESOURCES WOBURN MASSACHUSETTS
GEI CONSULTANTS INC
ROBERT E STETKAR (603) 224-7979 JOSEPH G ENGELS (617)721^4022 s
TSCA HOTLINE (800)424-9065
AT amp F (EXPLOSIVES INFO) (800^424-9555 V
NATIONAL RESPONSE CENTER x(8W) 424-8802
PESTICIDE INFORMATION SERVICE (800)845-7633
RCRA HOTLINE y -(800) 424-9346
CMA CHEMICAL REFERRAL CENTER (800) 262-8200V NATIONAL POISON CONTROL CENTER (800) 942-5969-y
US DOT bdquo (202) 366-0656
GEI CONSULTANTS ^ (603) 224-7979
Prepared by Thomas S Bobowski Date January 7 1991
Reviewed by Robert E Stetkar Date January 9 1991
All personnel working at this site have received OSHA required health and safety training Personnel are enrolled in a medical monitoring program A summary of training completed for all GEI personnel involved in the Source Control sampling program is provided in Table 3
Use of Common Sense is Required
I have read and understand this safety plan
Name (printed) Signature Date
Table 1A Organic and Inorganic Chemicals Detected in the Shallow Aquifer
Groundwater Samples at the F OConnor Site Maximum
Concentration Geometric Background
Range Mean[a] Concentration (ugL)
Chemical Frequency (ugL) (ugL)
ND(b]-2300B[c] 150 NDAcetone 211 ND-15J[d] NA[e] NDBenzene 211 ND-45 143 ND2-Butanone 17 ND-83 53 NDChlorobenzene 311 ND-53 NA NDToluene 27 ND-12J NA NDTriehloroethene 1P ND-11 81 NDBis(2-Ethylhexyl)Phthalate 411 ND-25 1deglaquo2 ND12-Dichlorobenzene 411 ND-14J 97 ND13-Dichlorobenzene 311 ND-13J 96 ND14-Dichlorobenzene 311 ND-29 94 ND124-Trichlorobenzene 17 ND-19 07 NDTotal PCBs 111 27-5085 06 49Aluminum 55 27-805 24 42Barium 55 13700-125451 38300 26600Calcium 55 ND-145 53 NDChromium 25 ND-37 NA NDCobalt 15 ND-285 66 14Copper 35 33-4952J 590 3Iron 55 ND-18 37 NDLead 15 21-2906 260 24Manganese 55 ND-154 10 NDNickel 15 ND-17 37 NDSilver 15 10593-72812 33400 14000Sodium 55 ND-71 71 NDVanadium 15 17-946 263 91Zinc 55
a) Calculated using detected concentrations and one-half of EPAs contract laboratory program (CLP) detection limits for the organics For the inorganic
chemicals the aqueous CLP detection limits were used
b) ND - Not Detected
c) B designates Chat substance was also found in the blank though the
sample level was significantly higher to prove a positive detect
d) J designates estimated value
e) NA - Not applicable Chemical was detected infrequently and the use of
one-half of the detection limit in calculating a mean results in a mean
concentration that exceeds the maximum Therefore a mean is not used
SourceEndangerment Assessment dated Jan 29 1988 by CDM
Table IB Organic and Inorganic Chemicals Detected in Bedrock Aquifer
Groundwater Samples at the F OConnor Site
Mean Concentration Geometric Background
Chemical Frequency Range (ugL)
Mean[a] (ugL)
Concentration (ugL)
Acetone 220 ND[b]-1200 68 ND Benzene 220 ND-27J[c] NA(d] ND Chloroblt ene 620 ND-16 36 ND Toluene 215 ND-27J NA ND Bis(2-E vlhexyl)Phthalate 1320 ND-64 Hi 61 12-Dich 13-Dic^
irobenzene jrobenzene
720 120
ND-26 ND-24J NA
66 ND ND
14-Dic^ robenzene 620 ND-44 82 ND Di-n-Bu phthalate 120 ND-22J NA ND 124-Tr hlorooenzene 720 ND-310 161 ND N-Nitros iiphenvlamine 25 ND-4J NA ND 3eta-BHC 110 ND-04 004 ND Gamma-BH (Lindane) 110 ND-006 003 ND Total PC 320 ND-50 LO ND Antimony 110 ND-55 19 ND Barium 1010 15-129 138 56 Chromium 410 ND-268 54 ND Cobalt 110 ND-115 92 ND Iron 1010 61-384301 837 152 Magnesiu Manganes
1010 810
5960-46250 ND-5895
15220 661
4203
27 Nickel 310 ND-345 125 ND Potassiu 1010 3504-16046 6560 4340 Vanadium 110 ND-52 NA ND
a) Calcul ted using detected concentrations and one-half of EPAs contract labor 3ry program (CLP) detection limits for the organics For the inorganic chemic Is the aqueous CLP detection limits were used
b) ND mdash F detected
c) J de Ignates estimated value
d) NA - N applicable Chemical was detected infrequently and the use of one-ha of the detection limit in calculating a mean-results in a mean concern ation that exceeds the maximum Therefore a mean is not used
Source Endangerment Assessment dated Jan 29 1988 by COM
Table 1C Organic and Inorganic Chemicals Detected in In-Fence Surface Soil
Samples at the F OConnor Site Mean
Concentration Geometric Background Range Mean[a] Concentration
Chemical Frequency (ugAg) (ugkg) (ugAg)
19 ND[b]-19J[c] NA[d] ND Chicroform ND29 ND-150B[e] 63Methylene Chloride
ND19 ND-30J NAToluene 260J19 ND-917J 260Bis(2-Ethylhexyl)Phrhalate
Carcinogenic PAHs ND19 ND-2700J 290BenzoltAgtAnthracene ND29 ND-12000J ^10BenzoltB or KgtFluoranthene ND39 ND-11000J 540Chrysene ND39 ND-23183Total CPAHs
Non-carcinogenic PAHs ND39 ND-12000J 540Pvrene ND39 ND-12000 540Total NCPAHs ND118186 ND-6205600 3400 Total PCBs 4001419 ND-64000 1900Cadmium 292001919 17000-29480000 275000
Copper 570001919 29000-2681000 213000Lead 252001919 19000-90000 35000Nickel ND219 ND-12000 650Silver 738001919 45000-1160000 183000Zinc
aj Calculated using detected concentrations and one-half of EPAs contract UboSto program (CLP) detection Unite for the organic For the inorgar-c chemicals the detection limits for soils were based on aqueous CLP
detection limit
b) ND - Not Detected
c) J designates estimated value
d) NA - Not applicable Chemical was detected infrequently and the use of one-half of the detection limit in calculating a mean results in a mean concentration that exceeds the maximum Therefore a mean is not used
e) B designates that substance was also found inthe blank though the sample level was significantly higher to prove a positive detect
Source Endangerment Assessment dated Jan 29 1988 by Clement Associates Inc
Table ID
Organic and Inorganic Chemicals Detected in the TVA III Surface Soil Samples at the F OConnor Site
Concentration Geometric Background Range Meanfa] Concentration
Chemical Frequency (ugAg) (ugAg) (ugAg)
44-DDT 13 ND[b]-5200 150 ND 44-DDE 13 ND-260 56 ND Total PCBs 2131 ND-620000 2940 ND
Antimony 11 189000 41000
Cadmium 11 11000 400 Copper 11 230000 29200 Iron 11 60900000 22200000 Lead 11 634000 57000 Zinc 11 799000 73800
a) Calculated using detected concentrations and one-half of
ErAs contract laboratory program (CLP) detection limits
b) ND - Not Detected
Source Endangerment Assessment dated Jan 29 1988 by Clement Associates Inc
Table IE irganic Chemicals Detected in Upland Marsh Sediment
Samples at the F OConnor Site[a] Maximum
Concentration Geometric Background Range Mean[b] Concentration
Che ical Frequency (ugAg) (ugAg) (ugAg)
To ane 11 23J[c] - ND[d] To- 1 PCBs 33 1300-34000 6425 ND
a) norganic chemicals were also analyzed for but none were itected significantly above background concentration
b) alculated using detected concentrations and one-half of PAs contract laboratory program (CLP) detection limits
c) J designates estimated value
d) D - Not Detected
Source Endangerment Assessment dated Jan 29 1988 by Clement Associates Inc
Chemical
Acetone 11 408B[c] ND[d]
Bis(2-EthyIhexy1)Phthalate 11 2082 ND
Toluene 11 28J[e](f] ND
Total PCBs 44 30000-1100000 381000 ND
a) Inorganic chemicals were also analyzed for but none were detected
significantly above background concentration
b) Calculated using detected concentrations and one-half of EPAs contract
laboratory program (CLP) detection limits
c) B designates that substance was also found in the blank though the sample
level was significantly higher to prove a positive detect
d) ND - Not Detected
e) J designates estimated value
f) In a duplicate sample toluene was not detected A geometric mean of the detected value and one-half of the detection limit would have resulted
in a mean concentration exceeding the detected value Therefore only
the detected value is listed
Source Endangerment Assessment dated Jan 29 1988 by Clement Associates Inc
Table 1G Organic and Inorganic Chemicals Detected in Lower Lagoon Sediment
Samples at the F OConnor Site Maximum
Concentration Geometric Background Range Mean(a] Concentration
Chemical Frequency (ugAg) (ugAg) (ugAg)
Bis(2-Ethylhexyl)Phthalate 12 ND[b]-100J[c] NA[d] ND
Benzoic Acid 22 120J-190J 150 ND Total PCBs 77 3202-40100 8660 ND
Cadmium 12 ND-2500 790 ND c 22 27000-59000 40000 20000
Lead 22 17000-70000 34500 ND
Manganese 22 525000-982000 718000 474000
Selenium 12 ND-760 436 ND Zinc 22 103000-249000 160000 108000
a)Calculated using detected concentrations and one-half of EPAs contract laboratory program (CLP) detection limits for the organic For the inorgan chemicals the detection limits for sediments were based on the aqueous CLP
detection limit
b) ND - Not Detected
c) J designates estimated value
d) NA - Not Applicable Chemical was detected infrequently and the use of
one-half of the detection limit in calculating a mean results in a mean
concentration that exceeds the maximum Therefore a mean is not used
Source Endangerment Assessment dated Jan 29 1988 by Clement Associates Inc
Table 1H Organic and Inorganic Chemicals Detected in Riggs Brook Sediment
Samples at the F OConnor Site Maximum
Concentration Geometric Background
Range Mean[a] Concentration
Frequency (ugAg) (ugkg) (ugAg)Chemical
12 ND[b]-30 12 NDMethylene Chloride
Carcinogenic PAHs 22 160J[c]-790 360 230JBenzoltAgtAnthracene 22 220J-800 420 290JBenzoltAgtPyrene 22 2-63J-1600 650 710J3enzoltB or KgtFluoranthene 22 280J-960 520 400J
Chrysene 12 ND-190J NA[d] NDDibenzltAHgtAnthraeene 12 ND-400J 340 NDIndenoCl23-CDgtPyrene 22 1507-4740 2670 2402Total CPAHs
Non-carcinogenic PAHs 12 ND-110J NA NDAcenapthy1ene 12 ND-200J NA NDAnthracene 12 ND-410J 350 ND
BenzoltGHIgtPerylene 22 280J-1200 580 420J
Fluoranthene 12 ND-80J NA NDFluorene 22 72J-680 220 150J
Phenanthrene 22 290J-1500 660 470J
Pyrene 22 1810-4180 2750 2584Total NCPAHs 615 ND-6481 870 NDTotal PCBs 12 ND-1200 775 NDSilver
a) Calculated using detected concentrations and one-half of EPAs contract laboratory program (CLP) detection limits for the organics For the degrgan chemicals the detection limits for sediments were based on the aqueous CLP
detection limits
b) ND - Not detected
c) J designates estimated value
d) NA - Not applicable Chemical was detected infrequently and the use of one-half of the detection limit in calculating a mean results in a mean
concentration that exceeds the maximum Therefore a mean is not used
Source Endangerment Assessment dated Jan 29 1988 by Clement Associates Inc
Table II Inorganic Chemicals Detected in Upland Marsh Surface
Water Samples at the F OConnor Site[a]
Sample Background
Concentration Concentration
Chemical Frequency (ugL) (ugL)
Aluminum 11 884 104 Arsenic 11 35 ND(10)[b]
Barium 11 12 47 Iron 11 3540 1160 Lead 11 36 ND(5)
Manganese 11 ^29 134 Potassium 11 7260 3610
a) Organic chemicals were also analyzed for but
none were detected
b) ND - Not Detected Limits of detection are
given in parentheses
Table 1J Organic and Inorganic Chemicals Detected in Upper Lagoon
Surface Water Samples at the F OConnor Site
Sample Background
Concentration Concentration
Chemical Frequency (ugL) (ugL)
108 ND(10)[a]Total PCBs 11 47Barium 11 23
6 ND(5)Lead 11 Manganese 11 1450 134
25 ND(40)Nickel 11
a) ND - Not Detected Limits of detection are given in
parentheses
Source Endangerment Assessment dated Jan 29 1988 by Clement Associates Inc
Table IK Organic and Inorganic Chemicals Detected in Lover Lagoon
Surface Water Samples at the F OConnor Site Maximum
Concentration Geometric Background Range Mean[a] Concentration
Chemical Frequency (ugL) (ugL) (ugL)
Total PCBs 22 13-375 221 ND[b] Aluminum 22 56-3740 458 104
Arsenic 12 ND-4 NA[c] ND
Barium 22 12-37 67 47
Cobalt 12 ND-9 NA ND Iron 22 1970-8260 4030 1160
Lead 22 91-13 109 ND
Manganese 22 137-2330 565 134 Potassium 22 5200-6220 5690 3610
a) Calculated using detected concentrations and one-half of EPAs
contract laboratory program (CLP) detection limits for the organics For the inorganic chemicals the aqueous CLP detection
limits were used
b) ND - Not Detected
c) NA - Not Applicable Chemical was detected infrequently and the
use of one-half of the detection limit in calculating a mean
results in a mean concentration that exceeds the maximum
Therefore a mean is not used
Table 1L
Inorganic Chemicals Detected in Riggs Brook Surface Water Samples at the F OConnor Site[a]
Maximum
Concentration Geometric Background Range Mean[b] Concentration
Chemical Frequency (ugL) (ugL) (UgL)
32 NDAntimony 13 ND[c]-35 5 NDLead 13 ND-16
a) Organic chemicals were also analyzed for but none were detected
b) Calculated using detected concentrations and one-half of EPA s
contract laboratory program (CLP) aqueous detection limits
c) ND - Not Detected
Source Endangerment Assessment dated Jan 29 1988 by Clement Associates Inc
Chemical
Acetone |CHCOCH3l Dimethyl ketone ketone propane
Toluene |CHCHJ _ e bull bull a O J Jtoluol phenyl aethane aethyl benzene
Cblorobcnzene (CHC1) aonochlorobenzene chlorobenzol
Ethyl benzene |C_HCH| phenyl ethane ethyl benzol
ACC TLV or STEL
ltPPB) (PfB)
750 1000
100 150 skin
75 (550agaraquo)
100 125
TABLE 2 CHEMICAL TOXICITY AND OTHER INFORMATION
Physical Skill Dcraal LD^ (mgkg) State Penetration Tonicity Potency ofraquoI(rat)
bullbullbull local it 9750liquid Bint-like odor
1297(nice)
liquid t local 5000
TC|Huosn =Ml00 ppa
colorless liquid 2910
colorless liquid local H 3500 with aromatic odor
syatcaatic bullbullbull TCu(Kiais) c 100 ppa
A hrs
Page 1 of 4
Remarks
Syaptoas Irritates eyea none throat narcotic in high concentrations
Target Organ respiratory aystea skin
First Aid Swallow water voait Skin soap wash
Incoapatibilities oxidizing materials acids Fire hazard when csposed to beat or flame
Tonicity 1 Persistence1 0
Syaptoas fatigue confusion euphoria dizzy headache dialated pupils lack of appetite nervousness insoania
Target organ CNS liver kidneys skin
First Aid Swallow NO VOHIT 8kln soap waah
Incoapatibilities strong ozldizers
Toxicity1 2 Persistence 1
Syaptoas irritates eyes nose causes drowsiness incoordination skin irritation
Target organ respiratory systea eyes skin cars liver
First Aid NO VOMIT
Incoapatibilities strong oxidizers reacts violently with AgClO^
Toxicity 2 Persistence 2
Syaptoas irritant to eyes and aucous aembrane headache narcotic
Target organ eyes upper respiratory systea
First Aid NO VOHIT
Incoapatibilities oxiding asterisks dangerous when exposed to heat or flame
TABU 2 Page 2 of 4 CHEMICAL TOXICITY AND OTHER INFORMATION
(continued)
ACC TLV or STEL Physical Skin Dcraal ID (agkg)
Cheaical (PPff) (PPB) State Penetration Toxicity Potency orsl(rat) Rcnarks
Benzene benzol
IC^H) 10 23 colorless liquid with aroaatic odor
local systeaatic
bullbull
bullbullbull Poisoning occurs aost coasaonly through lnhalationi also penetrates through akin
Syaptoass lrritatea eyes nose respiratory systea giddiness head nausea staggered gait fatigue depresesion sbdoaioal pain
Target organs bloody CNS skin bone narrow eyes respiratory systea
First Aids Swallows 8kins
NO VOMIT soap wash
Inconpatibilitiess strong oxidizers chlorine hronine with iron Dangerous when exposed to beat or flaae
Toxicitys 2 Persistences 1
Trichloroctbylcne ethylene trichloride tridene TCE
30 200 colorless liquid sweet odor
4820
1900(dog)
Syaptoass headache vertigo vision distortion treaors soanolcnce nausea voait irritates eyes cardiac errytbaiss paresthesias
Target organs respiratory systea heart liver kidneys CNS skin
First Aids Swallows Skins
Ipecac voait soap wash immediately
incoapatibless strong caustics chemically active actalss Da Li Ra Hg liquid O
Al 02 KN03 Ti
Persistences 3
Polychlorlasted biphenyi PCB Arocblor 1242 CjjHjClj(approx)
Arcblor 1234
C6H2C3C6M3C12
03
colorless to dark brown liquid with aild hydrocarbon odor
local systeaatic
local
Poisoning occurred Boat coaaonly through investigation or penetration of skin
Sypatoaas Irritates eyes (discbarge) skin scne-fora dernitatis Jaundice dark urine Target organs liver eyes skin First Aids Swallows Ipecac voait
Skins soap wash isnediately Incoapatibless strong oxidizers
TABU 2 CHEHICAL TOXICITY AND OTHER INFORMATION Page 3 of 4
ACC
Chulcil TLV or STEL (ppa) (POO)
Physical State
Skin Penetration
Derail Tonicity Potency
U)n (ngkg) of Reaarka
Dloctyl phtbalate di-acc-octyl pblbalata
5 aga1
light colored liquid
31000 Tonicity low to none via oral and derail routca produce 01 ayaptoas
12 Bichlorobenzene (C^H CI ) o-OCB
50 none liquid ++ local systemic
Symptoms irritates eyes and nose Target Organs liverkidneysskineyes First Aid Swallow salt water vomit
Skin soap wash Incompatabilities strong oxidizers
14 bichlorobenzene (CHbdquoC1 ) 7 2
P-OCB 75 110 solid ++ local
systemic ++ Symptoms irritates eyesheadachesnauseavomiting
Target Organs liverkidneyskineyesrespiratory system
first Aid Swallow water vomit skin soap wash
Incompatablities none
Lead (Pb) 015 mgm
none solid systemic t Symptoms Fatigue headaches abdominal pain Target Organs kidneys 61 central nervous system First Aid Swallow water vomit
Skin soap wash
Polycyclic Aromatic Hydrocarbons (PAHs)
015 mgm
none liquid systemic + Symptoms No obvious symptoms Carcinogenic to tissue following prolonged contact
First Aid Swallow water vomit Skin soap wash
Page 4 of4TABU 2 CHEMICAL TOXICITY AND OTHER INFORMATION
(continued)
NOTES
TLV - Threshold Unit Value ACC - Acceptable Ceiling Concentration STEL - Short Tera Exposure Limit
Suspected carcinogens teratogens or mutagens Firat Aid Unless specified flrat aid for oil of the liated cbeaicala are aa followa
Eyeai iaaedlatcly waab with copious quantity of cold water Skins Flush with water proaptly Breath Artificial respiration Swallowi Water voait
a Slight Hazard aa Hoderate Hasard aalaquo Extreme Hasard
Toxicity Ratiosa
Toxicity Rating
No toxicity (none) Material causes no hara in any condition or produces
tosic effects on buaana in very unusual circumstances or
in very large dosage
Slight toxicity (low)
Moderate toxicity
Severe toxicity
Persistence or each hazardous substance ia evaluated on its blodegradabllity aa follows
Assigned Value
Easily biodegradable coapounds 0
Straight chain hydrocprbons 1
Substituted and other ring compounds 2
Metals polycyclic coapounds and halogenated hydrocarbons 3
Adapted with modifications from EC Jordon Co RIFS Work Plan
TABLE 3 - PERSONNEL TRAINING AND MEDICAL MONITORING HEALTH AND SAFETY PLAN Field Sampling Plan OConnor Co Site Augusta Maine
personnel1
Robert E Stetkar
Joanne O Morin
Richard F Murdock
Benjamin Y Su
Joseph G Engeis
Steven R Lamb
Thomas S Bobowski
Boyd P Smith
Christopher L Covel
William J Haswell
Charles Blodgett
NOTES
ANNUALreg MEDICAL
MONITORING
yes
yes
yes
yes
yes
yes
yes
yes
yes
yes
yes
lt
y
OSHA 40shyHOURreg HAZMAT TRAINING
yes
yes
yes
yes
yes
yes
yes
yes
yes
yes
yes
ANNUALreg RESPIRATOR
FITTEST
yes
no
no
no
no
yes
yes
yes
es Yes
yltes
-y
CARDIOshyPULMONARY
FIRST AID RESUSCITATION TRAINING TRAINING
no no
yes yes
nov no
no no
no no
yes yes
yes yes
yes yes
yes yes
no no
yes yes
1 Only GEI personnel assigpedttfdo work on the OConnor site included on this list
2 Includes baseline and annual physicals lilood testing etc
3 In accordance with 29CFR191012tkncludes annual 8-hour refresher course
4 Includes annual respirator fit testing procedures
Project 90393 GEI Consultants Inc January 17 1991
TOW MAXARJM PCS CONCENTRATION (gtbullraquo) 8Y AREA
Central Maine Power Company Pre-Design Work Plans INTERPRETED CONTOURS Scale 1 inch = 180 feet Augusta Maine OConnor Site OF PGBs IN
Augusta Maine IN SURFICIAL SOILS From EC Jordon Co RIFS
Report dated June 1989 0 G E I C o n s u l t a n t s I n c Project 90393 January 1991 FigHS-2
Central Maine Power Company Pre-Design Work Plans DISTRIBUTION OF PAHs Scale 1 inch = 180 feet Augusta Maine OConnor Site IN SURFACE AND
Augusta Maine SUBSURFACE SOILS From EC Jordon Co RIFS
Report dated June 1989 0 G E I C o n s u l t a n t s I n c Project 90393 January 1991 FigHS-3
Central Maine Power Company Pre-Design Work Plans INTERPRETED DISTRIBUTION Scale 1 inch = 180 feet Augusta Maine OConnor Site OF LEAD IN SOILS
Augusta Maine From E C Jordon Co RIFS
Report dated June 1989 ltD G E I C o n s u l t a n t s I n c Project 90393 January 1991 FigHS-4
Central Maine Power Company Pre-Design Work Plans ANALYTICAL RESULTS FROM Scale 1 inch = 160 feet Augusta Maine OConnor Site SEDIMENT AND SURFACE
Augusta Maine WATER LOCATIONS From EC JOrdon Co RIFS lttgtReport dated June 1989 G E I C o n s u l t a n t s I n c Project 90393 January 1991 FigHS-5
Contamination 80 Feet
Control Line
Central Maine Power Company Pre-Design Work Plans SITE ACCESS AND Augusta Maine OConnor Site DECONTAMINATION
Revision 1 March 281991 Augusta Maine AREA
laquo G E I C o n s u l t a n t s I n c Project 90393 March 1991 KgHS-7
bull
Document Vol II SC SAP Appendix B Revision 0
Date January 17 1991 Page 1
APPENDIX B
FieldtogjL
FIELD LOGS
Project Field Log Book Equipment Calibration Logs
HNu Pl-101 MIE MINIRAM MARKSON CONDUCTIVITY METER MARKSON DIGITAL pHTEMPERATURE
Photograph Log Health and Safety QA Logs
Chain-of-Custody Forms Sample Assignment Forms Non-Conformance Report Forms Test Pit Log Forms Barn Sampling Forms Dexsil L-2000 PCB analyzer Calibration Boring Log Forms
lt
Document Vol II SC SAP Appendix B Revision 0
Date January 17 1991 Page 2
(OCONNORFL1)
(OCONNORFL2) (OCONNORFL3) (OCONNORFL4) (OCQNNORFL5) pound0CONNORFL6) (OCONNORFL7)
-(OCONNORFL9) (OCONNORFLIO) (OCONNORFL11) (OCONNORFL12) fOCONNORFL13) (OCONNORFL14) (OCONNORFL15)
Note Field Log OCONNORFLampisassigned to ground water sampling described in the Management of Migration Sampling andiAnalysis Plan
Document Vol II SC SAP Appendix B Revision 0
Date January 17 1991 Page 3
PROJECT LOGBOOKS (OCONNORFL1)
Serialized project logbooks are to be issued by the site contractor to all personnel at the site who have been designated to perform specific field tasks Individuals must sign their logbooks upon receipt and use them to record all pertinent information until the project is completed y
Logbook entries should be dated legible and contain accurate and inclusive documentation of an individuals project activities Because the logbook forms the basisfor the later written reports it must contain only facts and observations Entries made by individuals other than the person to whom the logbook was assigned are dated andsigned by the individual making the entry bull
CALIBRATION LOG Document No OCONNOR FT1 HNu Photoionization Device Model Pl-101 Page 1 of 1
Instrument Serial No
Lamp Date Span Setting Time Calibration Temperature User
Standard Introduced Meter Response (parts per million (ppm))
Comments (See Summary of Calibration Procedures attached7
X x
User Signature Date
Task Manager Signatures Date
CALIBRATION LOG Document No OCONNORFI3 MIE MINIRAM Hand-held Aerosol Monitor Page 1 of 1
Instrument
Serial No
Date
Time
User
Standard used (zero-bag)
Meter Display
Comments
User Signature lt Date X
Task Manager Signature l Date
CALIBRATION LOG Document No OCONNORFL4 Markson Conductivity Meter Model 103 Page 1 of 1
Instrument Serial No
Date Time User
Standard Used_ Meter Display^
Comments
s
v
lt
y xy ^y
User Signature Date z V
Task Manager Signature ) i Date
CALIBRATION LOG Document No OCONNORFU5 Markson Digital pHtemperature Meter Model 95 Page 1 of 1
Instrument Serial No
Date Time User
Temperature check vs mercury thermometer
Probe reading Thermometer reading
Upon completion of calibration procedure does pH probe checkout vs pH 40 buffer Reading bull lt x pH 70 buffer Reading bull
Comments v
X x
User Signature X^ Date
Task Manager Signature Date
Document No QCONNORFT f
Page
PHOTOGRAPH LOG
Project Name
Project No
Camera and Film Specifications
FILM
ROLL FRAME
DATE nTIME PHOTOGRAPHER PHOTO NUMBER
DESCRIPTION
lt3
ni
I X
V
V
gt
Document No QOONNORm7
HEALTH amp SAFETY QUALITY ASSURANCE CHECKLIST
Page 1 of 2 Project No Site Date Completed by
A On-site Operations During Hazardous Waste Site Investigations
yes no Team understands task procedures safety plan individual roles and site history contaminants
yes no Team knowledgeable to hospital route nearest phone location and who is responsible for health and safety on site
yes no Establishment of command post and decon station with Health amp Safety Plan readily available
yes no Establish communication or line-of-site maintained
yes no Field operations conformed environmental monitoring respiratory protection or emergency response
yes no Protective clothing and respiratory protection maintained
yes no Decontamination procedures performed on the following sample containers sampling equipment and personnel
yes no Equipment protected clean calibrated and being used properly by site personnel
yes no First Aid Equipment readily available at site with checklist and eye wash
yes no Site personnel trained in CPR and First Aid
yes no Site Records maintained such as field logbooks respirator usage log incident reports in place and up-to-date and any deviations or modifications to Safety Plan
GEI Consultants Inc
uocutrenc uujmutvrLz
HEALTH amp SAFETY QUALITY ASSURANCE CHECKLIST
Page 2 of 2 Project No Site Date Completed by
B Health amp Safety Follow-up Reports
o Adherence to procedures o Accidents o Unsafe practices or conditions o Results of environmental monitoring o Corrective action
GEI Consultants Inc
Document No Q00NN0RFL9 CHAIN OF CUSTODY RECORD
DOCUMENT NUMBFR rn tLORD
RELINQUISHED DYISiONruRE OATETJMD RECEIVED DY (SIGNATURE) RELINQUISHED DY (SIOHATURER DATETI^IE RECEIVED BY (SIGNATURE)
IIElINOUISIIEO BY(SIGNATURE) DATETIMf DATETIME gt REMARKS lcNAruDn^nLADOnATonvorI
P a g e o f
Document No OCONNORFLIO
Page of G E I C o n s u l t a n t s I n c
Project No
Project Name _
Laboratory Contact
Sampler ( s ) Date Assigned Date Sampled
GEI Sample No
Sample Medium
Quantity
Sample Container
Type
Analyses Requested Remarks
Special Instructions Remarks
Document No 0CQNNDRFL11
NONCONFORMANCE REPORT
Project Project No
Auditor Audit Date Finding No
FINDING
Where found Check Lit Item
ControllingDocument Section
Task Description
Noncenformanee
Discussed with
Recommended Corrective Action
Is system correction needed to prevent recurrence Yes No If yes state recommended action
Schedule Completion Date By
CORRECTION ACTION
Correction Action by Date
QA Approval of Correction Action by Date
Date Completed Submitted by
Correction Action Verified by Date
I T E S T P I T L O G QCONNORFL12
PROJECT
LOCATIONI CLIENT
CONTRACTOR EQUIPMENTI OBSERVED BY
I DEPTH BELOW
GROUND SURFACE
I (FT)
I
I
I
1
1
1
1
I
1 REMARKS
PROJECT NO
LOCATION
GROUND EL
DATE DATUM
SOIL DESCRIPTION
PIT DIMENSIONS (FT) LENGTH WIDTH DEPTH
ltJgt G E I 1
I Docuaent No 0C0NNCRFL13
bull GEI CONSULTANTS IMC 53 Regional Drive Concord New Hampshire 03301-8500 (603)224-7979
BARN SAMPLING FORM Serial I
PROJECT INFORMATION
Project Name Source Control Pre-Oesion Studies
I Site Name(if different) OConnor Co site
Project Number
I Analytical Lab(s) ERCO EPA
GEI GC screen Other(Specify)
I METHOD OF SAMPLING
WIPE SAMPLING OF HON-POROUS SURFACES
I U000EH UALL SAMPLING UITH DRILL BIT
OUSTSOIL SAMPLING OH FLOOR SLAB
( CONCRETE SAMPLIHG ITH MORTAR BIT
(OTHER-Explain)
I
DESCRIPTION OF SAMPLE
Brief Description of Type of Material or Item Sampled
Visible Staining NO Visible Staining
Approximate Area of Stain(if any) X
LOCATION OF SAMPLE
Ground Floor Second Floor Loft
(All Measurements in Feet to 010 Foot)
Distance Along Z Axis from Reference Origin
Distance Along M Axis from Reference Origin
Height of Sample Above Floor Slab
SKETCH IN APPROXIMATE HORIZONTAL LOCATION OF THE SAMPLE COLLECTED ON FIGURE BELOU
I UALL X
I
I
UALL U UALL Y
I
I Reference Origin UALL Z
I Approximate Scale 1 inchbull 15 feet
I Sample I0(s) SIGNATURE OF SAMPLER CERTIFIES ABOVE SAMPLING RECORD
Date Time
I Sampler(s) COC Docunent Signature Date
I
CALIBRATION LOG Document No OCONNOR FL14 Dexsil L-2000 PCB Analyzer Page 1 of 1
Instrument
Serial No
Date
Time
User
Ambient Temperature deg C
Standard used (50 ppm chloride)
Reading beforeadjustingCALIBRATE knob
Reading after adjusting CALIBRATE knob
Comments
User Signature Date
Task Manager Signature Date
Document No OCONNORFL15 I BORING LOCATION DATE START FINISH
GROUND ELEVATION (NGVO ) DRILLED BY
GROUNDWATER El DATE LOGGED BY TOTAL DEPTH (FT) PG OF
I EL DEPTH S A M P L E
Its TYPE BLOWS PEN REC R E M A R K S QO SOIL ANO ROCK DESCRIPTIONSlt_land PER aFT FT NO 6 IN IN IN lt9
I
I
I
I
I
1
1
I
1
I
I
I
I
I
I BLOWS PER (-140IBHAMMER FALUNS 30T0 DRIVE NOTES A 20 IN 00 SPLIT SPOON SAMPLER
PEN-PENETRATION LENGTH OF SAMPLER OR CORE BARREL REC-RECOVERY LENOTH OF SAMPLE ROO-LENOTM OF SOUND CORES gt4INLENSTH COREO S-SPLIT SPOON SAMPLE PROJECT
I U-UNOtSTURBCO SAMPLES UF-FIXEO PISTON _ UO-OSTER8ERO bully OROUNOWATER 0 G E I
I
I
I
I
I
I
I
I
I
1 1 1 1 1 1 1 I 1 1 I
Document VoL H SC SAP Appendix C Revision 0
Date January 17 1991 Page 1
APPENDIX C
EQUIPMENT CALIBRATION PROCEDURES
Document Vol II SC SAP Appendix C Revision 0
Date January 171991 Page 2
HNu PI-101
The HNu PI-101 is factory calibrated twice a year andor if the instrument is malfunctioning Prior to field use and at the end of each day the user of the instrument will check that the instrument is still holding calibration using the following procedures
1 Prior to the calibration check check the instrument with an Organic point source (ie magic marker) prior to use to verify that it is functioning
2 Connect the rubber sampling hose from the span gas cylinder regulator to the sampling
probe of the HNu gt
3 Fully open the regulator valve gt vy
4 Note the instrument meter response after 5 to 10 Seconds y
5 If the response deviates + 15 from the coneentration of the calibration gas (this figure appears on the cylinder label) the instruihehtTeq^es factory maintenance and will not be utilized in the field until factory calibratiori^Tah alternate meter will be used after calibration checking v (
V 6 Document the calibration information Oik the appropriate equipment calibration log
(OCONNORFL2) ~y
Document VoL IISC SAP Appendix C Revision 0
Date January 17 1991 Page 3
MIE MINIRAM Model PDM-3
The MINIRAM will be factory calibrated once a year andor if the instrument is malfunctioning Prior to field use and at the end of each day the user will zero the instrument using the following procedure
1 With the MINIRAM off insert MINIRAM into Zerobag andseal the Zerobag
2 Inflate Zerobag with filtered air containing no particulates using-attached hand pumpx- V
S
3 Press ZERO button on MINIRAM and wait 30 seconds MINIRAMshould read OFF
4 Pull MINIRAM out of Zerobag
5 Press MEAS button and wait 60 seconds for MINIRAM to go through self-tests
6 The MINIRAM is now functioning and wilJLtake-readings every 10 seconds
7 Document the calibration information onthe appropriate equipment calibration log (OCONNORFL3) V
lt
v
Document VoL II SC SAP Appendix C Revision 0
Date January 171991 Page 4
MARKSON DIGITAL MODEL 103 CONDUCTIVITY METER
The Markson Conductivity meter will be calibrated prior to and following each days field use using the following procedures
1 Rinse the conductivity probe with distilled water gt
2 Pour enough Cole-Parmer conductivity calibration solution (1413 xS 25degC) in a clean plastic Ziploc bag to be able to completely immerse the conductivity probe
3 Immerse the conductivity probe in the standard solution and shakdTree any bubbles that may cling to the cell
4 Allow about 1 minute for the cell to reach equilibrium temperature x X
5 Set the cell adjust control at the bottom of the meter to display the value of 141
6 Carefully rinse cell with water after calibration and after each use V~
7 Document the calibration process onjlie equipment calibration log (OCONNORFL4)
Document VoL H SC SAP Appendix C Revision 0
Date January 17 1991 Page 5
MARKSON MODEL 95
Combined Digital pHtemperature Meter
The Markson 95 combined digital pHtemperature meter will be calibrated prior to and following each days field use using the following procedures
1 Insert electrode into digital meter The reference pin should also be properly connected Temperature probe should be plugged all the way into the ATC jack
2 Remove protective cap and push rubber sleeve such that the potassium chloride filling hole is exposed gt
3 Rinse both pH and temperature probe in distilled water 4 Immerse both pH and temperature probe into buffer 700 solution 5 Set FUNCTION switch to TEMPERATURE to read temperature 6 Set FUNCTION switch to ATC and adjust the readout to the pH value of buffer 700 corresponding
to the temperature measured in E with the CALIBRATE control See Chart 1 7 Rinse electrode and temperature probe withdistilled water 8 Immerse both pH and temperature probe into buffer^401 9 Repeat E V ~ 10 Set the FUNCTION switch to ATC and adjust the readout to the pH value of the buffer 401
corresponding to the temperature measured in Iwith the SLOPE control See Chart 1 11 Rinse the electrodes and temperatureprobe-with distilled water Model 95 is calibrated and ready
for use 12 Document the calibration process on the equipment calibration log (OCONNORFL5)
^ CHART
Temp (C) Buffer Solution 70 X -X
Buffer Solution 40
5 y 700 401 10 708 399 15 706 399 20 703 399 25 701 399 30 700 400 35 699 401 40 698 402 50 698 403 60 697 405
Document VoL II SC SAP Appendix C Revision 0
Date January 171991 Page 6
Dexsil Model L-2009 PCB Analyzer
The Dexsil PCB Analyzer will be calibrated prior to each days field use using the following procedures
Initial Preparation
1 The electrode must be filled with Orion filling solution before it is operational Fill the electrode up to the hole in the side of the epoxy body by-placing the nozzle of the filling solution in the hole and squeezing the bottle 7
2 Drain the electrode while holding it upright over thewaste beaker Grasp the epoxy body firmly in one hand and push down on the white cap which is connected to the cord The solution will then drain out of the bottom of the electrode
Vgt 3 Refill the electrode and check to makesure that the liquid is making contact between the black
cone and the plastic shell at the bottom of theelectrode If it is not making contact at all points drain the electrode again and refill
4 Plug the electrode into the back of the L-200Qj)laeeJt in a vial or rinse solution and turn the instrument on Switch the analysis knobtdfnVand wait a few minutes until the reading stabilizes
Calibration O Imdash^
1 Fill a vial about half way with 50 parts per million calibration solution
2 Turn the analysis selectQrJcnob to CAL
3 Remove the electrode from the rinse solution dry it carefully with a tissue and place it in the calibration solution SWiri the electrode gently for a few seconds and then stop Push the start button on the instrument^
4 When the READ light comes on adjust the CAL knob so that the instrument reads 50
5 Remove the electrode from the calibration solution wipe it dry and place in the rinse solution
6 If this is the first calibration since the instrument has been turned on or since the electrode has been filled repeat steps 34 and 5
7 Document the calibration information on the appropriate equipment Calibration Log (OCONNORFL14)
Document Vol II SC SAP Appendix D Revision 0
Date January 17 1991 Page 1
APPENDIX D X
list of Acronyms
Document Vol II SC SAP Appendix D Revision 0
Date January 17 1991 Page 2
ACRONYMS
ASTM American Society for Testing and Materials CLP Contract Laboratory Program CMP Central Maine Power Company DEP Department of Environmental Protection (Maine) DQO Data Quality Objectives EPA Environmental Protection Agency [US) FL Field Log FSP Field Sampling Plan ltys GEI GEI Consultants Inc gt HSP Health and Safety Plan X
MIE Monitoring Instrumentsforthe Environment MOM Management of Migration NA Not Applicable X lt OSHA Occupational Safety anaHeakh Administration OSWER Officer of SolithWaste and Emergency Response PCB PolychlorinatecFBiphenyk ppb Parts per billion v7 ppm Parts per million QA QuaUtyAssuranck ) QAO QudU$~^sitraquoance Officer QAPP QualityAssurance Project Plan QC Qukkty Gontrof PIP -Thotoionization Detector RDRA -mdashRemedial DesignRemedial Action RI Remedial Investigation ROD x^XRecbrd of Decision RPD X^Relative Percent Difference RPM Remedial Project Manager RSD Relative Standard Deviation SAP Sampling and Analysis Plan SC Source Control SOW Statement of Work TPH Total Petroleum Hydrocarbons VOC Volatile Organic Chemical or Compound
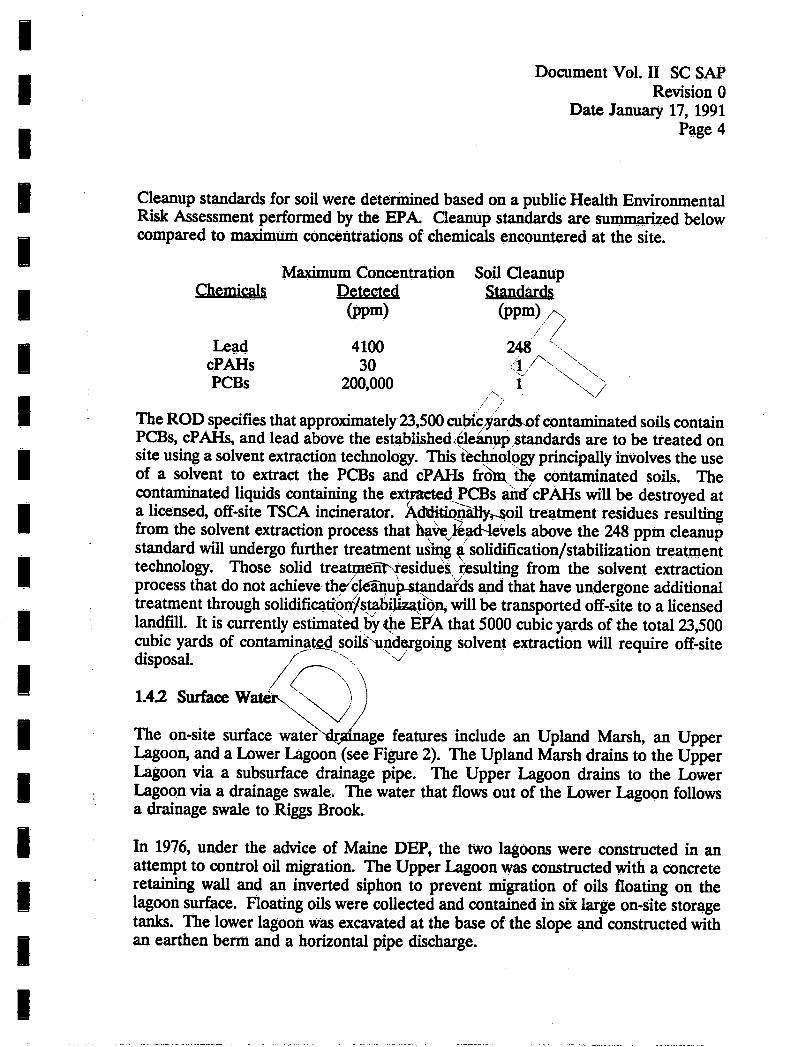
Document Vol II SC SAP Revision 0
Date January 17 1991 Page 4
Cleanup standards for soil were determined based on a public Health Environmental Risk Assessment performed by the EPA Cleanup standards are summarized below compared to maximum concentrations of chemicals encountered at the site
Maximum Concentration Soil Cleanup Chemicals Detected Standards
(ppm) (ppm)
Lead 4100 248 x
cPAHs 30 dX X PCBs 200000 1 gt bull
bullX
The RODspecifies that approximately23500 cubicyardsjof contaminated soils contain PCBs cPAHs and lead above the established Cleanup standards are to be treated on site using a solvent extraction technology This technology principally involves the use of a solvent to extract the PCBs and cPAHs from the contaminated soils The contaminated liquids containing the extracted PCBs and cPAHs will be destroyed at a licensed off-site TSCA incinerator AddkionaHyr-soil treatment residues resulting from the solvent extraction process that haveJlacNevels above the 248 ppm cleanup standard will undergo further treatment using n solidificationstabilization treatment technology Those solid treatmentNresidues jesulting from the solvent extraction process that do not achieve the cleahup-standards and that have undergone additional treatment through solidificationstabilization will be transported off-site to a licensed landfill It is currently estimated by the EPA that 5000 cubic yards of the total 23500 cubic yards of contaminated soils undergoing solvent extraction will require off-site disposal
142 Surface Wateiv
The on-site surface waterNirainage features include an Upland Marsh an Upper Lagoon and a Lower Lagoon (see Figure 2) The Upland Marsh drains to the Upper Lagoon via a subsurface drainage pipe The Upper Lagoon drains to the Lower Lagoon via a drainage swale The water that flows out of the Lower Lagoon follows a drainage swale to Riggs Brook
In 1976 under the advice of Maine DEP the two lagoons were constructed in an attempt to control oil migration The Upper Lagoon was constructed with a concrete retaining wall and an inverted siphon to prevent migration of oils floating on the lagoon surface Floating oils were collected and contained in six large on-site storage tanks The lower lagoon was excavated at the base of the slope and constructed with an earthen berm and a horizontal pipe discharge
Document Vol n SC SAP Revision 0
Date January 17 1991 Page 5
In 1977 under the direction of the Maine DEP the use of the lagoons was discontinued The water from the Upper Lagoon was placed in storage tanks and the sediments were excavated and placed in the low area shown on Figure 2 The sediments placed in the low1- area were underlain by a 1-foot-thick layer of marine clay and then covered with a clayey soil less than 6 inches thick The filling of the low area created a barrier to the previous natural surface water drainage and resulted in the formation of the Upland Marsh In an attemptto drain the marsh the subsurface drainage pipe was installed between the marsh and the Upper Lagoon in September 1978 The saturated area of the Upland Marsh presently still exists
On-site surface water quality was measured at five sampling locations These include one surface water sample from each of the lagoons and one from the Upland Marsh The surface water quality data in the RI indicated that PCBs (from unfiltered samples) were detectable in the Upper and Lower Lagponsyand in drainage from the Lower Lagoon but were not detected in surfacewater samples taken from Riggs Brook PCB concentrations in the on-site surface waters for the EowersLagoon the Upper Lagoon and Upland Marsh were 055 ppb 16 ppb^jand non-detected respectively Other contaminants of concern in the on-site urfkceTwaters were the inorganic chemicals lead and aluminum Lead was found at concentrations ranging from 36 to 13 ppb in all the on-site surface waters Additionally aluminum was detected in the on-site surface waters at concentrationsrangfog from 236 to 3740 ppb
O V Cleanup standards for surface water were determined based upon a Public Health
Environmental Risk Assessment performed by the EPA Cleanup standards are
summarized below compared to themaximum concentration of chemicals encountered
at the site N v
Surface Water Maximum Concentration Cleanup
Chemicals xD6tected Standards (PPb) (ppb)
Lead 13 194 Aluminum 3740 87
PCBs 16 0065
The selected remedy for surface water remediation at the site is pumping of surface water from the Upper and Lower Lagoons and Upland Marsh and disposal off-site unless otherwise approved by EPA The ROD indicates that the approximately 150000 to 195000 gallons of surface water are contained in the Upland Marsh and Upper and Lower Lagoons
Document Vol II SC SAP Revision 0
Date January 17 1991 Page 6
143 Sediment
The sediment sampling program conducted during the RI consisted of a total of 23 sediment samples from 19 locations both at on-site and off-site locations A total of six sediment samples were collected from the Upland Marsh Upper Lagoon and Lower Lagoon consisting of two samples from each of these surface water bodies Other samples were collected from Riggs Brook and drainage swales between the lagoons and Riggs Brook
xPCBs were detected in the sediment samples obtained from thexdge of the Upland Marsh both on-site lagoons and the Lower Lagoon drainage area leading into Riggs Brook PCB concentrations were highest in the Upper Lagoon (up to 1100 ppm) but decreased significantly downstream in the Lower iiigoon PCB concentrations were lowest in the drainage swale downstream fronii dieLower Lagoon (approximately 4 ppm) Cleanup standards for the sedimentswere~detennined based on a Public Health Environmental Risk Assessment performed by the ERA Cleanup standards are summarized below compared to maximiimgtCQncentrations of chemicals encountered in sediment samples from the Upland MSrsh Upper Lagoon and Lower Lagoon
Vmdash ( Sediment
MaximumConcentration gt Cleanup Chemicals Detected-^ v Standards
( (PPF1) -mdash (PPm)
Lead 28 248 cPAHs y 1 PCBs 1100 1
The ROD indicates that the cm-site sediments will be dredged and the sediment containing chemicals above^tbe established cleanup standards will be treated using the solvent extraction technology as described in Section 141
144 On-Site Barn Characteristics
The barn has been reported to formerly house scrap operations A surficial soil sample taken from within the barn (JSS1) during the RI was collected and analyzed for the presence of PCBs and lead The exact nature or matrix of the surficial soil (eg dust concrete wood) collected from within the barn could not be ascertained from the available documents The results of the PCB screening indicated a concentration of 96 ppm PCBs Lead was detected at a concentration of 1610 ppm No analysis for cPAHs was performed on the sample from the barn
Document Vol II SC SAP Revision 0
Date January 17 1991 Page 7
In the ROD EPA set soil cleanup standards for the site of 1ppm PCBs 1ppm cPAHs and 248 ppm lead The cleanup standards for barn materials were not specified in the ROD by EPA However the ROD specified that the barn would undergo decontamination procedure if contamination was present above cleanup standards (to be determined) through collection of soil dust and other loose material and these materials would be combined with the other contaminated soils and sediments for on-site solvent extraction treatment Large scrap items in the barn would then be removed for disposal off-site and the barn structure would be sampled for detection of the presence of contamination Following sampling and analysis of the barn structure the barn would be demolished and transported to an off-site facility for appropriate disposal ^gt
N
Document Vol II SC SAP Revision 0
Date January 17 1991 Page 8
2 SAMPLING AND DATA QUALITY OBJECTIVES
21 General
Sampling of soils surface water sediments and the on-site barn and its contents will be performed during the Source Control (SC) component of the Pre-Design Study Pre-Design SC sampling results will be used in the design of the SourceControl component of the remedy and development of the treatability testing program for soil and sediment
Pre-Design SC sampling will include N
Collection of surface water samples from the Upland Marsh and Upper and Lower Lagoons in April 1991 V
x
Collection of sediment samples from the Upland Marslkahd Upper and Lower Lagoons in April 1991 ^
Collection of soil samples from test pits and^Orihgsrin April 1991
bull Collection of samples of soil woodimckconcrete from the on-site barn floor and Walls and wipe samples from debris andlquipment located within the barn in May 1991
V-X7EPAs guidance document Data Quality Objectives for Remedial Response Activities (OSWER Directive 93550-78Jdarch 1987) identifies four analytical levels
Level I - field screeningoranalysis using portable instruments Results are often not compound specific and o^ qualitative in nature
Level II - field analyses using mbresophisticated portable analytical instruments Results are more reliable in terms of compound identification and may be semi-quantitative
Level El - laboratory analyses by established referenced methods Results are quantitative and compound specific
Level TV - EPA Contract Laboratory Program (CLP) services utilizing rigorous QAQC protocols and documentation
Level V - Laboratory analyses by non-standard methods Identified in the CLP asspecial analytical services
Document Vol II SC SAP Revision 1
Date March 28 1991 Page 9
A combination of Level I Level in and Level IV analytical protocols will be specified during Pre-Design SC sampling EPA Contract Laboratory Program (CLP) protocols prescribed in the 1988 Organic and Inorganic Statement of Works will be utilized for laboratory analysis of target compounds (PCBs cPAHs lead and aluminum) in surface water sediment soil and barn samples The analytical protocols that will be utilized for Pre-Design SC sampling are detailed in the SC Quality Assurance Project Plan (QAPP) included as Volume I of the SC SAP
22 Soils
Soil samples will be collected and analyzed to provide additional data for comparison with cleanup standards for design of the Source Control program at the OConnor Site Data will be used to refine the previously estimated volume of soils contaminated at various concentrations above the cleanup standards and to provide additional information at areas with apparent data gaps on the lateral and vertical extent of soil with PCB concentrations greater than 1 ppm Soil also will be collected at specified locations to provide samples for solvent extraction treatability bench-scale testing Samples selected for treatability testing will contain PCBs at concentrations previously not examined during limited bench-scale testing performed during the Feasibility Study (FS) The effectiveness of solvent extraction on removal of lead cPAH and PCB contamination will be examined during the bench-scale treatability studies performed during Pre-Design
The soil sampling program performed during the RI was designed to estimate the horizontal and vertical distribution of soils contaminated with PCBs lead and cPAHs above the cleanup standards The distribution of PCBs lead and cPAHs are summarized in the RI on Figures 4-8 4-10 and 1-10 respectively GEI identified several inconsistencies in the distribution of contaminated soils within the summary figures For instance the distributions of PCB contamination shown on Figures 1-6 and 4-8 in the RI in the northern portion of the site near TWA III do not agree Also previous soil sampling did not consistently confirm the horizontal and vertical limits of PCB contamination The vertical limits of the PCB contaminationwere not adequately identified for remedial design purposes near transformer work areas and along drainage pathways where PCB migration has occurred
The effectiveness of solvent extraction as the selected remedy for treating the on-site soils was not fully demonstrated during the FS The bench-scale testing that was performed during the FS did not investigate the full range of contamination levels and recovery efficiencies from different soil types that exist on the site
There are three primary objectives for collection of soil quality data during the Pre-Design studies
Document Vol II SG SAP Revision 1
Date March 28 1991 Page 10
1 Collect additional data with close control of analytical precision to evaluate datagaps and inconsistencies reported during the RI The collection of these data will primarily be performed near TWAs and drainage pathways
2 Refine the previously estimated volume of soils contaminated at various concentrations above the cleanup standards
3 Evaluate theselected remedy of solvent extraction through bench-scale testingof soils with specific ranges of PCB concentrations
All soil samples collected for treatability bench-scale testing will also have an aliquot collected for PCB analyses by Ceimic Corporation of Narragansett Rhode Island This will provide added confidence that designated samples are within the specified ranges of PCB concentrations for solvent extraction bench-scale testing
In order to facilitate comparison of Pre-Design Study soil quality with RI study soil quality rigorous QAQC protocols and documentation will be needed All sampleswill be analyzed by Ceimic Corporation using 1988 CLP protocols Analytical Level IV (CLP QAQC and documentation) will be utilized on 20 percent of the soil samples collected The remaining 80 percent will be analyzed according to 1988 CLP protocols utilizing Analytical Level III (CLP QAQC butwithout CLPdocumentation) These serviceswill provide detection limits at or below the ROD Cleanup Standards
During Pre-Design sampling equipment blanks will be collected and analyzed after decontamination of sampling equipment to identify artifact contamination that could result from incomplete decontamination of equipment Trip blanks will also be included during sample shipment to identify cross-contamination during transportation to Ceimic Corporation The laboratory and field QAQC procedures described above will enable the precision required to satisfy the objectives of the soil sampling component of this study
23 Sediments
Sediment samples will be collected and analyzed to provide additional data for comparison with the cleanup standards for design of the Source Control program at the OConnor site Data will be used to supplement the sediment quality data previously collected in the RI for a refined estimate of the levels of lead cPAH and PCB contamination in the sediments of the Upland Marsh Upper Lagoon and Lower Lagoon In addition a composite sediment sample from the Upper Lagoon and a composite sediment sample from the Lower Lagoon will be collected for solvent extraction treatability bench-scale testing Treatability testing on contaminated sediments was not performed during the FS The effectiveness of solvent extraction on removal of lead cPAHs and PCBs from sediments will be examined during the bench-scale treatability studies performed during Pre-Design
Document Vol II SC SAP Revision 1
Date March 28 1991 Page 11
The sediment quality data collected during the RI was limited Only two sediment samples were collected from the Upland Marsh Upper Lagoon and Lower Lagoon In addition limited data have been previously collected regarding the volume of contaminated sediment on-site
There are three primary objectives for sediment quality data to be collected during Pre-Design studies
1 Collect additional data with close control of analytical precision to examine levels of contamination in sediment at locations previously not investigated This will include two additional samples from the Upper Lagoon two additional samples from the Lower Lagoon and six additionalsamples from the Upland Marsh The investigation in the Upland Marsh will be directed towards delineating the extent of contamination in the westerly (upstream) direction
2 Refine the previously estimated volume of sediment in the Upland Marsh Upper Lagoon and Lower Lagoon
3 Evaluate the solvent extraction remedy effectiveness on treatment of sediment through bench-scale testing
In order to facilitate comparison of Pre-Design Study sediment quality with RI study sediment quality rigorous QAQC protocols and documentation will be needed Only sediment samples containing greater than 30 percent solids (based on visual observations) will be submitted for analysis After sample collection in the field percent volume of settled sediment in the sample container will be compared to the percent volume of free water Samples will be submitted to the laboratory for analysis if the volume of settled sediment in the sample container exceeds 50 percent of the total volume of the sample All samples will be analyzed by Ceimic Corporation of Narragansett Rhode Island following 1988 CLP protocols Analytical Level IV (CLP QAQC and documentation) will be performed by Ceimic on 20 percent of the sediment samples collected The remaining 80 percent will be analyzed by Ceimic utilizing Analytical Level in (CLP QAQC but without CLP documentation) These services will provide the detection limits at or below the ROD Cleanup Standards
During Pre-Design sampling equipment blanks will be collected and analyzed after decontamination of sampling equipment to identify artifact contamination that could result from incomplete decontamination of equipment Trip blanks will also be included during sample shipment to identify cross-contamination during transportation to Ceimic
The laboratory and field QAQC procedures described above will enable the precision required to satisfy the objectives of the sediment sampling component of this study
Document Vol II SC SAP Revision 1
Date March 28 1991 Page 12
24 Surface Water
The OConnor SiteStatement of Work for Remedial DesignRemedial Action requires that surface water contained within the Upper and Lower Lagoon and in the Upland Marsh be drained collected and transported off-sitefor treatment unlessotherwise instructed by EPA
The three primary objectives for surface water data to be collected during the Pre-Design Studies are to
1 Probe surface water depths in Lagoons and Upland Marsh to obtain a better estimate of surface Water volumes to be handled during remediation
2 Evaluate changes in surface water quality that may have occurred during the approximately three-year period since sampling during the RI and evaluate extent of surface water contamination in the Upland Marsh which is at the upstream edge of the PGB contamination area
3 Collect additional data to design an appropriate program for surface water diversion pumping treatment and disposal Off-site disposal destinations as well as on-site treatment and disposal options will be examined in more detail during the Pre-Design Study
All surface water samples will be submitted to Ceimic Corporation for analysis of PCBs aluminum and lead All of these samples will be analyzed following 1988 CLP protocols including CLP QAQC and CLP documentation (Analytical Level IV) One additional sample will be collected from each surface water body and submitted to Ceimic for Total Suspended Solids Analysis (EPA Method 1602) utilizing Analytical Level III
2JS Barn
The available data for the extent of contamination of barn materials consists of one sample point The surficial soil sample collected was not described such that it is known whether the sample consisted of dust the concrete slab soil within cracks of the slab or debris samples within the barn The elevated levels of PCBs and lead within the sample may not be representative of the majority of the loose materials within the barn Furthermore no wipe sampling on non-porous debris or sampling of the wooden barn structure was performed during the RI
Document Vol II SC SAP Revision 0
Date January 17 1991 Page 13
Cleanup standards for target chemicals listed in the ROD have not yet been established by EPA for barn materials The ROD indicates that the Toxic Substance Control Act (TSCA) Spill Cleanup Policy and Disposal Regulations (40 CFR Part 761) may be used in lieu of site-specific determination of acceptable levels
Samples of selected media within the barn will be collected and analyzed to provide an initial data set to establish the degree of contamination present within the barn Data will be used in developing the work plan for decontamination and demolition of the barn and to determine appropriate disposal sites for barn demolition debriSNand loose debris within the barn Depending on data results an evaluation will be made tbvdetermine whether additional sampling will be required prior to demolition to betterseqnence demolition activities so that PCB-contaminated material can beSeparated from non-contaminated building materials and debris
ltx All soil wood and concrete barnsamples will besubmitted to Ceimic Corporation (Ceimic) of Narragansett Rhode Island for analysis of PCBs cPAHsgtand lead Wipe samples of debris will be submitted to Ceimic for analySis-ofPCBs All samples will be analyzed following CLP protocols Analytical LeveK IV-requiring CLP QAQC and reporting requirements will be utilized for 20 percent of the5amples Analytical Level in utilizing CLP analytical protocols but without the documentation requirements of CLP will be specified for the remainder of the
Document Vol II SC SAP Revision 0
Date January 17 1991 Page 14
3 HEALTH AND SAFETY
A Health and Safety Plan for the Source Control Field Sampling Plan is presented in Appendix A All personnel involved in the sampling program have been trained in accordance with the requirements of the Occupational Safety and Health Administration Regulation OSHA 1910120 Hazardous Operations and Emergency Response and are enrolled in a comprehensive medical monitoring program
A list of personnel authorized to perform work on this project ^and listing of their participation in personnel training and health monitoring programs^arepresented in the Health and Safety Plan gt
Document Vol II SC SAP Revision 1
Date March 28 1991 Page 15
4 SAMPLING LOCATION AND FREQUENCY
41 Soils
411 General
In general the soil sampling program includes collection of the following two basic categories of samples
1 Soil samples collected from test pits for possible bench-scale testing and
2 Soil samples collected from test pits and borings to fill data gaps on the lateral and vertical extent of soil contamination above cleanup standards and to refine estimates of the quantity of contaminated soils
Figure 3 shows the locations of test pits and borings planned for this investigation These locations were based on the depth delineation of 1 ppm for Total PCBs presented in the Remedial Investigation Table 1provides ageneral sampling rationale including test pit and boring identification numbers target sampling depth and elevation anticipated PCB concentration level and soil type A summary of the analyses to be performed on soil samples including replicates and blanks is shown in Table 2
A total of 12 soil samples for possible bench-scale testing will be collected from test pits during April 1991 Two samples of each soil type indicated below will be collected within the specified ranges of PCB concentrations Each sample will have a minimum volume of about 05 cubic feet (about 60 lb weight) to provide sufficient soil for bench-scale testing
PCB Concentration Range fppml Soil Types
1 to 10 Clay and Fill 10 to 20 Clay 20 to 50 Clay 50 to 500 Clay and FiU
During the RI three soil samples were collected for bench-scale treatability testing with initial PCB concentrations of 1000 4000 and 22000 ppm However sample locations had been selected to obtain samples with PCB concentrations in the range of 250 to 700 ppm based on PCB concentration contours developed during the RI
Document Vol II SC SAP Revision 1
Date March 28 1991 Page 16
Therefore PCB concentration contours developed from the RI data do not precisely indicate the extent and level of contamination
In order to gain a higher degree of confidence that samples within each specific PCB concentration range have been collected GEI will perform field PCB screening with a Dexsil L-2000 PCB analyzer to estimate the soil PCB concentration range prior to collecting the soilsample Aliquots of the 12 bench-scale soilsamples will be collected for confirmatory testing for PCB concentrations by Ceimic of Narragansett Rhode Island utilizing 1988 CLP protocols
GEI will select the soil samples for bench-scale testing after receiving the CLP laboratory results of the PCB concentrations If the laboratory data do not indicate that at least one of the two soil samples was collected from the targeted concentration ranges and soil types an additional contingency round of soil sampling may occur Sampling locations for this contingency sampling round will be selected based Upon the PCB data summarized in the RI and the data collected by GEI during the previous SC sampling round
A total of 40 soil samples (including replicates) will be collected from test pits and borings during April 1991 to fill data gaps on the extent and quantity of contaminated soil The soil sampleswill be collected at the approximate elevation specified for each sampling location as indicated in Table 1 Sample elevations of the bench-scale samples may vary if PCB concentrations in samples screened with the Dexsil L-2000 PCB analyzer are not within the ranges indicated below
Acceptable Screening Target PCB Concentrations Range PCB Concentration Range
(ppm) (ppm)
1 to 10 1 to 10 10 to 20 10 to 20 20 to 50 25 to 45
50 to 500 200 to 350
The soil samples will be analyzed for PCBs ePAHs and lead by Ceimic of Narragansett Rhode Island utilizing CLP protocols Four soil samples (including two selected for bench-scale treatability testing) will also be analyzed for total organic carbon (TOC) cation exchange capacity (CEC) and pH
Document Vol II SC SAP Revision 1
Date March 28 1991 Page 17
Detailed descriptions of the soil sampling and decontamination methods are provided in Section 5 Appendix A and the QAPP Contractors will be used for surveying performance of test pits and drilling of borings All contractors will be required to document that they have completed health and safety training that complies with OSHA Standard 1910120 In generalstakes marking the planned locationsof test pits will be surveyed by a registered surveyor prior to test pit excavation The Stakes will serve as temporary bench marks for reference during location of test pit samples A rubber-tired type backhoe will be used to excavate test pits for planned sampling locations less than or equal to5 feet below ground surface The backhoe and operator will be supplied by HE Sargent Inc of Lewiston Maine capable of operating at hazardous waste sites under Level C personnel protection Soil samples will be collected from in-situ test pit excavations by GEI personnel using a stainless steel shovel or trowel
Due to anticipated shallow ground water conditions a drill rig will be used to advance test borings for soil sampling at locations where the target sampling location is greater than 5 feet below ground surface The soil samples will be collected using a split-spoon sampler Drilling and sampling will be performed by Northeast Diamond Drilling Company of Union Maine capable of working on hazardouswaste sites under Level C personnel protection
412 Soil Analysis Program
Analytical procedures are identified in the Quality Assurance Project Plan (QAPP) The samples will be analyzed using 1988 CLP methods for PCB cPAHs and lead by Ceimic of Narragansett Rhode Island EPA methods 9045 9060 and 9080 will be used to analyze soils for pH TOC and CEC respectively A summary of the analyses to be performed on soil samples including replicates and blanks is shown in Table 2 Samples will be collected in I-Chem glassware or equivalent and stored at 4 deg C as described in Section 6
A series of quality control blanks (replicates and blanks) will be collected by GEI and analyzed by the laboratory to aid in data assessment as discussed in the Quality Assurance Project Plan (QAPP) All quality control samples will be labelled with false sample identification as shown in Table 2 in order to avoid laboratory bias
Sampling equipment blanks and aqueous trip blanks will be submitted for every ten soil samples during the sampling program to check for the presence of cross-contamination These will provide a quality control check for decontamination and handling practices The trip blanks will contain laboratory-supplied organic-free water and will accompany the shipment of soil samples during storage and shipment The trip blanks will be analyzed for PCBs (sample identification will be TP26-TP29) Wipe
Document Vol II SC SAP Revision 1
Date March 28 1991 Page 18
samples will be collected from the shovel or hand trowel and split-spoon sampler (sample identification numbers TP30-TP33 and TP34-TP37 respectively) after decontamination and will be analyzed for PCBs Wipe sampling procedures are described as part of barn sampling procedures in Section 562 One replicate sample will be collected for every ten soil samples Replicate sample locations and identification numbers are indicated on Table 2
413 Soil Sample Designation
Each piece of soil sample glassware will be affixed with a self-sticking adhesive label Each label will be completed with an indelible marker to contain the following information
GEI Consultants Inc Site Name Project Number Sampling Date and Time Sample Number Samplers Initials Analysis Requested
The sample number is composed of a series of information to identify the sample as unique to the sampling point and sampling event The sample number labelled in the field and referred to on all associated documents is composed of the following
Matrix Project Sampling Location Sample Number
Soil - 90393 -TP2-SS1
The example sample number above indicates that soil sample SSI was collected from Test Pit No 2 under project number 90393
4JZ Sediment
431 General
Sediment samples will be collected by GEI from the Upland Marsh the Upper Lagoon and the Lower Lagoon during April 1991 A summary of the laboratory analyses of sediment samples is listed on Table 3 Procedures for sampling and equipment decontamination are provided in Section 5 Appendix A and the QAPP
Document Vol II SC SAP Revision 1
Date March 28 1991 Page 19
In general the sediment sampling program includes collection of the following two basic categories of samples
1 Two composite sediment samples collected using a clam-shell sampler for bench-scale testing
2 Eleven sediment samples (including one replicate) collected with a tube sediment sampler to provide additional data on sediment quality and for estimating the quantity of contaminated sediments
The two composite sediment samples collected using a clam-shell type sampler for bench-scale testing will be collected within the Upper Lagoon and Lower Lagoon at the locations shown on Figure 4 Based on the data in the RI the Upper Lagoon contained the higher sediment concentrations of PCBs
The eleven sediment samples collected to provide additional data on sediment quality and for estimating the quantity of sediments will be collected at the locations shown on Figure 4 As shown on the figure six sediment sampling locations were chosen for the Upland Marsh two locations were chosen for the Upper Lagoon and two locations for the Lower Lagoon
Detailed descriptions of the methods and equipment to be used during the sampling program are provided in Section 5 In general a temporary reference bench mark will be surveyed and staked adjacent to each surface water body by a surveyor licensed in the State of Maine and OSHA-approved for working on a hazardous waste site The actual sediment sampling locations will be measured by tape and compass bearings from the reference bench mark prior to sampling For the bench-scale sample a 5shygallon sample container will be filled with sediment from the dredge type sample The samples for providing additional data on sediment PCB concentrations will be collected with a tubesediment sampler pushed into the complete thickness of sediment at the sampling location All sampling equipment will be decontaminated using methanol and distilled water rinses before each use
4SL2 Sediment Analysis Program
Analytical procedures are identified in the Quality Assurance Project Plan (QAPP) Sediment samples will be submitted to Ceimic of Narragansett Rhode Island for laboratory analysis utilizing CLP protocols The samples collected for bench-scale testing will be analyzed for PCBs The remainder of the sediment samples will be analyzed for PCBs cPAHs and lead One sediment sample will also be analyzed for total organic carbon (TOC) cation exchange capacity (CEC) and pH by EPA methods 9060 9080 and 9045 respectively A summary of analyses to be performed on
Document Vol II SC SAP Revision 1
Date March 28 1991 Page 20
sediment samples including replicates and blanks is shown in Table 3 Samples will be collected in I-Chem glassware or equivalent and stored at 4degC as described in Section 6
A series of quality control samples (replicates and blanks) Will be collected by GEI and analyzed by the laboratory to aid in data assessment as discussed in the Quality Assurance Project Plan (QAPP) All qualitycontrol samples will be labelled withfalse sample identification as shown in Table 3 in order to avoid laboratory bias
Two sampling equipment blanks and one aqueous trip blank will be submitted during the sampling program to check for the presence of cross-contamination These will provide a quality control check for decontamination and sample handling practices The trip blank containing laboratory-supplied organic free water will accompany the shipment of sediment samples and will be analyzed for PCBs (Sample ID SED7) Wipe samples will be collected from the tube sediment sampler and dredge sampler after decontamination and will be analyzed for PCBs (sample identification numbers SED9 and SED8 respectively) Wipe sampling procedures are described as part of barn sampling procedures in Section 562 One replicate sample will be collected during sediment sampling Replicate sample location and identification is indicated on Table 3
423 Sediment Sample Designation
Each piece of sediment sample glassware will be affixed with a self-sticking adhesive label Each label will be completed with an indelible marker to contain the following information
GEI Consultants Inc Site Name Project Number Sampling Date and Time Sample Number Samplers Initials Analysis Requested
The sample number is composed of a series of information to identify the sample as unique to the sampling point and sampling event The sample number labelled in the field and referred to on all associated documents is composed of the following
Matrix Project Surface Water Body Sample Location
SED - 90393 - UM - SED1
Document Vol II SC SAP Revision 1
Date March 28 1991 Page 21
The example sample was obtained from sample location SED1 in the Upland Marsh under project number 90393 The surface water body designations for the Upper Lagoon and the Lower Lagoon will be UL and LL respectively
43 Surface Water
431 General
Surface water quality data consisting of two samples each from the Upland Marsh Upper Lagoon and the Lower Lagoon will be collected by GEI in April 1991 Sampling locations are shown on Figure 4 Surface water sampling locations will be determined in the field by tape and compass bearings from the temporary reference bench mark established for sediment sampling A summary of the analyses to be performed on surface water samples including duplicates and blanks is shown on Table 4 Detailed descriptions of the sampling methods to be used during surface water sampling are provided in Section 5 In general the depth of the water at the sampling location will be measured at each sampling location with a weighted tape measure prior to collecting the surface water sample A water sample will be collected after lowering a stainless steel Kemmerer sampling device one-half the total depth of the water column All sampling equipment will be decontaminated using methanol and distilled water rinses before each sampling event
433 Surface Water Analysis Program
Analytical procedures are identified in the Quality Assurance Project Plan (QAPP) All of the surface water samples will be analyzed using 1988 CLP methods for PCBs aluminum and lead One sample from each surface water body will also be Submitted for Total Suspended Solids Analysis (EPA Method 1602) A summary of the analyses to be performed on surface water samples including duplicates and blanks is shown on Table 4 Surface water samples will be submitted to Ceimic Corporation for laboratory analysis Samples will be collected in I-Chem glassware or equivalent and stored at 40 C as described in Section 6
A series of quality control samples (duplicates and blanks) will be collected by GEI and analyzed by the laboratory to aid in data assessment as discussed in the Quality Assurance Project Plan (QAPP) All quality control samples will be labelled with false sample identification as shown in Table 4 and described below in order to avoid laboratory bias
One sampling equipment blank and a trip blank will be submitted during each sampling round to Check for the presence of cross-contamination These will provide a quality control check for decontamination and handling practices One trip blank
Document Vol II SC SAP Revision 1
Date March 28 1991 Page 22
sample consisting of laboratory-supplied organic-free and de-ionized water will accompany the samples during storage and shipment and will be analyzed for PCBs aluminum and lead (sample identificationwill be SW4) A samplingequipment blank will be collected by pouring laboratory-supplied organic-free and de-ionized water through the Kemmerer sampler at the end of the sampling program The sampling equipment blank will then be analyzed for PCBs aluminum and lead (sample identification will be SW5)
One surface water duplicate will also be collected each sampling round Duplicate sample location and identification is indicated on Table 4
433 Surface Water Sample Designation
Each piece of sample glassware will be affixed With a self-sticking adhesive label Each label will be completed with an indelible marker to contain the following information
GEI Consultants Inc Site Name Project Number Sampling Date and Time Samplers Initials Analyses Requested
The sample number is composed of a series of information to identify the sample as unique to the sampling point and sampling event The sample number labelled in the field and referred to on all associated documents is composed of the following
Matrix Project Surface Water Body Sampling Location
SW - 90393 - UM - SW1
The example sample number above indicates thata surface water sample was obtained from the Upland Marsh at location SW1 under Project Number 90393 The surface water body designations for the Upper Lagoon and the Lower Lagoon will be UL and LL respectively
Document Vol II SC SAP Revision 1
Date March 28 1991 Page 23
44 Barn
441 General
A total of approximately 30 samples of various media within the barn will be collected by GEI during May 1991 The types of media collected will generally consist of wood fragments from barn walls dust concrete and wipes on non-porous debris within the barn The exact sample locations will be primarily determined in the field based on observations during sampling (eg staining on soils concrete or wood) Based on a site visit by GEI on December 19 1990 preliminary sample locations for barn materials were chosen as shown in Figure 5 These preliminary locations will enable representative sampling of general debris and staining in the barn and indicates the general sampling strategy which will be employed during Pre-Design Final sampling locations may be modified during the program based on closer observation of equipment barn materials and evidence of staining
Detailed descriptions of the methods to be used during the barn sampling program are provided in Section 5 In general a survey of the general types of materials present in the bam and locations of apparent staining of surficiial materials or debris will be recorded on a plan Following the survey representative areas within the barn will be sampled A total of 12 wipe samples will be collected (eg steel shelves boat wood stove electric meters etc) by wiping a 100 cm2 area with laboratory-prepared sampling wipes A total of ten samples of Wood from the walls of the barn will be collected by using a wood boring bit and wood chisel A total of four samples of loose dust will be collected from the floor of the concrete slab of the barn using disposable nylon brushes and stainless steel trowels Finally a total of four samples of concrete will be collected from areas of visible staining and one unstained area by drilling the concrete to a maximum depth of 12 inch in a 100 cm2 area All non-disposal steel sampling equipment will be decontaminated using methanol and distilled water rinses before use at each sampling location
442 Barn Analysis Program
Analytical procedures are identified in the Quality Assurance Project Plan (QAPP) Three field equipment blanks and three trip blanks will be submitted during the barn sampling program to check for the presence of cross-contamination These will provide aquality control check on decontamination and handling practicesAsummary of the analyses to be performed on each sample matrix and the quality controlsamples is shown in Table 5
Document Vol II SC SAP Revision 1
Date March 28 1991 Page 24
Wipe wood dust and concrete samples will be submitted to Ceimic in Narragansett Rhode Island for laboratory analysis Wood dust and concrete samples will be analyzed for PCBs cPAHs and lead Samples will be collected in I-Chem glassware or equivalent provided by Ceimic and preserved and stored as described in Section 6
The objective of the barn sampling program is to provide a preliminary assessment of the degree of contamination present within the barn (see Section 2) It may be difficult to ensure that representative replicates can be made of the various matrices during sampling Therefore no replicate samples of barn materials will be collected during this initial sampling effort
Aqueous trip blank wipe samples will accompany the samples during storage and shipment and will be analyzed for PCBs (sample identification will be PTB1-PTB3) Sampling equipment blank wipes will be made following decontamination of all steel sampling equipment at various times during the sampling program The steel equipment wiped will include the hole saw trowel and the drill bit used for barn wall dust and concrete sampling respectively The equipment wipe samples will then be analyzed for PCBs (sample identification will be PEB1-PEB3)gt
443 Barn Sample Designation
Each piece of sample glassware will be affixed with a self-sticking adhesive label Each label will be completed with an indelible marker to contain the following information
GEI Consultants Inc Site Name Project Number Sampling Data and Time Sample Number Samplers Initials Analysis Requested
The sample number is composed of a series of information to identify the sample as unique to the sampling point and sampling event The sample number labelled in the field and referred to on all associated documents is composed of the following
General Sample Location Project Sample Type Sample
BARN - 90393 - D2
Document Vol II SC SAP Revision 1
Date March 28 1991 Page 24a
The example sample number above indicates that a barn sample was obtained under project number 90393 and was the second dust sample collected The designations for the wipe samples will be P wooden samples W dust samples D concrete samples C and other samples O
Document Vol II SC SAP Revision 1
Date March 28 1991 Page 25
5 SAMPLING EQUIPMENT AND PROCEDURES
51 Air Monitoring
Short-term air monitoring will be performed regularly on-site during the Source Control (SC) sampling program A HNu photoionization detector (PID) and an MIE Model MINIRAM hand-held aerosol monitor (HAM) will be used for air monitoring The PID is capable of detecting total ionizable compounds (typically VOCs) and the HAM detects solid or liquid particulates in air which often take the form of dust smoke fumes and mists Each air monitoring instrument will be operated in accordance with the requirements specified in the Health and Safety Plan provided in Appendix A Readings from the PID and HAM will be recorded in the Project Field Log Book (see Appendix B) Calibration procedures for the PID (HNu Model PI-101) and the HAM (MIE Model MINIRAM) are provided in Appendix C
52 Soil Sampling
521 General
Soil sampling locations are shown on Figure 3 Table 1 lists each soil sampling location planned approximate sample depth and rationale for sample collection
Prior to sampling a surveyor registered in the State of Maine will survey the exact location of each test pit and boring location and provide a temporary stake that will function as a bench mark for horizontal and vertical control within 20 feet of each test pit and at each boring Sample locations within test pits will be by tape and compass bearing methods
Soil sampling will be performed with strict adherence to the procedures described below A list of equipment requirements for the soil sampling program is provided in Table 6 In general excavation of soil to the target depth in test pits will be performed with a backhoe for sampling to 5 feet below ground surface The backhoe and operator will be supplied by HE Sargent Inc and the operator will be equipped with Level C personnel protection (see Appendix A) A bombardier or truck-mounted drill rig operated by Northeast Diamond Drilling by personnel equipped with Level C protection will be utilized for sampling points greater than 5 feet below ground surface Soil samples collected by GEI for possible bench-scale testing will be obtained only at test pit locations Ambient air monitoring will be performed by GEI regularly while working on-site for health and safety monitoring Mobilization
Document VoL II SC SAP Revision 1
Date March 28 1991 Page 26
of equipment and transportation of materials over the site during the soil sampling program will avoid heavily contaminated transformer work areas when possible to reduce dispersing PCBs to other areas Drilling and excavating equipment will be decontaminated under the supervision of GEI prior to use at each sampling location following strict decontamination procedures described in Appendix A and below Sampling equipment will be decontaminated by GEI prior to each sampling event as described below All soil sampling operations within the site will be performed using Level C dermal and respiratory personnel protective equipment to protect against PCB-contaminated dust levels which are likely to exceed 1 mgm3 during sampling The detailed Health and Safety Plan that will be followed during soil sampling is provided in Appendix A
522 Soil Sampling Methods for Test Pits
A minimum of a two-person crew in addition to the backhoe operator or the drill rig crew will be provided by GEI during the sampling program
All soil samples will be collected from test pits by GEI with a shovel or trowel following excavation to the appropriate depth with a rubber tire backhoe as follows
1 Check the survey stakes for the proper test pit number identification and location
2 Place polyethylene sheeting on each side of the test pit for staging the excavated soils from the test pit
3 A standard rubber tire type backhoe will perform the soil excavation to the planned sampling depth All soil excavated from the test pit will be placed on the plastic sheeting adjacent to the test pit The top 2 feet of excavated soil will be cast to one side of the test pit on the sheeting and the bottom 3 feet of soil will be cast to the opposite side to avoid mixing soils with potentially significantly different levels of contamination After completion of sampling soil will be backfilled at a similar depth from which it was excavated
4 All excavation activities will be continuously observed by an engineer or geologist from GEI A test pit log form (OCONNORFL12) will be completed by GEI for each test pit performed and will include the following information
Document Vol II SC SAP Revision 0
Date January 17 1991 Page 27
Name and Location of Job Date Excavation and Test Pit Number Approximate Ground Surface Elevation at Test Pit Total Depth of Test Pit Dimensions of Test Pit Location and Depth of Soil Sample Relative to Stake Reference Method of Soil Sample Acquisition (Shovel Trowel) Volume of Soil Sample J Soil and Stratigraphic Descriptions x
Ground Water Levels (if encountered) y ^v Air Monitoring Information v Other observations Such as soil staining buried debris etc
5 At least one photograph will be taken oflta wall of each test pit from within the test pit with a scale for comparison to indicate soil layering or staining In addition one photograph shall be taken of thertesVpit from the ground surface also showing sample locations withinthe-test pit Photographs of the test pits will be marked to include site locationxjdbmumber^test pit number date and time A photograph log sheet will be maintained fampMuture reference
6 The target soil sampling elevation will be determined by GEI using a level and rod
7 Soil sampling will begin from within the test pit only after the side walls of the pit have been properly^sloped back in accordance with OSHA requirements (see Health and Safety Plan^ Appendix A) All samples collected will be identified on the test pit logazid in the field book Information about the sample including sample number^de^th voiuine and soil description will be recorded The soil sample will be colleetedTrotn an undisturbed area of the test pit floor or wall by means of scraping or digging with a stainless steel shovel or trowel The number of clean sampling utensils for each test pit shall be equal to the number of soil samples collected at the test pit Shovels or trowels used to clean sloughed material from the sampling location will not be used to collect the sample unless decontaminated before use in sampling Care will be taken to assure that the sample is taken from the actual soil unit desired mid does not include slough or scraped material from the sides of the trench The desired soil sample will be immediately placed into the sample container within the test pit A portion of the sample will be retained for screening with the Dexsil L-2000 PCB analyzer The containers will then be sealed labelled and stored in asecure area until Shipment to the laboratory
Document Vol II SC SAP Revision 1
Date March 28 1991 Page 28
8 When collecting a larger volume sample for bench-scale testing a smaller soil sample will first be collected for field screening using the Dexsil L-2000 PCB Analyzer If the analyzer indicates that the PCB concentration is within the target range the bench-scale soil sample will be collected If the Analyzer indicates that the PCB concentration is outside the target range the test pit will be expanded if necessary and another sample will be collected for PCB screening This procedure will be continued until a sample within the target range is identified The test pit will be expanded no more than 2 feet in all directions and to the maximum depth of 5 feet below ground surface If after this over-excavation the soil within the target concentration range has not been identified with the Dexsil L-2000 PCB Analyzer a new test pit location will be selected near the original test pit in an area indicated by the Remedial Investigation to contain soil contamination within the target range
9 Once the targeted PCB concentration has been indicated by field screening the desired soil sample will be collected with a clean stainless steel trowel or shovel at a sufficient quantity to fill a 5-gallon container An aliquot from the 5-gallon sample container will be collected and placed in an appropriate sample container for laboratory analysis for PCBs The 5-gallon containers will then be sealed labelled and appropriately stored in a secure area until transported off-site The laboratory samples will be sealed labelled and stored with the other soil samples awaiting shipment to the laboratory
10 Upon completion of sample collection the excavated soil material will then be backfilled into the test pit The backfilled area will be compacted to the approximate original ground elevation
11 Equipment will be decontaminated after backfilling the test pit (ie shovel trowels measuring equipment) byscrubbing and With methanol and distilled water rinses Portions of the backhoe (bucket bucket arm etc) will be decontaminated with a high-pressure steam rinse on the decontamination pad (see Appendix A)
523 Soil Sampling Methods for Borings
Selected soil samples are planned to be collected at depths greater than 5 feet below ground surface to obtain additional data on the depth of PCB contaminationexceeding cleanup standards in Transformer Work Areas Samples will be obtained using split-spoon sampling techniques within 3-inch ID hollow stem augers in test borings generally following procedures specified by American Society for Testing Materials (ASTM) D1586-84 Test borings will be performed by Northeast Diamond Drilling
Document Vol II SC SAP Revision 1
Date March 28 1991 Page 29
under the observation of an engineer or geologist from GEI The following procedures not specified in ASTM D1586-84 will be used
1 Place a polyethylene sheet on one side of the boring location for temporarily staging drilling cuttings during borehole advancement All drilling equipment shall be decontaminated with a high pressure steam rinse on the decontamination pad prior to beginning drilling
2 Advance hollow-stem augers without split-spoon sampling to a depth about 5 feet above the sampling depth specified in Table 1
3 Begin continuous split-spoon sampling with 18-inch-long samples Collect a specimen from the middle of each sample for screening with the Dexsil L-2000 PCB analyzer and the HNu photoionization detector Rinse the split-spoon sampler with methanol and distilled water rinses before each sample
4 Collect a split-spoon sample at the designated sample depth Divide the split-spoon sample vertically Place a minimum of 4 inches of sample recovered from the bottom right half of the sample into the glass sample container Seal and label the sample container as indicated in Section 4 and store the container in a cooler with ice in a secure area until shipment to the laboratory Retain the left half of the split-spoon sample for screening with the Dexsil 1^2000 PCB analyzer and the HNu photoionization detector
5 After collecting the final soil sample in the boring measure depth to ground water below ground surface using a decontaminated Solinst battery-operated water level indicator Record the time elapsed after completion of the boring when the ground water level was measured
6 Remove augers from borehole If the borehole remains open and evidence of ground water was encountered during sampling collect additional measurements of depth to ground water prior to backfilling until the ground water level appears to stabilize Note occurrence of precipitation or other events which could effect water level measurements in the project log book
7 Backfill borehole within 24 hours after completion of the boring with drill cuttings staged adjacent to the borehole If the borehole collapses and cuttings cannot be backfilled in the borehole store staged cuttings in a steel drum to be left on site Label outside of drum to indicate contents are borehole cuttings from the designated boring number and affix labelindicating PCB-contaminated materials Cuttings from more than one boring can be combined in a single drum
Document Vol II SC SAP Revision 0
Date January 17 1991 Page 30
8 Decontaminate measuring and sampling equipment with methanol and distilled water rinses Decontaminate downhole drilling equipment on the decontamination pad with a high-pressure steam rinse before starting the next boring
A log will be prepared by GEI for each boring and will include the following
information 7
Name and Location of Project
Boring Number lt Date of Boring Ground Surface Elevation x-Boring Diameter and Depth Sample Numbers and Depths Soil Screening Data Visual Soil Descriptions Water Level Measurements Air Monitoring Levels Other Observations
The boring log form is provrdedin Appendix B (OCONNORFL15)V
i
Surface Water ^^7
531 General
N
Surface water sam^les^will becollected at the locations shown in Figure 4 If water is too deep for safe aecess^with hip-waders andor access with hip waders will severely disturb sediment an inflatableboat will be used to access Surface water sampling locations
The surface water sampling program will be performed following strict adherence to the following procedures A list of the equipment requirements for surface water sampling is provided in Table 8 In general ambient air monitoring will be performed regularly while working on-site for health and safety considerations Areas of the site which have been determined by previous studies to have elevated concentrations of PCBs in soils (for example TWAs) will be avoided while traversing the site to reduce the likelihood of dispersing PCBs to other areas The depth of water at the sampling stations will be measured and the surface water elevation will be surveyed on each water body Equipment will be decontaminated prior to use at each sampling station following decontamination procedures
Document Vol II SC SAP Revision 0
Date January 17 1991 Page 31
532 Surface Water Sampling Methods
Surface water samples will be collected during the Pre-Design Study at the locations shown on Figure 4 Surface water samples will be collected during the initial stage of the Source Control sampling program prior to soil and sediment sampling An inflatable boat will be used to access surface water sampling locations if there is sufficient water depth The boat will be cleaned with methanol and distilled water rinses before sampling in each water body The surface water sampling procedures will be as follows ltX1 Determine the location of the sampling station by tape^and compass from a
temporary bench mark at the edge of the surface water body x
2 Measure the depth of water at the sampling station with a weighted tape measure x (
^ 3 Gently lower a clean Kemmerer sample^bottle to the desired depth (one-half
water depth) so as not to remove th^stoppeisprematurely V^
4 Pull out the stopper with a sharp jerk ofdhe sampler line
5 Allow the bottle to fill completelyras evidenced by the cessation of air bubbles
6 Raise the sample and capdhe nottle X x
7 Pour the sampl^fromthe bottle into the appropriate sample container The container willbesealedlabelled and stored in a secure area until shipment to the laboratory
8 Fill a beaker with water remaining in the sampler and measure specific conductance pH and temperature
9 Decontaminate the sampling apparatus measuring tape and Kemmerer sampler by scrubbing internally and externally with methanol and distilled water rinses
10 Record the following surface water sampling information in the project log book (OCONNORFL1)
Document Vol II SC SAP Revision 0
Date January 17 1991 Page 32
Date Time Total Depth of Water Location and Depth of Sample pH Conductivity Measurements Air monitoring levels detected Other observations
Sediment
541 General x
gt The locations of the sediment sampling stations are shown on Figure 4 Table 3 lists the various sampling stations and sampling methods for the sampling program Sediment sampling during the project will beperformed with strict adherence to the following procedures A list of equipment requirements for the sediment sampling program is provided in Table7 In general ambientw monitoring will be performed regularly while working on-site for health-and safetymonitoring Mobilization of equipment and materials over the sitdduring^he-sediment sampling program will follow specific routes to reduce the likelihoocKPfdispersing PCBs to other areas Equipment will be decontaminated prior to sampling at each location following strict decontamination procedures described belowy All sediment sampling operations within the site will be performed fusing level C dermal personnel protective equipment and Level D respiratory^protective equipment will be worn
v ^
542 Sediment Sampling Methods gtSN
The sediment sampling^vili be performed after collection of surface water samples and will consist of rivo primary components
1 Tube sediment smiling to provide additional data on sediment quality and to estimate the thickness of sediment
2 Dredge sediment sampling to obtain a sample for laboratory for bench-scale treatability testing
The tube sediment sampling program will be performed as follows
Document Vol II SC SAP Revision 0
Date January 17 1991 Page 33
1 Determine the sampling locations by tape and compass measurements from a temporary bench mark (reference stake) surveyed near the edge of the surface water body Access locations in interior portions of the water bodies using an inflatable rubber boat The boat will be decontaminated with methanol and distilled water rinses before use in each surface water body
2 Measure the depth of water with a weighted tape measure
3 Lower the hand tube sediment sampler to the desired ctepth Sediment entering the tube is trapped by a plastic core retainer allbyringlheunit to be retrieved a n d t h e s a m p l e r e m o v e d w i t h o u t s a m p l e l o s s X x y
4 Extract the sediment samplefrom the sampler and^immediately place the sample
into the sample container The containers ywllthen be sealed labelled and stored on ice in a cooler in a secure area until shipment to the laboratory
5 Decontaminate the sampling apparatua and measuring tape by scrubbing with methanol and distilled water rinses
vw 7 Record sediment sampling record information in the project log book
(OCONNORFL2) after collecting a sediment sample at each sampling station The information that will beuro~documenteamp includes the following
Date and Time ^ Total Depth of Water N Thickness of Sediment Location of Sample Length and Vblume^of Simple Sample Description x- Air Monitoring LevetesDeteeted Other Observations
The sediment sampling procedure for collecting samples for bench-scale treatability testing will be as follows
1 Determine the location of the dredge traverse line by tape and compass bearings from the temporarily bench mark adjacent to the surface water body
2 Pull the sediment dredge along the planned traverse with a wire line from the edge of the surface water body
Document Vol II SC SAP Revision 0
Date January 17 1991 Page 34
3 Repeat sampling until 5 gallons of sediment have been collected and placed in the 5-gallon sample container The containers will then be sealed labelled and stored in a secure area until shipment to the laboratory
4 Decontaminate the sampling apparatusand drag line by scrubbing with methanol and distilled water rinses
S6 Record the following sedimentsampling informationin die project log book after
sample collection X nXx
Date and Time X gt Total Depth of Water Location and Volume of Sample Number of Grab Samples Collected to Form Composite Volume Sample Description Air Monitoring Levels Detected x X Other Observations
Barn
5-51 General
Sampling within the barn will4gteperformed with strict adherence to the following procedures A list of equipment requirements for the barn sampling program is provided in Table 9 Areas of the Site which have been determined by previous studies to have elevatedconcentrations of PCBs in soils (for example TWAs) will be avoided during bam sampling to reduce the likelihood of dispersing PCBs to other areas within the barnXEquipment will be decontaminated prior to use at each sampling location inside thetarn following strict decontamination procedures All sampling operations withfaMhe barn will be performed with Level C personnel protective equipment due to dust levels which may to exceed 1 mgm3 during sampling (see Appendix A) A detailed Health and Safety Plan which will be followed during barn sampling is provided in Appendix A
552 Barn Sampling Methods
If power is not available on-site a gasoline-powered generator capable of supplying electricity for lighting and sampling equipment will be positioned outside the fenced area of the site prior to sampling Extension cords will be run to the barn (avoiding TWAI) for power supply In order to reduce the potential for cross-contamination due to dust generation the sampling of different matrices will proceed in the
Document Vol II SC SAP Revision 0
Date January 17 1991 Page 35
following sequence 1) wipe samplingof non-porous debris 2)wood sampling of barn walls 3) dust sampling from top of floor slab 4) concrete sampling of floor slab Areas to be sampled will be chosen based on the presence of apparent oil-type staining and to obtainan even distributionof representative samples with no apparent staining
Following sampling at each location a self-sticking adhesive label marked with the sample number will be placed at the sample location for future reference Each label will then be located by taping relative to a reference point Established at the western corner of the barn (W-Z corner) as shown in Figure 5 Walls W and Z will be used as orthogonal axes similar to a typical coordinate system For samples collected above the concrete floor slab (eg wipe and wooden wall samples the height above the floor slab will also be recorded All samples willbe collected between the floor slab and a maximum height of seven feet All location measurements and a brief description of the area sampled will be recorded on the Barn Sampling Form (OCONNORFL13) provided in Appendix B Imaddition a photograph of each sampling location will be taken and^ recordedy on the Photograph Log (OCONNORFL6) Detailed procedures-for each type of sample to be collected during the barn sampling program follows
lt Win Samnlino N
1 Identify the non-porous item within the barn selected to be sampled which has an area of at least 100 cm2 which maybe wiped Examples include sheet metal fiberglass cleanly painted wooden surfaces glass etc
2 Place a decontaminated stainless steel or plastic 100 cm2 (10 cm X 10 cm) template at t^desired sampling location
Note For smaller areas such as on electric meters use the quarter template of 25 cm2 area and make four wipes to compose one sample
3 Remove the laboratory-supplied gauze from within the glassware with stainless steel forceps The gauze should be moist with solvent as prepared by the laboratory
4 While holding the appropriate template in place thoroughly swab the 100 cm2 area with the gauze using forceps or bufyl rubber gloves Inspect the area to ensure that all loose dust has been wiped with the Alter paper
Document Vol II SC SAP Revision 0
Date January 17 1991 Page 36
5 Fold the gauze over to ensure that the dust is contained on the inside of the gauze Place in the appropriate sample container seal label and store in a secure area until shipment to the laboratory
6 Decontaminate the forceps and templates by scrubbing with methanol rinsing with distilled water and wiping dry with paper towels
7 Label the sample location photograph and complete^he Barn Sampling Form
(see Appendix B) and other necessary documentation after each sample is
c o l l e c t e d lt X x x y x x
xWooden Wall Sampling X
1 Select the sampling area of at least 100 cm2 on the inside wall of the barn and secure a decontaminated 100cm2 template at the location Place a steel pan below the sampling area to catch sawdust ancLwood chips
2 Using an electric drill equipped withra-one-ineh diameter wood-boring bit drill out wood within the template area to arnaximum depth of 12 inch
3 Place sawdust and wood chips man appropriate sample container seal label and store in a secure area untiLsRipinent to the laboratory
4 Decontaminate the drilTbit and pan by scrubbing with methanol rinsing with distilled water and jwiping dry with paper towels
5 Label the samplelocatidn photograph and complete the Barn Sampling Form (see Appendix^)
Dust on Floor Slab Sampling
1 Select an area to sample such that at least 100 grams of dust or soil may be obtained This will vary depending on thickness of the dust or soil
2 Using a disposable nylon brush or stainlesssteel trowel brush or scrape dustsoil toward the center of the area chosen minimizing the creation of airborne dust
3 After the dustsoil has been centralized use a flat stainless steel trowel to collect the material and place in laboratory-supplied glassware seal and label
Document Vol II SC SAP Revision 0
Date January 17 1991 Page 37
4 Dispose of the nylon brush with other containerized PCB-waste materials and decontaminate the stainless steel trowelsby scrubbingwith methanol rinsingwith distilled water and wiping dry with paper towels
5 Label the sample location photograph and complete the Barn Sampling Form
Concrete Slab Sampling
1 Identify three areas of visible staining and one area of no visible staining on the floor slab Using a disposable nylon brush carefulfy brushxaway loose dust and soil from an approximately 1-square-foot area
2 Place a pre-cut 10-square-foot sheet of clean polyethylene sheeting with a 1shysquare foot hole cut in the center over thevsampling area and secure in place with duct tape Place a decontaminated lOO cmr template in the center where t h e s a m p l e i s t o b e o b t a i n e d X v N
3 Using an electric hammer drill eqi^pedwitlra^ungsten-carbide mortar bit drill the four corners established by the tempfate^to a maximum depth of 12 inch
4 Remove the template ancLdrilL the remaining 100 cm2 within the established square to a maximum dep^fof l2Jnch
-vFollowing drilling brush the concrete chips and dust from the plastic sheeting toward the center otlhe sarhplihggtarea Collect sample with a clean disposable nylon brush andtrowel and place in an appropriate sample container seal label and store in aSecure area until shipment to the laboratory
6 Dispose of the nylon oriish with other containerized PCB-contaminated waste materials and decontaminate the stainless steel trowel and template by scrubbing with methanol rinsing with distilled water and wiping dry with paper towels
7 Remove and dispose of the polyethylene sheeting and duct tape in an appropriately marked barrel that will remain on the site with other sampling waste disposal materials Label the samplinglocation photograph and complete the Barn Sampling Form
Document Vol II SC SAP Revision 0
Date January 17 1991 Page 38
6 SAMPLE HANDLING AND ANALYSIS
61 General
GEI has established a program of sample chain-of-custody that is followed during sample handling activities in both field and laboratory operations Thisvprogram is designed to assure that each sample is accounted for at all times To accomplish this objective sample container labels sampling records chain-of-custody records sample assignment forms shipping airbill records and laboratory receipt sheets must be completed by the appropriate sampling and laboratory personnel ^ y gt
62 Sample Labeling and Documentation gt
The plastic 5-gallon containers for bench-scale testingsWilKbe cleaned with methanol and distilled water rinses prior to use All other sample containers^will be pre-cleaned by EPA-approved methods and provided by the laboratory^ A summary of the sample containers and preservation requirements for each of thamp^analytieal parameters to be measured is shown in Table 10 Each piece of sample gl^sware^will be affixed with a self-sticking adhesive label Each label will contain the information described in Sections 4 and 5 of this document ^
To further document the samplingprogr^mand Sample handling procedures the project log book (OCONNORFL1) will containinformation regarding the activities on-site and sample handling In addition photographs of each type of field procedure will be taken The photographs will be representative of thetechniques employed throughout the sampling program A record ofeach photograph Will be made on the Photograph Log (OCONNORFL6) as stiown 4i^Appendix B
63 Chain-of-CustodySample^Assignment
Chain-of-custody will be maintained at all times as described in more detail in the Quality Assurance Project Plan (QAPP) A copy of the chain-of-custody form (OCONNORFL9) to be used is provided in Appendix B
In general the chain-of-custody record must be used such that it includes the following information
Document Vol II SC SAP Revision 0
Date January 17 1991 Page 39
Project name and number Names of the sampler(s) and person shipping the samples Station number or well identification Date and time the samples were collected Composited or grab sample designation Sample number (eg 1GU-90393-MW101A) Total number of containers Analysis requested Date and time the samples were delivered for shipping Names of those responsible for receiving the sampled at the laboratory
Prior to shipment of the samples a sample assignment form will be completed (see OCONNORFLIO in Appendix B) The sample assignmenrform will provide the contract laboratory sufficient information to process the samples and perform the appropriate analysis
The chain-of-custody record and sample assignment fornr will both be completed in duplicate in the field through the use of carbon paperT The original copy of the forms will be enclosed in a plastic bag and placed in the coolersWith the samples for shipment to the laboratory The carbon copy of the forms will be retained by GEL
VSoil samples for bench-scale testing ynH be-stored on site in a locked storage shed until samples are selected for the bench-scale7testing^ This decision will be made after receipt of the laboratory PCB analyses results and approval of the Source Control Work Plan by the EPA Soil samples not usecLfor bench-scale testing will remain in the locked storage shed and will be included with-other soil for treatment during the Remedial Action
lt v 64 Sample Shipments
Sample containers are generally packed in coolers for shipment Prior to packing organic analysis samples will be placed in plastic bags Bottles are to be packed tightly so that no motion is possible Styrofoam vermiculite and bubble pack are suitable for most instances Ice Will be placed in sealed plastic bags or ice packs in order to keep samples at 4degC at all times Samples will be protected against freezing during cold weather The original chain-of-custody and sample assignment forms will be sealed in plastic bags and placed in the cooler with the samples The cooler will be closed and a signed self-sticking label with the words Custody Seal will placed between the body of the cooler and the cover The cover will then be sealed with clear tape Samples will be shipped so that they are received by the laboratory no later than 60 hours from the time of sample collection
Document Vol II SC SAP Revision 0
Date January 17 1991 Page 40
All shipping of samples will be done through Federal Express or equivalent overnight delivery service Samples will be shipped in accordance with Department of Transportation (DOT) regulations If prompt arrival of the samples cannot be guaranteed the samplers will be responsible for proper storage of the samples until adequate transportation arrangements can be made The laboratory will be notified prior to shipment to arrange for receiving the samples and to prepare for the analyses requested Based on the low concentrations of chemicals detected during previous studies theSamples will be classified as environmental samples The air bill for the samples will speeiiythat the contents of the cooler are environmental or hazardoussamples as appropriated When samples are received by the laboratory they will notify the Task Manager of theccondition of the samples
H craTrsi
TABLE 1 - SOIL SAMPLING SCHEDULE Field Sampling Plan OConnor Co Site Augusta Maine
DEPTH APPROXIMATE BELOW ANTICIPATED
SAMPLE NUMBER SAMPLE GROUND PCS GENERAL LOCATION OF ELEVATION SURFACE CONCENTRATION SOIL
ID SAMPLES (MSL) (PPm) TYPE COMMENTS
TP1 2175 25 ND ClaySandy Till Confirm contours 215 35 ND
TP2 217 15 50 ClaySandy Till Confirm contours TP3 212 ND Siltv Clav Confirm horizontal extent toward marsh TP4 211 5-50 Clav Obtain bench scale 20-50 ppm
TP5 213 50-500 Clay Confirm lateral extent
TP6 215 15 5-50 Fill Obtain bench test sample In 1-10 ppm
TP7 210 35 0-5 Siltv Fine Sand Confirm vertical extent in drainage area
217 3 0-5 FillClay Confirm contours TP8 219 1 0-5 TP9 207 35 0-5 Siltv Fine Sand Confirm vertical extent In drainage area
TP10 1175 15 50-5000 Fill Bench scale test sample 50 to 500 ppm
TP11 218 0-5 SandClay Confirm horizontal extent toward marsh
TP12 218 0-5 SandPay Confirm horizontal extent toward marsh
TP13 221 5-50 Clav Bench-scale test sample 10-20 ppm
TP14 206 0-5 Gray Silty Clay Confirm vertical extent
TP15 200 0-5 Gray Silty Clay Confirm vertical extent
TP16 2185 15 5-50 Clay Bench-scale test sample 1-10 ppm
228 4 TP17 230 2 Confirm contouring in north end of site
231 4 TP18 233 2 Confirm contourtng in north end of site
236 4 TP19 238 2 Confirm contouring in north end Of site
Project 90393 GEI Consultants Inc Page 1 of 2 March 28 1991
SAMPLE NUMBER LOCATION OF
SAMPLES
TP20 TP21 TP22 TP23
TP24 TP25
B1
B2
1 B3 2
B4
B5
ND = Not Detected
TABLE 1
APPROXIMATE SAMPLE
ELEVATION MSLJ
231 233
2275 237 237 235 236 222 210 215 210 215
215 220
218 220 220 222
- SOIL SAMPLING SCHEDULE Field Sampling Plan OConnor Co Site Augusta Maine
DHTH BELOW
GROUND SURFACE
4 2
15
2 1
8 3 8 3
12 6
8 6 6 4
ANTICIPATED PC8
CONCENTRATION
ND ND 0-5
500-5000 5-50
50-5000 0-5
50-500
0-5 50-500
0-5 0-5 0-5 0-5
GENERAL SOIL TYPE
Clavev Silt Silty Clay
Clay
Till or Clay
Till or Clay
Gray Silt
Gray Clavev Silt
Gray Clayey Silt
i
Confirm contouring in north end of site Confirm contours Confirm contours Confirm contours
Confirm contours Bench scale sample 50-500 ppm
Confirm contouring and vertical extent
Confirm Contouring and vertical extent
Confirm contours and vertical extent
Confirm contours and vertical extent
Confirm contours
Project 90393 GEI Consultants Inc Page 2 of 2 March 28 1991
TABLE 2 SOIL ANALYSIS PROGRAM Field Sampling Plan OConnor Co Site Augusta Maine
Sample Depth
Sample Location ID
SoB Sample Number
(ft below ground surface) Lead cPAHs PCBs
pH TOC CEC
Anatyticsd Level IV
TEST PITS TP1 SS1 TP2 SS1 15
SS2 35 TP3 SS1 TP4 SSI
SS2 TP5 SSI TP6 SS1 15
SS2 15 TP7 SS2 35 TP8 SSI
SS2 TP9 SSI 35
replicate of SS2 SSI
TP10 SS1 15 SS2 15
TP11 SSI TP12 SSI TP13 SS1
SS2 TP14 SS1 TP15 SS1
replicate of SS2 SS1
TP16 551 15 552 15
TP17 551 552
TP18 551 552
TP19 551 552
TP20 551 552
TP21 SS1 15 TP22 SS1
Project 90393 GEI Consultants Inc Page 1 of 2 March 281991
TABLE 2 SOIL ANALYSIS PROGRAM Field Sampling Plan OConnor Co Site Augusta Maine
Sample Depth
Sample Location ID
SoB Sample Number
(ft below ground surface) Lead cPAHs PCBs
pHTOC CEC
Analytical Level IV
Bench Scale
Sample
replicate of SS2 SS1
TP23 SS1 TP24 SS1
SS2 TP25 SSI
SS2 BORINGS
B1 SS1 SS2
B2 SS1 SS2
B3 SS1 6 replicate of
SS2 SS1 SS3 12
B4 551 552
B5 551 552
QUALITY CONTROL TP26-TP29
(trip blank) SS1-SS4 TP30-TP33 (shovel or
hand trowel SS1-SS4 blank)
TP34-TP37 (split-spoon
blank) SS1-SS4 TOTAL
ANALYSES 40 40 64 15 12
TOC - Total Oraanic Carbon CEC - Cation Exchange Capacity
Will be designated to the laboratory as matrix spikematrix spike duplicate
Additional trip blanks may be needed to ensure one trip blank per cooler
Project 90393 GEI Consultants Inc Page 2 of 2 March 281991
TABLE 3 SEDIMENT ANALYSIS PROGRAM Field Sampling Plan OConnor Company Site Augusta Maine
PH Bench Sample TOC Analytical Scale
Sample Location Number Lead cPAHs PCBs CEC Level IV Sample
Surface Water Body
SED1
SED2
SED3Upland Marsh (UM) SED4
SED5
SED6
SED1
SED2Upper Lagoon (UL)
SED3
SED4
Lower Lagoon (LL) SED1
SED2
SED3
SED7 (trip blank)
SED8Quality Control (dredge
blank)
SED9 (tube
samples blank)
Total Analyses 11 11 16
TOC - Total Organic Carbon CEC - Cation Exchange Capacity
UL SED2 is a replicate sample of UL SED1
Will be designated to the laboratory as matrix spikematrix spike duplicate
Additional trip blanks may be needed to ensure one trip blank per cooler
Project 90393 GEI Consultants Inc March 281991
TABLE 4 - SURFACE WATER ANALYSIS PROGRAM Field Sampling Plan OConnor Co Site Augusta Maine
SAMPLE SAMPLE LOCATION NUMBER Lead Aluminum PCBs
Upland SW1 X X X Marsh (UM) SW2 X X X
Upper SW1 X X X Lagoon (UL) SW2 X X X
SW3 X X X
Lower SW1 X X X Lagoon (LL) SW2 X X X
Quality Control Samples
Trip Blank SW4
Sampler Blank SW5
TOTAL ANALYSES
TSD - Total Suspended Solids
SW2 is a duplicate of SW1
Will be designated to the laboratory as matrix spikematrix spike duplicate
Additional trip blanks may be needed to ensure one trip blank per cooler
Project 90393 GEI Consultants Inc Page 1 of 1 March 28 1991
TABLE 5 - BARN SAMPLING ANALYSIS PROGRAM Field Sampling Plan OConnor Co Site Augusta Maine
SAMPLE MATRIX PCBS CPAHS Lead
Analytical Level IV
Wipe samples PTB (trip blank) PEB (equipment blank)
12 3 3
Wooden wall samples 10 10 10
Dustsoil on floor slab
Concrete slab
Total Analyses 36 18 18
Additional trip blanks may be needed to ensure one trip blank per cooler
One sample will be designated to the laboratory as a matrix spikematrix spike duplicate
Project 90393 GEI Consultants Inc Page 1 of 1 March 281991
TABLE 6 - SOIL SAMPLING EQUIPMENT REQUIREMENTS Field Sampling Plan OConnor Co Site Augusta Maine
Safety Equipment (Level C - Dermal)
Health and Safety Plan (copy) Portable Photoionization Detector (HNu) Hand-held Aerosol Monitor (HAM) Disposable Tyvek Coveralls Tyvek Hoods Duct Tape Safety Goggles Safety Boots Surgical Gloves Butyl Sampling Gloves n gt Rubber Boots or DisposableBooties Hard Hats (when near qverhead objects)
Safety Equipment (Level C - Respiratory)
Sampling and Measuring Equipment
Other
Full-face Respirators Combined Organic Vapor and
High-efficientcy particulate Cartridges Dust Prefilters
Level and Rod Measuring^Tape Stainless -SteeLShovels Stainless Stee^T rowels 165-foot Measuring Tape Methanol V
Distilled Water Paper Towels
SafopltngjSlassware (See Table 10) xCo6lers with Ice or Ice Pack
Clear Plastic Tape Re-sealable Plastic Bags
Gallon Drums
ite Maps Project Log Books Marking Pens Camera Photograph Log Forms Test Pit Log Forms Boring Log Forms Chain-of-Custody Forms Sample Assignment Forms Equipment Calibration Logs Extra Bottle Labels Spare AA Batteries for Meters Blank Federal Express Airbills
Project 90393 GEI Consultants Inc Page 1 of 1 January 171991
TABLE 7 - SEDIMENT SAMPLING EQUIPMENT REQUIREMENTS Field Sampling Plan OConnor Co Site Augusta Maine
Safety Equipment (Level C - Dermal)
Safety Equipment (Level C - Respiratory)
Sampling and Measuring Equipment
Other
GEI Consultants Inc
Health and Safety Plan (copy) Portable Photoionization Detector (HNu) Hand-held Aerosol Monitor (HAM) Disposable Tyvek Coveralls Tyvek Hoods Duct Tape Floatation Vest Inflatable Boat Safety Goggles Safety Boots Surgical Gloves Butyl Sampling Gloves Rubber Boots or Disposable obties Hard Hats (when near overheackobjepts)
V Full-face Respirators Combined Organic Vaporand
High-efficiencyHPartjculate Cartridges Dust Prefilters
Level andRod Measuring Tapp 165-foot MPasuririgTape Methanol V Distilled Water jper tpwels V
SjE(mplinsect~Glassware (See Table 10) Cdolbrs wlthjbe or Ice Pack
Clear Plastic Tape Re-sealable Plastic Bags
-Galloh Drums fghted Measuring Tape e Sediment Sampler dge Sediment Sampler
Site Maps Project Log Books Marking Pens Camera Photograph Log Forms Chain-of-Custody Forms Sample Assignment Forms Equipment Calibration Logs Extra Bottle Labels Spare AA Batteries for Meters Blank Federal Express Airbills
Project 90393 Page 1 of 1 January 17 1991
TABLE 8 - SURFACE WATER SAMPLING EQUIPMENT REQUIREMENTS Field Sampling Plan OConnor Co Site Augusta Maine
Safety Equipment (Level C - Dermal)
Safety Equipment (Level C - Respiratory)
Sampling and Measuring Equipment
Health and Safety Plan (copy) Portable Photoionization Detector (HNu) Hand-held Aerosol Monitor (HAM) Disposable Tyvek Coveralls Floatation Vest Inflatable Boat Tyvek Hoods Duct Tape Safety Goggles Safety Boots Surgical Gloves Butyl Sampling Gloves Rubber Boots or Disposable Booties Hard Hats (when nearOverhead objects)
w Full-face Respirators Combined OrganicVaporand
High-efficiency Particulate Cartridges Dust Pi
Level and Rod
Measuring Tape M3amp-foot Measuring Tape JsopropyhAlcohol Mbthanol DistlHed Water PaperTowels Sampling Glassware (See Table 6)
oolers with Ice or Ice Pack tear Plastic Tape
Re-sealable Plastic Bags 55-Gallon Drums Weighted Measuring Tape Kenmerer Sampler Disposable 045 Micron Field Filters Pressure Pump for Field Filtering pH Meter with Temperature Probe Cole-Parmer pH-40 70 Calibration Solutions Cole-Parmer 1413 Micromhoscm Calibration Solution
Project 90393 GEI Consultants Inc Page 1 of 2 January 171991
TABLE 8 - SURFACE WATER SAMPLING EQUIPMENT REQUIREMENTS Field Sampling Plan OConnor Co Site Augusta Maine
Other Site Maps Project Log Books Marking Pens Camera Photograph Log Forms Chain-of-Custody Forms Sample Assignment Forms Equipment Calibration Logs lt Extra Bottle Labels Spare AA Batteries forM6ters Blank Federal Express Airbills Xy
Project 90393 GEI Consultants Inc Page 2 of 2 January 171991
TABLE 9 - BARN SAMPLING EQUIPMENT REQUIREMENTS Field Sampling Plan OConnor Co Site Augusta Maine
Safety Equipment (Level C - Dermal)
Safety Equipment (Level C - Respiratory)
Sampling and Measuring Equipment
Other
Health and Safety Plan (copy) Portable Photoionization Detector (HNu) Hand-held Aerosol Monitor (HAM) Disposable Tyvek Coveralls Floatation Vest Tyvek Hoods Duct Tape Safety Goggles Safety Boots Surgical Gloves Butyl Sampling Gloves Rubber Boots or Disposable Bboties Hard Hats (when near overheackpbjects)
Full-face Respirators Combined OrganicVapor and
High-efficiencyParticutale Cartridges Dust Prefilters
Gas powered electrfcgenerator 5 gallonsgaspline 350 feetNplectricahextfnsion cord Self-standin^work-larnps (200 watts minimum) Electric 38drilkwith two 1-inch wood boring bits ElectricBoschhammer drillwtungsten-carbidemortar bit Hpound-cut polyethylene sheeting and duct tape
Steel blaRing sheet X^vdiSpdsabfe nylon brushes
Stainless steel trowels Three 100 cm templates andone 25 cm template Forceps Peper towels Silf-sticking adhesive labels and push pins
Site Maps Project Log Books Marking Pens Camera Photograph Log Forms Bam Sampling Forms Chain-of-Custody Forms Sample Assignment Forms Equipment Calibration Logs Extra Bottle Labels Spare AA Batteries for Meters Blank Federal Express Airbills
Project 90393 GEI Consultants Inc Page 1 of 1 January 171991
TABLE 10 - SAMPLE CONTAINERS AND PRESERVATION REQUIREMENTS Field Sampling Plan OConnor Co Site Augusta Maine
Holding Media Parameter Container Preservation Time
PCBs 8 oz glass jar 4deg C 14 days-with Teflon- extraction lined lid 40 days shy
analysis
cPAHs 8 oz glass jar 4deg C 14 days-SOIL with Teflon- extractionSEDIMENT lined lid 40 days shyWOOD
analysisCONCRETE AND WIPE Lead 8 oz glass jar 4deg C 6 months SAMPLES with Teflon-
lined lid
Bench-scale 5 gallon high NA NA testing density
polyethylene bucket
PCBs Two 1-liter 4deg C 7 days shyamber glass extraction bottles 40 days shy
SURFACE analysis WATER
Lead 500mi HN03 4deg C 6 monthsSAMPLES polyethylene to pH bottle lt20
Aluminum 500ml HN03 4deg C 6 months polyethylene to pH bottle lt20
NOTE All standard sample containers will be l-CHEM equivalent bottles supplied by the laboratory The 5-gallon polyethylene bucket will be rinsed with methanol and distilled water prior to use
NA = Not applicable
Project 90393 GEI Consultants Inc March 28 1991
gt 1I L )
i bullbullbull j bullgti sil- j-V
poundP
A C
jfr35
QUAOnANQLE LOCATIONTOOU9 POND MAINEJI881)N4416-W37-307B
bull4000 FEET
Central Maine Power Company Pre-Design Work Plans SITE Augusta Maine OConnor Site LOCATIONFrom EC Jordon Co RIFS
Augusta Maine MAPReport dated June 1989
C D Project 90393 January 1991 Fig 1 G E I C o n s u l t a n t s I n c
b-r
p pp l-I 0 x foooo^ _^_ZZZ~~r^-^
UpoundEtpound 1IMA iRAMWOfMII NOW AM A OAAMAG IWAllrj WWEOfOHAMMS MHICUOn Central Maine Power Company Pre-Design Work Plans LOCAIION Oh
in cuelt^KL2 Augusta Maine OConnor Site TRANSFORMER
Scale 1 inch = 142 feet Augusta Maine WORK AREAS AND SWALESFrom EC Jordon Co RIFS
Report dated June 1989 C D G E I C o n s u l t a n t s I n c Prnjprf QfttM January 1QQ1 Fifl 0
~- bull middot bull -middot r middot~middotmiddotmiddotIll middotmiddot t~r
I bull Imiddot
bull bull1 middotmiddot middotir-------~-------middot ~ bull middot middot-------------------middotmiddot ~ middotmiddotmiddotamiddot A middotimiddot r bull amiddot A I bull TWA I tmiddot LOW AREA A NO~TH) SOUTH) I
v
A middot
rmiddot---middot---middot~middot---- ----middot~middot [WEST) [W[ST) (EASr) middot I
middot middot middotmiddot AmiddotA D-D 220 SCRAP ARf-A 201 -
bull - I
nor 140 TWA I 2bull0
1 bull middotbullmiddot1~-~~ L~W AR1-A ---- middot-~ l0 ~
i r bull I -$-~middot
0 - )1 _~ ~ middot1~oi I EEltY
J I ~2J~ bullbull
bullf()omiddot middotmiddot middot~ bull0 2 i- 0
11bull I lo bull ~middotmiddotmiddot~middot ~ ~--middotmiddot~middotbull ~-8~-i~~jplusmny~f~=ii1 - ~ bull ___ I I- _5 middot~bull-tmiddoti~middot~ N ~ bullbull ~ i I o middot TP19 gt - ~ ~ Jmiddot ~I middot~middot~I bullJUI 215 middot 215~-I e bull TP23 if 21~ ~ middot middot middot_ ------ ~middot - L middot~ ~ ~~ 1 i i
235 middotQ1middot1middotmiddot ~ bullbull ~~middot~middot- Lil middot~ _~ middot f bulllto --- z middotmiddot middot
middotr
-lt lt -middot I ~ middot ~ I
1 c ~ __ ) bull bull bullmiddot bull --middot Q
middot bull bullbull - 1middotmiddot - bullbull ~middots middot- uPPfR 1middotmiddot T LAGOON 1middot middot -$- middot middotmiddotpoundpound~middotmiddotmiddotmiddotmiddot bull =lt middot
~ middot ~~ iP22 gt middotgt
w
210 I
-
------_7___ 210 1 _
w_ +-
middot middot w--~ J210 middot i~30 -- middot_
1 TP18 bull middotmiddotI middot~ ----shy middot-middotmiddot
middot~ I j
middot- t - I 1 I BEDROCK 11 I
1
lmiddotmiddotomiddotmiddotmiddotmiddotmiddot middot middot middot =middot _middotmiddot middotmiddotmiddotmiddot 1 I rI Th 205 bull 205
bull -middotmiddot bull_ 1 225 22 middot bullbullbull fltISmiddot middot middot ~ ~middot f4tmiddotmiddotmiddot I J205 1bull
middot OOTR10U1t0N craquo-middotPC~middot~oN~A~ SEL11r~~~TS H LO~ AR~A ------------------------------------------------bull1 BASEO IN PART ON QBSERVATION Of FILL PlACEMENTmiddot bullmiddot E~middot-1middot bull bullbullbull middotmiddot Q - _
_
-1 I
fmiddot bull bull
-middotmiddot I r-middot shy c bull
I omiddotmiddot
r- middotmiddotI ~I
1 middot1 r bull bullf-Sf1 TWA I middotbull middot ~ i1 bull bull middot (EASfJbullI middot-----bullI (WEST) middotI bull I 1I cmiddot middot~ I~ ~ I bull bullbullbullI 1bullbull
(EAST) - bull middot- - I
bull bull r ~middot l
~
~30 i
2io bull
middot) Ibullbull
I
- J l TPl7 bull- f ~j -middot middotmiddotmiddotmiddot I 1 J middotmiddot1
middot~ ~ bull middotimiddotmiddotch bull bull_ t-ROAOI cli middot bull ~ middot1middot
225
I bull ILmiddot i~A--middot1middot 225 bull
1225 middot I ~ CENTRAL DRAINAGE middotmiddotmiddot--Q-middot --middot _ --middot
~ I -- -shy A middot
bull B-B --- m
- _ - middoti-- 10bull ~ m
g r
220 220 I ~
I middot _
l MI r ~ I
middot middot 1bull bull1 111
I rbull bull
middot
bull bull l
215 BEOROC~ 215
bull I bull middot - -
) l
-middotshy- bull Il
I 5 -middot middot middottc bull bull gt f bull 110 1~ w 210 210 ~ middotmiddotmiddotmiddotmiddot middot-middot -
( bull
middotlt bull [ I
bull G -
-middot-
middot middotmiddot bull ~middot-middot-- -middot- t~middotmiddotmiddotmiddotmiddotmiddot middotmiddot middot L -middot 1 -middot~ bull bull - middotmiddot L middot-~ _ bull f middot middot1 I ~ l
205 bull bull ~middot JO~cmiddotimiddotmiddotmiddotmiddot middot--middotmiddotmiddot1 _~ middotmiddotmiddotmiddotmiddot middotmiddotmiddotmiddotmiddotmiddot bullI bull middot -middotmiddotmiddotmiddotmiddotmiddotg
bull -$-middotmiddotmiddot middot~middot iii~~- ~0 i TB-20 SUBSURFACE BORING NUMBER bull bull bull TPmiddot 105 TEST PIT NUMBER
middot
bull1
bull I TP16 middotmiddotmiddotmiddotmiddot~ Q G) ) mmiddot i GROUND SURFACEmiddot bull 1bull 1middot bull I i ~ u o I bullbullbull I~ bullbullbull bullbullbullbullbullbullbullbullbullbullbullbull bullbullbullbullbullbullbullbullbullbull bull middot bull
ll bull bullbullbull middotmiddotoz bull I 250 CONCENTRATION OF PCBs IN SCREENED SAMPLE lPPm) r lt bull bull I
middot CONCENTRATION CONTOUR middot middot bull - -- CROSS-SECTIONS CONTOURED AT 5ppm 50ppm ANO 500 ppm TOTAL PCBs
middotbull middotmiddot c- I bull ~~ ND NOT DElECTED -middot ~ I
middotmiddot middot--middot~ middot sect t I middot UNDERLINED VALUES ARE CLP RESULTS (ppm)bull
middot -____ bull ~~ - -- I
bull bull middot -middot middot bull Ibullbull middot ~- middot --- LEGEND (ISOPACH MAP) bull lmiddot I l
I
-middot 1 middot I
bull middot ~SUBSURFACE EJORING LOCATION middot
-t middot ( 10766 - 10 10186) middot middot J BORING NUMBER -2 middot THICKNESS OF SOIL CONTAINING PCBs IN EXCESS OF 5 ppm
I
bull ~ middot
LOW AREA BORING LOCTION (107187)
- I j
I
bull BORING LETTER - ~ THlC~NESS OF SOIL C011TAINING PCBs IN EXCESS oF Sppm middot middot middot middottmiddot=plusmn+ TEStPIT LOCATION 1 bull bull bullbullbull i 0~ Q G) I -$ ELECTRICAL EQUIPMENT SAMPLE POINl middot middot -middot bull 1-1 I ~ bull
If bull bull ) bullbull bullbullbullbullbullbullbullbullbullbull f4( middot~01 l - bullmiddotomiddot
middot - ( ~-~ SURFICIAL EXTENT OF SOILS CONTAINING gtSppm PCBs bull middot (
bull __ ~ -middot middot_ middotmiddotmiddotmiddotmiddotmiddotmiddotmiddot _ - middotmiddot --- bull bull -bull - ISOPACH LINE ILLUSTRATING THICKNESS OF SOILS CONTAMINATED BY middot middot middot -middot~middotmiddotbullmiddotmiddotmiddot middotmiddotmiddot bullbull middot middot bull middotmiddot middot 8 -- bull _CONTOURS [)RAWN _-- ~ _l bull abull lO_fEF lran_~OUllCStRF~CI gt~~~~ ~~~~bull
I bull middot T o o bull bull middot middotmiddot
) NOTES 1 -middot -middot bull
I1 THE ISOPACH CONTOURS WEREDRAWN TO DENOTE THE THICKNESS OF SOIL ~ Q iP1 middot 0 bullbull 5 bull GEi BORING LOCATIONS middotMEASURED FROM THE SURFACE CONTAMINATED BY GREATER THAN 5ppm TOTAL PCBs bullbull bull bull I THE VALUE OF 5ppm WAS CHOSEN ARBITRARILY AND IS NOT INTENDED TO REPRESENT
middot bullv middot-- - l A SITE-SPECIFIC CLEAN-UP LEVEJ GEi TEST PIT LOCATIONS
2 CRO~S-SECTIONS ILLUSTRAt EXTENT OF PCB CONTAMINATION WITH DEPTH I middot- -f j bull I
_ veRTt6l1 EXAGGEP1r10M m c~oss sicT1c~S 1s 61 middot
bull
middot
I middotshy1
middot J~uJt bull bull i ~ ~ _ - middot j
1 ~ middot bull bull bull middotmiddot l a )
0 gt bullmiddot -~I middotbull I 0 middot r middot- bull ibull I
bull
_ _ I I ~
middot I
bull bull
bull middot~r
- -middot- - -
bullI l middotI middot I bull r f I I
~_ Igt bull
bull f middot
t bull middot bullbull 8 _
~ 7 I r 9
-middot- bull bull I I ~
middot 1
bull ____________________________ ___ _ bull I
bullI 1 bull middot -~ bullr
---------r- -- -- middot~-~~~~middot--middot ~ f middoti middot
bull t ~
bull
middot j
1
-------- -------- ---------------------------- ti 1
bull ~---middot ------middot ~---middotmiddotmiddotmiddot-middot--middot-middot~---middot-- ___~------- middotmiddotmiddot middot middotrbull ~ ~--~~-~middot-~ 1 middotmiddotmiddot I
middot bull middot4J middotmiddot 1 middot
middotI 1
I
bull
bull
middot ~ middotimiddot 1 bull j-1 ~ bullbull bull I bull i ~
APPROXIMATE SCALE I DESIGNED
~ BY
bullIbull Imiddot bull SOURCEmiddot EC JORDON CO RlFS middot bull Central Maine Power Company Pre-Design Work Plans SOIL I ~ t
middot
middot bullmiddot I ~middotmiddot ( bull bull REPORT DATED JUNE 1989 bullL bullr middotmiddot bull ~I middotmiddot DRAWN BY I I bull 1 r bull ~ middotmiddot middot
bull r shy~middot r i Augusta Maine OConnor Site bull SAMPLING I Imiddot 0 middot bull
bullI
bull bull
r bull 40 80
J 1bullmiddot
CHECKED BY Augusta Maine middotLOCATIONS
h cf I ~ 1bull rmiddot_
1 Inch =~Feet t--~------~---_middotmiddot~ I ~middot bullgtIbull
) i _- DATE January1991 middot middot middotmiddotmiddot tbull middot1middotmiddot APPROVED BY GE I Consultants Inc
middot
middotmiddot middot t---P-R_O_J-EC_T_9_0_39-3-----4-S-H-E-ETmiddotmiddotOfFbull t DATE REVISION BYmiddotmiddot J middotFlg3 middot
1 nuovN( POST middot 1 Nl6~1 middot bullbull Ibull Ibull bull bull lomiddot bullbull -
I
I
I
------------ -
) bull middot i bull I
~ f I middot1 bull ~I r
I
middot
-middot- CJ middotYmiddotmiddot I
C bull
middot
I middot I
middot -shy bull bull middotmiddot~
J middot _ bull y
Ibull bull
~ bull ~~ r I bull middot bull
middot bull
I ~ I I ( I bull
JI t
- I
J l I
-~ 1 I
bull j middot middot~ ~ middot) __-_ bull i
Ibull I lt bull
middotmiddotmiddot
gtImiddotmiddot
I
I bull
middotmiddotmiddotmiddot_v -
~ bull J i 1 bullbull
r 1 I ~ middotbull middotbull
I I I l~_middotgt~~bullI~~~bull~middotmiddot jbull1111 1 bull~ - 1 111 middot~ bull1 middot 1middot I jbull I bullI _- middotmiddot 1 1t1 _ 1 (Imiddot 1 bull1 1gt middot~middotlt~middot middot
I l bull bull 1 r I bull bull middot
bull middot middot middot middot~middot ~middot middot~
- J ~J ~~ O lt hj I bull ~ bull bull 1 o t I lbull I
middotmiddot bull ~ middot I bull middot bull bull
middot bull - I middot ~middot
bull 11 ( _ I
middot I Ii lfI ltI
bull
I 1- bull_ II ~ I middot
I bull vmiddotmiddot
30 I ~middot middot bull bull
lt 1 I ---middot _ bull I ~ bull bull ~ bull
II ~
111
bull bulll3 bull ~ middotmiddot bull Ibull 0 I 1 bull 111 bull bull I rbull1 middot 0 I I I - Ibullmiddot 1 bull r middot middot __ -
i bullmiddot ~ ----middot yen ~ bull ~ j
--~middot
I
I
- -- ( middotmiddot~middotmiddot- - bullbull~ _ ~- I ~ bull--- shymiddot ----bull
1- -
bullbull I I - ~ I I bull middot middot ~ I middot
1
---- _ --
bull1 II I j
I bullbullbullbull
II ~
J 1bull ~
I
bull I I bull I ~ middot Tmiddot I 1 ~ bull JI I t Ibull bull ~ bull middot
I -
-----~_ middot1
-1
~
bullbull
-
bullbull I
middot---- a I AiLWO _ middotshy
I
bull f l
I bullbull - middot I - bullbullbull
SVf1
S~D1- -0 sih3 0
I I 0 1 i ---shy (]
middot bullgt I
I J middot bull bull IIbull Iamp middot P I 177
r o ~ 0 SEol l-middot J~ I - -- ltl
f bull bull
gt1 bullI 1 V bull ~ II ~ tJ middot -middot-
I
middot1 - bull bull bull -middot
bullmiddot -bull wmiddot ~ ~ ~
bull IA1 gtW2 - gt1
- - ~ -
middotmiddotmiddot----- ~r=02 bull bullmiddot I __ i Ctt1rr--shy
bullI
Q bull _
1
D I bullbull middot - bull
SW2
I middot- bull
bullI ~middot
rl
~ se02 I bullbullbull I bullbull ~ L-lf L-- I
- ___ bull bull___ I bullbullbull
I bull ) I f IIUZ middot___ ---- bull cu bull
I gt
bullbull -shyI bull Ii bull f
~ middotmiddot~ ~ middot - I
I bull ~ ) I~ shy bullfmiddot~ ~ i ~ ~middot
~ I 1
bull 4 Ot f I
1 i f ~ bull lt
1
bull bull I
___ - ~)____ - ------~ -------middot-middot-r--middot-middot ----middot- - ---middot-middot-middot-middotbull
t t - -- a
I middot bull -- middot - __ __--~~~=--~---_-~= _ _ middot - I ii- - ~~=-=~==--=~middotmiddot-~=~~~~~~=-~~~======middot=middot~middot== middotmiddot-- _ - I
bull -------------------~_
t ~middot middot middot middotbull bull middot i------------1I Imiddot ~~f~=-~~J~i~~~f~U+--f~~~===~~-~~middot~f~=~=~=~~fi~-~-~==~~-==~==~~==~====~==~-=-==~=~=2~~~~~~~77=~=~=~~-=~s)middot==~~~--=-=~~~=~=~====-=====~~=~~~~~=~=~=~==~==-=~=~=middot
middot 7gt JloltGKLA lllD --- shy l lf-nt RT n bull middotl bull
I
-i~------ - -- -------- -- --= bull (
( ei -~ ---- -------- - - - - - bull - shyI bull middot 1 ------
--------~____-____ bull SSmiddotsmiddot~middot2-iJi_8plusmn~plusmn-~~plusmn=+=~==-=-==~~===~~~~~~=-=s~~2~-~s-==~~~z--==~=~~t-=-=-=-==-=---~34~~~-==-=-==-==~=middot==---~=-middot~i~middotmiddot~ middot)~ f ________bull _
~--- __ - ____ - bull shyI I
bull __ _ ~ ~ ~ middott1 middot_
J(J--_ 11bull middot ------deg gt
middot -f ~~~se~middot~ARm~OMAarra~PERfOAMagtBY 0 middot~ bullO ( l r
r-------------liDElmiNEiiiiY-r---Amiddot----------________---~-------------_____ __________middotmiddot_lIbull middotmiddotmiddot ACHERON ENOINEERINCI 8ERVJCED COMPLIED IU8lo BASll MAP
(middot VERIFIED TO MEET NATIONAL MAP ACCUAACI 8TANOARD8(NMJ) middot Tl1ROUQltATEaT GURVltY CONOUCIED Df JORDM 121aa LEG~ APPROXJMATESCALE DESIGNED BY
-----------_ ---------~ CentralMalnePowerCompany p D W kPI middotSURFACEWATERANDmiddotmiddot_-~middotmiddot~~~middotFitow~middot~(TOO~MEETNMAamp DRAwN BY re- es1gn or ans middot middot middot shy bull bull bull - bull
bull Aug~sta Maine OConnor Sitamiddot SEDIMENT SAMPLING middot3middot~~~middot~--~~amCla~~~~~~usa-o middot O GEISEDIMEITTSAMPUN~LOCATI~Ns o 40 middot 80 1
BY LOCATIONS ~middot)~middot ~ bull 11i GEISURFACEWATERSAMPUNGLOCATIONS middot CHECKE
rh A~gustaMalne lt middotmiddot( middotmiddot 11nch-40Feet DATEmiddot January 1991
middot APPRovED BY -V GEi Consultants Inc ~ Imiddotgtmiddotgt middotmiddot middot middot souRCE EC JORDON co RlFS bull middot GEi COMPOSITE SEDIMENT SAMPLE bull DATE REVISION BY - PROJECT 90393 SHEET OF middotI middotmiddot middotI middotAEPORTDATEDJUNE1989 v COUECTEDFORBENCH-SCAIETESTING
I J ~ I
i I bull I )__ )
I I ilo I Ibull
X -4 mdashmdash-0shy
W A Elec-Zl lt4W
Meters Shelves ^ Pickup
A CapAntique a)
W WAutomobile W J
ia iW Y
W A o
LEGEND C w
Stove - wBoat X Designated Wall Label w
-e- -fr bulleshybull Cement SlabDust Sample
0 Wooden Wall Sample ZTaping Reference Origin
W Wipe Sample
Approximate Scale
NOTES 30 Feet
1 Ail locations on this plan are approximate
2 Sample locations are general Central Maine Power Company Pre-Design Work Hans EXAMPLE examples of the type of sampling Augusta Maine OConnor Site BARN SAMPLINGand the distribution Augusta Maine LOCATIONS
3 Revision No 1 (3-28-91) ltP G E I C o n s u l t a n t s I n c Project 90393336 January 1990 Fig 5
I I I I
I
I I
I
I
I
I
I
Document VoL II SC SAP Appendix A Revision 0
Date January 171991 Page 1
V
APPENDIX A zgt
s HEALTH AND SAFETY-PLAN
Source Control PrampDesign Studies CConnorCO^Site
Augusta Mkine shy_ lt
lt
NT lt
Document Vol II SC SAP Appendix A Revision 0
Date January 171991 Page 2
GEI CONSULTANTS INC SITE HEALTH AND SAFETY PLAN
Site Name OConnor Co Site
Site address Street Route 17 Qty Augusta State Maine
Proposed Site Activities Source Controlsampling of surface andsubsurface soilssediments surface water and the on-site barn
Proposed Date of Work April 1991 gt S
Original Safety Plan YES
Site Safety Coordinator Thomas S Bobowski
Client Central Maine Power Company^(CMP)
Site Contact Charles Nickerson (CMP)
Team PERSONNEL ^ IRESPONSIBILITIES Robert E Stetkar lt ^mjectManager Joanne O Morin Work Tlans and Pre-Design Studies Manager Richard F Murdock Qhality Assurance Officer Benjamin YSu Treatability Studies Manager Joseph G Engels Technical Consultant Steven R fcambx Source Control Sampling Task Manager Thomas S Bobowski7 Barn Sampling Coordinator Sampling Boyd P Smith Sampling Christopher L Covel Sampling William J Haswell Sampling Charles Blodgett Field Screening Analytical
Background Information
The OConnor Co Site (Site) covers approximately a 9-acre portion of a 65-acre parcel within the city limits of Augusta Maine The Site is surrounded by sparsely-developed residential or agricultural properties or undeveloped woods and wetlands (Riggs Brook and associated wetlands border the Site to the east) The F OConnor Co operated a transformer stripping and recycling operation on theSite from the1950s through the 1970s
Document VoL II SC SAP Appendix A Revision 0
Date January 171991 Page 3
During operations releases of wastes including PCB-laden oils resulted in contamination of water and soil on the site Principal features of the Site include a barn which formerly housed scrap operations an upland marsh formed by man-made disruption of natural surface water drainage upper and lower surfacewater impoundments (lagoons) constructed to control migration of oils from the Site a low area where excavated lagoon sediments were deposited within a clay liner three former transformer work areas a former scrap yard and a wetland associated with Riggs Brook A site plan depicting some of the major features of the site is shown in Figure HS-1
Ax In 1986 and 1987 remedial investigations were performed byECvJdrdan Co for Central Maine Power Company (CMP) These investigations included over^OQ soil samples 11 monitoring wells and analysesof surface water ground water sediment and biota for PCBs organic and inorganic chemicals The primary contaminantsdetected in soil and sediments at the Site were PCBs PAHs and Lead Chlorinated benzenes PCBs phthalates and to a lesser extent volatile organics and metals were detected in ground water and PCBs and metals were detected in surface water Using these data Clement AssociatesInc performed an Endangerment Assessment in 1988 for EPA^evaluating risks to human health and the environment associated with existing condiuoi^ra^Tuture conditions related to a noshyaction remedial alternative In 1989 EC JordabCoi acting as consultant to CMP completed a Feasibility Study which evaluated remedial alternatives based on information provided in their earlier Remedial Investigation Report and in the EPA Risk Assessment Report After receipt of the Feasibility^Stiidy Report EPA issued a Record of Decision (ROD) in September 1989 describihg the^EPA^elected remedial alternatives for source control and management of migration
Site Status Waste Types
Includes the followin
Ground water Surface water Sediment Soils On-site structures
Refer to Table1for listing of chemicals of concern during Source Control studies per media sampled
Document VoL H SC SAP Appendix A Revision 0
Date January 171991 Page 4
Hazard Evaluation
Known orSuspected HazardousToxicMaterials Polychlorinated biphenyls (PCBs)volatile organic compounds (VOCs) polycyclic aromatic hydrocarbons (PAHs) and metals (especially Lead) The ranges of concentrations of chemicals detected in all source control media on-site are presented in the attached Tables 1C through 1L from previous studies Concentrations of PCBs PAHs and Lead detected in surficial soikduring previous studies (including the on-site Barn) are shown in Figures HS-2 HS^3 and HS-4 respectively Concentrations of chemicals detected in surface water and sediihentsduring previousstudies are shown in Figure HS-5 lt( x
The primary concern at the Site is contamination of surface soils by spillage or leakage of transformer oils containing PCBs The potential forencountering concentrated wastes in the transformer work areas (TWA I TWA II andltTWAIlI) is high In addition wastes have also been identified in soils and sediments associatedwith the lagoons and drainage swales Within a short distance of these discrete areas of the site the potential for encountering significant concentrations of wastes-is low ToYeduce the likelihood of being exposed by wastes associated with these areasduring~source control sampling activities efforts should be made to avoid walking unnecessgrilyriiv these areas
Exposure to hazards from chemiealsduiing test plying and environmental sampling and analysis tasks are most likely to occurbyone-or more of the following
1 Direct contact with contaminated surficial and subsurface soils sediments or surface-water x N
mdashN2 Inhalation of fu^Uve^ust carrying contaminants
3 Inhalation of volatile orgsuuc compound vapors while test pitting or sampling the various media on-site
Toxic and Pharmacological Effects Refer to the NIOSH Guide to Chemical Hazard Table 2 lists the major chemicals of concern and their toxic and pharmacological effects Acute exposure to PCBs PAHs Lead and VOCs may result in dizziness or nausea The results of chronic exposure may include but are not limited to central nervous system depression liver and kidney damage and irritation of skin eyes and respiratory passages Many PCBs PAHs and VOCs are known or suspected carcinogens Routes of exposure include inhalation topical and ingestion
Document Vol II SC SAP Appendix A Revision 1
Date March 28 1991 Page 5
Heat-related illnesses range from heat fatigue to heat stroke the latter being the most serious Heat stroke requires prompt treatment to prevent irreversible damage to health Protective clothing may have to be cut off Less serious forms of heat stress require prompt attention to prevent further complications which may lead to heat stroke Unless the victim is obviously contaminated decontamination procedures should be omitted or minimized so that treatment may begin immediately
Hypothermia may result from personnel exposed to excessive cold during sampling operations Hypothermia requires prompt treatment to prevent serious damage to health Damp or wet clothing may have to be cut off and the persons body temperature must be elevated as soon as possible through the use of warm blankets or another persons body warmth Unless the victim is obviously contaminated decontamination procedures should be omitted or minimized so that treatment may begin immediately
Area Within Augusta Maine city limits
Proposed On-Site Activities Test pitting boring or hand augering for collection of surface and subsurface soil samples collection of sediment and surface water samples from an inflatable boat or from wading into the water with hip-boots and collection of samples from within the on-site Barn Potential physical safety hazards during each of the four proposed Source Control site activities are discussed per activity below
Test Pitting and Borings for Surface and Subsurface Soil Samples A backhoe will be used during test pitting operations to excavate soil for collection of samples The most significant hazard during this sampling effort is the potential for collapse of the excavation while sampling Therefore in accordance with OSHA and 29CFR1926 Subpart P if personnel are required to enter an excavation the excavation will be no deeper than 5 feet unless it is braced or sloped back For the Type A soils documented on-site (eg clay and glacial till) the required slope from the ground surface to the top of unbraced portion of the excavation in all directions is 05 HORIZONTAL 1 VERTICAL Short-term excavations of this type will not exceed 12 feet in depth In general a drilling rig will likely be used to obtain samples from depths below 5 feet by augering to a specified depth and using a split-spoon sampler
Document Vol H SC SAP Appendix A Revision 1
Date March 28 1991 Page 6
Other physical hazards during test pitting and boring operations include the presence of overhead objects (eg backhoe bucket) so hard hats must be worn during these tasks at all times In addition the potential for spreading contamination with fugitive dust during excavation and mobilization between sampling locations is much greater than during other Source Control sampling efforts Therefore Level C dermal and respiratory equipment must be worn during all test pitting and boring operations (see below) Additional decontamination procedures will be required between sampling areas to limit the potential for cross-contamination (see below)
Sediment and Surface Water Sampling These operations will be conducted using Level C dermal protection only The need for respiratory protection will be based on criteria discussed in the next section In order to collect sediment and surface water samples in interior portions of the Upland Marsh and Upper and Lower Lagoons an inflatable boat or hip-boots will be used Further sampling will be performed by walking along the shores of the surface water bodies while dragging a sediment sampler These operations involve the risk of falling in relatively deep water while equipped with Level C dermal protection This equipment may limit movement and may inhibit a person from swimming easily to safety Therefore while sampling with the boat a Coast Guard Approved life vest will be worn at all times In addition one person will standby on-shore to observe the boat operation and to assist in the event of a mishap Depending on the water and air temperature at the time of sampling it is possible that a person who had fallen in water may require treatment for hypothermia or shock
Barn Sampling The barn can be classified as a confined work space since it is fully enclosed and has a limited number of exits In order to operate safely in a confined work space special considerations are necessary Unlike some confined spaces the barn has numerous small openings in the wooden structure to allow for an adequate supply of air while collecting samples However the sampling effort will likely generate a significant amount of airborne dust within the barn which means that Level C dermal and respiratory protection must be worn at all times while in the barn One person will remain outside the barn during the sampling effort to observe the sampling personnel and to provide backup services Two Combination Type A-B-C fire extinguishers capable of extinguishing wood and paper flammable liquidis or electrical fires will be available (one inside and one outside the barn with the standby person) in the unlikely event of a fire occurring during sampling
Document VoL H SC SAP Appendix A Revision 0
Date January 171991 Page 7
In accordance with OSHA 29CFR1910120 a minimum lighting intensity of 5 foot
candles will be provided within the barn during sampling The creation of dust and the
low lighting which may be available in some areas of the barn is likely to limit vision
some of the time Special care must be taken to avoid tripping over the numerous
objects disposed of within the barn No electricity is available in the barn so power
will come from outside the barn to supply power for lighting and tools to be used in
the sampling effort This means that electrical extension cords will be laid out on the
floor to various sampling locations In addition a large amount of metal and wooden
debris exists within die barn which may become obstacles to free movement in certain
areas The wooden floors of the second story and loft ofxthe^arn are extremely
deteriorated in some places and should not be accessed unless authorized by the Site
Safety Coordinator v
The use of electric power tools to collect samples ^wobd boring and concrete drills) require special care The use of Level C dermal protection such as loose fitting gloves may make handling the drills more difficult Use speciaLcare to avoid contacting the moving bits of the drills while in operation tonvoid tearing tyveks or gloves If dermal protection is torn replace or patch it immediatelybefare proceeding with the sampling operation
Perimeter Establishment
MapSketch Attached See bdquo Perimeter Identified Access to site is restricted at all entry points via a locked
8-foot high cyclone fence^- x y
Zone(S) of contamination identified See Figure HS-1 through HS-5
Document Vol II SC SAP Appendix A Revision 1
Date March 28 1991 Page 8
Recommended Level(s) of Protection On-site personnel will use Level C dermal protection at all times See below for respiratory use
1 Protective Clothing
Sampling and decontamination personnel in these areas will wear
bull Disposable Tyvek coveralls over cotton coveralls bull Tyvek hoods bull Safety glasses or face shield bull Hard Hat bull Disposable booties over workbooks or waders for sampling surface water and
sediments bull Butyl rubber gloves over surgical gloves bull All gloves and booties will be taped to the Tyvek coveralls
2 Respiratory Protection
Air purifying respirators will be worn at all times while sampling during test pitting and boring operations and while inside the barn Otherwise the need for respiratory protection will be determined by on-site monitoring for organic vapors and the daily potential for exposure to airborne particulates The decision to utilize air-purifying respirators due to airborne particulates will be made by monitoring with a MIE MINIRAM Hand-held Aerosol Monitor (HAM) Based on previous studies (Endangerment Assessment Appendix F) an action level for worker safety of 10 mgm3 of respirable dust was established for the site Therefore when readings on the MINIRAM of 10 mgm3or greater are experienced Level C respirators will be worn Initial on-site monitoring for organic vapors will be conducted using an HNu Photoionization Detector (PID) Ambient vapor levels of 5 to 10 ppm above background in the breathing space will require the use of full-face cartridge respirators (Level C Protection) Background levels will be determined at the edge of the Site (ie fence line) before the initiation of the days activities Air quality will be monitored at the upwind boundary of the site at three locationsfor a duration of one minute at each location The maximum PID reading at each location will be recorded and the three readings will be averaged to determine the background level for that day Respiratory protection will be full-face respirators fitted with combined organic vapor and high-efficiency particulate cartridges (MSA Type GMA-F) Respirator cartridges will be replaced at a minimum on a daily basis Depending on readings obtained with the MINIRAM cartridges may be replaced at mid-day on windy days
Levels of organic vapors greater than 10 ppm above background in working areas will necessitate utilization of self-contained breathing apparatus (Level B Protection) During sampling HNu monitoring should be utilized to detect any changes in organic vapor levels Changes in fugitive dust or vapor level detection at any time may warrant appropriate alteration of required respiratory protection
Document VoL H SC SAP Appendix A Revision 0
Date January 171991 Page 9
Decontamination and Disposal
A decontamination areawill be assembled at the entrance to the site The decontamination zones will be established such that personnel and equipment are fully decontaminated prior to leaving the fenced area In addition all personnel will be familiar with proper decontamination procedures prior to going on site All personnel entering and exiting the hot zone shall pass through the decontamination zone
1 Personnel Decontamination
The personnel decontamination sequence is as follows
a Samples and equipment are dropped on plastic sheets
b Disposable booties Tyvek coveralls and contaminated outer gloves are first brushed off with soapy water then rinsed with clean water by decontamination personnel Thedisposable equipmenfis^then removed baggedand placed in a 55shygallon drum marked Dry Deconv
c Neoprene boots and outer gloves are washed if they were not drummed in Step b with soapy water and ririseck with clean water An additional rinse with methanol followed by a firiak water-rinse completes the sequence
lt d Neoprene boots and glovesare -removed
e Respirators (cartridge-change) are removed if necessary and disposed in the Dry Decon drum
f Surgical gloves are temovfedand disposed in the Diy Decon drum
Document Vol M SC SAP Appendix A Revision 0
Date January 17 1991 Page 10
2 Equipment Decontamination
The equipment decontamination procedure for Source Control sampling work performed inside the fenced area of the site is as follows
a All disposable items (eg surgical gloves plastic sheeting nylon brushes etc) will be discarded in the Dry Decon drum
b Heavy equipment such as the backhoe and drilling jig will be steam-cleaned on a specially constructed decontamination pad located east bfthermain site access gate and north of the ground water monitoring well couplet MW1Q2A and MW102B (see Figure HS-7) The pad will be constructed to allow for drainage of steam-cleaning solutions onto a bermed multi-layer -impermeable barrier consisting of several layers of at least 6-mil-thick polyethylene sheeting overlain and underlain by geotextile fabric The geotextile fabricwilfbe designed to collect contaminated sediments which may have collected on tires or excavating equipment Rinse water from the decontamination processwill then fre pumped through hoses or channelled for drainage into the Uppei^La^oomafter completion of surface water and sediment sampling The decontamination pad will be left in place after completion of field sampling
c All other equipment contacting surface or subsurface soils sediments surface water or materials within thebarm(egtrowels spatulas templates drill bits etc) will be decontaminated by rinsing with clean water scrubbing with methanol and re-rinsing with distilledwater Solutions which contain methanol will be collected for disposal into tHeJWet Decon drum Equipment used during barn sampling will then be drted^with paper towels and the towels will be disposed in the Dry Decon drum ^
3 Decontamination Station Closure
The procedure for decontamination station closure will be as follows
a Decontamination personnel shall be responsible for closing the station at the end of each workday
b All solid wastes such as plastic tarps bags and Tyveks will be placed in the Dry Decon drum and will be closed at die end of each workday
Document Vol IISC SAP Appendix A Revision 0
Date January 171991 Page 11
All spent decontamination solutions containing methanol will bedisposed of in the Wet Decon drum Decontamination solutions which are not composed of methanol and exhibiting PID readings below 1 ppm will be poured into surficial soils on the edge of TWA I within the fenced area of the site If PID readings are greater than 1 ppm the solutions will be disposed in the Wet Decon drum These drums will be closed at the end of each workday
d Drums shall be secured on-site until proper disposal is arranged after consultation with EPA
7 Air Monitoring Procedures X
Site Monitoring Equipment PID HNu PI-101 HAM MIE MINIRAM
Since Level C respirators will be used during test pitting and barn sampling air at the test pit and barn sampling areas will be monitoredfegularly with a PID and HAM primarily for future reference of the levels of VOCs and dustto^be expected during remedial activities During the other sampling efforts air monitoring wiH form the basis for whether an upgrade to Level C respiratory equipment is necessary TheltPID will be used regularly during soil sediment and surface water sampling^ TKampHAM will be used at least twice per hour while on-site to monitor for dust levels in air^Whenunusually windy conditions are experienced additional monitoring for dust levels wilLbe^erfbrmed When ambient temperatures in air are below 32deg F the chart recorderattachment for the MINIRAM must be used as the LED readout on the instrument may not operate below freezing All PID and HAM readings will be recorded in theJield Log Book
Document VoL H SC SAP Appendix A Revision 0
Date January 171991 Page 12
Emergency Information
Location Phone
FIRE Augusta (207) 623-2511
POLICE Augusta (207) 623-2511 State Police (Augusta) (207) 621-1200
AMBULANCE Augusta (207) 623-25tlx N
HOSPITAL Kennebec Valley Medical Center (207) 626-1000 Augusta Division N 6 East Chestnut Augusta ME
Chemical Trauma Capability Yes
EPA (Michael Jasinski) 7) 573-5786
DEP (Thomas Benn) (207) 289-2651
CMP (Charles Nickerson) (207) 623-3521
Directions to Hospital (See Fig HS-6)
Primary route to hospital is west on Route17 (Eastern Avenue) to Arsenal Avenue turn right on Arsenal Avenue and go3 blocks to E Chestnut street then right Emergency room entrance is 6 East Chestnut Street Alternate route - west on Route 17 (100 yards) to Cony Road turn right on Cony Road take^rst left (Cony Street Ext) to Riverside Drive go left on Riverside Drive the second mtejsection will be Arsenal Street goleft on Arsenal Street East Chestnut Street will be second left
Document VoL H SC SAP Appendix A Revision 0
Date January 171991 Page 13
Additional Emergency Contacts
DR DAVID EGILMAN (617) 935-8581 HEALTH RESOURCES WOBURN MASSACHUSETTS
GEI CONSULTANTS INC
ROBERT E STETKAR (603) 224-7979 JOSEPH G ENGELS (617)721^4022 s
TSCA HOTLINE (800)424-9065
AT amp F (EXPLOSIVES INFO) (800^424-9555 V
NATIONAL RESPONSE CENTER x(8W) 424-8802
PESTICIDE INFORMATION SERVICE (800)845-7633
RCRA HOTLINE y -(800) 424-9346
CMA CHEMICAL REFERRAL CENTER (800) 262-8200V NATIONAL POISON CONTROL CENTER (800) 942-5969-y
US DOT bdquo (202) 366-0656
GEI CONSULTANTS ^ (603) 224-7979
Prepared by Thomas S Bobowski Date January 7 1991
Reviewed by Robert E Stetkar Date January 9 1991
All personnel working at this site have received OSHA required health and safety training Personnel are enrolled in a medical monitoring program A summary of training completed for all GEI personnel involved in the Source Control sampling program is provided in Table 3
Use of Common Sense is Required
I have read and understand this safety plan
Name (printed) Signature Date
Table 1A Organic and Inorganic Chemicals Detected in the Shallow Aquifer
Groundwater Samples at the F OConnor Site Maximum
Concentration Geometric Background
Range Mean[a] Concentration (ugL)
Chemical Frequency (ugL) (ugL)
ND(b]-2300B[c] 150 NDAcetone 211 ND-15J[d] NA[e] NDBenzene 211 ND-45 143 ND2-Butanone 17 ND-83 53 NDChlorobenzene 311 ND-53 NA NDToluene 27 ND-12J NA NDTriehloroethene 1P ND-11 81 NDBis(2-Ethylhexyl)Phthalate 411 ND-25 1deglaquo2 ND12-Dichlorobenzene 411 ND-14J 97 ND13-Dichlorobenzene 311 ND-13J 96 ND14-Dichlorobenzene 311 ND-29 94 ND124-Trichlorobenzene 17 ND-19 07 NDTotal PCBs 111 27-5085 06 49Aluminum 55 27-805 24 42Barium 55 13700-125451 38300 26600Calcium 55 ND-145 53 NDChromium 25 ND-37 NA NDCobalt 15 ND-285 66 14Copper 35 33-4952J 590 3Iron 55 ND-18 37 NDLead 15 21-2906 260 24Manganese 55 ND-154 10 NDNickel 15 ND-17 37 NDSilver 15 10593-72812 33400 14000Sodium 55 ND-71 71 NDVanadium 15 17-946 263 91Zinc 55
a) Calculated using detected concentrations and one-half of EPAs contract laboratory program (CLP) detection limits for the organics For the inorganic
chemicals the aqueous CLP detection limits were used
b) ND - Not Detected
c) B designates Chat substance was also found in the blank though the
sample level was significantly higher to prove a positive detect
d) J designates estimated value
e) NA - Not applicable Chemical was detected infrequently and the use of
one-half of the detection limit in calculating a mean results in a mean
concentration that exceeds the maximum Therefore a mean is not used
SourceEndangerment Assessment dated Jan 29 1988 by CDM
Table IB Organic and Inorganic Chemicals Detected in Bedrock Aquifer
Groundwater Samples at the F OConnor Site
Mean Concentration Geometric Background
Chemical Frequency Range (ugL)
Mean[a] (ugL)
Concentration (ugL)
Acetone 220 ND[b]-1200 68 ND Benzene 220 ND-27J[c] NA(d] ND Chloroblt ene 620 ND-16 36 ND Toluene 215 ND-27J NA ND Bis(2-E vlhexyl)Phthalate 1320 ND-64 Hi 61 12-Dich 13-Dic^
irobenzene jrobenzene
720 120
ND-26 ND-24J NA
66 ND ND
14-Dic^ robenzene 620 ND-44 82 ND Di-n-Bu phthalate 120 ND-22J NA ND 124-Tr hlorooenzene 720 ND-310 161 ND N-Nitros iiphenvlamine 25 ND-4J NA ND 3eta-BHC 110 ND-04 004 ND Gamma-BH (Lindane) 110 ND-006 003 ND Total PC 320 ND-50 LO ND Antimony 110 ND-55 19 ND Barium 1010 15-129 138 56 Chromium 410 ND-268 54 ND Cobalt 110 ND-115 92 ND Iron 1010 61-384301 837 152 Magnesiu Manganes
1010 810
5960-46250 ND-5895
15220 661
4203
27 Nickel 310 ND-345 125 ND Potassiu 1010 3504-16046 6560 4340 Vanadium 110 ND-52 NA ND
a) Calcul ted using detected concentrations and one-half of EPAs contract labor 3ry program (CLP) detection limits for the organics For the inorganic chemic Is the aqueous CLP detection limits were used
b) ND mdash F detected
c) J de Ignates estimated value
d) NA - N applicable Chemical was detected infrequently and the use of one-ha of the detection limit in calculating a mean-results in a mean concern ation that exceeds the maximum Therefore a mean is not used
Source Endangerment Assessment dated Jan 29 1988 by COM
Table 1C Organic and Inorganic Chemicals Detected in In-Fence Surface Soil
Samples at the F OConnor Site Mean
Concentration Geometric Background Range Mean[a] Concentration
Chemical Frequency (ugAg) (ugkg) (ugAg)
19 ND[b]-19J[c] NA[d] ND Chicroform ND29 ND-150B[e] 63Methylene Chloride
ND19 ND-30J NAToluene 260J19 ND-917J 260Bis(2-Ethylhexyl)Phrhalate
Carcinogenic PAHs ND19 ND-2700J 290BenzoltAgtAnthracene ND29 ND-12000J ^10BenzoltB or KgtFluoranthene ND39 ND-11000J 540Chrysene ND39 ND-23183Total CPAHs
Non-carcinogenic PAHs ND39 ND-12000J 540Pvrene ND39 ND-12000 540Total NCPAHs ND118186 ND-6205600 3400 Total PCBs 4001419 ND-64000 1900Cadmium 292001919 17000-29480000 275000
Copper 570001919 29000-2681000 213000Lead 252001919 19000-90000 35000Nickel ND219 ND-12000 650Silver 738001919 45000-1160000 183000Zinc
aj Calculated using detected concentrations and one-half of EPAs contract UboSto program (CLP) detection Unite for the organic For the inorgar-c chemicals the detection limits for soils were based on aqueous CLP
detection limit
b) ND - Not Detected
c) J designates estimated value
d) NA - Not applicable Chemical was detected infrequently and the use of one-half of the detection limit in calculating a mean results in a mean concentration that exceeds the maximum Therefore a mean is not used
e) B designates that substance was also found inthe blank though the sample level was significantly higher to prove a positive detect
Source Endangerment Assessment dated Jan 29 1988 by Clement Associates Inc
Table ID
Organic and Inorganic Chemicals Detected in the TVA III Surface Soil Samples at the F OConnor Site
Concentration Geometric Background Range Meanfa] Concentration
Chemical Frequency (ugAg) (ugAg) (ugAg)
44-DDT 13 ND[b]-5200 150 ND 44-DDE 13 ND-260 56 ND Total PCBs 2131 ND-620000 2940 ND
Antimony 11 189000 41000
Cadmium 11 11000 400 Copper 11 230000 29200 Iron 11 60900000 22200000 Lead 11 634000 57000 Zinc 11 799000 73800
a) Calculated using detected concentrations and one-half of
ErAs contract laboratory program (CLP) detection limits
b) ND - Not Detected
Source Endangerment Assessment dated Jan 29 1988 by Clement Associates Inc
Table IE irganic Chemicals Detected in Upland Marsh Sediment
Samples at the F OConnor Site[a] Maximum
Concentration Geometric Background Range Mean[b] Concentration
Che ical Frequency (ugAg) (ugAg) (ugAg)
To ane 11 23J[c] - ND[d] To- 1 PCBs 33 1300-34000 6425 ND
a) norganic chemicals were also analyzed for but none were itected significantly above background concentration
b) alculated using detected concentrations and one-half of PAs contract laboratory program (CLP) detection limits
c) J designates estimated value
d) D - Not Detected
Source Endangerment Assessment dated Jan 29 1988 by Clement Associates Inc
Chemical
Acetone 11 408B[c] ND[d]
Bis(2-EthyIhexy1)Phthalate 11 2082 ND
Toluene 11 28J[e](f] ND
Total PCBs 44 30000-1100000 381000 ND
a) Inorganic chemicals were also analyzed for but none were detected
significantly above background concentration
b) Calculated using detected concentrations and one-half of EPAs contract
laboratory program (CLP) detection limits
c) B designates that substance was also found in the blank though the sample
level was significantly higher to prove a positive detect
d) ND - Not Detected
e) J designates estimated value
f) In a duplicate sample toluene was not detected A geometric mean of the detected value and one-half of the detection limit would have resulted
in a mean concentration exceeding the detected value Therefore only
the detected value is listed
Source Endangerment Assessment dated Jan 29 1988 by Clement Associates Inc
Table 1G Organic and Inorganic Chemicals Detected in Lower Lagoon Sediment
Samples at the F OConnor Site Maximum
Concentration Geometric Background Range Mean(a] Concentration
Chemical Frequency (ugAg) (ugAg) (ugAg)
Bis(2-Ethylhexyl)Phthalate 12 ND[b]-100J[c] NA[d] ND
Benzoic Acid 22 120J-190J 150 ND Total PCBs 77 3202-40100 8660 ND
Cadmium 12 ND-2500 790 ND c 22 27000-59000 40000 20000
Lead 22 17000-70000 34500 ND
Manganese 22 525000-982000 718000 474000
Selenium 12 ND-760 436 ND Zinc 22 103000-249000 160000 108000
a)Calculated using detected concentrations and one-half of EPAs contract laboratory program (CLP) detection limits for the organic For the inorgan chemicals the detection limits for sediments were based on the aqueous CLP
detection limit
b) ND - Not Detected
c) J designates estimated value
d) NA - Not Applicable Chemical was detected infrequently and the use of
one-half of the detection limit in calculating a mean results in a mean
concentration that exceeds the maximum Therefore a mean is not used
Source Endangerment Assessment dated Jan 29 1988 by Clement Associates Inc
Table 1H Organic and Inorganic Chemicals Detected in Riggs Brook Sediment
Samples at the F OConnor Site Maximum
Concentration Geometric Background
Range Mean[a] Concentration
Frequency (ugAg) (ugkg) (ugAg)Chemical
12 ND[b]-30 12 NDMethylene Chloride
Carcinogenic PAHs 22 160J[c]-790 360 230JBenzoltAgtAnthracene 22 220J-800 420 290JBenzoltAgtPyrene 22 2-63J-1600 650 710J3enzoltB or KgtFluoranthene 22 280J-960 520 400J
Chrysene 12 ND-190J NA[d] NDDibenzltAHgtAnthraeene 12 ND-400J 340 NDIndenoCl23-CDgtPyrene 22 1507-4740 2670 2402Total CPAHs
Non-carcinogenic PAHs 12 ND-110J NA NDAcenapthy1ene 12 ND-200J NA NDAnthracene 12 ND-410J 350 ND
BenzoltGHIgtPerylene 22 280J-1200 580 420J
Fluoranthene 12 ND-80J NA NDFluorene 22 72J-680 220 150J
Phenanthrene 22 290J-1500 660 470J
Pyrene 22 1810-4180 2750 2584Total NCPAHs 615 ND-6481 870 NDTotal PCBs 12 ND-1200 775 NDSilver
a) Calculated using detected concentrations and one-half of EPAs contract laboratory program (CLP) detection limits for the organics For the degrgan chemicals the detection limits for sediments were based on the aqueous CLP
detection limits
b) ND - Not detected
c) J designates estimated value
d) NA - Not applicable Chemical was detected infrequently and the use of one-half of the detection limit in calculating a mean results in a mean
concentration that exceeds the maximum Therefore a mean is not used
Source Endangerment Assessment dated Jan 29 1988 by Clement Associates Inc
Table II Inorganic Chemicals Detected in Upland Marsh Surface
Water Samples at the F OConnor Site[a]
Sample Background
Concentration Concentration
Chemical Frequency (ugL) (ugL)
Aluminum 11 884 104 Arsenic 11 35 ND(10)[b]
Barium 11 12 47 Iron 11 3540 1160 Lead 11 36 ND(5)
Manganese 11 ^29 134 Potassium 11 7260 3610
a) Organic chemicals were also analyzed for but
none were detected
b) ND - Not Detected Limits of detection are
given in parentheses
Table 1J Organic and Inorganic Chemicals Detected in Upper Lagoon
Surface Water Samples at the F OConnor Site
Sample Background
Concentration Concentration
Chemical Frequency (ugL) (ugL)
108 ND(10)[a]Total PCBs 11 47Barium 11 23
6 ND(5)Lead 11 Manganese 11 1450 134
25 ND(40)Nickel 11
a) ND - Not Detected Limits of detection are given in
parentheses
Source Endangerment Assessment dated Jan 29 1988 by Clement Associates Inc
Table IK Organic and Inorganic Chemicals Detected in Lover Lagoon
Surface Water Samples at the F OConnor Site Maximum
Concentration Geometric Background Range Mean[a] Concentration
Chemical Frequency (ugL) (ugL) (ugL)
Total PCBs 22 13-375 221 ND[b] Aluminum 22 56-3740 458 104
Arsenic 12 ND-4 NA[c] ND
Barium 22 12-37 67 47
Cobalt 12 ND-9 NA ND Iron 22 1970-8260 4030 1160
Lead 22 91-13 109 ND
Manganese 22 137-2330 565 134 Potassium 22 5200-6220 5690 3610
a) Calculated using detected concentrations and one-half of EPAs
contract laboratory program (CLP) detection limits for the organics For the inorganic chemicals the aqueous CLP detection
limits were used
b) ND - Not Detected
c) NA - Not Applicable Chemical was detected infrequently and the
use of one-half of the detection limit in calculating a mean
results in a mean concentration that exceeds the maximum
Therefore a mean is not used
Table 1L
Inorganic Chemicals Detected in Riggs Brook Surface Water Samples at the F OConnor Site[a]
Maximum
Concentration Geometric Background Range Mean[b] Concentration
Chemical Frequency (ugL) (ugL) (UgL)
32 NDAntimony 13 ND[c]-35 5 NDLead 13 ND-16
a) Organic chemicals were also analyzed for but none were detected
b) Calculated using detected concentrations and one-half of EPA s
contract laboratory program (CLP) aqueous detection limits
c) ND - Not Detected
Source Endangerment Assessment dated Jan 29 1988 by Clement Associates Inc
Chemical
Acetone |CHCOCH3l Dimethyl ketone ketone propane
Toluene |CHCHJ _ e bull bull a O J Jtoluol phenyl aethane aethyl benzene
Cblorobcnzene (CHC1) aonochlorobenzene chlorobenzol
Ethyl benzene |C_HCH| phenyl ethane ethyl benzol
ACC TLV or STEL
ltPPB) (PfB)
750 1000
100 150 skin
75 (550agaraquo)
100 125
TABLE 2 CHEMICAL TOXICITY AND OTHER INFORMATION
Physical Skill Dcraal LD^ (mgkg) State Penetration Tonicity Potency ofraquoI(rat)
bullbullbull local it 9750liquid Bint-like odor
1297(nice)
liquid t local 5000
TC|Huosn =Ml00 ppa
colorless liquid 2910
colorless liquid local H 3500 with aromatic odor
syatcaatic bullbullbull TCu(Kiais) c 100 ppa
A hrs
Page 1 of 4
Remarks
Syaptoas Irritates eyea none throat narcotic in high concentrations
Target Organ respiratory aystea skin
First Aid Swallow water voait Skin soap wash
Incoapatibilities oxidizing materials acids Fire hazard when csposed to beat or flame
Tonicity 1 Persistence1 0
Syaptoas fatigue confusion euphoria dizzy headache dialated pupils lack of appetite nervousness insoania
Target organ CNS liver kidneys skin
First Aid Swallow NO VOHIT 8kln soap waah
Incoapatibilities strong ozldizers
Toxicity1 2 Persistence 1
Syaptoas irritates eyes nose causes drowsiness incoordination skin irritation
Target organ respiratory systea eyes skin cars liver
First Aid NO VOMIT
Incoapatibilities strong oxidizers reacts violently with AgClO^
Toxicity 2 Persistence 2
Syaptoas irritant to eyes and aucous aembrane headache narcotic
Target organ eyes upper respiratory systea
First Aid NO VOHIT
Incoapatibilities oxiding asterisks dangerous when exposed to heat or flame
TABU 2 Page 2 of 4 CHEMICAL TOXICITY AND OTHER INFORMATION
(continued)
ACC TLV or STEL Physical Skin Dcraal ID (agkg)
Cheaical (PPff) (PPB) State Penetration Toxicity Potency orsl(rat) Rcnarks
Benzene benzol
IC^H) 10 23 colorless liquid with aroaatic odor
local systeaatic
bullbull
bullbullbull Poisoning occurs aost coasaonly through lnhalationi also penetrates through akin
Syaptoass lrritatea eyes nose respiratory systea giddiness head nausea staggered gait fatigue depresesion sbdoaioal pain
Target organs bloody CNS skin bone narrow eyes respiratory systea
First Aids Swallows 8kins
NO VOMIT soap wash
Inconpatibilitiess strong oxidizers chlorine hronine with iron Dangerous when exposed to beat or flaae
Toxicitys 2 Persistences 1
Trichloroctbylcne ethylene trichloride tridene TCE
30 200 colorless liquid sweet odor
4820
1900(dog)
Syaptoass headache vertigo vision distortion treaors soanolcnce nausea voait irritates eyes cardiac errytbaiss paresthesias
Target organs respiratory systea heart liver kidneys CNS skin
First Aids Swallows Skins
Ipecac voait soap wash immediately
incoapatibless strong caustics chemically active actalss Da Li Ra Hg liquid O
Al 02 KN03 Ti
Persistences 3
Polychlorlasted biphenyi PCB Arocblor 1242 CjjHjClj(approx)
Arcblor 1234
C6H2C3C6M3C12
03
colorless to dark brown liquid with aild hydrocarbon odor
local systeaatic
local
Poisoning occurred Boat coaaonly through investigation or penetration of skin
Sypatoaas Irritates eyes (discbarge) skin scne-fora dernitatis Jaundice dark urine Target organs liver eyes skin First Aids Swallows Ipecac voait
Skins soap wash isnediately Incoapatibless strong oxidizers
TABU 2 CHEHICAL TOXICITY AND OTHER INFORMATION Page 3 of 4
ACC
Chulcil TLV or STEL (ppa) (POO)
Physical State
Skin Penetration
Derail Tonicity Potency
U)n (ngkg) of Reaarka
Dloctyl phtbalate di-acc-octyl pblbalata
5 aga1
light colored liquid
31000 Tonicity low to none via oral and derail routca produce 01 ayaptoas
12 Bichlorobenzene (C^H CI ) o-OCB
50 none liquid ++ local systemic
Symptoms irritates eyes and nose Target Organs liverkidneysskineyes First Aid Swallow salt water vomit
Skin soap wash Incompatabilities strong oxidizers
14 bichlorobenzene (CHbdquoC1 ) 7 2
P-OCB 75 110 solid ++ local
systemic ++ Symptoms irritates eyesheadachesnauseavomiting
Target Organs liverkidneyskineyesrespiratory system
first Aid Swallow water vomit skin soap wash
Incompatablities none
Lead (Pb) 015 mgm
none solid systemic t Symptoms Fatigue headaches abdominal pain Target Organs kidneys 61 central nervous system First Aid Swallow water vomit
Skin soap wash
Polycyclic Aromatic Hydrocarbons (PAHs)
015 mgm
none liquid systemic + Symptoms No obvious symptoms Carcinogenic to tissue following prolonged contact
First Aid Swallow water vomit Skin soap wash
Page 4 of4TABU 2 CHEMICAL TOXICITY AND OTHER INFORMATION
(continued)
NOTES
TLV - Threshold Unit Value ACC - Acceptable Ceiling Concentration STEL - Short Tera Exposure Limit
Suspected carcinogens teratogens or mutagens Firat Aid Unless specified flrat aid for oil of the liated cbeaicala are aa followa
Eyeai iaaedlatcly waab with copious quantity of cold water Skins Flush with water proaptly Breath Artificial respiration Swallowi Water voait
a Slight Hazard aa Hoderate Hasard aalaquo Extreme Hasard
Toxicity Ratiosa
Toxicity Rating
No toxicity (none) Material causes no hara in any condition or produces
tosic effects on buaana in very unusual circumstances or
in very large dosage
Slight toxicity (low)
Moderate toxicity
Severe toxicity
Persistence or each hazardous substance ia evaluated on its blodegradabllity aa follows
Assigned Value
Easily biodegradable coapounds 0
Straight chain hydrocprbons 1
Substituted and other ring compounds 2
Metals polycyclic coapounds and halogenated hydrocarbons 3
Adapted with modifications from EC Jordon Co RIFS Work Plan
TABLE 3 - PERSONNEL TRAINING AND MEDICAL MONITORING HEALTH AND SAFETY PLAN Field Sampling Plan OConnor Co Site Augusta Maine
personnel1
Robert E Stetkar
Joanne O Morin
Richard F Murdock
Benjamin Y Su
Joseph G Engeis
Steven R Lamb
Thomas S Bobowski
Boyd P Smith
Christopher L Covel
William J Haswell
Charles Blodgett
NOTES
ANNUALreg MEDICAL
MONITORING
yes
yes
yes
yes
yes
yes
yes
yes
yes
yes
yes
lt
y
OSHA 40shyHOURreg HAZMAT TRAINING
yes
yes
yes
yes
yes
yes
yes
yes
yes
yes
yes
ANNUALreg RESPIRATOR
FITTEST
yes
no
no
no
no
yes
yes
yes
es Yes
yltes
-y
CARDIOshyPULMONARY
FIRST AID RESUSCITATION TRAINING TRAINING
no no
yes yes
nov no
no no
no no
yes yes
yes yes
yes yes
yes yes
no no
yes yes
1 Only GEI personnel assigpedttfdo work on the OConnor site included on this list
2 Includes baseline and annual physicals lilood testing etc
3 In accordance with 29CFR191012tkncludes annual 8-hour refresher course
4 Includes annual respirator fit testing procedures
Project 90393 GEI Consultants Inc January 17 1991
TOW MAXARJM PCS CONCENTRATION (gtbullraquo) 8Y AREA
Central Maine Power Company Pre-Design Work Plans INTERPRETED CONTOURS Scale 1 inch = 180 feet Augusta Maine OConnor Site OF PGBs IN
Augusta Maine IN SURFICIAL SOILS From EC Jordon Co RIFS
Report dated June 1989 0 G E I C o n s u l t a n t s I n c Project 90393 January 1991 FigHS-2
Central Maine Power Company Pre-Design Work Plans DISTRIBUTION OF PAHs Scale 1 inch = 180 feet Augusta Maine OConnor Site IN SURFACE AND
Augusta Maine SUBSURFACE SOILS From EC Jordon Co RIFS
Report dated June 1989 0 G E I C o n s u l t a n t s I n c Project 90393 January 1991 FigHS-3
Central Maine Power Company Pre-Design Work Plans INTERPRETED DISTRIBUTION Scale 1 inch = 180 feet Augusta Maine OConnor Site OF LEAD IN SOILS
Augusta Maine From E C Jordon Co RIFS
Report dated June 1989 ltD G E I C o n s u l t a n t s I n c Project 90393 January 1991 FigHS-4
Central Maine Power Company Pre-Design Work Plans ANALYTICAL RESULTS FROM Scale 1 inch = 160 feet Augusta Maine OConnor Site SEDIMENT AND SURFACE
Augusta Maine WATER LOCATIONS From EC JOrdon Co RIFS lttgtReport dated June 1989 G E I C o n s u l t a n t s I n c Project 90393 January 1991 FigHS-5
Contamination 80 Feet
Control Line
Central Maine Power Company Pre-Design Work Plans SITE ACCESS AND Augusta Maine OConnor Site DECONTAMINATION
Revision 1 March 281991 Augusta Maine AREA
laquo G E I C o n s u l t a n t s I n c Project 90393 March 1991 KgHS-7
bull
Document Vol II SC SAP Appendix B Revision 0
Date January 17 1991 Page 1
APPENDIX B
FieldtogjL
FIELD LOGS
Project Field Log Book Equipment Calibration Logs
HNu Pl-101 MIE MINIRAM MARKSON CONDUCTIVITY METER MARKSON DIGITAL pHTEMPERATURE
Photograph Log Health and Safety QA Logs
Chain-of-Custody Forms Sample Assignment Forms Non-Conformance Report Forms Test Pit Log Forms Barn Sampling Forms Dexsil L-2000 PCB analyzer Calibration Boring Log Forms
lt
Document Vol II SC SAP Appendix B Revision 0
Date January 17 1991 Page 2
(OCONNORFL1)
(OCONNORFL2) (OCONNORFL3) (OCONNORFL4) (OCQNNORFL5) pound0CONNORFL6) (OCONNORFL7)
-(OCONNORFL9) (OCONNORFLIO) (OCONNORFL11) (OCONNORFL12) fOCONNORFL13) (OCONNORFL14) (OCONNORFL15)
Note Field Log OCONNORFLampisassigned to ground water sampling described in the Management of Migration Sampling andiAnalysis Plan
Document Vol II SC SAP Appendix B Revision 0
Date January 17 1991 Page 3
PROJECT LOGBOOKS (OCONNORFL1)
Serialized project logbooks are to be issued by the site contractor to all personnel at the site who have been designated to perform specific field tasks Individuals must sign their logbooks upon receipt and use them to record all pertinent information until the project is completed y
Logbook entries should be dated legible and contain accurate and inclusive documentation of an individuals project activities Because the logbook forms the basisfor the later written reports it must contain only facts and observations Entries made by individuals other than the person to whom the logbook was assigned are dated andsigned by the individual making the entry bull
CALIBRATION LOG Document No OCONNOR FT1 HNu Photoionization Device Model Pl-101 Page 1 of 1
Instrument Serial No
Lamp Date Span Setting Time Calibration Temperature User
Standard Introduced Meter Response (parts per million (ppm))
Comments (See Summary of Calibration Procedures attached7
X x
User Signature Date
Task Manager Signatures Date
CALIBRATION LOG Document No OCONNORFI3 MIE MINIRAM Hand-held Aerosol Monitor Page 1 of 1
Instrument
Serial No
Date
Time
User
Standard used (zero-bag)
Meter Display
Comments
User Signature lt Date X
Task Manager Signature l Date
CALIBRATION LOG Document No OCONNORFL4 Markson Conductivity Meter Model 103 Page 1 of 1
Instrument Serial No
Date Time User
Standard Used_ Meter Display^
Comments
s
v
lt
y xy ^y
User Signature Date z V
Task Manager Signature ) i Date
CALIBRATION LOG Document No OCONNORFU5 Markson Digital pHtemperature Meter Model 95 Page 1 of 1
Instrument Serial No
Date Time User
Temperature check vs mercury thermometer
Probe reading Thermometer reading
Upon completion of calibration procedure does pH probe checkout vs pH 40 buffer Reading bull lt x pH 70 buffer Reading bull
Comments v
X x
User Signature X^ Date
Task Manager Signature Date
Document No QCONNORFT f
Page
PHOTOGRAPH LOG
Project Name
Project No
Camera and Film Specifications
FILM
ROLL FRAME
DATE nTIME PHOTOGRAPHER PHOTO NUMBER
DESCRIPTION
lt3
ni
I X
V
V
gt
Document No QOONNORm7
HEALTH amp SAFETY QUALITY ASSURANCE CHECKLIST
Page 1 of 2 Project No Site Date Completed by
A On-site Operations During Hazardous Waste Site Investigations
yes no Team understands task procedures safety plan individual roles and site history contaminants
yes no Team knowledgeable to hospital route nearest phone location and who is responsible for health and safety on site
yes no Establishment of command post and decon station with Health amp Safety Plan readily available
yes no Establish communication or line-of-site maintained
yes no Field operations conformed environmental monitoring respiratory protection or emergency response
yes no Protective clothing and respiratory protection maintained
yes no Decontamination procedures performed on the following sample containers sampling equipment and personnel
yes no Equipment protected clean calibrated and being used properly by site personnel
yes no First Aid Equipment readily available at site with checklist and eye wash
yes no Site personnel trained in CPR and First Aid
yes no Site Records maintained such as field logbooks respirator usage log incident reports in place and up-to-date and any deviations or modifications to Safety Plan
GEI Consultants Inc
uocutrenc uujmutvrLz
HEALTH amp SAFETY QUALITY ASSURANCE CHECKLIST
Page 2 of 2 Project No Site Date Completed by
B Health amp Safety Follow-up Reports
o Adherence to procedures o Accidents o Unsafe practices or conditions o Results of environmental monitoring o Corrective action
GEI Consultants Inc
Document No Q00NN0RFL9 CHAIN OF CUSTODY RECORD
DOCUMENT NUMBFR rn tLORD
RELINQUISHED DYISiONruRE OATETJMD RECEIVED DY (SIGNATURE) RELINQUISHED DY (SIOHATURER DATETI^IE RECEIVED BY (SIGNATURE)
IIElINOUISIIEO BY(SIGNATURE) DATETIMf DATETIME gt REMARKS lcNAruDn^nLADOnATonvorI
P a g e o f
Document No OCONNORFLIO
Page of G E I C o n s u l t a n t s I n c
Project No
Project Name _
Laboratory Contact
Sampler ( s ) Date Assigned Date Sampled
GEI Sample No
Sample Medium
Quantity
Sample Container
Type
Analyses Requested Remarks
Special Instructions Remarks
Document No 0CQNNDRFL11
NONCONFORMANCE REPORT
Project Project No
Auditor Audit Date Finding No
FINDING
Where found Check Lit Item
ControllingDocument Section
Task Description
Noncenformanee
Discussed with
Recommended Corrective Action
Is system correction needed to prevent recurrence Yes No If yes state recommended action
Schedule Completion Date By
CORRECTION ACTION
Correction Action by Date
QA Approval of Correction Action by Date
Date Completed Submitted by
Correction Action Verified by Date
I T E S T P I T L O G QCONNORFL12
PROJECT
LOCATIONI CLIENT
CONTRACTOR EQUIPMENTI OBSERVED BY
I DEPTH BELOW
GROUND SURFACE
I (FT)
I
I
I
1
1
1
1
I
1 REMARKS
PROJECT NO
LOCATION
GROUND EL
DATE DATUM
SOIL DESCRIPTION
PIT DIMENSIONS (FT) LENGTH WIDTH DEPTH
ltJgt G E I 1
I Docuaent No 0C0NNCRFL13
bull GEI CONSULTANTS IMC 53 Regional Drive Concord New Hampshire 03301-8500 (603)224-7979
BARN SAMPLING FORM Serial I
PROJECT INFORMATION
Project Name Source Control Pre-Oesion Studies
I Site Name(if different) OConnor Co site
Project Number
I Analytical Lab(s) ERCO EPA
GEI GC screen Other(Specify)
I METHOD OF SAMPLING
WIPE SAMPLING OF HON-POROUS SURFACES
I U000EH UALL SAMPLING UITH DRILL BIT
OUSTSOIL SAMPLING OH FLOOR SLAB
( CONCRETE SAMPLIHG ITH MORTAR BIT
(OTHER-Explain)
I
DESCRIPTION OF SAMPLE
Brief Description of Type of Material or Item Sampled
Visible Staining NO Visible Staining
Approximate Area of Stain(if any) X
LOCATION OF SAMPLE
Ground Floor Second Floor Loft
(All Measurements in Feet to 010 Foot)
Distance Along Z Axis from Reference Origin
Distance Along M Axis from Reference Origin
Height of Sample Above Floor Slab
SKETCH IN APPROXIMATE HORIZONTAL LOCATION OF THE SAMPLE COLLECTED ON FIGURE BELOU
I UALL X
I
I
UALL U UALL Y
I
I Reference Origin UALL Z
I Approximate Scale 1 inchbull 15 feet
I Sample I0(s) SIGNATURE OF SAMPLER CERTIFIES ABOVE SAMPLING RECORD
Date Time
I Sampler(s) COC Docunent Signature Date
I
CALIBRATION LOG Document No OCONNOR FL14 Dexsil L-2000 PCB Analyzer Page 1 of 1
Instrument
Serial No
Date
Time
User
Ambient Temperature deg C
Standard used (50 ppm chloride)
Reading beforeadjustingCALIBRATE knob
Reading after adjusting CALIBRATE knob
Comments
User Signature Date
Task Manager Signature Date
Document No OCONNORFL15 I BORING LOCATION DATE START FINISH
GROUND ELEVATION (NGVO ) DRILLED BY
GROUNDWATER El DATE LOGGED BY TOTAL DEPTH (FT) PG OF
I EL DEPTH S A M P L E
Its TYPE BLOWS PEN REC R E M A R K S QO SOIL ANO ROCK DESCRIPTIONSlt_land PER aFT FT NO 6 IN IN IN lt9
I
I
I
I
I
1
1
I
1
I
I
I
I
I
I BLOWS PER (-140IBHAMMER FALUNS 30T0 DRIVE NOTES A 20 IN 00 SPLIT SPOON SAMPLER
PEN-PENETRATION LENGTH OF SAMPLER OR CORE BARREL REC-RECOVERY LENOTH OF SAMPLE ROO-LENOTM OF SOUND CORES gt4INLENSTH COREO S-SPLIT SPOON SAMPLE PROJECT
I U-UNOtSTURBCO SAMPLES UF-FIXEO PISTON _ UO-OSTER8ERO bully OROUNOWATER 0 G E I
I
I
I
I
I
I
I
I
I
1 1 1 1 1 1 1 I 1 1 I
Document VoL H SC SAP Appendix C Revision 0
Date January 17 1991 Page 1
APPENDIX C
EQUIPMENT CALIBRATION PROCEDURES
Document Vol II SC SAP Appendix C Revision 0
Date January 171991 Page 2
HNu PI-101
The HNu PI-101 is factory calibrated twice a year andor if the instrument is malfunctioning Prior to field use and at the end of each day the user of the instrument will check that the instrument is still holding calibration using the following procedures
1 Prior to the calibration check check the instrument with an Organic point source (ie magic marker) prior to use to verify that it is functioning
2 Connect the rubber sampling hose from the span gas cylinder regulator to the sampling
probe of the HNu gt
3 Fully open the regulator valve gt vy
4 Note the instrument meter response after 5 to 10 Seconds y
5 If the response deviates + 15 from the coneentration of the calibration gas (this figure appears on the cylinder label) the instruihehtTeq^es factory maintenance and will not be utilized in the field until factory calibratiori^Tah alternate meter will be used after calibration checking v (
V 6 Document the calibration information Oik the appropriate equipment calibration log
(OCONNORFL2) ~y
Document VoL IISC SAP Appendix C Revision 0
Date January 17 1991 Page 3
MIE MINIRAM Model PDM-3
The MINIRAM will be factory calibrated once a year andor if the instrument is malfunctioning Prior to field use and at the end of each day the user will zero the instrument using the following procedure
1 With the MINIRAM off insert MINIRAM into Zerobag andseal the Zerobag
2 Inflate Zerobag with filtered air containing no particulates using-attached hand pumpx- V
S
3 Press ZERO button on MINIRAM and wait 30 seconds MINIRAMshould read OFF
4 Pull MINIRAM out of Zerobag
5 Press MEAS button and wait 60 seconds for MINIRAM to go through self-tests
6 The MINIRAM is now functioning and wilJLtake-readings every 10 seconds
7 Document the calibration information onthe appropriate equipment calibration log (OCONNORFL3) V
lt
v
Document VoL II SC SAP Appendix C Revision 0
Date January 171991 Page 4
MARKSON DIGITAL MODEL 103 CONDUCTIVITY METER
The Markson Conductivity meter will be calibrated prior to and following each days field use using the following procedures
1 Rinse the conductivity probe with distilled water gt
2 Pour enough Cole-Parmer conductivity calibration solution (1413 xS 25degC) in a clean plastic Ziploc bag to be able to completely immerse the conductivity probe
3 Immerse the conductivity probe in the standard solution and shakdTree any bubbles that may cling to the cell
4 Allow about 1 minute for the cell to reach equilibrium temperature x X
5 Set the cell adjust control at the bottom of the meter to display the value of 141
6 Carefully rinse cell with water after calibration and after each use V~
7 Document the calibration process onjlie equipment calibration log (OCONNORFL4)
Document VoL H SC SAP Appendix C Revision 0
Date January 17 1991 Page 5
MARKSON MODEL 95
Combined Digital pHtemperature Meter
The Markson 95 combined digital pHtemperature meter will be calibrated prior to and following each days field use using the following procedures
1 Insert electrode into digital meter The reference pin should also be properly connected Temperature probe should be plugged all the way into the ATC jack
2 Remove protective cap and push rubber sleeve such that the potassium chloride filling hole is exposed gt
3 Rinse both pH and temperature probe in distilled water 4 Immerse both pH and temperature probe into buffer 700 solution 5 Set FUNCTION switch to TEMPERATURE to read temperature 6 Set FUNCTION switch to ATC and adjust the readout to the pH value of buffer 700 corresponding
to the temperature measured in E with the CALIBRATE control See Chart 1 7 Rinse electrode and temperature probe withdistilled water 8 Immerse both pH and temperature probe into buffer^401 9 Repeat E V ~ 10 Set the FUNCTION switch to ATC and adjust the readout to the pH value of the buffer 401
corresponding to the temperature measured in Iwith the SLOPE control See Chart 1 11 Rinse the electrodes and temperatureprobe-with distilled water Model 95 is calibrated and ready
for use 12 Document the calibration process on the equipment calibration log (OCONNORFL5)
^ CHART
Temp (C) Buffer Solution 70 X -X
Buffer Solution 40
5 y 700 401 10 708 399 15 706 399 20 703 399 25 701 399 30 700 400 35 699 401 40 698 402 50 698 403 60 697 405
Document VoL II SC SAP Appendix C Revision 0
Date January 171991 Page 6
Dexsil Model L-2009 PCB Analyzer
The Dexsil PCB Analyzer will be calibrated prior to each days field use using the following procedures
Initial Preparation
1 The electrode must be filled with Orion filling solution before it is operational Fill the electrode up to the hole in the side of the epoxy body by-placing the nozzle of the filling solution in the hole and squeezing the bottle 7
2 Drain the electrode while holding it upright over thewaste beaker Grasp the epoxy body firmly in one hand and push down on the white cap which is connected to the cord The solution will then drain out of the bottom of the electrode
Vgt 3 Refill the electrode and check to makesure that the liquid is making contact between the black
cone and the plastic shell at the bottom of theelectrode If it is not making contact at all points drain the electrode again and refill
4 Plug the electrode into the back of the L-200Qj)laeeJt in a vial or rinse solution and turn the instrument on Switch the analysis knobtdfnVand wait a few minutes until the reading stabilizes
Calibration O Imdash^
1 Fill a vial about half way with 50 parts per million calibration solution
2 Turn the analysis selectQrJcnob to CAL
3 Remove the electrode from the rinse solution dry it carefully with a tissue and place it in the calibration solution SWiri the electrode gently for a few seconds and then stop Push the start button on the instrument^
4 When the READ light comes on adjust the CAL knob so that the instrument reads 50
5 Remove the electrode from the calibration solution wipe it dry and place in the rinse solution
6 If this is the first calibration since the instrument has been turned on or since the electrode has been filled repeat steps 34 and 5
7 Document the calibration information on the appropriate equipment Calibration Log (OCONNORFL14)
Document Vol II SC SAP Appendix D Revision 0
Date January 17 1991 Page 1
APPENDIX D X
list of Acronyms
Document Vol II SC SAP Appendix D Revision 0
Date January 17 1991 Page 2
ACRONYMS
ASTM American Society for Testing and Materials CLP Contract Laboratory Program CMP Central Maine Power Company DEP Department of Environmental Protection (Maine) DQO Data Quality Objectives EPA Environmental Protection Agency [US) FL Field Log FSP Field Sampling Plan ltys GEI GEI Consultants Inc gt HSP Health and Safety Plan X
MIE Monitoring Instrumentsforthe Environment MOM Management of Migration NA Not Applicable X lt OSHA Occupational Safety anaHeakh Administration OSWER Officer of SolithWaste and Emergency Response PCB PolychlorinatecFBiphenyk ppb Parts per billion v7 ppm Parts per million QA QuaUtyAssuranck ) QAO QudU$~^sitraquoance Officer QAPP QualityAssurance Project Plan QC Qukkty Gontrof PIP -Thotoionization Detector RDRA -mdashRemedial DesignRemedial Action RI Remedial Investigation ROD x^XRecbrd of Decision RPD X^Relative Percent Difference RPM Remedial Project Manager RSD Relative Standard Deviation SAP Sampling and Analysis Plan SC Source Control SOW Statement of Work TPH Total Petroleum Hydrocarbons VOC Volatile Organic Chemical or Compound

Document Vol II SC SAP Revision 0
Date January 17 1991 Page 6
143 Sediment
The sediment sampling program conducted during the RI consisted of a total of 23 sediment samples from 19 locations both at on-site and off-site locations A total of six sediment samples were collected from the Upland Marsh Upper Lagoon and Lower Lagoon consisting of two samples from each of these surface water bodies Other samples were collected from Riggs Brook and drainage swales between the lagoons and Riggs Brook
xPCBs were detected in the sediment samples obtained from thexdge of the Upland Marsh both on-site lagoons and the Lower Lagoon drainage area leading into Riggs Brook PCB concentrations were highest in the Upper Lagoon (up to 1100 ppm) but decreased significantly downstream in the Lower iiigoon PCB concentrations were lowest in the drainage swale downstream fronii dieLower Lagoon (approximately 4 ppm) Cleanup standards for the sedimentswere~detennined based on a Public Health Environmental Risk Assessment performed by the ERA Cleanup standards are summarized below compared to maximiimgtCQncentrations of chemicals encountered in sediment samples from the Upland MSrsh Upper Lagoon and Lower Lagoon
Vmdash ( Sediment
MaximumConcentration gt Cleanup Chemicals Detected-^ v Standards
( (PPF1) -mdash (PPm)
Lead 28 248 cPAHs y 1 PCBs 1100 1
The ROD indicates that the cm-site sediments will be dredged and the sediment containing chemicals above^tbe established cleanup standards will be treated using the solvent extraction technology as described in Section 141
144 On-Site Barn Characteristics
The barn has been reported to formerly house scrap operations A surficial soil sample taken from within the barn (JSS1) during the RI was collected and analyzed for the presence of PCBs and lead The exact nature or matrix of the surficial soil (eg dust concrete wood) collected from within the barn could not be ascertained from the available documents The results of the PCB screening indicated a concentration of 96 ppm PCBs Lead was detected at a concentration of 1610 ppm No analysis for cPAHs was performed on the sample from the barn
Document Vol II SC SAP Revision 0
Date January 17 1991 Page 7
In the ROD EPA set soil cleanup standards for the site of 1ppm PCBs 1ppm cPAHs and 248 ppm lead The cleanup standards for barn materials were not specified in the ROD by EPA However the ROD specified that the barn would undergo decontamination procedure if contamination was present above cleanup standards (to be determined) through collection of soil dust and other loose material and these materials would be combined with the other contaminated soils and sediments for on-site solvent extraction treatment Large scrap items in the barn would then be removed for disposal off-site and the barn structure would be sampled for detection of the presence of contamination Following sampling and analysis of the barn structure the barn would be demolished and transported to an off-site facility for appropriate disposal ^gt
N
Document Vol II SC SAP Revision 0
Date January 17 1991 Page 8
2 SAMPLING AND DATA QUALITY OBJECTIVES
21 General
Sampling of soils surface water sediments and the on-site barn and its contents will be performed during the Source Control (SC) component of the Pre-Design Study Pre-Design SC sampling results will be used in the design of the SourceControl component of the remedy and development of the treatability testing program for soil and sediment
Pre-Design SC sampling will include N
Collection of surface water samples from the Upland Marsh and Upper and Lower Lagoons in April 1991 V
x
Collection of sediment samples from the Upland Marslkahd Upper and Lower Lagoons in April 1991 ^
Collection of soil samples from test pits and^Orihgsrin April 1991
bull Collection of samples of soil woodimckconcrete from the on-site barn floor and Walls and wipe samples from debris andlquipment located within the barn in May 1991
V-X7EPAs guidance document Data Quality Objectives for Remedial Response Activities (OSWER Directive 93550-78Jdarch 1987) identifies four analytical levels
Level I - field screeningoranalysis using portable instruments Results are often not compound specific and o^ qualitative in nature
Level II - field analyses using mbresophisticated portable analytical instruments Results are more reliable in terms of compound identification and may be semi-quantitative
Level El - laboratory analyses by established referenced methods Results are quantitative and compound specific
Level TV - EPA Contract Laboratory Program (CLP) services utilizing rigorous QAQC protocols and documentation
Level V - Laboratory analyses by non-standard methods Identified in the CLP asspecial analytical services
Document Vol II SC SAP Revision 1
Date March 28 1991 Page 9
A combination of Level I Level in and Level IV analytical protocols will be specified during Pre-Design SC sampling EPA Contract Laboratory Program (CLP) protocols prescribed in the 1988 Organic and Inorganic Statement of Works will be utilized for laboratory analysis of target compounds (PCBs cPAHs lead and aluminum) in surface water sediment soil and barn samples The analytical protocols that will be utilized for Pre-Design SC sampling are detailed in the SC Quality Assurance Project Plan (QAPP) included as Volume I of the SC SAP
22 Soils
Soil samples will be collected and analyzed to provide additional data for comparison with cleanup standards for design of the Source Control program at the OConnor Site Data will be used to refine the previously estimated volume of soils contaminated at various concentrations above the cleanup standards and to provide additional information at areas with apparent data gaps on the lateral and vertical extent of soil with PCB concentrations greater than 1 ppm Soil also will be collected at specified locations to provide samples for solvent extraction treatability bench-scale testing Samples selected for treatability testing will contain PCBs at concentrations previously not examined during limited bench-scale testing performed during the Feasibility Study (FS) The effectiveness of solvent extraction on removal of lead cPAH and PCB contamination will be examined during the bench-scale treatability studies performed during Pre-Design
The soil sampling program performed during the RI was designed to estimate the horizontal and vertical distribution of soils contaminated with PCBs lead and cPAHs above the cleanup standards The distribution of PCBs lead and cPAHs are summarized in the RI on Figures 4-8 4-10 and 1-10 respectively GEI identified several inconsistencies in the distribution of contaminated soils within the summary figures For instance the distributions of PCB contamination shown on Figures 1-6 and 4-8 in the RI in the northern portion of the site near TWA III do not agree Also previous soil sampling did not consistently confirm the horizontal and vertical limits of PCB contamination The vertical limits of the PCB contaminationwere not adequately identified for remedial design purposes near transformer work areas and along drainage pathways where PCB migration has occurred
The effectiveness of solvent extraction as the selected remedy for treating the on-site soils was not fully demonstrated during the FS The bench-scale testing that was performed during the FS did not investigate the full range of contamination levels and recovery efficiencies from different soil types that exist on the site
There are three primary objectives for collection of soil quality data during the Pre-Design studies
Document Vol II SG SAP Revision 1
Date March 28 1991 Page 10
1 Collect additional data with close control of analytical precision to evaluate datagaps and inconsistencies reported during the RI The collection of these data will primarily be performed near TWAs and drainage pathways
2 Refine the previously estimated volume of soils contaminated at various concentrations above the cleanup standards
3 Evaluate theselected remedy of solvent extraction through bench-scale testingof soils with specific ranges of PCB concentrations
All soil samples collected for treatability bench-scale testing will also have an aliquot collected for PCB analyses by Ceimic Corporation of Narragansett Rhode Island This will provide added confidence that designated samples are within the specified ranges of PCB concentrations for solvent extraction bench-scale testing
In order to facilitate comparison of Pre-Design Study soil quality with RI study soil quality rigorous QAQC protocols and documentation will be needed All sampleswill be analyzed by Ceimic Corporation using 1988 CLP protocols Analytical Level IV (CLP QAQC and documentation) will be utilized on 20 percent of the soil samples collected The remaining 80 percent will be analyzed according to 1988 CLP protocols utilizing Analytical Level III (CLP QAQC butwithout CLPdocumentation) These serviceswill provide detection limits at or below the ROD Cleanup Standards
During Pre-Design sampling equipment blanks will be collected and analyzed after decontamination of sampling equipment to identify artifact contamination that could result from incomplete decontamination of equipment Trip blanks will also be included during sample shipment to identify cross-contamination during transportation to Ceimic Corporation The laboratory and field QAQC procedures described above will enable the precision required to satisfy the objectives of the soil sampling component of this study
23 Sediments
Sediment samples will be collected and analyzed to provide additional data for comparison with the cleanup standards for design of the Source Control program at the OConnor site Data will be used to supplement the sediment quality data previously collected in the RI for a refined estimate of the levels of lead cPAH and PCB contamination in the sediments of the Upland Marsh Upper Lagoon and Lower Lagoon In addition a composite sediment sample from the Upper Lagoon and a composite sediment sample from the Lower Lagoon will be collected for solvent extraction treatability bench-scale testing Treatability testing on contaminated sediments was not performed during the FS The effectiveness of solvent extraction on removal of lead cPAHs and PCBs from sediments will be examined during the bench-scale treatability studies performed during Pre-Design
Document Vol II SC SAP Revision 1
Date March 28 1991 Page 11
The sediment quality data collected during the RI was limited Only two sediment samples were collected from the Upland Marsh Upper Lagoon and Lower Lagoon In addition limited data have been previously collected regarding the volume of contaminated sediment on-site
There are three primary objectives for sediment quality data to be collected during Pre-Design studies
1 Collect additional data with close control of analytical precision to examine levels of contamination in sediment at locations previously not investigated This will include two additional samples from the Upper Lagoon two additional samples from the Lower Lagoon and six additionalsamples from the Upland Marsh The investigation in the Upland Marsh will be directed towards delineating the extent of contamination in the westerly (upstream) direction
2 Refine the previously estimated volume of sediment in the Upland Marsh Upper Lagoon and Lower Lagoon
3 Evaluate the solvent extraction remedy effectiveness on treatment of sediment through bench-scale testing
In order to facilitate comparison of Pre-Design Study sediment quality with RI study sediment quality rigorous QAQC protocols and documentation will be needed Only sediment samples containing greater than 30 percent solids (based on visual observations) will be submitted for analysis After sample collection in the field percent volume of settled sediment in the sample container will be compared to the percent volume of free water Samples will be submitted to the laboratory for analysis if the volume of settled sediment in the sample container exceeds 50 percent of the total volume of the sample All samples will be analyzed by Ceimic Corporation of Narragansett Rhode Island following 1988 CLP protocols Analytical Level IV (CLP QAQC and documentation) will be performed by Ceimic on 20 percent of the sediment samples collected The remaining 80 percent will be analyzed by Ceimic utilizing Analytical Level in (CLP QAQC but without CLP documentation) These services will provide the detection limits at or below the ROD Cleanup Standards
During Pre-Design sampling equipment blanks will be collected and analyzed after decontamination of sampling equipment to identify artifact contamination that could result from incomplete decontamination of equipment Trip blanks will also be included during sample shipment to identify cross-contamination during transportation to Ceimic
The laboratory and field QAQC procedures described above will enable the precision required to satisfy the objectives of the sediment sampling component of this study
Document Vol II SC SAP Revision 1
Date March 28 1991 Page 12
24 Surface Water
The OConnor SiteStatement of Work for Remedial DesignRemedial Action requires that surface water contained within the Upper and Lower Lagoon and in the Upland Marsh be drained collected and transported off-sitefor treatment unlessotherwise instructed by EPA
The three primary objectives for surface water data to be collected during the Pre-Design Studies are to
1 Probe surface water depths in Lagoons and Upland Marsh to obtain a better estimate of surface Water volumes to be handled during remediation
2 Evaluate changes in surface water quality that may have occurred during the approximately three-year period since sampling during the RI and evaluate extent of surface water contamination in the Upland Marsh which is at the upstream edge of the PGB contamination area
3 Collect additional data to design an appropriate program for surface water diversion pumping treatment and disposal Off-site disposal destinations as well as on-site treatment and disposal options will be examined in more detail during the Pre-Design Study
All surface water samples will be submitted to Ceimic Corporation for analysis of PCBs aluminum and lead All of these samples will be analyzed following 1988 CLP protocols including CLP QAQC and CLP documentation (Analytical Level IV) One additional sample will be collected from each surface water body and submitted to Ceimic for Total Suspended Solids Analysis (EPA Method 1602) utilizing Analytical Level III
2JS Barn
The available data for the extent of contamination of barn materials consists of one sample point The surficial soil sample collected was not described such that it is known whether the sample consisted of dust the concrete slab soil within cracks of the slab or debris samples within the barn The elevated levels of PCBs and lead within the sample may not be representative of the majority of the loose materials within the barn Furthermore no wipe sampling on non-porous debris or sampling of the wooden barn structure was performed during the RI
Document Vol II SC SAP Revision 0
Date January 17 1991 Page 13
Cleanup standards for target chemicals listed in the ROD have not yet been established by EPA for barn materials The ROD indicates that the Toxic Substance Control Act (TSCA) Spill Cleanup Policy and Disposal Regulations (40 CFR Part 761) may be used in lieu of site-specific determination of acceptable levels
Samples of selected media within the barn will be collected and analyzed to provide an initial data set to establish the degree of contamination present within the barn Data will be used in developing the work plan for decontamination and demolition of the barn and to determine appropriate disposal sites for barn demolition debriSNand loose debris within the barn Depending on data results an evaluation will be made tbvdetermine whether additional sampling will be required prior to demolition to betterseqnence demolition activities so that PCB-contaminated material can beSeparated from non-contaminated building materials and debris
ltx All soil wood and concrete barnsamples will besubmitted to Ceimic Corporation (Ceimic) of Narragansett Rhode Island for analysis of PCBs cPAHsgtand lead Wipe samples of debris will be submitted to Ceimic for analySis-ofPCBs All samples will be analyzed following CLP protocols Analytical LeveK IV-requiring CLP QAQC and reporting requirements will be utilized for 20 percent of the5amples Analytical Level in utilizing CLP analytical protocols but without the documentation requirements of CLP will be specified for the remainder of the
Document Vol II SC SAP Revision 0
Date January 17 1991 Page 14
3 HEALTH AND SAFETY
A Health and Safety Plan for the Source Control Field Sampling Plan is presented in Appendix A All personnel involved in the sampling program have been trained in accordance with the requirements of the Occupational Safety and Health Administration Regulation OSHA 1910120 Hazardous Operations and Emergency Response and are enrolled in a comprehensive medical monitoring program
A list of personnel authorized to perform work on this project ^and listing of their participation in personnel training and health monitoring programs^arepresented in the Health and Safety Plan gt
Document Vol II SC SAP Revision 1
Date March 28 1991 Page 15
4 SAMPLING LOCATION AND FREQUENCY
41 Soils
411 General
In general the soil sampling program includes collection of the following two basic categories of samples
1 Soil samples collected from test pits for possible bench-scale testing and
2 Soil samples collected from test pits and borings to fill data gaps on the lateral and vertical extent of soil contamination above cleanup standards and to refine estimates of the quantity of contaminated soils
Figure 3 shows the locations of test pits and borings planned for this investigation These locations were based on the depth delineation of 1 ppm for Total PCBs presented in the Remedial Investigation Table 1provides ageneral sampling rationale including test pit and boring identification numbers target sampling depth and elevation anticipated PCB concentration level and soil type A summary of the analyses to be performed on soil samples including replicates and blanks is shown in Table 2
A total of 12 soil samples for possible bench-scale testing will be collected from test pits during April 1991 Two samples of each soil type indicated below will be collected within the specified ranges of PCB concentrations Each sample will have a minimum volume of about 05 cubic feet (about 60 lb weight) to provide sufficient soil for bench-scale testing
PCB Concentration Range fppml Soil Types
1 to 10 Clay and Fill 10 to 20 Clay 20 to 50 Clay 50 to 500 Clay and FiU
During the RI three soil samples were collected for bench-scale treatability testing with initial PCB concentrations of 1000 4000 and 22000 ppm However sample locations had been selected to obtain samples with PCB concentrations in the range of 250 to 700 ppm based on PCB concentration contours developed during the RI
Document Vol II SC SAP Revision 1
Date March 28 1991 Page 16
Therefore PCB concentration contours developed from the RI data do not precisely indicate the extent and level of contamination
In order to gain a higher degree of confidence that samples within each specific PCB concentration range have been collected GEI will perform field PCB screening with a Dexsil L-2000 PCB analyzer to estimate the soil PCB concentration range prior to collecting the soilsample Aliquots of the 12 bench-scale soilsamples will be collected for confirmatory testing for PCB concentrations by Ceimic of Narragansett Rhode Island utilizing 1988 CLP protocols
GEI will select the soil samples for bench-scale testing after receiving the CLP laboratory results of the PCB concentrations If the laboratory data do not indicate that at least one of the two soil samples was collected from the targeted concentration ranges and soil types an additional contingency round of soil sampling may occur Sampling locations for this contingency sampling round will be selected based Upon the PCB data summarized in the RI and the data collected by GEI during the previous SC sampling round
A total of 40 soil samples (including replicates) will be collected from test pits and borings during April 1991 to fill data gaps on the extent and quantity of contaminated soil The soil sampleswill be collected at the approximate elevation specified for each sampling location as indicated in Table 1 Sample elevations of the bench-scale samples may vary if PCB concentrations in samples screened with the Dexsil L-2000 PCB analyzer are not within the ranges indicated below
Acceptable Screening Target PCB Concentrations Range PCB Concentration Range
(ppm) (ppm)
1 to 10 1 to 10 10 to 20 10 to 20 20 to 50 25 to 45
50 to 500 200 to 350
The soil samples will be analyzed for PCBs ePAHs and lead by Ceimic of Narragansett Rhode Island utilizing CLP protocols Four soil samples (including two selected for bench-scale treatability testing) will also be analyzed for total organic carbon (TOC) cation exchange capacity (CEC) and pH
Document Vol II SC SAP Revision 1
Date March 28 1991 Page 17
Detailed descriptions of the soil sampling and decontamination methods are provided in Section 5 Appendix A and the QAPP Contractors will be used for surveying performance of test pits and drilling of borings All contractors will be required to document that they have completed health and safety training that complies with OSHA Standard 1910120 In generalstakes marking the planned locationsof test pits will be surveyed by a registered surveyor prior to test pit excavation The Stakes will serve as temporary bench marks for reference during location of test pit samples A rubber-tired type backhoe will be used to excavate test pits for planned sampling locations less than or equal to5 feet below ground surface The backhoe and operator will be supplied by HE Sargent Inc of Lewiston Maine capable of operating at hazardous waste sites under Level C personnel protection Soil samples will be collected from in-situ test pit excavations by GEI personnel using a stainless steel shovel or trowel
Due to anticipated shallow ground water conditions a drill rig will be used to advance test borings for soil sampling at locations where the target sampling location is greater than 5 feet below ground surface The soil samples will be collected using a split-spoon sampler Drilling and sampling will be performed by Northeast Diamond Drilling Company of Union Maine capable of working on hazardouswaste sites under Level C personnel protection
412 Soil Analysis Program
Analytical procedures are identified in the Quality Assurance Project Plan (QAPP) The samples will be analyzed using 1988 CLP methods for PCB cPAHs and lead by Ceimic of Narragansett Rhode Island EPA methods 9045 9060 and 9080 will be used to analyze soils for pH TOC and CEC respectively A summary of the analyses to be performed on soil samples including replicates and blanks is shown in Table 2 Samples will be collected in I-Chem glassware or equivalent and stored at 4 deg C as described in Section 6
A series of quality control blanks (replicates and blanks) will be collected by GEI and analyzed by the laboratory to aid in data assessment as discussed in the Quality Assurance Project Plan (QAPP) All quality control samples will be labelled with false sample identification as shown in Table 2 in order to avoid laboratory bias
Sampling equipment blanks and aqueous trip blanks will be submitted for every ten soil samples during the sampling program to check for the presence of cross-contamination These will provide a quality control check for decontamination and handling practices The trip blanks will contain laboratory-supplied organic-free water and will accompany the shipment of soil samples during storage and shipment The trip blanks will be analyzed for PCBs (sample identification will be TP26-TP29) Wipe
Document Vol II SC SAP Revision 1
Date March 28 1991 Page 18
samples will be collected from the shovel or hand trowel and split-spoon sampler (sample identification numbers TP30-TP33 and TP34-TP37 respectively) after decontamination and will be analyzed for PCBs Wipe sampling procedures are described as part of barn sampling procedures in Section 562 One replicate sample will be collected for every ten soil samples Replicate sample locations and identification numbers are indicated on Table 2
413 Soil Sample Designation
Each piece of soil sample glassware will be affixed with a self-sticking adhesive label Each label will be completed with an indelible marker to contain the following information
GEI Consultants Inc Site Name Project Number Sampling Date and Time Sample Number Samplers Initials Analysis Requested
The sample number is composed of a series of information to identify the sample as unique to the sampling point and sampling event The sample number labelled in the field and referred to on all associated documents is composed of the following
Matrix Project Sampling Location Sample Number
Soil - 90393 -TP2-SS1
The example sample number above indicates that soil sample SSI was collected from Test Pit No 2 under project number 90393
4JZ Sediment
431 General
Sediment samples will be collected by GEI from the Upland Marsh the Upper Lagoon and the Lower Lagoon during April 1991 A summary of the laboratory analyses of sediment samples is listed on Table 3 Procedures for sampling and equipment decontamination are provided in Section 5 Appendix A and the QAPP
Document Vol II SC SAP Revision 1
Date March 28 1991 Page 19
In general the sediment sampling program includes collection of the following two basic categories of samples
1 Two composite sediment samples collected using a clam-shell sampler for bench-scale testing
2 Eleven sediment samples (including one replicate) collected with a tube sediment sampler to provide additional data on sediment quality and for estimating the quantity of contaminated sediments
The two composite sediment samples collected using a clam-shell type sampler for bench-scale testing will be collected within the Upper Lagoon and Lower Lagoon at the locations shown on Figure 4 Based on the data in the RI the Upper Lagoon contained the higher sediment concentrations of PCBs
The eleven sediment samples collected to provide additional data on sediment quality and for estimating the quantity of sediments will be collected at the locations shown on Figure 4 As shown on the figure six sediment sampling locations were chosen for the Upland Marsh two locations were chosen for the Upper Lagoon and two locations for the Lower Lagoon
Detailed descriptions of the methods and equipment to be used during the sampling program are provided in Section 5 In general a temporary reference bench mark will be surveyed and staked adjacent to each surface water body by a surveyor licensed in the State of Maine and OSHA-approved for working on a hazardous waste site The actual sediment sampling locations will be measured by tape and compass bearings from the reference bench mark prior to sampling For the bench-scale sample a 5shygallon sample container will be filled with sediment from the dredge type sample The samples for providing additional data on sediment PCB concentrations will be collected with a tubesediment sampler pushed into the complete thickness of sediment at the sampling location All sampling equipment will be decontaminated using methanol and distilled water rinses before each use
4SL2 Sediment Analysis Program
Analytical procedures are identified in the Quality Assurance Project Plan (QAPP) Sediment samples will be submitted to Ceimic of Narragansett Rhode Island for laboratory analysis utilizing CLP protocols The samples collected for bench-scale testing will be analyzed for PCBs The remainder of the sediment samples will be analyzed for PCBs cPAHs and lead One sediment sample will also be analyzed for total organic carbon (TOC) cation exchange capacity (CEC) and pH by EPA methods 9060 9080 and 9045 respectively A summary of analyses to be performed on
Document Vol II SC SAP Revision 1
Date March 28 1991 Page 20
sediment samples including replicates and blanks is shown in Table 3 Samples will be collected in I-Chem glassware or equivalent and stored at 4degC as described in Section 6
A series of quality control samples (replicates and blanks) Will be collected by GEI and analyzed by the laboratory to aid in data assessment as discussed in the Quality Assurance Project Plan (QAPP) All qualitycontrol samples will be labelled withfalse sample identification as shown in Table 3 in order to avoid laboratory bias
Two sampling equipment blanks and one aqueous trip blank will be submitted during the sampling program to check for the presence of cross-contamination These will provide a quality control check for decontamination and sample handling practices The trip blank containing laboratory-supplied organic free water will accompany the shipment of sediment samples and will be analyzed for PCBs (Sample ID SED7) Wipe samples will be collected from the tube sediment sampler and dredge sampler after decontamination and will be analyzed for PCBs (sample identification numbers SED9 and SED8 respectively) Wipe sampling procedures are described as part of barn sampling procedures in Section 562 One replicate sample will be collected during sediment sampling Replicate sample location and identification is indicated on Table 3
423 Sediment Sample Designation
Each piece of sediment sample glassware will be affixed with a self-sticking adhesive label Each label will be completed with an indelible marker to contain the following information
GEI Consultants Inc Site Name Project Number Sampling Date and Time Sample Number Samplers Initials Analysis Requested
The sample number is composed of a series of information to identify the sample as unique to the sampling point and sampling event The sample number labelled in the field and referred to on all associated documents is composed of the following
Matrix Project Surface Water Body Sample Location
SED - 90393 - UM - SED1
Document Vol II SC SAP Revision 1
Date March 28 1991 Page 21
The example sample was obtained from sample location SED1 in the Upland Marsh under project number 90393 The surface water body designations for the Upper Lagoon and the Lower Lagoon will be UL and LL respectively
43 Surface Water
431 General
Surface water quality data consisting of two samples each from the Upland Marsh Upper Lagoon and the Lower Lagoon will be collected by GEI in April 1991 Sampling locations are shown on Figure 4 Surface water sampling locations will be determined in the field by tape and compass bearings from the temporary reference bench mark established for sediment sampling A summary of the analyses to be performed on surface water samples including duplicates and blanks is shown on Table 4 Detailed descriptions of the sampling methods to be used during surface water sampling are provided in Section 5 In general the depth of the water at the sampling location will be measured at each sampling location with a weighted tape measure prior to collecting the surface water sample A water sample will be collected after lowering a stainless steel Kemmerer sampling device one-half the total depth of the water column All sampling equipment will be decontaminated using methanol and distilled water rinses before each sampling event
433 Surface Water Analysis Program
Analytical procedures are identified in the Quality Assurance Project Plan (QAPP) All of the surface water samples will be analyzed using 1988 CLP methods for PCBs aluminum and lead One sample from each surface water body will also be Submitted for Total Suspended Solids Analysis (EPA Method 1602) A summary of the analyses to be performed on surface water samples including duplicates and blanks is shown on Table 4 Surface water samples will be submitted to Ceimic Corporation for laboratory analysis Samples will be collected in I-Chem glassware or equivalent and stored at 40 C as described in Section 6
A series of quality control samples (duplicates and blanks) will be collected by GEI and analyzed by the laboratory to aid in data assessment as discussed in the Quality Assurance Project Plan (QAPP) All quality control samples will be labelled with false sample identification as shown in Table 4 and described below in order to avoid laboratory bias
One sampling equipment blank and a trip blank will be submitted during each sampling round to Check for the presence of cross-contamination These will provide a quality control check for decontamination and handling practices One trip blank
Document Vol II SC SAP Revision 1
Date March 28 1991 Page 22
sample consisting of laboratory-supplied organic-free and de-ionized water will accompany the samples during storage and shipment and will be analyzed for PCBs aluminum and lead (sample identificationwill be SW4) A samplingequipment blank will be collected by pouring laboratory-supplied organic-free and de-ionized water through the Kemmerer sampler at the end of the sampling program The sampling equipment blank will then be analyzed for PCBs aluminum and lead (sample identification will be SW5)
One surface water duplicate will also be collected each sampling round Duplicate sample location and identification is indicated on Table 4
433 Surface Water Sample Designation
Each piece of sample glassware will be affixed With a self-sticking adhesive label Each label will be completed with an indelible marker to contain the following information
GEI Consultants Inc Site Name Project Number Sampling Date and Time Samplers Initials Analyses Requested
The sample number is composed of a series of information to identify the sample as unique to the sampling point and sampling event The sample number labelled in the field and referred to on all associated documents is composed of the following
Matrix Project Surface Water Body Sampling Location
SW - 90393 - UM - SW1
The example sample number above indicates thata surface water sample was obtained from the Upland Marsh at location SW1 under Project Number 90393 The surface water body designations for the Upper Lagoon and the Lower Lagoon will be UL and LL respectively
Document Vol II SC SAP Revision 1
Date March 28 1991 Page 23
44 Barn
441 General
A total of approximately 30 samples of various media within the barn will be collected by GEI during May 1991 The types of media collected will generally consist of wood fragments from barn walls dust concrete and wipes on non-porous debris within the barn The exact sample locations will be primarily determined in the field based on observations during sampling (eg staining on soils concrete or wood) Based on a site visit by GEI on December 19 1990 preliminary sample locations for barn materials were chosen as shown in Figure 5 These preliminary locations will enable representative sampling of general debris and staining in the barn and indicates the general sampling strategy which will be employed during Pre-Design Final sampling locations may be modified during the program based on closer observation of equipment barn materials and evidence of staining
Detailed descriptions of the methods to be used during the barn sampling program are provided in Section 5 In general a survey of the general types of materials present in the bam and locations of apparent staining of surficiial materials or debris will be recorded on a plan Following the survey representative areas within the barn will be sampled A total of 12 wipe samples will be collected (eg steel shelves boat wood stove electric meters etc) by wiping a 100 cm2 area with laboratory-prepared sampling wipes A total of ten samples of Wood from the walls of the barn will be collected by using a wood boring bit and wood chisel A total of four samples of loose dust will be collected from the floor of the concrete slab of the barn using disposable nylon brushes and stainless steel trowels Finally a total of four samples of concrete will be collected from areas of visible staining and one unstained area by drilling the concrete to a maximum depth of 12 inch in a 100 cm2 area All non-disposal steel sampling equipment will be decontaminated using methanol and distilled water rinses before use at each sampling location
442 Barn Analysis Program
Analytical procedures are identified in the Quality Assurance Project Plan (QAPP) Three field equipment blanks and three trip blanks will be submitted during the barn sampling program to check for the presence of cross-contamination These will provide aquality control check on decontamination and handling practicesAsummary of the analyses to be performed on each sample matrix and the quality controlsamples is shown in Table 5
Document Vol II SC SAP Revision 1
Date March 28 1991 Page 24
Wipe wood dust and concrete samples will be submitted to Ceimic in Narragansett Rhode Island for laboratory analysis Wood dust and concrete samples will be analyzed for PCBs cPAHs and lead Samples will be collected in I-Chem glassware or equivalent provided by Ceimic and preserved and stored as described in Section 6
The objective of the barn sampling program is to provide a preliminary assessment of the degree of contamination present within the barn (see Section 2) It may be difficult to ensure that representative replicates can be made of the various matrices during sampling Therefore no replicate samples of barn materials will be collected during this initial sampling effort
Aqueous trip blank wipe samples will accompany the samples during storage and shipment and will be analyzed for PCBs (sample identification will be PTB1-PTB3) Sampling equipment blank wipes will be made following decontamination of all steel sampling equipment at various times during the sampling program The steel equipment wiped will include the hole saw trowel and the drill bit used for barn wall dust and concrete sampling respectively The equipment wipe samples will then be analyzed for PCBs (sample identification will be PEB1-PEB3)gt
443 Barn Sample Designation
Each piece of sample glassware will be affixed with a self-sticking adhesive label Each label will be completed with an indelible marker to contain the following information
GEI Consultants Inc Site Name Project Number Sampling Data and Time Sample Number Samplers Initials Analysis Requested
The sample number is composed of a series of information to identify the sample as unique to the sampling point and sampling event The sample number labelled in the field and referred to on all associated documents is composed of the following
General Sample Location Project Sample Type Sample
BARN - 90393 - D2
Document Vol II SC SAP Revision 1
Date March 28 1991 Page 24a
The example sample number above indicates that a barn sample was obtained under project number 90393 and was the second dust sample collected The designations for the wipe samples will be P wooden samples W dust samples D concrete samples C and other samples O
Document Vol II SC SAP Revision 1
Date March 28 1991 Page 25
5 SAMPLING EQUIPMENT AND PROCEDURES
51 Air Monitoring
Short-term air monitoring will be performed regularly on-site during the Source Control (SC) sampling program A HNu photoionization detector (PID) and an MIE Model MINIRAM hand-held aerosol monitor (HAM) will be used for air monitoring The PID is capable of detecting total ionizable compounds (typically VOCs) and the HAM detects solid or liquid particulates in air which often take the form of dust smoke fumes and mists Each air monitoring instrument will be operated in accordance with the requirements specified in the Health and Safety Plan provided in Appendix A Readings from the PID and HAM will be recorded in the Project Field Log Book (see Appendix B) Calibration procedures for the PID (HNu Model PI-101) and the HAM (MIE Model MINIRAM) are provided in Appendix C
52 Soil Sampling
521 General
Soil sampling locations are shown on Figure 3 Table 1 lists each soil sampling location planned approximate sample depth and rationale for sample collection
Prior to sampling a surveyor registered in the State of Maine will survey the exact location of each test pit and boring location and provide a temporary stake that will function as a bench mark for horizontal and vertical control within 20 feet of each test pit and at each boring Sample locations within test pits will be by tape and compass bearing methods
Soil sampling will be performed with strict adherence to the procedures described below A list of equipment requirements for the soil sampling program is provided in Table 6 In general excavation of soil to the target depth in test pits will be performed with a backhoe for sampling to 5 feet below ground surface The backhoe and operator will be supplied by HE Sargent Inc and the operator will be equipped with Level C personnel protection (see Appendix A) A bombardier or truck-mounted drill rig operated by Northeast Diamond Drilling by personnel equipped with Level C protection will be utilized for sampling points greater than 5 feet below ground surface Soil samples collected by GEI for possible bench-scale testing will be obtained only at test pit locations Ambient air monitoring will be performed by GEI regularly while working on-site for health and safety monitoring Mobilization
Document VoL II SC SAP Revision 1
Date March 28 1991 Page 26
of equipment and transportation of materials over the site during the soil sampling program will avoid heavily contaminated transformer work areas when possible to reduce dispersing PCBs to other areas Drilling and excavating equipment will be decontaminated under the supervision of GEI prior to use at each sampling location following strict decontamination procedures described in Appendix A and below Sampling equipment will be decontaminated by GEI prior to each sampling event as described below All soil sampling operations within the site will be performed using Level C dermal and respiratory personnel protective equipment to protect against PCB-contaminated dust levels which are likely to exceed 1 mgm3 during sampling The detailed Health and Safety Plan that will be followed during soil sampling is provided in Appendix A
522 Soil Sampling Methods for Test Pits
A minimum of a two-person crew in addition to the backhoe operator or the drill rig crew will be provided by GEI during the sampling program
All soil samples will be collected from test pits by GEI with a shovel or trowel following excavation to the appropriate depth with a rubber tire backhoe as follows
1 Check the survey stakes for the proper test pit number identification and location
2 Place polyethylene sheeting on each side of the test pit for staging the excavated soils from the test pit
3 A standard rubber tire type backhoe will perform the soil excavation to the planned sampling depth All soil excavated from the test pit will be placed on the plastic sheeting adjacent to the test pit The top 2 feet of excavated soil will be cast to one side of the test pit on the sheeting and the bottom 3 feet of soil will be cast to the opposite side to avoid mixing soils with potentially significantly different levels of contamination After completion of sampling soil will be backfilled at a similar depth from which it was excavated
4 All excavation activities will be continuously observed by an engineer or geologist from GEI A test pit log form (OCONNORFL12) will be completed by GEI for each test pit performed and will include the following information
Document Vol II SC SAP Revision 0
Date January 17 1991 Page 27
Name and Location of Job Date Excavation and Test Pit Number Approximate Ground Surface Elevation at Test Pit Total Depth of Test Pit Dimensions of Test Pit Location and Depth of Soil Sample Relative to Stake Reference Method of Soil Sample Acquisition (Shovel Trowel) Volume of Soil Sample J Soil and Stratigraphic Descriptions x
Ground Water Levels (if encountered) y ^v Air Monitoring Information v Other observations Such as soil staining buried debris etc
5 At least one photograph will be taken oflta wall of each test pit from within the test pit with a scale for comparison to indicate soil layering or staining In addition one photograph shall be taken of thertesVpit from the ground surface also showing sample locations withinthe-test pit Photographs of the test pits will be marked to include site locationxjdbmumber^test pit number date and time A photograph log sheet will be maintained fampMuture reference
6 The target soil sampling elevation will be determined by GEI using a level and rod
7 Soil sampling will begin from within the test pit only after the side walls of the pit have been properly^sloped back in accordance with OSHA requirements (see Health and Safety Plan^ Appendix A) All samples collected will be identified on the test pit logazid in the field book Information about the sample including sample number^de^th voiuine and soil description will be recorded The soil sample will be colleetedTrotn an undisturbed area of the test pit floor or wall by means of scraping or digging with a stainless steel shovel or trowel The number of clean sampling utensils for each test pit shall be equal to the number of soil samples collected at the test pit Shovels or trowels used to clean sloughed material from the sampling location will not be used to collect the sample unless decontaminated before use in sampling Care will be taken to assure that the sample is taken from the actual soil unit desired mid does not include slough or scraped material from the sides of the trench The desired soil sample will be immediately placed into the sample container within the test pit A portion of the sample will be retained for screening with the Dexsil L-2000 PCB analyzer The containers will then be sealed labelled and stored in asecure area until Shipment to the laboratory
Document Vol II SC SAP Revision 1
Date March 28 1991 Page 28
8 When collecting a larger volume sample for bench-scale testing a smaller soil sample will first be collected for field screening using the Dexsil L-2000 PCB Analyzer If the analyzer indicates that the PCB concentration is within the target range the bench-scale soil sample will be collected If the Analyzer indicates that the PCB concentration is outside the target range the test pit will be expanded if necessary and another sample will be collected for PCB screening This procedure will be continued until a sample within the target range is identified The test pit will be expanded no more than 2 feet in all directions and to the maximum depth of 5 feet below ground surface If after this over-excavation the soil within the target concentration range has not been identified with the Dexsil L-2000 PCB Analyzer a new test pit location will be selected near the original test pit in an area indicated by the Remedial Investigation to contain soil contamination within the target range
9 Once the targeted PCB concentration has been indicated by field screening the desired soil sample will be collected with a clean stainless steel trowel or shovel at a sufficient quantity to fill a 5-gallon container An aliquot from the 5-gallon sample container will be collected and placed in an appropriate sample container for laboratory analysis for PCBs The 5-gallon containers will then be sealed labelled and appropriately stored in a secure area until transported off-site The laboratory samples will be sealed labelled and stored with the other soil samples awaiting shipment to the laboratory
10 Upon completion of sample collection the excavated soil material will then be backfilled into the test pit The backfilled area will be compacted to the approximate original ground elevation
11 Equipment will be decontaminated after backfilling the test pit (ie shovel trowels measuring equipment) byscrubbing and With methanol and distilled water rinses Portions of the backhoe (bucket bucket arm etc) will be decontaminated with a high-pressure steam rinse on the decontamination pad (see Appendix A)
523 Soil Sampling Methods for Borings
Selected soil samples are planned to be collected at depths greater than 5 feet below ground surface to obtain additional data on the depth of PCB contaminationexceeding cleanup standards in Transformer Work Areas Samples will be obtained using split-spoon sampling techniques within 3-inch ID hollow stem augers in test borings generally following procedures specified by American Society for Testing Materials (ASTM) D1586-84 Test borings will be performed by Northeast Diamond Drilling
Document Vol II SC SAP Revision 1
Date March 28 1991 Page 29
under the observation of an engineer or geologist from GEI The following procedures not specified in ASTM D1586-84 will be used
1 Place a polyethylene sheet on one side of the boring location for temporarily staging drilling cuttings during borehole advancement All drilling equipment shall be decontaminated with a high pressure steam rinse on the decontamination pad prior to beginning drilling
2 Advance hollow-stem augers without split-spoon sampling to a depth about 5 feet above the sampling depth specified in Table 1
3 Begin continuous split-spoon sampling with 18-inch-long samples Collect a specimen from the middle of each sample for screening with the Dexsil L-2000 PCB analyzer and the HNu photoionization detector Rinse the split-spoon sampler with methanol and distilled water rinses before each sample
4 Collect a split-spoon sample at the designated sample depth Divide the split-spoon sample vertically Place a minimum of 4 inches of sample recovered from the bottom right half of the sample into the glass sample container Seal and label the sample container as indicated in Section 4 and store the container in a cooler with ice in a secure area until shipment to the laboratory Retain the left half of the split-spoon sample for screening with the Dexsil 1^2000 PCB analyzer and the HNu photoionization detector
5 After collecting the final soil sample in the boring measure depth to ground water below ground surface using a decontaminated Solinst battery-operated water level indicator Record the time elapsed after completion of the boring when the ground water level was measured
6 Remove augers from borehole If the borehole remains open and evidence of ground water was encountered during sampling collect additional measurements of depth to ground water prior to backfilling until the ground water level appears to stabilize Note occurrence of precipitation or other events which could effect water level measurements in the project log book
7 Backfill borehole within 24 hours after completion of the boring with drill cuttings staged adjacent to the borehole If the borehole collapses and cuttings cannot be backfilled in the borehole store staged cuttings in a steel drum to be left on site Label outside of drum to indicate contents are borehole cuttings from the designated boring number and affix labelindicating PCB-contaminated materials Cuttings from more than one boring can be combined in a single drum
Document Vol II SC SAP Revision 0
Date January 17 1991 Page 30
8 Decontaminate measuring and sampling equipment with methanol and distilled water rinses Decontaminate downhole drilling equipment on the decontamination pad with a high-pressure steam rinse before starting the next boring
A log will be prepared by GEI for each boring and will include the following
information 7
Name and Location of Project
Boring Number lt Date of Boring Ground Surface Elevation x-Boring Diameter and Depth Sample Numbers and Depths Soil Screening Data Visual Soil Descriptions Water Level Measurements Air Monitoring Levels Other Observations
The boring log form is provrdedin Appendix B (OCONNORFL15)V
i
Surface Water ^^7
531 General
N
Surface water sam^les^will becollected at the locations shown in Figure 4 If water is too deep for safe aecess^with hip-waders andor access with hip waders will severely disturb sediment an inflatableboat will be used to access Surface water sampling locations
The surface water sampling program will be performed following strict adherence to the following procedures A list of the equipment requirements for surface water sampling is provided in Table 8 In general ambient air monitoring will be performed regularly while working on-site for health and safety considerations Areas of the site which have been determined by previous studies to have elevated concentrations of PCBs in soils (for example TWAs) will be avoided while traversing the site to reduce the likelihood of dispersing PCBs to other areas The depth of water at the sampling stations will be measured and the surface water elevation will be surveyed on each water body Equipment will be decontaminated prior to use at each sampling station following decontamination procedures
Document Vol II SC SAP Revision 0
Date January 17 1991 Page 31
532 Surface Water Sampling Methods
Surface water samples will be collected during the Pre-Design Study at the locations shown on Figure 4 Surface water samples will be collected during the initial stage of the Source Control sampling program prior to soil and sediment sampling An inflatable boat will be used to access surface water sampling locations if there is sufficient water depth The boat will be cleaned with methanol and distilled water rinses before sampling in each water body The surface water sampling procedures will be as follows ltX1 Determine the location of the sampling station by tape^and compass from a
temporary bench mark at the edge of the surface water body x
2 Measure the depth of water at the sampling station with a weighted tape measure x (
^ 3 Gently lower a clean Kemmerer sample^bottle to the desired depth (one-half
water depth) so as not to remove th^stoppeisprematurely V^
4 Pull out the stopper with a sharp jerk ofdhe sampler line
5 Allow the bottle to fill completelyras evidenced by the cessation of air bubbles
6 Raise the sample and capdhe nottle X x
7 Pour the sampl^fromthe bottle into the appropriate sample container The container willbesealedlabelled and stored in a secure area until shipment to the laboratory
8 Fill a beaker with water remaining in the sampler and measure specific conductance pH and temperature
9 Decontaminate the sampling apparatus measuring tape and Kemmerer sampler by scrubbing internally and externally with methanol and distilled water rinses
10 Record the following surface water sampling information in the project log book (OCONNORFL1)
Document Vol II SC SAP Revision 0
Date January 17 1991 Page 32
Date Time Total Depth of Water Location and Depth of Sample pH Conductivity Measurements Air monitoring levels detected Other observations
Sediment
541 General x
gt The locations of the sediment sampling stations are shown on Figure 4 Table 3 lists the various sampling stations and sampling methods for the sampling program Sediment sampling during the project will beperformed with strict adherence to the following procedures A list of equipment requirements for the sediment sampling program is provided in Table7 In general ambientw monitoring will be performed regularly while working on-site for health-and safetymonitoring Mobilization of equipment and materials over the sitdduring^he-sediment sampling program will follow specific routes to reduce the likelihoocKPfdispersing PCBs to other areas Equipment will be decontaminated prior to sampling at each location following strict decontamination procedures described belowy All sediment sampling operations within the site will be performed fusing level C dermal personnel protective equipment and Level D respiratory^protective equipment will be worn
v ^
542 Sediment Sampling Methods gtSN
The sediment sampling^vili be performed after collection of surface water samples and will consist of rivo primary components
1 Tube sediment smiling to provide additional data on sediment quality and to estimate the thickness of sediment
2 Dredge sediment sampling to obtain a sample for laboratory for bench-scale treatability testing
The tube sediment sampling program will be performed as follows
Document Vol II SC SAP Revision 0
Date January 17 1991 Page 33
1 Determine the sampling locations by tape and compass measurements from a temporary bench mark (reference stake) surveyed near the edge of the surface water body Access locations in interior portions of the water bodies using an inflatable rubber boat The boat will be decontaminated with methanol and distilled water rinses before use in each surface water body
2 Measure the depth of water with a weighted tape measure
3 Lower the hand tube sediment sampler to the desired ctepth Sediment entering the tube is trapped by a plastic core retainer allbyringlheunit to be retrieved a n d t h e s a m p l e r e m o v e d w i t h o u t s a m p l e l o s s X x y
4 Extract the sediment samplefrom the sampler and^immediately place the sample
into the sample container The containers ywllthen be sealed labelled and stored on ice in a cooler in a secure area until shipment to the laboratory
5 Decontaminate the sampling apparatua and measuring tape by scrubbing with methanol and distilled water rinses
vw 7 Record sediment sampling record information in the project log book
(OCONNORFL2) after collecting a sediment sample at each sampling station The information that will beuro~documenteamp includes the following
Date and Time ^ Total Depth of Water N Thickness of Sediment Location of Sample Length and Vblume^of Simple Sample Description x- Air Monitoring LevetesDeteeted Other Observations
The sediment sampling procedure for collecting samples for bench-scale treatability testing will be as follows
1 Determine the location of the dredge traverse line by tape and compass bearings from the temporarily bench mark adjacent to the surface water body
2 Pull the sediment dredge along the planned traverse with a wire line from the edge of the surface water body
Document Vol II SC SAP Revision 0
Date January 17 1991 Page 34
3 Repeat sampling until 5 gallons of sediment have been collected and placed in the 5-gallon sample container The containers will then be sealed labelled and stored in a secure area until shipment to the laboratory
4 Decontaminate the sampling apparatusand drag line by scrubbing with methanol and distilled water rinses
S6 Record the following sedimentsampling informationin die project log book after
sample collection X nXx
Date and Time X gt Total Depth of Water Location and Volume of Sample Number of Grab Samples Collected to Form Composite Volume Sample Description Air Monitoring Levels Detected x X Other Observations
Barn
5-51 General
Sampling within the barn will4gteperformed with strict adherence to the following procedures A list of equipment requirements for the barn sampling program is provided in Table 9 Areas of the Site which have been determined by previous studies to have elevatedconcentrations of PCBs in soils (for example TWAs) will be avoided during bam sampling to reduce the likelihood of dispersing PCBs to other areas within the barnXEquipment will be decontaminated prior to use at each sampling location inside thetarn following strict decontamination procedures All sampling operations withfaMhe barn will be performed with Level C personnel protective equipment due to dust levels which may to exceed 1 mgm3 during sampling (see Appendix A) A detailed Health and Safety Plan which will be followed during barn sampling is provided in Appendix A
552 Barn Sampling Methods
If power is not available on-site a gasoline-powered generator capable of supplying electricity for lighting and sampling equipment will be positioned outside the fenced area of the site prior to sampling Extension cords will be run to the barn (avoiding TWAI) for power supply In order to reduce the potential for cross-contamination due to dust generation the sampling of different matrices will proceed in the
Document Vol II SC SAP Revision 0
Date January 17 1991 Page 35
following sequence 1) wipe samplingof non-porous debris 2)wood sampling of barn walls 3) dust sampling from top of floor slab 4) concrete sampling of floor slab Areas to be sampled will be chosen based on the presence of apparent oil-type staining and to obtainan even distributionof representative samples with no apparent staining
Following sampling at each location a self-sticking adhesive label marked with the sample number will be placed at the sample location for future reference Each label will then be located by taping relative to a reference point Established at the western corner of the barn (W-Z corner) as shown in Figure 5 Walls W and Z will be used as orthogonal axes similar to a typical coordinate system For samples collected above the concrete floor slab (eg wipe and wooden wall samples the height above the floor slab will also be recorded All samples willbe collected between the floor slab and a maximum height of seven feet All location measurements and a brief description of the area sampled will be recorded on the Barn Sampling Form (OCONNORFL13) provided in Appendix B Imaddition a photograph of each sampling location will be taken and^ recordedy on the Photograph Log (OCONNORFL6) Detailed procedures-for each type of sample to be collected during the barn sampling program follows
lt Win Samnlino N
1 Identify the non-porous item within the barn selected to be sampled which has an area of at least 100 cm2 which maybe wiped Examples include sheet metal fiberglass cleanly painted wooden surfaces glass etc
2 Place a decontaminated stainless steel or plastic 100 cm2 (10 cm X 10 cm) template at t^desired sampling location
Note For smaller areas such as on electric meters use the quarter template of 25 cm2 area and make four wipes to compose one sample
3 Remove the laboratory-supplied gauze from within the glassware with stainless steel forceps The gauze should be moist with solvent as prepared by the laboratory
4 While holding the appropriate template in place thoroughly swab the 100 cm2 area with the gauze using forceps or bufyl rubber gloves Inspect the area to ensure that all loose dust has been wiped with the Alter paper
Document Vol II SC SAP Revision 0
Date January 17 1991 Page 36
5 Fold the gauze over to ensure that the dust is contained on the inside of the gauze Place in the appropriate sample container seal label and store in a secure area until shipment to the laboratory
6 Decontaminate the forceps and templates by scrubbing with methanol rinsing with distilled water and wiping dry with paper towels
7 Label the sample location photograph and complete^he Barn Sampling Form
(see Appendix B) and other necessary documentation after each sample is
c o l l e c t e d lt X x x y x x
xWooden Wall Sampling X
1 Select the sampling area of at least 100 cm2 on the inside wall of the barn and secure a decontaminated 100cm2 template at the location Place a steel pan below the sampling area to catch sawdust ancLwood chips
2 Using an electric drill equipped withra-one-ineh diameter wood-boring bit drill out wood within the template area to arnaximum depth of 12 inch
3 Place sawdust and wood chips man appropriate sample container seal label and store in a secure area untiLsRipinent to the laboratory
4 Decontaminate the drilTbit and pan by scrubbing with methanol rinsing with distilled water and jwiping dry with paper towels
5 Label the samplelocatidn photograph and complete the Barn Sampling Form (see Appendix^)
Dust on Floor Slab Sampling
1 Select an area to sample such that at least 100 grams of dust or soil may be obtained This will vary depending on thickness of the dust or soil
2 Using a disposable nylon brush or stainlesssteel trowel brush or scrape dustsoil toward the center of the area chosen minimizing the creation of airborne dust
3 After the dustsoil has been centralized use a flat stainless steel trowel to collect the material and place in laboratory-supplied glassware seal and label
Document Vol II SC SAP Revision 0
Date January 17 1991 Page 37
4 Dispose of the nylon brush with other containerized PCB-waste materials and decontaminate the stainless steel trowelsby scrubbingwith methanol rinsingwith distilled water and wiping dry with paper towels
5 Label the sample location photograph and complete the Barn Sampling Form
Concrete Slab Sampling
1 Identify three areas of visible staining and one area of no visible staining on the floor slab Using a disposable nylon brush carefulfy brushxaway loose dust and soil from an approximately 1-square-foot area
2 Place a pre-cut 10-square-foot sheet of clean polyethylene sheeting with a 1shysquare foot hole cut in the center over thevsampling area and secure in place with duct tape Place a decontaminated lOO cmr template in the center where t h e s a m p l e i s t o b e o b t a i n e d X v N
3 Using an electric hammer drill eqi^pedwitlra^ungsten-carbide mortar bit drill the four corners established by the tempfate^to a maximum depth of 12 inch
4 Remove the template ancLdrilL the remaining 100 cm2 within the established square to a maximum dep^fof l2Jnch
-vFollowing drilling brush the concrete chips and dust from the plastic sheeting toward the center otlhe sarhplihggtarea Collect sample with a clean disposable nylon brush andtrowel and place in an appropriate sample container seal label and store in aSecure area until shipment to the laboratory
6 Dispose of the nylon oriish with other containerized PCB-contaminated waste materials and decontaminate the stainless steel trowel and template by scrubbing with methanol rinsing with distilled water and wiping dry with paper towels
7 Remove and dispose of the polyethylene sheeting and duct tape in an appropriately marked barrel that will remain on the site with other sampling waste disposal materials Label the samplinglocation photograph and complete the Barn Sampling Form
Document Vol II SC SAP Revision 0
Date January 17 1991 Page 38
6 SAMPLE HANDLING AND ANALYSIS
61 General
GEI has established a program of sample chain-of-custody that is followed during sample handling activities in both field and laboratory operations Thisvprogram is designed to assure that each sample is accounted for at all times To accomplish this objective sample container labels sampling records chain-of-custody records sample assignment forms shipping airbill records and laboratory receipt sheets must be completed by the appropriate sampling and laboratory personnel ^ y gt
62 Sample Labeling and Documentation gt
The plastic 5-gallon containers for bench-scale testingsWilKbe cleaned with methanol and distilled water rinses prior to use All other sample containers^will be pre-cleaned by EPA-approved methods and provided by the laboratory^ A summary of the sample containers and preservation requirements for each of thamp^analytieal parameters to be measured is shown in Table 10 Each piece of sample gl^sware^will be affixed with a self-sticking adhesive label Each label will contain the information described in Sections 4 and 5 of this document ^
To further document the samplingprogr^mand Sample handling procedures the project log book (OCONNORFL1) will containinformation regarding the activities on-site and sample handling In addition photographs of each type of field procedure will be taken The photographs will be representative of thetechniques employed throughout the sampling program A record ofeach photograph Will be made on the Photograph Log (OCONNORFL6) as stiown 4i^Appendix B
63 Chain-of-CustodySample^Assignment
Chain-of-custody will be maintained at all times as described in more detail in the Quality Assurance Project Plan (QAPP) A copy of the chain-of-custody form (OCONNORFL9) to be used is provided in Appendix B
In general the chain-of-custody record must be used such that it includes the following information
Document Vol II SC SAP Revision 0
Date January 17 1991 Page 39
Project name and number Names of the sampler(s) and person shipping the samples Station number or well identification Date and time the samples were collected Composited or grab sample designation Sample number (eg 1GU-90393-MW101A) Total number of containers Analysis requested Date and time the samples were delivered for shipping Names of those responsible for receiving the sampled at the laboratory
Prior to shipment of the samples a sample assignment form will be completed (see OCONNORFLIO in Appendix B) The sample assignmenrform will provide the contract laboratory sufficient information to process the samples and perform the appropriate analysis
The chain-of-custody record and sample assignment fornr will both be completed in duplicate in the field through the use of carbon paperT The original copy of the forms will be enclosed in a plastic bag and placed in the coolersWith the samples for shipment to the laboratory The carbon copy of the forms will be retained by GEL
VSoil samples for bench-scale testing ynH be-stored on site in a locked storage shed until samples are selected for the bench-scale7testing^ This decision will be made after receipt of the laboratory PCB analyses results and approval of the Source Control Work Plan by the EPA Soil samples not usecLfor bench-scale testing will remain in the locked storage shed and will be included with-other soil for treatment during the Remedial Action
lt v 64 Sample Shipments
Sample containers are generally packed in coolers for shipment Prior to packing organic analysis samples will be placed in plastic bags Bottles are to be packed tightly so that no motion is possible Styrofoam vermiculite and bubble pack are suitable for most instances Ice Will be placed in sealed plastic bags or ice packs in order to keep samples at 4degC at all times Samples will be protected against freezing during cold weather The original chain-of-custody and sample assignment forms will be sealed in plastic bags and placed in the cooler with the samples The cooler will be closed and a signed self-sticking label with the words Custody Seal will placed between the body of the cooler and the cover The cover will then be sealed with clear tape Samples will be shipped so that they are received by the laboratory no later than 60 hours from the time of sample collection
Document Vol II SC SAP Revision 0
Date January 17 1991 Page 40
All shipping of samples will be done through Federal Express or equivalent overnight delivery service Samples will be shipped in accordance with Department of Transportation (DOT) regulations If prompt arrival of the samples cannot be guaranteed the samplers will be responsible for proper storage of the samples until adequate transportation arrangements can be made The laboratory will be notified prior to shipment to arrange for receiving the samples and to prepare for the analyses requested Based on the low concentrations of chemicals detected during previous studies theSamples will be classified as environmental samples The air bill for the samples will speeiiythat the contents of the cooler are environmental or hazardoussamples as appropriated When samples are received by the laboratory they will notify the Task Manager of theccondition of the samples
H craTrsi
TABLE 1 - SOIL SAMPLING SCHEDULE Field Sampling Plan OConnor Co Site Augusta Maine
DEPTH APPROXIMATE BELOW ANTICIPATED
SAMPLE NUMBER SAMPLE GROUND PCS GENERAL LOCATION OF ELEVATION SURFACE CONCENTRATION SOIL
ID SAMPLES (MSL) (PPm) TYPE COMMENTS
TP1 2175 25 ND ClaySandy Till Confirm contours 215 35 ND
TP2 217 15 50 ClaySandy Till Confirm contours TP3 212 ND Siltv Clav Confirm horizontal extent toward marsh TP4 211 5-50 Clav Obtain bench scale 20-50 ppm
TP5 213 50-500 Clay Confirm lateral extent
TP6 215 15 5-50 Fill Obtain bench test sample In 1-10 ppm
TP7 210 35 0-5 Siltv Fine Sand Confirm vertical extent in drainage area
217 3 0-5 FillClay Confirm contours TP8 219 1 0-5 TP9 207 35 0-5 Siltv Fine Sand Confirm vertical extent In drainage area
TP10 1175 15 50-5000 Fill Bench scale test sample 50 to 500 ppm
TP11 218 0-5 SandClay Confirm horizontal extent toward marsh
TP12 218 0-5 SandPay Confirm horizontal extent toward marsh
TP13 221 5-50 Clav Bench-scale test sample 10-20 ppm
TP14 206 0-5 Gray Silty Clay Confirm vertical extent
TP15 200 0-5 Gray Silty Clay Confirm vertical extent
TP16 2185 15 5-50 Clay Bench-scale test sample 1-10 ppm
228 4 TP17 230 2 Confirm contouring in north end of site
231 4 TP18 233 2 Confirm contourtng in north end of site
236 4 TP19 238 2 Confirm contouring in north end Of site
Project 90393 GEI Consultants Inc Page 1 of 2 March 28 1991
SAMPLE NUMBER LOCATION OF
SAMPLES
TP20 TP21 TP22 TP23
TP24 TP25
B1
B2
1 B3 2
B4
B5
ND = Not Detected
TABLE 1
APPROXIMATE SAMPLE
ELEVATION MSLJ
231 233
2275 237 237 235 236 222 210 215 210 215
215 220
218 220 220 222
- SOIL SAMPLING SCHEDULE Field Sampling Plan OConnor Co Site Augusta Maine
DHTH BELOW
GROUND SURFACE
4 2
15
2 1
8 3 8 3
12 6
8 6 6 4
ANTICIPATED PC8
CONCENTRATION
ND ND 0-5
500-5000 5-50
50-5000 0-5
50-500
0-5 50-500
0-5 0-5 0-5 0-5
GENERAL SOIL TYPE
Clavev Silt Silty Clay
Clay
Till or Clay
Till or Clay
Gray Silt
Gray Clavev Silt
Gray Clayey Silt
i
Confirm contouring in north end of site Confirm contours Confirm contours Confirm contours
Confirm contours Bench scale sample 50-500 ppm
Confirm contouring and vertical extent
Confirm Contouring and vertical extent
Confirm contours and vertical extent
Confirm contours and vertical extent
Confirm contours
Project 90393 GEI Consultants Inc Page 2 of 2 March 28 1991
TABLE 2 SOIL ANALYSIS PROGRAM Field Sampling Plan OConnor Co Site Augusta Maine
Sample Depth
Sample Location ID
SoB Sample Number
(ft below ground surface) Lead cPAHs PCBs
pH TOC CEC
Anatyticsd Level IV
TEST PITS TP1 SS1 TP2 SS1 15
SS2 35 TP3 SS1 TP4 SSI
SS2 TP5 SSI TP6 SS1 15
SS2 15 TP7 SS2 35 TP8 SSI
SS2 TP9 SSI 35
replicate of SS2 SSI
TP10 SS1 15 SS2 15
TP11 SSI TP12 SSI TP13 SS1
SS2 TP14 SS1 TP15 SS1
replicate of SS2 SS1
TP16 551 15 552 15
TP17 551 552
TP18 551 552
TP19 551 552
TP20 551 552
TP21 SS1 15 TP22 SS1
Project 90393 GEI Consultants Inc Page 1 of 2 March 281991
TABLE 2 SOIL ANALYSIS PROGRAM Field Sampling Plan OConnor Co Site Augusta Maine
Sample Depth
Sample Location ID
SoB Sample Number
(ft below ground surface) Lead cPAHs PCBs
pHTOC CEC
Analytical Level IV
Bench Scale
Sample
replicate of SS2 SS1
TP23 SS1 TP24 SS1
SS2 TP25 SSI
SS2 BORINGS
B1 SS1 SS2
B2 SS1 SS2
B3 SS1 6 replicate of
SS2 SS1 SS3 12
B4 551 552
B5 551 552
QUALITY CONTROL TP26-TP29
(trip blank) SS1-SS4 TP30-TP33 (shovel or
hand trowel SS1-SS4 blank)
TP34-TP37 (split-spoon
blank) SS1-SS4 TOTAL
ANALYSES 40 40 64 15 12
TOC - Total Oraanic Carbon CEC - Cation Exchange Capacity
Will be designated to the laboratory as matrix spikematrix spike duplicate
Additional trip blanks may be needed to ensure one trip blank per cooler
Project 90393 GEI Consultants Inc Page 2 of 2 March 281991
TABLE 3 SEDIMENT ANALYSIS PROGRAM Field Sampling Plan OConnor Company Site Augusta Maine
PH Bench Sample TOC Analytical Scale
Sample Location Number Lead cPAHs PCBs CEC Level IV Sample
Surface Water Body
SED1
SED2
SED3Upland Marsh (UM) SED4
SED5
SED6
SED1
SED2Upper Lagoon (UL)
SED3
SED4
Lower Lagoon (LL) SED1
SED2
SED3
SED7 (trip blank)
SED8Quality Control (dredge
blank)
SED9 (tube
samples blank)
Total Analyses 11 11 16
TOC - Total Organic Carbon CEC - Cation Exchange Capacity
UL SED2 is a replicate sample of UL SED1
Will be designated to the laboratory as matrix spikematrix spike duplicate
Additional trip blanks may be needed to ensure one trip blank per cooler
Project 90393 GEI Consultants Inc March 281991
TABLE 4 - SURFACE WATER ANALYSIS PROGRAM Field Sampling Plan OConnor Co Site Augusta Maine
SAMPLE SAMPLE LOCATION NUMBER Lead Aluminum PCBs
Upland SW1 X X X Marsh (UM) SW2 X X X
Upper SW1 X X X Lagoon (UL) SW2 X X X
SW3 X X X
Lower SW1 X X X Lagoon (LL) SW2 X X X
Quality Control Samples
Trip Blank SW4
Sampler Blank SW5
TOTAL ANALYSES
TSD - Total Suspended Solids
SW2 is a duplicate of SW1
Will be designated to the laboratory as matrix spikematrix spike duplicate
Additional trip blanks may be needed to ensure one trip blank per cooler
Project 90393 GEI Consultants Inc Page 1 of 1 March 28 1991
TABLE 5 - BARN SAMPLING ANALYSIS PROGRAM Field Sampling Plan OConnor Co Site Augusta Maine
SAMPLE MATRIX PCBS CPAHS Lead
Analytical Level IV
Wipe samples PTB (trip blank) PEB (equipment blank)
12 3 3
Wooden wall samples 10 10 10
Dustsoil on floor slab
Concrete slab
Total Analyses 36 18 18
Additional trip blanks may be needed to ensure one trip blank per cooler
One sample will be designated to the laboratory as a matrix spikematrix spike duplicate
Project 90393 GEI Consultants Inc Page 1 of 1 March 281991
TABLE 6 - SOIL SAMPLING EQUIPMENT REQUIREMENTS Field Sampling Plan OConnor Co Site Augusta Maine
Safety Equipment (Level C - Dermal)
Health and Safety Plan (copy) Portable Photoionization Detector (HNu) Hand-held Aerosol Monitor (HAM) Disposable Tyvek Coveralls Tyvek Hoods Duct Tape Safety Goggles Safety Boots Surgical Gloves Butyl Sampling Gloves n gt Rubber Boots or DisposableBooties Hard Hats (when near qverhead objects)
Safety Equipment (Level C - Respiratory)
Sampling and Measuring Equipment
Other
Full-face Respirators Combined Organic Vapor and
High-efficientcy particulate Cartridges Dust Prefilters
Level and Rod Measuring^Tape Stainless -SteeLShovels Stainless Stee^T rowels 165-foot Measuring Tape Methanol V
Distilled Water Paper Towels
SafopltngjSlassware (See Table 10) xCo6lers with Ice or Ice Pack
Clear Plastic Tape Re-sealable Plastic Bags
Gallon Drums
ite Maps Project Log Books Marking Pens Camera Photograph Log Forms Test Pit Log Forms Boring Log Forms Chain-of-Custody Forms Sample Assignment Forms Equipment Calibration Logs Extra Bottle Labels Spare AA Batteries for Meters Blank Federal Express Airbills
Project 90393 GEI Consultants Inc Page 1 of 1 January 171991
TABLE 7 - SEDIMENT SAMPLING EQUIPMENT REQUIREMENTS Field Sampling Plan OConnor Co Site Augusta Maine
Safety Equipment (Level C - Dermal)
Safety Equipment (Level C - Respiratory)
Sampling and Measuring Equipment
Other
GEI Consultants Inc
Health and Safety Plan (copy) Portable Photoionization Detector (HNu) Hand-held Aerosol Monitor (HAM) Disposable Tyvek Coveralls Tyvek Hoods Duct Tape Floatation Vest Inflatable Boat Safety Goggles Safety Boots Surgical Gloves Butyl Sampling Gloves Rubber Boots or Disposable obties Hard Hats (when near overheackobjepts)
V Full-face Respirators Combined Organic Vaporand
High-efficiencyHPartjculate Cartridges Dust Prefilters
Level andRod Measuring Tapp 165-foot MPasuririgTape Methanol V Distilled Water jper tpwels V
SjE(mplinsect~Glassware (See Table 10) Cdolbrs wlthjbe or Ice Pack
Clear Plastic Tape Re-sealable Plastic Bags
-Galloh Drums fghted Measuring Tape e Sediment Sampler dge Sediment Sampler
Site Maps Project Log Books Marking Pens Camera Photograph Log Forms Chain-of-Custody Forms Sample Assignment Forms Equipment Calibration Logs Extra Bottle Labels Spare AA Batteries for Meters Blank Federal Express Airbills
Project 90393 Page 1 of 1 January 17 1991
TABLE 8 - SURFACE WATER SAMPLING EQUIPMENT REQUIREMENTS Field Sampling Plan OConnor Co Site Augusta Maine
Safety Equipment (Level C - Dermal)
Safety Equipment (Level C - Respiratory)
Sampling and Measuring Equipment
Health and Safety Plan (copy) Portable Photoionization Detector (HNu) Hand-held Aerosol Monitor (HAM) Disposable Tyvek Coveralls Floatation Vest Inflatable Boat Tyvek Hoods Duct Tape Safety Goggles Safety Boots Surgical Gloves Butyl Sampling Gloves Rubber Boots or Disposable Booties Hard Hats (when nearOverhead objects)
w Full-face Respirators Combined OrganicVaporand
High-efficiency Particulate Cartridges Dust Pi
Level and Rod
Measuring Tape M3amp-foot Measuring Tape JsopropyhAlcohol Mbthanol DistlHed Water PaperTowels Sampling Glassware (See Table 6)
oolers with Ice or Ice Pack tear Plastic Tape
Re-sealable Plastic Bags 55-Gallon Drums Weighted Measuring Tape Kenmerer Sampler Disposable 045 Micron Field Filters Pressure Pump for Field Filtering pH Meter with Temperature Probe Cole-Parmer pH-40 70 Calibration Solutions Cole-Parmer 1413 Micromhoscm Calibration Solution
Project 90393 GEI Consultants Inc Page 1 of 2 January 171991
TABLE 8 - SURFACE WATER SAMPLING EQUIPMENT REQUIREMENTS Field Sampling Plan OConnor Co Site Augusta Maine
Other Site Maps Project Log Books Marking Pens Camera Photograph Log Forms Chain-of-Custody Forms Sample Assignment Forms Equipment Calibration Logs lt Extra Bottle Labels Spare AA Batteries forM6ters Blank Federal Express Airbills Xy
Project 90393 GEI Consultants Inc Page 2 of 2 January 171991
TABLE 9 - BARN SAMPLING EQUIPMENT REQUIREMENTS Field Sampling Plan OConnor Co Site Augusta Maine
Safety Equipment (Level C - Dermal)
Safety Equipment (Level C - Respiratory)
Sampling and Measuring Equipment
Other
Health and Safety Plan (copy) Portable Photoionization Detector (HNu) Hand-held Aerosol Monitor (HAM) Disposable Tyvek Coveralls Floatation Vest Tyvek Hoods Duct Tape Safety Goggles Safety Boots Surgical Gloves Butyl Sampling Gloves Rubber Boots or Disposable Bboties Hard Hats (when near overheackpbjects)
Full-face Respirators Combined OrganicVapor and
High-efficiencyParticutale Cartridges Dust Prefilters
Gas powered electrfcgenerator 5 gallonsgaspline 350 feetNplectricahextfnsion cord Self-standin^work-larnps (200 watts minimum) Electric 38drilkwith two 1-inch wood boring bits ElectricBoschhammer drillwtungsten-carbidemortar bit Hpound-cut polyethylene sheeting and duct tape
Steel blaRing sheet X^vdiSpdsabfe nylon brushes
Stainless steel trowels Three 100 cm templates andone 25 cm template Forceps Peper towels Silf-sticking adhesive labels and push pins
Site Maps Project Log Books Marking Pens Camera Photograph Log Forms Bam Sampling Forms Chain-of-Custody Forms Sample Assignment Forms Equipment Calibration Logs Extra Bottle Labels Spare AA Batteries for Meters Blank Federal Express Airbills
Project 90393 GEI Consultants Inc Page 1 of 1 January 171991
TABLE 10 - SAMPLE CONTAINERS AND PRESERVATION REQUIREMENTS Field Sampling Plan OConnor Co Site Augusta Maine
Holding Media Parameter Container Preservation Time
PCBs 8 oz glass jar 4deg C 14 days-with Teflon- extraction lined lid 40 days shy
analysis
cPAHs 8 oz glass jar 4deg C 14 days-SOIL with Teflon- extractionSEDIMENT lined lid 40 days shyWOOD
analysisCONCRETE AND WIPE Lead 8 oz glass jar 4deg C 6 months SAMPLES with Teflon-
lined lid
Bench-scale 5 gallon high NA NA testing density
polyethylene bucket
PCBs Two 1-liter 4deg C 7 days shyamber glass extraction bottles 40 days shy
SURFACE analysis WATER
Lead 500mi HN03 4deg C 6 monthsSAMPLES polyethylene to pH bottle lt20
Aluminum 500ml HN03 4deg C 6 months polyethylene to pH bottle lt20
NOTE All standard sample containers will be l-CHEM equivalent bottles supplied by the laboratory The 5-gallon polyethylene bucket will be rinsed with methanol and distilled water prior to use
NA = Not applicable
Project 90393 GEI Consultants Inc March 28 1991
gt 1I L )
i bullbullbull j bullgti sil- j-V
poundP
A C
jfr35
QUAOnANQLE LOCATIONTOOU9 POND MAINEJI881)N4416-W37-307B
bull4000 FEET
Central Maine Power Company Pre-Design Work Plans SITE Augusta Maine OConnor Site LOCATIONFrom EC Jordon Co RIFS
Augusta Maine MAPReport dated June 1989
C D Project 90393 January 1991 Fig 1 G E I C o n s u l t a n t s I n c
b-r
p pp l-I 0 x foooo^ _^_ZZZ~~r^-^
UpoundEtpound 1IMA iRAMWOfMII NOW AM A OAAMAG IWAllrj WWEOfOHAMMS MHICUOn Central Maine Power Company Pre-Design Work Plans LOCAIION Oh
in cuelt^KL2 Augusta Maine OConnor Site TRANSFORMER
Scale 1 inch = 142 feet Augusta Maine WORK AREAS AND SWALESFrom EC Jordon Co RIFS
Report dated June 1989 C D G E I C o n s u l t a n t s I n c Prnjprf QfttM January 1QQ1 Fifl 0
~- bull middot bull -middot r middot~middotmiddotmiddotIll middotmiddot t~r
I bull Imiddot
bull bull1 middotmiddot middotir-------~-------middot ~ bull middot middot-------------------middotmiddot ~ middotmiddotmiddotamiddot A middotimiddot r bull amiddot A I bull TWA I tmiddot LOW AREA A NO~TH) SOUTH) I
v
A middot
rmiddot---middot---middot~middot---- ----middot~middot [WEST) [W[ST) (EASr) middot I
middot middot middotmiddot AmiddotA D-D 220 SCRAP ARf-A 201 -
bull - I
nor 140 TWA I 2bull0
1 bull middotbullmiddot1~-~~ L~W AR1-A ---- middot-~ l0 ~
i r bull I -$-~middot
0 - )1 _~ ~ middot1~oi I EEltY
J I ~2J~ bullbull
bullf()omiddot middotmiddot middot~ bull0 2 i- 0
11bull I lo bull ~middotmiddotmiddot~middot ~ ~--middotmiddot~middotbull ~-8~-i~~jplusmny~f~=ii1 - ~ bull ___ I I- _5 middot~bull-tmiddoti~middot~ N ~ bullbull ~ i I o middot TP19 gt - ~ ~ Jmiddot ~I middot~middot~I bullJUI 215 middot 215~-I e bull TP23 if 21~ ~ middot middot middot_ ------ ~middot - L middot~ ~ ~~ 1 i i
235 middotQ1middot1middotmiddot ~ bullbull ~~middot~middot- Lil middot~ _~ middot f bulllto --- z middotmiddot middot
middotr
-lt lt -middot I ~ middot ~ I
1 c ~ __ ) bull bull bullmiddot bull --middot Q
middot bull bullbull - 1middotmiddot - bullbull ~middots middot- uPPfR 1middotmiddot T LAGOON 1middot middot -$- middot middotmiddotpoundpound~middotmiddotmiddotmiddotmiddot bull =lt middot
~ middot ~~ iP22 gt middotgt
w
210 I
-
------_7___ 210 1 _
w_ +-
middot middot w--~ J210 middot i~30 -- middot_
1 TP18 bull middotmiddotI middot~ ----shy middot-middotmiddot
middot~ I j
middot- t - I 1 I BEDROCK 11 I
1
lmiddotmiddotomiddotmiddotmiddotmiddotmiddot middot middot middot =middot _middotmiddot middotmiddotmiddotmiddot 1 I rI Th 205 bull 205
bull -middotmiddot bull_ 1 225 22 middot bullbullbull fltISmiddot middot middot ~ ~middot f4tmiddotmiddotmiddot I J205 1bull
middot OOTR10U1t0N craquo-middotPC~middot~oN~A~ SEL11r~~~TS H LO~ AR~A ------------------------------------------------bull1 BASEO IN PART ON QBSERVATION Of FILL PlACEMENTmiddot bullmiddot E~middot-1middot bull bullbullbull middotmiddot Q - _
_
-1 I
fmiddot bull bull
-middotmiddot I r-middot shy c bull
I omiddotmiddot
r- middotmiddotI ~I
1 middot1 r bull bullf-Sf1 TWA I middotbull middot ~ i1 bull bull middot (EASfJbullI middot-----bullI (WEST) middotI bull I 1I cmiddot middot~ I~ ~ I bull bullbullbullI 1bullbull
(EAST) - bull middot- - I
bull bull r ~middot l
~
~30 i
2io bull
middot) Ibullbull
I
- J l TPl7 bull- f ~j -middot middotmiddotmiddotmiddot I 1 J middotmiddot1
middot~ ~ bull middotimiddotmiddotch bull bull_ t-ROAOI cli middot bull ~ middot1middot
225
I bull ILmiddot i~A--middot1middot 225 bull
1225 middot I ~ CENTRAL DRAINAGE middotmiddotmiddot--Q-middot --middot _ --middot
~ I -- -shy A middot
bull B-B --- m
- _ - middoti-- 10bull ~ m
g r
220 220 I ~
I middot _
l MI r ~ I
middot middot 1bull bull1 111
I rbull bull
middot
bull bull l
215 BEOROC~ 215
bull I bull middot - -
) l
-middotshy- bull Il
I 5 -middot middot middottc bull bull gt f bull 110 1~ w 210 210 ~ middotmiddotmiddotmiddotmiddot middot-middot -
( bull
middotlt bull [ I
bull G -
-middot-
middot middotmiddot bull ~middot-middot-- -middot- t~middotmiddotmiddotmiddotmiddotmiddot middotmiddot middot L -middot 1 -middot~ bull bull - middotmiddot L middot-~ _ bull f middot middot1 I ~ l
205 bull bull ~middot JO~cmiddotimiddotmiddotmiddotmiddot middot--middotmiddotmiddot1 _~ middotmiddotmiddotmiddotmiddot middotmiddotmiddotmiddotmiddotmiddot bullI bull middot -middotmiddotmiddotmiddotmiddotmiddotg
bull -$-middotmiddotmiddot middot~middot iii~~- ~0 i TB-20 SUBSURFACE BORING NUMBER bull bull bull TPmiddot 105 TEST PIT NUMBER
middot
bull1
bull I TP16 middotmiddotmiddotmiddotmiddot~ Q G) ) mmiddot i GROUND SURFACEmiddot bull 1bull 1middot bull I i ~ u o I bullbullbull I~ bullbullbull bullbullbullbullbullbullbullbullbullbullbullbull bullbullbullbullbullbullbullbullbullbull bull middot bull
ll bull bullbullbull middotmiddotoz bull I 250 CONCENTRATION OF PCBs IN SCREENED SAMPLE lPPm) r lt bull bull I
middot CONCENTRATION CONTOUR middot middot bull - -- CROSS-SECTIONS CONTOURED AT 5ppm 50ppm ANO 500 ppm TOTAL PCBs
middotbull middotmiddot c- I bull ~~ ND NOT DElECTED -middot ~ I
middotmiddot middot--middot~ middot sect t I middot UNDERLINED VALUES ARE CLP RESULTS (ppm)bull
middot -____ bull ~~ - -- I
bull bull middot -middot middot bull Ibullbull middot ~- middot --- LEGEND (ISOPACH MAP) bull lmiddot I l
I
-middot 1 middot I
bull middot ~SUBSURFACE EJORING LOCATION middot
-t middot ( 10766 - 10 10186) middot middot J BORING NUMBER -2 middot THICKNESS OF SOIL CONTAINING PCBs IN EXCESS OF 5 ppm
I
bull ~ middot
LOW AREA BORING LOCTION (107187)
- I j
I
bull BORING LETTER - ~ THlC~NESS OF SOIL C011TAINING PCBs IN EXCESS oF Sppm middot middot middot middottmiddot=plusmn+ TEStPIT LOCATION 1 bull bull bullbullbull i 0~ Q G) I -$ ELECTRICAL EQUIPMENT SAMPLE POINl middot middot -middot bull 1-1 I ~ bull
If bull bull ) bullbull bullbullbullbullbullbullbullbullbullbull f4( middot~01 l - bullmiddotomiddot
middot - ( ~-~ SURFICIAL EXTENT OF SOILS CONTAINING gtSppm PCBs bull middot (
bull __ ~ -middot middot_ middotmiddotmiddotmiddotmiddotmiddotmiddotmiddot _ - middotmiddot --- bull bull -bull - ISOPACH LINE ILLUSTRATING THICKNESS OF SOILS CONTAMINATED BY middot middot middot -middot~middotmiddotbullmiddotmiddotmiddot middotmiddotmiddot bullbull middot middot bull middotmiddot middot 8 -- bull _CONTOURS [)RAWN _-- ~ _l bull abull lO_fEF lran_~OUllCStRF~CI gt~~~~ ~~~~bull
I bull middot T o o bull bull middot middotmiddot
) NOTES 1 -middot -middot bull
I1 THE ISOPACH CONTOURS WEREDRAWN TO DENOTE THE THICKNESS OF SOIL ~ Q iP1 middot 0 bullbull 5 bull GEi BORING LOCATIONS middotMEASURED FROM THE SURFACE CONTAMINATED BY GREATER THAN 5ppm TOTAL PCBs bullbull bull bull I THE VALUE OF 5ppm WAS CHOSEN ARBITRARILY AND IS NOT INTENDED TO REPRESENT
middot bullv middot-- - l A SITE-SPECIFIC CLEAN-UP LEVEJ GEi TEST PIT LOCATIONS
2 CRO~S-SECTIONS ILLUSTRAt EXTENT OF PCB CONTAMINATION WITH DEPTH I middot- -f j bull I
_ veRTt6l1 EXAGGEP1r10M m c~oss sicT1c~S 1s 61 middot
bull
middot
I middotshy1
middot J~uJt bull bull i ~ ~ _ - middot j
1 ~ middot bull bull bull middotmiddot l a )
0 gt bullmiddot -~I middotbull I 0 middot r middot- bull ibull I
bull
_ _ I I ~
middot I
bull bull
bull middot~r
- -middot- - -
bullI l middotI middot I bull r f I I
~_ Igt bull
bull f middot
t bull middot bullbull 8 _
~ 7 I r 9
-middot- bull bull I I ~
middot 1
bull ____________________________ ___ _ bull I
bullI 1 bull middot -~ bullr
---------r- -- -- middot~-~~~~middot--middot ~ f middoti middot
bull t ~
bull
middot j
1
-------- -------- ---------------------------- ti 1
bull ~---middot ------middot ~---middotmiddotmiddotmiddot-middot--middot-middot~---middot-- ___~------- middotmiddotmiddot middot middotrbull ~ ~--~~-~middot-~ 1 middotmiddotmiddot I
middot bull middot4J middotmiddot 1 middot
middotI 1
I
bull
bull
middot ~ middotimiddot 1 bull j-1 ~ bullbull bull I bull i ~
APPROXIMATE SCALE I DESIGNED
~ BY
bullIbull Imiddot bull SOURCEmiddot EC JORDON CO RlFS middot bull Central Maine Power Company Pre-Design Work Plans SOIL I ~ t
middot
middot bullmiddot I ~middotmiddot ( bull bull REPORT DATED JUNE 1989 bullL bullr middotmiddot bull ~I middotmiddot DRAWN BY I I bull 1 r bull ~ middotmiddot middot
bull r shy~middot r i Augusta Maine OConnor Site bull SAMPLING I Imiddot 0 middot bull
bullI
bull bull
r bull 40 80
J 1bullmiddot
CHECKED BY Augusta Maine middotLOCATIONS
h cf I ~ 1bull rmiddot_
1 Inch =~Feet t--~------~---_middotmiddot~ I ~middot bullgtIbull
) i _- DATE January1991 middot middot middotmiddotmiddot tbull middot1middotmiddot APPROVED BY GE I Consultants Inc
middot
middotmiddot middot t---P-R_O_J-EC_T_9_0_39-3-----4-S-H-E-ETmiddotmiddotOfFbull t DATE REVISION BYmiddotmiddot J middotFlg3 middot
1 nuovN( POST middot 1 Nl6~1 middot bullbull Ibull Ibull bull bull lomiddot bullbull -
I
I
I
------------ -
) bull middot i bull I
~ f I middot1 bull ~I r
I
middot
-middot- CJ middotYmiddotmiddot I
C bull
middot
I middot I
middot -shy bull bull middotmiddot~
J middot _ bull y
Ibull bull
~ bull ~~ r I bull middot bull
middot bull
I ~ I I ( I bull
JI t
- I
J l I
-~ 1 I
bull j middot middot~ ~ middot) __-_ bull i
Ibull I lt bull
middotmiddotmiddot
gtImiddotmiddot
I
I bull
middotmiddotmiddotmiddot_v -
~ bull J i 1 bullbull
r 1 I ~ middotbull middotbull
I I I l~_middotgt~~bullI~~~bull~middotmiddot jbull1111 1 bull~ - 1 111 middot~ bull1 middot 1middot I jbull I bullI _- middotmiddot 1 1t1 _ 1 (Imiddot 1 bull1 1gt middot~middotlt~middot middot
I l bull bull 1 r I bull bull middot
bull middot middot middot middot~middot ~middot middot~
- J ~J ~~ O lt hj I bull ~ bull bull 1 o t I lbull I
middotmiddot bull ~ middot I bull middot bull bull
middot bull - I middot ~middot
bull 11 ( _ I
middot I Ii lfI ltI
bull
I 1- bull_ II ~ I middot
I bull vmiddotmiddot
30 I ~middot middot bull bull
lt 1 I ---middot _ bull I ~ bull bull ~ bull
II ~
111
bull bulll3 bull ~ middotmiddot bull Ibull 0 I 1 bull 111 bull bull I rbull1 middot 0 I I I - Ibullmiddot 1 bull r middot middot __ -
i bullmiddot ~ ----middot yen ~ bull ~ j
--~middot
I
I
- -- ( middotmiddot~middotmiddot- - bullbull~ _ ~- I ~ bull--- shymiddot ----bull
1- -
bullbull I I - ~ I I bull middot middot ~ I middot
1
---- _ --
bull1 II I j
I bullbullbullbull
II ~
J 1bull ~
I
bull I I bull I ~ middot Tmiddot I 1 ~ bull JI I t Ibull bull ~ bull middot
I -
-----~_ middot1
-1
~
bullbull
-
bullbull I
middot---- a I AiLWO _ middotshy
I
bull f l
I bullbull - middot I - bullbullbull
SVf1
S~D1- -0 sih3 0
I I 0 1 i ---shy (]
middot bullgt I
I J middot bull bull IIbull Iamp middot P I 177
r o ~ 0 SEol l-middot J~ I - -- ltl
f bull bull
gt1 bullI 1 V bull ~ II ~ tJ middot -middot-
I
middot1 - bull bull bull -middot
bullmiddot -bull wmiddot ~ ~ ~
bull IA1 gtW2 - gt1
- - ~ -
middotmiddotmiddot----- ~r=02 bull bullmiddot I __ i Ctt1rr--shy
bullI
Q bull _
1
D I bullbull middot - bull
SW2
I middot- bull
bullI ~middot
rl
~ se02 I bullbullbull I bullbull ~ L-lf L-- I
- ___ bull bull___ I bullbullbull
I bull ) I f IIUZ middot___ ---- bull cu bull
I gt
bullbull -shyI bull Ii bull f
~ middotmiddot~ ~ middot - I
I bull ~ ) I~ shy bullfmiddot~ ~ i ~ ~middot
~ I 1
bull 4 Ot f I
1 i f ~ bull lt
1
bull bull I
___ - ~)____ - ------~ -------middot-middot-r--middot-middot ----middot- - ---middot-middot-middot-middotbull
t t - -- a
I middot bull -- middot - __ __--~~~=--~---_-~= _ _ middot - I ii- - ~~=-=~==--=~middotmiddot-~=~~~~~~=-~~~======middot=middot~middot== middotmiddot-- _ - I
bull -------------------~_
t ~middot middot middot middotbull bull middot i------------1I Imiddot ~~f~=-~~J~i~~~f~U+--f~~~===~~-~~middot~f~=~=~=~~fi~-~-~==~~-==~==~~==~====~==~-=-==~=~=2~~~~~~~77=~=~=~~-=~s)middot==~~~--=-=~~~=~=~====-=====~~=~~~~~=~=~=~==~==-=~=~=middot
middot 7gt JloltGKLA lllD --- shy l lf-nt RT n bull middotl bull
I
-i~------ - -- -------- -- --= bull (
( ei -~ ---- -------- - - - - - bull - shyI bull middot 1 ------
--------~____-____ bull SSmiddotsmiddot~middot2-iJi_8plusmn~plusmn-~~plusmn=+=~==-=-==~~===~~~~~~=-=s~~2~-~s-==~~~z--==~=~~t-=-=-=-==-=---~34~~~-==-=-==-==~=middot==---~=-middot~i~middotmiddot~ middot)~ f ________bull _
~--- __ - ____ - bull shyI I
bull __ _ ~ ~ ~ middott1 middot_
J(J--_ 11bull middot ------deg gt
middot -f ~~~se~middot~ARm~OMAarra~PERfOAMagtBY 0 middot~ bullO ( l r
r-------------liDElmiNEiiiiY-r---Amiddot----------________---~-------------_____ __________middotmiddot_lIbull middotmiddotmiddot ACHERON ENOINEERINCI 8ERVJCED COMPLIED IU8lo BASll MAP
(middot VERIFIED TO MEET NATIONAL MAP ACCUAACI 8TANOARD8(NMJ) middot Tl1ROUQltATEaT GURVltY CONOUCIED Df JORDM 121aa LEG~ APPROXJMATESCALE DESIGNED BY
-----------_ ---------~ CentralMalnePowerCompany p D W kPI middotSURFACEWATERANDmiddotmiddot_-~middotmiddot~~~middotFitow~middot~(TOO~MEETNMAamp DRAwN BY re- es1gn or ans middot middot middot shy bull bull bull - bull
bull Aug~sta Maine OConnor Sitamiddot SEDIMENT SAMPLING middot3middot~~~middot~--~~amCla~~~~~~usa-o middot O GEISEDIMEITTSAMPUN~LOCATI~Ns o 40 middot 80 1
BY LOCATIONS ~middot)~middot ~ bull 11i GEISURFACEWATERSAMPUNGLOCATIONS middot CHECKE
rh A~gustaMalne lt middotmiddot( middotmiddot 11nch-40Feet DATEmiddot January 1991
middot APPRovED BY -V GEi Consultants Inc ~ Imiddotgtmiddotgt middotmiddot middot middot souRCE EC JORDON co RlFS bull middot GEi COMPOSITE SEDIMENT SAMPLE bull DATE REVISION BY - PROJECT 90393 SHEET OF middotI middotmiddot middotI middotAEPORTDATEDJUNE1989 v COUECTEDFORBENCH-SCAIETESTING
I J ~ I
i I bull I )__ )
I I ilo I Ibull
X -4 mdashmdash-0shy
W A Elec-Zl lt4W
Meters Shelves ^ Pickup
A CapAntique a)
W WAutomobile W J
ia iW Y
W A o
LEGEND C w
Stove - wBoat X Designated Wall Label w
-e- -fr bulleshybull Cement SlabDust Sample
0 Wooden Wall Sample ZTaping Reference Origin
W Wipe Sample
Approximate Scale
NOTES 30 Feet
1 Ail locations on this plan are approximate
2 Sample locations are general Central Maine Power Company Pre-Design Work Hans EXAMPLE examples of the type of sampling Augusta Maine OConnor Site BARN SAMPLINGand the distribution Augusta Maine LOCATIONS
3 Revision No 1 (3-28-91) ltP G E I C o n s u l t a n t s I n c Project 90393336 January 1990 Fig 5
I I I I
I
I I
I
I
I
I
I
Document VoL II SC SAP Appendix A Revision 0
Date January 171991 Page 1
V
APPENDIX A zgt
s HEALTH AND SAFETY-PLAN
Source Control PrampDesign Studies CConnorCO^Site
Augusta Mkine shy_ lt
lt
NT lt
Document Vol II SC SAP Appendix A Revision 0
Date January 171991 Page 2
GEI CONSULTANTS INC SITE HEALTH AND SAFETY PLAN
Site Name OConnor Co Site
Site address Street Route 17 Qty Augusta State Maine
Proposed Site Activities Source Controlsampling of surface andsubsurface soilssediments surface water and the on-site barn
Proposed Date of Work April 1991 gt S
Original Safety Plan YES
Site Safety Coordinator Thomas S Bobowski
Client Central Maine Power Company^(CMP)
Site Contact Charles Nickerson (CMP)
Team PERSONNEL ^ IRESPONSIBILITIES Robert E Stetkar lt ^mjectManager Joanne O Morin Work Tlans and Pre-Design Studies Manager Richard F Murdock Qhality Assurance Officer Benjamin YSu Treatability Studies Manager Joseph G Engels Technical Consultant Steven R fcambx Source Control Sampling Task Manager Thomas S Bobowski7 Barn Sampling Coordinator Sampling Boyd P Smith Sampling Christopher L Covel Sampling William J Haswell Sampling Charles Blodgett Field Screening Analytical
Background Information
The OConnor Co Site (Site) covers approximately a 9-acre portion of a 65-acre parcel within the city limits of Augusta Maine The Site is surrounded by sparsely-developed residential or agricultural properties or undeveloped woods and wetlands (Riggs Brook and associated wetlands border the Site to the east) The F OConnor Co operated a transformer stripping and recycling operation on theSite from the1950s through the 1970s
Document VoL II SC SAP Appendix A Revision 0
Date January 171991 Page 3
During operations releases of wastes including PCB-laden oils resulted in contamination of water and soil on the site Principal features of the Site include a barn which formerly housed scrap operations an upland marsh formed by man-made disruption of natural surface water drainage upper and lower surfacewater impoundments (lagoons) constructed to control migration of oils from the Site a low area where excavated lagoon sediments were deposited within a clay liner three former transformer work areas a former scrap yard and a wetland associated with Riggs Brook A site plan depicting some of the major features of the site is shown in Figure HS-1
Ax In 1986 and 1987 remedial investigations were performed byECvJdrdan Co for Central Maine Power Company (CMP) These investigations included over^OQ soil samples 11 monitoring wells and analysesof surface water ground water sediment and biota for PCBs organic and inorganic chemicals The primary contaminantsdetected in soil and sediments at the Site were PCBs PAHs and Lead Chlorinated benzenes PCBs phthalates and to a lesser extent volatile organics and metals were detected in ground water and PCBs and metals were detected in surface water Using these data Clement AssociatesInc performed an Endangerment Assessment in 1988 for EPA^evaluating risks to human health and the environment associated with existing condiuoi^ra^Tuture conditions related to a noshyaction remedial alternative In 1989 EC JordabCoi acting as consultant to CMP completed a Feasibility Study which evaluated remedial alternatives based on information provided in their earlier Remedial Investigation Report and in the EPA Risk Assessment Report After receipt of the Feasibility^Stiidy Report EPA issued a Record of Decision (ROD) in September 1989 describihg the^EPA^elected remedial alternatives for source control and management of migration
Site Status Waste Types
Includes the followin
Ground water Surface water Sediment Soils On-site structures
Refer to Table1for listing of chemicals of concern during Source Control studies per media sampled
Document VoL H SC SAP Appendix A Revision 0
Date January 171991 Page 4
Hazard Evaluation
Known orSuspected HazardousToxicMaterials Polychlorinated biphenyls (PCBs)volatile organic compounds (VOCs) polycyclic aromatic hydrocarbons (PAHs) and metals (especially Lead) The ranges of concentrations of chemicals detected in all source control media on-site are presented in the attached Tables 1C through 1L from previous studies Concentrations of PCBs PAHs and Lead detected in surficial soikduring previous studies (including the on-site Barn) are shown in Figures HS-2 HS^3 and HS-4 respectively Concentrations of chemicals detected in surface water and sediihentsduring previousstudies are shown in Figure HS-5 lt( x
The primary concern at the Site is contamination of surface soils by spillage or leakage of transformer oils containing PCBs The potential forencountering concentrated wastes in the transformer work areas (TWA I TWA II andltTWAIlI) is high In addition wastes have also been identified in soils and sediments associatedwith the lagoons and drainage swales Within a short distance of these discrete areas of the site the potential for encountering significant concentrations of wastes-is low ToYeduce the likelihood of being exposed by wastes associated with these areasduring~source control sampling activities efforts should be made to avoid walking unnecessgrilyriiv these areas
Exposure to hazards from chemiealsduiing test plying and environmental sampling and analysis tasks are most likely to occurbyone-or more of the following
1 Direct contact with contaminated surficial and subsurface soils sediments or surface-water x N
mdashN2 Inhalation of fu^Uve^ust carrying contaminants
3 Inhalation of volatile orgsuuc compound vapors while test pitting or sampling the various media on-site
Toxic and Pharmacological Effects Refer to the NIOSH Guide to Chemical Hazard Table 2 lists the major chemicals of concern and their toxic and pharmacological effects Acute exposure to PCBs PAHs Lead and VOCs may result in dizziness or nausea The results of chronic exposure may include but are not limited to central nervous system depression liver and kidney damage and irritation of skin eyes and respiratory passages Many PCBs PAHs and VOCs are known or suspected carcinogens Routes of exposure include inhalation topical and ingestion
Document Vol II SC SAP Appendix A Revision 1
Date March 28 1991 Page 5
Heat-related illnesses range from heat fatigue to heat stroke the latter being the most serious Heat stroke requires prompt treatment to prevent irreversible damage to health Protective clothing may have to be cut off Less serious forms of heat stress require prompt attention to prevent further complications which may lead to heat stroke Unless the victim is obviously contaminated decontamination procedures should be omitted or minimized so that treatment may begin immediately
Hypothermia may result from personnel exposed to excessive cold during sampling operations Hypothermia requires prompt treatment to prevent serious damage to health Damp or wet clothing may have to be cut off and the persons body temperature must be elevated as soon as possible through the use of warm blankets or another persons body warmth Unless the victim is obviously contaminated decontamination procedures should be omitted or minimized so that treatment may begin immediately
Area Within Augusta Maine city limits
Proposed On-Site Activities Test pitting boring or hand augering for collection of surface and subsurface soil samples collection of sediment and surface water samples from an inflatable boat or from wading into the water with hip-boots and collection of samples from within the on-site Barn Potential physical safety hazards during each of the four proposed Source Control site activities are discussed per activity below
Test Pitting and Borings for Surface and Subsurface Soil Samples A backhoe will be used during test pitting operations to excavate soil for collection of samples The most significant hazard during this sampling effort is the potential for collapse of the excavation while sampling Therefore in accordance with OSHA and 29CFR1926 Subpart P if personnel are required to enter an excavation the excavation will be no deeper than 5 feet unless it is braced or sloped back For the Type A soils documented on-site (eg clay and glacial till) the required slope from the ground surface to the top of unbraced portion of the excavation in all directions is 05 HORIZONTAL 1 VERTICAL Short-term excavations of this type will not exceed 12 feet in depth In general a drilling rig will likely be used to obtain samples from depths below 5 feet by augering to a specified depth and using a split-spoon sampler
Document Vol H SC SAP Appendix A Revision 1
Date March 28 1991 Page 6
Other physical hazards during test pitting and boring operations include the presence of overhead objects (eg backhoe bucket) so hard hats must be worn during these tasks at all times In addition the potential for spreading contamination with fugitive dust during excavation and mobilization between sampling locations is much greater than during other Source Control sampling efforts Therefore Level C dermal and respiratory equipment must be worn during all test pitting and boring operations (see below) Additional decontamination procedures will be required between sampling areas to limit the potential for cross-contamination (see below)
Sediment and Surface Water Sampling These operations will be conducted using Level C dermal protection only The need for respiratory protection will be based on criteria discussed in the next section In order to collect sediment and surface water samples in interior portions of the Upland Marsh and Upper and Lower Lagoons an inflatable boat or hip-boots will be used Further sampling will be performed by walking along the shores of the surface water bodies while dragging a sediment sampler These operations involve the risk of falling in relatively deep water while equipped with Level C dermal protection This equipment may limit movement and may inhibit a person from swimming easily to safety Therefore while sampling with the boat a Coast Guard Approved life vest will be worn at all times In addition one person will standby on-shore to observe the boat operation and to assist in the event of a mishap Depending on the water and air temperature at the time of sampling it is possible that a person who had fallen in water may require treatment for hypothermia or shock
Barn Sampling The barn can be classified as a confined work space since it is fully enclosed and has a limited number of exits In order to operate safely in a confined work space special considerations are necessary Unlike some confined spaces the barn has numerous small openings in the wooden structure to allow for an adequate supply of air while collecting samples However the sampling effort will likely generate a significant amount of airborne dust within the barn which means that Level C dermal and respiratory protection must be worn at all times while in the barn One person will remain outside the barn during the sampling effort to observe the sampling personnel and to provide backup services Two Combination Type A-B-C fire extinguishers capable of extinguishing wood and paper flammable liquidis or electrical fires will be available (one inside and one outside the barn with the standby person) in the unlikely event of a fire occurring during sampling
Document VoL H SC SAP Appendix A Revision 0
Date January 171991 Page 7
In accordance with OSHA 29CFR1910120 a minimum lighting intensity of 5 foot
candles will be provided within the barn during sampling The creation of dust and the
low lighting which may be available in some areas of the barn is likely to limit vision
some of the time Special care must be taken to avoid tripping over the numerous
objects disposed of within the barn No electricity is available in the barn so power
will come from outside the barn to supply power for lighting and tools to be used in
the sampling effort This means that electrical extension cords will be laid out on the
floor to various sampling locations In addition a large amount of metal and wooden
debris exists within die barn which may become obstacles to free movement in certain
areas The wooden floors of the second story and loft ofxthe^arn are extremely
deteriorated in some places and should not be accessed unless authorized by the Site
Safety Coordinator v
The use of electric power tools to collect samples ^wobd boring and concrete drills) require special care The use of Level C dermal protection such as loose fitting gloves may make handling the drills more difficult Use speciaLcare to avoid contacting the moving bits of the drills while in operation tonvoid tearing tyveks or gloves If dermal protection is torn replace or patch it immediatelybefare proceeding with the sampling operation
Perimeter Establishment
MapSketch Attached See bdquo Perimeter Identified Access to site is restricted at all entry points via a locked
8-foot high cyclone fence^- x y
Zone(S) of contamination identified See Figure HS-1 through HS-5
Document Vol II SC SAP Appendix A Revision 1
Date March 28 1991 Page 8
Recommended Level(s) of Protection On-site personnel will use Level C dermal protection at all times See below for respiratory use
1 Protective Clothing
Sampling and decontamination personnel in these areas will wear
bull Disposable Tyvek coveralls over cotton coveralls bull Tyvek hoods bull Safety glasses or face shield bull Hard Hat bull Disposable booties over workbooks or waders for sampling surface water and
sediments bull Butyl rubber gloves over surgical gloves bull All gloves and booties will be taped to the Tyvek coveralls
2 Respiratory Protection
Air purifying respirators will be worn at all times while sampling during test pitting and boring operations and while inside the barn Otherwise the need for respiratory protection will be determined by on-site monitoring for organic vapors and the daily potential for exposure to airborne particulates The decision to utilize air-purifying respirators due to airborne particulates will be made by monitoring with a MIE MINIRAM Hand-held Aerosol Monitor (HAM) Based on previous studies (Endangerment Assessment Appendix F) an action level for worker safety of 10 mgm3 of respirable dust was established for the site Therefore when readings on the MINIRAM of 10 mgm3or greater are experienced Level C respirators will be worn Initial on-site monitoring for organic vapors will be conducted using an HNu Photoionization Detector (PID) Ambient vapor levels of 5 to 10 ppm above background in the breathing space will require the use of full-face cartridge respirators (Level C Protection) Background levels will be determined at the edge of the Site (ie fence line) before the initiation of the days activities Air quality will be monitored at the upwind boundary of the site at three locationsfor a duration of one minute at each location The maximum PID reading at each location will be recorded and the three readings will be averaged to determine the background level for that day Respiratory protection will be full-face respirators fitted with combined organic vapor and high-efficiency particulate cartridges (MSA Type GMA-F) Respirator cartridges will be replaced at a minimum on a daily basis Depending on readings obtained with the MINIRAM cartridges may be replaced at mid-day on windy days
Levels of organic vapors greater than 10 ppm above background in working areas will necessitate utilization of self-contained breathing apparatus (Level B Protection) During sampling HNu monitoring should be utilized to detect any changes in organic vapor levels Changes in fugitive dust or vapor level detection at any time may warrant appropriate alteration of required respiratory protection
Document VoL H SC SAP Appendix A Revision 0
Date January 171991 Page 9
Decontamination and Disposal
A decontamination areawill be assembled at the entrance to the site The decontamination zones will be established such that personnel and equipment are fully decontaminated prior to leaving the fenced area In addition all personnel will be familiar with proper decontamination procedures prior to going on site All personnel entering and exiting the hot zone shall pass through the decontamination zone
1 Personnel Decontamination
The personnel decontamination sequence is as follows
a Samples and equipment are dropped on plastic sheets
b Disposable booties Tyvek coveralls and contaminated outer gloves are first brushed off with soapy water then rinsed with clean water by decontamination personnel Thedisposable equipmenfis^then removed baggedand placed in a 55shygallon drum marked Dry Deconv
c Neoprene boots and outer gloves are washed if they were not drummed in Step b with soapy water and ririseck with clean water An additional rinse with methanol followed by a firiak water-rinse completes the sequence
lt d Neoprene boots and glovesare -removed
e Respirators (cartridge-change) are removed if necessary and disposed in the Dry Decon drum
f Surgical gloves are temovfedand disposed in the Diy Decon drum
Document Vol M SC SAP Appendix A Revision 0
Date January 17 1991 Page 10
2 Equipment Decontamination
The equipment decontamination procedure for Source Control sampling work performed inside the fenced area of the site is as follows
a All disposable items (eg surgical gloves plastic sheeting nylon brushes etc) will be discarded in the Dry Decon drum
b Heavy equipment such as the backhoe and drilling jig will be steam-cleaned on a specially constructed decontamination pad located east bfthermain site access gate and north of the ground water monitoring well couplet MW1Q2A and MW102B (see Figure HS-7) The pad will be constructed to allow for drainage of steam-cleaning solutions onto a bermed multi-layer -impermeable barrier consisting of several layers of at least 6-mil-thick polyethylene sheeting overlain and underlain by geotextile fabric The geotextile fabricwilfbe designed to collect contaminated sediments which may have collected on tires or excavating equipment Rinse water from the decontamination processwill then fre pumped through hoses or channelled for drainage into the Uppei^La^oomafter completion of surface water and sediment sampling The decontamination pad will be left in place after completion of field sampling
c All other equipment contacting surface or subsurface soils sediments surface water or materials within thebarm(egtrowels spatulas templates drill bits etc) will be decontaminated by rinsing with clean water scrubbing with methanol and re-rinsing with distilledwater Solutions which contain methanol will be collected for disposal into tHeJWet Decon drum Equipment used during barn sampling will then be drted^with paper towels and the towels will be disposed in the Dry Decon drum ^
3 Decontamination Station Closure
The procedure for decontamination station closure will be as follows
a Decontamination personnel shall be responsible for closing the station at the end of each workday
b All solid wastes such as plastic tarps bags and Tyveks will be placed in the Dry Decon drum and will be closed at die end of each workday
Document Vol IISC SAP Appendix A Revision 0
Date January 171991 Page 11
All spent decontamination solutions containing methanol will bedisposed of in the Wet Decon drum Decontamination solutions which are not composed of methanol and exhibiting PID readings below 1 ppm will be poured into surficial soils on the edge of TWA I within the fenced area of the site If PID readings are greater than 1 ppm the solutions will be disposed in the Wet Decon drum These drums will be closed at the end of each workday
d Drums shall be secured on-site until proper disposal is arranged after consultation with EPA
7 Air Monitoring Procedures X
Site Monitoring Equipment PID HNu PI-101 HAM MIE MINIRAM
Since Level C respirators will be used during test pitting and barn sampling air at the test pit and barn sampling areas will be monitoredfegularly with a PID and HAM primarily for future reference of the levels of VOCs and dustto^be expected during remedial activities During the other sampling efforts air monitoring wiH form the basis for whether an upgrade to Level C respiratory equipment is necessary TheltPID will be used regularly during soil sediment and surface water sampling^ TKampHAM will be used at least twice per hour while on-site to monitor for dust levels in air^Whenunusually windy conditions are experienced additional monitoring for dust levels wilLbe^erfbrmed When ambient temperatures in air are below 32deg F the chart recorderattachment for the MINIRAM must be used as the LED readout on the instrument may not operate below freezing All PID and HAM readings will be recorded in theJield Log Book
Document VoL H SC SAP Appendix A Revision 0
Date January 171991 Page 12
Emergency Information
Location Phone
FIRE Augusta (207) 623-2511
POLICE Augusta (207) 623-2511 State Police (Augusta) (207) 621-1200
AMBULANCE Augusta (207) 623-25tlx N
HOSPITAL Kennebec Valley Medical Center (207) 626-1000 Augusta Division N 6 East Chestnut Augusta ME
Chemical Trauma Capability Yes
EPA (Michael Jasinski) 7) 573-5786
DEP (Thomas Benn) (207) 289-2651
CMP (Charles Nickerson) (207) 623-3521
Directions to Hospital (See Fig HS-6)
Primary route to hospital is west on Route17 (Eastern Avenue) to Arsenal Avenue turn right on Arsenal Avenue and go3 blocks to E Chestnut street then right Emergency room entrance is 6 East Chestnut Street Alternate route - west on Route 17 (100 yards) to Cony Road turn right on Cony Road take^rst left (Cony Street Ext) to Riverside Drive go left on Riverside Drive the second mtejsection will be Arsenal Street goleft on Arsenal Street East Chestnut Street will be second left
Document VoL H SC SAP Appendix A Revision 0
Date January 171991 Page 13
Additional Emergency Contacts
DR DAVID EGILMAN (617) 935-8581 HEALTH RESOURCES WOBURN MASSACHUSETTS
GEI CONSULTANTS INC
ROBERT E STETKAR (603) 224-7979 JOSEPH G ENGELS (617)721^4022 s
TSCA HOTLINE (800)424-9065
AT amp F (EXPLOSIVES INFO) (800^424-9555 V
NATIONAL RESPONSE CENTER x(8W) 424-8802
PESTICIDE INFORMATION SERVICE (800)845-7633
RCRA HOTLINE y -(800) 424-9346
CMA CHEMICAL REFERRAL CENTER (800) 262-8200V NATIONAL POISON CONTROL CENTER (800) 942-5969-y
US DOT bdquo (202) 366-0656
GEI CONSULTANTS ^ (603) 224-7979
Prepared by Thomas S Bobowski Date January 7 1991
Reviewed by Robert E Stetkar Date January 9 1991
All personnel working at this site have received OSHA required health and safety training Personnel are enrolled in a medical monitoring program A summary of training completed for all GEI personnel involved in the Source Control sampling program is provided in Table 3
Use of Common Sense is Required
I have read and understand this safety plan
Name (printed) Signature Date
Table 1A Organic and Inorganic Chemicals Detected in the Shallow Aquifer
Groundwater Samples at the F OConnor Site Maximum
Concentration Geometric Background
Range Mean[a] Concentration (ugL)
Chemical Frequency (ugL) (ugL)
ND(b]-2300B[c] 150 NDAcetone 211 ND-15J[d] NA[e] NDBenzene 211 ND-45 143 ND2-Butanone 17 ND-83 53 NDChlorobenzene 311 ND-53 NA NDToluene 27 ND-12J NA NDTriehloroethene 1P ND-11 81 NDBis(2-Ethylhexyl)Phthalate 411 ND-25 1deglaquo2 ND12-Dichlorobenzene 411 ND-14J 97 ND13-Dichlorobenzene 311 ND-13J 96 ND14-Dichlorobenzene 311 ND-29 94 ND124-Trichlorobenzene 17 ND-19 07 NDTotal PCBs 111 27-5085 06 49Aluminum 55 27-805 24 42Barium 55 13700-125451 38300 26600Calcium 55 ND-145 53 NDChromium 25 ND-37 NA NDCobalt 15 ND-285 66 14Copper 35 33-4952J 590 3Iron 55 ND-18 37 NDLead 15 21-2906 260 24Manganese 55 ND-154 10 NDNickel 15 ND-17 37 NDSilver 15 10593-72812 33400 14000Sodium 55 ND-71 71 NDVanadium 15 17-946 263 91Zinc 55
a) Calculated using detected concentrations and one-half of EPAs contract laboratory program (CLP) detection limits for the organics For the inorganic
chemicals the aqueous CLP detection limits were used
b) ND - Not Detected
c) B designates Chat substance was also found in the blank though the
sample level was significantly higher to prove a positive detect
d) J designates estimated value
e) NA - Not applicable Chemical was detected infrequently and the use of
one-half of the detection limit in calculating a mean results in a mean
concentration that exceeds the maximum Therefore a mean is not used
SourceEndangerment Assessment dated Jan 29 1988 by CDM
Table IB Organic and Inorganic Chemicals Detected in Bedrock Aquifer
Groundwater Samples at the F OConnor Site
Mean Concentration Geometric Background
Chemical Frequency Range (ugL)
Mean[a] (ugL)
Concentration (ugL)
Acetone 220 ND[b]-1200 68 ND Benzene 220 ND-27J[c] NA(d] ND Chloroblt ene 620 ND-16 36 ND Toluene 215 ND-27J NA ND Bis(2-E vlhexyl)Phthalate 1320 ND-64 Hi 61 12-Dich 13-Dic^
irobenzene jrobenzene
720 120
ND-26 ND-24J NA
66 ND ND
14-Dic^ robenzene 620 ND-44 82 ND Di-n-Bu phthalate 120 ND-22J NA ND 124-Tr hlorooenzene 720 ND-310 161 ND N-Nitros iiphenvlamine 25 ND-4J NA ND 3eta-BHC 110 ND-04 004 ND Gamma-BH (Lindane) 110 ND-006 003 ND Total PC 320 ND-50 LO ND Antimony 110 ND-55 19 ND Barium 1010 15-129 138 56 Chromium 410 ND-268 54 ND Cobalt 110 ND-115 92 ND Iron 1010 61-384301 837 152 Magnesiu Manganes
1010 810
5960-46250 ND-5895
15220 661
4203
27 Nickel 310 ND-345 125 ND Potassiu 1010 3504-16046 6560 4340 Vanadium 110 ND-52 NA ND
a) Calcul ted using detected concentrations and one-half of EPAs contract labor 3ry program (CLP) detection limits for the organics For the inorganic chemic Is the aqueous CLP detection limits were used
b) ND mdash F detected
c) J de Ignates estimated value
d) NA - N applicable Chemical was detected infrequently and the use of one-ha of the detection limit in calculating a mean-results in a mean concern ation that exceeds the maximum Therefore a mean is not used
Source Endangerment Assessment dated Jan 29 1988 by COM
Table 1C Organic and Inorganic Chemicals Detected in In-Fence Surface Soil
Samples at the F OConnor Site Mean
Concentration Geometric Background Range Mean[a] Concentration
Chemical Frequency (ugAg) (ugkg) (ugAg)
19 ND[b]-19J[c] NA[d] ND Chicroform ND29 ND-150B[e] 63Methylene Chloride
ND19 ND-30J NAToluene 260J19 ND-917J 260Bis(2-Ethylhexyl)Phrhalate
Carcinogenic PAHs ND19 ND-2700J 290BenzoltAgtAnthracene ND29 ND-12000J ^10BenzoltB or KgtFluoranthene ND39 ND-11000J 540Chrysene ND39 ND-23183Total CPAHs
Non-carcinogenic PAHs ND39 ND-12000J 540Pvrene ND39 ND-12000 540Total NCPAHs ND118186 ND-6205600 3400 Total PCBs 4001419 ND-64000 1900Cadmium 292001919 17000-29480000 275000
Copper 570001919 29000-2681000 213000Lead 252001919 19000-90000 35000Nickel ND219 ND-12000 650Silver 738001919 45000-1160000 183000Zinc
aj Calculated using detected concentrations and one-half of EPAs contract UboSto program (CLP) detection Unite for the organic For the inorgar-c chemicals the detection limits for soils were based on aqueous CLP
detection limit
b) ND - Not Detected
c) J designates estimated value
d) NA - Not applicable Chemical was detected infrequently and the use of one-half of the detection limit in calculating a mean results in a mean concentration that exceeds the maximum Therefore a mean is not used
e) B designates that substance was also found inthe blank though the sample level was significantly higher to prove a positive detect
Source Endangerment Assessment dated Jan 29 1988 by Clement Associates Inc
Table ID
Organic and Inorganic Chemicals Detected in the TVA III Surface Soil Samples at the F OConnor Site
Concentration Geometric Background Range Meanfa] Concentration
Chemical Frequency (ugAg) (ugAg) (ugAg)
44-DDT 13 ND[b]-5200 150 ND 44-DDE 13 ND-260 56 ND Total PCBs 2131 ND-620000 2940 ND
Antimony 11 189000 41000
Cadmium 11 11000 400 Copper 11 230000 29200 Iron 11 60900000 22200000 Lead 11 634000 57000 Zinc 11 799000 73800
a) Calculated using detected concentrations and one-half of
ErAs contract laboratory program (CLP) detection limits
b) ND - Not Detected
Source Endangerment Assessment dated Jan 29 1988 by Clement Associates Inc
Table IE irganic Chemicals Detected in Upland Marsh Sediment
Samples at the F OConnor Site[a] Maximum
Concentration Geometric Background Range Mean[b] Concentration
Che ical Frequency (ugAg) (ugAg) (ugAg)
To ane 11 23J[c] - ND[d] To- 1 PCBs 33 1300-34000 6425 ND
a) norganic chemicals were also analyzed for but none were itected significantly above background concentration
b) alculated using detected concentrations and one-half of PAs contract laboratory program (CLP) detection limits
c) J designates estimated value
d) D - Not Detected
Source Endangerment Assessment dated Jan 29 1988 by Clement Associates Inc
Chemical
Acetone 11 408B[c] ND[d]
Bis(2-EthyIhexy1)Phthalate 11 2082 ND
Toluene 11 28J[e](f] ND
Total PCBs 44 30000-1100000 381000 ND
a) Inorganic chemicals were also analyzed for but none were detected
significantly above background concentration
b) Calculated using detected concentrations and one-half of EPAs contract
laboratory program (CLP) detection limits
c) B designates that substance was also found in the blank though the sample
level was significantly higher to prove a positive detect
d) ND - Not Detected
e) J designates estimated value
f) In a duplicate sample toluene was not detected A geometric mean of the detected value and one-half of the detection limit would have resulted
in a mean concentration exceeding the detected value Therefore only
the detected value is listed
Source Endangerment Assessment dated Jan 29 1988 by Clement Associates Inc
Table 1G Organic and Inorganic Chemicals Detected in Lower Lagoon Sediment
Samples at the F OConnor Site Maximum
Concentration Geometric Background Range Mean(a] Concentration
Chemical Frequency (ugAg) (ugAg) (ugAg)
Bis(2-Ethylhexyl)Phthalate 12 ND[b]-100J[c] NA[d] ND
Benzoic Acid 22 120J-190J 150 ND Total PCBs 77 3202-40100 8660 ND
Cadmium 12 ND-2500 790 ND c 22 27000-59000 40000 20000
Lead 22 17000-70000 34500 ND
Manganese 22 525000-982000 718000 474000
Selenium 12 ND-760 436 ND Zinc 22 103000-249000 160000 108000
a)Calculated using detected concentrations and one-half of EPAs contract laboratory program (CLP) detection limits for the organic For the inorgan chemicals the detection limits for sediments were based on the aqueous CLP
detection limit
b) ND - Not Detected
c) J designates estimated value
d) NA - Not Applicable Chemical was detected infrequently and the use of
one-half of the detection limit in calculating a mean results in a mean
concentration that exceeds the maximum Therefore a mean is not used
Source Endangerment Assessment dated Jan 29 1988 by Clement Associates Inc
Table 1H Organic and Inorganic Chemicals Detected in Riggs Brook Sediment
Samples at the F OConnor Site Maximum
Concentration Geometric Background
Range Mean[a] Concentration
Frequency (ugAg) (ugkg) (ugAg)Chemical
12 ND[b]-30 12 NDMethylene Chloride
Carcinogenic PAHs 22 160J[c]-790 360 230JBenzoltAgtAnthracene 22 220J-800 420 290JBenzoltAgtPyrene 22 2-63J-1600 650 710J3enzoltB or KgtFluoranthene 22 280J-960 520 400J
Chrysene 12 ND-190J NA[d] NDDibenzltAHgtAnthraeene 12 ND-400J 340 NDIndenoCl23-CDgtPyrene 22 1507-4740 2670 2402Total CPAHs
Non-carcinogenic PAHs 12 ND-110J NA NDAcenapthy1ene 12 ND-200J NA NDAnthracene 12 ND-410J 350 ND
BenzoltGHIgtPerylene 22 280J-1200 580 420J
Fluoranthene 12 ND-80J NA NDFluorene 22 72J-680 220 150J
Phenanthrene 22 290J-1500 660 470J
Pyrene 22 1810-4180 2750 2584Total NCPAHs 615 ND-6481 870 NDTotal PCBs 12 ND-1200 775 NDSilver
a) Calculated using detected concentrations and one-half of EPAs contract laboratory program (CLP) detection limits for the organics For the degrgan chemicals the detection limits for sediments were based on the aqueous CLP
detection limits
b) ND - Not detected
c) J designates estimated value
d) NA - Not applicable Chemical was detected infrequently and the use of one-half of the detection limit in calculating a mean results in a mean
concentration that exceeds the maximum Therefore a mean is not used
Source Endangerment Assessment dated Jan 29 1988 by Clement Associates Inc
Table II Inorganic Chemicals Detected in Upland Marsh Surface
Water Samples at the F OConnor Site[a]
Sample Background
Concentration Concentration
Chemical Frequency (ugL) (ugL)
Aluminum 11 884 104 Arsenic 11 35 ND(10)[b]
Barium 11 12 47 Iron 11 3540 1160 Lead 11 36 ND(5)
Manganese 11 ^29 134 Potassium 11 7260 3610
a) Organic chemicals were also analyzed for but
none were detected
b) ND - Not Detected Limits of detection are
given in parentheses
Table 1J Organic and Inorganic Chemicals Detected in Upper Lagoon
Surface Water Samples at the F OConnor Site
Sample Background
Concentration Concentration
Chemical Frequency (ugL) (ugL)
108 ND(10)[a]Total PCBs 11 47Barium 11 23
6 ND(5)Lead 11 Manganese 11 1450 134
25 ND(40)Nickel 11
a) ND - Not Detected Limits of detection are given in
parentheses
Source Endangerment Assessment dated Jan 29 1988 by Clement Associates Inc
Table IK Organic and Inorganic Chemicals Detected in Lover Lagoon
Surface Water Samples at the F OConnor Site Maximum
Concentration Geometric Background Range Mean[a] Concentration
Chemical Frequency (ugL) (ugL) (ugL)
Total PCBs 22 13-375 221 ND[b] Aluminum 22 56-3740 458 104
Arsenic 12 ND-4 NA[c] ND
Barium 22 12-37 67 47
Cobalt 12 ND-9 NA ND Iron 22 1970-8260 4030 1160
Lead 22 91-13 109 ND
Manganese 22 137-2330 565 134 Potassium 22 5200-6220 5690 3610
a) Calculated using detected concentrations and one-half of EPAs
contract laboratory program (CLP) detection limits for the organics For the inorganic chemicals the aqueous CLP detection
limits were used
b) ND - Not Detected
c) NA - Not Applicable Chemical was detected infrequently and the
use of one-half of the detection limit in calculating a mean
results in a mean concentration that exceeds the maximum
Therefore a mean is not used
Table 1L
Inorganic Chemicals Detected in Riggs Brook Surface Water Samples at the F OConnor Site[a]
Maximum
Concentration Geometric Background Range Mean[b] Concentration
Chemical Frequency (ugL) (ugL) (UgL)
32 NDAntimony 13 ND[c]-35 5 NDLead 13 ND-16
a) Organic chemicals were also analyzed for but none were detected
b) Calculated using detected concentrations and one-half of EPA s
contract laboratory program (CLP) aqueous detection limits
c) ND - Not Detected
Source Endangerment Assessment dated Jan 29 1988 by Clement Associates Inc
Chemical
Acetone |CHCOCH3l Dimethyl ketone ketone propane
Toluene |CHCHJ _ e bull bull a O J Jtoluol phenyl aethane aethyl benzene
Cblorobcnzene (CHC1) aonochlorobenzene chlorobenzol
Ethyl benzene |C_HCH| phenyl ethane ethyl benzol
ACC TLV or STEL
ltPPB) (PfB)
750 1000
100 150 skin
75 (550agaraquo)
100 125
TABLE 2 CHEMICAL TOXICITY AND OTHER INFORMATION
Physical Skill Dcraal LD^ (mgkg) State Penetration Tonicity Potency ofraquoI(rat)
bullbullbull local it 9750liquid Bint-like odor
1297(nice)
liquid t local 5000
TC|Huosn =Ml00 ppa
colorless liquid 2910
colorless liquid local H 3500 with aromatic odor
syatcaatic bullbullbull TCu(Kiais) c 100 ppa
A hrs
Page 1 of 4
Remarks
Syaptoas Irritates eyea none throat narcotic in high concentrations
Target Organ respiratory aystea skin
First Aid Swallow water voait Skin soap wash
Incoapatibilities oxidizing materials acids Fire hazard when csposed to beat or flame
Tonicity 1 Persistence1 0
Syaptoas fatigue confusion euphoria dizzy headache dialated pupils lack of appetite nervousness insoania
Target organ CNS liver kidneys skin
First Aid Swallow NO VOHIT 8kln soap waah
Incoapatibilities strong ozldizers
Toxicity1 2 Persistence 1
Syaptoas irritates eyes nose causes drowsiness incoordination skin irritation
Target organ respiratory systea eyes skin cars liver
First Aid NO VOMIT
Incoapatibilities strong oxidizers reacts violently with AgClO^
Toxicity 2 Persistence 2
Syaptoas irritant to eyes and aucous aembrane headache narcotic
Target organ eyes upper respiratory systea
First Aid NO VOHIT
Incoapatibilities oxiding asterisks dangerous when exposed to heat or flame
TABU 2 Page 2 of 4 CHEMICAL TOXICITY AND OTHER INFORMATION
(continued)
ACC TLV or STEL Physical Skin Dcraal ID (agkg)
Cheaical (PPff) (PPB) State Penetration Toxicity Potency orsl(rat) Rcnarks
Benzene benzol
IC^H) 10 23 colorless liquid with aroaatic odor
local systeaatic
bullbull
bullbullbull Poisoning occurs aost coasaonly through lnhalationi also penetrates through akin
Syaptoass lrritatea eyes nose respiratory systea giddiness head nausea staggered gait fatigue depresesion sbdoaioal pain
Target organs bloody CNS skin bone narrow eyes respiratory systea
First Aids Swallows 8kins
NO VOMIT soap wash
Inconpatibilitiess strong oxidizers chlorine hronine with iron Dangerous when exposed to beat or flaae
Toxicitys 2 Persistences 1
Trichloroctbylcne ethylene trichloride tridene TCE
30 200 colorless liquid sweet odor
4820
1900(dog)
Syaptoass headache vertigo vision distortion treaors soanolcnce nausea voait irritates eyes cardiac errytbaiss paresthesias
Target organs respiratory systea heart liver kidneys CNS skin
First Aids Swallows Skins
Ipecac voait soap wash immediately
incoapatibless strong caustics chemically active actalss Da Li Ra Hg liquid O
Al 02 KN03 Ti
Persistences 3
Polychlorlasted biphenyi PCB Arocblor 1242 CjjHjClj(approx)
Arcblor 1234
C6H2C3C6M3C12
03
colorless to dark brown liquid with aild hydrocarbon odor
local systeaatic
local
Poisoning occurred Boat coaaonly through investigation or penetration of skin
Sypatoaas Irritates eyes (discbarge) skin scne-fora dernitatis Jaundice dark urine Target organs liver eyes skin First Aids Swallows Ipecac voait
Skins soap wash isnediately Incoapatibless strong oxidizers
TABU 2 CHEHICAL TOXICITY AND OTHER INFORMATION Page 3 of 4
ACC
Chulcil TLV or STEL (ppa) (POO)
Physical State
Skin Penetration
Derail Tonicity Potency
U)n (ngkg) of Reaarka
Dloctyl phtbalate di-acc-octyl pblbalata
5 aga1
light colored liquid
31000 Tonicity low to none via oral and derail routca produce 01 ayaptoas
12 Bichlorobenzene (C^H CI ) o-OCB
50 none liquid ++ local systemic
Symptoms irritates eyes and nose Target Organs liverkidneysskineyes First Aid Swallow salt water vomit
Skin soap wash Incompatabilities strong oxidizers
14 bichlorobenzene (CHbdquoC1 ) 7 2
P-OCB 75 110 solid ++ local
systemic ++ Symptoms irritates eyesheadachesnauseavomiting
Target Organs liverkidneyskineyesrespiratory system
first Aid Swallow water vomit skin soap wash
Incompatablities none
Lead (Pb) 015 mgm
none solid systemic t Symptoms Fatigue headaches abdominal pain Target Organs kidneys 61 central nervous system First Aid Swallow water vomit
Skin soap wash
Polycyclic Aromatic Hydrocarbons (PAHs)
015 mgm
none liquid systemic + Symptoms No obvious symptoms Carcinogenic to tissue following prolonged contact
First Aid Swallow water vomit Skin soap wash
Page 4 of4TABU 2 CHEMICAL TOXICITY AND OTHER INFORMATION
(continued)
NOTES
TLV - Threshold Unit Value ACC - Acceptable Ceiling Concentration STEL - Short Tera Exposure Limit
Suspected carcinogens teratogens or mutagens Firat Aid Unless specified flrat aid for oil of the liated cbeaicala are aa followa
Eyeai iaaedlatcly waab with copious quantity of cold water Skins Flush with water proaptly Breath Artificial respiration Swallowi Water voait
a Slight Hazard aa Hoderate Hasard aalaquo Extreme Hasard
Toxicity Ratiosa
Toxicity Rating
No toxicity (none) Material causes no hara in any condition or produces
tosic effects on buaana in very unusual circumstances or
in very large dosage
Slight toxicity (low)
Moderate toxicity
Severe toxicity
Persistence or each hazardous substance ia evaluated on its blodegradabllity aa follows
Assigned Value
Easily biodegradable coapounds 0
Straight chain hydrocprbons 1
Substituted and other ring compounds 2
Metals polycyclic coapounds and halogenated hydrocarbons 3
Adapted with modifications from EC Jordon Co RIFS Work Plan
TABLE 3 - PERSONNEL TRAINING AND MEDICAL MONITORING HEALTH AND SAFETY PLAN Field Sampling Plan OConnor Co Site Augusta Maine
personnel1
Robert E Stetkar
Joanne O Morin
Richard F Murdock
Benjamin Y Su
Joseph G Engeis
Steven R Lamb
Thomas S Bobowski
Boyd P Smith
Christopher L Covel
William J Haswell
Charles Blodgett
NOTES
ANNUALreg MEDICAL
MONITORING
yes
yes
yes
yes
yes
yes
yes
yes
yes
yes
yes
lt
y
OSHA 40shyHOURreg HAZMAT TRAINING
yes
yes
yes
yes
yes
yes
yes
yes
yes
yes
yes
ANNUALreg RESPIRATOR
FITTEST
yes
no
no
no
no
yes
yes
yes
es Yes
yltes
-y
CARDIOshyPULMONARY
FIRST AID RESUSCITATION TRAINING TRAINING
no no
yes yes
nov no
no no
no no
yes yes
yes yes
yes yes
yes yes
no no
yes yes
1 Only GEI personnel assigpedttfdo work on the OConnor site included on this list
2 Includes baseline and annual physicals lilood testing etc
3 In accordance with 29CFR191012tkncludes annual 8-hour refresher course
4 Includes annual respirator fit testing procedures
Project 90393 GEI Consultants Inc January 17 1991
TOW MAXARJM PCS CONCENTRATION (gtbullraquo) 8Y AREA
Central Maine Power Company Pre-Design Work Plans INTERPRETED CONTOURS Scale 1 inch = 180 feet Augusta Maine OConnor Site OF PGBs IN
Augusta Maine IN SURFICIAL SOILS From EC Jordon Co RIFS
Report dated June 1989 0 G E I C o n s u l t a n t s I n c Project 90393 January 1991 FigHS-2
Central Maine Power Company Pre-Design Work Plans DISTRIBUTION OF PAHs Scale 1 inch = 180 feet Augusta Maine OConnor Site IN SURFACE AND
Augusta Maine SUBSURFACE SOILS From EC Jordon Co RIFS
Report dated June 1989 0 G E I C o n s u l t a n t s I n c Project 90393 January 1991 FigHS-3
Central Maine Power Company Pre-Design Work Plans INTERPRETED DISTRIBUTION Scale 1 inch = 180 feet Augusta Maine OConnor Site OF LEAD IN SOILS
Augusta Maine From E C Jordon Co RIFS
Report dated June 1989 ltD G E I C o n s u l t a n t s I n c Project 90393 January 1991 FigHS-4
Central Maine Power Company Pre-Design Work Plans ANALYTICAL RESULTS FROM Scale 1 inch = 160 feet Augusta Maine OConnor Site SEDIMENT AND SURFACE
Augusta Maine WATER LOCATIONS From EC JOrdon Co RIFS lttgtReport dated June 1989 G E I C o n s u l t a n t s I n c Project 90393 January 1991 FigHS-5
Contamination 80 Feet
Control Line
Central Maine Power Company Pre-Design Work Plans SITE ACCESS AND Augusta Maine OConnor Site DECONTAMINATION
Revision 1 March 281991 Augusta Maine AREA
laquo G E I C o n s u l t a n t s I n c Project 90393 March 1991 KgHS-7
bull
Document Vol II SC SAP Appendix B Revision 0
Date January 17 1991 Page 1
APPENDIX B
FieldtogjL
FIELD LOGS
Project Field Log Book Equipment Calibration Logs
HNu Pl-101 MIE MINIRAM MARKSON CONDUCTIVITY METER MARKSON DIGITAL pHTEMPERATURE
Photograph Log Health and Safety QA Logs
Chain-of-Custody Forms Sample Assignment Forms Non-Conformance Report Forms Test Pit Log Forms Barn Sampling Forms Dexsil L-2000 PCB analyzer Calibration Boring Log Forms
lt
Document Vol II SC SAP Appendix B Revision 0
Date January 17 1991 Page 2
(OCONNORFL1)
(OCONNORFL2) (OCONNORFL3) (OCONNORFL4) (OCQNNORFL5) pound0CONNORFL6) (OCONNORFL7)
-(OCONNORFL9) (OCONNORFLIO) (OCONNORFL11) (OCONNORFL12) fOCONNORFL13) (OCONNORFL14) (OCONNORFL15)
Note Field Log OCONNORFLampisassigned to ground water sampling described in the Management of Migration Sampling andiAnalysis Plan
Document Vol II SC SAP Appendix B Revision 0
Date January 17 1991 Page 3
PROJECT LOGBOOKS (OCONNORFL1)
Serialized project logbooks are to be issued by the site contractor to all personnel at the site who have been designated to perform specific field tasks Individuals must sign their logbooks upon receipt and use them to record all pertinent information until the project is completed y
Logbook entries should be dated legible and contain accurate and inclusive documentation of an individuals project activities Because the logbook forms the basisfor the later written reports it must contain only facts and observations Entries made by individuals other than the person to whom the logbook was assigned are dated andsigned by the individual making the entry bull
CALIBRATION LOG Document No OCONNOR FT1 HNu Photoionization Device Model Pl-101 Page 1 of 1
Instrument Serial No
Lamp Date Span Setting Time Calibration Temperature User
Standard Introduced Meter Response (parts per million (ppm))
Comments (See Summary of Calibration Procedures attached7
X x
User Signature Date
Task Manager Signatures Date
CALIBRATION LOG Document No OCONNORFI3 MIE MINIRAM Hand-held Aerosol Monitor Page 1 of 1
Instrument
Serial No
Date
Time
User
Standard used (zero-bag)
Meter Display
Comments
User Signature lt Date X
Task Manager Signature l Date
CALIBRATION LOG Document No OCONNORFL4 Markson Conductivity Meter Model 103 Page 1 of 1
Instrument Serial No
Date Time User
Standard Used_ Meter Display^
Comments
s
v
lt
y xy ^y
User Signature Date z V
Task Manager Signature ) i Date
CALIBRATION LOG Document No OCONNORFU5 Markson Digital pHtemperature Meter Model 95 Page 1 of 1
Instrument Serial No
Date Time User
Temperature check vs mercury thermometer
Probe reading Thermometer reading
Upon completion of calibration procedure does pH probe checkout vs pH 40 buffer Reading bull lt x pH 70 buffer Reading bull
Comments v
X x
User Signature X^ Date
Task Manager Signature Date
Document No QCONNORFT f
Page
PHOTOGRAPH LOG
Project Name
Project No
Camera and Film Specifications
FILM
ROLL FRAME
DATE nTIME PHOTOGRAPHER PHOTO NUMBER
DESCRIPTION
lt3
ni
I X
V
V
gt
Document No QOONNORm7
HEALTH amp SAFETY QUALITY ASSURANCE CHECKLIST
Page 1 of 2 Project No Site Date Completed by
A On-site Operations During Hazardous Waste Site Investigations
yes no Team understands task procedures safety plan individual roles and site history contaminants
yes no Team knowledgeable to hospital route nearest phone location and who is responsible for health and safety on site
yes no Establishment of command post and decon station with Health amp Safety Plan readily available
yes no Establish communication or line-of-site maintained
yes no Field operations conformed environmental monitoring respiratory protection or emergency response
yes no Protective clothing and respiratory protection maintained
yes no Decontamination procedures performed on the following sample containers sampling equipment and personnel
yes no Equipment protected clean calibrated and being used properly by site personnel
yes no First Aid Equipment readily available at site with checklist and eye wash
yes no Site personnel trained in CPR and First Aid
yes no Site Records maintained such as field logbooks respirator usage log incident reports in place and up-to-date and any deviations or modifications to Safety Plan
GEI Consultants Inc
uocutrenc uujmutvrLz
HEALTH amp SAFETY QUALITY ASSURANCE CHECKLIST
Page 2 of 2 Project No Site Date Completed by
B Health amp Safety Follow-up Reports
o Adherence to procedures o Accidents o Unsafe practices or conditions o Results of environmental monitoring o Corrective action
GEI Consultants Inc
Document No Q00NN0RFL9 CHAIN OF CUSTODY RECORD
DOCUMENT NUMBFR rn tLORD
RELINQUISHED DYISiONruRE OATETJMD RECEIVED DY (SIGNATURE) RELINQUISHED DY (SIOHATURER DATETI^IE RECEIVED BY (SIGNATURE)
IIElINOUISIIEO BY(SIGNATURE) DATETIMf DATETIME gt REMARKS lcNAruDn^nLADOnATonvorI
P a g e o f
Document No OCONNORFLIO
Page of G E I C o n s u l t a n t s I n c
Project No
Project Name _
Laboratory Contact
Sampler ( s ) Date Assigned Date Sampled
GEI Sample No
Sample Medium
Quantity
Sample Container
Type
Analyses Requested Remarks
Special Instructions Remarks
Document No 0CQNNDRFL11
NONCONFORMANCE REPORT
Project Project No
Auditor Audit Date Finding No
FINDING
Where found Check Lit Item
ControllingDocument Section
Task Description
Noncenformanee
Discussed with
Recommended Corrective Action
Is system correction needed to prevent recurrence Yes No If yes state recommended action
Schedule Completion Date By
CORRECTION ACTION
Correction Action by Date
QA Approval of Correction Action by Date
Date Completed Submitted by
Correction Action Verified by Date
I T E S T P I T L O G QCONNORFL12
PROJECT
LOCATIONI CLIENT
CONTRACTOR EQUIPMENTI OBSERVED BY
I DEPTH BELOW
GROUND SURFACE
I (FT)
I
I
I
1
1
1
1
I
1 REMARKS
PROJECT NO
LOCATION
GROUND EL
DATE DATUM
SOIL DESCRIPTION
PIT DIMENSIONS (FT) LENGTH WIDTH DEPTH
ltJgt G E I 1
I Docuaent No 0C0NNCRFL13
bull GEI CONSULTANTS IMC 53 Regional Drive Concord New Hampshire 03301-8500 (603)224-7979
BARN SAMPLING FORM Serial I
PROJECT INFORMATION
Project Name Source Control Pre-Oesion Studies
I Site Name(if different) OConnor Co site
Project Number
I Analytical Lab(s) ERCO EPA
GEI GC screen Other(Specify)
I METHOD OF SAMPLING
WIPE SAMPLING OF HON-POROUS SURFACES
I U000EH UALL SAMPLING UITH DRILL BIT
OUSTSOIL SAMPLING OH FLOOR SLAB
( CONCRETE SAMPLIHG ITH MORTAR BIT
(OTHER-Explain)
I
DESCRIPTION OF SAMPLE
Brief Description of Type of Material or Item Sampled
Visible Staining NO Visible Staining
Approximate Area of Stain(if any) X
LOCATION OF SAMPLE
Ground Floor Second Floor Loft
(All Measurements in Feet to 010 Foot)
Distance Along Z Axis from Reference Origin
Distance Along M Axis from Reference Origin
Height of Sample Above Floor Slab
SKETCH IN APPROXIMATE HORIZONTAL LOCATION OF THE SAMPLE COLLECTED ON FIGURE BELOU
I UALL X
I
I
UALL U UALL Y
I
I Reference Origin UALL Z
I Approximate Scale 1 inchbull 15 feet
I Sample I0(s) SIGNATURE OF SAMPLER CERTIFIES ABOVE SAMPLING RECORD
Date Time
I Sampler(s) COC Docunent Signature Date
I
CALIBRATION LOG Document No OCONNOR FL14 Dexsil L-2000 PCB Analyzer Page 1 of 1
Instrument
Serial No
Date
Time
User
Ambient Temperature deg C
Standard used (50 ppm chloride)
Reading beforeadjustingCALIBRATE knob
Reading after adjusting CALIBRATE knob
Comments
User Signature Date
Task Manager Signature Date
Document No OCONNORFL15 I BORING LOCATION DATE START FINISH
GROUND ELEVATION (NGVO ) DRILLED BY
GROUNDWATER El DATE LOGGED BY TOTAL DEPTH (FT) PG OF
I EL DEPTH S A M P L E
Its TYPE BLOWS PEN REC R E M A R K S QO SOIL ANO ROCK DESCRIPTIONSlt_land PER aFT FT NO 6 IN IN IN lt9
I
I
I
I
I
1
1
I
1
I
I
I
I
I
I BLOWS PER (-140IBHAMMER FALUNS 30T0 DRIVE NOTES A 20 IN 00 SPLIT SPOON SAMPLER
PEN-PENETRATION LENGTH OF SAMPLER OR CORE BARREL REC-RECOVERY LENOTH OF SAMPLE ROO-LENOTM OF SOUND CORES gt4INLENSTH COREO S-SPLIT SPOON SAMPLE PROJECT
I U-UNOtSTURBCO SAMPLES UF-FIXEO PISTON _ UO-OSTER8ERO bully OROUNOWATER 0 G E I
I
I
I
I
I
I
I
I
I
1 1 1 1 1 1 1 I 1 1 I
Document VoL H SC SAP Appendix C Revision 0
Date January 17 1991 Page 1
APPENDIX C
EQUIPMENT CALIBRATION PROCEDURES
Document Vol II SC SAP Appendix C Revision 0
Date January 171991 Page 2
HNu PI-101
The HNu PI-101 is factory calibrated twice a year andor if the instrument is malfunctioning Prior to field use and at the end of each day the user of the instrument will check that the instrument is still holding calibration using the following procedures
1 Prior to the calibration check check the instrument with an Organic point source (ie magic marker) prior to use to verify that it is functioning
2 Connect the rubber sampling hose from the span gas cylinder regulator to the sampling
probe of the HNu gt
3 Fully open the regulator valve gt vy
4 Note the instrument meter response after 5 to 10 Seconds y
5 If the response deviates + 15 from the coneentration of the calibration gas (this figure appears on the cylinder label) the instruihehtTeq^es factory maintenance and will not be utilized in the field until factory calibratiori^Tah alternate meter will be used after calibration checking v (
V 6 Document the calibration information Oik the appropriate equipment calibration log
(OCONNORFL2) ~y
Document VoL IISC SAP Appendix C Revision 0
Date January 17 1991 Page 3
MIE MINIRAM Model PDM-3
The MINIRAM will be factory calibrated once a year andor if the instrument is malfunctioning Prior to field use and at the end of each day the user will zero the instrument using the following procedure
1 With the MINIRAM off insert MINIRAM into Zerobag andseal the Zerobag
2 Inflate Zerobag with filtered air containing no particulates using-attached hand pumpx- V
S
3 Press ZERO button on MINIRAM and wait 30 seconds MINIRAMshould read OFF
4 Pull MINIRAM out of Zerobag
5 Press MEAS button and wait 60 seconds for MINIRAM to go through self-tests
6 The MINIRAM is now functioning and wilJLtake-readings every 10 seconds
7 Document the calibration information onthe appropriate equipment calibration log (OCONNORFL3) V
lt
v
Document VoL II SC SAP Appendix C Revision 0
Date January 171991 Page 4
MARKSON DIGITAL MODEL 103 CONDUCTIVITY METER
The Markson Conductivity meter will be calibrated prior to and following each days field use using the following procedures
1 Rinse the conductivity probe with distilled water gt
2 Pour enough Cole-Parmer conductivity calibration solution (1413 xS 25degC) in a clean plastic Ziploc bag to be able to completely immerse the conductivity probe
3 Immerse the conductivity probe in the standard solution and shakdTree any bubbles that may cling to the cell
4 Allow about 1 minute for the cell to reach equilibrium temperature x X
5 Set the cell adjust control at the bottom of the meter to display the value of 141
6 Carefully rinse cell with water after calibration and after each use V~
7 Document the calibration process onjlie equipment calibration log (OCONNORFL4)
Document VoL H SC SAP Appendix C Revision 0
Date January 17 1991 Page 5
MARKSON MODEL 95
Combined Digital pHtemperature Meter
The Markson 95 combined digital pHtemperature meter will be calibrated prior to and following each days field use using the following procedures
1 Insert electrode into digital meter The reference pin should also be properly connected Temperature probe should be plugged all the way into the ATC jack
2 Remove protective cap and push rubber sleeve such that the potassium chloride filling hole is exposed gt
3 Rinse both pH and temperature probe in distilled water 4 Immerse both pH and temperature probe into buffer 700 solution 5 Set FUNCTION switch to TEMPERATURE to read temperature 6 Set FUNCTION switch to ATC and adjust the readout to the pH value of buffer 700 corresponding
to the temperature measured in E with the CALIBRATE control See Chart 1 7 Rinse electrode and temperature probe withdistilled water 8 Immerse both pH and temperature probe into buffer^401 9 Repeat E V ~ 10 Set the FUNCTION switch to ATC and adjust the readout to the pH value of the buffer 401
corresponding to the temperature measured in Iwith the SLOPE control See Chart 1 11 Rinse the electrodes and temperatureprobe-with distilled water Model 95 is calibrated and ready
for use 12 Document the calibration process on the equipment calibration log (OCONNORFL5)
^ CHART
Temp (C) Buffer Solution 70 X -X
Buffer Solution 40
5 y 700 401 10 708 399 15 706 399 20 703 399 25 701 399 30 700 400 35 699 401 40 698 402 50 698 403 60 697 405
Document VoL II SC SAP Appendix C Revision 0
Date January 171991 Page 6
Dexsil Model L-2009 PCB Analyzer
The Dexsil PCB Analyzer will be calibrated prior to each days field use using the following procedures
Initial Preparation
1 The electrode must be filled with Orion filling solution before it is operational Fill the electrode up to the hole in the side of the epoxy body by-placing the nozzle of the filling solution in the hole and squeezing the bottle 7
2 Drain the electrode while holding it upright over thewaste beaker Grasp the epoxy body firmly in one hand and push down on the white cap which is connected to the cord The solution will then drain out of the bottom of the electrode
Vgt 3 Refill the electrode and check to makesure that the liquid is making contact between the black
cone and the plastic shell at the bottom of theelectrode If it is not making contact at all points drain the electrode again and refill
4 Plug the electrode into the back of the L-200Qj)laeeJt in a vial or rinse solution and turn the instrument on Switch the analysis knobtdfnVand wait a few minutes until the reading stabilizes
Calibration O Imdash^
1 Fill a vial about half way with 50 parts per million calibration solution
2 Turn the analysis selectQrJcnob to CAL
3 Remove the electrode from the rinse solution dry it carefully with a tissue and place it in the calibration solution SWiri the electrode gently for a few seconds and then stop Push the start button on the instrument^
4 When the READ light comes on adjust the CAL knob so that the instrument reads 50
5 Remove the electrode from the calibration solution wipe it dry and place in the rinse solution
6 If this is the first calibration since the instrument has been turned on or since the electrode has been filled repeat steps 34 and 5
7 Document the calibration information on the appropriate equipment Calibration Log (OCONNORFL14)
Document Vol II SC SAP Appendix D Revision 0
Date January 17 1991 Page 1
APPENDIX D X
list of Acronyms
Document Vol II SC SAP Appendix D Revision 0
Date January 17 1991 Page 2
ACRONYMS
ASTM American Society for Testing and Materials CLP Contract Laboratory Program CMP Central Maine Power Company DEP Department of Environmental Protection (Maine) DQO Data Quality Objectives EPA Environmental Protection Agency [US) FL Field Log FSP Field Sampling Plan ltys GEI GEI Consultants Inc gt HSP Health and Safety Plan X
MIE Monitoring Instrumentsforthe Environment MOM Management of Migration NA Not Applicable X lt OSHA Occupational Safety anaHeakh Administration OSWER Officer of SolithWaste and Emergency Response PCB PolychlorinatecFBiphenyk ppb Parts per billion v7 ppm Parts per million QA QuaUtyAssuranck ) QAO QudU$~^sitraquoance Officer QAPP QualityAssurance Project Plan QC Qukkty Gontrof PIP -Thotoionization Detector RDRA -mdashRemedial DesignRemedial Action RI Remedial Investigation ROD x^XRecbrd of Decision RPD X^Relative Percent Difference RPM Remedial Project Manager RSD Relative Standard Deviation SAP Sampling and Analysis Plan SC Source Control SOW Statement of Work TPH Total Petroleum Hydrocarbons VOC Volatile Organic Chemical or Compound
Document Vol II SC SAP Revision 0
Date January 17 1991 Page 7
In the ROD EPA set soil cleanup standards for the site of 1ppm PCBs 1ppm cPAHs and 248 ppm lead The cleanup standards for barn materials were not specified in the ROD by EPA However the ROD specified that the barn would undergo decontamination procedure if contamination was present above cleanup standards (to be determined) through collection of soil dust and other loose material and these materials would be combined with the other contaminated soils and sediments for on-site solvent extraction treatment Large scrap items in the barn would then be removed for disposal off-site and the barn structure would be sampled for detection of the presence of contamination Following sampling and analysis of the barn structure the barn would be demolished and transported to an off-site facility for appropriate disposal ^gt
N
Document Vol II SC SAP Revision 0
Date January 17 1991 Page 8
2 SAMPLING AND DATA QUALITY OBJECTIVES
21 General
Sampling of soils surface water sediments and the on-site barn and its contents will be performed during the Source Control (SC) component of the Pre-Design Study Pre-Design SC sampling results will be used in the design of the SourceControl component of the remedy and development of the treatability testing program for soil and sediment
Pre-Design SC sampling will include N
Collection of surface water samples from the Upland Marsh and Upper and Lower Lagoons in April 1991 V
x
Collection of sediment samples from the Upland Marslkahd Upper and Lower Lagoons in April 1991 ^
Collection of soil samples from test pits and^Orihgsrin April 1991
bull Collection of samples of soil woodimckconcrete from the on-site barn floor and Walls and wipe samples from debris andlquipment located within the barn in May 1991
V-X7EPAs guidance document Data Quality Objectives for Remedial Response Activities (OSWER Directive 93550-78Jdarch 1987) identifies four analytical levels
Level I - field screeningoranalysis using portable instruments Results are often not compound specific and o^ qualitative in nature
Level II - field analyses using mbresophisticated portable analytical instruments Results are more reliable in terms of compound identification and may be semi-quantitative
Level El - laboratory analyses by established referenced methods Results are quantitative and compound specific
Level TV - EPA Contract Laboratory Program (CLP) services utilizing rigorous QAQC protocols and documentation
Level V - Laboratory analyses by non-standard methods Identified in the CLP asspecial analytical services
Document Vol II SC SAP Revision 1
Date March 28 1991 Page 9
A combination of Level I Level in and Level IV analytical protocols will be specified during Pre-Design SC sampling EPA Contract Laboratory Program (CLP) protocols prescribed in the 1988 Organic and Inorganic Statement of Works will be utilized for laboratory analysis of target compounds (PCBs cPAHs lead and aluminum) in surface water sediment soil and barn samples The analytical protocols that will be utilized for Pre-Design SC sampling are detailed in the SC Quality Assurance Project Plan (QAPP) included as Volume I of the SC SAP
22 Soils
Soil samples will be collected and analyzed to provide additional data for comparison with cleanup standards for design of the Source Control program at the OConnor Site Data will be used to refine the previously estimated volume of soils contaminated at various concentrations above the cleanup standards and to provide additional information at areas with apparent data gaps on the lateral and vertical extent of soil with PCB concentrations greater than 1 ppm Soil also will be collected at specified locations to provide samples for solvent extraction treatability bench-scale testing Samples selected for treatability testing will contain PCBs at concentrations previously not examined during limited bench-scale testing performed during the Feasibility Study (FS) The effectiveness of solvent extraction on removal of lead cPAH and PCB contamination will be examined during the bench-scale treatability studies performed during Pre-Design
The soil sampling program performed during the RI was designed to estimate the horizontal and vertical distribution of soils contaminated with PCBs lead and cPAHs above the cleanup standards The distribution of PCBs lead and cPAHs are summarized in the RI on Figures 4-8 4-10 and 1-10 respectively GEI identified several inconsistencies in the distribution of contaminated soils within the summary figures For instance the distributions of PCB contamination shown on Figures 1-6 and 4-8 in the RI in the northern portion of the site near TWA III do not agree Also previous soil sampling did not consistently confirm the horizontal and vertical limits of PCB contamination The vertical limits of the PCB contaminationwere not adequately identified for remedial design purposes near transformer work areas and along drainage pathways where PCB migration has occurred
The effectiveness of solvent extraction as the selected remedy for treating the on-site soils was not fully demonstrated during the FS The bench-scale testing that was performed during the FS did not investigate the full range of contamination levels and recovery efficiencies from different soil types that exist on the site
There are three primary objectives for collection of soil quality data during the Pre-Design studies
Document Vol II SG SAP Revision 1
Date March 28 1991 Page 10
1 Collect additional data with close control of analytical precision to evaluate datagaps and inconsistencies reported during the RI The collection of these data will primarily be performed near TWAs and drainage pathways
2 Refine the previously estimated volume of soils contaminated at various concentrations above the cleanup standards
3 Evaluate theselected remedy of solvent extraction through bench-scale testingof soils with specific ranges of PCB concentrations
All soil samples collected for treatability bench-scale testing will also have an aliquot collected for PCB analyses by Ceimic Corporation of Narragansett Rhode Island This will provide added confidence that designated samples are within the specified ranges of PCB concentrations for solvent extraction bench-scale testing
In order to facilitate comparison of Pre-Design Study soil quality with RI study soil quality rigorous QAQC protocols and documentation will be needed All sampleswill be analyzed by Ceimic Corporation using 1988 CLP protocols Analytical Level IV (CLP QAQC and documentation) will be utilized on 20 percent of the soil samples collected The remaining 80 percent will be analyzed according to 1988 CLP protocols utilizing Analytical Level III (CLP QAQC butwithout CLPdocumentation) These serviceswill provide detection limits at or below the ROD Cleanup Standards
During Pre-Design sampling equipment blanks will be collected and analyzed after decontamination of sampling equipment to identify artifact contamination that could result from incomplete decontamination of equipment Trip blanks will also be included during sample shipment to identify cross-contamination during transportation to Ceimic Corporation The laboratory and field QAQC procedures described above will enable the precision required to satisfy the objectives of the soil sampling component of this study
23 Sediments
Sediment samples will be collected and analyzed to provide additional data for comparison with the cleanup standards for design of the Source Control program at the OConnor site Data will be used to supplement the sediment quality data previously collected in the RI for a refined estimate of the levels of lead cPAH and PCB contamination in the sediments of the Upland Marsh Upper Lagoon and Lower Lagoon In addition a composite sediment sample from the Upper Lagoon and a composite sediment sample from the Lower Lagoon will be collected for solvent extraction treatability bench-scale testing Treatability testing on contaminated sediments was not performed during the FS The effectiveness of solvent extraction on removal of lead cPAHs and PCBs from sediments will be examined during the bench-scale treatability studies performed during Pre-Design
Document Vol II SC SAP Revision 1
Date March 28 1991 Page 11
The sediment quality data collected during the RI was limited Only two sediment samples were collected from the Upland Marsh Upper Lagoon and Lower Lagoon In addition limited data have been previously collected regarding the volume of contaminated sediment on-site
There are three primary objectives for sediment quality data to be collected during Pre-Design studies
1 Collect additional data with close control of analytical precision to examine levels of contamination in sediment at locations previously not investigated This will include two additional samples from the Upper Lagoon two additional samples from the Lower Lagoon and six additionalsamples from the Upland Marsh The investigation in the Upland Marsh will be directed towards delineating the extent of contamination in the westerly (upstream) direction
2 Refine the previously estimated volume of sediment in the Upland Marsh Upper Lagoon and Lower Lagoon
3 Evaluate the solvent extraction remedy effectiveness on treatment of sediment through bench-scale testing
In order to facilitate comparison of Pre-Design Study sediment quality with RI study sediment quality rigorous QAQC protocols and documentation will be needed Only sediment samples containing greater than 30 percent solids (based on visual observations) will be submitted for analysis After sample collection in the field percent volume of settled sediment in the sample container will be compared to the percent volume of free water Samples will be submitted to the laboratory for analysis if the volume of settled sediment in the sample container exceeds 50 percent of the total volume of the sample All samples will be analyzed by Ceimic Corporation of Narragansett Rhode Island following 1988 CLP protocols Analytical Level IV (CLP QAQC and documentation) will be performed by Ceimic on 20 percent of the sediment samples collected The remaining 80 percent will be analyzed by Ceimic utilizing Analytical Level in (CLP QAQC but without CLP documentation) These services will provide the detection limits at or below the ROD Cleanup Standards
During Pre-Design sampling equipment blanks will be collected and analyzed after decontamination of sampling equipment to identify artifact contamination that could result from incomplete decontamination of equipment Trip blanks will also be included during sample shipment to identify cross-contamination during transportation to Ceimic
The laboratory and field QAQC procedures described above will enable the precision required to satisfy the objectives of the sediment sampling component of this study
Document Vol II SC SAP Revision 1
Date March 28 1991 Page 12
24 Surface Water
The OConnor SiteStatement of Work for Remedial DesignRemedial Action requires that surface water contained within the Upper and Lower Lagoon and in the Upland Marsh be drained collected and transported off-sitefor treatment unlessotherwise instructed by EPA
The three primary objectives for surface water data to be collected during the Pre-Design Studies are to
1 Probe surface water depths in Lagoons and Upland Marsh to obtain a better estimate of surface Water volumes to be handled during remediation
2 Evaluate changes in surface water quality that may have occurred during the approximately three-year period since sampling during the RI and evaluate extent of surface water contamination in the Upland Marsh which is at the upstream edge of the PGB contamination area
3 Collect additional data to design an appropriate program for surface water diversion pumping treatment and disposal Off-site disposal destinations as well as on-site treatment and disposal options will be examined in more detail during the Pre-Design Study
All surface water samples will be submitted to Ceimic Corporation for analysis of PCBs aluminum and lead All of these samples will be analyzed following 1988 CLP protocols including CLP QAQC and CLP documentation (Analytical Level IV) One additional sample will be collected from each surface water body and submitted to Ceimic for Total Suspended Solids Analysis (EPA Method 1602) utilizing Analytical Level III
2JS Barn
The available data for the extent of contamination of barn materials consists of one sample point The surficial soil sample collected was not described such that it is known whether the sample consisted of dust the concrete slab soil within cracks of the slab or debris samples within the barn The elevated levels of PCBs and lead within the sample may not be representative of the majority of the loose materials within the barn Furthermore no wipe sampling on non-porous debris or sampling of the wooden barn structure was performed during the RI
Document Vol II SC SAP Revision 0
Date January 17 1991 Page 13
Cleanup standards for target chemicals listed in the ROD have not yet been established by EPA for barn materials The ROD indicates that the Toxic Substance Control Act (TSCA) Spill Cleanup Policy and Disposal Regulations (40 CFR Part 761) may be used in lieu of site-specific determination of acceptable levels
Samples of selected media within the barn will be collected and analyzed to provide an initial data set to establish the degree of contamination present within the barn Data will be used in developing the work plan for decontamination and demolition of the barn and to determine appropriate disposal sites for barn demolition debriSNand loose debris within the barn Depending on data results an evaluation will be made tbvdetermine whether additional sampling will be required prior to demolition to betterseqnence demolition activities so that PCB-contaminated material can beSeparated from non-contaminated building materials and debris
ltx All soil wood and concrete barnsamples will besubmitted to Ceimic Corporation (Ceimic) of Narragansett Rhode Island for analysis of PCBs cPAHsgtand lead Wipe samples of debris will be submitted to Ceimic for analySis-ofPCBs All samples will be analyzed following CLP protocols Analytical LeveK IV-requiring CLP QAQC and reporting requirements will be utilized for 20 percent of the5amples Analytical Level in utilizing CLP analytical protocols but without the documentation requirements of CLP will be specified for the remainder of the
Document Vol II SC SAP Revision 0
Date January 17 1991 Page 14
3 HEALTH AND SAFETY
A Health and Safety Plan for the Source Control Field Sampling Plan is presented in Appendix A All personnel involved in the sampling program have been trained in accordance with the requirements of the Occupational Safety and Health Administration Regulation OSHA 1910120 Hazardous Operations and Emergency Response and are enrolled in a comprehensive medical monitoring program
A list of personnel authorized to perform work on this project ^and listing of their participation in personnel training and health monitoring programs^arepresented in the Health and Safety Plan gt
Document Vol II SC SAP Revision 1
Date March 28 1991 Page 15
4 SAMPLING LOCATION AND FREQUENCY
41 Soils
411 General
In general the soil sampling program includes collection of the following two basic categories of samples
1 Soil samples collected from test pits for possible bench-scale testing and
2 Soil samples collected from test pits and borings to fill data gaps on the lateral and vertical extent of soil contamination above cleanup standards and to refine estimates of the quantity of contaminated soils
Figure 3 shows the locations of test pits and borings planned for this investigation These locations were based on the depth delineation of 1 ppm for Total PCBs presented in the Remedial Investigation Table 1provides ageneral sampling rationale including test pit and boring identification numbers target sampling depth and elevation anticipated PCB concentration level and soil type A summary of the analyses to be performed on soil samples including replicates and blanks is shown in Table 2
A total of 12 soil samples for possible bench-scale testing will be collected from test pits during April 1991 Two samples of each soil type indicated below will be collected within the specified ranges of PCB concentrations Each sample will have a minimum volume of about 05 cubic feet (about 60 lb weight) to provide sufficient soil for bench-scale testing
PCB Concentration Range fppml Soil Types
1 to 10 Clay and Fill 10 to 20 Clay 20 to 50 Clay 50 to 500 Clay and FiU
During the RI three soil samples were collected for bench-scale treatability testing with initial PCB concentrations of 1000 4000 and 22000 ppm However sample locations had been selected to obtain samples with PCB concentrations in the range of 250 to 700 ppm based on PCB concentration contours developed during the RI
Document Vol II SC SAP Revision 1
Date March 28 1991 Page 16
Therefore PCB concentration contours developed from the RI data do not precisely indicate the extent and level of contamination
In order to gain a higher degree of confidence that samples within each specific PCB concentration range have been collected GEI will perform field PCB screening with a Dexsil L-2000 PCB analyzer to estimate the soil PCB concentration range prior to collecting the soilsample Aliquots of the 12 bench-scale soilsamples will be collected for confirmatory testing for PCB concentrations by Ceimic of Narragansett Rhode Island utilizing 1988 CLP protocols
GEI will select the soil samples for bench-scale testing after receiving the CLP laboratory results of the PCB concentrations If the laboratory data do not indicate that at least one of the two soil samples was collected from the targeted concentration ranges and soil types an additional contingency round of soil sampling may occur Sampling locations for this contingency sampling round will be selected based Upon the PCB data summarized in the RI and the data collected by GEI during the previous SC sampling round
A total of 40 soil samples (including replicates) will be collected from test pits and borings during April 1991 to fill data gaps on the extent and quantity of contaminated soil The soil sampleswill be collected at the approximate elevation specified for each sampling location as indicated in Table 1 Sample elevations of the bench-scale samples may vary if PCB concentrations in samples screened with the Dexsil L-2000 PCB analyzer are not within the ranges indicated below
Acceptable Screening Target PCB Concentrations Range PCB Concentration Range
(ppm) (ppm)
1 to 10 1 to 10 10 to 20 10 to 20 20 to 50 25 to 45
50 to 500 200 to 350
The soil samples will be analyzed for PCBs ePAHs and lead by Ceimic of Narragansett Rhode Island utilizing CLP protocols Four soil samples (including two selected for bench-scale treatability testing) will also be analyzed for total organic carbon (TOC) cation exchange capacity (CEC) and pH
Document Vol II SC SAP Revision 1
Date March 28 1991 Page 17
Detailed descriptions of the soil sampling and decontamination methods are provided in Section 5 Appendix A and the QAPP Contractors will be used for surveying performance of test pits and drilling of borings All contractors will be required to document that they have completed health and safety training that complies with OSHA Standard 1910120 In generalstakes marking the planned locationsof test pits will be surveyed by a registered surveyor prior to test pit excavation The Stakes will serve as temporary bench marks for reference during location of test pit samples A rubber-tired type backhoe will be used to excavate test pits for planned sampling locations less than or equal to5 feet below ground surface The backhoe and operator will be supplied by HE Sargent Inc of Lewiston Maine capable of operating at hazardous waste sites under Level C personnel protection Soil samples will be collected from in-situ test pit excavations by GEI personnel using a stainless steel shovel or trowel
Due to anticipated shallow ground water conditions a drill rig will be used to advance test borings for soil sampling at locations where the target sampling location is greater than 5 feet below ground surface The soil samples will be collected using a split-spoon sampler Drilling and sampling will be performed by Northeast Diamond Drilling Company of Union Maine capable of working on hazardouswaste sites under Level C personnel protection
412 Soil Analysis Program
Analytical procedures are identified in the Quality Assurance Project Plan (QAPP) The samples will be analyzed using 1988 CLP methods for PCB cPAHs and lead by Ceimic of Narragansett Rhode Island EPA methods 9045 9060 and 9080 will be used to analyze soils for pH TOC and CEC respectively A summary of the analyses to be performed on soil samples including replicates and blanks is shown in Table 2 Samples will be collected in I-Chem glassware or equivalent and stored at 4 deg C as described in Section 6
A series of quality control blanks (replicates and blanks) will be collected by GEI and analyzed by the laboratory to aid in data assessment as discussed in the Quality Assurance Project Plan (QAPP) All quality control samples will be labelled with false sample identification as shown in Table 2 in order to avoid laboratory bias
Sampling equipment blanks and aqueous trip blanks will be submitted for every ten soil samples during the sampling program to check for the presence of cross-contamination These will provide a quality control check for decontamination and handling practices The trip blanks will contain laboratory-supplied organic-free water and will accompany the shipment of soil samples during storage and shipment The trip blanks will be analyzed for PCBs (sample identification will be TP26-TP29) Wipe
Document Vol II SC SAP Revision 1
Date March 28 1991 Page 18
samples will be collected from the shovel or hand trowel and split-spoon sampler (sample identification numbers TP30-TP33 and TP34-TP37 respectively) after decontamination and will be analyzed for PCBs Wipe sampling procedures are described as part of barn sampling procedures in Section 562 One replicate sample will be collected for every ten soil samples Replicate sample locations and identification numbers are indicated on Table 2
413 Soil Sample Designation
Each piece of soil sample glassware will be affixed with a self-sticking adhesive label Each label will be completed with an indelible marker to contain the following information
GEI Consultants Inc Site Name Project Number Sampling Date and Time Sample Number Samplers Initials Analysis Requested
The sample number is composed of a series of information to identify the sample as unique to the sampling point and sampling event The sample number labelled in the field and referred to on all associated documents is composed of the following
Matrix Project Sampling Location Sample Number
Soil - 90393 -TP2-SS1
The example sample number above indicates that soil sample SSI was collected from Test Pit No 2 under project number 90393
4JZ Sediment
431 General
Sediment samples will be collected by GEI from the Upland Marsh the Upper Lagoon and the Lower Lagoon during April 1991 A summary of the laboratory analyses of sediment samples is listed on Table 3 Procedures for sampling and equipment decontamination are provided in Section 5 Appendix A and the QAPP
Document Vol II SC SAP Revision 1
Date March 28 1991 Page 19
In general the sediment sampling program includes collection of the following two basic categories of samples
1 Two composite sediment samples collected using a clam-shell sampler for bench-scale testing
2 Eleven sediment samples (including one replicate) collected with a tube sediment sampler to provide additional data on sediment quality and for estimating the quantity of contaminated sediments
The two composite sediment samples collected using a clam-shell type sampler for bench-scale testing will be collected within the Upper Lagoon and Lower Lagoon at the locations shown on Figure 4 Based on the data in the RI the Upper Lagoon contained the higher sediment concentrations of PCBs
The eleven sediment samples collected to provide additional data on sediment quality and for estimating the quantity of sediments will be collected at the locations shown on Figure 4 As shown on the figure six sediment sampling locations were chosen for the Upland Marsh two locations were chosen for the Upper Lagoon and two locations for the Lower Lagoon
Detailed descriptions of the methods and equipment to be used during the sampling program are provided in Section 5 In general a temporary reference bench mark will be surveyed and staked adjacent to each surface water body by a surveyor licensed in the State of Maine and OSHA-approved for working on a hazardous waste site The actual sediment sampling locations will be measured by tape and compass bearings from the reference bench mark prior to sampling For the bench-scale sample a 5shygallon sample container will be filled with sediment from the dredge type sample The samples for providing additional data on sediment PCB concentrations will be collected with a tubesediment sampler pushed into the complete thickness of sediment at the sampling location All sampling equipment will be decontaminated using methanol and distilled water rinses before each use
4SL2 Sediment Analysis Program
Analytical procedures are identified in the Quality Assurance Project Plan (QAPP) Sediment samples will be submitted to Ceimic of Narragansett Rhode Island for laboratory analysis utilizing CLP protocols The samples collected for bench-scale testing will be analyzed for PCBs The remainder of the sediment samples will be analyzed for PCBs cPAHs and lead One sediment sample will also be analyzed for total organic carbon (TOC) cation exchange capacity (CEC) and pH by EPA methods 9060 9080 and 9045 respectively A summary of analyses to be performed on
Document Vol II SC SAP Revision 1
Date March 28 1991 Page 20
sediment samples including replicates and blanks is shown in Table 3 Samples will be collected in I-Chem glassware or equivalent and stored at 4degC as described in Section 6
A series of quality control samples (replicates and blanks) Will be collected by GEI and analyzed by the laboratory to aid in data assessment as discussed in the Quality Assurance Project Plan (QAPP) All qualitycontrol samples will be labelled withfalse sample identification as shown in Table 3 in order to avoid laboratory bias
Two sampling equipment blanks and one aqueous trip blank will be submitted during the sampling program to check for the presence of cross-contamination These will provide a quality control check for decontamination and sample handling practices The trip blank containing laboratory-supplied organic free water will accompany the shipment of sediment samples and will be analyzed for PCBs (Sample ID SED7) Wipe samples will be collected from the tube sediment sampler and dredge sampler after decontamination and will be analyzed for PCBs (sample identification numbers SED9 and SED8 respectively) Wipe sampling procedures are described as part of barn sampling procedures in Section 562 One replicate sample will be collected during sediment sampling Replicate sample location and identification is indicated on Table 3
423 Sediment Sample Designation
Each piece of sediment sample glassware will be affixed with a self-sticking adhesive label Each label will be completed with an indelible marker to contain the following information
GEI Consultants Inc Site Name Project Number Sampling Date and Time Sample Number Samplers Initials Analysis Requested
The sample number is composed of a series of information to identify the sample as unique to the sampling point and sampling event The sample number labelled in the field and referred to on all associated documents is composed of the following
Matrix Project Surface Water Body Sample Location
SED - 90393 - UM - SED1
Document Vol II SC SAP Revision 1
Date March 28 1991 Page 21
The example sample was obtained from sample location SED1 in the Upland Marsh under project number 90393 The surface water body designations for the Upper Lagoon and the Lower Lagoon will be UL and LL respectively
43 Surface Water
431 General
Surface water quality data consisting of two samples each from the Upland Marsh Upper Lagoon and the Lower Lagoon will be collected by GEI in April 1991 Sampling locations are shown on Figure 4 Surface water sampling locations will be determined in the field by tape and compass bearings from the temporary reference bench mark established for sediment sampling A summary of the analyses to be performed on surface water samples including duplicates and blanks is shown on Table 4 Detailed descriptions of the sampling methods to be used during surface water sampling are provided in Section 5 In general the depth of the water at the sampling location will be measured at each sampling location with a weighted tape measure prior to collecting the surface water sample A water sample will be collected after lowering a stainless steel Kemmerer sampling device one-half the total depth of the water column All sampling equipment will be decontaminated using methanol and distilled water rinses before each sampling event
433 Surface Water Analysis Program
Analytical procedures are identified in the Quality Assurance Project Plan (QAPP) All of the surface water samples will be analyzed using 1988 CLP methods for PCBs aluminum and lead One sample from each surface water body will also be Submitted for Total Suspended Solids Analysis (EPA Method 1602) A summary of the analyses to be performed on surface water samples including duplicates and blanks is shown on Table 4 Surface water samples will be submitted to Ceimic Corporation for laboratory analysis Samples will be collected in I-Chem glassware or equivalent and stored at 40 C as described in Section 6
A series of quality control samples (duplicates and blanks) will be collected by GEI and analyzed by the laboratory to aid in data assessment as discussed in the Quality Assurance Project Plan (QAPP) All quality control samples will be labelled with false sample identification as shown in Table 4 and described below in order to avoid laboratory bias
One sampling equipment blank and a trip blank will be submitted during each sampling round to Check for the presence of cross-contamination These will provide a quality control check for decontamination and handling practices One trip blank
Document Vol II SC SAP Revision 1
Date March 28 1991 Page 22
sample consisting of laboratory-supplied organic-free and de-ionized water will accompany the samples during storage and shipment and will be analyzed for PCBs aluminum and lead (sample identificationwill be SW4) A samplingequipment blank will be collected by pouring laboratory-supplied organic-free and de-ionized water through the Kemmerer sampler at the end of the sampling program The sampling equipment blank will then be analyzed for PCBs aluminum and lead (sample identification will be SW5)
One surface water duplicate will also be collected each sampling round Duplicate sample location and identification is indicated on Table 4
433 Surface Water Sample Designation
Each piece of sample glassware will be affixed With a self-sticking adhesive label Each label will be completed with an indelible marker to contain the following information
GEI Consultants Inc Site Name Project Number Sampling Date and Time Samplers Initials Analyses Requested
The sample number is composed of a series of information to identify the sample as unique to the sampling point and sampling event The sample number labelled in the field and referred to on all associated documents is composed of the following
Matrix Project Surface Water Body Sampling Location
SW - 90393 - UM - SW1
The example sample number above indicates thata surface water sample was obtained from the Upland Marsh at location SW1 under Project Number 90393 The surface water body designations for the Upper Lagoon and the Lower Lagoon will be UL and LL respectively
Document Vol II SC SAP Revision 1
Date March 28 1991 Page 23
44 Barn
441 General
A total of approximately 30 samples of various media within the barn will be collected by GEI during May 1991 The types of media collected will generally consist of wood fragments from barn walls dust concrete and wipes on non-porous debris within the barn The exact sample locations will be primarily determined in the field based on observations during sampling (eg staining on soils concrete or wood) Based on a site visit by GEI on December 19 1990 preliminary sample locations for barn materials were chosen as shown in Figure 5 These preliminary locations will enable representative sampling of general debris and staining in the barn and indicates the general sampling strategy which will be employed during Pre-Design Final sampling locations may be modified during the program based on closer observation of equipment barn materials and evidence of staining
Detailed descriptions of the methods to be used during the barn sampling program are provided in Section 5 In general a survey of the general types of materials present in the bam and locations of apparent staining of surficiial materials or debris will be recorded on a plan Following the survey representative areas within the barn will be sampled A total of 12 wipe samples will be collected (eg steel shelves boat wood stove electric meters etc) by wiping a 100 cm2 area with laboratory-prepared sampling wipes A total of ten samples of Wood from the walls of the barn will be collected by using a wood boring bit and wood chisel A total of four samples of loose dust will be collected from the floor of the concrete slab of the barn using disposable nylon brushes and stainless steel trowels Finally a total of four samples of concrete will be collected from areas of visible staining and one unstained area by drilling the concrete to a maximum depth of 12 inch in a 100 cm2 area All non-disposal steel sampling equipment will be decontaminated using methanol and distilled water rinses before use at each sampling location
442 Barn Analysis Program
Analytical procedures are identified in the Quality Assurance Project Plan (QAPP) Three field equipment blanks and three trip blanks will be submitted during the barn sampling program to check for the presence of cross-contamination These will provide aquality control check on decontamination and handling practicesAsummary of the analyses to be performed on each sample matrix and the quality controlsamples is shown in Table 5
Document Vol II SC SAP Revision 1
Date March 28 1991 Page 24
Wipe wood dust and concrete samples will be submitted to Ceimic in Narragansett Rhode Island for laboratory analysis Wood dust and concrete samples will be analyzed for PCBs cPAHs and lead Samples will be collected in I-Chem glassware or equivalent provided by Ceimic and preserved and stored as described in Section 6
The objective of the barn sampling program is to provide a preliminary assessment of the degree of contamination present within the barn (see Section 2) It may be difficult to ensure that representative replicates can be made of the various matrices during sampling Therefore no replicate samples of barn materials will be collected during this initial sampling effort
Aqueous trip blank wipe samples will accompany the samples during storage and shipment and will be analyzed for PCBs (sample identification will be PTB1-PTB3) Sampling equipment blank wipes will be made following decontamination of all steel sampling equipment at various times during the sampling program The steel equipment wiped will include the hole saw trowel and the drill bit used for barn wall dust and concrete sampling respectively The equipment wipe samples will then be analyzed for PCBs (sample identification will be PEB1-PEB3)gt
443 Barn Sample Designation
Each piece of sample glassware will be affixed with a self-sticking adhesive label Each label will be completed with an indelible marker to contain the following information
GEI Consultants Inc Site Name Project Number Sampling Data and Time Sample Number Samplers Initials Analysis Requested
The sample number is composed of a series of information to identify the sample as unique to the sampling point and sampling event The sample number labelled in the field and referred to on all associated documents is composed of the following
General Sample Location Project Sample Type Sample
BARN - 90393 - D2
Document Vol II SC SAP Revision 1
Date March 28 1991 Page 24a
The example sample number above indicates that a barn sample was obtained under project number 90393 and was the second dust sample collected The designations for the wipe samples will be P wooden samples W dust samples D concrete samples C and other samples O
Document Vol II SC SAP Revision 1
Date March 28 1991 Page 25
5 SAMPLING EQUIPMENT AND PROCEDURES
51 Air Monitoring
Short-term air monitoring will be performed regularly on-site during the Source Control (SC) sampling program A HNu photoionization detector (PID) and an MIE Model MINIRAM hand-held aerosol monitor (HAM) will be used for air monitoring The PID is capable of detecting total ionizable compounds (typically VOCs) and the HAM detects solid or liquid particulates in air which often take the form of dust smoke fumes and mists Each air monitoring instrument will be operated in accordance with the requirements specified in the Health and Safety Plan provided in Appendix A Readings from the PID and HAM will be recorded in the Project Field Log Book (see Appendix B) Calibration procedures for the PID (HNu Model PI-101) and the HAM (MIE Model MINIRAM) are provided in Appendix C
52 Soil Sampling
521 General
Soil sampling locations are shown on Figure 3 Table 1 lists each soil sampling location planned approximate sample depth and rationale for sample collection
Prior to sampling a surveyor registered in the State of Maine will survey the exact location of each test pit and boring location and provide a temporary stake that will function as a bench mark for horizontal and vertical control within 20 feet of each test pit and at each boring Sample locations within test pits will be by tape and compass bearing methods
Soil sampling will be performed with strict adherence to the procedures described below A list of equipment requirements for the soil sampling program is provided in Table 6 In general excavation of soil to the target depth in test pits will be performed with a backhoe for sampling to 5 feet below ground surface The backhoe and operator will be supplied by HE Sargent Inc and the operator will be equipped with Level C personnel protection (see Appendix A) A bombardier or truck-mounted drill rig operated by Northeast Diamond Drilling by personnel equipped with Level C protection will be utilized for sampling points greater than 5 feet below ground surface Soil samples collected by GEI for possible bench-scale testing will be obtained only at test pit locations Ambient air monitoring will be performed by GEI regularly while working on-site for health and safety monitoring Mobilization
Document VoL II SC SAP Revision 1
Date March 28 1991 Page 26
of equipment and transportation of materials over the site during the soil sampling program will avoid heavily contaminated transformer work areas when possible to reduce dispersing PCBs to other areas Drilling and excavating equipment will be decontaminated under the supervision of GEI prior to use at each sampling location following strict decontamination procedures described in Appendix A and below Sampling equipment will be decontaminated by GEI prior to each sampling event as described below All soil sampling operations within the site will be performed using Level C dermal and respiratory personnel protective equipment to protect against PCB-contaminated dust levels which are likely to exceed 1 mgm3 during sampling The detailed Health and Safety Plan that will be followed during soil sampling is provided in Appendix A
522 Soil Sampling Methods for Test Pits
A minimum of a two-person crew in addition to the backhoe operator or the drill rig crew will be provided by GEI during the sampling program
All soil samples will be collected from test pits by GEI with a shovel or trowel following excavation to the appropriate depth with a rubber tire backhoe as follows
1 Check the survey stakes for the proper test pit number identification and location
2 Place polyethylene sheeting on each side of the test pit for staging the excavated soils from the test pit
3 A standard rubber tire type backhoe will perform the soil excavation to the planned sampling depth All soil excavated from the test pit will be placed on the plastic sheeting adjacent to the test pit The top 2 feet of excavated soil will be cast to one side of the test pit on the sheeting and the bottom 3 feet of soil will be cast to the opposite side to avoid mixing soils with potentially significantly different levels of contamination After completion of sampling soil will be backfilled at a similar depth from which it was excavated
4 All excavation activities will be continuously observed by an engineer or geologist from GEI A test pit log form (OCONNORFL12) will be completed by GEI for each test pit performed and will include the following information
Document Vol II SC SAP Revision 0
Date January 17 1991 Page 27
Name and Location of Job Date Excavation and Test Pit Number Approximate Ground Surface Elevation at Test Pit Total Depth of Test Pit Dimensions of Test Pit Location and Depth of Soil Sample Relative to Stake Reference Method of Soil Sample Acquisition (Shovel Trowel) Volume of Soil Sample J Soil and Stratigraphic Descriptions x
Ground Water Levels (if encountered) y ^v Air Monitoring Information v Other observations Such as soil staining buried debris etc
5 At least one photograph will be taken oflta wall of each test pit from within the test pit with a scale for comparison to indicate soil layering or staining In addition one photograph shall be taken of thertesVpit from the ground surface also showing sample locations withinthe-test pit Photographs of the test pits will be marked to include site locationxjdbmumber^test pit number date and time A photograph log sheet will be maintained fampMuture reference
6 The target soil sampling elevation will be determined by GEI using a level and rod
7 Soil sampling will begin from within the test pit only after the side walls of the pit have been properly^sloped back in accordance with OSHA requirements (see Health and Safety Plan^ Appendix A) All samples collected will be identified on the test pit logazid in the field book Information about the sample including sample number^de^th voiuine and soil description will be recorded The soil sample will be colleetedTrotn an undisturbed area of the test pit floor or wall by means of scraping or digging with a stainless steel shovel or trowel The number of clean sampling utensils for each test pit shall be equal to the number of soil samples collected at the test pit Shovels or trowels used to clean sloughed material from the sampling location will not be used to collect the sample unless decontaminated before use in sampling Care will be taken to assure that the sample is taken from the actual soil unit desired mid does not include slough or scraped material from the sides of the trench The desired soil sample will be immediately placed into the sample container within the test pit A portion of the sample will be retained for screening with the Dexsil L-2000 PCB analyzer The containers will then be sealed labelled and stored in asecure area until Shipment to the laboratory
Document Vol II SC SAP Revision 1
Date March 28 1991 Page 28
8 When collecting a larger volume sample for bench-scale testing a smaller soil sample will first be collected for field screening using the Dexsil L-2000 PCB Analyzer If the analyzer indicates that the PCB concentration is within the target range the bench-scale soil sample will be collected If the Analyzer indicates that the PCB concentration is outside the target range the test pit will be expanded if necessary and another sample will be collected for PCB screening This procedure will be continued until a sample within the target range is identified The test pit will be expanded no more than 2 feet in all directions and to the maximum depth of 5 feet below ground surface If after this over-excavation the soil within the target concentration range has not been identified with the Dexsil L-2000 PCB Analyzer a new test pit location will be selected near the original test pit in an area indicated by the Remedial Investigation to contain soil contamination within the target range
9 Once the targeted PCB concentration has been indicated by field screening the desired soil sample will be collected with a clean stainless steel trowel or shovel at a sufficient quantity to fill a 5-gallon container An aliquot from the 5-gallon sample container will be collected and placed in an appropriate sample container for laboratory analysis for PCBs The 5-gallon containers will then be sealed labelled and appropriately stored in a secure area until transported off-site The laboratory samples will be sealed labelled and stored with the other soil samples awaiting shipment to the laboratory
10 Upon completion of sample collection the excavated soil material will then be backfilled into the test pit The backfilled area will be compacted to the approximate original ground elevation
11 Equipment will be decontaminated after backfilling the test pit (ie shovel trowels measuring equipment) byscrubbing and With methanol and distilled water rinses Portions of the backhoe (bucket bucket arm etc) will be decontaminated with a high-pressure steam rinse on the decontamination pad (see Appendix A)
523 Soil Sampling Methods for Borings
Selected soil samples are planned to be collected at depths greater than 5 feet below ground surface to obtain additional data on the depth of PCB contaminationexceeding cleanup standards in Transformer Work Areas Samples will be obtained using split-spoon sampling techniques within 3-inch ID hollow stem augers in test borings generally following procedures specified by American Society for Testing Materials (ASTM) D1586-84 Test borings will be performed by Northeast Diamond Drilling
Document Vol II SC SAP Revision 1
Date March 28 1991 Page 29
under the observation of an engineer or geologist from GEI The following procedures not specified in ASTM D1586-84 will be used
1 Place a polyethylene sheet on one side of the boring location for temporarily staging drilling cuttings during borehole advancement All drilling equipment shall be decontaminated with a high pressure steam rinse on the decontamination pad prior to beginning drilling
2 Advance hollow-stem augers without split-spoon sampling to a depth about 5 feet above the sampling depth specified in Table 1
3 Begin continuous split-spoon sampling with 18-inch-long samples Collect a specimen from the middle of each sample for screening with the Dexsil L-2000 PCB analyzer and the HNu photoionization detector Rinse the split-spoon sampler with methanol and distilled water rinses before each sample
4 Collect a split-spoon sample at the designated sample depth Divide the split-spoon sample vertically Place a minimum of 4 inches of sample recovered from the bottom right half of the sample into the glass sample container Seal and label the sample container as indicated in Section 4 and store the container in a cooler with ice in a secure area until shipment to the laboratory Retain the left half of the split-spoon sample for screening with the Dexsil 1^2000 PCB analyzer and the HNu photoionization detector
5 After collecting the final soil sample in the boring measure depth to ground water below ground surface using a decontaminated Solinst battery-operated water level indicator Record the time elapsed after completion of the boring when the ground water level was measured
6 Remove augers from borehole If the borehole remains open and evidence of ground water was encountered during sampling collect additional measurements of depth to ground water prior to backfilling until the ground water level appears to stabilize Note occurrence of precipitation or other events which could effect water level measurements in the project log book
7 Backfill borehole within 24 hours after completion of the boring with drill cuttings staged adjacent to the borehole If the borehole collapses and cuttings cannot be backfilled in the borehole store staged cuttings in a steel drum to be left on site Label outside of drum to indicate contents are borehole cuttings from the designated boring number and affix labelindicating PCB-contaminated materials Cuttings from more than one boring can be combined in a single drum
Document Vol II SC SAP Revision 0
Date January 17 1991 Page 30
8 Decontaminate measuring and sampling equipment with methanol and distilled water rinses Decontaminate downhole drilling equipment on the decontamination pad with a high-pressure steam rinse before starting the next boring
A log will be prepared by GEI for each boring and will include the following
information 7
Name and Location of Project
Boring Number lt Date of Boring Ground Surface Elevation x-Boring Diameter and Depth Sample Numbers and Depths Soil Screening Data Visual Soil Descriptions Water Level Measurements Air Monitoring Levels Other Observations
The boring log form is provrdedin Appendix B (OCONNORFL15)V
i
Surface Water ^^7
531 General
N
Surface water sam^les^will becollected at the locations shown in Figure 4 If water is too deep for safe aecess^with hip-waders andor access with hip waders will severely disturb sediment an inflatableboat will be used to access Surface water sampling locations
The surface water sampling program will be performed following strict adherence to the following procedures A list of the equipment requirements for surface water sampling is provided in Table 8 In general ambient air monitoring will be performed regularly while working on-site for health and safety considerations Areas of the site which have been determined by previous studies to have elevated concentrations of PCBs in soils (for example TWAs) will be avoided while traversing the site to reduce the likelihood of dispersing PCBs to other areas The depth of water at the sampling stations will be measured and the surface water elevation will be surveyed on each water body Equipment will be decontaminated prior to use at each sampling station following decontamination procedures
Document Vol II SC SAP Revision 0
Date January 17 1991 Page 31
532 Surface Water Sampling Methods
Surface water samples will be collected during the Pre-Design Study at the locations shown on Figure 4 Surface water samples will be collected during the initial stage of the Source Control sampling program prior to soil and sediment sampling An inflatable boat will be used to access surface water sampling locations if there is sufficient water depth The boat will be cleaned with methanol and distilled water rinses before sampling in each water body The surface water sampling procedures will be as follows ltX1 Determine the location of the sampling station by tape^and compass from a
temporary bench mark at the edge of the surface water body x
2 Measure the depth of water at the sampling station with a weighted tape measure x (
^ 3 Gently lower a clean Kemmerer sample^bottle to the desired depth (one-half
water depth) so as not to remove th^stoppeisprematurely V^
4 Pull out the stopper with a sharp jerk ofdhe sampler line
5 Allow the bottle to fill completelyras evidenced by the cessation of air bubbles
6 Raise the sample and capdhe nottle X x
7 Pour the sampl^fromthe bottle into the appropriate sample container The container willbesealedlabelled and stored in a secure area until shipment to the laboratory
8 Fill a beaker with water remaining in the sampler and measure specific conductance pH and temperature
9 Decontaminate the sampling apparatus measuring tape and Kemmerer sampler by scrubbing internally and externally with methanol and distilled water rinses
10 Record the following surface water sampling information in the project log book (OCONNORFL1)
Document Vol II SC SAP Revision 0
Date January 17 1991 Page 32
Date Time Total Depth of Water Location and Depth of Sample pH Conductivity Measurements Air monitoring levels detected Other observations
Sediment
541 General x
gt The locations of the sediment sampling stations are shown on Figure 4 Table 3 lists the various sampling stations and sampling methods for the sampling program Sediment sampling during the project will beperformed with strict adherence to the following procedures A list of equipment requirements for the sediment sampling program is provided in Table7 In general ambientw monitoring will be performed regularly while working on-site for health-and safetymonitoring Mobilization of equipment and materials over the sitdduring^he-sediment sampling program will follow specific routes to reduce the likelihoocKPfdispersing PCBs to other areas Equipment will be decontaminated prior to sampling at each location following strict decontamination procedures described belowy All sediment sampling operations within the site will be performed fusing level C dermal personnel protective equipment and Level D respiratory^protective equipment will be worn
v ^
542 Sediment Sampling Methods gtSN
The sediment sampling^vili be performed after collection of surface water samples and will consist of rivo primary components
1 Tube sediment smiling to provide additional data on sediment quality and to estimate the thickness of sediment
2 Dredge sediment sampling to obtain a sample for laboratory for bench-scale treatability testing
The tube sediment sampling program will be performed as follows
Document Vol II SC SAP Revision 0
Date January 17 1991 Page 33
1 Determine the sampling locations by tape and compass measurements from a temporary bench mark (reference stake) surveyed near the edge of the surface water body Access locations in interior portions of the water bodies using an inflatable rubber boat The boat will be decontaminated with methanol and distilled water rinses before use in each surface water body
2 Measure the depth of water with a weighted tape measure
3 Lower the hand tube sediment sampler to the desired ctepth Sediment entering the tube is trapped by a plastic core retainer allbyringlheunit to be retrieved a n d t h e s a m p l e r e m o v e d w i t h o u t s a m p l e l o s s X x y
4 Extract the sediment samplefrom the sampler and^immediately place the sample
into the sample container The containers ywllthen be sealed labelled and stored on ice in a cooler in a secure area until shipment to the laboratory
5 Decontaminate the sampling apparatua and measuring tape by scrubbing with methanol and distilled water rinses
vw 7 Record sediment sampling record information in the project log book
(OCONNORFL2) after collecting a sediment sample at each sampling station The information that will beuro~documenteamp includes the following
Date and Time ^ Total Depth of Water N Thickness of Sediment Location of Sample Length and Vblume^of Simple Sample Description x- Air Monitoring LevetesDeteeted Other Observations
The sediment sampling procedure for collecting samples for bench-scale treatability testing will be as follows
1 Determine the location of the dredge traverse line by tape and compass bearings from the temporarily bench mark adjacent to the surface water body
2 Pull the sediment dredge along the planned traverse with a wire line from the edge of the surface water body
Document Vol II SC SAP Revision 0
Date January 17 1991 Page 34
3 Repeat sampling until 5 gallons of sediment have been collected and placed in the 5-gallon sample container The containers will then be sealed labelled and stored in a secure area until shipment to the laboratory
4 Decontaminate the sampling apparatusand drag line by scrubbing with methanol and distilled water rinses
S6 Record the following sedimentsampling informationin die project log book after
sample collection X nXx
Date and Time X gt Total Depth of Water Location and Volume of Sample Number of Grab Samples Collected to Form Composite Volume Sample Description Air Monitoring Levels Detected x X Other Observations
Barn
5-51 General
Sampling within the barn will4gteperformed with strict adherence to the following procedures A list of equipment requirements for the barn sampling program is provided in Table 9 Areas of the Site which have been determined by previous studies to have elevatedconcentrations of PCBs in soils (for example TWAs) will be avoided during bam sampling to reduce the likelihood of dispersing PCBs to other areas within the barnXEquipment will be decontaminated prior to use at each sampling location inside thetarn following strict decontamination procedures All sampling operations withfaMhe barn will be performed with Level C personnel protective equipment due to dust levels which may to exceed 1 mgm3 during sampling (see Appendix A) A detailed Health and Safety Plan which will be followed during barn sampling is provided in Appendix A
552 Barn Sampling Methods
If power is not available on-site a gasoline-powered generator capable of supplying electricity for lighting and sampling equipment will be positioned outside the fenced area of the site prior to sampling Extension cords will be run to the barn (avoiding TWAI) for power supply In order to reduce the potential for cross-contamination due to dust generation the sampling of different matrices will proceed in the
Document Vol II SC SAP Revision 0
Date January 17 1991 Page 35
following sequence 1) wipe samplingof non-porous debris 2)wood sampling of barn walls 3) dust sampling from top of floor slab 4) concrete sampling of floor slab Areas to be sampled will be chosen based on the presence of apparent oil-type staining and to obtainan even distributionof representative samples with no apparent staining
Following sampling at each location a self-sticking adhesive label marked with the sample number will be placed at the sample location for future reference Each label will then be located by taping relative to a reference point Established at the western corner of the barn (W-Z corner) as shown in Figure 5 Walls W and Z will be used as orthogonal axes similar to a typical coordinate system For samples collected above the concrete floor slab (eg wipe and wooden wall samples the height above the floor slab will also be recorded All samples willbe collected between the floor slab and a maximum height of seven feet All location measurements and a brief description of the area sampled will be recorded on the Barn Sampling Form (OCONNORFL13) provided in Appendix B Imaddition a photograph of each sampling location will be taken and^ recordedy on the Photograph Log (OCONNORFL6) Detailed procedures-for each type of sample to be collected during the barn sampling program follows
lt Win Samnlino N
1 Identify the non-porous item within the barn selected to be sampled which has an area of at least 100 cm2 which maybe wiped Examples include sheet metal fiberglass cleanly painted wooden surfaces glass etc
2 Place a decontaminated stainless steel or plastic 100 cm2 (10 cm X 10 cm) template at t^desired sampling location
Note For smaller areas such as on electric meters use the quarter template of 25 cm2 area and make four wipes to compose one sample
3 Remove the laboratory-supplied gauze from within the glassware with stainless steel forceps The gauze should be moist with solvent as prepared by the laboratory
4 While holding the appropriate template in place thoroughly swab the 100 cm2 area with the gauze using forceps or bufyl rubber gloves Inspect the area to ensure that all loose dust has been wiped with the Alter paper
Document Vol II SC SAP Revision 0
Date January 17 1991 Page 36
5 Fold the gauze over to ensure that the dust is contained on the inside of the gauze Place in the appropriate sample container seal label and store in a secure area until shipment to the laboratory
6 Decontaminate the forceps and templates by scrubbing with methanol rinsing with distilled water and wiping dry with paper towels
7 Label the sample location photograph and complete^he Barn Sampling Form
(see Appendix B) and other necessary documentation after each sample is
c o l l e c t e d lt X x x y x x
xWooden Wall Sampling X
1 Select the sampling area of at least 100 cm2 on the inside wall of the barn and secure a decontaminated 100cm2 template at the location Place a steel pan below the sampling area to catch sawdust ancLwood chips
2 Using an electric drill equipped withra-one-ineh diameter wood-boring bit drill out wood within the template area to arnaximum depth of 12 inch
3 Place sawdust and wood chips man appropriate sample container seal label and store in a secure area untiLsRipinent to the laboratory
4 Decontaminate the drilTbit and pan by scrubbing with methanol rinsing with distilled water and jwiping dry with paper towels
5 Label the samplelocatidn photograph and complete the Barn Sampling Form (see Appendix^)
Dust on Floor Slab Sampling
1 Select an area to sample such that at least 100 grams of dust or soil may be obtained This will vary depending on thickness of the dust or soil
2 Using a disposable nylon brush or stainlesssteel trowel brush or scrape dustsoil toward the center of the area chosen minimizing the creation of airborne dust
3 After the dustsoil has been centralized use a flat stainless steel trowel to collect the material and place in laboratory-supplied glassware seal and label
Document Vol II SC SAP Revision 0
Date January 17 1991 Page 37
4 Dispose of the nylon brush with other containerized PCB-waste materials and decontaminate the stainless steel trowelsby scrubbingwith methanol rinsingwith distilled water and wiping dry with paper towels
5 Label the sample location photograph and complete the Barn Sampling Form
Concrete Slab Sampling
1 Identify three areas of visible staining and one area of no visible staining on the floor slab Using a disposable nylon brush carefulfy brushxaway loose dust and soil from an approximately 1-square-foot area
2 Place a pre-cut 10-square-foot sheet of clean polyethylene sheeting with a 1shysquare foot hole cut in the center over thevsampling area and secure in place with duct tape Place a decontaminated lOO cmr template in the center where t h e s a m p l e i s t o b e o b t a i n e d X v N
3 Using an electric hammer drill eqi^pedwitlra^ungsten-carbide mortar bit drill the four corners established by the tempfate^to a maximum depth of 12 inch
4 Remove the template ancLdrilL the remaining 100 cm2 within the established square to a maximum dep^fof l2Jnch
-vFollowing drilling brush the concrete chips and dust from the plastic sheeting toward the center otlhe sarhplihggtarea Collect sample with a clean disposable nylon brush andtrowel and place in an appropriate sample container seal label and store in aSecure area until shipment to the laboratory
6 Dispose of the nylon oriish with other containerized PCB-contaminated waste materials and decontaminate the stainless steel trowel and template by scrubbing with methanol rinsing with distilled water and wiping dry with paper towels
7 Remove and dispose of the polyethylene sheeting and duct tape in an appropriately marked barrel that will remain on the site with other sampling waste disposal materials Label the samplinglocation photograph and complete the Barn Sampling Form
Document Vol II SC SAP Revision 0
Date January 17 1991 Page 38
6 SAMPLE HANDLING AND ANALYSIS
61 General
GEI has established a program of sample chain-of-custody that is followed during sample handling activities in both field and laboratory operations Thisvprogram is designed to assure that each sample is accounted for at all times To accomplish this objective sample container labels sampling records chain-of-custody records sample assignment forms shipping airbill records and laboratory receipt sheets must be completed by the appropriate sampling and laboratory personnel ^ y gt
62 Sample Labeling and Documentation gt
The plastic 5-gallon containers for bench-scale testingsWilKbe cleaned with methanol and distilled water rinses prior to use All other sample containers^will be pre-cleaned by EPA-approved methods and provided by the laboratory^ A summary of the sample containers and preservation requirements for each of thamp^analytieal parameters to be measured is shown in Table 10 Each piece of sample gl^sware^will be affixed with a self-sticking adhesive label Each label will contain the information described in Sections 4 and 5 of this document ^
To further document the samplingprogr^mand Sample handling procedures the project log book (OCONNORFL1) will containinformation regarding the activities on-site and sample handling In addition photographs of each type of field procedure will be taken The photographs will be representative of thetechniques employed throughout the sampling program A record ofeach photograph Will be made on the Photograph Log (OCONNORFL6) as stiown 4i^Appendix B
63 Chain-of-CustodySample^Assignment
Chain-of-custody will be maintained at all times as described in more detail in the Quality Assurance Project Plan (QAPP) A copy of the chain-of-custody form (OCONNORFL9) to be used is provided in Appendix B
In general the chain-of-custody record must be used such that it includes the following information
Document Vol II SC SAP Revision 0
Date January 17 1991 Page 39
Project name and number Names of the sampler(s) and person shipping the samples Station number or well identification Date and time the samples were collected Composited or grab sample designation Sample number (eg 1GU-90393-MW101A) Total number of containers Analysis requested Date and time the samples were delivered for shipping Names of those responsible for receiving the sampled at the laboratory
Prior to shipment of the samples a sample assignment form will be completed (see OCONNORFLIO in Appendix B) The sample assignmenrform will provide the contract laboratory sufficient information to process the samples and perform the appropriate analysis
The chain-of-custody record and sample assignment fornr will both be completed in duplicate in the field through the use of carbon paperT The original copy of the forms will be enclosed in a plastic bag and placed in the coolersWith the samples for shipment to the laboratory The carbon copy of the forms will be retained by GEL
VSoil samples for bench-scale testing ynH be-stored on site in a locked storage shed until samples are selected for the bench-scale7testing^ This decision will be made after receipt of the laboratory PCB analyses results and approval of the Source Control Work Plan by the EPA Soil samples not usecLfor bench-scale testing will remain in the locked storage shed and will be included with-other soil for treatment during the Remedial Action
lt v 64 Sample Shipments
Sample containers are generally packed in coolers for shipment Prior to packing organic analysis samples will be placed in plastic bags Bottles are to be packed tightly so that no motion is possible Styrofoam vermiculite and bubble pack are suitable for most instances Ice Will be placed in sealed plastic bags or ice packs in order to keep samples at 4degC at all times Samples will be protected against freezing during cold weather The original chain-of-custody and sample assignment forms will be sealed in plastic bags and placed in the cooler with the samples The cooler will be closed and a signed self-sticking label with the words Custody Seal will placed between the body of the cooler and the cover The cover will then be sealed with clear tape Samples will be shipped so that they are received by the laboratory no later than 60 hours from the time of sample collection
Document Vol II SC SAP Revision 0
Date January 17 1991 Page 40
All shipping of samples will be done through Federal Express or equivalent overnight delivery service Samples will be shipped in accordance with Department of Transportation (DOT) regulations If prompt arrival of the samples cannot be guaranteed the samplers will be responsible for proper storage of the samples until adequate transportation arrangements can be made The laboratory will be notified prior to shipment to arrange for receiving the samples and to prepare for the analyses requested Based on the low concentrations of chemicals detected during previous studies theSamples will be classified as environmental samples The air bill for the samples will speeiiythat the contents of the cooler are environmental or hazardoussamples as appropriated When samples are received by the laboratory they will notify the Task Manager of theccondition of the samples
H craTrsi
TABLE 1 - SOIL SAMPLING SCHEDULE Field Sampling Plan OConnor Co Site Augusta Maine
DEPTH APPROXIMATE BELOW ANTICIPATED
SAMPLE NUMBER SAMPLE GROUND PCS GENERAL LOCATION OF ELEVATION SURFACE CONCENTRATION SOIL
ID SAMPLES (MSL) (PPm) TYPE COMMENTS
TP1 2175 25 ND ClaySandy Till Confirm contours 215 35 ND
TP2 217 15 50 ClaySandy Till Confirm contours TP3 212 ND Siltv Clav Confirm horizontal extent toward marsh TP4 211 5-50 Clav Obtain bench scale 20-50 ppm
TP5 213 50-500 Clay Confirm lateral extent
TP6 215 15 5-50 Fill Obtain bench test sample In 1-10 ppm
TP7 210 35 0-5 Siltv Fine Sand Confirm vertical extent in drainage area
217 3 0-5 FillClay Confirm contours TP8 219 1 0-5 TP9 207 35 0-5 Siltv Fine Sand Confirm vertical extent In drainage area
TP10 1175 15 50-5000 Fill Bench scale test sample 50 to 500 ppm
TP11 218 0-5 SandClay Confirm horizontal extent toward marsh
TP12 218 0-5 SandPay Confirm horizontal extent toward marsh
TP13 221 5-50 Clav Bench-scale test sample 10-20 ppm
TP14 206 0-5 Gray Silty Clay Confirm vertical extent
TP15 200 0-5 Gray Silty Clay Confirm vertical extent
TP16 2185 15 5-50 Clay Bench-scale test sample 1-10 ppm
228 4 TP17 230 2 Confirm contouring in north end of site
231 4 TP18 233 2 Confirm contourtng in north end of site
236 4 TP19 238 2 Confirm contouring in north end Of site
Project 90393 GEI Consultants Inc Page 1 of 2 March 28 1991
SAMPLE NUMBER LOCATION OF
SAMPLES
TP20 TP21 TP22 TP23
TP24 TP25
B1
B2
1 B3 2
B4
B5
ND = Not Detected
TABLE 1
APPROXIMATE SAMPLE
ELEVATION MSLJ
231 233
2275 237 237 235 236 222 210 215 210 215
215 220
218 220 220 222
- SOIL SAMPLING SCHEDULE Field Sampling Plan OConnor Co Site Augusta Maine
DHTH BELOW
GROUND SURFACE
4 2
15
2 1
8 3 8 3
12 6
8 6 6 4
ANTICIPATED PC8
CONCENTRATION
ND ND 0-5
500-5000 5-50
50-5000 0-5
50-500
0-5 50-500
0-5 0-5 0-5 0-5
GENERAL SOIL TYPE
Clavev Silt Silty Clay
Clay
Till or Clay
Till or Clay
Gray Silt
Gray Clavev Silt
Gray Clayey Silt
i
Confirm contouring in north end of site Confirm contours Confirm contours Confirm contours
Confirm contours Bench scale sample 50-500 ppm
Confirm contouring and vertical extent
Confirm Contouring and vertical extent
Confirm contours and vertical extent
Confirm contours and vertical extent
Confirm contours
Project 90393 GEI Consultants Inc Page 2 of 2 March 28 1991
TABLE 2 SOIL ANALYSIS PROGRAM Field Sampling Plan OConnor Co Site Augusta Maine
Sample Depth
Sample Location ID
SoB Sample Number
(ft below ground surface) Lead cPAHs PCBs
pH TOC CEC
Anatyticsd Level IV
TEST PITS TP1 SS1 TP2 SS1 15
SS2 35 TP3 SS1 TP4 SSI
SS2 TP5 SSI TP6 SS1 15
SS2 15 TP7 SS2 35 TP8 SSI
SS2 TP9 SSI 35
replicate of SS2 SSI
TP10 SS1 15 SS2 15
TP11 SSI TP12 SSI TP13 SS1
SS2 TP14 SS1 TP15 SS1
replicate of SS2 SS1
TP16 551 15 552 15
TP17 551 552
TP18 551 552
TP19 551 552
TP20 551 552
TP21 SS1 15 TP22 SS1
Project 90393 GEI Consultants Inc Page 1 of 2 March 281991
TABLE 2 SOIL ANALYSIS PROGRAM Field Sampling Plan OConnor Co Site Augusta Maine
Sample Depth
Sample Location ID
SoB Sample Number
(ft below ground surface) Lead cPAHs PCBs
pHTOC CEC
Analytical Level IV
Bench Scale
Sample
replicate of SS2 SS1
TP23 SS1 TP24 SS1
SS2 TP25 SSI
SS2 BORINGS
B1 SS1 SS2
B2 SS1 SS2
B3 SS1 6 replicate of
SS2 SS1 SS3 12
B4 551 552
B5 551 552
QUALITY CONTROL TP26-TP29
(trip blank) SS1-SS4 TP30-TP33 (shovel or
hand trowel SS1-SS4 blank)
TP34-TP37 (split-spoon
blank) SS1-SS4 TOTAL
ANALYSES 40 40 64 15 12
TOC - Total Oraanic Carbon CEC - Cation Exchange Capacity
Will be designated to the laboratory as matrix spikematrix spike duplicate
Additional trip blanks may be needed to ensure one trip blank per cooler
Project 90393 GEI Consultants Inc Page 2 of 2 March 281991
TABLE 3 SEDIMENT ANALYSIS PROGRAM Field Sampling Plan OConnor Company Site Augusta Maine
PH Bench Sample TOC Analytical Scale
Sample Location Number Lead cPAHs PCBs CEC Level IV Sample
Surface Water Body
SED1
SED2
SED3Upland Marsh (UM) SED4
SED5
SED6
SED1
SED2Upper Lagoon (UL)
SED3
SED4
Lower Lagoon (LL) SED1
SED2
SED3
SED7 (trip blank)
SED8Quality Control (dredge
blank)
SED9 (tube
samples blank)
Total Analyses 11 11 16
TOC - Total Organic Carbon CEC - Cation Exchange Capacity
UL SED2 is a replicate sample of UL SED1
Will be designated to the laboratory as matrix spikematrix spike duplicate
Additional trip blanks may be needed to ensure one trip blank per cooler
Project 90393 GEI Consultants Inc March 281991
TABLE 4 - SURFACE WATER ANALYSIS PROGRAM Field Sampling Plan OConnor Co Site Augusta Maine
SAMPLE SAMPLE LOCATION NUMBER Lead Aluminum PCBs
Upland SW1 X X X Marsh (UM) SW2 X X X
Upper SW1 X X X Lagoon (UL) SW2 X X X
SW3 X X X
Lower SW1 X X X Lagoon (LL) SW2 X X X
Quality Control Samples
Trip Blank SW4
Sampler Blank SW5
TOTAL ANALYSES
TSD - Total Suspended Solids
SW2 is a duplicate of SW1
Will be designated to the laboratory as matrix spikematrix spike duplicate
Additional trip blanks may be needed to ensure one trip blank per cooler
Project 90393 GEI Consultants Inc Page 1 of 1 March 28 1991
TABLE 5 - BARN SAMPLING ANALYSIS PROGRAM Field Sampling Plan OConnor Co Site Augusta Maine
SAMPLE MATRIX PCBS CPAHS Lead
Analytical Level IV
Wipe samples PTB (trip blank) PEB (equipment blank)
12 3 3
Wooden wall samples 10 10 10
Dustsoil on floor slab
Concrete slab
Total Analyses 36 18 18
Additional trip blanks may be needed to ensure one trip blank per cooler
One sample will be designated to the laboratory as a matrix spikematrix spike duplicate
Project 90393 GEI Consultants Inc Page 1 of 1 March 281991
TABLE 6 - SOIL SAMPLING EQUIPMENT REQUIREMENTS Field Sampling Plan OConnor Co Site Augusta Maine
Safety Equipment (Level C - Dermal)
Health and Safety Plan (copy) Portable Photoionization Detector (HNu) Hand-held Aerosol Monitor (HAM) Disposable Tyvek Coveralls Tyvek Hoods Duct Tape Safety Goggles Safety Boots Surgical Gloves Butyl Sampling Gloves n gt Rubber Boots or DisposableBooties Hard Hats (when near qverhead objects)
Safety Equipment (Level C - Respiratory)
Sampling and Measuring Equipment
Other
Full-face Respirators Combined Organic Vapor and
High-efficientcy particulate Cartridges Dust Prefilters
Level and Rod Measuring^Tape Stainless -SteeLShovels Stainless Stee^T rowels 165-foot Measuring Tape Methanol V
Distilled Water Paper Towels
SafopltngjSlassware (See Table 10) xCo6lers with Ice or Ice Pack
Clear Plastic Tape Re-sealable Plastic Bags
Gallon Drums
ite Maps Project Log Books Marking Pens Camera Photograph Log Forms Test Pit Log Forms Boring Log Forms Chain-of-Custody Forms Sample Assignment Forms Equipment Calibration Logs Extra Bottle Labels Spare AA Batteries for Meters Blank Federal Express Airbills
Project 90393 GEI Consultants Inc Page 1 of 1 January 171991
TABLE 7 - SEDIMENT SAMPLING EQUIPMENT REQUIREMENTS Field Sampling Plan OConnor Co Site Augusta Maine
Safety Equipment (Level C - Dermal)
Safety Equipment (Level C - Respiratory)
Sampling and Measuring Equipment
Other
GEI Consultants Inc
Health and Safety Plan (copy) Portable Photoionization Detector (HNu) Hand-held Aerosol Monitor (HAM) Disposable Tyvek Coveralls Tyvek Hoods Duct Tape Floatation Vest Inflatable Boat Safety Goggles Safety Boots Surgical Gloves Butyl Sampling Gloves Rubber Boots or Disposable obties Hard Hats (when near overheackobjepts)
V Full-face Respirators Combined Organic Vaporand
High-efficiencyHPartjculate Cartridges Dust Prefilters
Level andRod Measuring Tapp 165-foot MPasuririgTape Methanol V Distilled Water jper tpwels V
SjE(mplinsect~Glassware (See Table 10) Cdolbrs wlthjbe or Ice Pack
Clear Plastic Tape Re-sealable Plastic Bags
-Galloh Drums fghted Measuring Tape e Sediment Sampler dge Sediment Sampler
Site Maps Project Log Books Marking Pens Camera Photograph Log Forms Chain-of-Custody Forms Sample Assignment Forms Equipment Calibration Logs Extra Bottle Labels Spare AA Batteries for Meters Blank Federal Express Airbills
Project 90393 Page 1 of 1 January 17 1991
TABLE 8 - SURFACE WATER SAMPLING EQUIPMENT REQUIREMENTS Field Sampling Plan OConnor Co Site Augusta Maine
Safety Equipment (Level C - Dermal)
Safety Equipment (Level C - Respiratory)
Sampling and Measuring Equipment
Health and Safety Plan (copy) Portable Photoionization Detector (HNu) Hand-held Aerosol Monitor (HAM) Disposable Tyvek Coveralls Floatation Vest Inflatable Boat Tyvek Hoods Duct Tape Safety Goggles Safety Boots Surgical Gloves Butyl Sampling Gloves Rubber Boots or Disposable Booties Hard Hats (when nearOverhead objects)
w Full-face Respirators Combined OrganicVaporand
High-efficiency Particulate Cartridges Dust Pi
Level and Rod
Measuring Tape M3amp-foot Measuring Tape JsopropyhAlcohol Mbthanol DistlHed Water PaperTowels Sampling Glassware (See Table 6)
oolers with Ice or Ice Pack tear Plastic Tape
Re-sealable Plastic Bags 55-Gallon Drums Weighted Measuring Tape Kenmerer Sampler Disposable 045 Micron Field Filters Pressure Pump for Field Filtering pH Meter with Temperature Probe Cole-Parmer pH-40 70 Calibration Solutions Cole-Parmer 1413 Micromhoscm Calibration Solution
Project 90393 GEI Consultants Inc Page 1 of 2 January 171991
TABLE 8 - SURFACE WATER SAMPLING EQUIPMENT REQUIREMENTS Field Sampling Plan OConnor Co Site Augusta Maine
Other Site Maps Project Log Books Marking Pens Camera Photograph Log Forms Chain-of-Custody Forms Sample Assignment Forms Equipment Calibration Logs lt Extra Bottle Labels Spare AA Batteries forM6ters Blank Federal Express Airbills Xy
Project 90393 GEI Consultants Inc Page 2 of 2 January 171991
TABLE 9 - BARN SAMPLING EQUIPMENT REQUIREMENTS Field Sampling Plan OConnor Co Site Augusta Maine
Safety Equipment (Level C - Dermal)
Safety Equipment (Level C - Respiratory)
Sampling and Measuring Equipment
Other
Health and Safety Plan (copy) Portable Photoionization Detector (HNu) Hand-held Aerosol Monitor (HAM) Disposable Tyvek Coveralls Floatation Vest Tyvek Hoods Duct Tape Safety Goggles Safety Boots Surgical Gloves Butyl Sampling Gloves Rubber Boots or Disposable Bboties Hard Hats (when near overheackpbjects)
Full-face Respirators Combined OrganicVapor and
High-efficiencyParticutale Cartridges Dust Prefilters
Gas powered electrfcgenerator 5 gallonsgaspline 350 feetNplectricahextfnsion cord Self-standin^work-larnps (200 watts minimum) Electric 38drilkwith two 1-inch wood boring bits ElectricBoschhammer drillwtungsten-carbidemortar bit Hpound-cut polyethylene sheeting and duct tape
Steel blaRing sheet X^vdiSpdsabfe nylon brushes
Stainless steel trowels Three 100 cm templates andone 25 cm template Forceps Peper towels Silf-sticking adhesive labels and push pins
Site Maps Project Log Books Marking Pens Camera Photograph Log Forms Bam Sampling Forms Chain-of-Custody Forms Sample Assignment Forms Equipment Calibration Logs Extra Bottle Labels Spare AA Batteries for Meters Blank Federal Express Airbills
Project 90393 GEI Consultants Inc Page 1 of 1 January 171991
TABLE 10 - SAMPLE CONTAINERS AND PRESERVATION REQUIREMENTS Field Sampling Plan OConnor Co Site Augusta Maine
Holding Media Parameter Container Preservation Time
PCBs 8 oz glass jar 4deg C 14 days-with Teflon- extraction lined lid 40 days shy
analysis
cPAHs 8 oz glass jar 4deg C 14 days-SOIL with Teflon- extractionSEDIMENT lined lid 40 days shyWOOD
analysisCONCRETE AND WIPE Lead 8 oz glass jar 4deg C 6 months SAMPLES with Teflon-
lined lid
Bench-scale 5 gallon high NA NA testing density
polyethylene bucket
PCBs Two 1-liter 4deg C 7 days shyamber glass extraction bottles 40 days shy
SURFACE analysis WATER
Lead 500mi HN03 4deg C 6 monthsSAMPLES polyethylene to pH bottle lt20
Aluminum 500ml HN03 4deg C 6 months polyethylene to pH bottle lt20
NOTE All standard sample containers will be l-CHEM equivalent bottles supplied by the laboratory The 5-gallon polyethylene bucket will be rinsed with methanol and distilled water prior to use
NA = Not applicable
Project 90393 GEI Consultants Inc March 28 1991
gt 1I L )
i bullbullbull j bullgti sil- j-V
poundP
A C
jfr35
QUAOnANQLE LOCATIONTOOU9 POND MAINEJI881)N4416-W37-307B
bull4000 FEET
Central Maine Power Company Pre-Design Work Plans SITE Augusta Maine OConnor Site LOCATIONFrom EC Jordon Co RIFS
Augusta Maine MAPReport dated June 1989
C D Project 90393 January 1991 Fig 1 G E I C o n s u l t a n t s I n c
b-r
p pp l-I 0 x foooo^ _^_ZZZ~~r^-^
UpoundEtpound 1IMA iRAMWOfMII NOW AM A OAAMAG IWAllrj WWEOfOHAMMS MHICUOn Central Maine Power Company Pre-Design Work Plans LOCAIION Oh
in cuelt^KL2 Augusta Maine OConnor Site TRANSFORMER
Scale 1 inch = 142 feet Augusta Maine WORK AREAS AND SWALESFrom EC Jordon Co RIFS
Report dated June 1989 C D G E I C o n s u l t a n t s I n c Prnjprf QfttM January 1QQ1 Fifl 0
~- bull middot bull -middot r middot~middotmiddotmiddotIll middotmiddot t~r
I bull Imiddot
bull bull1 middotmiddot middotir-------~-------middot ~ bull middot middot-------------------middotmiddot ~ middotmiddotmiddotamiddot A middotimiddot r bull amiddot A I bull TWA I tmiddot LOW AREA A NO~TH) SOUTH) I
v
A middot
rmiddot---middot---middot~middot---- ----middot~middot [WEST) [W[ST) (EASr) middot I
middot middot middotmiddot AmiddotA D-D 220 SCRAP ARf-A 201 -
bull - I
nor 140 TWA I 2bull0
1 bull middotbullmiddot1~-~~ L~W AR1-A ---- middot-~ l0 ~
i r bull I -$-~middot
0 - )1 _~ ~ middot1~oi I EEltY
J I ~2J~ bullbull
bullf()omiddot middotmiddot middot~ bull0 2 i- 0
11bull I lo bull ~middotmiddotmiddot~middot ~ ~--middotmiddot~middotbull ~-8~-i~~jplusmny~f~=ii1 - ~ bull ___ I I- _5 middot~bull-tmiddoti~middot~ N ~ bullbull ~ i I o middot TP19 gt - ~ ~ Jmiddot ~I middot~middot~I bullJUI 215 middot 215~-I e bull TP23 if 21~ ~ middot middot middot_ ------ ~middot - L middot~ ~ ~~ 1 i i
235 middotQ1middot1middotmiddot ~ bullbull ~~middot~middot- Lil middot~ _~ middot f bulllto --- z middotmiddot middot
middotr
-lt lt -middot I ~ middot ~ I
1 c ~ __ ) bull bull bullmiddot bull --middot Q
middot bull bullbull - 1middotmiddot - bullbull ~middots middot- uPPfR 1middotmiddot T LAGOON 1middot middot -$- middot middotmiddotpoundpound~middotmiddotmiddotmiddotmiddot bull =lt middot
~ middot ~~ iP22 gt middotgt
w
210 I
-
------_7___ 210 1 _
w_ +-
middot middot w--~ J210 middot i~30 -- middot_
1 TP18 bull middotmiddotI middot~ ----shy middot-middotmiddot
middot~ I j
middot- t - I 1 I BEDROCK 11 I
1
lmiddotmiddotomiddotmiddotmiddotmiddotmiddot middot middot middot =middot _middotmiddot middotmiddotmiddotmiddot 1 I rI Th 205 bull 205
bull -middotmiddot bull_ 1 225 22 middot bullbullbull fltISmiddot middot middot ~ ~middot f4tmiddotmiddotmiddot I J205 1bull
middot OOTR10U1t0N craquo-middotPC~middot~oN~A~ SEL11r~~~TS H LO~ AR~A ------------------------------------------------bull1 BASEO IN PART ON QBSERVATION Of FILL PlACEMENTmiddot bullmiddot E~middot-1middot bull bullbullbull middotmiddot Q - _
_
-1 I
fmiddot bull bull
-middotmiddot I r-middot shy c bull
I omiddotmiddot
r- middotmiddotI ~I
1 middot1 r bull bullf-Sf1 TWA I middotbull middot ~ i1 bull bull middot (EASfJbullI middot-----bullI (WEST) middotI bull I 1I cmiddot middot~ I~ ~ I bull bullbullbullI 1bullbull
(EAST) - bull middot- - I
bull bull r ~middot l
~
~30 i
2io bull
middot) Ibullbull
I
- J l TPl7 bull- f ~j -middot middotmiddotmiddotmiddot I 1 J middotmiddot1
middot~ ~ bull middotimiddotmiddotch bull bull_ t-ROAOI cli middot bull ~ middot1middot
225
I bull ILmiddot i~A--middot1middot 225 bull
1225 middot I ~ CENTRAL DRAINAGE middotmiddotmiddot--Q-middot --middot _ --middot
~ I -- -shy A middot
bull B-B --- m
- _ - middoti-- 10bull ~ m
g r
220 220 I ~
I middot _
l MI r ~ I
middot middot 1bull bull1 111
I rbull bull
middot
bull bull l
215 BEOROC~ 215
bull I bull middot - -
) l
-middotshy- bull Il
I 5 -middot middot middottc bull bull gt f bull 110 1~ w 210 210 ~ middotmiddotmiddotmiddotmiddot middot-middot -
( bull
middotlt bull [ I
bull G -
-middot-
middot middotmiddot bull ~middot-middot-- -middot- t~middotmiddotmiddotmiddotmiddotmiddot middotmiddot middot L -middot 1 -middot~ bull bull - middotmiddot L middot-~ _ bull f middot middot1 I ~ l
205 bull bull ~middot JO~cmiddotimiddotmiddotmiddotmiddot middot--middotmiddotmiddot1 _~ middotmiddotmiddotmiddotmiddot middotmiddotmiddotmiddotmiddotmiddot bullI bull middot -middotmiddotmiddotmiddotmiddotmiddotg
bull -$-middotmiddotmiddot middot~middot iii~~- ~0 i TB-20 SUBSURFACE BORING NUMBER bull bull bull TPmiddot 105 TEST PIT NUMBER
middot
bull1
bull I TP16 middotmiddotmiddotmiddotmiddot~ Q G) ) mmiddot i GROUND SURFACEmiddot bull 1bull 1middot bull I i ~ u o I bullbullbull I~ bullbullbull bullbullbullbullbullbullbullbullbullbullbullbull bullbullbullbullbullbullbullbullbullbull bull middot bull
ll bull bullbullbull middotmiddotoz bull I 250 CONCENTRATION OF PCBs IN SCREENED SAMPLE lPPm) r lt bull bull I
middot CONCENTRATION CONTOUR middot middot bull - -- CROSS-SECTIONS CONTOURED AT 5ppm 50ppm ANO 500 ppm TOTAL PCBs
middotbull middotmiddot c- I bull ~~ ND NOT DElECTED -middot ~ I
middotmiddot middot--middot~ middot sect t I middot UNDERLINED VALUES ARE CLP RESULTS (ppm)bull
middot -____ bull ~~ - -- I
bull bull middot -middot middot bull Ibullbull middot ~- middot --- LEGEND (ISOPACH MAP) bull lmiddot I l
I
-middot 1 middot I
bull middot ~SUBSURFACE EJORING LOCATION middot
-t middot ( 10766 - 10 10186) middot middot J BORING NUMBER -2 middot THICKNESS OF SOIL CONTAINING PCBs IN EXCESS OF 5 ppm
I
bull ~ middot
LOW AREA BORING LOCTION (107187)
- I j
I
bull BORING LETTER - ~ THlC~NESS OF SOIL C011TAINING PCBs IN EXCESS oF Sppm middot middot middot middottmiddot=plusmn+ TEStPIT LOCATION 1 bull bull bullbullbull i 0~ Q G) I -$ ELECTRICAL EQUIPMENT SAMPLE POINl middot middot -middot bull 1-1 I ~ bull
If bull bull ) bullbull bullbullbullbullbullbullbullbullbullbull f4( middot~01 l - bullmiddotomiddot
middot - ( ~-~ SURFICIAL EXTENT OF SOILS CONTAINING gtSppm PCBs bull middot (
bull __ ~ -middot middot_ middotmiddotmiddotmiddotmiddotmiddotmiddotmiddot _ - middotmiddot --- bull bull -bull - ISOPACH LINE ILLUSTRATING THICKNESS OF SOILS CONTAMINATED BY middot middot middot -middot~middotmiddotbullmiddotmiddotmiddot middotmiddotmiddot bullbull middot middot bull middotmiddot middot 8 -- bull _CONTOURS [)RAWN _-- ~ _l bull abull lO_fEF lran_~OUllCStRF~CI gt~~~~ ~~~~bull
I bull middot T o o bull bull middot middotmiddot
) NOTES 1 -middot -middot bull
I1 THE ISOPACH CONTOURS WEREDRAWN TO DENOTE THE THICKNESS OF SOIL ~ Q iP1 middot 0 bullbull 5 bull GEi BORING LOCATIONS middotMEASURED FROM THE SURFACE CONTAMINATED BY GREATER THAN 5ppm TOTAL PCBs bullbull bull bull I THE VALUE OF 5ppm WAS CHOSEN ARBITRARILY AND IS NOT INTENDED TO REPRESENT
middot bullv middot-- - l A SITE-SPECIFIC CLEAN-UP LEVEJ GEi TEST PIT LOCATIONS
2 CRO~S-SECTIONS ILLUSTRAt EXTENT OF PCB CONTAMINATION WITH DEPTH I middot- -f j bull I
_ veRTt6l1 EXAGGEP1r10M m c~oss sicT1c~S 1s 61 middot
bull
middot
I middotshy1
middot J~uJt bull bull i ~ ~ _ - middot j
1 ~ middot bull bull bull middotmiddot l a )
0 gt bullmiddot -~I middotbull I 0 middot r middot- bull ibull I
bull
_ _ I I ~
middot I
bull bull
bull middot~r
- -middot- - -
bullI l middotI middot I bull r f I I
~_ Igt bull
bull f middot
t bull middot bullbull 8 _
~ 7 I r 9
-middot- bull bull I I ~
middot 1
bull ____________________________ ___ _ bull I
bullI 1 bull middot -~ bullr
---------r- -- -- middot~-~~~~middot--middot ~ f middoti middot
bull t ~
bull
middot j
1
-------- -------- ---------------------------- ti 1
bull ~---middot ------middot ~---middotmiddotmiddotmiddot-middot--middot-middot~---middot-- ___~------- middotmiddotmiddot middot middotrbull ~ ~--~~-~middot-~ 1 middotmiddotmiddot I
middot bull middot4J middotmiddot 1 middot
middotI 1
I
bull
bull
middot ~ middotimiddot 1 bull j-1 ~ bullbull bull I bull i ~
APPROXIMATE SCALE I DESIGNED
~ BY
bullIbull Imiddot bull SOURCEmiddot EC JORDON CO RlFS middot bull Central Maine Power Company Pre-Design Work Plans SOIL I ~ t
middot
middot bullmiddot I ~middotmiddot ( bull bull REPORT DATED JUNE 1989 bullL bullr middotmiddot bull ~I middotmiddot DRAWN BY I I bull 1 r bull ~ middotmiddot middot
bull r shy~middot r i Augusta Maine OConnor Site bull SAMPLING I Imiddot 0 middot bull
bullI
bull bull
r bull 40 80
J 1bullmiddot
CHECKED BY Augusta Maine middotLOCATIONS
h cf I ~ 1bull rmiddot_
1 Inch =~Feet t--~------~---_middotmiddot~ I ~middot bullgtIbull
) i _- DATE January1991 middot middot middotmiddotmiddot tbull middot1middotmiddot APPROVED BY GE I Consultants Inc
middot
middotmiddot middot t---P-R_O_J-EC_T_9_0_39-3-----4-S-H-E-ETmiddotmiddotOfFbull t DATE REVISION BYmiddotmiddot J middotFlg3 middot
1 nuovN( POST middot 1 Nl6~1 middot bullbull Ibull Ibull bull bull lomiddot bullbull -
I
I
I
------------ -
) bull middot i bull I
~ f I middot1 bull ~I r
I
middot
-middot- CJ middotYmiddotmiddot I
C bull
middot
I middot I
middot -shy bull bull middotmiddot~
J middot _ bull y
Ibull bull
~ bull ~~ r I bull middot bull
middot bull
I ~ I I ( I bull
JI t
- I
J l I
-~ 1 I
bull j middot middot~ ~ middot) __-_ bull i
Ibull I lt bull
middotmiddotmiddot
gtImiddotmiddot
I
I bull
middotmiddotmiddotmiddot_v -
~ bull J i 1 bullbull
r 1 I ~ middotbull middotbull
I I I l~_middotgt~~bullI~~~bull~middotmiddot jbull1111 1 bull~ - 1 111 middot~ bull1 middot 1middot I jbull I bullI _- middotmiddot 1 1t1 _ 1 (Imiddot 1 bull1 1gt middot~middotlt~middot middot
I l bull bull 1 r I bull bull middot
bull middot middot middot middot~middot ~middot middot~
- J ~J ~~ O lt hj I bull ~ bull bull 1 o t I lbull I
middotmiddot bull ~ middot I bull middot bull bull
middot bull - I middot ~middot
bull 11 ( _ I
middot I Ii lfI ltI
bull
I 1- bull_ II ~ I middot
I bull vmiddotmiddot
30 I ~middot middot bull bull
lt 1 I ---middot _ bull I ~ bull bull ~ bull
II ~
111
bull bulll3 bull ~ middotmiddot bull Ibull 0 I 1 bull 111 bull bull I rbull1 middot 0 I I I - Ibullmiddot 1 bull r middot middot __ -
i bullmiddot ~ ----middot yen ~ bull ~ j
--~middot
I
I
- -- ( middotmiddot~middotmiddot- - bullbull~ _ ~- I ~ bull--- shymiddot ----bull
1- -
bullbull I I - ~ I I bull middot middot ~ I middot
1
---- _ --
bull1 II I j
I bullbullbullbull
II ~
J 1bull ~
I
bull I I bull I ~ middot Tmiddot I 1 ~ bull JI I t Ibull bull ~ bull middot
I -
-----~_ middot1
-1
~
bullbull
-
bullbull I
middot---- a I AiLWO _ middotshy
I
bull f l
I bullbull - middot I - bullbullbull
SVf1
S~D1- -0 sih3 0
I I 0 1 i ---shy (]
middot bullgt I
I J middot bull bull IIbull Iamp middot P I 177
r o ~ 0 SEol l-middot J~ I - -- ltl
f bull bull
gt1 bullI 1 V bull ~ II ~ tJ middot -middot-
I
middot1 - bull bull bull -middot
bullmiddot -bull wmiddot ~ ~ ~
bull IA1 gtW2 - gt1
- - ~ -
middotmiddotmiddot----- ~r=02 bull bullmiddot I __ i Ctt1rr--shy
bullI
Q bull _
1
D I bullbull middot - bull
SW2
I middot- bull
bullI ~middot
rl
~ se02 I bullbullbull I bullbull ~ L-lf L-- I
- ___ bull bull___ I bullbullbull
I bull ) I f IIUZ middot___ ---- bull cu bull
I gt
bullbull -shyI bull Ii bull f
~ middotmiddot~ ~ middot - I
I bull ~ ) I~ shy bullfmiddot~ ~ i ~ ~middot
~ I 1
bull 4 Ot f I
1 i f ~ bull lt
1
bull bull I
___ - ~)____ - ------~ -------middot-middot-r--middot-middot ----middot- - ---middot-middot-middot-middotbull
t t - -- a
I middot bull -- middot - __ __--~~~=--~---_-~= _ _ middot - I ii- - ~~=-=~==--=~middotmiddot-~=~~~~~~=-~~~======middot=middot~middot== middotmiddot-- _ - I
bull -------------------~_
t ~middot middot middot middotbull bull middot i------------1I Imiddot ~~f~=-~~J~i~~~f~U+--f~~~===~~-~~middot~f~=~=~=~~fi~-~-~==~~-==~==~~==~====~==~-=-==~=~=2~~~~~~~77=~=~=~~-=~s)middot==~~~--=-=~~~=~=~====-=====~~=~~~~~=~=~=~==~==-=~=~=middot
middot 7gt JloltGKLA lllD --- shy l lf-nt RT n bull middotl bull
I
-i~------ - -- -------- -- --= bull (
( ei -~ ---- -------- - - - - - bull - shyI bull middot 1 ------
--------~____-____ bull SSmiddotsmiddot~middot2-iJi_8plusmn~plusmn-~~plusmn=+=~==-=-==~~===~~~~~~=-=s~~2~-~s-==~~~z--==~=~~t-=-=-=-==-=---~34~~~-==-=-==-==~=middot==---~=-middot~i~middotmiddot~ middot)~ f ________bull _
~--- __ - ____ - bull shyI I
bull __ _ ~ ~ ~ middott1 middot_
J(J--_ 11bull middot ------deg gt
middot -f ~~~se~middot~ARm~OMAarra~PERfOAMagtBY 0 middot~ bullO ( l r
r-------------liDElmiNEiiiiY-r---Amiddot----------________---~-------------_____ __________middotmiddot_lIbull middotmiddotmiddot ACHERON ENOINEERINCI 8ERVJCED COMPLIED IU8lo BASll MAP
(middot VERIFIED TO MEET NATIONAL MAP ACCUAACI 8TANOARD8(NMJ) middot Tl1ROUQltATEaT GURVltY CONOUCIED Df JORDM 121aa LEG~ APPROXJMATESCALE DESIGNED BY
-----------_ ---------~ CentralMalnePowerCompany p D W kPI middotSURFACEWATERANDmiddotmiddot_-~middotmiddot~~~middotFitow~middot~(TOO~MEETNMAamp DRAwN BY re- es1gn or ans middot middot middot shy bull bull bull - bull
bull Aug~sta Maine OConnor Sitamiddot SEDIMENT SAMPLING middot3middot~~~middot~--~~amCla~~~~~~usa-o middot O GEISEDIMEITTSAMPUN~LOCATI~Ns o 40 middot 80 1
BY LOCATIONS ~middot)~middot ~ bull 11i GEISURFACEWATERSAMPUNGLOCATIONS middot CHECKE
rh A~gustaMalne lt middotmiddot( middotmiddot 11nch-40Feet DATEmiddot January 1991
middot APPRovED BY -V GEi Consultants Inc ~ Imiddotgtmiddotgt middotmiddot middot middot souRCE EC JORDON co RlFS bull middot GEi COMPOSITE SEDIMENT SAMPLE bull DATE REVISION BY - PROJECT 90393 SHEET OF middotI middotmiddot middotI middotAEPORTDATEDJUNE1989 v COUECTEDFORBENCH-SCAIETESTING
I J ~ I
i I bull I )__ )
I I ilo I Ibull
X -4 mdashmdash-0shy
W A Elec-Zl lt4W
Meters Shelves ^ Pickup
A CapAntique a)
W WAutomobile W J
ia iW Y
W A o
LEGEND C w
Stove - wBoat X Designated Wall Label w
-e- -fr bulleshybull Cement SlabDust Sample
0 Wooden Wall Sample ZTaping Reference Origin
W Wipe Sample
Approximate Scale
NOTES 30 Feet
1 Ail locations on this plan are approximate
2 Sample locations are general Central Maine Power Company Pre-Design Work Hans EXAMPLE examples of the type of sampling Augusta Maine OConnor Site BARN SAMPLINGand the distribution Augusta Maine LOCATIONS
3 Revision No 1 (3-28-91) ltP G E I C o n s u l t a n t s I n c Project 90393336 January 1990 Fig 5
I I I I
I
I I
I
I
I
I
I
Document VoL II SC SAP Appendix A Revision 0
Date January 171991 Page 1
V
APPENDIX A zgt
s HEALTH AND SAFETY-PLAN
Source Control PrampDesign Studies CConnorCO^Site
Augusta Mkine shy_ lt
lt
NT lt
Document Vol II SC SAP Appendix A Revision 0
Date January 171991 Page 2
GEI CONSULTANTS INC SITE HEALTH AND SAFETY PLAN
Site Name OConnor Co Site
Site address Street Route 17 Qty Augusta State Maine
Proposed Site Activities Source Controlsampling of surface andsubsurface soilssediments surface water and the on-site barn
Proposed Date of Work April 1991 gt S
Original Safety Plan YES
Site Safety Coordinator Thomas S Bobowski
Client Central Maine Power Company^(CMP)
Site Contact Charles Nickerson (CMP)
Team PERSONNEL ^ IRESPONSIBILITIES Robert E Stetkar lt ^mjectManager Joanne O Morin Work Tlans and Pre-Design Studies Manager Richard F Murdock Qhality Assurance Officer Benjamin YSu Treatability Studies Manager Joseph G Engels Technical Consultant Steven R fcambx Source Control Sampling Task Manager Thomas S Bobowski7 Barn Sampling Coordinator Sampling Boyd P Smith Sampling Christopher L Covel Sampling William J Haswell Sampling Charles Blodgett Field Screening Analytical
Background Information
The OConnor Co Site (Site) covers approximately a 9-acre portion of a 65-acre parcel within the city limits of Augusta Maine The Site is surrounded by sparsely-developed residential or agricultural properties or undeveloped woods and wetlands (Riggs Brook and associated wetlands border the Site to the east) The F OConnor Co operated a transformer stripping and recycling operation on theSite from the1950s through the 1970s
Document VoL II SC SAP Appendix A Revision 0
Date January 171991 Page 3
During operations releases of wastes including PCB-laden oils resulted in contamination of water and soil on the site Principal features of the Site include a barn which formerly housed scrap operations an upland marsh formed by man-made disruption of natural surface water drainage upper and lower surfacewater impoundments (lagoons) constructed to control migration of oils from the Site a low area where excavated lagoon sediments were deposited within a clay liner three former transformer work areas a former scrap yard and a wetland associated with Riggs Brook A site plan depicting some of the major features of the site is shown in Figure HS-1
Ax In 1986 and 1987 remedial investigations were performed byECvJdrdan Co for Central Maine Power Company (CMP) These investigations included over^OQ soil samples 11 monitoring wells and analysesof surface water ground water sediment and biota for PCBs organic and inorganic chemicals The primary contaminantsdetected in soil and sediments at the Site were PCBs PAHs and Lead Chlorinated benzenes PCBs phthalates and to a lesser extent volatile organics and metals were detected in ground water and PCBs and metals were detected in surface water Using these data Clement AssociatesInc performed an Endangerment Assessment in 1988 for EPA^evaluating risks to human health and the environment associated with existing condiuoi^ra^Tuture conditions related to a noshyaction remedial alternative In 1989 EC JordabCoi acting as consultant to CMP completed a Feasibility Study which evaluated remedial alternatives based on information provided in their earlier Remedial Investigation Report and in the EPA Risk Assessment Report After receipt of the Feasibility^Stiidy Report EPA issued a Record of Decision (ROD) in September 1989 describihg the^EPA^elected remedial alternatives for source control and management of migration
Site Status Waste Types
Includes the followin
Ground water Surface water Sediment Soils On-site structures
Refer to Table1for listing of chemicals of concern during Source Control studies per media sampled
Document VoL H SC SAP Appendix A Revision 0
Date January 171991 Page 4
Hazard Evaluation
Known orSuspected HazardousToxicMaterials Polychlorinated biphenyls (PCBs)volatile organic compounds (VOCs) polycyclic aromatic hydrocarbons (PAHs) and metals (especially Lead) The ranges of concentrations of chemicals detected in all source control media on-site are presented in the attached Tables 1C through 1L from previous studies Concentrations of PCBs PAHs and Lead detected in surficial soikduring previous studies (including the on-site Barn) are shown in Figures HS-2 HS^3 and HS-4 respectively Concentrations of chemicals detected in surface water and sediihentsduring previousstudies are shown in Figure HS-5 lt( x
The primary concern at the Site is contamination of surface soils by spillage or leakage of transformer oils containing PCBs The potential forencountering concentrated wastes in the transformer work areas (TWA I TWA II andltTWAIlI) is high In addition wastes have also been identified in soils and sediments associatedwith the lagoons and drainage swales Within a short distance of these discrete areas of the site the potential for encountering significant concentrations of wastes-is low ToYeduce the likelihood of being exposed by wastes associated with these areasduring~source control sampling activities efforts should be made to avoid walking unnecessgrilyriiv these areas
Exposure to hazards from chemiealsduiing test plying and environmental sampling and analysis tasks are most likely to occurbyone-or more of the following
1 Direct contact with contaminated surficial and subsurface soils sediments or surface-water x N
mdashN2 Inhalation of fu^Uve^ust carrying contaminants
3 Inhalation of volatile orgsuuc compound vapors while test pitting or sampling the various media on-site
Toxic and Pharmacological Effects Refer to the NIOSH Guide to Chemical Hazard Table 2 lists the major chemicals of concern and their toxic and pharmacological effects Acute exposure to PCBs PAHs Lead and VOCs may result in dizziness or nausea The results of chronic exposure may include but are not limited to central nervous system depression liver and kidney damage and irritation of skin eyes and respiratory passages Many PCBs PAHs and VOCs are known or suspected carcinogens Routes of exposure include inhalation topical and ingestion
Document Vol II SC SAP Appendix A Revision 1
Date March 28 1991 Page 5
Heat-related illnesses range from heat fatigue to heat stroke the latter being the most serious Heat stroke requires prompt treatment to prevent irreversible damage to health Protective clothing may have to be cut off Less serious forms of heat stress require prompt attention to prevent further complications which may lead to heat stroke Unless the victim is obviously contaminated decontamination procedures should be omitted or minimized so that treatment may begin immediately
Hypothermia may result from personnel exposed to excessive cold during sampling operations Hypothermia requires prompt treatment to prevent serious damage to health Damp or wet clothing may have to be cut off and the persons body temperature must be elevated as soon as possible through the use of warm blankets or another persons body warmth Unless the victim is obviously contaminated decontamination procedures should be omitted or minimized so that treatment may begin immediately
Area Within Augusta Maine city limits
Proposed On-Site Activities Test pitting boring or hand augering for collection of surface and subsurface soil samples collection of sediment and surface water samples from an inflatable boat or from wading into the water with hip-boots and collection of samples from within the on-site Barn Potential physical safety hazards during each of the four proposed Source Control site activities are discussed per activity below
Test Pitting and Borings for Surface and Subsurface Soil Samples A backhoe will be used during test pitting operations to excavate soil for collection of samples The most significant hazard during this sampling effort is the potential for collapse of the excavation while sampling Therefore in accordance with OSHA and 29CFR1926 Subpart P if personnel are required to enter an excavation the excavation will be no deeper than 5 feet unless it is braced or sloped back For the Type A soils documented on-site (eg clay and glacial till) the required slope from the ground surface to the top of unbraced portion of the excavation in all directions is 05 HORIZONTAL 1 VERTICAL Short-term excavations of this type will not exceed 12 feet in depth In general a drilling rig will likely be used to obtain samples from depths below 5 feet by augering to a specified depth and using a split-spoon sampler
Document Vol H SC SAP Appendix A Revision 1
Date March 28 1991 Page 6
Other physical hazards during test pitting and boring operations include the presence of overhead objects (eg backhoe bucket) so hard hats must be worn during these tasks at all times In addition the potential for spreading contamination with fugitive dust during excavation and mobilization between sampling locations is much greater than during other Source Control sampling efforts Therefore Level C dermal and respiratory equipment must be worn during all test pitting and boring operations (see below) Additional decontamination procedures will be required between sampling areas to limit the potential for cross-contamination (see below)
Sediment and Surface Water Sampling These operations will be conducted using Level C dermal protection only The need for respiratory protection will be based on criteria discussed in the next section In order to collect sediment and surface water samples in interior portions of the Upland Marsh and Upper and Lower Lagoons an inflatable boat or hip-boots will be used Further sampling will be performed by walking along the shores of the surface water bodies while dragging a sediment sampler These operations involve the risk of falling in relatively deep water while equipped with Level C dermal protection This equipment may limit movement and may inhibit a person from swimming easily to safety Therefore while sampling with the boat a Coast Guard Approved life vest will be worn at all times In addition one person will standby on-shore to observe the boat operation and to assist in the event of a mishap Depending on the water and air temperature at the time of sampling it is possible that a person who had fallen in water may require treatment for hypothermia or shock
Barn Sampling The barn can be classified as a confined work space since it is fully enclosed and has a limited number of exits In order to operate safely in a confined work space special considerations are necessary Unlike some confined spaces the barn has numerous small openings in the wooden structure to allow for an adequate supply of air while collecting samples However the sampling effort will likely generate a significant amount of airborne dust within the barn which means that Level C dermal and respiratory protection must be worn at all times while in the barn One person will remain outside the barn during the sampling effort to observe the sampling personnel and to provide backup services Two Combination Type A-B-C fire extinguishers capable of extinguishing wood and paper flammable liquidis or electrical fires will be available (one inside and one outside the barn with the standby person) in the unlikely event of a fire occurring during sampling
Document VoL H SC SAP Appendix A Revision 0
Date January 171991 Page 7
In accordance with OSHA 29CFR1910120 a minimum lighting intensity of 5 foot
candles will be provided within the barn during sampling The creation of dust and the
low lighting which may be available in some areas of the barn is likely to limit vision
some of the time Special care must be taken to avoid tripping over the numerous
objects disposed of within the barn No electricity is available in the barn so power
will come from outside the barn to supply power for lighting and tools to be used in
the sampling effort This means that electrical extension cords will be laid out on the
floor to various sampling locations In addition a large amount of metal and wooden
debris exists within die barn which may become obstacles to free movement in certain
areas The wooden floors of the second story and loft ofxthe^arn are extremely
deteriorated in some places and should not be accessed unless authorized by the Site
Safety Coordinator v
The use of electric power tools to collect samples ^wobd boring and concrete drills) require special care The use of Level C dermal protection such as loose fitting gloves may make handling the drills more difficult Use speciaLcare to avoid contacting the moving bits of the drills while in operation tonvoid tearing tyveks or gloves If dermal protection is torn replace or patch it immediatelybefare proceeding with the sampling operation
Perimeter Establishment
MapSketch Attached See bdquo Perimeter Identified Access to site is restricted at all entry points via a locked
8-foot high cyclone fence^- x y
Zone(S) of contamination identified See Figure HS-1 through HS-5
Document Vol II SC SAP Appendix A Revision 1
Date March 28 1991 Page 8
Recommended Level(s) of Protection On-site personnel will use Level C dermal protection at all times See below for respiratory use
1 Protective Clothing
Sampling and decontamination personnel in these areas will wear
bull Disposable Tyvek coveralls over cotton coveralls bull Tyvek hoods bull Safety glasses or face shield bull Hard Hat bull Disposable booties over workbooks or waders for sampling surface water and
sediments bull Butyl rubber gloves over surgical gloves bull All gloves and booties will be taped to the Tyvek coveralls
2 Respiratory Protection
Air purifying respirators will be worn at all times while sampling during test pitting and boring operations and while inside the barn Otherwise the need for respiratory protection will be determined by on-site monitoring for organic vapors and the daily potential for exposure to airborne particulates The decision to utilize air-purifying respirators due to airborne particulates will be made by monitoring with a MIE MINIRAM Hand-held Aerosol Monitor (HAM) Based on previous studies (Endangerment Assessment Appendix F) an action level for worker safety of 10 mgm3 of respirable dust was established for the site Therefore when readings on the MINIRAM of 10 mgm3or greater are experienced Level C respirators will be worn Initial on-site monitoring for organic vapors will be conducted using an HNu Photoionization Detector (PID) Ambient vapor levels of 5 to 10 ppm above background in the breathing space will require the use of full-face cartridge respirators (Level C Protection) Background levels will be determined at the edge of the Site (ie fence line) before the initiation of the days activities Air quality will be monitored at the upwind boundary of the site at three locationsfor a duration of one minute at each location The maximum PID reading at each location will be recorded and the three readings will be averaged to determine the background level for that day Respiratory protection will be full-face respirators fitted with combined organic vapor and high-efficiency particulate cartridges (MSA Type GMA-F) Respirator cartridges will be replaced at a minimum on a daily basis Depending on readings obtained with the MINIRAM cartridges may be replaced at mid-day on windy days
Levels of organic vapors greater than 10 ppm above background in working areas will necessitate utilization of self-contained breathing apparatus (Level B Protection) During sampling HNu monitoring should be utilized to detect any changes in organic vapor levels Changes in fugitive dust or vapor level detection at any time may warrant appropriate alteration of required respiratory protection
Document VoL H SC SAP Appendix A Revision 0
Date January 171991 Page 9
Decontamination and Disposal
A decontamination areawill be assembled at the entrance to the site The decontamination zones will be established such that personnel and equipment are fully decontaminated prior to leaving the fenced area In addition all personnel will be familiar with proper decontamination procedures prior to going on site All personnel entering and exiting the hot zone shall pass through the decontamination zone
1 Personnel Decontamination
The personnel decontamination sequence is as follows
a Samples and equipment are dropped on plastic sheets
b Disposable booties Tyvek coveralls and contaminated outer gloves are first brushed off with soapy water then rinsed with clean water by decontamination personnel Thedisposable equipmenfis^then removed baggedand placed in a 55shygallon drum marked Dry Deconv
c Neoprene boots and outer gloves are washed if they were not drummed in Step b with soapy water and ririseck with clean water An additional rinse with methanol followed by a firiak water-rinse completes the sequence
lt d Neoprene boots and glovesare -removed
e Respirators (cartridge-change) are removed if necessary and disposed in the Dry Decon drum
f Surgical gloves are temovfedand disposed in the Diy Decon drum
Document Vol M SC SAP Appendix A Revision 0
Date January 17 1991 Page 10
2 Equipment Decontamination
The equipment decontamination procedure for Source Control sampling work performed inside the fenced area of the site is as follows
a All disposable items (eg surgical gloves plastic sheeting nylon brushes etc) will be discarded in the Dry Decon drum
b Heavy equipment such as the backhoe and drilling jig will be steam-cleaned on a specially constructed decontamination pad located east bfthermain site access gate and north of the ground water monitoring well couplet MW1Q2A and MW102B (see Figure HS-7) The pad will be constructed to allow for drainage of steam-cleaning solutions onto a bermed multi-layer -impermeable barrier consisting of several layers of at least 6-mil-thick polyethylene sheeting overlain and underlain by geotextile fabric The geotextile fabricwilfbe designed to collect contaminated sediments which may have collected on tires or excavating equipment Rinse water from the decontamination processwill then fre pumped through hoses or channelled for drainage into the Uppei^La^oomafter completion of surface water and sediment sampling The decontamination pad will be left in place after completion of field sampling
c All other equipment contacting surface or subsurface soils sediments surface water or materials within thebarm(egtrowels spatulas templates drill bits etc) will be decontaminated by rinsing with clean water scrubbing with methanol and re-rinsing with distilledwater Solutions which contain methanol will be collected for disposal into tHeJWet Decon drum Equipment used during barn sampling will then be drted^with paper towels and the towels will be disposed in the Dry Decon drum ^
3 Decontamination Station Closure
The procedure for decontamination station closure will be as follows
a Decontamination personnel shall be responsible for closing the station at the end of each workday
b All solid wastes such as plastic tarps bags and Tyveks will be placed in the Dry Decon drum and will be closed at die end of each workday
Document Vol IISC SAP Appendix A Revision 0
Date January 171991 Page 11
All spent decontamination solutions containing methanol will bedisposed of in the Wet Decon drum Decontamination solutions which are not composed of methanol and exhibiting PID readings below 1 ppm will be poured into surficial soils on the edge of TWA I within the fenced area of the site If PID readings are greater than 1 ppm the solutions will be disposed in the Wet Decon drum These drums will be closed at the end of each workday
d Drums shall be secured on-site until proper disposal is arranged after consultation with EPA
7 Air Monitoring Procedures X
Site Monitoring Equipment PID HNu PI-101 HAM MIE MINIRAM
Since Level C respirators will be used during test pitting and barn sampling air at the test pit and barn sampling areas will be monitoredfegularly with a PID and HAM primarily for future reference of the levels of VOCs and dustto^be expected during remedial activities During the other sampling efforts air monitoring wiH form the basis for whether an upgrade to Level C respiratory equipment is necessary TheltPID will be used regularly during soil sediment and surface water sampling^ TKampHAM will be used at least twice per hour while on-site to monitor for dust levels in air^Whenunusually windy conditions are experienced additional monitoring for dust levels wilLbe^erfbrmed When ambient temperatures in air are below 32deg F the chart recorderattachment for the MINIRAM must be used as the LED readout on the instrument may not operate below freezing All PID and HAM readings will be recorded in theJield Log Book
Document VoL H SC SAP Appendix A Revision 0
Date January 171991 Page 12
Emergency Information
Location Phone
FIRE Augusta (207) 623-2511
POLICE Augusta (207) 623-2511 State Police (Augusta) (207) 621-1200
AMBULANCE Augusta (207) 623-25tlx N
HOSPITAL Kennebec Valley Medical Center (207) 626-1000 Augusta Division N 6 East Chestnut Augusta ME
Chemical Trauma Capability Yes
EPA (Michael Jasinski) 7) 573-5786
DEP (Thomas Benn) (207) 289-2651
CMP (Charles Nickerson) (207) 623-3521
Directions to Hospital (See Fig HS-6)
Primary route to hospital is west on Route17 (Eastern Avenue) to Arsenal Avenue turn right on Arsenal Avenue and go3 blocks to E Chestnut street then right Emergency room entrance is 6 East Chestnut Street Alternate route - west on Route 17 (100 yards) to Cony Road turn right on Cony Road take^rst left (Cony Street Ext) to Riverside Drive go left on Riverside Drive the second mtejsection will be Arsenal Street goleft on Arsenal Street East Chestnut Street will be second left
Document VoL H SC SAP Appendix A Revision 0
Date January 171991 Page 13
Additional Emergency Contacts
DR DAVID EGILMAN (617) 935-8581 HEALTH RESOURCES WOBURN MASSACHUSETTS
GEI CONSULTANTS INC
ROBERT E STETKAR (603) 224-7979 JOSEPH G ENGELS (617)721^4022 s
TSCA HOTLINE (800)424-9065
AT amp F (EXPLOSIVES INFO) (800^424-9555 V
NATIONAL RESPONSE CENTER x(8W) 424-8802
PESTICIDE INFORMATION SERVICE (800)845-7633
RCRA HOTLINE y -(800) 424-9346
CMA CHEMICAL REFERRAL CENTER (800) 262-8200V NATIONAL POISON CONTROL CENTER (800) 942-5969-y
US DOT bdquo (202) 366-0656
GEI CONSULTANTS ^ (603) 224-7979
Prepared by Thomas S Bobowski Date January 7 1991
Reviewed by Robert E Stetkar Date January 9 1991
All personnel working at this site have received OSHA required health and safety training Personnel are enrolled in a medical monitoring program A summary of training completed for all GEI personnel involved in the Source Control sampling program is provided in Table 3
Use of Common Sense is Required
I have read and understand this safety plan
Name (printed) Signature Date
Table 1A Organic and Inorganic Chemicals Detected in the Shallow Aquifer
Groundwater Samples at the F OConnor Site Maximum
Concentration Geometric Background
Range Mean[a] Concentration (ugL)
Chemical Frequency (ugL) (ugL)
ND(b]-2300B[c] 150 NDAcetone 211 ND-15J[d] NA[e] NDBenzene 211 ND-45 143 ND2-Butanone 17 ND-83 53 NDChlorobenzene 311 ND-53 NA NDToluene 27 ND-12J NA NDTriehloroethene 1P ND-11 81 NDBis(2-Ethylhexyl)Phthalate 411 ND-25 1deglaquo2 ND12-Dichlorobenzene 411 ND-14J 97 ND13-Dichlorobenzene 311 ND-13J 96 ND14-Dichlorobenzene 311 ND-29 94 ND124-Trichlorobenzene 17 ND-19 07 NDTotal PCBs 111 27-5085 06 49Aluminum 55 27-805 24 42Barium 55 13700-125451 38300 26600Calcium 55 ND-145 53 NDChromium 25 ND-37 NA NDCobalt 15 ND-285 66 14Copper 35 33-4952J 590 3Iron 55 ND-18 37 NDLead 15 21-2906 260 24Manganese 55 ND-154 10 NDNickel 15 ND-17 37 NDSilver 15 10593-72812 33400 14000Sodium 55 ND-71 71 NDVanadium 15 17-946 263 91Zinc 55
a) Calculated using detected concentrations and one-half of EPAs contract laboratory program (CLP) detection limits for the organics For the inorganic
chemicals the aqueous CLP detection limits were used
b) ND - Not Detected
c) B designates Chat substance was also found in the blank though the
sample level was significantly higher to prove a positive detect
d) J designates estimated value
e) NA - Not applicable Chemical was detected infrequently and the use of
one-half of the detection limit in calculating a mean results in a mean
concentration that exceeds the maximum Therefore a mean is not used
SourceEndangerment Assessment dated Jan 29 1988 by CDM
Table IB Organic and Inorganic Chemicals Detected in Bedrock Aquifer
Groundwater Samples at the F OConnor Site
Mean Concentration Geometric Background
Chemical Frequency Range (ugL)
Mean[a] (ugL)
Concentration (ugL)
Acetone 220 ND[b]-1200 68 ND Benzene 220 ND-27J[c] NA(d] ND Chloroblt ene 620 ND-16 36 ND Toluene 215 ND-27J NA ND Bis(2-E vlhexyl)Phthalate 1320 ND-64 Hi 61 12-Dich 13-Dic^
irobenzene jrobenzene
720 120
ND-26 ND-24J NA
66 ND ND
14-Dic^ robenzene 620 ND-44 82 ND Di-n-Bu phthalate 120 ND-22J NA ND 124-Tr hlorooenzene 720 ND-310 161 ND N-Nitros iiphenvlamine 25 ND-4J NA ND 3eta-BHC 110 ND-04 004 ND Gamma-BH (Lindane) 110 ND-006 003 ND Total PC 320 ND-50 LO ND Antimony 110 ND-55 19 ND Barium 1010 15-129 138 56 Chromium 410 ND-268 54 ND Cobalt 110 ND-115 92 ND Iron 1010 61-384301 837 152 Magnesiu Manganes
1010 810
5960-46250 ND-5895
15220 661
4203
27 Nickel 310 ND-345 125 ND Potassiu 1010 3504-16046 6560 4340 Vanadium 110 ND-52 NA ND
a) Calcul ted using detected concentrations and one-half of EPAs contract labor 3ry program (CLP) detection limits for the organics For the inorganic chemic Is the aqueous CLP detection limits were used
b) ND mdash F detected
c) J de Ignates estimated value
d) NA - N applicable Chemical was detected infrequently and the use of one-ha of the detection limit in calculating a mean-results in a mean concern ation that exceeds the maximum Therefore a mean is not used
Source Endangerment Assessment dated Jan 29 1988 by COM
Table 1C Organic and Inorganic Chemicals Detected in In-Fence Surface Soil
Samples at the F OConnor Site Mean
Concentration Geometric Background Range Mean[a] Concentration
Chemical Frequency (ugAg) (ugkg) (ugAg)
19 ND[b]-19J[c] NA[d] ND Chicroform ND29 ND-150B[e] 63Methylene Chloride
ND19 ND-30J NAToluene 260J19 ND-917J 260Bis(2-Ethylhexyl)Phrhalate
Carcinogenic PAHs ND19 ND-2700J 290BenzoltAgtAnthracene ND29 ND-12000J ^10BenzoltB or KgtFluoranthene ND39 ND-11000J 540Chrysene ND39 ND-23183Total CPAHs
Non-carcinogenic PAHs ND39 ND-12000J 540Pvrene ND39 ND-12000 540Total NCPAHs ND118186 ND-6205600 3400 Total PCBs 4001419 ND-64000 1900Cadmium 292001919 17000-29480000 275000
Copper 570001919 29000-2681000 213000Lead 252001919 19000-90000 35000Nickel ND219 ND-12000 650Silver 738001919 45000-1160000 183000Zinc
aj Calculated using detected concentrations and one-half of EPAs contract UboSto program (CLP) detection Unite for the organic For the inorgar-c chemicals the detection limits for soils were based on aqueous CLP
detection limit
b) ND - Not Detected
c) J designates estimated value
d) NA - Not applicable Chemical was detected infrequently and the use of one-half of the detection limit in calculating a mean results in a mean concentration that exceeds the maximum Therefore a mean is not used
e) B designates that substance was also found inthe blank though the sample level was significantly higher to prove a positive detect
Source Endangerment Assessment dated Jan 29 1988 by Clement Associates Inc
Table ID
Organic and Inorganic Chemicals Detected in the TVA III Surface Soil Samples at the F OConnor Site
Concentration Geometric Background Range Meanfa] Concentration
Chemical Frequency (ugAg) (ugAg) (ugAg)
44-DDT 13 ND[b]-5200 150 ND 44-DDE 13 ND-260 56 ND Total PCBs 2131 ND-620000 2940 ND
Antimony 11 189000 41000
Cadmium 11 11000 400 Copper 11 230000 29200 Iron 11 60900000 22200000 Lead 11 634000 57000 Zinc 11 799000 73800
a) Calculated using detected concentrations and one-half of
ErAs contract laboratory program (CLP) detection limits
b) ND - Not Detected
Source Endangerment Assessment dated Jan 29 1988 by Clement Associates Inc
Table IE irganic Chemicals Detected in Upland Marsh Sediment
Samples at the F OConnor Site[a] Maximum
Concentration Geometric Background Range Mean[b] Concentration
Che ical Frequency (ugAg) (ugAg) (ugAg)
To ane 11 23J[c] - ND[d] To- 1 PCBs 33 1300-34000 6425 ND
a) norganic chemicals were also analyzed for but none were itected significantly above background concentration
b) alculated using detected concentrations and one-half of PAs contract laboratory program (CLP) detection limits
c) J designates estimated value
d) D - Not Detected
Source Endangerment Assessment dated Jan 29 1988 by Clement Associates Inc
Chemical
Acetone 11 408B[c] ND[d]
Bis(2-EthyIhexy1)Phthalate 11 2082 ND
Toluene 11 28J[e](f] ND
Total PCBs 44 30000-1100000 381000 ND
a) Inorganic chemicals were also analyzed for but none were detected
significantly above background concentration
b) Calculated using detected concentrations and one-half of EPAs contract
laboratory program (CLP) detection limits
c) B designates that substance was also found in the blank though the sample
level was significantly higher to prove a positive detect
d) ND - Not Detected
e) J designates estimated value
f) In a duplicate sample toluene was not detected A geometric mean of the detected value and one-half of the detection limit would have resulted
in a mean concentration exceeding the detected value Therefore only
the detected value is listed
Source Endangerment Assessment dated Jan 29 1988 by Clement Associates Inc
Table 1G Organic and Inorganic Chemicals Detected in Lower Lagoon Sediment
Samples at the F OConnor Site Maximum
Concentration Geometric Background Range Mean(a] Concentration
Chemical Frequency (ugAg) (ugAg) (ugAg)
Bis(2-Ethylhexyl)Phthalate 12 ND[b]-100J[c] NA[d] ND
Benzoic Acid 22 120J-190J 150 ND Total PCBs 77 3202-40100 8660 ND
Cadmium 12 ND-2500 790 ND c 22 27000-59000 40000 20000
Lead 22 17000-70000 34500 ND
Manganese 22 525000-982000 718000 474000
Selenium 12 ND-760 436 ND Zinc 22 103000-249000 160000 108000
a)Calculated using detected concentrations and one-half of EPAs contract laboratory program (CLP) detection limits for the organic For the inorgan chemicals the detection limits for sediments were based on the aqueous CLP
detection limit
b) ND - Not Detected
c) J designates estimated value
d) NA - Not Applicable Chemical was detected infrequently and the use of
one-half of the detection limit in calculating a mean results in a mean
concentration that exceeds the maximum Therefore a mean is not used
Source Endangerment Assessment dated Jan 29 1988 by Clement Associates Inc
Table 1H Organic and Inorganic Chemicals Detected in Riggs Brook Sediment
Samples at the F OConnor Site Maximum
Concentration Geometric Background
Range Mean[a] Concentration
Frequency (ugAg) (ugkg) (ugAg)Chemical
12 ND[b]-30 12 NDMethylene Chloride
Carcinogenic PAHs 22 160J[c]-790 360 230JBenzoltAgtAnthracene 22 220J-800 420 290JBenzoltAgtPyrene 22 2-63J-1600 650 710J3enzoltB or KgtFluoranthene 22 280J-960 520 400J
Chrysene 12 ND-190J NA[d] NDDibenzltAHgtAnthraeene 12 ND-400J 340 NDIndenoCl23-CDgtPyrene 22 1507-4740 2670 2402Total CPAHs
Non-carcinogenic PAHs 12 ND-110J NA NDAcenapthy1ene 12 ND-200J NA NDAnthracene 12 ND-410J 350 ND
BenzoltGHIgtPerylene 22 280J-1200 580 420J
Fluoranthene 12 ND-80J NA NDFluorene 22 72J-680 220 150J
Phenanthrene 22 290J-1500 660 470J
Pyrene 22 1810-4180 2750 2584Total NCPAHs 615 ND-6481 870 NDTotal PCBs 12 ND-1200 775 NDSilver
a) Calculated using detected concentrations and one-half of EPAs contract laboratory program (CLP) detection limits for the organics For the degrgan chemicals the detection limits for sediments were based on the aqueous CLP
detection limits
b) ND - Not detected
c) J designates estimated value
d) NA - Not applicable Chemical was detected infrequently and the use of one-half of the detection limit in calculating a mean results in a mean
concentration that exceeds the maximum Therefore a mean is not used
Source Endangerment Assessment dated Jan 29 1988 by Clement Associates Inc
Table II Inorganic Chemicals Detected in Upland Marsh Surface
Water Samples at the F OConnor Site[a]
Sample Background
Concentration Concentration
Chemical Frequency (ugL) (ugL)
Aluminum 11 884 104 Arsenic 11 35 ND(10)[b]
Barium 11 12 47 Iron 11 3540 1160 Lead 11 36 ND(5)
Manganese 11 ^29 134 Potassium 11 7260 3610
a) Organic chemicals were also analyzed for but
none were detected
b) ND - Not Detected Limits of detection are
given in parentheses
Table 1J Organic and Inorganic Chemicals Detected in Upper Lagoon
Surface Water Samples at the F OConnor Site
Sample Background
Concentration Concentration
Chemical Frequency (ugL) (ugL)
108 ND(10)[a]Total PCBs 11 47Barium 11 23
6 ND(5)Lead 11 Manganese 11 1450 134
25 ND(40)Nickel 11
a) ND - Not Detected Limits of detection are given in
parentheses
Source Endangerment Assessment dated Jan 29 1988 by Clement Associates Inc
Table IK Organic and Inorganic Chemicals Detected in Lover Lagoon
Surface Water Samples at the F OConnor Site Maximum
Concentration Geometric Background Range Mean[a] Concentration
Chemical Frequency (ugL) (ugL) (ugL)
Total PCBs 22 13-375 221 ND[b] Aluminum 22 56-3740 458 104
Arsenic 12 ND-4 NA[c] ND
Barium 22 12-37 67 47
Cobalt 12 ND-9 NA ND Iron 22 1970-8260 4030 1160
Lead 22 91-13 109 ND
Manganese 22 137-2330 565 134 Potassium 22 5200-6220 5690 3610
a) Calculated using detected concentrations and one-half of EPAs
contract laboratory program (CLP) detection limits for the organics For the inorganic chemicals the aqueous CLP detection
limits were used
b) ND - Not Detected
c) NA - Not Applicable Chemical was detected infrequently and the
use of one-half of the detection limit in calculating a mean
results in a mean concentration that exceeds the maximum
Therefore a mean is not used
Table 1L
Inorganic Chemicals Detected in Riggs Brook Surface Water Samples at the F OConnor Site[a]
Maximum
Concentration Geometric Background Range Mean[b] Concentration
Chemical Frequency (ugL) (ugL) (UgL)
32 NDAntimony 13 ND[c]-35 5 NDLead 13 ND-16
a) Organic chemicals were also analyzed for but none were detected
b) Calculated using detected concentrations and one-half of EPA s
contract laboratory program (CLP) aqueous detection limits
c) ND - Not Detected
Source Endangerment Assessment dated Jan 29 1988 by Clement Associates Inc
Chemical
Acetone |CHCOCH3l Dimethyl ketone ketone propane
Toluene |CHCHJ _ e bull bull a O J Jtoluol phenyl aethane aethyl benzene
Cblorobcnzene (CHC1) aonochlorobenzene chlorobenzol
Ethyl benzene |C_HCH| phenyl ethane ethyl benzol
ACC TLV or STEL
ltPPB) (PfB)
750 1000
100 150 skin
75 (550agaraquo)
100 125
TABLE 2 CHEMICAL TOXICITY AND OTHER INFORMATION
Physical Skill Dcraal LD^ (mgkg) State Penetration Tonicity Potency ofraquoI(rat)
bullbullbull local it 9750liquid Bint-like odor
1297(nice)
liquid t local 5000
TC|Huosn =Ml00 ppa
colorless liquid 2910
colorless liquid local H 3500 with aromatic odor
syatcaatic bullbullbull TCu(Kiais) c 100 ppa
A hrs
Page 1 of 4
Remarks
Syaptoas Irritates eyea none throat narcotic in high concentrations
Target Organ respiratory aystea skin
First Aid Swallow water voait Skin soap wash
Incoapatibilities oxidizing materials acids Fire hazard when csposed to beat or flame
Tonicity 1 Persistence1 0
Syaptoas fatigue confusion euphoria dizzy headache dialated pupils lack of appetite nervousness insoania
Target organ CNS liver kidneys skin
First Aid Swallow NO VOHIT 8kln soap waah
Incoapatibilities strong ozldizers
Toxicity1 2 Persistence 1
Syaptoas irritates eyes nose causes drowsiness incoordination skin irritation
Target organ respiratory systea eyes skin cars liver
First Aid NO VOMIT
Incoapatibilities strong oxidizers reacts violently with AgClO^
Toxicity 2 Persistence 2
Syaptoas irritant to eyes and aucous aembrane headache narcotic
Target organ eyes upper respiratory systea
First Aid NO VOHIT
Incoapatibilities oxiding asterisks dangerous when exposed to heat or flame
TABU 2 Page 2 of 4 CHEMICAL TOXICITY AND OTHER INFORMATION
(continued)
ACC TLV or STEL Physical Skin Dcraal ID (agkg)
Cheaical (PPff) (PPB) State Penetration Toxicity Potency orsl(rat) Rcnarks
Benzene benzol
IC^H) 10 23 colorless liquid with aroaatic odor
local systeaatic
bullbull
bullbullbull Poisoning occurs aost coasaonly through lnhalationi also penetrates through akin
Syaptoass lrritatea eyes nose respiratory systea giddiness head nausea staggered gait fatigue depresesion sbdoaioal pain
Target organs bloody CNS skin bone narrow eyes respiratory systea
First Aids Swallows 8kins
NO VOMIT soap wash
Inconpatibilitiess strong oxidizers chlorine hronine with iron Dangerous when exposed to beat or flaae
Toxicitys 2 Persistences 1
Trichloroctbylcne ethylene trichloride tridene TCE
30 200 colorless liquid sweet odor
4820
1900(dog)
Syaptoass headache vertigo vision distortion treaors soanolcnce nausea voait irritates eyes cardiac errytbaiss paresthesias
Target organs respiratory systea heart liver kidneys CNS skin
First Aids Swallows Skins
Ipecac voait soap wash immediately
incoapatibless strong caustics chemically active actalss Da Li Ra Hg liquid O
Al 02 KN03 Ti
Persistences 3
Polychlorlasted biphenyi PCB Arocblor 1242 CjjHjClj(approx)
Arcblor 1234
C6H2C3C6M3C12
03
colorless to dark brown liquid with aild hydrocarbon odor
local systeaatic
local
Poisoning occurred Boat coaaonly through investigation or penetration of skin
Sypatoaas Irritates eyes (discbarge) skin scne-fora dernitatis Jaundice dark urine Target organs liver eyes skin First Aids Swallows Ipecac voait
Skins soap wash isnediately Incoapatibless strong oxidizers
TABU 2 CHEHICAL TOXICITY AND OTHER INFORMATION Page 3 of 4
ACC
Chulcil TLV or STEL (ppa) (POO)
Physical State
Skin Penetration
Derail Tonicity Potency
U)n (ngkg) of Reaarka
Dloctyl phtbalate di-acc-octyl pblbalata
5 aga1
light colored liquid
31000 Tonicity low to none via oral and derail routca produce 01 ayaptoas
12 Bichlorobenzene (C^H CI ) o-OCB
50 none liquid ++ local systemic
Symptoms irritates eyes and nose Target Organs liverkidneysskineyes First Aid Swallow salt water vomit
Skin soap wash Incompatabilities strong oxidizers
14 bichlorobenzene (CHbdquoC1 ) 7 2
P-OCB 75 110 solid ++ local
systemic ++ Symptoms irritates eyesheadachesnauseavomiting
Target Organs liverkidneyskineyesrespiratory system
first Aid Swallow water vomit skin soap wash
Incompatablities none
Lead (Pb) 015 mgm
none solid systemic t Symptoms Fatigue headaches abdominal pain Target Organs kidneys 61 central nervous system First Aid Swallow water vomit
Skin soap wash
Polycyclic Aromatic Hydrocarbons (PAHs)
015 mgm
none liquid systemic + Symptoms No obvious symptoms Carcinogenic to tissue following prolonged contact
First Aid Swallow water vomit Skin soap wash
Page 4 of4TABU 2 CHEMICAL TOXICITY AND OTHER INFORMATION
(continued)
NOTES
TLV - Threshold Unit Value ACC - Acceptable Ceiling Concentration STEL - Short Tera Exposure Limit
Suspected carcinogens teratogens or mutagens Firat Aid Unless specified flrat aid for oil of the liated cbeaicala are aa followa
Eyeai iaaedlatcly waab with copious quantity of cold water Skins Flush with water proaptly Breath Artificial respiration Swallowi Water voait
a Slight Hazard aa Hoderate Hasard aalaquo Extreme Hasard
Toxicity Ratiosa
Toxicity Rating
No toxicity (none) Material causes no hara in any condition or produces
tosic effects on buaana in very unusual circumstances or
in very large dosage
Slight toxicity (low)
Moderate toxicity
Severe toxicity
Persistence or each hazardous substance ia evaluated on its blodegradabllity aa follows
Assigned Value
Easily biodegradable coapounds 0
Straight chain hydrocprbons 1
Substituted and other ring compounds 2
Metals polycyclic coapounds and halogenated hydrocarbons 3
Adapted with modifications from EC Jordon Co RIFS Work Plan
TABLE 3 - PERSONNEL TRAINING AND MEDICAL MONITORING HEALTH AND SAFETY PLAN Field Sampling Plan OConnor Co Site Augusta Maine
personnel1
Robert E Stetkar
Joanne O Morin
Richard F Murdock
Benjamin Y Su
Joseph G Engeis
Steven R Lamb
Thomas S Bobowski
Boyd P Smith
Christopher L Covel
William J Haswell
Charles Blodgett
NOTES
ANNUALreg MEDICAL
MONITORING
yes
yes
yes
yes
yes
yes
yes
yes
yes
yes
yes
lt
y
OSHA 40shyHOURreg HAZMAT TRAINING
yes
yes
yes
yes
yes
yes
yes
yes
yes
yes
yes
ANNUALreg RESPIRATOR
FITTEST
yes
no
no
no
no
yes
yes
yes
es Yes
yltes
-y
CARDIOshyPULMONARY
FIRST AID RESUSCITATION TRAINING TRAINING
no no
yes yes
nov no
no no
no no
yes yes
yes yes
yes yes
yes yes
no no
yes yes
1 Only GEI personnel assigpedttfdo work on the OConnor site included on this list
2 Includes baseline and annual physicals lilood testing etc
3 In accordance with 29CFR191012tkncludes annual 8-hour refresher course
4 Includes annual respirator fit testing procedures
Project 90393 GEI Consultants Inc January 17 1991
TOW MAXARJM PCS CONCENTRATION (gtbullraquo) 8Y AREA
Central Maine Power Company Pre-Design Work Plans INTERPRETED CONTOURS Scale 1 inch = 180 feet Augusta Maine OConnor Site OF PGBs IN
Augusta Maine IN SURFICIAL SOILS From EC Jordon Co RIFS
Report dated June 1989 0 G E I C o n s u l t a n t s I n c Project 90393 January 1991 FigHS-2
Central Maine Power Company Pre-Design Work Plans DISTRIBUTION OF PAHs Scale 1 inch = 180 feet Augusta Maine OConnor Site IN SURFACE AND
Augusta Maine SUBSURFACE SOILS From EC Jordon Co RIFS
Report dated June 1989 0 G E I C o n s u l t a n t s I n c Project 90393 January 1991 FigHS-3
Central Maine Power Company Pre-Design Work Plans INTERPRETED DISTRIBUTION Scale 1 inch = 180 feet Augusta Maine OConnor Site OF LEAD IN SOILS
Augusta Maine From E C Jordon Co RIFS
Report dated June 1989 ltD G E I C o n s u l t a n t s I n c Project 90393 January 1991 FigHS-4
Central Maine Power Company Pre-Design Work Plans ANALYTICAL RESULTS FROM Scale 1 inch = 160 feet Augusta Maine OConnor Site SEDIMENT AND SURFACE
Augusta Maine WATER LOCATIONS From EC JOrdon Co RIFS lttgtReport dated June 1989 G E I C o n s u l t a n t s I n c Project 90393 January 1991 FigHS-5
Contamination 80 Feet
Control Line
Central Maine Power Company Pre-Design Work Plans SITE ACCESS AND Augusta Maine OConnor Site DECONTAMINATION
Revision 1 March 281991 Augusta Maine AREA
laquo G E I C o n s u l t a n t s I n c Project 90393 March 1991 KgHS-7
bull
Document Vol II SC SAP Appendix B Revision 0
Date January 17 1991 Page 1
APPENDIX B
FieldtogjL
FIELD LOGS
Project Field Log Book Equipment Calibration Logs
HNu Pl-101 MIE MINIRAM MARKSON CONDUCTIVITY METER MARKSON DIGITAL pHTEMPERATURE
Photograph Log Health and Safety QA Logs
Chain-of-Custody Forms Sample Assignment Forms Non-Conformance Report Forms Test Pit Log Forms Barn Sampling Forms Dexsil L-2000 PCB analyzer Calibration Boring Log Forms
lt
Document Vol II SC SAP Appendix B Revision 0
Date January 17 1991 Page 2
(OCONNORFL1)
(OCONNORFL2) (OCONNORFL3) (OCONNORFL4) (OCQNNORFL5) pound0CONNORFL6) (OCONNORFL7)
-(OCONNORFL9) (OCONNORFLIO) (OCONNORFL11) (OCONNORFL12) fOCONNORFL13) (OCONNORFL14) (OCONNORFL15)
Note Field Log OCONNORFLampisassigned to ground water sampling described in the Management of Migration Sampling andiAnalysis Plan
Document Vol II SC SAP Appendix B Revision 0
Date January 17 1991 Page 3
PROJECT LOGBOOKS (OCONNORFL1)
Serialized project logbooks are to be issued by the site contractor to all personnel at the site who have been designated to perform specific field tasks Individuals must sign their logbooks upon receipt and use them to record all pertinent information until the project is completed y
Logbook entries should be dated legible and contain accurate and inclusive documentation of an individuals project activities Because the logbook forms the basisfor the later written reports it must contain only facts and observations Entries made by individuals other than the person to whom the logbook was assigned are dated andsigned by the individual making the entry bull
CALIBRATION LOG Document No OCONNOR FT1 HNu Photoionization Device Model Pl-101 Page 1 of 1
Instrument Serial No
Lamp Date Span Setting Time Calibration Temperature User
Standard Introduced Meter Response (parts per million (ppm))
Comments (See Summary of Calibration Procedures attached7
X x
User Signature Date
Task Manager Signatures Date
CALIBRATION LOG Document No OCONNORFI3 MIE MINIRAM Hand-held Aerosol Monitor Page 1 of 1
Instrument
Serial No
Date
Time
User
Standard used (zero-bag)
Meter Display
Comments
User Signature lt Date X
Task Manager Signature l Date
CALIBRATION LOG Document No OCONNORFL4 Markson Conductivity Meter Model 103 Page 1 of 1
Instrument Serial No
Date Time User
Standard Used_ Meter Display^
Comments
s
v
lt
y xy ^y
User Signature Date z V
Task Manager Signature ) i Date
CALIBRATION LOG Document No OCONNORFU5 Markson Digital pHtemperature Meter Model 95 Page 1 of 1
Instrument Serial No
Date Time User
Temperature check vs mercury thermometer
Probe reading Thermometer reading
Upon completion of calibration procedure does pH probe checkout vs pH 40 buffer Reading bull lt x pH 70 buffer Reading bull
Comments v
X x
User Signature X^ Date
Task Manager Signature Date
Document No QCONNORFT f
Page
PHOTOGRAPH LOG
Project Name
Project No
Camera and Film Specifications
FILM
ROLL FRAME
DATE nTIME PHOTOGRAPHER PHOTO NUMBER
DESCRIPTION
lt3
ni
I X
V
V
gt
Document No QOONNORm7
HEALTH amp SAFETY QUALITY ASSURANCE CHECKLIST
Page 1 of 2 Project No Site Date Completed by
A On-site Operations During Hazardous Waste Site Investigations
yes no Team understands task procedures safety plan individual roles and site history contaminants
yes no Team knowledgeable to hospital route nearest phone location and who is responsible for health and safety on site
yes no Establishment of command post and decon station with Health amp Safety Plan readily available
yes no Establish communication or line-of-site maintained
yes no Field operations conformed environmental monitoring respiratory protection or emergency response
yes no Protective clothing and respiratory protection maintained
yes no Decontamination procedures performed on the following sample containers sampling equipment and personnel
yes no Equipment protected clean calibrated and being used properly by site personnel
yes no First Aid Equipment readily available at site with checklist and eye wash
yes no Site personnel trained in CPR and First Aid
yes no Site Records maintained such as field logbooks respirator usage log incident reports in place and up-to-date and any deviations or modifications to Safety Plan
GEI Consultants Inc
uocutrenc uujmutvrLz
HEALTH amp SAFETY QUALITY ASSURANCE CHECKLIST
Page 2 of 2 Project No Site Date Completed by
B Health amp Safety Follow-up Reports
o Adherence to procedures o Accidents o Unsafe practices or conditions o Results of environmental monitoring o Corrective action
GEI Consultants Inc
Document No Q00NN0RFL9 CHAIN OF CUSTODY RECORD
DOCUMENT NUMBFR rn tLORD
RELINQUISHED DYISiONruRE OATETJMD RECEIVED DY (SIGNATURE) RELINQUISHED DY (SIOHATURER DATETI^IE RECEIVED BY (SIGNATURE)
IIElINOUISIIEO BY(SIGNATURE) DATETIMf DATETIME gt REMARKS lcNAruDn^nLADOnATonvorI
P a g e o f
Document No OCONNORFLIO
Page of G E I C o n s u l t a n t s I n c
Project No
Project Name _
Laboratory Contact
Sampler ( s ) Date Assigned Date Sampled
GEI Sample No
Sample Medium
Quantity
Sample Container
Type
Analyses Requested Remarks
Special Instructions Remarks
Document No 0CQNNDRFL11
NONCONFORMANCE REPORT
Project Project No
Auditor Audit Date Finding No
FINDING
Where found Check Lit Item
ControllingDocument Section
Task Description
Noncenformanee
Discussed with
Recommended Corrective Action
Is system correction needed to prevent recurrence Yes No If yes state recommended action
Schedule Completion Date By
CORRECTION ACTION
Correction Action by Date
QA Approval of Correction Action by Date
Date Completed Submitted by
Correction Action Verified by Date
I T E S T P I T L O G QCONNORFL12
PROJECT
LOCATIONI CLIENT
CONTRACTOR EQUIPMENTI OBSERVED BY
I DEPTH BELOW
GROUND SURFACE
I (FT)
I
I
I
1
1
1
1
I
1 REMARKS
PROJECT NO
LOCATION
GROUND EL
DATE DATUM
SOIL DESCRIPTION
PIT DIMENSIONS (FT) LENGTH WIDTH DEPTH
ltJgt G E I 1
I Docuaent No 0C0NNCRFL13
bull GEI CONSULTANTS IMC 53 Regional Drive Concord New Hampshire 03301-8500 (603)224-7979
BARN SAMPLING FORM Serial I
PROJECT INFORMATION
Project Name Source Control Pre-Oesion Studies
I Site Name(if different) OConnor Co site
Project Number
I Analytical Lab(s) ERCO EPA
GEI GC screen Other(Specify)
I METHOD OF SAMPLING
WIPE SAMPLING OF HON-POROUS SURFACES
I U000EH UALL SAMPLING UITH DRILL BIT
OUSTSOIL SAMPLING OH FLOOR SLAB
( CONCRETE SAMPLIHG ITH MORTAR BIT
(OTHER-Explain)
I
DESCRIPTION OF SAMPLE
Brief Description of Type of Material or Item Sampled
Visible Staining NO Visible Staining
Approximate Area of Stain(if any) X
LOCATION OF SAMPLE
Ground Floor Second Floor Loft
(All Measurements in Feet to 010 Foot)
Distance Along Z Axis from Reference Origin
Distance Along M Axis from Reference Origin
Height of Sample Above Floor Slab
SKETCH IN APPROXIMATE HORIZONTAL LOCATION OF THE SAMPLE COLLECTED ON FIGURE BELOU
I UALL X
I
I
UALL U UALL Y
I
I Reference Origin UALL Z
I Approximate Scale 1 inchbull 15 feet
I Sample I0(s) SIGNATURE OF SAMPLER CERTIFIES ABOVE SAMPLING RECORD
Date Time
I Sampler(s) COC Docunent Signature Date
I
CALIBRATION LOG Document No OCONNOR FL14 Dexsil L-2000 PCB Analyzer Page 1 of 1
Instrument
Serial No
Date
Time
User
Ambient Temperature deg C
Standard used (50 ppm chloride)
Reading beforeadjustingCALIBRATE knob
Reading after adjusting CALIBRATE knob
Comments
User Signature Date
Task Manager Signature Date
Document No OCONNORFL15 I BORING LOCATION DATE START FINISH
GROUND ELEVATION (NGVO ) DRILLED BY
GROUNDWATER El DATE LOGGED BY TOTAL DEPTH (FT) PG OF
I EL DEPTH S A M P L E
Its TYPE BLOWS PEN REC R E M A R K S QO SOIL ANO ROCK DESCRIPTIONSlt_land PER aFT FT NO 6 IN IN IN lt9
I
I
I
I
I
1
1
I
1
I
I
I
I
I
I BLOWS PER (-140IBHAMMER FALUNS 30T0 DRIVE NOTES A 20 IN 00 SPLIT SPOON SAMPLER
PEN-PENETRATION LENGTH OF SAMPLER OR CORE BARREL REC-RECOVERY LENOTH OF SAMPLE ROO-LENOTM OF SOUND CORES gt4INLENSTH COREO S-SPLIT SPOON SAMPLE PROJECT
I U-UNOtSTURBCO SAMPLES UF-FIXEO PISTON _ UO-OSTER8ERO bully OROUNOWATER 0 G E I
I
I
I
I
I
I
I
I
I
1 1 1 1 1 1 1 I 1 1 I
Document VoL H SC SAP Appendix C Revision 0
Date January 17 1991 Page 1
APPENDIX C
EQUIPMENT CALIBRATION PROCEDURES
Document Vol II SC SAP Appendix C Revision 0
Date January 171991 Page 2
HNu PI-101
The HNu PI-101 is factory calibrated twice a year andor if the instrument is malfunctioning Prior to field use and at the end of each day the user of the instrument will check that the instrument is still holding calibration using the following procedures
1 Prior to the calibration check check the instrument with an Organic point source (ie magic marker) prior to use to verify that it is functioning
2 Connect the rubber sampling hose from the span gas cylinder regulator to the sampling
probe of the HNu gt
3 Fully open the regulator valve gt vy
4 Note the instrument meter response after 5 to 10 Seconds y
5 If the response deviates + 15 from the coneentration of the calibration gas (this figure appears on the cylinder label) the instruihehtTeq^es factory maintenance and will not be utilized in the field until factory calibratiori^Tah alternate meter will be used after calibration checking v (
V 6 Document the calibration information Oik the appropriate equipment calibration log
(OCONNORFL2) ~y
Document VoL IISC SAP Appendix C Revision 0
Date January 17 1991 Page 3
MIE MINIRAM Model PDM-3
The MINIRAM will be factory calibrated once a year andor if the instrument is malfunctioning Prior to field use and at the end of each day the user will zero the instrument using the following procedure
1 With the MINIRAM off insert MINIRAM into Zerobag andseal the Zerobag
2 Inflate Zerobag with filtered air containing no particulates using-attached hand pumpx- V
S
3 Press ZERO button on MINIRAM and wait 30 seconds MINIRAMshould read OFF
4 Pull MINIRAM out of Zerobag
5 Press MEAS button and wait 60 seconds for MINIRAM to go through self-tests
6 The MINIRAM is now functioning and wilJLtake-readings every 10 seconds
7 Document the calibration information onthe appropriate equipment calibration log (OCONNORFL3) V
lt
v
Document VoL II SC SAP Appendix C Revision 0
Date January 171991 Page 4
MARKSON DIGITAL MODEL 103 CONDUCTIVITY METER
The Markson Conductivity meter will be calibrated prior to and following each days field use using the following procedures
1 Rinse the conductivity probe with distilled water gt
2 Pour enough Cole-Parmer conductivity calibration solution (1413 xS 25degC) in a clean plastic Ziploc bag to be able to completely immerse the conductivity probe
3 Immerse the conductivity probe in the standard solution and shakdTree any bubbles that may cling to the cell
4 Allow about 1 minute for the cell to reach equilibrium temperature x X
5 Set the cell adjust control at the bottom of the meter to display the value of 141
6 Carefully rinse cell with water after calibration and after each use V~
7 Document the calibration process onjlie equipment calibration log (OCONNORFL4)
Document VoL H SC SAP Appendix C Revision 0
Date January 17 1991 Page 5
MARKSON MODEL 95
Combined Digital pHtemperature Meter
The Markson 95 combined digital pHtemperature meter will be calibrated prior to and following each days field use using the following procedures
1 Insert electrode into digital meter The reference pin should also be properly connected Temperature probe should be plugged all the way into the ATC jack
2 Remove protective cap and push rubber sleeve such that the potassium chloride filling hole is exposed gt
3 Rinse both pH and temperature probe in distilled water 4 Immerse both pH and temperature probe into buffer 700 solution 5 Set FUNCTION switch to TEMPERATURE to read temperature 6 Set FUNCTION switch to ATC and adjust the readout to the pH value of buffer 700 corresponding
to the temperature measured in E with the CALIBRATE control See Chart 1 7 Rinse electrode and temperature probe withdistilled water 8 Immerse both pH and temperature probe into buffer^401 9 Repeat E V ~ 10 Set the FUNCTION switch to ATC and adjust the readout to the pH value of the buffer 401
corresponding to the temperature measured in Iwith the SLOPE control See Chart 1 11 Rinse the electrodes and temperatureprobe-with distilled water Model 95 is calibrated and ready
for use 12 Document the calibration process on the equipment calibration log (OCONNORFL5)
^ CHART
Temp (C) Buffer Solution 70 X -X
Buffer Solution 40
5 y 700 401 10 708 399 15 706 399 20 703 399 25 701 399 30 700 400 35 699 401 40 698 402 50 698 403 60 697 405
Document VoL II SC SAP Appendix C Revision 0
Date January 171991 Page 6
Dexsil Model L-2009 PCB Analyzer
The Dexsil PCB Analyzer will be calibrated prior to each days field use using the following procedures
Initial Preparation
1 The electrode must be filled with Orion filling solution before it is operational Fill the electrode up to the hole in the side of the epoxy body by-placing the nozzle of the filling solution in the hole and squeezing the bottle 7
2 Drain the electrode while holding it upright over thewaste beaker Grasp the epoxy body firmly in one hand and push down on the white cap which is connected to the cord The solution will then drain out of the bottom of the electrode
Vgt 3 Refill the electrode and check to makesure that the liquid is making contact between the black
cone and the plastic shell at the bottom of theelectrode If it is not making contact at all points drain the electrode again and refill
4 Plug the electrode into the back of the L-200Qj)laeeJt in a vial or rinse solution and turn the instrument on Switch the analysis knobtdfnVand wait a few minutes until the reading stabilizes
Calibration O Imdash^
1 Fill a vial about half way with 50 parts per million calibration solution
2 Turn the analysis selectQrJcnob to CAL
3 Remove the electrode from the rinse solution dry it carefully with a tissue and place it in the calibration solution SWiri the electrode gently for a few seconds and then stop Push the start button on the instrument^
4 When the READ light comes on adjust the CAL knob so that the instrument reads 50
5 Remove the electrode from the calibration solution wipe it dry and place in the rinse solution
6 If this is the first calibration since the instrument has been turned on or since the electrode has been filled repeat steps 34 and 5
7 Document the calibration information on the appropriate equipment Calibration Log (OCONNORFL14)
Document Vol II SC SAP Appendix D Revision 0
Date January 17 1991 Page 1
APPENDIX D X
list of Acronyms
Document Vol II SC SAP Appendix D Revision 0
Date January 17 1991 Page 2
ACRONYMS
ASTM American Society for Testing and Materials CLP Contract Laboratory Program CMP Central Maine Power Company DEP Department of Environmental Protection (Maine) DQO Data Quality Objectives EPA Environmental Protection Agency [US) FL Field Log FSP Field Sampling Plan ltys GEI GEI Consultants Inc gt HSP Health and Safety Plan X
MIE Monitoring Instrumentsforthe Environment MOM Management of Migration NA Not Applicable X lt OSHA Occupational Safety anaHeakh Administration OSWER Officer of SolithWaste and Emergency Response PCB PolychlorinatecFBiphenyk ppb Parts per billion v7 ppm Parts per million QA QuaUtyAssuranck ) QAO QudU$~^sitraquoance Officer QAPP QualityAssurance Project Plan QC Qukkty Gontrof PIP -Thotoionization Detector RDRA -mdashRemedial DesignRemedial Action RI Remedial Investigation ROD x^XRecbrd of Decision RPD X^Relative Percent Difference RPM Remedial Project Manager RSD Relative Standard Deviation SAP Sampling and Analysis Plan SC Source Control SOW Statement of Work TPH Total Petroleum Hydrocarbons VOC Volatile Organic Chemical or Compound

Document Vol II SC SAP Revision 0
Date January 17 1991 Page 8
2 SAMPLING AND DATA QUALITY OBJECTIVES
21 General
Sampling of soils surface water sediments and the on-site barn and its contents will be performed during the Source Control (SC) component of the Pre-Design Study Pre-Design SC sampling results will be used in the design of the SourceControl component of the remedy and development of the treatability testing program for soil and sediment
Pre-Design SC sampling will include N
Collection of surface water samples from the Upland Marsh and Upper and Lower Lagoons in April 1991 V
x
Collection of sediment samples from the Upland Marslkahd Upper and Lower Lagoons in April 1991 ^
Collection of soil samples from test pits and^Orihgsrin April 1991
bull Collection of samples of soil woodimckconcrete from the on-site barn floor and Walls and wipe samples from debris andlquipment located within the barn in May 1991
V-X7EPAs guidance document Data Quality Objectives for Remedial Response Activities (OSWER Directive 93550-78Jdarch 1987) identifies four analytical levels
Level I - field screeningoranalysis using portable instruments Results are often not compound specific and o^ qualitative in nature
Level II - field analyses using mbresophisticated portable analytical instruments Results are more reliable in terms of compound identification and may be semi-quantitative
Level El - laboratory analyses by established referenced methods Results are quantitative and compound specific
Level TV - EPA Contract Laboratory Program (CLP) services utilizing rigorous QAQC protocols and documentation
Level V - Laboratory analyses by non-standard methods Identified in the CLP asspecial analytical services
Document Vol II SC SAP Revision 1
Date March 28 1991 Page 9
A combination of Level I Level in and Level IV analytical protocols will be specified during Pre-Design SC sampling EPA Contract Laboratory Program (CLP) protocols prescribed in the 1988 Organic and Inorganic Statement of Works will be utilized for laboratory analysis of target compounds (PCBs cPAHs lead and aluminum) in surface water sediment soil and barn samples The analytical protocols that will be utilized for Pre-Design SC sampling are detailed in the SC Quality Assurance Project Plan (QAPP) included as Volume I of the SC SAP
22 Soils
Soil samples will be collected and analyzed to provide additional data for comparison with cleanup standards for design of the Source Control program at the OConnor Site Data will be used to refine the previously estimated volume of soils contaminated at various concentrations above the cleanup standards and to provide additional information at areas with apparent data gaps on the lateral and vertical extent of soil with PCB concentrations greater than 1 ppm Soil also will be collected at specified locations to provide samples for solvent extraction treatability bench-scale testing Samples selected for treatability testing will contain PCBs at concentrations previously not examined during limited bench-scale testing performed during the Feasibility Study (FS) The effectiveness of solvent extraction on removal of lead cPAH and PCB contamination will be examined during the bench-scale treatability studies performed during Pre-Design
The soil sampling program performed during the RI was designed to estimate the horizontal and vertical distribution of soils contaminated with PCBs lead and cPAHs above the cleanup standards The distribution of PCBs lead and cPAHs are summarized in the RI on Figures 4-8 4-10 and 1-10 respectively GEI identified several inconsistencies in the distribution of contaminated soils within the summary figures For instance the distributions of PCB contamination shown on Figures 1-6 and 4-8 in the RI in the northern portion of the site near TWA III do not agree Also previous soil sampling did not consistently confirm the horizontal and vertical limits of PCB contamination The vertical limits of the PCB contaminationwere not adequately identified for remedial design purposes near transformer work areas and along drainage pathways where PCB migration has occurred
The effectiveness of solvent extraction as the selected remedy for treating the on-site soils was not fully demonstrated during the FS The bench-scale testing that was performed during the FS did not investigate the full range of contamination levels and recovery efficiencies from different soil types that exist on the site
There are three primary objectives for collection of soil quality data during the Pre-Design studies
Document Vol II SG SAP Revision 1
Date March 28 1991 Page 10
1 Collect additional data with close control of analytical precision to evaluate datagaps and inconsistencies reported during the RI The collection of these data will primarily be performed near TWAs and drainage pathways
2 Refine the previously estimated volume of soils contaminated at various concentrations above the cleanup standards
3 Evaluate theselected remedy of solvent extraction through bench-scale testingof soils with specific ranges of PCB concentrations
All soil samples collected for treatability bench-scale testing will also have an aliquot collected for PCB analyses by Ceimic Corporation of Narragansett Rhode Island This will provide added confidence that designated samples are within the specified ranges of PCB concentrations for solvent extraction bench-scale testing
In order to facilitate comparison of Pre-Design Study soil quality with RI study soil quality rigorous QAQC protocols and documentation will be needed All sampleswill be analyzed by Ceimic Corporation using 1988 CLP protocols Analytical Level IV (CLP QAQC and documentation) will be utilized on 20 percent of the soil samples collected The remaining 80 percent will be analyzed according to 1988 CLP protocols utilizing Analytical Level III (CLP QAQC butwithout CLPdocumentation) These serviceswill provide detection limits at or below the ROD Cleanup Standards
During Pre-Design sampling equipment blanks will be collected and analyzed after decontamination of sampling equipment to identify artifact contamination that could result from incomplete decontamination of equipment Trip blanks will also be included during sample shipment to identify cross-contamination during transportation to Ceimic Corporation The laboratory and field QAQC procedures described above will enable the precision required to satisfy the objectives of the soil sampling component of this study
23 Sediments
Sediment samples will be collected and analyzed to provide additional data for comparison with the cleanup standards for design of the Source Control program at the OConnor site Data will be used to supplement the sediment quality data previously collected in the RI for a refined estimate of the levels of lead cPAH and PCB contamination in the sediments of the Upland Marsh Upper Lagoon and Lower Lagoon In addition a composite sediment sample from the Upper Lagoon and a composite sediment sample from the Lower Lagoon will be collected for solvent extraction treatability bench-scale testing Treatability testing on contaminated sediments was not performed during the FS The effectiveness of solvent extraction on removal of lead cPAHs and PCBs from sediments will be examined during the bench-scale treatability studies performed during Pre-Design
Document Vol II SC SAP Revision 1
Date March 28 1991 Page 11
The sediment quality data collected during the RI was limited Only two sediment samples were collected from the Upland Marsh Upper Lagoon and Lower Lagoon In addition limited data have been previously collected regarding the volume of contaminated sediment on-site
There are three primary objectives for sediment quality data to be collected during Pre-Design studies
1 Collect additional data with close control of analytical precision to examine levels of contamination in sediment at locations previously not investigated This will include two additional samples from the Upper Lagoon two additional samples from the Lower Lagoon and six additionalsamples from the Upland Marsh The investigation in the Upland Marsh will be directed towards delineating the extent of contamination in the westerly (upstream) direction
2 Refine the previously estimated volume of sediment in the Upland Marsh Upper Lagoon and Lower Lagoon
3 Evaluate the solvent extraction remedy effectiveness on treatment of sediment through bench-scale testing
In order to facilitate comparison of Pre-Design Study sediment quality with RI study sediment quality rigorous QAQC protocols and documentation will be needed Only sediment samples containing greater than 30 percent solids (based on visual observations) will be submitted for analysis After sample collection in the field percent volume of settled sediment in the sample container will be compared to the percent volume of free water Samples will be submitted to the laboratory for analysis if the volume of settled sediment in the sample container exceeds 50 percent of the total volume of the sample All samples will be analyzed by Ceimic Corporation of Narragansett Rhode Island following 1988 CLP protocols Analytical Level IV (CLP QAQC and documentation) will be performed by Ceimic on 20 percent of the sediment samples collected The remaining 80 percent will be analyzed by Ceimic utilizing Analytical Level in (CLP QAQC but without CLP documentation) These services will provide the detection limits at or below the ROD Cleanup Standards
During Pre-Design sampling equipment blanks will be collected and analyzed after decontamination of sampling equipment to identify artifact contamination that could result from incomplete decontamination of equipment Trip blanks will also be included during sample shipment to identify cross-contamination during transportation to Ceimic
The laboratory and field QAQC procedures described above will enable the precision required to satisfy the objectives of the sediment sampling component of this study
Document Vol II SC SAP Revision 1
Date March 28 1991 Page 12
24 Surface Water
The OConnor SiteStatement of Work for Remedial DesignRemedial Action requires that surface water contained within the Upper and Lower Lagoon and in the Upland Marsh be drained collected and transported off-sitefor treatment unlessotherwise instructed by EPA
The three primary objectives for surface water data to be collected during the Pre-Design Studies are to
1 Probe surface water depths in Lagoons and Upland Marsh to obtain a better estimate of surface Water volumes to be handled during remediation
2 Evaluate changes in surface water quality that may have occurred during the approximately three-year period since sampling during the RI and evaluate extent of surface water contamination in the Upland Marsh which is at the upstream edge of the PGB contamination area
3 Collect additional data to design an appropriate program for surface water diversion pumping treatment and disposal Off-site disposal destinations as well as on-site treatment and disposal options will be examined in more detail during the Pre-Design Study
All surface water samples will be submitted to Ceimic Corporation for analysis of PCBs aluminum and lead All of these samples will be analyzed following 1988 CLP protocols including CLP QAQC and CLP documentation (Analytical Level IV) One additional sample will be collected from each surface water body and submitted to Ceimic for Total Suspended Solids Analysis (EPA Method 1602) utilizing Analytical Level III
2JS Barn
The available data for the extent of contamination of barn materials consists of one sample point The surficial soil sample collected was not described such that it is known whether the sample consisted of dust the concrete slab soil within cracks of the slab or debris samples within the barn The elevated levels of PCBs and lead within the sample may not be representative of the majority of the loose materials within the barn Furthermore no wipe sampling on non-porous debris or sampling of the wooden barn structure was performed during the RI
Document Vol II SC SAP Revision 0
Date January 17 1991 Page 13
Cleanup standards for target chemicals listed in the ROD have not yet been established by EPA for barn materials The ROD indicates that the Toxic Substance Control Act (TSCA) Spill Cleanup Policy and Disposal Regulations (40 CFR Part 761) may be used in lieu of site-specific determination of acceptable levels
Samples of selected media within the barn will be collected and analyzed to provide an initial data set to establish the degree of contamination present within the barn Data will be used in developing the work plan for decontamination and demolition of the barn and to determine appropriate disposal sites for barn demolition debriSNand loose debris within the barn Depending on data results an evaluation will be made tbvdetermine whether additional sampling will be required prior to demolition to betterseqnence demolition activities so that PCB-contaminated material can beSeparated from non-contaminated building materials and debris
ltx All soil wood and concrete barnsamples will besubmitted to Ceimic Corporation (Ceimic) of Narragansett Rhode Island for analysis of PCBs cPAHsgtand lead Wipe samples of debris will be submitted to Ceimic for analySis-ofPCBs All samples will be analyzed following CLP protocols Analytical LeveK IV-requiring CLP QAQC and reporting requirements will be utilized for 20 percent of the5amples Analytical Level in utilizing CLP analytical protocols but without the documentation requirements of CLP will be specified for the remainder of the
Document Vol II SC SAP Revision 0
Date January 17 1991 Page 14
3 HEALTH AND SAFETY
A Health and Safety Plan for the Source Control Field Sampling Plan is presented in Appendix A All personnel involved in the sampling program have been trained in accordance with the requirements of the Occupational Safety and Health Administration Regulation OSHA 1910120 Hazardous Operations and Emergency Response and are enrolled in a comprehensive medical monitoring program
A list of personnel authorized to perform work on this project ^and listing of their participation in personnel training and health monitoring programs^arepresented in the Health and Safety Plan gt
Document Vol II SC SAP Revision 1
Date March 28 1991 Page 15
4 SAMPLING LOCATION AND FREQUENCY
41 Soils
411 General
In general the soil sampling program includes collection of the following two basic categories of samples
1 Soil samples collected from test pits for possible bench-scale testing and
2 Soil samples collected from test pits and borings to fill data gaps on the lateral and vertical extent of soil contamination above cleanup standards and to refine estimates of the quantity of contaminated soils
Figure 3 shows the locations of test pits and borings planned for this investigation These locations were based on the depth delineation of 1 ppm for Total PCBs presented in the Remedial Investigation Table 1provides ageneral sampling rationale including test pit and boring identification numbers target sampling depth and elevation anticipated PCB concentration level and soil type A summary of the analyses to be performed on soil samples including replicates and blanks is shown in Table 2
A total of 12 soil samples for possible bench-scale testing will be collected from test pits during April 1991 Two samples of each soil type indicated below will be collected within the specified ranges of PCB concentrations Each sample will have a minimum volume of about 05 cubic feet (about 60 lb weight) to provide sufficient soil for bench-scale testing
PCB Concentration Range fppml Soil Types
1 to 10 Clay and Fill 10 to 20 Clay 20 to 50 Clay 50 to 500 Clay and FiU
During the RI three soil samples were collected for bench-scale treatability testing with initial PCB concentrations of 1000 4000 and 22000 ppm However sample locations had been selected to obtain samples with PCB concentrations in the range of 250 to 700 ppm based on PCB concentration contours developed during the RI
Document Vol II SC SAP Revision 1
Date March 28 1991 Page 16
Therefore PCB concentration contours developed from the RI data do not precisely indicate the extent and level of contamination
In order to gain a higher degree of confidence that samples within each specific PCB concentration range have been collected GEI will perform field PCB screening with a Dexsil L-2000 PCB analyzer to estimate the soil PCB concentration range prior to collecting the soilsample Aliquots of the 12 bench-scale soilsamples will be collected for confirmatory testing for PCB concentrations by Ceimic of Narragansett Rhode Island utilizing 1988 CLP protocols
GEI will select the soil samples for bench-scale testing after receiving the CLP laboratory results of the PCB concentrations If the laboratory data do not indicate that at least one of the two soil samples was collected from the targeted concentration ranges and soil types an additional contingency round of soil sampling may occur Sampling locations for this contingency sampling round will be selected based Upon the PCB data summarized in the RI and the data collected by GEI during the previous SC sampling round
A total of 40 soil samples (including replicates) will be collected from test pits and borings during April 1991 to fill data gaps on the extent and quantity of contaminated soil The soil sampleswill be collected at the approximate elevation specified for each sampling location as indicated in Table 1 Sample elevations of the bench-scale samples may vary if PCB concentrations in samples screened with the Dexsil L-2000 PCB analyzer are not within the ranges indicated below
Acceptable Screening Target PCB Concentrations Range PCB Concentration Range
(ppm) (ppm)
1 to 10 1 to 10 10 to 20 10 to 20 20 to 50 25 to 45
50 to 500 200 to 350
The soil samples will be analyzed for PCBs ePAHs and lead by Ceimic of Narragansett Rhode Island utilizing CLP protocols Four soil samples (including two selected for bench-scale treatability testing) will also be analyzed for total organic carbon (TOC) cation exchange capacity (CEC) and pH
Document Vol II SC SAP Revision 1
Date March 28 1991 Page 17
Detailed descriptions of the soil sampling and decontamination methods are provided in Section 5 Appendix A and the QAPP Contractors will be used for surveying performance of test pits and drilling of borings All contractors will be required to document that they have completed health and safety training that complies with OSHA Standard 1910120 In generalstakes marking the planned locationsof test pits will be surveyed by a registered surveyor prior to test pit excavation The Stakes will serve as temporary bench marks for reference during location of test pit samples A rubber-tired type backhoe will be used to excavate test pits for planned sampling locations less than or equal to5 feet below ground surface The backhoe and operator will be supplied by HE Sargent Inc of Lewiston Maine capable of operating at hazardous waste sites under Level C personnel protection Soil samples will be collected from in-situ test pit excavations by GEI personnel using a stainless steel shovel or trowel
Due to anticipated shallow ground water conditions a drill rig will be used to advance test borings for soil sampling at locations where the target sampling location is greater than 5 feet below ground surface The soil samples will be collected using a split-spoon sampler Drilling and sampling will be performed by Northeast Diamond Drilling Company of Union Maine capable of working on hazardouswaste sites under Level C personnel protection
412 Soil Analysis Program
Analytical procedures are identified in the Quality Assurance Project Plan (QAPP) The samples will be analyzed using 1988 CLP methods for PCB cPAHs and lead by Ceimic of Narragansett Rhode Island EPA methods 9045 9060 and 9080 will be used to analyze soils for pH TOC and CEC respectively A summary of the analyses to be performed on soil samples including replicates and blanks is shown in Table 2 Samples will be collected in I-Chem glassware or equivalent and stored at 4 deg C as described in Section 6
A series of quality control blanks (replicates and blanks) will be collected by GEI and analyzed by the laboratory to aid in data assessment as discussed in the Quality Assurance Project Plan (QAPP) All quality control samples will be labelled with false sample identification as shown in Table 2 in order to avoid laboratory bias
Sampling equipment blanks and aqueous trip blanks will be submitted for every ten soil samples during the sampling program to check for the presence of cross-contamination These will provide a quality control check for decontamination and handling practices The trip blanks will contain laboratory-supplied organic-free water and will accompany the shipment of soil samples during storage and shipment The trip blanks will be analyzed for PCBs (sample identification will be TP26-TP29) Wipe
Document Vol II SC SAP Revision 1
Date March 28 1991 Page 18
samples will be collected from the shovel or hand trowel and split-spoon sampler (sample identification numbers TP30-TP33 and TP34-TP37 respectively) after decontamination and will be analyzed for PCBs Wipe sampling procedures are described as part of barn sampling procedures in Section 562 One replicate sample will be collected for every ten soil samples Replicate sample locations and identification numbers are indicated on Table 2
413 Soil Sample Designation
Each piece of soil sample glassware will be affixed with a self-sticking adhesive label Each label will be completed with an indelible marker to contain the following information
GEI Consultants Inc Site Name Project Number Sampling Date and Time Sample Number Samplers Initials Analysis Requested
The sample number is composed of a series of information to identify the sample as unique to the sampling point and sampling event The sample number labelled in the field and referred to on all associated documents is composed of the following
Matrix Project Sampling Location Sample Number
Soil - 90393 -TP2-SS1
The example sample number above indicates that soil sample SSI was collected from Test Pit No 2 under project number 90393
4JZ Sediment
431 General
Sediment samples will be collected by GEI from the Upland Marsh the Upper Lagoon and the Lower Lagoon during April 1991 A summary of the laboratory analyses of sediment samples is listed on Table 3 Procedures for sampling and equipment decontamination are provided in Section 5 Appendix A and the QAPP
Document Vol II SC SAP Revision 1
Date March 28 1991 Page 19
In general the sediment sampling program includes collection of the following two basic categories of samples
1 Two composite sediment samples collected using a clam-shell sampler for bench-scale testing
2 Eleven sediment samples (including one replicate) collected with a tube sediment sampler to provide additional data on sediment quality and for estimating the quantity of contaminated sediments
The two composite sediment samples collected using a clam-shell type sampler for bench-scale testing will be collected within the Upper Lagoon and Lower Lagoon at the locations shown on Figure 4 Based on the data in the RI the Upper Lagoon contained the higher sediment concentrations of PCBs
The eleven sediment samples collected to provide additional data on sediment quality and for estimating the quantity of sediments will be collected at the locations shown on Figure 4 As shown on the figure six sediment sampling locations were chosen for the Upland Marsh two locations were chosen for the Upper Lagoon and two locations for the Lower Lagoon
Detailed descriptions of the methods and equipment to be used during the sampling program are provided in Section 5 In general a temporary reference bench mark will be surveyed and staked adjacent to each surface water body by a surveyor licensed in the State of Maine and OSHA-approved for working on a hazardous waste site The actual sediment sampling locations will be measured by tape and compass bearings from the reference bench mark prior to sampling For the bench-scale sample a 5shygallon sample container will be filled with sediment from the dredge type sample The samples for providing additional data on sediment PCB concentrations will be collected with a tubesediment sampler pushed into the complete thickness of sediment at the sampling location All sampling equipment will be decontaminated using methanol and distilled water rinses before each use
4SL2 Sediment Analysis Program
Analytical procedures are identified in the Quality Assurance Project Plan (QAPP) Sediment samples will be submitted to Ceimic of Narragansett Rhode Island for laboratory analysis utilizing CLP protocols The samples collected for bench-scale testing will be analyzed for PCBs The remainder of the sediment samples will be analyzed for PCBs cPAHs and lead One sediment sample will also be analyzed for total organic carbon (TOC) cation exchange capacity (CEC) and pH by EPA methods 9060 9080 and 9045 respectively A summary of analyses to be performed on
Document Vol II SC SAP Revision 1
Date March 28 1991 Page 20
sediment samples including replicates and blanks is shown in Table 3 Samples will be collected in I-Chem glassware or equivalent and stored at 4degC as described in Section 6
A series of quality control samples (replicates and blanks) Will be collected by GEI and analyzed by the laboratory to aid in data assessment as discussed in the Quality Assurance Project Plan (QAPP) All qualitycontrol samples will be labelled withfalse sample identification as shown in Table 3 in order to avoid laboratory bias
Two sampling equipment blanks and one aqueous trip blank will be submitted during the sampling program to check for the presence of cross-contamination These will provide a quality control check for decontamination and sample handling practices The trip blank containing laboratory-supplied organic free water will accompany the shipment of sediment samples and will be analyzed for PCBs (Sample ID SED7) Wipe samples will be collected from the tube sediment sampler and dredge sampler after decontamination and will be analyzed for PCBs (sample identification numbers SED9 and SED8 respectively) Wipe sampling procedures are described as part of barn sampling procedures in Section 562 One replicate sample will be collected during sediment sampling Replicate sample location and identification is indicated on Table 3
423 Sediment Sample Designation
Each piece of sediment sample glassware will be affixed with a self-sticking adhesive label Each label will be completed with an indelible marker to contain the following information
GEI Consultants Inc Site Name Project Number Sampling Date and Time Sample Number Samplers Initials Analysis Requested
The sample number is composed of a series of information to identify the sample as unique to the sampling point and sampling event The sample number labelled in the field and referred to on all associated documents is composed of the following
Matrix Project Surface Water Body Sample Location
SED - 90393 - UM - SED1
Document Vol II SC SAP Revision 1
Date March 28 1991 Page 21
The example sample was obtained from sample location SED1 in the Upland Marsh under project number 90393 The surface water body designations for the Upper Lagoon and the Lower Lagoon will be UL and LL respectively
43 Surface Water
431 General
Surface water quality data consisting of two samples each from the Upland Marsh Upper Lagoon and the Lower Lagoon will be collected by GEI in April 1991 Sampling locations are shown on Figure 4 Surface water sampling locations will be determined in the field by tape and compass bearings from the temporary reference bench mark established for sediment sampling A summary of the analyses to be performed on surface water samples including duplicates and blanks is shown on Table 4 Detailed descriptions of the sampling methods to be used during surface water sampling are provided in Section 5 In general the depth of the water at the sampling location will be measured at each sampling location with a weighted tape measure prior to collecting the surface water sample A water sample will be collected after lowering a stainless steel Kemmerer sampling device one-half the total depth of the water column All sampling equipment will be decontaminated using methanol and distilled water rinses before each sampling event
433 Surface Water Analysis Program
Analytical procedures are identified in the Quality Assurance Project Plan (QAPP) All of the surface water samples will be analyzed using 1988 CLP methods for PCBs aluminum and lead One sample from each surface water body will also be Submitted for Total Suspended Solids Analysis (EPA Method 1602) A summary of the analyses to be performed on surface water samples including duplicates and blanks is shown on Table 4 Surface water samples will be submitted to Ceimic Corporation for laboratory analysis Samples will be collected in I-Chem glassware or equivalent and stored at 40 C as described in Section 6
A series of quality control samples (duplicates and blanks) will be collected by GEI and analyzed by the laboratory to aid in data assessment as discussed in the Quality Assurance Project Plan (QAPP) All quality control samples will be labelled with false sample identification as shown in Table 4 and described below in order to avoid laboratory bias
One sampling equipment blank and a trip blank will be submitted during each sampling round to Check for the presence of cross-contamination These will provide a quality control check for decontamination and handling practices One trip blank
Document Vol II SC SAP Revision 1
Date March 28 1991 Page 22
sample consisting of laboratory-supplied organic-free and de-ionized water will accompany the samples during storage and shipment and will be analyzed for PCBs aluminum and lead (sample identificationwill be SW4) A samplingequipment blank will be collected by pouring laboratory-supplied organic-free and de-ionized water through the Kemmerer sampler at the end of the sampling program The sampling equipment blank will then be analyzed for PCBs aluminum and lead (sample identification will be SW5)
One surface water duplicate will also be collected each sampling round Duplicate sample location and identification is indicated on Table 4
433 Surface Water Sample Designation
Each piece of sample glassware will be affixed With a self-sticking adhesive label Each label will be completed with an indelible marker to contain the following information
GEI Consultants Inc Site Name Project Number Sampling Date and Time Samplers Initials Analyses Requested
The sample number is composed of a series of information to identify the sample as unique to the sampling point and sampling event The sample number labelled in the field and referred to on all associated documents is composed of the following
Matrix Project Surface Water Body Sampling Location
SW - 90393 - UM - SW1
The example sample number above indicates thata surface water sample was obtained from the Upland Marsh at location SW1 under Project Number 90393 The surface water body designations for the Upper Lagoon and the Lower Lagoon will be UL and LL respectively
Document Vol II SC SAP Revision 1
Date March 28 1991 Page 23
44 Barn
441 General
A total of approximately 30 samples of various media within the barn will be collected by GEI during May 1991 The types of media collected will generally consist of wood fragments from barn walls dust concrete and wipes on non-porous debris within the barn The exact sample locations will be primarily determined in the field based on observations during sampling (eg staining on soils concrete or wood) Based on a site visit by GEI on December 19 1990 preliminary sample locations for barn materials were chosen as shown in Figure 5 These preliminary locations will enable representative sampling of general debris and staining in the barn and indicates the general sampling strategy which will be employed during Pre-Design Final sampling locations may be modified during the program based on closer observation of equipment barn materials and evidence of staining
Detailed descriptions of the methods to be used during the barn sampling program are provided in Section 5 In general a survey of the general types of materials present in the bam and locations of apparent staining of surficiial materials or debris will be recorded on a plan Following the survey representative areas within the barn will be sampled A total of 12 wipe samples will be collected (eg steel shelves boat wood stove electric meters etc) by wiping a 100 cm2 area with laboratory-prepared sampling wipes A total of ten samples of Wood from the walls of the barn will be collected by using a wood boring bit and wood chisel A total of four samples of loose dust will be collected from the floor of the concrete slab of the barn using disposable nylon brushes and stainless steel trowels Finally a total of four samples of concrete will be collected from areas of visible staining and one unstained area by drilling the concrete to a maximum depth of 12 inch in a 100 cm2 area All non-disposal steel sampling equipment will be decontaminated using methanol and distilled water rinses before use at each sampling location
442 Barn Analysis Program
Analytical procedures are identified in the Quality Assurance Project Plan (QAPP) Three field equipment blanks and three trip blanks will be submitted during the barn sampling program to check for the presence of cross-contamination These will provide aquality control check on decontamination and handling practicesAsummary of the analyses to be performed on each sample matrix and the quality controlsamples is shown in Table 5
Document Vol II SC SAP Revision 1
Date March 28 1991 Page 24
Wipe wood dust and concrete samples will be submitted to Ceimic in Narragansett Rhode Island for laboratory analysis Wood dust and concrete samples will be analyzed for PCBs cPAHs and lead Samples will be collected in I-Chem glassware or equivalent provided by Ceimic and preserved and stored as described in Section 6
The objective of the barn sampling program is to provide a preliminary assessment of the degree of contamination present within the barn (see Section 2) It may be difficult to ensure that representative replicates can be made of the various matrices during sampling Therefore no replicate samples of barn materials will be collected during this initial sampling effort
Aqueous trip blank wipe samples will accompany the samples during storage and shipment and will be analyzed for PCBs (sample identification will be PTB1-PTB3) Sampling equipment blank wipes will be made following decontamination of all steel sampling equipment at various times during the sampling program The steel equipment wiped will include the hole saw trowel and the drill bit used for barn wall dust and concrete sampling respectively The equipment wipe samples will then be analyzed for PCBs (sample identification will be PEB1-PEB3)gt
443 Barn Sample Designation
Each piece of sample glassware will be affixed with a self-sticking adhesive label Each label will be completed with an indelible marker to contain the following information
GEI Consultants Inc Site Name Project Number Sampling Data and Time Sample Number Samplers Initials Analysis Requested
The sample number is composed of a series of information to identify the sample as unique to the sampling point and sampling event The sample number labelled in the field and referred to on all associated documents is composed of the following
General Sample Location Project Sample Type Sample
BARN - 90393 - D2
Document Vol II SC SAP Revision 1
Date March 28 1991 Page 24a
The example sample number above indicates that a barn sample was obtained under project number 90393 and was the second dust sample collected The designations for the wipe samples will be P wooden samples W dust samples D concrete samples C and other samples O
Document Vol II SC SAP Revision 1
Date March 28 1991 Page 25
5 SAMPLING EQUIPMENT AND PROCEDURES
51 Air Monitoring
Short-term air monitoring will be performed regularly on-site during the Source Control (SC) sampling program A HNu photoionization detector (PID) and an MIE Model MINIRAM hand-held aerosol monitor (HAM) will be used for air monitoring The PID is capable of detecting total ionizable compounds (typically VOCs) and the HAM detects solid or liquid particulates in air which often take the form of dust smoke fumes and mists Each air monitoring instrument will be operated in accordance with the requirements specified in the Health and Safety Plan provided in Appendix A Readings from the PID and HAM will be recorded in the Project Field Log Book (see Appendix B) Calibration procedures for the PID (HNu Model PI-101) and the HAM (MIE Model MINIRAM) are provided in Appendix C
52 Soil Sampling
521 General
Soil sampling locations are shown on Figure 3 Table 1 lists each soil sampling location planned approximate sample depth and rationale for sample collection
Prior to sampling a surveyor registered in the State of Maine will survey the exact location of each test pit and boring location and provide a temporary stake that will function as a bench mark for horizontal and vertical control within 20 feet of each test pit and at each boring Sample locations within test pits will be by tape and compass bearing methods
Soil sampling will be performed with strict adherence to the procedures described below A list of equipment requirements for the soil sampling program is provided in Table 6 In general excavation of soil to the target depth in test pits will be performed with a backhoe for sampling to 5 feet below ground surface The backhoe and operator will be supplied by HE Sargent Inc and the operator will be equipped with Level C personnel protection (see Appendix A) A bombardier or truck-mounted drill rig operated by Northeast Diamond Drilling by personnel equipped with Level C protection will be utilized for sampling points greater than 5 feet below ground surface Soil samples collected by GEI for possible bench-scale testing will be obtained only at test pit locations Ambient air monitoring will be performed by GEI regularly while working on-site for health and safety monitoring Mobilization
Document VoL II SC SAP Revision 1
Date March 28 1991 Page 26
of equipment and transportation of materials over the site during the soil sampling program will avoid heavily contaminated transformer work areas when possible to reduce dispersing PCBs to other areas Drilling and excavating equipment will be decontaminated under the supervision of GEI prior to use at each sampling location following strict decontamination procedures described in Appendix A and below Sampling equipment will be decontaminated by GEI prior to each sampling event as described below All soil sampling operations within the site will be performed using Level C dermal and respiratory personnel protective equipment to protect against PCB-contaminated dust levels which are likely to exceed 1 mgm3 during sampling The detailed Health and Safety Plan that will be followed during soil sampling is provided in Appendix A
522 Soil Sampling Methods for Test Pits
A minimum of a two-person crew in addition to the backhoe operator or the drill rig crew will be provided by GEI during the sampling program
All soil samples will be collected from test pits by GEI with a shovel or trowel following excavation to the appropriate depth with a rubber tire backhoe as follows
1 Check the survey stakes for the proper test pit number identification and location
2 Place polyethylene sheeting on each side of the test pit for staging the excavated soils from the test pit
3 A standard rubber tire type backhoe will perform the soil excavation to the planned sampling depth All soil excavated from the test pit will be placed on the plastic sheeting adjacent to the test pit The top 2 feet of excavated soil will be cast to one side of the test pit on the sheeting and the bottom 3 feet of soil will be cast to the opposite side to avoid mixing soils with potentially significantly different levels of contamination After completion of sampling soil will be backfilled at a similar depth from which it was excavated
4 All excavation activities will be continuously observed by an engineer or geologist from GEI A test pit log form (OCONNORFL12) will be completed by GEI for each test pit performed and will include the following information
Document Vol II SC SAP Revision 0
Date January 17 1991 Page 27
Name and Location of Job Date Excavation and Test Pit Number Approximate Ground Surface Elevation at Test Pit Total Depth of Test Pit Dimensions of Test Pit Location and Depth of Soil Sample Relative to Stake Reference Method of Soil Sample Acquisition (Shovel Trowel) Volume of Soil Sample J Soil and Stratigraphic Descriptions x
Ground Water Levels (if encountered) y ^v Air Monitoring Information v Other observations Such as soil staining buried debris etc
5 At least one photograph will be taken oflta wall of each test pit from within the test pit with a scale for comparison to indicate soil layering or staining In addition one photograph shall be taken of thertesVpit from the ground surface also showing sample locations withinthe-test pit Photographs of the test pits will be marked to include site locationxjdbmumber^test pit number date and time A photograph log sheet will be maintained fampMuture reference
6 The target soil sampling elevation will be determined by GEI using a level and rod
7 Soil sampling will begin from within the test pit only after the side walls of the pit have been properly^sloped back in accordance with OSHA requirements (see Health and Safety Plan^ Appendix A) All samples collected will be identified on the test pit logazid in the field book Information about the sample including sample number^de^th voiuine and soil description will be recorded The soil sample will be colleetedTrotn an undisturbed area of the test pit floor or wall by means of scraping or digging with a stainless steel shovel or trowel The number of clean sampling utensils for each test pit shall be equal to the number of soil samples collected at the test pit Shovels or trowels used to clean sloughed material from the sampling location will not be used to collect the sample unless decontaminated before use in sampling Care will be taken to assure that the sample is taken from the actual soil unit desired mid does not include slough or scraped material from the sides of the trench The desired soil sample will be immediately placed into the sample container within the test pit A portion of the sample will be retained for screening with the Dexsil L-2000 PCB analyzer The containers will then be sealed labelled and stored in asecure area until Shipment to the laboratory
Document Vol II SC SAP Revision 1
Date March 28 1991 Page 28
8 When collecting a larger volume sample for bench-scale testing a smaller soil sample will first be collected for field screening using the Dexsil L-2000 PCB Analyzer If the analyzer indicates that the PCB concentration is within the target range the bench-scale soil sample will be collected If the Analyzer indicates that the PCB concentration is outside the target range the test pit will be expanded if necessary and another sample will be collected for PCB screening This procedure will be continued until a sample within the target range is identified The test pit will be expanded no more than 2 feet in all directions and to the maximum depth of 5 feet below ground surface If after this over-excavation the soil within the target concentration range has not been identified with the Dexsil L-2000 PCB Analyzer a new test pit location will be selected near the original test pit in an area indicated by the Remedial Investigation to contain soil contamination within the target range
9 Once the targeted PCB concentration has been indicated by field screening the desired soil sample will be collected with a clean stainless steel trowel or shovel at a sufficient quantity to fill a 5-gallon container An aliquot from the 5-gallon sample container will be collected and placed in an appropriate sample container for laboratory analysis for PCBs The 5-gallon containers will then be sealed labelled and appropriately stored in a secure area until transported off-site The laboratory samples will be sealed labelled and stored with the other soil samples awaiting shipment to the laboratory
10 Upon completion of sample collection the excavated soil material will then be backfilled into the test pit The backfilled area will be compacted to the approximate original ground elevation
11 Equipment will be decontaminated after backfilling the test pit (ie shovel trowels measuring equipment) byscrubbing and With methanol and distilled water rinses Portions of the backhoe (bucket bucket arm etc) will be decontaminated with a high-pressure steam rinse on the decontamination pad (see Appendix A)
523 Soil Sampling Methods for Borings
Selected soil samples are planned to be collected at depths greater than 5 feet below ground surface to obtain additional data on the depth of PCB contaminationexceeding cleanup standards in Transformer Work Areas Samples will be obtained using split-spoon sampling techniques within 3-inch ID hollow stem augers in test borings generally following procedures specified by American Society for Testing Materials (ASTM) D1586-84 Test borings will be performed by Northeast Diamond Drilling
Document Vol II SC SAP Revision 1
Date March 28 1991 Page 29
under the observation of an engineer or geologist from GEI The following procedures not specified in ASTM D1586-84 will be used
1 Place a polyethylene sheet on one side of the boring location for temporarily staging drilling cuttings during borehole advancement All drilling equipment shall be decontaminated with a high pressure steam rinse on the decontamination pad prior to beginning drilling
2 Advance hollow-stem augers without split-spoon sampling to a depth about 5 feet above the sampling depth specified in Table 1
3 Begin continuous split-spoon sampling with 18-inch-long samples Collect a specimen from the middle of each sample for screening with the Dexsil L-2000 PCB analyzer and the HNu photoionization detector Rinse the split-spoon sampler with methanol and distilled water rinses before each sample
4 Collect a split-spoon sample at the designated sample depth Divide the split-spoon sample vertically Place a minimum of 4 inches of sample recovered from the bottom right half of the sample into the glass sample container Seal and label the sample container as indicated in Section 4 and store the container in a cooler with ice in a secure area until shipment to the laboratory Retain the left half of the split-spoon sample for screening with the Dexsil 1^2000 PCB analyzer and the HNu photoionization detector
5 After collecting the final soil sample in the boring measure depth to ground water below ground surface using a decontaminated Solinst battery-operated water level indicator Record the time elapsed after completion of the boring when the ground water level was measured
6 Remove augers from borehole If the borehole remains open and evidence of ground water was encountered during sampling collect additional measurements of depth to ground water prior to backfilling until the ground water level appears to stabilize Note occurrence of precipitation or other events which could effect water level measurements in the project log book
7 Backfill borehole within 24 hours after completion of the boring with drill cuttings staged adjacent to the borehole If the borehole collapses and cuttings cannot be backfilled in the borehole store staged cuttings in a steel drum to be left on site Label outside of drum to indicate contents are borehole cuttings from the designated boring number and affix labelindicating PCB-contaminated materials Cuttings from more than one boring can be combined in a single drum
Document Vol II SC SAP Revision 0
Date January 17 1991 Page 30
8 Decontaminate measuring and sampling equipment with methanol and distilled water rinses Decontaminate downhole drilling equipment on the decontamination pad with a high-pressure steam rinse before starting the next boring
A log will be prepared by GEI for each boring and will include the following
information 7
Name and Location of Project
Boring Number lt Date of Boring Ground Surface Elevation x-Boring Diameter and Depth Sample Numbers and Depths Soil Screening Data Visual Soil Descriptions Water Level Measurements Air Monitoring Levels Other Observations
The boring log form is provrdedin Appendix B (OCONNORFL15)V
i
Surface Water ^^7
531 General
N
Surface water sam^les^will becollected at the locations shown in Figure 4 If water is too deep for safe aecess^with hip-waders andor access with hip waders will severely disturb sediment an inflatableboat will be used to access Surface water sampling locations
The surface water sampling program will be performed following strict adherence to the following procedures A list of the equipment requirements for surface water sampling is provided in Table 8 In general ambient air monitoring will be performed regularly while working on-site for health and safety considerations Areas of the site which have been determined by previous studies to have elevated concentrations of PCBs in soils (for example TWAs) will be avoided while traversing the site to reduce the likelihood of dispersing PCBs to other areas The depth of water at the sampling stations will be measured and the surface water elevation will be surveyed on each water body Equipment will be decontaminated prior to use at each sampling station following decontamination procedures
Document Vol II SC SAP Revision 0
Date January 17 1991 Page 31
532 Surface Water Sampling Methods
Surface water samples will be collected during the Pre-Design Study at the locations shown on Figure 4 Surface water samples will be collected during the initial stage of the Source Control sampling program prior to soil and sediment sampling An inflatable boat will be used to access surface water sampling locations if there is sufficient water depth The boat will be cleaned with methanol and distilled water rinses before sampling in each water body The surface water sampling procedures will be as follows ltX1 Determine the location of the sampling station by tape^and compass from a
temporary bench mark at the edge of the surface water body x
2 Measure the depth of water at the sampling station with a weighted tape measure x (
^ 3 Gently lower a clean Kemmerer sample^bottle to the desired depth (one-half
water depth) so as not to remove th^stoppeisprematurely V^
4 Pull out the stopper with a sharp jerk ofdhe sampler line
5 Allow the bottle to fill completelyras evidenced by the cessation of air bubbles
6 Raise the sample and capdhe nottle X x
7 Pour the sampl^fromthe bottle into the appropriate sample container The container willbesealedlabelled and stored in a secure area until shipment to the laboratory
8 Fill a beaker with water remaining in the sampler and measure specific conductance pH and temperature
9 Decontaminate the sampling apparatus measuring tape and Kemmerer sampler by scrubbing internally and externally with methanol and distilled water rinses
10 Record the following surface water sampling information in the project log book (OCONNORFL1)
Document Vol II SC SAP Revision 0
Date January 17 1991 Page 32
Date Time Total Depth of Water Location and Depth of Sample pH Conductivity Measurements Air monitoring levels detected Other observations
Sediment
541 General x
gt The locations of the sediment sampling stations are shown on Figure 4 Table 3 lists the various sampling stations and sampling methods for the sampling program Sediment sampling during the project will beperformed with strict adherence to the following procedures A list of equipment requirements for the sediment sampling program is provided in Table7 In general ambientw monitoring will be performed regularly while working on-site for health-and safetymonitoring Mobilization of equipment and materials over the sitdduring^he-sediment sampling program will follow specific routes to reduce the likelihoocKPfdispersing PCBs to other areas Equipment will be decontaminated prior to sampling at each location following strict decontamination procedures described belowy All sediment sampling operations within the site will be performed fusing level C dermal personnel protective equipment and Level D respiratory^protective equipment will be worn
v ^
542 Sediment Sampling Methods gtSN
The sediment sampling^vili be performed after collection of surface water samples and will consist of rivo primary components
1 Tube sediment smiling to provide additional data on sediment quality and to estimate the thickness of sediment
2 Dredge sediment sampling to obtain a sample for laboratory for bench-scale treatability testing
The tube sediment sampling program will be performed as follows
Document Vol II SC SAP Revision 0
Date January 17 1991 Page 33
1 Determine the sampling locations by tape and compass measurements from a temporary bench mark (reference stake) surveyed near the edge of the surface water body Access locations in interior portions of the water bodies using an inflatable rubber boat The boat will be decontaminated with methanol and distilled water rinses before use in each surface water body
2 Measure the depth of water with a weighted tape measure
3 Lower the hand tube sediment sampler to the desired ctepth Sediment entering the tube is trapped by a plastic core retainer allbyringlheunit to be retrieved a n d t h e s a m p l e r e m o v e d w i t h o u t s a m p l e l o s s X x y
4 Extract the sediment samplefrom the sampler and^immediately place the sample
into the sample container The containers ywllthen be sealed labelled and stored on ice in a cooler in a secure area until shipment to the laboratory
5 Decontaminate the sampling apparatua and measuring tape by scrubbing with methanol and distilled water rinses
vw 7 Record sediment sampling record information in the project log book
(OCONNORFL2) after collecting a sediment sample at each sampling station The information that will beuro~documenteamp includes the following
Date and Time ^ Total Depth of Water N Thickness of Sediment Location of Sample Length and Vblume^of Simple Sample Description x- Air Monitoring LevetesDeteeted Other Observations
The sediment sampling procedure for collecting samples for bench-scale treatability testing will be as follows
1 Determine the location of the dredge traverse line by tape and compass bearings from the temporarily bench mark adjacent to the surface water body
2 Pull the sediment dredge along the planned traverse with a wire line from the edge of the surface water body
Document Vol II SC SAP Revision 0
Date January 17 1991 Page 34
3 Repeat sampling until 5 gallons of sediment have been collected and placed in the 5-gallon sample container The containers will then be sealed labelled and stored in a secure area until shipment to the laboratory
4 Decontaminate the sampling apparatusand drag line by scrubbing with methanol and distilled water rinses
S6 Record the following sedimentsampling informationin die project log book after
sample collection X nXx
Date and Time X gt Total Depth of Water Location and Volume of Sample Number of Grab Samples Collected to Form Composite Volume Sample Description Air Monitoring Levels Detected x X Other Observations
Barn
5-51 General
Sampling within the barn will4gteperformed with strict adherence to the following procedures A list of equipment requirements for the barn sampling program is provided in Table 9 Areas of the Site which have been determined by previous studies to have elevatedconcentrations of PCBs in soils (for example TWAs) will be avoided during bam sampling to reduce the likelihood of dispersing PCBs to other areas within the barnXEquipment will be decontaminated prior to use at each sampling location inside thetarn following strict decontamination procedures All sampling operations withfaMhe barn will be performed with Level C personnel protective equipment due to dust levels which may to exceed 1 mgm3 during sampling (see Appendix A) A detailed Health and Safety Plan which will be followed during barn sampling is provided in Appendix A
552 Barn Sampling Methods
If power is not available on-site a gasoline-powered generator capable of supplying electricity for lighting and sampling equipment will be positioned outside the fenced area of the site prior to sampling Extension cords will be run to the barn (avoiding TWAI) for power supply In order to reduce the potential for cross-contamination due to dust generation the sampling of different matrices will proceed in the
Document Vol II SC SAP Revision 0
Date January 17 1991 Page 35
following sequence 1) wipe samplingof non-porous debris 2)wood sampling of barn walls 3) dust sampling from top of floor slab 4) concrete sampling of floor slab Areas to be sampled will be chosen based on the presence of apparent oil-type staining and to obtainan even distributionof representative samples with no apparent staining
Following sampling at each location a self-sticking adhesive label marked with the sample number will be placed at the sample location for future reference Each label will then be located by taping relative to a reference point Established at the western corner of the barn (W-Z corner) as shown in Figure 5 Walls W and Z will be used as orthogonal axes similar to a typical coordinate system For samples collected above the concrete floor slab (eg wipe and wooden wall samples the height above the floor slab will also be recorded All samples willbe collected between the floor slab and a maximum height of seven feet All location measurements and a brief description of the area sampled will be recorded on the Barn Sampling Form (OCONNORFL13) provided in Appendix B Imaddition a photograph of each sampling location will be taken and^ recordedy on the Photograph Log (OCONNORFL6) Detailed procedures-for each type of sample to be collected during the barn sampling program follows
lt Win Samnlino N
1 Identify the non-porous item within the barn selected to be sampled which has an area of at least 100 cm2 which maybe wiped Examples include sheet metal fiberglass cleanly painted wooden surfaces glass etc
2 Place a decontaminated stainless steel or plastic 100 cm2 (10 cm X 10 cm) template at t^desired sampling location
Note For smaller areas such as on electric meters use the quarter template of 25 cm2 area and make four wipes to compose one sample
3 Remove the laboratory-supplied gauze from within the glassware with stainless steel forceps The gauze should be moist with solvent as prepared by the laboratory
4 While holding the appropriate template in place thoroughly swab the 100 cm2 area with the gauze using forceps or bufyl rubber gloves Inspect the area to ensure that all loose dust has been wiped with the Alter paper
Document Vol II SC SAP Revision 0
Date January 17 1991 Page 36
5 Fold the gauze over to ensure that the dust is contained on the inside of the gauze Place in the appropriate sample container seal label and store in a secure area until shipment to the laboratory
6 Decontaminate the forceps and templates by scrubbing with methanol rinsing with distilled water and wiping dry with paper towels
7 Label the sample location photograph and complete^he Barn Sampling Form
(see Appendix B) and other necessary documentation after each sample is
c o l l e c t e d lt X x x y x x
xWooden Wall Sampling X
1 Select the sampling area of at least 100 cm2 on the inside wall of the barn and secure a decontaminated 100cm2 template at the location Place a steel pan below the sampling area to catch sawdust ancLwood chips
2 Using an electric drill equipped withra-one-ineh diameter wood-boring bit drill out wood within the template area to arnaximum depth of 12 inch
3 Place sawdust and wood chips man appropriate sample container seal label and store in a secure area untiLsRipinent to the laboratory
4 Decontaminate the drilTbit and pan by scrubbing with methanol rinsing with distilled water and jwiping dry with paper towels
5 Label the samplelocatidn photograph and complete the Barn Sampling Form (see Appendix^)
Dust on Floor Slab Sampling
1 Select an area to sample such that at least 100 grams of dust or soil may be obtained This will vary depending on thickness of the dust or soil
2 Using a disposable nylon brush or stainlesssteel trowel brush or scrape dustsoil toward the center of the area chosen minimizing the creation of airborne dust
3 After the dustsoil has been centralized use a flat stainless steel trowel to collect the material and place in laboratory-supplied glassware seal and label
Document Vol II SC SAP Revision 0
Date January 17 1991 Page 37
4 Dispose of the nylon brush with other containerized PCB-waste materials and decontaminate the stainless steel trowelsby scrubbingwith methanol rinsingwith distilled water and wiping dry with paper towels
5 Label the sample location photograph and complete the Barn Sampling Form
Concrete Slab Sampling
1 Identify three areas of visible staining and one area of no visible staining on the floor slab Using a disposable nylon brush carefulfy brushxaway loose dust and soil from an approximately 1-square-foot area
2 Place a pre-cut 10-square-foot sheet of clean polyethylene sheeting with a 1shysquare foot hole cut in the center over thevsampling area and secure in place with duct tape Place a decontaminated lOO cmr template in the center where t h e s a m p l e i s t o b e o b t a i n e d X v N
3 Using an electric hammer drill eqi^pedwitlra^ungsten-carbide mortar bit drill the four corners established by the tempfate^to a maximum depth of 12 inch
4 Remove the template ancLdrilL the remaining 100 cm2 within the established square to a maximum dep^fof l2Jnch
-vFollowing drilling brush the concrete chips and dust from the plastic sheeting toward the center otlhe sarhplihggtarea Collect sample with a clean disposable nylon brush andtrowel and place in an appropriate sample container seal label and store in aSecure area until shipment to the laboratory
6 Dispose of the nylon oriish with other containerized PCB-contaminated waste materials and decontaminate the stainless steel trowel and template by scrubbing with methanol rinsing with distilled water and wiping dry with paper towels
7 Remove and dispose of the polyethylene sheeting and duct tape in an appropriately marked barrel that will remain on the site with other sampling waste disposal materials Label the samplinglocation photograph and complete the Barn Sampling Form
Document Vol II SC SAP Revision 0
Date January 17 1991 Page 38
6 SAMPLE HANDLING AND ANALYSIS
61 General
GEI has established a program of sample chain-of-custody that is followed during sample handling activities in both field and laboratory operations Thisvprogram is designed to assure that each sample is accounted for at all times To accomplish this objective sample container labels sampling records chain-of-custody records sample assignment forms shipping airbill records and laboratory receipt sheets must be completed by the appropriate sampling and laboratory personnel ^ y gt
62 Sample Labeling and Documentation gt
The plastic 5-gallon containers for bench-scale testingsWilKbe cleaned with methanol and distilled water rinses prior to use All other sample containers^will be pre-cleaned by EPA-approved methods and provided by the laboratory^ A summary of the sample containers and preservation requirements for each of thamp^analytieal parameters to be measured is shown in Table 10 Each piece of sample gl^sware^will be affixed with a self-sticking adhesive label Each label will contain the information described in Sections 4 and 5 of this document ^
To further document the samplingprogr^mand Sample handling procedures the project log book (OCONNORFL1) will containinformation regarding the activities on-site and sample handling In addition photographs of each type of field procedure will be taken The photographs will be representative of thetechniques employed throughout the sampling program A record ofeach photograph Will be made on the Photograph Log (OCONNORFL6) as stiown 4i^Appendix B
63 Chain-of-CustodySample^Assignment
Chain-of-custody will be maintained at all times as described in more detail in the Quality Assurance Project Plan (QAPP) A copy of the chain-of-custody form (OCONNORFL9) to be used is provided in Appendix B
In general the chain-of-custody record must be used such that it includes the following information
Document Vol II SC SAP Revision 0
Date January 17 1991 Page 39
Project name and number Names of the sampler(s) and person shipping the samples Station number or well identification Date and time the samples were collected Composited or grab sample designation Sample number (eg 1GU-90393-MW101A) Total number of containers Analysis requested Date and time the samples were delivered for shipping Names of those responsible for receiving the sampled at the laboratory
Prior to shipment of the samples a sample assignment form will be completed (see OCONNORFLIO in Appendix B) The sample assignmenrform will provide the contract laboratory sufficient information to process the samples and perform the appropriate analysis
The chain-of-custody record and sample assignment fornr will both be completed in duplicate in the field through the use of carbon paperT The original copy of the forms will be enclosed in a plastic bag and placed in the coolersWith the samples for shipment to the laboratory The carbon copy of the forms will be retained by GEL
VSoil samples for bench-scale testing ynH be-stored on site in a locked storage shed until samples are selected for the bench-scale7testing^ This decision will be made after receipt of the laboratory PCB analyses results and approval of the Source Control Work Plan by the EPA Soil samples not usecLfor bench-scale testing will remain in the locked storage shed and will be included with-other soil for treatment during the Remedial Action
lt v 64 Sample Shipments
Sample containers are generally packed in coolers for shipment Prior to packing organic analysis samples will be placed in plastic bags Bottles are to be packed tightly so that no motion is possible Styrofoam vermiculite and bubble pack are suitable for most instances Ice Will be placed in sealed plastic bags or ice packs in order to keep samples at 4degC at all times Samples will be protected against freezing during cold weather The original chain-of-custody and sample assignment forms will be sealed in plastic bags and placed in the cooler with the samples The cooler will be closed and a signed self-sticking label with the words Custody Seal will placed between the body of the cooler and the cover The cover will then be sealed with clear tape Samples will be shipped so that they are received by the laboratory no later than 60 hours from the time of sample collection
Document Vol II SC SAP Revision 0
Date January 17 1991 Page 40
All shipping of samples will be done through Federal Express or equivalent overnight delivery service Samples will be shipped in accordance with Department of Transportation (DOT) regulations If prompt arrival of the samples cannot be guaranteed the samplers will be responsible for proper storage of the samples until adequate transportation arrangements can be made The laboratory will be notified prior to shipment to arrange for receiving the samples and to prepare for the analyses requested Based on the low concentrations of chemicals detected during previous studies theSamples will be classified as environmental samples The air bill for the samples will speeiiythat the contents of the cooler are environmental or hazardoussamples as appropriated When samples are received by the laboratory they will notify the Task Manager of theccondition of the samples
H craTrsi
TABLE 1 - SOIL SAMPLING SCHEDULE Field Sampling Plan OConnor Co Site Augusta Maine
DEPTH APPROXIMATE BELOW ANTICIPATED
SAMPLE NUMBER SAMPLE GROUND PCS GENERAL LOCATION OF ELEVATION SURFACE CONCENTRATION SOIL
ID SAMPLES (MSL) (PPm) TYPE COMMENTS
TP1 2175 25 ND ClaySandy Till Confirm contours 215 35 ND
TP2 217 15 50 ClaySandy Till Confirm contours TP3 212 ND Siltv Clav Confirm horizontal extent toward marsh TP4 211 5-50 Clav Obtain bench scale 20-50 ppm
TP5 213 50-500 Clay Confirm lateral extent
TP6 215 15 5-50 Fill Obtain bench test sample In 1-10 ppm
TP7 210 35 0-5 Siltv Fine Sand Confirm vertical extent in drainage area
217 3 0-5 FillClay Confirm contours TP8 219 1 0-5 TP9 207 35 0-5 Siltv Fine Sand Confirm vertical extent In drainage area
TP10 1175 15 50-5000 Fill Bench scale test sample 50 to 500 ppm
TP11 218 0-5 SandClay Confirm horizontal extent toward marsh
TP12 218 0-5 SandPay Confirm horizontal extent toward marsh
TP13 221 5-50 Clav Bench-scale test sample 10-20 ppm
TP14 206 0-5 Gray Silty Clay Confirm vertical extent
TP15 200 0-5 Gray Silty Clay Confirm vertical extent
TP16 2185 15 5-50 Clay Bench-scale test sample 1-10 ppm
228 4 TP17 230 2 Confirm contouring in north end of site
231 4 TP18 233 2 Confirm contourtng in north end of site
236 4 TP19 238 2 Confirm contouring in north end Of site
Project 90393 GEI Consultants Inc Page 1 of 2 March 28 1991
SAMPLE NUMBER LOCATION OF
SAMPLES
TP20 TP21 TP22 TP23
TP24 TP25
B1
B2
1 B3 2
B4
B5
ND = Not Detected
TABLE 1
APPROXIMATE SAMPLE
ELEVATION MSLJ
231 233
2275 237 237 235 236 222 210 215 210 215
215 220
218 220 220 222
- SOIL SAMPLING SCHEDULE Field Sampling Plan OConnor Co Site Augusta Maine
DHTH BELOW
GROUND SURFACE
4 2
15
2 1
8 3 8 3
12 6
8 6 6 4
ANTICIPATED PC8
CONCENTRATION
ND ND 0-5
500-5000 5-50
50-5000 0-5
50-500
0-5 50-500
0-5 0-5 0-5 0-5
GENERAL SOIL TYPE
Clavev Silt Silty Clay
Clay
Till or Clay
Till or Clay
Gray Silt
Gray Clavev Silt
Gray Clayey Silt
i
Confirm contouring in north end of site Confirm contours Confirm contours Confirm contours
Confirm contours Bench scale sample 50-500 ppm
Confirm contouring and vertical extent
Confirm Contouring and vertical extent
Confirm contours and vertical extent
Confirm contours and vertical extent
Confirm contours
Project 90393 GEI Consultants Inc Page 2 of 2 March 28 1991
TABLE 2 SOIL ANALYSIS PROGRAM Field Sampling Plan OConnor Co Site Augusta Maine
Sample Depth
Sample Location ID
SoB Sample Number
(ft below ground surface) Lead cPAHs PCBs
pH TOC CEC
Anatyticsd Level IV
TEST PITS TP1 SS1 TP2 SS1 15
SS2 35 TP3 SS1 TP4 SSI
SS2 TP5 SSI TP6 SS1 15
SS2 15 TP7 SS2 35 TP8 SSI
SS2 TP9 SSI 35
replicate of SS2 SSI
TP10 SS1 15 SS2 15
TP11 SSI TP12 SSI TP13 SS1
SS2 TP14 SS1 TP15 SS1
replicate of SS2 SS1
TP16 551 15 552 15
TP17 551 552
TP18 551 552
TP19 551 552
TP20 551 552
TP21 SS1 15 TP22 SS1
Project 90393 GEI Consultants Inc Page 1 of 2 March 281991
TABLE 2 SOIL ANALYSIS PROGRAM Field Sampling Plan OConnor Co Site Augusta Maine
Sample Depth
Sample Location ID
SoB Sample Number
(ft below ground surface) Lead cPAHs PCBs
pHTOC CEC
Analytical Level IV
Bench Scale
Sample
replicate of SS2 SS1
TP23 SS1 TP24 SS1
SS2 TP25 SSI
SS2 BORINGS
B1 SS1 SS2
B2 SS1 SS2
B3 SS1 6 replicate of
SS2 SS1 SS3 12
B4 551 552
B5 551 552
QUALITY CONTROL TP26-TP29
(trip blank) SS1-SS4 TP30-TP33 (shovel or
hand trowel SS1-SS4 blank)
TP34-TP37 (split-spoon
blank) SS1-SS4 TOTAL
ANALYSES 40 40 64 15 12
TOC - Total Oraanic Carbon CEC - Cation Exchange Capacity
Will be designated to the laboratory as matrix spikematrix spike duplicate
Additional trip blanks may be needed to ensure one trip blank per cooler
Project 90393 GEI Consultants Inc Page 2 of 2 March 281991
TABLE 3 SEDIMENT ANALYSIS PROGRAM Field Sampling Plan OConnor Company Site Augusta Maine
PH Bench Sample TOC Analytical Scale
Sample Location Number Lead cPAHs PCBs CEC Level IV Sample
Surface Water Body
SED1
SED2
SED3Upland Marsh (UM) SED4
SED5
SED6
SED1
SED2Upper Lagoon (UL)
SED3
SED4
Lower Lagoon (LL) SED1
SED2
SED3
SED7 (trip blank)
SED8Quality Control (dredge
blank)
SED9 (tube
samples blank)
Total Analyses 11 11 16
TOC - Total Organic Carbon CEC - Cation Exchange Capacity
UL SED2 is a replicate sample of UL SED1
Will be designated to the laboratory as matrix spikematrix spike duplicate
Additional trip blanks may be needed to ensure one trip blank per cooler
Project 90393 GEI Consultants Inc March 281991
TABLE 4 - SURFACE WATER ANALYSIS PROGRAM Field Sampling Plan OConnor Co Site Augusta Maine
SAMPLE SAMPLE LOCATION NUMBER Lead Aluminum PCBs
Upland SW1 X X X Marsh (UM) SW2 X X X
Upper SW1 X X X Lagoon (UL) SW2 X X X
SW3 X X X
Lower SW1 X X X Lagoon (LL) SW2 X X X
Quality Control Samples
Trip Blank SW4
Sampler Blank SW5
TOTAL ANALYSES
TSD - Total Suspended Solids
SW2 is a duplicate of SW1
Will be designated to the laboratory as matrix spikematrix spike duplicate
Additional trip blanks may be needed to ensure one trip blank per cooler
Project 90393 GEI Consultants Inc Page 1 of 1 March 28 1991
TABLE 5 - BARN SAMPLING ANALYSIS PROGRAM Field Sampling Plan OConnor Co Site Augusta Maine
SAMPLE MATRIX PCBS CPAHS Lead
Analytical Level IV
Wipe samples PTB (trip blank) PEB (equipment blank)
12 3 3
Wooden wall samples 10 10 10
Dustsoil on floor slab
Concrete slab
Total Analyses 36 18 18
Additional trip blanks may be needed to ensure one trip blank per cooler
One sample will be designated to the laboratory as a matrix spikematrix spike duplicate
Project 90393 GEI Consultants Inc Page 1 of 1 March 281991
TABLE 6 - SOIL SAMPLING EQUIPMENT REQUIREMENTS Field Sampling Plan OConnor Co Site Augusta Maine
Safety Equipment (Level C - Dermal)
Health and Safety Plan (copy) Portable Photoionization Detector (HNu) Hand-held Aerosol Monitor (HAM) Disposable Tyvek Coveralls Tyvek Hoods Duct Tape Safety Goggles Safety Boots Surgical Gloves Butyl Sampling Gloves n gt Rubber Boots or DisposableBooties Hard Hats (when near qverhead objects)
Safety Equipment (Level C - Respiratory)
Sampling and Measuring Equipment
Other
Full-face Respirators Combined Organic Vapor and
High-efficientcy particulate Cartridges Dust Prefilters
Level and Rod Measuring^Tape Stainless -SteeLShovels Stainless Stee^T rowels 165-foot Measuring Tape Methanol V
Distilled Water Paper Towels
SafopltngjSlassware (See Table 10) xCo6lers with Ice or Ice Pack
Clear Plastic Tape Re-sealable Plastic Bags
Gallon Drums
ite Maps Project Log Books Marking Pens Camera Photograph Log Forms Test Pit Log Forms Boring Log Forms Chain-of-Custody Forms Sample Assignment Forms Equipment Calibration Logs Extra Bottle Labels Spare AA Batteries for Meters Blank Federal Express Airbills
Project 90393 GEI Consultants Inc Page 1 of 1 January 171991
TABLE 7 - SEDIMENT SAMPLING EQUIPMENT REQUIREMENTS Field Sampling Plan OConnor Co Site Augusta Maine
Safety Equipment (Level C - Dermal)
Safety Equipment (Level C - Respiratory)
Sampling and Measuring Equipment
Other
GEI Consultants Inc
Health and Safety Plan (copy) Portable Photoionization Detector (HNu) Hand-held Aerosol Monitor (HAM) Disposable Tyvek Coveralls Tyvek Hoods Duct Tape Floatation Vest Inflatable Boat Safety Goggles Safety Boots Surgical Gloves Butyl Sampling Gloves Rubber Boots or Disposable obties Hard Hats (when near overheackobjepts)
V Full-face Respirators Combined Organic Vaporand
High-efficiencyHPartjculate Cartridges Dust Prefilters
Level andRod Measuring Tapp 165-foot MPasuririgTape Methanol V Distilled Water jper tpwels V
SjE(mplinsect~Glassware (See Table 10) Cdolbrs wlthjbe or Ice Pack
Clear Plastic Tape Re-sealable Plastic Bags
-Galloh Drums fghted Measuring Tape e Sediment Sampler dge Sediment Sampler
Site Maps Project Log Books Marking Pens Camera Photograph Log Forms Chain-of-Custody Forms Sample Assignment Forms Equipment Calibration Logs Extra Bottle Labels Spare AA Batteries for Meters Blank Federal Express Airbills
Project 90393 Page 1 of 1 January 17 1991
TABLE 8 - SURFACE WATER SAMPLING EQUIPMENT REQUIREMENTS Field Sampling Plan OConnor Co Site Augusta Maine
Safety Equipment (Level C - Dermal)
Safety Equipment (Level C - Respiratory)
Sampling and Measuring Equipment
Health and Safety Plan (copy) Portable Photoionization Detector (HNu) Hand-held Aerosol Monitor (HAM) Disposable Tyvek Coveralls Floatation Vest Inflatable Boat Tyvek Hoods Duct Tape Safety Goggles Safety Boots Surgical Gloves Butyl Sampling Gloves Rubber Boots or Disposable Booties Hard Hats (when nearOverhead objects)
w Full-face Respirators Combined OrganicVaporand
High-efficiency Particulate Cartridges Dust Pi
Level and Rod
Measuring Tape M3amp-foot Measuring Tape JsopropyhAlcohol Mbthanol DistlHed Water PaperTowels Sampling Glassware (See Table 6)
oolers with Ice or Ice Pack tear Plastic Tape
Re-sealable Plastic Bags 55-Gallon Drums Weighted Measuring Tape Kenmerer Sampler Disposable 045 Micron Field Filters Pressure Pump for Field Filtering pH Meter with Temperature Probe Cole-Parmer pH-40 70 Calibration Solutions Cole-Parmer 1413 Micromhoscm Calibration Solution
Project 90393 GEI Consultants Inc Page 1 of 2 January 171991
TABLE 8 - SURFACE WATER SAMPLING EQUIPMENT REQUIREMENTS Field Sampling Plan OConnor Co Site Augusta Maine
Other Site Maps Project Log Books Marking Pens Camera Photograph Log Forms Chain-of-Custody Forms Sample Assignment Forms Equipment Calibration Logs lt Extra Bottle Labels Spare AA Batteries forM6ters Blank Federal Express Airbills Xy
Project 90393 GEI Consultants Inc Page 2 of 2 January 171991
TABLE 9 - BARN SAMPLING EQUIPMENT REQUIREMENTS Field Sampling Plan OConnor Co Site Augusta Maine
Safety Equipment (Level C - Dermal)
Safety Equipment (Level C - Respiratory)
Sampling and Measuring Equipment
Other
Health and Safety Plan (copy) Portable Photoionization Detector (HNu) Hand-held Aerosol Monitor (HAM) Disposable Tyvek Coveralls Floatation Vest Tyvek Hoods Duct Tape Safety Goggles Safety Boots Surgical Gloves Butyl Sampling Gloves Rubber Boots or Disposable Bboties Hard Hats (when near overheackpbjects)
Full-face Respirators Combined OrganicVapor and
High-efficiencyParticutale Cartridges Dust Prefilters
Gas powered electrfcgenerator 5 gallonsgaspline 350 feetNplectricahextfnsion cord Self-standin^work-larnps (200 watts minimum) Electric 38drilkwith two 1-inch wood boring bits ElectricBoschhammer drillwtungsten-carbidemortar bit Hpound-cut polyethylene sheeting and duct tape
Steel blaRing sheet X^vdiSpdsabfe nylon brushes
Stainless steel trowels Three 100 cm templates andone 25 cm template Forceps Peper towels Silf-sticking adhesive labels and push pins
Site Maps Project Log Books Marking Pens Camera Photograph Log Forms Bam Sampling Forms Chain-of-Custody Forms Sample Assignment Forms Equipment Calibration Logs Extra Bottle Labels Spare AA Batteries for Meters Blank Federal Express Airbills
Project 90393 GEI Consultants Inc Page 1 of 1 January 171991
TABLE 10 - SAMPLE CONTAINERS AND PRESERVATION REQUIREMENTS Field Sampling Plan OConnor Co Site Augusta Maine
Holding Media Parameter Container Preservation Time
PCBs 8 oz glass jar 4deg C 14 days-with Teflon- extraction lined lid 40 days shy
analysis
cPAHs 8 oz glass jar 4deg C 14 days-SOIL with Teflon- extractionSEDIMENT lined lid 40 days shyWOOD
analysisCONCRETE AND WIPE Lead 8 oz glass jar 4deg C 6 months SAMPLES with Teflon-
lined lid
Bench-scale 5 gallon high NA NA testing density
polyethylene bucket
PCBs Two 1-liter 4deg C 7 days shyamber glass extraction bottles 40 days shy
SURFACE analysis WATER
Lead 500mi HN03 4deg C 6 monthsSAMPLES polyethylene to pH bottle lt20
Aluminum 500ml HN03 4deg C 6 months polyethylene to pH bottle lt20
NOTE All standard sample containers will be l-CHEM equivalent bottles supplied by the laboratory The 5-gallon polyethylene bucket will be rinsed with methanol and distilled water prior to use
NA = Not applicable
Project 90393 GEI Consultants Inc March 28 1991
gt 1I L )
i bullbullbull j bullgti sil- j-V
poundP
A C
jfr35
QUAOnANQLE LOCATIONTOOU9 POND MAINEJI881)N4416-W37-307B
bull4000 FEET
Central Maine Power Company Pre-Design Work Plans SITE Augusta Maine OConnor Site LOCATIONFrom EC Jordon Co RIFS
Augusta Maine MAPReport dated June 1989
C D Project 90393 January 1991 Fig 1 G E I C o n s u l t a n t s I n c
b-r
p pp l-I 0 x foooo^ _^_ZZZ~~r^-^
UpoundEtpound 1IMA iRAMWOfMII NOW AM A OAAMAG IWAllrj WWEOfOHAMMS MHICUOn Central Maine Power Company Pre-Design Work Plans LOCAIION Oh
in cuelt^KL2 Augusta Maine OConnor Site TRANSFORMER
Scale 1 inch = 142 feet Augusta Maine WORK AREAS AND SWALESFrom EC Jordon Co RIFS
Report dated June 1989 C D G E I C o n s u l t a n t s I n c Prnjprf QfttM January 1QQ1 Fifl 0
~- bull middot bull -middot r middot~middotmiddotmiddotIll middotmiddot t~r
I bull Imiddot
bull bull1 middotmiddot middotir-------~-------middot ~ bull middot middot-------------------middotmiddot ~ middotmiddotmiddotamiddot A middotimiddot r bull amiddot A I bull TWA I tmiddot LOW AREA A NO~TH) SOUTH) I
v
A middot
rmiddot---middot---middot~middot---- ----middot~middot [WEST) [W[ST) (EASr) middot I
middot middot middotmiddot AmiddotA D-D 220 SCRAP ARf-A 201 -
bull - I
nor 140 TWA I 2bull0
1 bull middotbullmiddot1~-~~ L~W AR1-A ---- middot-~ l0 ~
i r bull I -$-~middot
0 - )1 _~ ~ middot1~oi I EEltY
J I ~2J~ bullbull
bullf()omiddot middotmiddot middot~ bull0 2 i- 0
11bull I lo bull ~middotmiddotmiddot~middot ~ ~--middotmiddot~middotbull ~-8~-i~~jplusmny~f~=ii1 - ~ bull ___ I I- _5 middot~bull-tmiddoti~middot~ N ~ bullbull ~ i I o middot TP19 gt - ~ ~ Jmiddot ~I middot~middot~I bullJUI 215 middot 215~-I e bull TP23 if 21~ ~ middot middot middot_ ------ ~middot - L middot~ ~ ~~ 1 i i
235 middotQ1middot1middotmiddot ~ bullbull ~~middot~middot- Lil middot~ _~ middot f bulllto --- z middotmiddot middot
middotr
-lt lt -middot I ~ middot ~ I
1 c ~ __ ) bull bull bullmiddot bull --middot Q
middot bull bullbull - 1middotmiddot - bullbull ~middots middot- uPPfR 1middotmiddot T LAGOON 1middot middot -$- middot middotmiddotpoundpound~middotmiddotmiddotmiddotmiddot bull =lt middot
~ middot ~~ iP22 gt middotgt
w
210 I
-
------_7___ 210 1 _
w_ +-
middot middot w--~ J210 middot i~30 -- middot_
1 TP18 bull middotmiddotI middot~ ----shy middot-middotmiddot
middot~ I j
middot- t - I 1 I BEDROCK 11 I
1
lmiddotmiddotomiddotmiddotmiddotmiddotmiddot middot middot middot =middot _middotmiddot middotmiddotmiddotmiddot 1 I rI Th 205 bull 205
bull -middotmiddot bull_ 1 225 22 middot bullbullbull fltISmiddot middot middot ~ ~middot f4tmiddotmiddotmiddot I J205 1bull
middot OOTR10U1t0N craquo-middotPC~middot~oN~A~ SEL11r~~~TS H LO~ AR~A ------------------------------------------------bull1 BASEO IN PART ON QBSERVATION Of FILL PlACEMENTmiddot bullmiddot E~middot-1middot bull bullbullbull middotmiddot Q - _
_
-1 I
fmiddot bull bull
-middotmiddot I r-middot shy c bull
I omiddotmiddot
r- middotmiddotI ~I
1 middot1 r bull bullf-Sf1 TWA I middotbull middot ~ i1 bull bull middot (EASfJbullI middot-----bullI (WEST) middotI bull I 1I cmiddot middot~ I~ ~ I bull bullbullbullI 1bullbull
(EAST) - bull middot- - I
bull bull r ~middot l
~
~30 i
2io bull
middot) Ibullbull
I
- J l TPl7 bull- f ~j -middot middotmiddotmiddotmiddot I 1 J middotmiddot1
middot~ ~ bull middotimiddotmiddotch bull bull_ t-ROAOI cli middot bull ~ middot1middot
225
I bull ILmiddot i~A--middot1middot 225 bull
1225 middot I ~ CENTRAL DRAINAGE middotmiddotmiddot--Q-middot --middot _ --middot
~ I -- -shy A middot
bull B-B --- m
- _ - middoti-- 10bull ~ m
g r
220 220 I ~
I middot _
l MI r ~ I
middot middot 1bull bull1 111
I rbull bull
middot
bull bull l
215 BEOROC~ 215
bull I bull middot - -
) l
-middotshy- bull Il
I 5 -middot middot middottc bull bull gt f bull 110 1~ w 210 210 ~ middotmiddotmiddotmiddotmiddot middot-middot -
( bull
middotlt bull [ I
bull G -
-middot-
middot middotmiddot bull ~middot-middot-- -middot- t~middotmiddotmiddotmiddotmiddotmiddot middotmiddot middot L -middot 1 -middot~ bull bull - middotmiddot L middot-~ _ bull f middot middot1 I ~ l
205 bull bull ~middot JO~cmiddotimiddotmiddotmiddotmiddot middot--middotmiddotmiddot1 _~ middotmiddotmiddotmiddotmiddot middotmiddotmiddotmiddotmiddotmiddot bullI bull middot -middotmiddotmiddotmiddotmiddotmiddotg
bull -$-middotmiddotmiddot middot~middot iii~~- ~0 i TB-20 SUBSURFACE BORING NUMBER bull bull bull TPmiddot 105 TEST PIT NUMBER
middot
bull1
bull I TP16 middotmiddotmiddotmiddotmiddot~ Q G) ) mmiddot i GROUND SURFACEmiddot bull 1bull 1middot bull I i ~ u o I bullbullbull I~ bullbullbull bullbullbullbullbullbullbullbullbullbullbullbull bullbullbullbullbullbullbullbullbullbull bull middot bull
ll bull bullbullbull middotmiddotoz bull I 250 CONCENTRATION OF PCBs IN SCREENED SAMPLE lPPm) r lt bull bull I
middot CONCENTRATION CONTOUR middot middot bull - -- CROSS-SECTIONS CONTOURED AT 5ppm 50ppm ANO 500 ppm TOTAL PCBs
middotbull middotmiddot c- I bull ~~ ND NOT DElECTED -middot ~ I
middotmiddot middot--middot~ middot sect t I middot UNDERLINED VALUES ARE CLP RESULTS (ppm)bull
middot -____ bull ~~ - -- I
bull bull middot -middot middot bull Ibullbull middot ~- middot --- LEGEND (ISOPACH MAP) bull lmiddot I l
I
-middot 1 middot I
bull middot ~SUBSURFACE EJORING LOCATION middot
-t middot ( 10766 - 10 10186) middot middot J BORING NUMBER -2 middot THICKNESS OF SOIL CONTAINING PCBs IN EXCESS OF 5 ppm
I
bull ~ middot
LOW AREA BORING LOCTION (107187)
- I j
I
bull BORING LETTER - ~ THlC~NESS OF SOIL C011TAINING PCBs IN EXCESS oF Sppm middot middot middot middottmiddot=plusmn+ TEStPIT LOCATION 1 bull bull bullbullbull i 0~ Q G) I -$ ELECTRICAL EQUIPMENT SAMPLE POINl middot middot -middot bull 1-1 I ~ bull
If bull bull ) bullbull bullbullbullbullbullbullbullbullbullbull f4( middot~01 l - bullmiddotomiddot
middot - ( ~-~ SURFICIAL EXTENT OF SOILS CONTAINING gtSppm PCBs bull middot (
bull __ ~ -middot middot_ middotmiddotmiddotmiddotmiddotmiddotmiddotmiddot _ - middotmiddot --- bull bull -bull - ISOPACH LINE ILLUSTRATING THICKNESS OF SOILS CONTAMINATED BY middot middot middot -middot~middotmiddotbullmiddotmiddotmiddot middotmiddotmiddot bullbull middot middot bull middotmiddot middot 8 -- bull _CONTOURS [)RAWN _-- ~ _l bull abull lO_fEF lran_~OUllCStRF~CI gt~~~~ ~~~~bull
I bull middot T o o bull bull middot middotmiddot
) NOTES 1 -middot -middot bull
I1 THE ISOPACH CONTOURS WEREDRAWN TO DENOTE THE THICKNESS OF SOIL ~ Q iP1 middot 0 bullbull 5 bull GEi BORING LOCATIONS middotMEASURED FROM THE SURFACE CONTAMINATED BY GREATER THAN 5ppm TOTAL PCBs bullbull bull bull I THE VALUE OF 5ppm WAS CHOSEN ARBITRARILY AND IS NOT INTENDED TO REPRESENT
middot bullv middot-- - l A SITE-SPECIFIC CLEAN-UP LEVEJ GEi TEST PIT LOCATIONS
2 CRO~S-SECTIONS ILLUSTRAt EXTENT OF PCB CONTAMINATION WITH DEPTH I middot- -f j bull I
_ veRTt6l1 EXAGGEP1r10M m c~oss sicT1c~S 1s 61 middot
bull
middot
I middotshy1
middot J~uJt bull bull i ~ ~ _ - middot j
1 ~ middot bull bull bull middotmiddot l a )
0 gt bullmiddot -~I middotbull I 0 middot r middot- bull ibull I
bull
_ _ I I ~
middot I
bull bull
bull middot~r
- -middot- - -
bullI l middotI middot I bull r f I I
~_ Igt bull
bull f middot
t bull middot bullbull 8 _
~ 7 I r 9
-middot- bull bull I I ~
middot 1
bull ____________________________ ___ _ bull I
bullI 1 bull middot -~ bullr
---------r- -- -- middot~-~~~~middot--middot ~ f middoti middot
bull t ~
bull
middot j
1
-------- -------- ---------------------------- ti 1
bull ~---middot ------middot ~---middotmiddotmiddotmiddot-middot--middot-middot~---middot-- ___~------- middotmiddotmiddot middot middotrbull ~ ~--~~-~middot-~ 1 middotmiddotmiddot I
middot bull middot4J middotmiddot 1 middot
middotI 1
I
bull
bull
middot ~ middotimiddot 1 bull j-1 ~ bullbull bull I bull i ~
APPROXIMATE SCALE I DESIGNED
~ BY
bullIbull Imiddot bull SOURCEmiddot EC JORDON CO RlFS middot bull Central Maine Power Company Pre-Design Work Plans SOIL I ~ t
middot
middot bullmiddot I ~middotmiddot ( bull bull REPORT DATED JUNE 1989 bullL bullr middotmiddot bull ~I middotmiddot DRAWN BY I I bull 1 r bull ~ middotmiddot middot
bull r shy~middot r i Augusta Maine OConnor Site bull SAMPLING I Imiddot 0 middot bull
bullI
bull bull
r bull 40 80
J 1bullmiddot
CHECKED BY Augusta Maine middotLOCATIONS
h cf I ~ 1bull rmiddot_
1 Inch =~Feet t--~------~---_middotmiddot~ I ~middot bullgtIbull
) i _- DATE January1991 middot middot middotmiddotmiddot tbull middot1middotmiddot APPROVED BY GE I Consultants Inc
middot
middotmiddot middot t---P-R_O_J-EC_T_9_0_39-3-----4-S-H-E-ETmiddotmiddotOfFbull t DATE REVISION BYmiddotmiddot J middotFlg3 middot
1 nuovN( POST middot 1 Nl6~1 middot bullbull Ibull Ibull bull bull lomiddot bullbull -
I
I
I
------------ -
) bull middot i bull I
~ f I middot1 bull ~I r
I
middot
-middot- CJ middotYmiddotmiddot I
C bull
middot
I middot I
middot -shy bull bull middotmiddot~
J middot _ bull y
Ibull bull
~ bull ~~ r I bull middot bull
middot bull
I ~ I I ( I bull
JI t
- I
J l I
-~ 1 I
bull j middot middot~ ~ middot) __-_ bull i
Ibull I lt bull
middotmiddotmiddot
gtImiddotmiddot
I
I bull
middotmiddotmiddotmiddot_v -
~ bull J i 1 bullbull
r 1 I ~ middotbull middotbull
I I I l~_middotgt~~bullI~~~bull~middotmiddot jbull1111 1 bull~ - 1 111 middot~ bull1 middot 1middot I jbull I bullI _- middotmiddot 1 1t1 _ 1 (Imiddot 1 bull1 1gt middot~middotlt~middot middot
I l bull bull 1 r I bull bull middot
bull middot middot middot middot~middot ~middot middot~
- J ~J ~~ O lt hj I bull ~ bull bull 1 o t I lbull I
middotmiddot bull ~ middot I bull middot bull bull
middot bull - I middot ~middot
bull 11 ( _ I
middot I Ii lfI ltI
bull
I 1- bull_ II ~ I middot
I bull vmiddotmiddot
30 I ~middot middot bull bull
lt 1 I ---middot _ bull I ~ bull bull ~ bull
II ~
111
bull bulll3 bull ~ middotmiddot bull Ibull 0 I 1 bull 111 bull bull I rbull1 middot 0 I I I - Ibullmiddot 1 bull r middot middot __ -
i bullmiddot ~ ----middot yen ~ bull ~ j
--~middot
I
I
- -- ( middotmiddot~middotmiddot- - bullbull~ _ ~- I ~ bull--- shymiddot ----bull
1- -
bullbull I I - ~ I I bull middot middot ~ I middot
1
---- _ --
bull1 II I j
I bullbullbullbull
II ~
J 1bull ~
I
bull I I bull I ~ middot Tmiddot I 1 ~ bull JI I t Ibull bull ~ bull middot
I -
-----~_ middot1
-1
~
bullbull
-
bullbull I
middot---- a I AiLWO _ middotshy
I
bull f l
I bullbull - middot I - bullbullbull
SVf1
S~D1- -0 sih3 0
I I 0 1 i ---shy (]
middot bullgt I
I J middot bull bull IIbull Iamp middot P I 177
r o ~ 0 SEol l-middot J~ I - -- ltl
f bull bull
gt1 bullI 1 V bull ~ II ~ tJ middot -middot-
I
middot1 - bull bull bull -middot
bullmiddot -bull wmiddot ~ ~ ~
bull IA1 gtW2 - gt1
- - ~ -
middotmiddotmiddot----- ~r=02 bull bullmiddot I __ i Ctt1rr--shy
bullI
Q bull _
1
D I bullbull middot - bull
SW2
I middot- bull
bullI ~middot
rl
~ se02 I bullbullbull I bullbull ~ L-lf L-- I
- ___ bull bull___ I bullbullbull
I bull ) I f IIUZ middot___ ---- bull cu bull
I gt
bullbull -shyI bull Ii bull f
~ middotmiddot~ ~ middot - I
I bull ~ ) I~ shy bullfmiddot~ ~ i ~ ~middot
~ I 1
bull 4 Ot f I
1 i f ~ bull lt
1
bull bull I
___ - ~)____ - ------~ -------middot-middot-r--middot-middot ----middot- - ---middot-middot-middot-middotbull
t t - -- a
I middot bull -- middot - __ __--~~~=--~---_-~= _ _ middot - I ii- - ~~=-=~==--=~middotmiddot-~=~~~~~~=-~~~======middot=middot~middot== middotmiddot-- _ - I
bull -------------------~_
t ~middot middot middot middotbull bull middot i------------1I Imiddot ~~f~=-~~J~i~~~f~U+--f~~~===~~-~~middot~f~=~=~=~~fi~-~-~==~~-==~==~~==~====~==~-=-==~=~=2~~~~~~~77=~=~=~~-=~s)middot==~~~--=-=~~~=~=~====-=====~~=~~~~~=~=~=~==~==-=~=~=middot
middot 7gt JloltGKLA lllD --- shy l lf-nt RT n bull middotl bull
I
-i~------ - -- -------- -- --= bull (
( ei -~ ---- -------- - - - - - bull - shyI bull middot 1 ------
--------~____-____ bull SSmiddotsmiddot~middot2-iJi_8plusmn~plusmn-~~plusmn=+=~==-=-==~~===~~~~~~=-=s~~2~-~s-==~~~z--==~=~~t-=-=-=-==-=---~34~~~-==-=-==-==~=middot==---~=-middot~i~middotmiddot~ middot)~ f ________bull _
~--- __ - ____ - bull shyI I
bull __ _ ~ ~ ~ middott1 middot_
J(J--_ 11bull middot ------deg gt
middot -f ~~~se~middot~ARm~OMAarra~PERfOAMagtBY 0 middot~ bullO ( l r
r-------------liDElmiNEiiiiY-r---Amiddot----------________---~-------------_____ __________middotmiddot_lIbull middotmiddotmiddot ACHERON ENOINEERINCI 8ERVJCED COMPLIED IU8lo BASll MAP
(middot VERIFIED TO MEET NATIONAL MAP ACCUAACI 8TANOARD8(NMJ) middot Tl1ROUQltATEaT GURVltY CONOUCIED Df JORDM 121aa LEG~ APPROXJMATESCALE DESIGNED BY
-----------_ ---------~ CentralMalnePowerCompany p D W kPI middotSURFACEWATERANDmiddotmiddot_-~middotmiddot~~~middotFitow~middot~(TOO~MEETNMAamp DRAwN BY re- es1gn or ans middot middot middot shy bull bull bull - bull
bull Aug~sta Maine OConnor Sitamiddot SEDIMENT SAMPLING middot3middot~~~middot~--~~amCla~~~~~~usa-o middot O GEISEDIMEITTSAMPUN~LOCATI~Ns o 40 middot 80 1
BY LOCATIONS ~middot)~middot ~ bull 11i GEISURFACEWATERSAMPUNGLOCATIONS middot CHECKE
rh A~gustaMalne lt middotmiddot( middotmiddot 11nch-40Feet DATEmiddot January 1991
middot APPRovED BY -V GEi Consultants Inc ~ Imiddotgtmiddotgt middotmiddot middot middot souRCE EC JORDON co RlFS bull middot GEi COMPOSITE SEDIMENT SAMPLE bull DATE REVISION BY - PROJECT 90393 SHEET OF middotI middotmiddot middotI middotAEPORTDATEDJUNE1989 v COUECTEDFORBENCH-SCAIETESTING
I J ~ I
i I bull I )__ )
I I ilo I Ibull
X -4 mdashmdash-0shy
W A Elec-Zl lt4W
Meters Shelves ^ Pickup
A CapAntique a)
W WAutomobile W J
ia iW Y
W A o
LEGEND C w
Stove - wBoat X Designated Wall Label w
-e- -fr bulleshybull Cement SlabDust Sample
0 Wooden Wall Sample ZTaping Reference Origin
W Wipe Sample
Approximate Scale
NOTES 30 Feet
1 Ail locations on this plan are approximate
2 Sample locations are general Central Maine Power Company Pre-Design Work Hans EXAMPLE examples of the type of sampling Augusta Maine OConnor Site BARN SAMPLINGand the distribution Augusta Maine LOCATIONS
3 Revision No 1 (3-28-91) ltP G E I C o n s u l t a n t s I n c Project 90393336 January 1990 Fig 5
I I I I
I
I I
I
I
I
I
I
Document VoL II SC SAP Appendix A Revision 0
Date January 171991 Page 1
V
APPENDIX A zgt
s HEALTH AND SAFETY-PLAN
Source Control PrampDesign Studies CConnorCO^Site
Augusta Mkine shy_ lt
lt
NT lt
Document Vol II SC SAP Appendix A Revision 0
Date January 171991 Page 2
GEI CONSULTANTS INC SITE HEALTH AND SAFETY PLAN
Site Name OConnor Co Site
Site address Street Route 17 Qty Augusta State Maine
Proposed Site Activities Source Controlsampling of surface andsubsurface soilssediments surface water and the on-site barn
Proposed Date of Work April 1991 gt S
Original Safety Plan YES
Site Safety Coordinator Thomas S Bobowski
Client Central Maine Power Company^(CMP)
Site Contact Charles Nickerson (CMP)
Team PERSONNEL ^ IRESPONSIBILITIES Robert E Stetkar lt ^mjectManager Joanne O Morin Work Tlans and Pre-Design Studies Manager Richard F Murdock Qhality Assurance Officer Benjamin YSu Treatability Studies Manager Joseph G Engels Technical Consultant Steven R fcambx Source Control Sampling Task Manager Thomas S Bobowski7 Barn Sampling Coordinator Sampling Boyd P Smith Sampling Christopher L Covel Sampling William J Haswell Sampling Charles Blodgett Field Screening Analytical
Background Information
The OConnor Co Site (Site) covers approximately a 9-acre portion of a 65-acre parcel within the city limits of Augusta Maine The Site is surrounded by sparsely-developed residential or agricultural properties or undeveloped woods and wetlands (Riggs Brook and associated wetlands border the Site to the east) The F OConnor Co operated a transformer stripping and recycling operation on theSite from the1950s through the 1970s
Document VoL II SC SAP Appendix A Revision 0
Date January 171991 Page 3
During operations releases of wastes including PCB-laden oils resulted in contamination of water and soil on the site Principal features of the Site include a barn which formerly housed scrap operations an upland marsh formed by man-made disruption of natural surface water drainage upper and lower surfacewater impoundments (lagoons) constructed to control migration of oils from the Site a low area where excavated lagoon sediments were deposited within a clay liner three former transformer work areas a former scrap yard and a wetland associated with Riggs Brook A site plan depicting some of the major features of the site is shown in Figure HS-1
Ax In 1986 and 1987 remedial investigations were performed byECvJdrdan Co for Central Maine Power Company (CMP) These investigations included over^OQ soil samples 11 monitoring wells and analysesof surface water ground water sediment and biota for PCBs organic and inorganic chemicals The primary contaminantsdetected in soil and sediments at the Site were PCBs PAHs and Lead Chlorinated benzenes PCBs phthalates and to a lesser extent volatile organics and metals were detected in ground water and PCBs and metals were detected in surface water Using these data Clement AssociatesInc performed an Endangerment Assessment in 1988 for EPA^evaluating risks to human health and the environment associated with existing condiuoi^ra^Tuture conditions related to a noshyaction remedial alternative In 1989 EC JordabCoi acting as consultant to CMP completed a Feasibility Study which evaluated remedial alternatives based on information provided in their earlier Remedial Investigation Report and in the EPA Risk Assessment Report After receipt of the Feasibility^Stiidy Report EPA issued a Record of Decision (ROD) in September 1989 describihg the^EPA^elected remedial alternatives for source control and management of migration
Site Status Waste Types
Includes the followin
Ground water Surface water Sediment Soils On-site structures
Refer to Table1for listing of chemicals of concern during Source Control studies per media sampled
Document VoL H SC SAP Appendix A Revision 0
Date January 171991 Page 4
Hazard Evaluation
Known orSuspected HazardousToxicMaterials Polychlorinated biphenyls (PCBs)volatile organic compounds (VOCs) polycyclic aromatic hydrocarbons (PAHs) and metals (especially Lead) The ranges of concentrations of chemicals detected in all source control media on-site are presented in the attached Tables 1C through 1L from previous studies Concentrations of PCBs PAHs and Lead detected in surficial soikduring previous studies (including the on-site Barn) are shown in Figures HS-2 HS^3 and HS-4 respectively Concentrations of chemicals detected in surface water and sediihentsduring previousstudies are shown in Figure HS-5 lt( x
The primary concern at the Site is contamination of surface soils by spillage or leakage of transformer oils containing PCBs The potential forencountering concentrated wastes in the transformer work areas (TWA I TWA II andltTWAIlI) is high In addition wastes have also been identified in soils and sediments associatedwith the lagoons and drainage swales Within a short distance of these discrete areas of the site the potential for encountering significant concentrations of wastes-is low ToYeduce the likelihood of being exposed by wastes associated with these areasduring~source control sampling activities efforts should be made to avoid walking unnecessgrilyriiv these areas
Exposure to hazards from chemiealsduiing test plying and environmental sampling and analysis tasks are most likely to occurbyone-or more of the following
1 Direct contact with contaminated surficial and subsurface soils sediments or surface-water x N
mdashN2 Inhalation of fu^Uve^ust carrying contaminants
3 Inhalation of volatile orgsuuc compound vapors while test pitting or sampling the various media on-site
Toxic and Pharmacological Effects Refer to the NIOSH Guide to Chemical Hazard Table 2 lists the major chemicals of concern and their toxic and pharmacological effects Acute exposure to PCBs PAHs Lead and VOCs may result in dizziness or nausea The results of chronic exposure may include but are not limited to central nervous system depression liver and kidney damage and irritation of skin eyes and respiratory passages Many PCBs PAHs and VOCs are known or suspected carcinogens Routes of exposure include inhalation topical and ingestion
Document Vol II SC SAP Appendix A Revision 1
Date March 28 1991 Page 5
Heat-related illnesses range from heat fatigue to heat stroke the latter being the most serious Heat stroke requires prompt treatment to prevent irreversible damage to health Protective clothing may have to be cut off Less serious forms of heat stress require prompt attention to prevent further complications which may lead to heat stroke Unless the victim is obviously contaminated decontamination procedures should be omitted or minimized so that treatment may begin immediately
Hypothermia may result from personnel exposed to excessive cold during sampling operations Hypothermia requires prompt treatment to prevent serious damage to health Damp or wet clothing may have to be cut off and the persons body temperature must be elevated as soon as possible through the use of warm blankets or another persons body warmth Unless the victim is obviously contaminated decontamination procedures should be omitted or minimized so that treatment may begin immediately
Area Within Augusta Maine city limits
Proposed On-Site Activities Test pitting boring or hand augering for collection of surface and subsurface soil samples collection of sediment and surface water samples from an inflatable boat or from wading into the water with hip-boots and collection of samples from within the on-site Barn Potential physical safety hazards during each of the four proposed Source Control site activities are discussed per activity below
Test Pitting and Borings for Surface and Subsurface Soil Samples A backhoe will be used during test pitting operations to excavate soil for collection of samples The most significant hazard during this sampling effort is the potential for collapse of the excavation while sampling Therefore in accordance with OSHA and 29CFR1926 Subpart P if personnel are required to enter an excavation the excavation will be no deeper than 5 feet unless it is braced or sloped back For the Type A soils documented on-site (eg clay and glacial till) the required slope from the ground surface to the top of unbraced portion of the excavation in all directions is 05 HORIZONTAL 1 VERTICAL Short-term excavations of this type will not exceed 12 feet in depth In general a drilling rig will likely be used to obtain samples from depths below 5 feet by augering to a specified depth and using a split-spoon sampler
Document Vol H SC SAP Appendix A Revision 1
Date March 28 1991 Page 6
Other physical hazards during test pitting and boring operations include the presence of overhead objects (eg backhoe bucket) so hard hats must be worn during these tasks at all times In addition the potential for spreading contamination with fugitive dust during excavation and mobilization between sampling locations is much greater than during other Source Control sampling efforts Therefore Level C dermal and respiratory equipment must be worn during all test pitting and boring operations (see below) Additional decontamination procedures will be required between sampling areas to limit the potential for cross-contamination (see below)
Sediment and Surface Water Sampling These operations will be conducted using Level C dermal protection only The need for respiratory protection will be based on criteria discussed in the next section In order to collect sediment and surface water samples in interior portions of the Upland Marsh and Upper and Lower Lagoons an inflatable boat or hip-boots will be used Further sampling will be performed by walking along the shores of the surface water bodies while dragging a sediment sampler These operations involve the risk of falling in relatively deep water while equipped with Level C dermal protection This equipment may limit movement and may inhibit a person from swimming easily to safety Therefore while sampling with the boat a Coast Guard Approved life vest will be worn at all times In addition one person will standby on-shore to observe the boat operation and to assist in the event of a mishap Depending on the water and air temperature at the time of sampling it is possible that a person who had fallen in water may require treatment for hypothermia or shock
Barn Sampling The barn can be classified as a confined work space since it is fully enclosed and has a limited number of exits In order to operate safely in a confined work space special considerations are necessary Unlike some confined spaces the barn has numerous small openings in the wooden structure to allow for an adequate supply of air while collecting samples However the sampling effort will likely generate a significant amount of airborne dust within the barn which means that Level C dermal and respiratory protection must be worn at all times while in the barn One person will remain outside the barn during the sampling effort to observe the sampling personnel and to provide backup services Two Combination Type A-B-C fire extinguishers capable of extinguishing wood and paper flammable liquidis or electrical fires will be available (one inside and one outside the barn with the standby person) in the unlikely event of a fire occurring during sampling
Document VoL H SC SAP Appendix A Revision 0
Date January 171991 Page 7
In accordance with OSHA 29CFR1910120 a minimum lighting intensity of 5 foot
candles will be provided within the barn during sampling The creation of dust and the
low lighting which may be available in some areas of the barn is likely to limit vision
some of the time Special care must be taken to avoid tripping over the numerous
objects disposed of within the barn No electricity is available in the barn so power
will come from outside the barn to supply power for lighting and tools to be used in
the sampling effort This means that electrical extension cords will be laid out on the
floor to various sampling locations In addition a large amount of metal and wooden
debris exists within die barn which may become obstacles to free movement in certain
areas The wooden floors of the second story and loft ofxthe^arn are extremely
deteriorated in some places and should not be accessed unless authorized by the Site
Safety Coordinator v
The use of electric power tools to collect samples ^wobd boring and concrete drills) require special care The use of Level C dermal protection such as loose fitting gloves may make handling the drills more difficult Use speciaLcare to avoid contacting the moving bits of the drills while in operation tonvoid tearing tyveks or gloves If dermal protection is torn replace or patch it immediatelybefare proceeding with the sampling operation
Perimeter Establishment
MapSketch Attached See bdquo Perimeter Identified Access to site is restricted at all entry points via a locked
8-foot high cyclone fence^- x y
Zone(S) of contamination identified See Figure HS-1 through HS-5
Document Vol II SC SAP Appendix A Revision 1
Date March 28 1991 Page 8
Recommended Level(s) of Protection On-site personnel will use Level C dermal protection at all times See below for respiratory use
1 Protective Clothing
Sampling and decontamination personnel in these areas will wear
bull Disposable Tyvek coveralls over cotton coveralls bull Tyvek hoods bull Safety glasses or face shield bull Hard Hat bull Disposable booties over workbooks or waders for sampling surface water and
sediments bull Butyl rubber gloves over surgical gloves bull All gloves and booties will be taped to the Tyvek coveralls
2 Respiratory Protection
Air purifying respirators will be worn at all times while sampling during test pitting and boring operations and while inside the barn Otherwise the need for respiratory protection will be determined by on-site monitoring for organic vapors and the daily potential for exposure to airborne particulates The decision to utilize air-purifying respirators due to airborne particulates will be made by monitoring with a MIE MINIRAM Hand-held Aerosol Monitor (HAM) Based on previous studies (Endangerment Assessment Appendix F) an action level for worker safety of 10 mgm3 of respirable dust was established for the site Therefore when readings on the MINIRAM of 10 mgm3or greater are experienced Level C respirators will be worn Initial on-site monitoring for organic vapors will be conducted using an HNu Photoionization Detector (PID) Ambient vapor levels of 5 to 10 ppm above background in the breathing space will require the use of full-face cartridge respirators (Level C Protection) Background levels will be determined at the edge of the Site (ie fence line) before the initiation of the days activities Air quality will be monitored at the upwind boundary of the site at three locationsfor a duration of one minute at each location The maximum PID reading at each location will be recorded and the three readings will be averaged to determine the background level for that day Respiratory protection will be full-face respirators fitted with combined organic vapor and high-efficiency particulate cartridges (MSA Type GMA-F) Respirator cartridges will be replaced at a minimum on a daily basis Depending on readings obtained with the MINIRAM cartridges may be replaced at mid-day on windy days
Levels of organic vapors greater than 10 ppm above background in working areas will necessitate utilization of self-contained breathing apparatus (Level B Protection) During sampling HNu monitoring should be utilized to detect any changes in organic vapor levels Changes in fugitive dust or vapor level detection at any time may warrant appropriate alteration of required respiratory protection
Document VoL H SC SAP Appendix A Revision 0
Date January 171991 Page 9
Decontamination and Disposal
A decontamination areawill be assembled at the entrance to the site The decontamination zones will be established such that personnel and equipment are fully decontaminated prior to leaving the fenced area In addition all personnel will be familiar with proper decontamination procedures prior to going on site All personnel entering and exiting the hot zone shall pass through the decontamination zone
1 Personnel Decontamination
The personnel decontamination sequence is as follows
a Samples and equipment are dropped on plastic sheets
b Disposable booties Tyvek coveralls and contaminated outer gloves are first brushed off with soapy water then rinsed with clean water by decontamination personnel Thedisposable equipmenfis^then removed baggedand placed in a 55shygallon drum marked Dry Deconv
c Neoprene boots and outer gloves are washed if they were not drummed in Step b with soapy water and ririseck with clean water An additional rinse with methanol followed by a firiak water-rinse completes the sequence
lt d Neoprene boots and glovesare -removed
e Respirators (cartridge-change) are removed if necessary and disposed in the Dry Decon drum
f Surgical gloves are temovfedand disposed in the Diy Decon drum
Document Vol M SC SAP Appendix A Revision 0
Date January 17 1991 Page 10
2 Equipment Decontamination
The equipment decontamination procedure for Source Control sampling work performed inside the fenced area of the site is as follows
a All disposable items (eg surgical gloves plastic sheeting nylon brushes etc) will be discarded in the Dry Decon drum
b Heavy equipment such as the backhoe and drilling jig will be steam-cleaned on a specially constructed decontamination pad located east bfthermain site access gate and north of the ground water monitoring well couplet MW1Q2A and MW102B (see Figure HS-7) The pad will be constructed to allow for drainage of steam-cleaning solutions onto a bermed multi-layer -impermeable barrier consisting of several layers of at least 6-mil-thick polyethylene sheeting overlain and underlain by geotextile fabric The geotextile fabricwilfbe designed to collect contaminated sediments which may have collected on tires or excavating equipment Rinse water from the decontamination processwill then fre pumped through hoses or channelled for drainage into the Uppei^La^oomafter completion of surface water and sediment sampling The decontamination pad will be left in place after completion of field sampling
c All other equipment contacting surface or subsurface soils sediments surface water or materials within thebarm(egtrowels spatulas templates drill bits etc) will be decontaminated by rinsing with clean water scrubbing with methanol and re-rinsing with distilledwater Solutions which contain methanol will be collected for disposal into tHeJWet Decon drum Equipment used during barn sampling will then be drted^with paper towels and the towels will be disposed in the Dry Decon drum ^
3 Decontamination Station Closure
The procedure for decontamination station closure will be as follows
a Decontamination personnel shall be responsible for closing the station at the end of each workday
b All solid wastes such as plastic tarps bags and Tyveks will be placed in the Dry Decon drum and will be closed at die end of each workday
Document Vol IISC SAP Appendix A Revision 0
Date January 171991 Page 11
All spent decontamination solutions containing methanol will bedisposed of in the Wet Decon drum Decontamination solutions which are not composed of methanol and exhibiting PID readings below 1 ppm will be poured into surficial soils on the edge of TWA I within the fenced area of the site If PID readings are greater than 1 ppm the solutions will be disposed in the Wet Decon drum These drums will be closed at the end of each workday
d Drums shall be secured on-site until proper disposal is arranged after consultation with EPA
7 Air Monitoring Procedures X
Site Monitoring Equipment PID HNu PI-101 HAM MIE MINIRAM
Since Level C respirators will be used during test pitting and barn sampling air at the test pit and barn sampling areas will be monitoredfegularly with a PID and HAM primarily for future reference of the levels of VOCs and dustto^be expected during remedial activities During the other sampling efforts air monitoring wiH form the basis for whether an upgrade to Level C respiratory equipment is necessary TheltPID will be used regularly during soil sediment and surface water sampling^ TKampHAM will be used at least twice per hour while on-site to monitor for dust levels in air^Whenunusually windy conditions are experienced additional monitoring for dust levels wilLbe^erfbrmed When ambient temperatures in air are below 32deg F the chart recorderattachment for the MINIRAM must be used as the LED readout on the instrument may not operate below freezing All PID and HAM readings will be recorded in theJield Log Book
Document VoL H SC SAP Appendix A Revision 0
Date January 171991 Page 12
Emergency Information
Location Phone
FIRE Augusta (207) 623-2511
POLICE Augusta (207) 623-2511 State Police (Augusta) (207) 621-1200
AMBULANCE Augusta (207) 623-25tlx N
HOSPITAL Kennebec Valley Medical Center (207) 626-1000 Augusta Division N 6 East Chestnut Augusta ME
Chemical Trauma Capability Yes
EPA (Michael Jasinski) 7) 573-5786
DEP (Thomas Benn) (207) 289-2651
CMP (Charles Nickerson) (207) 623-3521
Directions to Hospital (See Fig HS-6)
Primary route to hospital is west on Route17 (Eastern Avenue) to Arsenal Avenue turn right on Arsenal Avenue and go3 blocks to E Chestnut street then right Emergency room entrance is 6 East Chestnut Street Alternate route - west on Route 17 (100 yards) to Cony Road turn right on Cony Road take^rst left (Cony Street Ext) to Riverside Drive go left on Riverside Drive the second mtejsection will be Arsenal Street goleft on Arsenal Street East Chestnut Street will be second left
Document VoL H SC SAP Appendix A Revision 0
Date January 171991 Page 13
Additional Emergency Contacts
DR DAVID EGILMAN (617) 935-8581 HEALTH RESOURCES WOBURN MASSACHUSETTS
GEI CONSULTANTS INC
ROBERT E STETKAR (603) 224-7979 JOSEPH G ENGELS (617)721^4022 s
TSCA HOTLINE (800)424-9065
AT amp F (EXPLOSIVES INFO) (800^424-9555 V
NATIONAL RESPONSE CENTER x(8W) 424-8802
PESTICIDE INFORMATION SERVICE (800)845-7633
RCRA HOTLINE y -(800) 424-9346
CMA CHEMICAL REFERRAL CENTER (800) 262-8200V NATIONAL POISON CONTROL CENTER (800) 942-5969-y
US DOT bdquo (202) 366-0656
GEI CONSULTANTS ^ (603) 224-7979
Prepared by Thomas S Bobowski Date January 7 1991
Reviewed by Robert E Stetkar Date January 9 1991
All personnel working at this site have received OSHA required health and safety training Personnel are enrolled in a medical monitoring program A summary of training completed for all GEI personnel involved in the Source Control sampling program is provided in Table 3
Use of Common Sense is Required
I have read and understand this safety plan
Name (printed) Signature Date
Table 1A Organic and Inorganic Chemicals Detected in the Shallow Aquifer
Groundwater Samples at the F OConnor Site Maximum
Concentration Geometric Background
Range Mean[a] Concentration (ugL)
Chemical Frequency (ugL) (ugL)
ND(b]-2300B[c] 150 NDAcetone 211 ND-15J[d] NA[e] NDBenzene 211 ND-45 143 ND2-Butanone 17 ND-83 53 NDChlorobenzene 311 ND-53 NA NDToluene 27 ND-12J NA NDTriehloroethene 1P ND-11 81 NDBis(2-Ethylhexyl)Phthalate 411 ND-25 1deglaquo2 ND12-Dichlorobenzene 411 ND-14J 97 ND13-Dichlorobenzene 311 ND-13J 96 ND14-Dichlorobenzene 311 ND-29 94 ND124-Trichlorobenzene 17 ND-19 07 NDTotal PCBs 111 27-5085 06 49Aluminum 55 27-805 24 42Barium 55 13700-125451 38300 26600Calcium 55 ND-145 53 NDChromium 25 ND-37 NA NDCobalt 15 ND-285 66 14Copper 35 33-4952J 590 3Iron 55 ND-18 37 NDLead 15 21-2906 260 24Manganese 55 ND-154 10 NDNickel 15 ND-17 37 NDSilver 15 10593-72812 33400 14000Sodium 55 ND-71 71 NDVanadium 15 17-946 263 91Zinc 55
a) Calculated using detected concentrations and one-half of EPAs contract laboratory program (CLP) detection limits for the organics For the inorganic
chemicals the aqueous CLP detection limits were used
b) ND - Not Detected
c) B designates Chat substance was also found in the blank though the
sample level was significantly higher to prove a positive detect
d) J designates estimated value
e) NA - Not applicable Chemical was detected infrequently and the use of
one-half of the detection limit in calculating a mean results in a mean
concentration that exceeds the maximum Therefore a mean is not used
SourceEndangerment Assessment dated Jan 29 1988 by CDM
Table IB Organic and Inorganic Chemicals Detected in Bedrock Aquifer
Groundwater Samples at the F OConnor Site
Mean Concentration Geometric Background
Chemical Frequency Range (ugL)
Mean[a] (ugL)
Concentration (ugL)
Acetone 220 ND[b]-1200 68 ND Benzene 220 ND-27J[c] NA(d] ND Chloroblt ene 620 ND-16 36 ND Toluene 215 ND-27J NA ND Bis(2-E vlhexyl)Phthalate 1320 ND-64 Hi 61 12-Dich 13-Dic^
irobenzene jrobenzene
720 120
ND-26 ND-24J NA
66 ND ND
14-Dic^ robenzene 620 ND-44 82 ND Di-n-Bu phthalate 120 ND-22J NA ND 124-Tr hlorooenzene 720 ND-310 161 ND N-Nitros iiphenvlamine 25 ND-4J NA ND 3eta-BHC 110 ND-04 004 ND Gamma-BH (Lindane) 110 ND-006 003 ND Total PC 320 ND-50 LO ND Antimony 110 ND-55 19 ND Barium 1010 15-129 138 56 Chromium 410 ND-268 54 ND Cobalt 110 ND-115 92 ND Iron 1010 61-384301 837 152 Magnesiu Manganes
1010 810
5960-46250 ND-5895
15220 661
4203
27 Nickel 310 ND-345 125 ND Potassiu 1010 3504-16046 6560 4340 Vanadium 110 ND-52 NA ND
a) Calcul ted using detected concentrations and one-half of EPAs contract labor 3ry program (CLP) detection limits for the organics For the inorganic chemic Is the aqueous CLP detection limits were used
b) ND mdash F detected
c) J de Ignates estimated value
d) NA - N applicable Chemical was detected infrequently and the use of one-ha of the detection limit in calculating a mean-results in a mean concern ation that exceeds the maximum Therefore a mean is not used
Source Endangerment Assessment dated Jan 29 1988 by COM
Table 1C Organic and Inorganic Chemicals Detected in In-Fence Surface Soil
Samples at the F OConnor Site Mean
Concentration Geometric Background Range Mean[a] Concentration
Chemical Frequency (ugAg) (ugkg) (ugAg)
19 ND[b]-19J[c] NA[d] ND Chicroform ND29 ND-150B[e] 63Methylene Chloride
ND19 ND-30J NAToluene 260J19 ND-917J 260Bis(2-Ethylhexyl)Phrhalate
Carcinogenic PAHs ND19 ND-2700J 290BenzoltAgtAnthracene ND29 ND-12000J ^10BenzoltB or KgtFluoranthene ND39 ND-11000J 540Chrysene ND39 ND-23183Total CPAHs
Non-carcinogenic PAHs ND39 ND-12000J 540Pvrene ND39 ND-12000 540Total NCPAHs ND118186 ND-6205600 3400 Total PCBs 4001419 ND-64000 1900Cadmium 292001919 17000-29480000 275000
Copper 570001919 29000-2681000 213000Lead 252001919 19000-90000 35000Nickel ND219 ND-12000 650Silver 738001919 45000-1160000 183000Zinc
aj Calculated using detected concentrations and one-half of EPAs contract UboSto program (CLP) detection Unite for the organic For the inorgar-c chemicals the detection limits for soils were based on aqueous CLP
detection limit
b) ND - Not Detected
c) J designates estimated value
d) NA - Not applicable Chemical was detected infrequently and the use of one-half of the detection limit in calculating a mean results in a mean concentration that exceeds the maximum Therefore a mean is not used
e) B designates that substance was also found inthe blank though the sample level was significantly higher to prove a positive detect
Source Endangerment Assessment dated Jan 29 1988 by Clement Associates Inc
Table ID
Organic and Inorganic Chemicals Detected in the TVA III Surface Soil Samples at the F OConnor Site
Concentration Geometric Background Range Meanfa] Concentration
Chemical Frequency (ugAg) (ugAg) (ugAg)
44-DDT 13 ND[b]-5200 150 ND 44-DDE 13 ND-260 56 ND Total PCBs 2131 ND-620000 2940 ND
Antimony 11 189000 41000
Cadmium 11 11000 400 Copper 11 230000 29200 Iron 11 60900000 22200000 Lead 11 634000 57000 Zinc 11 799000 73800
a) Calculated using detected concentrations and one-half of
ErAs contract laboratory program (CLP) detection limits
b) ND - Not Detected
Source Endangerment Assessment dated Jan 29 1988 by Clement Associates Inc
Table IE irganic Chemicals Detected in Upland Marsh Sediment
Samples at the F OConnor Site[a] Maximum
Concentration Geometric Background Range Mean[b] Concentration
Che ical Frequency (ugAg) (ugAg) (ugAg)
To ane 11 23J[c] - ND[d] To- 1 PCBs 33 1300-34000 6425 ND
a) norganic chemicals were also analyzed for but none were itected significantly above background concentration
b) alculated using detected concentrations and one-half of PAs contract laboratory program (CLP) detection limits
c) J designates estimated value
d) D - Not Detected
Source Endangerment Assessment dated Jan 29 1988 by Clement Associates Inc
Chemical
Acetone 11 408B[c] ND[d]
Bis(2-EthyIhexy1)Phthalate 11 2082 ND
Toluene 11 28J[e](f] ND
Total PCBs 44 30000-1100000 381000 ND
a) Inorganic chemicals were also analyzed for but none were detected
significantly above background concentration
b) Calculated using detected concentrations and one-half of EPAs contract
laboratory program (CLP) detection limits
c) B designates that substance was also found in the blank though the sample
level was significantly higher to prove a positive detect
d) ND - Not Detected
e) J designates estimated value
f) In a duplicate sample toluene was not detected A geometric mean of the detected value and one-half of the detection limit would have resulted
in a mean concentration exceeding the detected value Therefore only
the detected value is listed
Source Endangerment Assessment dated Jan 29 1988 by Clement Associates Inc
Table 1G Organic and Inorganic Chemicals Detected in Lower Lagoon Sediment
Samples at the F OConnor Site Maximum
Concentration Geometric Background Range Mean(a] Concentration
Chemical Frequency (ugAg) (ugAg) (ugAg)
Bis(2-Ethylhexyl)Phthalate 12 ND[b]-100J[c] NA[d] ND
Benzoic Acid 22 120J-190J 150 ND Total PCBs 77 3202-40100 8660 ND
Cadmium 12 ND-2500 790 ND c 22 27000-59000 40000 20000
Lead 22 17000-70000 34500 ND
Manganese 22 525000-982000 718000 474000
Selenium 12 ND-760 436 ND Zinc 22 103000-249000 160000 108000
a)Calculated using detected concentrations and one-half of EPAs contract laboratory program (CLP) detection limits for the organic For the inorgan chemicals the detection limits for sediments were based on the aqueous CLP
detection limit
b) ND - Not Detected
c) J designates estimated value
d) NA - Not Applicable Chemical was detected infrequently and the use of
one-half of the detection limit in calculating a mean results in a mean
concentration that exceeds the maximum Therefore a mean is not used
Source Endangerment Assessment dated Jan 29 1988 by Clement Associates Inc
Table 1H Organic and Inorganic Chemicals Detected in Riggs Brook Sediment
Samples at the F OConnor Site Maximum
Concentration Geometric Background
Range Mean[a] Concentration
Frequency (ugAg) (ugkg) (ugAg)Chemical
12 ND[b]-30 12 NDMethylene Chloride
Carcinogenic PAHs 22 160J[c]-790 360 230JBenzoltAgtAnthracene 22 220J-800 420 290JBenzoltAgtPyrene 22 2-63J-1600 650 710J3enzoltB or KgtFluoranthene 22 280J-960 520 400J
Chrysene 12 ND-190J NA[d] NDDibenzltAHgtAnthraeene 12 ND-400J 340 NDIndenoCl23-CDgtPyrene 22 1507-4740 2670 2402Total CPAHs
Non-carcinogenic PAHs 12 ND-110J NA NDAcenapthy1ene 12 ND-200J NA NDAnthracene 12 ND-410J 350 ND
BenzoltGHIgtPerylene 22 280J-1200 580 420J
Fluoranthene 12 ND-80J NA NDFluorene 22 72J-680 220 150J
Phenanthrene 22 290J-1500 660 470J
Pyrene 22 1810-4180 2750 2584Total NCPAHs 615 ND-6481 870 NDTotal PCBs 12 ND-1200 775 NDSilver
a) Calculated using detected concentrations and one-half of EPAs contract laboratory program (CLP) detection limits for the organics For the degrgan chemicals the detection limits for sediments were based on the aqueous CLP
detection limits
b) ND - Not detected
c) J designates estimated value
d) NA - Not applicable Chemical was detected infrequently and the use of one-half of the detection limit in calculating a mean results in a mean
concentration that exceeds the maximum Therefore a mean is not used
Source Endangerment Assessment dated Jan 29 1988 by Clement Associates Inc
Table II Inorganic Chemicals Detected in Upland Marsh Surface
Water Samples at the F OConnor Site[a]
Sample Background
Concentration Concentration
Chemical Frequency (ugL) (ugL)
Aluminum 11 884 104 Arsenic 11 35 ND(10)[b]
Barium 11 12 47 Iron 11 3540 1160 Lead 11 36 ND(5)
Manganese 11 ^29 134 Potassium 11 7260 3610
a) Organic chemicals were also analyzed for but
none were detected
b) ND - Not Detected Limits of detection are
given in parentheses
Table 1J Organic and Inorganic Chemicals Detected in Upper Lagoon
Surface Water Samples at the F OConnor Site
Sample Background
Concentration Concentration
Chemical Frequency (ugL) (ugL)
108 ND(10)[a]Total PCBs 11 47Barium 11 23
6 ND(5)Lead 11 Manganese 11 1450 134
25 ND(40)Nickel 11
a) ND - Not Detected Limits of detection are given in
parentheses
Source Endangerment Assessment dated Jan 29 1988 by Clement Associates Inc
Table IK Organic and Inorganic Chemicals Detected in Lover Lagoon
Surface Water Samples at the F OConnor Site Maximum
Concentration Geometric Background Range Mean[a] Concentration
Chemical Frequency (ugL) (ugL) (ugL)
Total PCBs 22 13-375 221 ND[b] Aluminum 22 56-3740 458 104
Arsenic 12 ND-4 NA[c] ND
Barium 22 12-37 67 47
Cobalt 12 ND-9 NA ND Iron 22 1970-8260 4030 1160
Lead 22 91-13 109 ND
Manganese 22 137-2330 565 134 Potassium 22 5200-6220 5690 3610
a) Calculated using detected concentrations and one-half of EPAs
contract laboratory program (CLP) detection limits for the organics For the inorganic chemicals the aqueous CLP detection
limits were used
b) ND - Not Detected
c) NA - Not Applicable Chemical was detected infrequently and the
use of one-half of the detection limit in calculating a mean
results in a mean concentration that exceeds the maximum
Therefore a mean is not used
Table 1L
Inorganic Chemicals Detected in Riggs Brook Surface Water Samples at the F OConnor Site[a]
Maximum
Concentration Geometric Background Range Mean[b] Concentration
Chemical Frequency (ugL) (ugL) (UgL)
32 NDAntimony 13 ND[c]-35 5 NDLead 13 ND-16
a) Organic chemicals were also analyzed for but none were detected
b) Calculated using detected concentrations and one-half of EPA s
contract laboratory program (CLP) aqueous detection limits
c) ND - Not Detected
Source Endangerment Assessment dated Jan 29 1988 by Clement Associates Inc
Chemical
Acetone |CHCOCH3l Dimethyl ketone ketone propane
Toluene |CHCHJ _ e bull bull a O J Jtoluol phenyl aethane aethyl benzene
Cblorobcnzene (CHC1) aonochlorobenzene chlorobenzol
Ethyl benzene |C_HCH| phenyl ethane ethyl benzol
ACC TLV or STEL
ltPPB) (PfB)
750 1000
100 150 skin
75 (550agaraquo)
100 125
TABLE 2 CHEMICAL TOXICITY AND OTHER INFORMATION
Physical Skill Dcraal LD^ (mgkg) State Penetration Tonicity Potency ofraquoI(rat)
bullbullbull local it 9750liquid Bint-like odor
1297(nice)
liquid t local 5000
TC|Huosn =Ml00 ppa
colorless liquid 2910
colorless liquid local H 3500 with aromatic odor
syatcaatic bullbullbull TCu(Kiais) c 100 ppa
A hrs
Page 1 of 4
Remarks
Syaptoas Irritates eyea none throat narcotic in high concentrations
Target Organ respiratory aystea skin
First Aid Swallow water voait Skin soap wash
Incoapatibilities oxidizing materials acids Fire hazard when csposed to beat or flame
Tonicity 1 Persistence1 0
Syaptoas fatigue confusion euphoria dizzy headache dialated pupils lack of appetite nervousness insoania
Target organ CNS liver kidneys skin
First Aid Swallow NO VOHIT 8kln soap waah
Incoapatibilities strong ozldizers
Toxicity1 2 Persistence 1
Syaptoas irritates eyes nose causes drowsiness incoordination skin irritation
Target organ respiratory systea eyes skin cars liver
First Aid NO VOMIT
Incoapatibilities strong oxidizers reacts violently with AgClO^
Toxicity 2 Persistence 2
Syaptoas irritant to eyes and aucous aembrane headache narcotic
Target organ eyes upper respiratory systea
First Aid NO VOHIT
Incoapatibilities oxiding asterisks dangerous when exposed to heat or flame
TABU 2 Page 2 of 4 CHEMICAL TOXICITY AND OTHER INFORMATION
(continued)
ACC TLV or STEL Physical Skin Dcraal ID (agkg)
Cheaical (PPff) (PPB) State Penetration Toxicity Potency orsl(rat) Rcnarks
Benzene benzol
IC^H) 10 23 colorless liquid with aroaatic odor
local systeaatic
bullbull
bullbullbull Poisoning occurs aost coasaonly through lnhalationi also penetrates through akin
Syaptoass lrritatea eyes nose respiratory systea giddiness head nausea staggered gait fatigue depresesion sbdoaioal pain
Target organs bloody CNS skin bone narrow eyes respiratory systea
First Aids Swallows 8kins
NO VOMIT soap wash
Inconpatibilitiess strong oxidizers chlorine hronine with iron Dangerous when exposed to beat or flaae
Toxicitys 2 Persistences 1
Trichloroctbylcne ethylene trichloride tridene TCE
30 200 colorless liquid sweet odor
4820
1900(dog)
Syaptoass headache vertigo vision distortion treaors soanolcnce nausea voait irritates eyes cardiac errytbaiss paresthesias
Target organs respiratory systea heart liver kidneys CNS skin
First Aids Swallows Skins
Ipecac voait soap wash immediately
incoapatibless strong caustics chemically active actalss Da Li Ra Hg liquid O
Al 02 KN03 Ti
Persistences 3
Polychlorlasted biphenyi PCB Arocblor 1242 CjjHjClj(approx)
Arcblor 1234
C6H2C3C6M3C12
03
colorless to dark brown liquid with aild hydrocarbon odor
local systeaatic
local
Poisoning occurred Boat coaaonly through investigation or penetration of skin
Sypatoaas Irritates eyes (discbarge) skin scne-fora dernitatis Jaundice dark urine Target organs liver eyes skin First Aids Swallows Ipecac voait
Skins soap wash isnediately Incoapatibless strong oxidizers
TABU 2 CHEHICAL TOXICITY AND OTHER INFORMATION Page 3 of 4
ACC
Chulcil TLV or STEL (ppa) (POO)
Physical State
Skin Penetration
Derail Tonicity Potency
U)n (ngkg) of Reaarka
Dloctyl phtbalate di-acc-octyl pblbalata
5 aga1
light colored liquid
31000 Tonicity low to none via oral and derail routca produce 01 ayaptoas
12 Bichlorobenzene (C^H CI ) o-OCB
50 none liquid ++ local systemic
Symptoms irritates eyes and nose Target Organs liverkidneysskineyes First Aid Swallow salt water vomit
Skin soap wash Incompatabilities strong oxidizers
14 bichlorobenzene (CHbdquoC1 ) 7 2
P-OCB 75 110 solid ++ local
systemic ++ Symptoms irritates eyesheadachesnauseavomiting
Target Organs liverkidneyskineyesrespiratory system
first Aid Swallow water vomit skin soap wash
Incompatablities none
Lead (Pb) 015 mgm
none solid systemic t Symptoms Fatigue headaches abdominal pain Target Organs kidneys 61 central nervous system First Aid Swallow water vomit
Skin soap wash
Polycyclic Aromatic Hydrocarbons (PAHs)
015 mgm
none liquid systemic + Symptoms No obvious symptoms Carcinogenic to tissue following prolonged contact
First Aid Swallow water vomit Skin soap wash
Page 4 of4TABU 2 CHEMICAL TOXICITY AND OTHER INFORMATION
(continued)
NOTES
TLV - Threshold Unit Value ACC - Acceptable Ceiling Concentration STEL - Short Tera Exposure Limit
Suspected carcinogens teratogens or mutagens Firat Aid Unless specified flrat aid for oil of the liated cbeaicala are aa followa
Eyeai iaaedlatcly waab with copious quantity of cold water Skins Flush with water proaptly Breath Artificial respiration Swallowi Water voait
a Slight Hazard aa Hoderate Hasard aalaquo Extreme Hasard
Toxicity Ratiosa
Toxicity Rating
No toxicity (none) Material causes no hara in any condition or produces
tosic effects on buaana in very unusual circumstances or
in very large dosage
Slight toxicity (low)
Moderate toxicity
Severe toxicity
Persistence or each hazardous substance ia evaluated on its blodegradabllity aa follows
Assigned Value
Easily biodegradable coapounds 0
Straight chain hydrocprbons 1
Substituted and other ring compounds 2
Metals polycyclic coapounds and halogenated hydrocarbons 3
Adapted with modifications from EC Jordon Co RIFS Work Plan
TABLE 3 - PERSONNEL TRAINING AND MEDICAL MONITORING HEALTH AND SAFETY PLAN Field Sampling Plan OConnor Co Site Augusta Maine
personnel1
Robert E Stetkar
Joanne O Morin
Richard F Murdock
Benjamin Y Su
Joseph G Engeis
Steven R Lamb
Thomas S Bobowski
Boyd P Smith
Christopher L Covel
William J Haswell
Charles Blodgett
NOTES
ANNUALreg MEDICAL
MONITORING
yes
yes
yes
yes
yes
yes
yes
yes
yes
yes
yes
lt
y
OSHA 40shyHOURreg HAZMAT TRAINING
yes
yes
yes
yes
yes
yes
yes
yes
yes
yes
yes
ANNUALreg RESPIRATOR
FITTEST
yes
no
no
no
no
yes
yes
yes
es Yes
yltes
-y
CARDIOshyPULMONARY
FIRST AID RESUSCITATION TRAINING TRAINING
no no
yes yes
nov no
no no
no no
yes yes
yes yes
yes yes
yes yes
no no
yes yes
1 Only GEI personnel assigpedttfdo work on the OConnor site included on this list
2 Includes baseline and annual physicals lilood testing etc
3 In accordance with 29CFR191012tkncludes annual 8-hour refresher course
4 Includes annual respirator fit testing procedures
Project 90393 GEI Consultants Inc January 17 1991
TOW MAXARJM PCS CONCENTRATION (gtbullraquo) 8Y AREA
Central Maine Power Company Pre-Design Work Plans INTERPRETED CONTOURS Scale 1 inch = 180 feet Augusta Maine OConnor Site OF PGBs IN
Augusta Maine IN SURFICIAL SOILS From EC Jordon Co RIFS
Report dated June 1989 0 G E I C o n s u l t a n t s I n c Project 90393 January 1991 FigHS-2
Central Maine Power Company Pre-Design Work Plans DISTRIBUTION OF PAHs Scale 1 inch = 180 feet Augusta Maine OConnor Site IN SURFACE AND
Augusta Maine SUBSURFACE SOILS From EC Jordon Co RIFS
Report dated June 1989 0 G E I C o n s u l t a n t s I n c Project 90393 January 1991 FigHS-3
Central Maine Power Company Pre-Design Work Plans INTERPRETED DISTRIBUTION Scale 1 inch = 180 feet Augusta Maine OConnor Site OF LEAD IN SOILS
Augusta Maine From E C Jordon Co RIFS
Report dated June 1989 ltD G E I C o n s u l t a n t s I n c Project 90393 January 1991 FigHS-4
Central Maine Power Company Pre-Design Work Plans ANALYTICAL RESULTS FROM Scale 1 inch = 160 feet Augusta Maine OConnor Site SEDIMENT AND SURFACE
Augusta Maine WATER LOCATIONS From EC JOrdon Co RIFS lttgtReport dated June 1989 G E I C o n s u l t a n t s I n c Project 90393 January 1991 FigHS-5
Contamination 80 Feet
Control Line
Central Maine Power Company Pre-Design Work Plans SITE ACCESS AND Augusta Maine OConnor Site DECONTAMINATION
Revision 1 March 281991 Augusta Maine AREA
laquo G E I C o n s u l t a n t s I n c Project 90393 March 1991 KgHS-7
bull
Document Vol II SC SAP Appendix B Revision 0
Date January 17 1991 Page 1
APPENDIX B
FieldtogjL
FIELD LOGS
Project Field Log Book Equipment Calibration Logs
HNu Pl-101 MIE MINIRAM MARKSON CONDUCTIVITY METER MARKSON DIGITAL pHTEMPERATURE
Photograph Log Health and Safety QA Logs
Chain-of-Custody Forms Sample Assignment Forms Non-Conformance Report Forms Test Pit Log Forms Barn Sampling Forms Dexsil L-2000 PCB analyzer Calibration Boring Log Forms
lt
Document Vol II SC SAP Appendix B Revision 0
Date January 17 1991 Page 2
(OCONNORFL1)
(OCONNORFL2) (OCONNORFL3) (OCONNORFL4) (OCQNNORFL5) pound0CONNORFL6) (OCONNORFL7)
-(OCONNORFL9) (OCONNORFLIO) (OCONNORFL11) (OCONNORFL12) fOCONNORFL13) (OCONNORFL14) (OCONNORFL15)
Note Field Log OCONNORFLampisassigned to ground water sampling described in the Management of Migration Sampling andiAnalysis Plan
Document Vol II SC SAP Appendix B Revision 0
Date January 17 1991 Page 3
PROJECT LOGBOOKS (OCONNORFL1)
Serialized project logbooks are to be issued by the site contractor to all personnel at the site who have been designated to perform specific field tasks Individuals must sign their logbooks upon receipt and use them to record all pertinent information until the project is completed y
Logbook entries should be dated legible and contain accurate and inclusive documentation of an individuals project activities Because the logbook forms the basisfor the later written reports it must contain only facts and observations Entries made by individuals other than the person to whom the logbook was assigned are dated andsigned by the individual making the entry bull
CALIBRATION LOG Document No OCONNOR FT1 HNu Photoionization Device Model Pl-101 Page 1 of 1
Instrument Serial No
Lamp Date Span Setting Time Calibration Temperature User
Standard Introduced Meter Response (parts per million (ppm))
Comments (See Summary of Calibration Procedures attached7
X x
User Signature Date
Task Manager Signatures Date
CALIBRATION LOG Document No OCONNORFI3 MIE MINIRAM Hand-held Aerosol Monitor Page 1 of 1
Instrument
Serial No
Date
Time
User
Standard used (zero-bag)
Meter Display
Comments
User Signature lt Date X
Task Manager Signature l Date
CALIBRATION LOG Document No OCONNORFL4 Markson Conductivity Meter Model 103 Page 1 of 1
Instrument Serial No
Date Time User
Standard Used_ Meter Display^
Comments
s
v
lt
y xy ^y
User Signature Date z V
Task Manager Signature ) i Date
CALIBRATION LOG Document No OCONNORFU5 Markson Digital pHtemperature Meter Model 95 Page 1 of 1
Instrument Serial No
Date Time User
Temperature check vs mercury thermometer
Probe reading Thermometer reading
Upon completion of calibration procedure does pH probe checkout vs pH 40 buffer Reading bull lt x pH 70 buffer Reading bull
Comments v
X x
User Signature X^ Date
Task Manager Signature Date
Document No QCONNORFT f
Page
PHOTOGRAPH LOG
Project Name
Project No
Camera and Film Specifications
FILM
ROLL FRAME
DATE nTIME PHOTOGRAPHER PHOTO NUMBER
DESCRIPTION
lt3
ni
I X
V
V
gt
Document No QOONNORm7
HEALTH amp SAFETY QUALITY ASSURANCE CHECKLIST
Page 1 of 2 Project No Site Date Completed by
A On-site Operations During Hazardous Waste Site Investigations
yes no Team understands task procedures safety plan individual roles and site history contaminants
yes no Team knowledgeable to hospital route nearest phone location and who is responsible for health and safety on site
yes no Establishment of command post and decon station with Health amp Safety Plan readily available
yes no Establish communication or line-of-site maintained
yes no Field operations conformed environmental monitoring respiratory protection or emergency response
yes no Protective clothing and respiratory protection maintained
yes no Decontamination procedures performed on the following sample containers sampling equipment and personnel
yes no Equipment protected clean calibrated and being used properly by site personnel
yes no First Aid Equipment readily available at site with checklist and eye wash
yes no Site personnel trained in CPR and First Aid
yes no Site Records maintained such as field logbooks respirator usage log incident reports in place and up-to-date and any deviations or modifications to Safety Plan
GEI Consultants Inc
uocutrenc uujmutvrLz
HEALTH amp SAFETY QUALITY ASSURANCE CHECKLIST
Page 2 of 2 Project No Site Date Completed by
B Health amp Safety Follow-up Reports
o Adherence to procedures o Accidents o Unsafe practices or conditions o Results of environmental monitoring o Corrective action
GEI Consultants Inc
Document No Q00NN0RFL9 CHAIN OF CUSTODY RECORD
DOCUMENT NUMBFR rn tLORD
RELINQUISHED DYISiONruRE OATETJMD RECEIVED DY (SIGNATURE) RELINQUISHED DY (SIOHATURER DATETI^IE RECEIVED BY (SIGNATURE)
IIElINOUISIIEO BY(SIGNATURE) DATETIMf DATETIME gt REMARKS lcNAruDn^nLADOnATonvorI
P a g e o f
Document No OCONNORFLIO
Page of G E I C o n s u l t a n t s I n c
Project No
Project Name _
Laboratory Contact
Sampler ( s ) Date Assigned Date Sampled
GEI Sample No
Sample Medium
Quantity
Sample Container
Type
Analyses Requested Remarks
Special Instructions Remarks
Document No 0CQNNDRFL11
NONCONFORMANCE REPORT
Project Project No
Auditor Audit Date Finding No
FINDING
Where found Check Lit Item
ControllingDocument Section
Task Description
Noncenformanee
Discussed with
Recommended Corrective Action
Is system correction needed to prevent recurrence Yes No If yes state recommended action
Schedule Completion Date By
CORRECTION ACTION
Correction Action by Date
QA Approval of Correction Action by Date
Date Completed Submitted by
Correction Action Verified by Date
I T E S T P I T L O G QCONNORFL12
PROJECT
LOCATIONI CLIENT
CONTRACTOR EQUIPMENTI OBSERVED BY
I DEPTH BELOW
GROUND SURFACE
I (FT)
I
I
I
1
1
1
1
I
1 REMARKS
PROJECT NO
LOCATION
GROUND EL
DATE DATUM
SOIL DESCRIPTION
PIT DIMENSIONS (FT) LENGTH WIDTH DEPTH
ltJgt G E I 1
I Docuaent No 0C0NNCRFL13
bull GEI CONSULTANTS IMC 53 Regional Drive Concord New Hampshire 03301-8500 (603)224-7979
BARN SAMPLING FORM Serial I
PROJECT INFORMATION
Project Name Source Control Pre-Oesion Studies
I Site Name(if different) OConnor Co site
Project Number
I Analytical Lab(s) ERCO EPA
GEI GC screen Other(Specify)
I METHOD OF SAMPLING
WIPE SAMPLING OF HON-POROUS SURFACES
I U000EH UALL SAMPLING UITH DRILL BIT
OUSTSOIL SAMPLING OH FLOOR SLAB
( CONCRETE SAMPLIHG ITH MORTAR BIT
(OTHER-Explain)
I
DESCRIPTION OF SAMPLE
Brief Description of Type of Material or Item Sampled
Visible Staining NO Visible Staining
Approximate Area of Stain(if any) X
LOCATION OF SAMPLE
Ground Floor Second Floor Loft
(All Measurements in Feet to 010 Foot)
Distance Along Z Axis from Reference Origin
Distance Along M Axis from Reference Origin
Height of Sample Above Floor Slab
SKETCH IN APPROXIMATE HORIZONTAL LOCATION OF THE SAMPLE COLLECTED ON FIGURE BELOU
I UALL X
I
I
UALL U UALL Y
I
I Reference Origin UALL Z
I Approximate Scale 1 inchbull 15 feet
I Sample I0(s) SIGNATURE OF SAMPLER CERTIFIES ABOVE SAMPLING RECORD
Date Time
I Sampler(s) COC Docunent Signature Date
I
CALIBRATION LOG Document No OCONNOR FL14 Dexsil L-2000 PCB Analyzer Page 1 of 1
Instrument
Serial No
Date
Time
User
Ambient Temperature deg C
Standard used (50 ppm chloride)
Reading beforeadjustingCALIBRATE knob
Reading after adjusting CALIBRATE knob
Comments
User Signature Date
Task Manager Signature Date
Document No OCONNORFL15 I BORING LOCATION DATE START FINISH
GROUND ELEVATION (NGVO ) DRILLED BY
GROUNDWATER El DATE LOGGED BY TOTAL DEPTH (FT) PG OF
I EL DEPTH S A M P L E
Its TYPE BLOWS PEN REC R E M A R K S QO SOIL ANO ROCK DESCRIPTIONSlt_land PER aFT FT NO 6 IN IN IN lt9
I
I
I
I
I
1
1
I
1
I
I
I
I
I
I BLOWS PER (-140IBHAMMER FALUNS 30T0 DRIVE NOTES A 20 IN 00 SPLIT SPOON SAMPLER
PEN-PENETRATION LENGTH OF SAMPLER OR CORE BARREL REC-RECOVERY LENOTH OF SAMPLE ROO-LENOTM OF SOUND CORES gt4INLENSTH COREO S-SPLIT SPOON SAMPLE PROJECT
I U-UNOtSTURBCO SAMPLES UF-FIXEO PISTON _ UO-OSTER8ERO bully OROUNOWATER 0 G E I
I
I
I
I
I
I
I
I
I
1 1 1 1 1 1 1 I 1 1 I
Document VoL H SC SAP Appendix C Revision 0
Date January 17 1991 Page 1
APPENDIX C
EQUIPMENT CALIBRATION PROCEDURES
Document Vol II SC SAP Appendix C Revision 0
Date January 171991 Page 2
HNu PI-101
The HNu PI-101 is factory calibrated twice a year andor if the instrument is malfunctioning Prior to field use and at the end of each day the user of the instrument will check that the instrument is still holding calibration using the following procedures
1 Prior to the calibration check check the instrument with an Organic point source (ie magic marker) prior to use to verify that it is functioning
2 Connect the rubber sampling hose from the span gas cylinder regulator to the sampling
probe of the HNu gt
3 Fully open the regulator valve gt vy
4 Note the instrument meter response after 5 to 10 Seconds y
5 If the response deviates + 15 from the coneentration of the calibration gas (this figure appears on the cylinder label) the instruihehtTeq^es factory maintenance and will not be utilized in the field until factory calibratiori^Tah alternate meter will be used after calibration checking v (
V 6 Document the calibration information Oik the appropriate equipment calibration log
(OCONNORFL2) ~y
Document VoL IISC SAP Appendix C Revision 0
Date January 17 1991 Page 3
MIE MINIRAM Model PDM-3
The MINIRAM will be factory calibrated once a year andor if the instrument is malfunctioning Prior to field use and at the end of each day the user will zero the instrument using the following procedure
1 With the MINIRAM off insert MINIRAM into Zerobag andseal the Zerobag
2 Inflate Zerobag with filtered air containing no particulates using-attached hand pumpx- V
S
3 Press ZERO button on MINIRAM and wait 30 seconds MINIRAMshould read OFF
4 Pull MINIRAM out of Zerobag
5 Press MEAS button and wait 60 seconds for MINIRAM to go through self-tests
6 The MINIRAM is now functioning and wilJLtake-readings every 10 seconds
7 Document the calibration information onthe appropriate equipment calibration log (OCONNORFL3) V
lt
v
Document VoL II SC SAP Appendix C Revision 0
Date January 171991 Page 4
MARKSON DIGITAL MODEL 103 CONDUCTIVITY METER
The Markson Conductivity meter will be calibrated prior to and following each days field use using the following procedures
1 Rinse the conductivity probe with distilled water gt
2 Pour enough Cole-Parmer conductivity calibration solution (1413 xS 25degC) in a clean plastic Ziploc bag to be able to completely immerse the conductivity probe
3 Immerse the conductivity probe in the standard solution and shakdTree any bubbles that may cling to the cell
4 Allow about 1 minute for the cell to reach equilibrium temperature x X
5 Set the cell adjust control at the bottom of the meter to display the value of 141
6 Carefully rinse cell with water after calibration and after each use V~
7 Document the calibration process onjlie equipment calibration log (OCONNORFL4)
Document VoL H SC SAP Appendix C Revision 0
Date January 17 1991 Page 5
MARKSON MODEL 95
Combined Digital pHtemperature Meter
The Markson 95 combined digital pHtemperature meter will be calibrated prior to and following each days field use using the following procedures
1 Insert electrode into digital meter The reference pin should also be properly connected Temperature probe should be plugged all the way into the ATC jack
2 Remove protective cap and push rubber sleeve such that the potassium chloride filling hole is exposed gt
3 Rinse both pH and temperature probe in distilled water 4 Immerse both pH and temperature probe into buffer 700 solution 5 Set FUNCTION switch to TEMPERATURE to read temperature 6 Set FUNCTION switch to ATC and adjust the readout to the pH value of buffer 700 corresponding
to the temperature measured in E with the CALIBRATE control See Chart 1 7 Rinse electrode and temperature probe withdistilled water 8 Immerse both pH and temperature probe into buffer^401 9 Repeat E V ~ 10 Set the FUNCTION switch to ATC and adjust the readout to the pH value of the buffer 401
corresponding to the temperature measured in Iwith the SLOPE control See Chart 1 11 Rinse the electrodes and temperatureprobe-with distilled water Model 95 is calibrated and ready
for use 12 Document the calibration process on the equipment calibration log (OCONNORFL5)
^ CHART
Temp (C) Buffer Solution 70 X -X
Buffer Solution 40
5 y 700 401 10 708 399 15 706 399 20 703 399 25 701 399 30 700 400 35 699 401 40 698 402 50 698 403 60 697 405
Document VoL II SC SAP Appendix C Revision 0
Date January 171991 Page 6
Dexsil Model L-2009 PCB Analyzer
The Dexsil PCB Analyzer will be calibrated prior to each days field use using the following procedures
Initial Preparation
1 The electrode must be filled with Orion filling solution before it is operational Fill the electrode up to the hole in the side of the epoxy body by-placing the nozzle of the filling solution in the hole and squeezing the bottle 7
2 Drain the electrode while holding it upright over thewaste beaker Grasp the epoxy body firmly in one hand and push down on the white cap which is connected to the cord The solution will then drain out of the bottom of the electrode
Vgt 3 Refill the electrode and check to makesure that the liquid is making contact between the black
cone and the plastic shell at the bottom of theelectrode If it is not making contact at all points drain the electrode again and refill
4 Plug the electrode into the back of the L-200Qj)laeeJt in a vial or rinse solution and turn the instrument on Switch the analysis knobtdfnVand wait a few minutes until the reading stabilizes
Calibration O Imdash^
1 Fill a vial about half way with 50 parts per million calibration solution
2 Turn the analysis selectQrJcnob to CAL
3 Remove the electrode from the rinse solution dry it carefully with a tissue and place it in the calibration solution SWiri the electrode gently for a few seconds and then stop Push the start button on the instrument^
4 When the READ light comes on adjust the CAL knob so that the instrument reads 50
5 Remove the electrode from the calibration solution wipe it dry and place in the rinse solution
6 If this is the first calibration since the instrument has been turned on or since the electrode has been filled repeat steps 34 and 5
7 Document the calibration information on the appropriate equipment Calibration Log (OCONNORFL14)
Document Vol II SC SAP Appendix D Revision 0
Date January 17 1991 Page 1
APPENDIX D X
list of Acronyms
Document Vol II SC SAP Appendix D Revision 0
Date January 17 1991 Page 2
ACRONYMS
ASTM American Society for Testing and Materials CLP Contract Laboratory Program CMP Central Maine Power Company DEP Department of Environmental Protection (Maine) DQO Data Quality Objectives EPA Environmental Protection Agency [US) FL Field Log FSP Field Sampling Plan ltys GEI GEI Consultants Inc gt HSP Health and Safety Plan X
MIE Monitoring Instrumentsforthe Environment MOM Management of Migration NA Not Applicable X lt OSHA Occupational Safety anaHeakh Administration OSWER Officer of SolithWaste and Emergency Response PCB PolychlorinatecFBiphenyk ppb Parts per billion v7 ppm Parts per million QA QuaUtyAssuranck ) QAO QudU$~^sitraquoance Officer QAPP QualityAssurance Project Plan QC Qukkty Gontrof PIP -Thotoionization Detector RDRA -mdashRemedial DesignRemedial Action RI Remedial Investigation ROD x^XRecbrd of Decision RPD X^Relative Percent Difference RPM Remedial Project Manager RSD Relative Standard Deviation SAP Sampling and Analysis Plan SC Source Control SOW Statement of Work TPH Total Petroleum Hydrocarbons VOC Volatile Organic Chemical or Compound