Embed Size (px)
Citation preview

Community Participation Major decisions concerning your drinking water are
made by the Village of Oakfield Board of Trustees,
which meets at the Village Office on the second and
fourth Mondays of each month at 6:30 p.m. You are
invited to attend these Village Board Meetings to be-
come more informed or voice your opinion in the deci-
sion making process affecting your water.
Annual WATER QUALITY
REPORT Reporting Year 2020
Village of Oakfield
And Town of Oakfield 37 Main Street
Oakfield, NY 14125
Source Water Assessment A source water assessment was prepared through the New York Department of Health in 2002. It evaluated possible and actual threats to Batavia’s drinking water sources. The State source water assessment includes a susceptibility rating based on the risk posed by each potential source of contamination and how easily contaminants can move through the subsurface into the wells. The susceptibility rating is an estimate of the potential for contamination of the source water; it does not mean that the water delivered to consumers is or will become contaminated. See the section “Are There Contaminants in Our Drinking Water?” for a list of the contaminants that have been detected. The source water assessments provide resource managers with additional infor-mation for protecting source waters into the future. Our water is derived from two drilled wells and the Tonawanda Creek. The source water assessment has rated these wells as having a medium-
high to very high susceptibility to microbials, nitrates, petroleum products, industrial solvents and other industrial contaminants. These ratings are due primarily to the close proximity of permitted discharge facilities (industrial/commercial facilities that discharge wastewater into environment and
are regulated by the state and/or federal government) to the wells and the associated industrial activity in the assessment area. In addition, the wells draw from an unconfined aquifer of unknown hydraulic conductivity. The source water assessment for the To-nawanda Creek has found an elevated susceptibility to contamina-tion for this source of drinking water. The amount of agricultural lands in the assessment area results in elevated potential for microbials, phosphorus, DBP pre-cursors and pesticides contamination. In addition, the moderate density of CAFOs (Concentrated Animal Feeding Operations) in the assessment may add to the potential for contamination. While there are some facilities present, permitted discharges do not likely represent an important threat to source water quality, based on their density in the assessment area. However, it appears that the total amount of wastewater discharged to surface water in this assessment area is high enough to further raise the potential for contamination (particularly for protozoa). There is also notewor-thy contamination susceptibility associated with other discrete contaminate resources. These facility types include mines. Final-ly, it should be noted that relatively high flow velocities make river drinking water supplies highly sensitive to existing and new sources of microbial contamination. While the source water as-sessment rates our Wells and the Tonawanda Creek as being sus-ceptible to microbials, please note that Batavia’s water is filtered and disinfected to ensure that the finished water delivered to your home meets New York State’s drinking water standards for micro-bial contamination. A copy of the assessment, including a map of the assessment area, can be obtained by contacting the Genesee County Health Department (585) 344-2580, or Ray Tourt at Bata-via’s City Hall (585) 345-6315.
Water Conservation Tips
You can play a role in conserving water and save your-
self money in the process by becoming conscious of the amount of water your household is using and by looking for ways to use less whenever you can. It is not hard to conserve water. Here are a few tips:
• Automatic dishwashers use 15 gallons for every cycle, regardless of how many dishes are loaded. So get a run for your money and load it to capacity.
• Turn off the tap when brushing your teeth.
• Check every faucet in your home for leaks. Just a slow drip can waste 15 to 20 gallons a day. Fix it and you can save almost 6,000 gallons per year
• Check your toilets for leaks by putting a few drops of food coloring in the tank. Watch for a few minutes to see if the color shows up in the bowl. It is not uncommon to lose up to 100 gallons a day from an invisible toilet leak. Fix it and you can save more than 30,000 gallons a year.
• Use your water meter to detect hidden leaks. Simp-ly turn off all taps and water-using appliances. Then check the meter after 15 minutes. If it moved, you have a leak.
PWS ID#NY1800551
Town ID#NY1830042 Village of Oakfield 37 Main St., Oakfield, NY 14125 585-948-5862

During the past year, we have taken hundreds of water samples in order to determine the presence of any radioactive, biological, inorganic, volatile organic, or synthetic or-
ganic contaminants. The tables below show only those contaminants that were detected in the water. The State requires us to monitor for certain substances less often than once per year because the concentrations of these substances do not change frequently. In these cases, the most recent sample data are included, along with the year in which the sample was taken.
Definitions 90th percentile: The levels reported for lead and copper represent the 90th per-centile of the total number of sites tested. A percentile is a value on a scale of 100 that indicates the percent of a distribution that is equal to or below it. The 90th percentile is equal to or greater than 90% of the lead and copper values detected at your water system. AL (Action Level): The concentration of a contaminant which, if exceeded, triggers treatment or other requirements that a water system must follow. MCL (Maximum Contaminant Level): The highest level of a contaminant that is allowed in drinking water. MCLs are set as close to the MCLG as possible. MCLG (Maximum Contaminant Level Goal): The level of a Contaminant in drink-ing water below which there is no known or expected risk to health. MCLGs allow for a margin of safety. MRDL (Maximum Residual Disinfectant Level) The highest level of a disinfectant allowed in drinking water. There is con-vincing evidence that addition of a disin-fectant is necessary for control of microbial contaminants. MRDLG (Maximum Residual Disinfect-ant Level Goal) The level of a drinking water disinfectant below which there is no known or expected risk to health. MRDLDs do not reflect the benefits of the use of disinfectants to control microbial contami-nation. NA: Not applicable. ND: (Not detected): Indicates that the substance was not found by laboratory analysis. NTU (Nephelometric Turbidity Units): Measurement of the clarity, or turbidity, of water. Turbidity in excess of 5 NTU is just noticeable to the average person. ppb (part per billion): One part substance per billion parts water (or micrograms per liter). ppm (parts per million): One part sub-stance per million parts water (or milli-gram per liter). TT (Treatment Technique): A required process intended to reduce the level of a contaminant in drinking water.
REGULATED SUBSTANCES SUBSTANCE DATE MCL MCLG AMOUNT RANGE VIOLATION TYPICAL SOURCE (UNIT OF MEASURE) SAMPLED DETECTED LOW/HIGH Detected
City of Batavia Chloride (ppm) 8/4/20 250 NA 146 NA No Naturally occurring or indicative of road salt contamination. Chlorides are in nature as salts of sodium, potassium and calcium; potassium chloride is used in the production of farming fertilizers. Barium (ppm) 8/4/20 2 2 0.015 NA No Discharge of drilling wastes; Discharge from metal refineries; Erosion of
natural deposits.
1.4 Dioxane (ppb) 8/4/20 1 NA .021 .021 No Released from industrial & commercial sources and is associated with hazardous waste sites Nitrogen Ammonia (ppm) 8/4/20 NA NA .11 NA No Run off into streams from liquid organic waste products
Chlorine Residual (ppm) 20, hourly [4] 1.3 1.04 0.70-1.61 No By-product of drinking water chlorination.
Fluoride (ppm) 8/4/20 2.2 NA 1.1 NA No Erosion of natural deposits; Water additive to promote strong teeth; Discharge (Daily) 2.2 NA .63 0.52-1.32 from fertilizer and aluminum factories.
Nitrate as N (ppm) 8/4/20 10 10 .81 NA No Runoff from fertilizer use; leaching from septic tanks, sewage; erosion of natural deposits.
Sulfate (ppm) 8/4/20 250 NA 35 NA No Naturally occurring. Total Organic Carbon (TOC) 2020 TT NA 1.20 ND-1.9 No Organic contaminants (natural organic substances, insecticides, Herbicides and (Monthly)
agricultural chemicals) enter waterways in rainfall runoff; Domestic and industrial wastewaters also contribute organic contaminants in various amounts.
Sodium (ppm) 8/4/20 TT NA 60.2 NA No Naturally occurring; Road salt, Water softeners; Animal waste.
Alkalinity as CaCO3 (ppm) 8/4/20 NA NA 61.6 NA No Natural minerals; lime softening process
Calcium (ppm) 8/4/20 NA NA 37.7 NA No Mineral deposits
Magnesium (ppm) 8/4/20 NA 15 18.8 NA No Dissolution of nickel in well water. Haloacetic Acids (ppb) 2020/qtrly 60 60 13.3 1.4-22.3 No By-product of drinking water disinfection
TTHMs6 (ppb) 2020/qrtly 80 80 57.3 15.4-44.7 No By-product of drinking water disinfection Turbidity1 (NTU) 20 (daily) TT<1.0 NA 0.01 0-.14 No Soil runoff.
Turbidity (lowest monthly 20 (daily) TT<0.3 NA 100% NA No Soil runoff-July 2013 found the highest turbidity levels, but they were still well Percent of samples meeting NTU5 within tolerance levels of below 5.0 NTU. Limits) (NTU)
Turbidity [Distrib. Sym] (NTU) 2019/wkly <5 NA 0.53 0.01-1.83 No Cloudiness in water main disruptions and breaks. (See section on water main flushing) Copper (ppm) 7/17/19 1.3 1.3 0.0327 ND-0.118 No Corrosion of household plumbing systems; erosion of natural deposits; leaching from wood preservatives
Lead (ppm) 7/17/19 15 0 0.0032 ND-0.0141 No Corrosion of household plumbing systems; erosion of natural deposits
Village of Oakfield Copper3 (ppm) 8/1/18 1.3 1.3 .18 .069-.31 No Corrosion of household plumbing systems; erosion of natural deposits; leaching from wood preservatives
Lead4 (ppm) 8/1/18 0.015 0 .002 ND-0.013 No Corrosion of household plumbing systems; erosion of natural deposits TTHMs6 (ppb) 2020/qrtly 80 80 67.75 32-109 No By-product of drinking water disinfection Haloacetic Acids 6(ppb) 2020/qrtly 60 60 18.65 15-32 No By-product of drinking water disinfection
Town of Oakfield Copper3 (ppm) 8/1/18 1.3 1.3 .14 .0071-.16 No Corrosion of household plumbing systems; erosion of natural deposits; leaching from wood preservatives Lead4 (ppm) 8/1/18 0.015 0 .0018 ND-0.0028 No Corrosion of household plumbing systems; erosion of natural deposits TTHMs6 (ppb) 2020/qrtly 80 80 78.5 41-125 No By-product of drinking water disinfection Haloacetic Acids 6(ppb) 2020/qrtly 60 60 21.25 14-26 No By-product of drinking water disinfection

HOW IS OUR WATER TREATED AND PURIFIED?
Batavia’s well water is very clear and requires little treatment other than softening. Soft water cleans better, and less soap is needed to wash effectively. Tonawanda Creek water enters the water plant through me-chanical screens. The screens prevent creek debris from get-ting into the plant. Creek water is then mixed with well water in the flash mixers where water treatment chemicals are add-ed. Ferric sulfate is added as a coagulant, neutralizing the charges on particles suspended in the water, and thus allowing them to clump together and drop out. Calcium oxide, also called lime, is added to the raw water to soften it. Lime will cause compounds of calcium, magnesium, and other minerals to begin to precipitate or drop out of the water. The water is then sent out to the softening tanks where pad-dles churn the chemically treated water forming a sludge layer of muddy water. The sludge is made up of added chemicals and chemicals from the water, suspended dirt, clay, silt and microorganisms. Most of these impurities will now drop out of the water. The next step is the settling basin where the water’s velocity is reduced so that suspended matter can drop to the bottom. Carbon dioxide is added at this point to adjust the pH. Chlo-rine is added as a disinfectant, which will prevent growth of organisms in your drinking water. From the settling basin, the water is directed to 12 rapid sand filters. The filters allow the water through while holding back virtually any remaining particles. The water is then very clear, usually having a finished turbidity of around 0.02 NTU. Finally, we add a small amount of polyphosphate corrosion inhibitor to prevent minerals dissolved in the water from pre-cipitating out onto your pipes. Pumps push the finished water out into the distribution system, into two elevated tanks and to your homes and businesses, at a pressure of around 70 pounds per square inch. When it reaches the Village of Oakfield’s new 500,000 gallon tank, the booster chlorination pump raises the residual to 1.1 ppm.
Non-Detected Substances
The following is a complete list of all the substances that we tested for in 2020 but did not detect in our water supply:
Inorganics: Antimony, Arsenic, Beryl-ium, Cadmium, Chromium, Lead, (at sys-tem entry point), Mercury, Selenium, Sil-ver, Thallium, Iron, Manganese, Zinc, Cyanide, Sulfite, Nitrite, Nickel, Copper, Nitrogen Ammonia.
SOCs: Alachlor, Aldrin, Chlordane, Diel-drin, Endrin, Heptachlor, Heptachlor epoxide, Hexachloro-benzene, Hexachlorocyclopentadiene, Lindane, Methox-ychlor, Total PCBs (Arochlor), Toxaphene, 2,4,5-TP(Silvex), 2,4-D, Dalapon, Dicamba, Dinoseb, Pentachloro-phenol, Pichloram, Atrazine, Benzo(a)pyrene(PAH), bis(2-Ethylhexyl)adipate, Bis(2-ethylhexyl)phthalate, Butachlor, Metolachlor, Metribuzin, Propachlor, Simazine, 3-Hydroxycarbofuran, Aldicarb, Adlicarb sulfone, Aldicarb Sulfoxide, Carbaryl, Carbofuran, Methonyl, Oxamyl, PFOS-PFOA. VOCs: Benzene, Bromobenzene, Bromochloromethane, Carbon tetrachloride, Chlorobenzene, Chloroethane, cis-1,2-Dichloroethene, cis-1,3-Dichloropropene, 1,1,1,2-Tetrachloroethane, 1,1,1-Trichloroethane, 1,1,2,2-Tetrachloroethane, 1,1,2-Trichloroethane, 1,1-Dichloroethane, 1,1-Dichloroethene, 1,1-Dichloropropene, 1,2,3-Trichlorobenzene, 1,2,3-Trichloropropane, 1,2,4-Trichlorobenzene, 1,2,4-Trimethylbenzene, 1,2-Dichlorobenzene, 1,2-Dichloroethane, 1,2-Dichloropropane, 1,3,5-Trimethylbenzene, 1,3-Dichlorobenzene, 1,3-Dichloropropane, 1,4-Dichlorobenzene, 2,2-Dichloropropane, 2/4-Chlorotoluene, 4-Isopropyltoluene, Dibromomethane, Dichlorodifluoro-methane, Ethylbenzene, Hexachlorobutadiene, Iso-propylbenzene, m,p,-Xylene, Methyl tert-butyl ether(MTBE), Methylene chloride, n-Butylbenzene, n-Propylbenzene, o-Xylene, sec-Butylbenzene, Styrene, tert-Butylbenzene, Tetrachloroethene, Toluene, trans-1,2-Dichloroethene, trans-1,3-Dichloropropene, Trichloroe-thene, Trichlorofluoromethane, Vinyl chloride.
Our system is one of the many drinking water systems in New
York State that provides drinking water with a controlled, low level
of fluoride for consumer dental health protection. Fluoride is add-
ed to your water by the City of Batavia before it is delivered to us.
According to the United States Centers for Disease Control, fluo-
ride is very effective in preventing cavities when present in drink-
ing water at an optimal range from 0.7 to 1.0 ppm. Fluoride is
added by the City of Batavia to ensure that the fluoride supple-
ment in your water provides optimal dental protection, the State
Department of Health requires that we monitor fluoride levels on a
daily basis. During the reporting year, monitoring showed fluoride
levels in your water were in the optimal range 82% of the time.
None of the monitoring results showed fluoride at levels that ap-
proach the 2.2 ppm MCL for fluoride.
Fluoridation of Our Water
System Improvements
The Village is utilizing an antenna based reading signal to read
residential meters on an daily basis, allowing quicker response
time for leaks and potential issues. A more aggressive hydrant
flushing program has been implemented to keep water quality
high and ensure all hydrants are working properly. The Village
tests for trihalomethane levels quarterly to show the success of
the hydrant flushing program. The Village will be replacing all
SR-2 residential meters to new low lead compliant ones and to
help reduce water loss and track usage more accurately.
The sample site for the Village is 37 Main St. and 71 S. Main
St.
The sample site for the Town is 3556 Lockport Rd.
1Turbidity is a measure of the cloudiness of the water. It is tested because it is a good indicator of the effectiveness of the filtration system. Our highest single turbidity measurement for the year occurred as indicated in the table.
State regulations require that turbidity must always be below 1 NTU. The regulations require that 95% of the turbidity samples collected have measurements below 0.3 NTU. (Note that TT is dependent upon filtration method: conven-
tional, 0.3 NTU; slow sand, 1.0 NTU; or diatomaceous earth filtration 1.0 NTU.) Although the month as indicated In the Date column was the month when we had the fewest measurements meeting the treatment technique for turbidi-
ty, the levels recorded were within the acceptable range allowed and did not constitute a treatment technique violation. 2The highest measurement of the monthly average distribution results for the year occurred as indicated in the
table. 3The level presented represents the 90th percentile of the 10 sites tested. A percentile is a value on a scale of 100 that indicates the percent of a distribution that is equal or below it. The 90th percentile is equal to or greater
than 90% of the copper values detected in Village and Town of Oakfield . Ten samples were collected in 2018. The Action Level of 1.3 ppm for copper was not exceeded at any of the sites tested. 4The level listed represents the 90th
percentile of the 10 samples collected in 2018. The Action Level for lead was 0 of the 10 sites tested. 5Water containing more than 20 ppm of sodium should not be used for drinking by people on severely restricted sodium drew. Water
containing more than 270 ppm of sodium should not be used for drinking by people on moderately restricted sodium diets. 6This level represents the highest locational running annual average calculated from data collected.

Meeting the Challenge We are once again proud to present our annual water quality report covering all testing performed between January 1 and December 31, 2020. Over the years, we have dedicated ourselves to producing drinking water that meets all state and federal standards. We continually strive to adopt new methods for delivering the best quality drinking water to you. As new challenges to drinking water safety emerge, we remain vigilant in meeting the goals of source water protection, water conservation and community education while continually to serve the needs of all our water users. Please share with us your thoughts or concerns about the information in this report. After all, well informed custom-ers are our best allies. For more information about this re-port, or any questions relating to your drinking water, please Tom Mikolajczyk, DPW Supervisor at (585) 331-3758 for both Village of Oakfield and Town of Oakfield.
FACTS & FIGURES
The Village of Oakfield purchased 147,902,000 gallons of water from the City of Batavia through Genesee County in 2020. The Village serves a population of 1813 and supplies water to about 1066 connections with 651 in the Village and 415 in the Town. A total of 49,318,700 (33%) was not metered and unaccounted for. This was water from hydrants or water lost in leaks or breaks. The charge for water billed in 2020 was $6.40 per thousand gallons.
The sources of drinking water (both tap water and bottled water) include rivers, lakes, streams, ponds, reservoirs, springs, and wells. As water travels over the surface of the land or through the ground, it dissolves naturally occurring minerals and can pick up substances resulting from the presence of ani-mals or from human activities. Contam- inants that may be present in source water include: Microbial Contaminants; Inorganic Contaminants; Pesticides and Herbicides; Organic Chemical Con- taminants; and Radioactive Contami-nants. Drinking water, including bottled water, may reasonably be expected to contain at least small amounts of some contami- nants. The presence of contaminants does not necessarily indicate that water poses a health risk. In order to ensure that tap water is safe to drink the State and the U.S. EPA prescribe regulations that limit the amount of certain contaminants in water provided by public water systems. The State Health Department and the U.S. FDA’s regulations establish limits for contaminants in bottled water that must provide the same protection for public health. More information about contaminants and potential health effects can be obtained by calling the EPA’s Safe Drinking Water Hotline at (800) 426-4791 or the Genesee County Health Department at (585) 344-2580 ext. 5555.
Substances That Could Be in Water
The Village of Oakfield purchases water wholesale from the Genesee County Water Authority,
which comes from the City of Batavia. The City of Batavia receives its water from two sources.
Two wells located at Cedar Street draw water from the Tonawanda Valley Watershed, one of the
largest underground aquifers in New York State. The well water is exceptionally clear with an
average turbidity of less than 0.05 NTU. However, well water in this area is hard (containing
dissolved minerals) and requires softening to bring it to a condition most residents find accepta-
ble. The Tonawanda Creek is the other source of water. While the creek has provided an ade-
quate quantity and quality of water for more than 90 years, it is a surface water source and is
therefore susceptible to rapid changes in quality. Runoff can quickly increase levels of turbidity,
making the creek water less cost-effective to process. Creek water is used to supplement our
wells and as a back up water supply. In an emergency, the city can even purchase water from
the Monroe County Water Authority through connecting water lines.
Where Does My Water Come From?
Distribution mains (pipes) convey water homes, businesses,
and hydrants in your neighborhood. The water entering dis-tribution mains is of very high quality; however, water quality can deteriorate in areas of the distribution mains by sending a rapid flow of water through the mains.
Flushing maintains water quality in several ways. For example, flushing removes sediments like iron and manganese. Alt-hough iron and manganese do not pose health concerns, they can affect the taste, clarity and color of the water. Additional-ly, sediments can shield microorganisms from the disinfecting power of chlorine, contributing to the growth of microorgan-isms within distribution mains. Flushing helps remove stale water and ensures the presence of fresh water with sufficient dissolved oxygen, disinfectant levels and an acceptable taste and smell.
During flushing operations in your neighborhood, some short-term deterioration of water quality though uncommon, is possible. You should avoid tap water for household uses at that time. If you do use the tap, , allow your cold water to run for a few minutes at full velocity before use and avoid using hot water, to prevent sediment accumulation in your hot water tank. The Village usually flushes hydrants two times a year, in April and November. The Town usually flushes hydrants monthly and exercises all hydrants yearly.
Water Main Flushing Important Health Information
Although our drinking water met or exceeded state and federal regulations, some people may be more vulnerable to disease causing microorganisms or pathogens in drink-ing water than the general population. Immunocompro-mised persons such as persons with cancer undergoing chemotherapy, persons who have undergone organ trans-plants, people with HIV-AIDS or other immune system disorders, some elderly, and infants can be particularly at risk from infections. These people should seek advice from their health care provider about their drinking water. EPA/CDC guidelines on appropriate means to lessen the risk of infection by Cryptosporidium, Giardia and other microbial pathogens are available from the Safe Drinking Water Hotline at (800) 426-4791. If present, elevated levels of lead can cause serious health problems, especially for pregnant women, infants and young children. It is possible that lead levels at your home may be higher than at other homes in the community as a result of materials used in your home’s plumbing. We are responsible for providing high-quality drinking water, but we cannot control the variety of materials used in plumbing components. When your water has been sitting for several hours, you can minimize the potential for lead exposure by flushing your tap for 30 seconds to 2 minutes before using water for drinking or cooking. If you are con-cerned about lead in your water, you may wish to have your water tested. Information on lead in drinking water, testing methods, and steps you can take to minimize expo-sure is available from the Safe Drinking Water Hotline (800) 426-4791 or at www.epa.gov/safewater/lead.

MCWA Water Quality Summary Table
2020 Calendar Year Results -
Detected Substances:
Supply - MCWA Production Water: MCWA Purchased Water:
Likely Source:
Water Quality Violation:
SWTP & WWTP - CWTP - Rochester - ECWA -
Source - Lake Ontario Well Field Hemlock Lake Lake Erie
(Source Type) (Surface Water) (Groundwater) (Surface Water) (Surface Water)
Units MCLG MCL Range of detected values: Yes or No
Barium mg/L 2 2 0.019 - 0.023 0.1 - 0.11 0.017 0.021 Erosion of natural deposits No
Chloride mg/L NA 250 22 - 29 48 - 68 37 - 39 21 - 24 Naturally occurring No
Fluoride mg/L NA 2.2 0.5 - 1 0.11 - 0.14 0.08 - 0.78 0.58 - 0.8 Natural and additive - pro-
motes strong teeth No
Nitrate mg/L 10 10 0.21 - 0.39 ND 0.25 0.32 Erosion of natural deposits No
Perfluorohexanesulfonic acid ng/L NS NS ND - 2 ND ND ND Used to manufacture textiles No
Perfluorooctanesulfonic acid ng/L NS 10 2.5 - 2.8 ND ND ND Used to manufacture textiles No
Perfluorooctanoic acid ng/L NS 10 ND - 2.2 ND ND ND Used to manufacture textiles No
Sodium mg/L NA NS 14 - 17 46 - 100 * 19 - 21 * 12 - 14 Naturally occurring No
Sulfate mg/L NA 250 25 - 28 48 - 52 12 20 - 21 Naturally occurring No
Turbidity - Turbidity is a measure of cloudiness of the water. Turbidity has no health effects. MCWA monitors turbidity because it is a good indicator of the effectiveness of our filtration systems and water quality. State regulations require that turbidity must always be below 1 NTU in the combined filter effluent. The regulations also require that 95% of samples collected from the entry point have measurements below 0.3 NTU and the highest monthly average for distribution system samples be below 5 NTU. Averages, annual ranges and lowest monthly percentages are listed.
Turbidity - Entry Point NTU NA TT 0.04 (0.02 - 0.09)
NR 0.06 (0.04 - 0.1) 0.1 (0.04 - 0.18)
Soil Runoff No 100% < 0.3 NTU 100% < 0.3 NTU 100% < 0.3 NTU
Turbidity - Distribution NTU NA 5 7 - 11/19/2020 0.88 - 7/30/2020 7 - 11/19/2020 0.88 - 7/30/2020 Soil Runoff No
Microbial Pararmeters - No more than 5% of monthly samples can be positive. The highest monthly % positive and number of samples is listed.
Total Coliform Bacteria NA 0 TT 0.39% - November 2.86% - March 0.39% - November 2.86% - March
Naturally occurring No 2 samples 1 sample 2 samples 1 sample
Source Water Microbial Pathogens - The highest positive month and number of samples is listed. In our treatment processes, Cryptosporidium is removed / inactivated through a combination of filtration and disinfection or by disin-fection alone.
Cryptosporidium Cysts/L 0 TT WWTP - 1 (March)
NR ND ND (2017) Naturally occurring No 1 Sample
Disinfectant and Disinfectant By-products (DBPs) - Chlorine has a MRDL (Maximum Residual Disinfectant Level) and MRDLG (MRDL Goal) rather than an MCL and MCLG (Averages and ranges are listed). For the DBPs (Total Trihalome-thanes and Haloacetic Acids) the annual system average, range for all locations, and highest locational running annual average for all locations are listed.
Chlorine Residual - Entry Point mg/L NA MRDL = 4 1.15 (0.78 - 1.38)
0.84 (0.71 - 1.1) 0.84 (0.71 - 1.1) 1.49 (1.29 - 1.64) Additive for control of mi-
crobes No
0.77 (0.46 - 0.97)
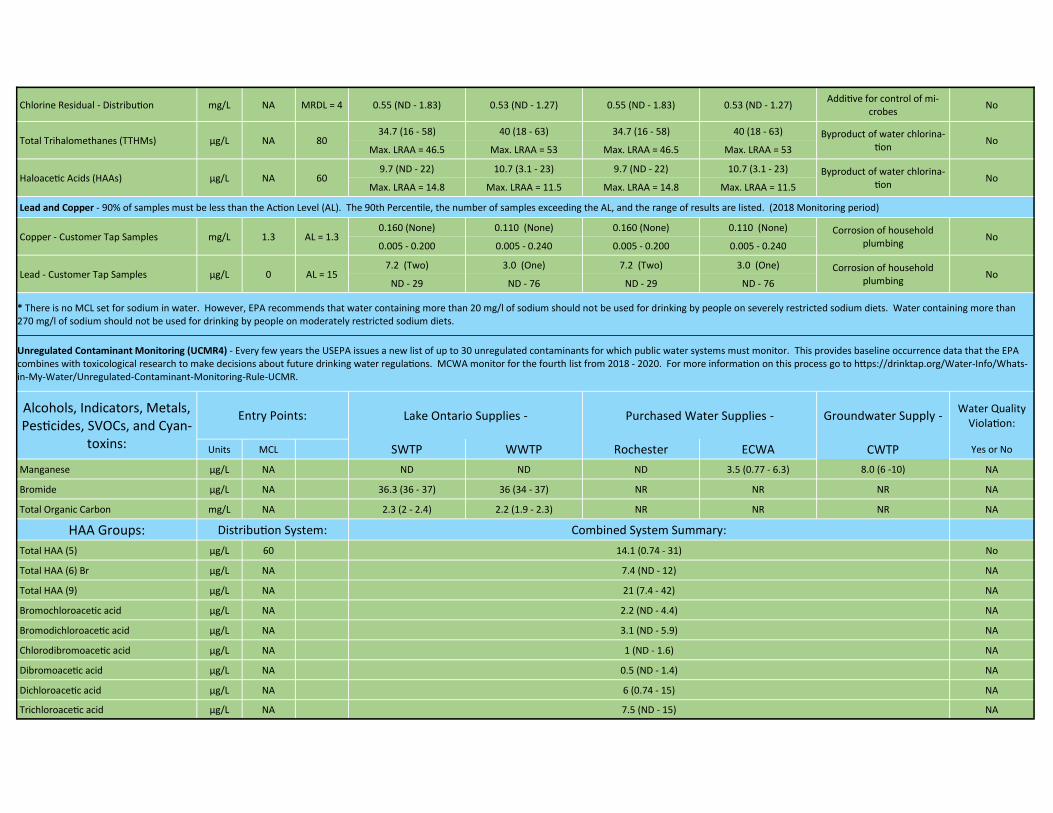
Chlorine Residual - Distribution mg/L NA MRDL = 4 0.55 (ND - 1.83) 0.53 (ND - 1.27) 0.55 (ND - 1.83) 0.53 (ND - 1.27) Additive for control of mi-
crobes No
Total Trihalomethanes (TTHMs) µg/L NA 80 34.7 (16 - 58) 40 (18 - 63) 34.7 (16 - 58) 40 (18 - 63) Byproduct of water chlorina-
tion No
Max. LRAA = 46.5 Max. LRAA = 53 Max. LRAA = 46.5 Max. LRAA = 53
Haloacetic Acids (HAAs) µg/L NA 60 9.7 (ND - 22) 10.7 (3.1 - 23) 9.7 (ND - 22) 10.7 (3.1 - 23) Byproduct of water chlorina-
tion No
Max. LRAA = 14.8 Max. LRAA = 11.5 Max. LRAA = 14.8 Max. LRAA = 11.5
Lead and Copper - 90% of samples must be less than the Action Level (AL). The 90th Percentile, the number of samples exceeding the AL, and the range of results are listed. (2018 Monitoring period)
Copper - Customer Tap Samples mg/L 1.3 AL = 1.3 0.160 (None) 0.110 (None) 0.160 (None) 0.110 (None) Corrosion of household
plumbing No
0.005 - 0.200 0.005 - 0.240 0.005 - 0.200 0.005 - 0.240
Lead - Customer Tap Samples µg/L 0 AL = 15 7.2 (Two) 3.0 (One) 7.2 (Two) 3.0 (One) Corrosion of household
plumbing No
ND - 29 ND - 76 ND - 29 ND - 76
* There is no MCL set for sodium in water. However, EPA recommends that water containing more than 20 mg/l of sodium should not be used for drinking by people on severely restricted sodium diets. Water containing more than 270 mg/l of sodium should not be used for drinking by people on moderately restricted sodium diets.
Unregulated Contaminant Monitoring (UCMR4) - Every few years the USEPA issues a new list of up to 30 unregulated contaminants for which public water systems must monitor. This provides baseline occurrence data that the EPA combines with toxicological research to make decisions about future drinking water regulations. MCWA monitor for the fourth list from 2018 - 2020. For more information on this process go to https://drinktap.org/Water-Info/Whats-in-My-Water/Unregulated-Contaminant-Monitoring-Rule-UCMR.
Alcohols, Indicators, Metals, Pesticides, SVOCs, and Cyan-
toxins:
Entry Points: Lake Ontario Supplies - Purchased Water Supplies - Groundwater Supply - Water Quality
Violation:
Units MCL SWTP WWTP Rochester ECWA CWTP Yes or No
Manganese µg/L NA ND ND ND 3.5 (0.77 - 6.3) 8.0 (6 -10) NA
Bromide µg/L NA 36.3 (36 - 37) 36 (34 - 37) NR NR NR NA
Total Organic Carbon mg/L NA 2.3 (2 - 2.4) 2.2 (1.9 - 2.3) NR NR NR NA
HAA Groups: Distribution System: Combined System Summary:
Total HAA (5) µg/L 60 14.1 (0.74 - 31) No
Total HAA (6) Br µg/L NA 7.4 (ND - 12) NA
Total HAA (9) µg/L NA 21 (7.4 - 42) NA
Bromochloroacetic acid µg/L NA 2.2 (ND - 4.4) NA
Bromodichloroacetic acid µg/L NA 3.1 (ND - 5.9) NA
Chlorodibromoacetic acid µg/L NA 1 (ND - 1.6) NA
Dibromoacetic acid µg/L NA 0.5 (ND - 1.4) NA
Dichloroacetic acid µg/L NA 6 (0.74 - 15) NA
Trichloroacetic acid µg/L NA 7.5 (ND - 15) NA

Key Terms and Abbreviations used: MCL = Maximum Contaminant Level - The highest level of a contaminant that is allowed in drinking water. MCLs are set as close to the MCLGs as possible.
MCLG = Maximum Contaminant Level Goal - The level of a contaminant below which there is no known or expected risk to health. MCLGs allow for a margin of safety.
MRDL = Maximum Residual Disinfectant Level - The highest level of a disinfectant allowed in drinking water. There is convincing evidence that addition of a
disinfectant is necessary for control of microbial contaminants.
MRDLG = Maximum Residual Disnfectant Level Goal - The level of a drinking water disinfectant below which there is no known or expected risk to health. MRDLGs
do not reflect the benefits of the use of disinfectants to control microbial contamination.
LRAA = Locational Running Annual Average - The annual average contaminant concentration at a monitoring site.
pCi/L = picoCuries per liter.
TT = Treatment Technique - A required process intended to reduce the level of a contaminant in drinking water.
AL = Action Level - The concentration of a contaminant which, if exceeded, triggers treatment or other requirements which a water system must follow.
ND = Not Detected - Absent or present at less than testing method detection level. All testing methods are EPA approved with detection limits much less than the MCL.
NA = Not applicable. NR = Not required / Not reported. NS = No standard.
mg/L = milligram (1/1,000 of a gram) per liter = ppm = parts per million.
µg/L = microgram (1/1,000,000 of a gram) per liter = ppb = parts per billion.
ng/L = nanogram (1/1,000,000,000 of a gram) per liter = ppt = parts per trillion.
NTU = Nephelometric Turbidity Unit - A measurement of water clarity.
CWTP = Corfu Water Treatement Plant. SWTP = Shoremnt Water Treatement Plant. WWTP = Webster Water Treatment Plant.
MCWA = Monroe County Water Authority. Rochester = City of Rochester. ECWA = Erie County Water Authority.

Compounds Tested For But Not Detected Benzene Toluene Carbaryl Ethoprop
Bromobenzene 1,2,3-Trichlorobenzene Dalapon Oxyfluoren
Bromochloromethane 1,2,4-Trichlorobenzene Di(2-Ethylhexyl) Adipate Profenofos
Bromomethane 1,1,1-Trichloroethane Di(2-Ethylhexyl) phthalate (DEHP) Tebuconazole
n-Butylbenzene 1,1,2-Trichloroethane Dicamba Permethrin, cis & trans
sec-Butylbenzene Trichloroethene Dieldrin Tribufos
tert-Butylbenzene Trichlorofluoromethane Dinoseb Butylated hydroxyanisole
Carbon Tetrachloride 1,2,3-Trichloropropane Diquat o-Toluidene
Chlorobenzene 1,2,4-Trimethylbenzene Endothall Quinoline
Chloroethane 1,3,5-Trimethylbenzene Glyphosate 1-Butanol
Chloromethane Vinyl Chloride Hexachlorobenzene 2-Methoxyethanol
2-Chlorotoluene o-Xylene Hexachlorocyclopentadiene 2-Propen-1-ol
4-Chlorotoluene m, p-Xylene 3-Hydroxycarbofuran Monobromoacetic acid
Dibromomethane Total Xylene Methomyl Monochloroacetic acid
1,2-Dichlorobenzene Alachlor Metolachlor Tribromoacetic acid
1,3-Dichlorobenzene Aldicarb Metribuzin 1, 4-Dioxane
1,4-Dichlorobenzene Aldicarb sulfoxide Oxamyl (vydate) N-ethyl Perflurooctanesulfonamidoacetic acid
Dichlorodifluoromethane Aldicarb sulfone Perchlorate N-methyl Perflurooctanesulfonamidoacetic acid
1,1 Dichloroethane Atrazine Picloram Perfluorobutanesulfonic acid
1,2-Dichloroethane Carbofuran Propachlor Perfluorodecanoic acid
1,1-Dichloroethene Chlordane Simazine Perfluorododecanoic acid
cis-1,2-Dichloroethene Dibromochloropropane 2, 3, 7, 8-TCDD (Dioxin) Perfluoroheptanoic acid
trans-1,2-Dichloroethene 2, 4-D Antimony Perfluorohexanoic acid
1,2-Dichloropropane Endrin Beryllium Perfluorononoic acid
1,3-Dichloropropane Ethylene Dibromide Chromium Perfluorotetradecanoic acid
2,2-Dichloropropane Heptachlor Cyanide Perfluorotridecanoic acid
1,1-Dichloropropene Heptachlor Epoxide Mercury Perfluoroundecanoic acid
1,3-Dichloropropene(cis) Lindane (gamma-BHC) Nickel Total Microcystin
1,3-Dichloropropene(trans) Methoxychlor Nitrite Microcystin-LA
Ethylbenzene p,p' DDD Selenium Microcystin-LF
Hexachlorobutadiene p,p' DDE Silver Microcystin-LR
p-Isopropyltoluene p,p' DDT Thallium Microcystin-LY
Methyl Tert-butyl ether (MTBE) PCB's Total Zinc Microcystin-RR
Methylene Chloride (Dichloromethane) Pentachlorophenol Surfactants (Foaming Agents) Microcystin-YR
n-Propylbenzene Toxaphane Giardia Lamblia Nodularin
Styrene 2, 4, 5-TP (Silvex) Germanium Anatoxin-A
1,1,1,2-Tetrachloroethane Aldrin alpha-Hexachlorocyclohexane Cylindrospermopsin
1,1,2,2-Tetrachloroethane Benzo(a)pyrene Chlorpyrfos
Tetrachloroethene Butachlor Dimethipin
For more information on MCWA's water quality monitoring program call Customer Service at 585-442-7200 or visit our website at www.mcwa.com.

TOWN OF BATAVIA – SAMPLING RESULTS
SUBSTANCE [UNITS]
MCL [MRDL]
MCLG HIGHEST RUNNING ANN. AVG1
RANGE Low-High
DATE SAM-PLED
MEETS EPA STANDARDS
Chlorine Residual [mg/L] [4] N/A N/A 0.07 - 1.31 2020 (few times per week) Yes
Haloacetic Acids (HAAs) [ug/L]
Batavia Consolidated PWS 60 N/A 16.7 10.6 – 20.5 2020 (quarterly) Yes
Haloacetic Acids (HAAs) [ug/L]
Alexander WD#2 PWS 60 N/A N/A 8.5 – 11.7 8/3/20 & 11/4/20 N/A
Haloacetic Acids (HAAs) [ug/L]
Townline Water PWS 60 N/A 19.0 11.5 – 22.1 2020 (quarterly) Yes
Haloacetic Acids (HAAs) [ug/L]
Alabama WD#2 PWS 60 N/A 15.4 11.8 – 17.8 2020 (quarterly) N/A
Haloacetic Acids (HAAs) [ug/L]
Elba WD#2 PWS 60 N/A N/A 11.1 – 11.2 8/3/20 & 11/4/20 N/A
Total Trihalomethanes (TTHMs) [ug/L]
Batavia Consolidated PWS 80 N/A 47.3 26.8 – 72.9 2020 (quarterly) Yes
Total Trihalomethanes (TTHMs) [ug/L]
Alexander WD#2 PWS 80 N/A N/A 81.8 – 99.1 8/3/20 & 11/4/20 N/A
Total Trihalomethanes (TTHMs) [ug/L]
Townline Water PWS 80 N/A 52.1 32.4 – 68.7 2020 (quarterly) Yes
Total Trihalomethanes (TTHMs) [ug/L]
Alabama WD#2 PWS 80 N/A 59.1 34.8 – 84.5 2020 (quarterly) Yes
Total Trihalomethanes (TTHMs) [ug/L]
Elba WD#2 PWS 80 N/A N/A 71.3 – 84.1 8/3/20 & 11/4/20 N/A
SUBSTANCE [UNITS]
AL SITES SAM-
PLED SITES DE-TECTED
RANGE Low-High
DATE SAM-PLED
MEETS EPA STANDARDS
Asbestos Fibers [MFL] Batavia Consolidated PWS2
7.0 6 1 ND-0.2 12/29/14 Yes
SUBSTANCE [UNITS]
AL MCLG 90TH %TILE
RESULT3 RANGE Low
-High DATE SAM-
PLED MEETS EPA STANDARDS
Copper [mg/L] 1.3 1.3 0.0708 0.0035 – 0.559 July 2018 Yes
Lead [mg/L] 0.015 0 0.0034 ND-0.0103 July 2018 Yes 1These levels represent the highest locational running annual average calculated from data collected. 2Alexander WD#2, Townline Water, Alabama WD#2, and Elba WD#2 PWS’s do not have asbestos cement pipes in the system and are waived from asbestos fibers sampling. 3The 90th percentile is equal to or greater than 90% of the lead and copper values detected at your water system.