Embed Size (px)
Citation preview
NCEO Report 429
The 95 Percent State Assessment
Participation Requirement:
Current Landscape, State Challenges,
and Recommended Strategies
i
NCEO Report 429
The 95 Percent State Assessment Participation Requirement: Current Landscape, State Challenges, and Recommended Strategies
Tiffany Katanyoutanant, Sylvia Kwon, Markie McNeilly, Bryan Hemberg, Martha L. Thurlow, Sheryl S. Lazarus, Andrew R. Hinkle, and Kristin K. Liu
September 2021
All rights reserved. Any or all portions of this document may be reproduced and distributed without prior permission, provided the source is cited as:
Katanyoutanant, T., Kwon, S., McNeilly, M., Hemberg, B., Thurlow, M. L., Lazarus, S. S., Hinkle, A. R., & Liu, K. K. (2021). The 95 percent state assessment participation requirement: Current landscape, state challenges, and recommended strategies (NCEO Report 429). National Center on Educational Outcomes.
ii
National Center on Educational OutcomesUniversity of Minnesota • 207 Pattee Hall150 Pillsbury Dr. SE • Minneapolis, MN 55455Phone 612/626-1530 • Fax 612/624-0879http://www.nceo.info
The University of Minnesota shall provide equal access to and opportunity in its programs, facilities, and employment without regard to race, color, creed, religion, national origin, gender, age, marital status, disability, public assistance status, veteran status, sexual orientation, gender identity, or gender expression.
This document is available in alternative formats upon request.
NCEO Core StaffSheryl S. Lazarus, DirectorDeb A. AlbusJessica BowmanKascinda Fleming Gail GhereLinda GoldstoneAndrew HinkleKristi K. LiuCharity Funfe Tatah Mentan
Michael L. MooreDarrell PetersonVirginia RessaChristopher RogersJennifer Sommerness Kathy StrunkMartha L. ThurlowTerri VandercookYi-Chen Wu
The Center is supported through a Cooperative Agreement (#H326G160001) with the Research to Practice Division, Office of Special Education Programs, U.S. Department of Education. The Center is affiliated with the Institute on Community Integration at the College of Education and Human Develop-ment, University of Minnesota. The contents of this report were developed under the Cooperative Agreement from the U.S. Department of Education, but do not necessarily represent the policy or opinions of the U.S. Department of Education or Offices within it. Readers should not assume endorsement by the federal government.
Project Officer: David Egnor
In collaboration with:
iii
Executive Summary
State tests used for accountability provide important information for program decision making, and support equity and quality instruction. Federal regulations require that all students in speci-fied elementary, middle, and high school grade ranges participate in state assessments used for accountability. The Individuals with Disabilities Education Act (IDEA) requires that all children with disabilities are included in all general state and districtwide assessment programs with ap-propriate accommodations and alternate assessments, regardless of whether the assessments are used for accountability. The 2015 reauthorization of the Elementary and Secondary Education Act (ESEA) known as the Every Student Succeeds Act (ESSA) stipulates that states must assess at least 95 percent of all students, as well as 95 percent of students in each subgroup, including children with disabilities, with federally approved statewide academic content assessments to meet federal accountability requirements.
For students with the most significant cognitive disabilities, ESSA places a one percent threshold on their participation in a state’s alternate assessment based on alternate academic achievement standards (AA-AAAS). If a state anticipates exceeding the one percent threshold for any subject area (i.e., reading/language arts, math, science), the state may submit a waiver request to the U.S. Department of Education for the relevant subject. Any state requesting such a waiver must also demonstrate substantial progress toward reducing the number of students taking the AA-AAAS. Additionally, any state seeking this waiver must demonstrate that at least 95 percent of all students and 95 percent of all students with disabilities participated in the state assessment.
The purpose of this report is to provide an overview of federal statutory language on student participation in state summative assessments used for accountability as well as the participa-tion requirements for states requesting waivers from the 1% threshold on participation in the AA-AAAS. It also includes a review of the reasons why states have found it challenging to meet the 95 percent participation rate, and the extent to which states have met federal testing participation requirements.
The report includes examples of strategies several states used to address assessment participa-tion. Addressing stakeholder questions and clarifying the value of testing can encourage student participation in state assessments. Communication tools and the development of a communi-cation plan can support states in communicating testing purpose and importance clearly, and addressing stakeholder questions and concerns about testing. To support districts and schools, states might consider:
• What messages do our districts and schools receive about our state’s testing system? How consistent is this messaging across stakeholders? How do our communication tools address different stakeholders’ understandings of our testing system?
• How do our communication tools explain accessibility features and accommodations avail-able to support all students participating in assessments?
iv
• How transparent are our communication tools about state testing and how assessment data are used?
• How do we support our districts and schools in analyzing data to identify challenges reach-ing the 95 percent participation rate requirement?
• How do our state’s contingency plans help districts and schools in cases where technology or equipment challenges impact assessment administration?
• How can our state’s supports be used in different school contexts (e.g., in-person instruc-tion, remote instruction, hybrid instruction)? Are our supports adaptable to different school contexts?
v
Table of Contents
Executive Summary .......................................................................................................................... iii
Overview ..............................................................................................................................................1
Federal Assessment Requirements .......................................................................................................1
Challenges Related to State Assessment Participation Rates ..............................................................3
Assessment Administration Technology Issues ..............................................................................3
Voluntary Student Opt-Out .............................................................................................................5
Challenges due to the COVID-19 Pandemic .................................................................................6
State Assessments in Spring 2021........................................................................................................7
Review of Recent State Assessment Participation Rates ................................................................9
State Strategies to Address Assessment Participation ........................................................................11
General State Communications Strategies ....................................................................................11
Conclusion .........................................................................................................................................14
References ..........................................................................................................................................16
Appendix A ........................................................................................................................................21
1NCEO
Overview
Although state testing requirements have been a feature of public K–12 education since the 1994 reauthorization of the Elementary and Secondary Education Act (Improving America’s Schools Act of 1994, 20 U.S.C. § 1111, 1994) stakeholders, including educators, administra-tors, families, and policymakers, have shared persistent questions about federal requirements related to these assessments: Why is it necessary for students to participate in annual testing? Which students are required to participate? Why are students with disabilities required to take state tests? What happens if families choose to opt their students out of testing? Given these kinds of questions, it is critical for state education agencies (SEAs) to have current and clear information about annually assessing all students.
To support SEA staff in addressing stakeholders’ questions related to these requirements, this report reviews federal statutory language that governs annual state assessment requirements, including alternate assessments. In addition to examining testing requirements and the rationale behind them, this report explores the extent to which states have met federal testing requirements, as well as the challenges states have faced in meeting these associated assessment participation regulations. As SEA staff consider how to address student assessment participation challenges, state strategies are highlighted to provide examples that can be adapted for different state contexts.
Federal Assessment Requirements
Two federal laws, the Elementary and Secondary Education Act (ESEA), known as the Every Student Succeeds Act (ESSA), and the Individuals with Disabilities Education Act (IDEA), re-quire that all students in specified elementary, middle, and high school grade ranges participate in state assessments each year. To ensure that all students are tested and that appropriate assess-ment accommodations are provided as needed, these laws include assessment participation rate requirements for states to follow (U.S. Department of Education, 2016).
Federal regulations are in place to ensure that all students, including students with disabilities, are included in statewide assessment participation. For students with disabilities, section 300.160 of IDEA calls for states to make certain that all children with disabilities are included in all general state and districtwide assessment programs, including assessments described under section 1111 of ESEA, 20 U.S.C. 6311, with appropriate accommodations and alternate assess-ments, if necessary, as indicated in their respective individualized education programs (IEPs). Section 1111(c)(4)(E) of ESEA reinforces testing for all students, stipulating that states must assess at least 95 percent of all students, as well as 95 percent of students in each subgroup, including English learners and children with disabilities, with federally approved statewide academic content assessments to meet federal accountability requirements. States are required
2 NCEO
to administer assessments: in reading/language arts and mathematics annually in grades 3–8 and once in high school; in science once in each grade span (elementary, middle, and high school); and for annual English language proficiency in grades K–12 for all English learners. States must include all students for each of the required assessments and must meet the 95 percent participation requirements for accountability purposes. Codified as part of the ESSA 2015 reauthorization, the assessment participation requirement supports states and districts to help ensure that all students and subgroups graduate from high school ready for college or a career. Progress toward this college or career readiness goal is measured in part by statewide annual assessments that provide performance and outcome data for stakeholders to track student progress and performance.
Each state’s school accountability system must include a methodology for calculating the per-centage of public school students who participate in statewide assessments and report those participation calculations in state and district accountability report cards. In addition to reporting the results of annual statewide assessments in reading/language arts, math, and science, states must provide annual assessment participation rates for all students and subgroups (by racial and ethnic groups, for economically disadvantaged students, for children with disabilities, and for English learners) (U.S. Department of Education, 2019).
For students with the most significant cognitive disabilities, ESSA places a one percent thresh-old (or cap) on their participation in a state’s alternate assessment based on alternate academic achievement standards (AA-AAAS). The one percent cap is calculated based on the number of tested students within a subject. This regulation applies to all subjects for which states administer alternate assessments (U.S. Department of Education, 2017b). If a state anticipates exceeding the one percent cap for any subject assessment, the state may submit a waiver request to the U.S. Department of Education for the relevant subject. Any state requesting such a waiver must also demonstrate “substantial progress” toward reducing the number of students taking a state alternate assessment. Additionally, any state seeking this waiver must demonstrate that at least 95 percent of all students and 95 percent of all students with disabilities participated in state-required assessments (U.S. Department of Education, 2018a; 2020).
If statewide assessment participation rates fall below 95 percent (for all students or for any sub-group), SEAs must develop an action plan, with community stakeholder feedback, to improve participation rates (U.S. Department of Education, 2016). There are no federal requirements for action plans; states are given latitude to propose actions that are differentiated to address particular needs but also sufficiently rigorous and effective for increasing statewide assessment participation rates. Districts and schools that do not meet the 95 percent participation rate require-ment are also required to develop individual plans to increase participation; these plans must be developed with stakeholder input and be based on local contexts. Any action plan developed
3NCEO
to address assessment participation rates should be responsive to the unique circumstances and issues that impact district and state abilities to test their students.
Challenges Related to State Assessment Participation Rates
States continue to have a variety of challenges related to statewide assessment administration and participation, necessitating states to contemplate various logistical considerations for test-ing. States have reported a variety of challenges related to student assessment participation, highlighting the difficulties states may have meeting the federal 95 percent assessment require-ment in any given year. In previous years, multiple states have dealt with technological issues that interrupted administration of their computer-assisted assessments and adversely impacted students’ participation rates. States have also contended with families and students who have opted-out of state testing for personal reasons. Additionally, state assessment participation for the 2020–21 school year was further impacted by the COVID-19 pandemic, with states deal-ing with variable school re-opening plans and logistics for safely getting students back into the classroom for testing. Each of these three challenges is discussed in more detail.
Assessment Administration Technology Issues
With the advent and availability of digitally-based assessments in recent years, statewide as-sessment administration has taken on new logistical considerations. According to the National Center for Education Statistics (n.d.), 49 states administer computer-based assessments in the elementary and middle school grades. As the use of online assessments continues to expand, state and district technological capacities may impact student opportunities to participate in state testing. Although these assessments provide opportunities to use interactive questions and adaptive techniques to measure students’ understanding and critical thinking, administering them requires states, districts, and schools to consider and address technological equipment and connectivity concerns (e.g., ensuring that all students have technological equipment to complete digitally-based assessments, ensuring students have consistent access to internet connection to complete assessments) (Brown, 2016).
Given the wide-scale administration of computer-based assessments, states must develop contingency plans to address technological challenges that may impact student assessment participation. In recent years, multiple states have experienced technical issues that impeded students’ assessment participation:
• In Alaska, a fiber optic cable near the state’s selected testing provider was severed, inter-rupting assessment administration. Before and after the cable was repaired, schools reported multiple technology errors that impacted students, such as blank screens, lack of sound, and
4 NCEO
answers not being saved. State officials requested that the U.S. Department of Education provide a waiver for federal assessment and reporting requirements due to the “significant technical problems” that hampered assessment administration (Alaska Department of Edu-cation and Early Development, 2016).
• In Georgia, teachers and parents reported issues with the Georgia Milestones End-Of-Grade assessments, including students unable to log on to the testing system or later dropped from the site (Walker, 2016).
• In Nevada, computer systems were overloaded and brought state testing to a halt for two days (Milliard, 2015).
• In New York, the software used for the state’s grades 3–8 English language arts assessments crashed, resulting in the state having to cancel all online testing for a day (Murphy, 2019).
• In Tennessee, online testing in the elementary and middle school grades was cancelled after vendor delivery issues (Gonzales, 2019).
• In Texas, technical hiccups erased students’ answers on more than 14,000 exams (Brown, 2016).
Any interruption in assessment administration can have an adverse impact on a state’s ability to meet the 95 percent participation requirement. In all these examples, state education officials had to contend with either rescheduling administration of digitally-based assessments or secur-ing enough paper versions for students to use instead. Officials also had to ensure that students’ online assessment responses would be properly recorded for participation calculations and school accountability designation purposes. Technology can have a massive impact on a state’s ability to administer digitally-based assessments and ensure that students have sufficient opportunity to participate in testing.
In spite of federal requirements that all students participate in state assessment systems, some students with disabilities, English learners, and English learners with disabilities may not par-ticipate in state tests used for accountability due to the lack of availability of needed accom-modations on some digitally-based assessments. Local education agencies (LEAs) may face challenges providing the range of accommodations individual students need to participate in state testing. Students with IEPs may need assessment accommodations that are incompatible with currently available digital administration requirements (e.g., having separate testing loca-tions, having particular software available) (Stone & Davey, 2011). English learners may need direct linguistic support accommodations (e.g., having items read aloud in simplified/sheltered English or in their home language) or native language accommodations (e.g., oral directions in different languages, having items read aloud in different languages) in order to participate in
5NCEO
statewide assessments (Lazarus et al., 2021). States will need to ensure that their digitally-based assessments have these accessibility features and accommodations available. Failure to ensure that all needed accessibility features and accommodations are provided can adversely impact students’ ability to participate in state testing.
Voluntary Student Opt-Out
Across the United States, some families have withdrawn their children from statewide testing; this decision has at times been spurred by concerns about the volume of standardized testing in grades K–12; overreliance on test scores to evaluate schools, students, and teachers; and equity concerns related to assessment suitability and access for all students (National Center for Fair and Open Testing, 2020; Pizmony-Levy & Green Saraisky, 2016). State laws and policies on opt out vary, with some states explicitly permitting opt outs. Thirty-four states and the District of Columbia require all students to take state assessments (Lorenzo, 2015), while other states allow districts to set their own opt out-related policies (Bennett, 2016). For example, California Education Code 60615 allows parents or guardians to submit a written request to exclude a stu-dent from any or all parts of state-mandated assessments, with no state-mandated consequences (California Teachers Association, n.d.). There are also states that have policies permitting par-ents to refuse statewide assessments for their child, though students will not be exempt from consequences of non-participation (e.g., not advancing to the next grade, not receiving a high school diploma) (Center on Standards and Assessment Implementation, 2016).
In a review of news accounts, research studies, and state and federal education department docu-ments, Bennett (2016) found that decisions to opt students out of statewide testing are driven by concerns about how states prioritize testing data for accountability purposes. For example, in New York, Bennett observed that the teacher evaluation system, which heightened the role of standardized assessments in determining teacher performance, was a factor in increased opt out rates among families—New York State had proposed to calculate half of a teacher’s evaluation based on state assessment score growth indicators. Although ESSA removed requirements to incorporate students’ state assessment scores when evaluating teachers (Sawchuk, 2016), these concerns persist for families who choose to withdraw their students from statewide testing.
In their analysis of responses to Columbia University’s online survey on who chose to opt stu-dents out of testing and their rationales for doing so, Pizmony-Levy and Green Saraisky (2016) found that some respondents were also motivated by equity concerns. In their comments, some respondents questioned how fair assessments are for students with disabilities in particular. Some asserted that standardized assessments as currently constructed may not be valid measures of the conceptual understanding of some students with disabilities, even with accommodations (Dahlstrom-Hakki et al., 2019). Other scholars have highlighted concerns about the scientific racism that underpins standardized testing, noting that testing historically has been used to pur-
6 NCEO
portedly prove that African American and other non-white students are intellectually inferior (Davis & Martin, 2018). Davis and Martin (2018) reported lingering concerns about how the persistent focus on standardized testing perpetuates racial hierarchies rather than improving instruction for students. These types of concerns may be contributing to family decisions to opt their child out of statewide assessments.
On the other hand, some stakeholders (e.g., educators, researchers, and policymakers) have contended that standardized assessments are often the only comparable measure of student performance. Without a common assessment tool, it is difficult to ascertain how students across schools and districts perform relative to their grade-level peers. Statewide assessment scores are often the only available school-level measures that disaggregate student performance by demo-graphic groups, which is necessary for stakeholders to determine whether students have access to equitable learning opportunities and outcomes (Bennett, 2016). Without common measures of student learning outcomes, it can be difficult to ascertain how students are responding to instruction and how their performance compares to their school peers.
The variation in perspectives of equity in assessment highlights different conceptions of equity with regard to student learning and schooling practices and how these different conceptions may impact views of standardized testing practices. Although some express concern about testing potentially perpetuating racial hierarchies, others assert that standardized assessments are needed to provide comparable measures to determine whether students have equitable ac-cess to instruction and learning. Nonetheless, different perspectives of assessments and equity may impact which students participate in statewide assessments and which students choose to voluntarily opt out.
Challenges due to the COVID-19 Pandemic
Due to the COVID-19 pandemic and subsequent school closures, all 50 states, the District of Columbia, Puerto Rico, and the Bureau of Indian Education received waivers for federal test-ing requirements (Office of Elementary and Secondary Education, n.d.) in 2020. As a result, states were not required to administer statewide assessments, identify schools for support and improvement, or report assessment and accountability data in state or local report cards for the 2019–20 school year (Education Commission of the States, 2020). However, as of September, 2021, there was no existing U.S. Department of Education guidance on how states are to ac-count for this missing year of assessment data in their accountability systems. Moving forward, states will have to consider how to account for a missing year of state assessment data in their school accountability plans.
As a result of the COVID-19 pandemic, states had to grapple with questions about how to administer assessments in in-person and remote modes. States that proceeded with in-person
7NCEO
testing had to secure sufficient equipment for assessment administration, adhere to social dis-tance protocols, develop testing schedules for students, and determine staffing needs (National Academy of Education, 2021). In cases where school facilities were unable to open, some states opted for remote assessment administration, requiring states to address students’ disparate ac-cess to devices, internet connections, and suitable environments needed for testing (Marion, 2021). Remote administration can put students at risk of not receiving needed accessibility features and accommodations (e.g., human readers, scribes), which raises potential legal issues for states and their ability to meet all students’ testing needs. Both in-person and remote modes of administration had implications for assessment participation and required states to consider how assessments would be made accessible for all students, regardless of where state assess-ments were administered.
Managing both in-person and remote testing also required states to address how scores from different administration settings will eventually be compared and aggregated (Marion, 2021).
With differences in participation rates, as well as in testing settings and contexts (at home versus in a classroom), how will states ensure that data from different settings are comparable? Ad-ministering assessments in different settings also required states to develop plans for securing test materials across settings. Spring 2021 assessment administration required states to manage multiple contingencies to address diverse testing environments, student assessment needs, and possible technological issues that might impact administration.
State Assessments in Spring 2021
In its February 22, 2021 letter to state officials, the U.S. Department of Education identified potential considerations for flexibility to facilitate statewide testing:
• Administer a shortened version of statewide assessments;
• Offer remote administration, where feasible (students are not required to test in a school building if it is not safe to do so); or
• Extend the testing window to the greatest extent practicable.
This letter confirmed that states could offer multiple assessment windows or extend the spring 2021 window into the summer or fall 2021, though states then had to consider how assessment results would be made publicly available in a timely manner. Flexibility to extend testing win-dows included English language proficiency assessments to ensure that all students would be able complete their state’s assessment as needed (U.S. Department of Education, 2021).
8 NCEO
Despite the flexibilities offered by the U.S. Department of Education, health and safety concerns still impacted state administration and student participation in spring 2021. At the state level, multiple states submitted applications to the U.S. Department of Education to request waivers from federal testing requirements for spring 2021 (Office of Elementary & Secondary Educa-tion, n.d.). Of these states, only the District of Columbia was granted a waiver for spring 2021 testing; officials were concerned because 88 percent of students in the District of Columbia were learning remotely and few students would be able to take assessments in person. Given the U.S. Department of Education’s stance that students should not be attending in-person instruc-tion solely for testing, the District of Columbia was granted a waiver (Blad & Ujifusa, 2021; Office of Elementary & Secondary Education, n.d.). Multiple states submitted waivers based on concerns about bringing students back to in-person instruction for testing; for these states, structuring spring 2021 assessment administration was a critical challenge.
In states where remote assessment administration was not an option, health and safety concerns prompted some families to opt their students out of testing and keep them at home. For example, in Texas, the State of Texas Assessments of Academic Readiness (STAAR) were administered only at school or alternate sites. Concerns about health risks for sending students back to cam-pus prompted some families to opt out of STAAR testing (Donaldson, 2021). Similarly, some families in Louisiana cited health concerns over sending children back to campus as the reason for opting their children out of state testing (Guidry, 2021). In face of the ongoing COVID-19 pandemic and family reluctance to send their students back to school for testing, some states (e.g., Maryland, New Jersey, and Washington) elected to test students in fall 2021 instead (Uji-fusa, 2021).
In response to state concerns about the feasibility of carrying out testing as planned, the U.S. Department of Education informed state leaders that accountability provisions related to the 95 percent assessment participation requirement were waived for 2021 testing (U.S. Department of Education, 2021). In guidance to states, the U.S. Department of Education (2021) acknowl-edged the challenges associated with spring 2021 assessment administration and clarified that there would not be penalties for states not meeting the 95 percent participation rate for this administration period. Still, many states continued to have their own requirements for student assessment participation.
Despite the challenges states faced in administering and successfully testing students in spring 2021, at least one state reported that 95 percent or more of its students would be assessed. For example, by the end of April 2021, Arkansas’ Division of Elementary and Secondary Education reported testing 75 percent of its students and expressed confidence that the state would meet the 95 percent participation threshold. Arkansas districts allowed students to take assessments in school or at other school-designated sites during the school day, after regular school hours, and on Saturdays to encourage student participation (Howell, 2021).
9NCEO
Review of Recent State Assessment Participation Rates
Table 1 provides a state-by-state overview of assessment participation rates for the 2018–19 school year gathered from state department of education websites. These participation data focus on all students and students with disabilities. This provides a context for student assessment participation in the 2020–21 school year.
Table 1. State Assessment Participation Rates for All K–12 Students and Students with Disabilities, by Content Area, for 2018–19
State Name
Reading/Language Arts Mathematics Science
All Students
Students with Dis-abilities
All Students
Students with Dis-abilities
All Students
Students with Dis-abilities
Alabama 99% 98% 99% 98% 98% 97%Alaska 91% 93% 91% 91% 88% 90%Arizona 95% 95% 95% 95% 95% 95%Arkansas 99% 99% 99% 99% 99% 99%California 97% 95% 97% 95% 94% 89%Colorado 94% 90% 94% 90% 82% 83%Connecticut 99% 97% 98% 97% 98% 94%Delaware 99% 97% 99% 97% 93% 90%Florida 96% 85% 91% 86% 95% 85%Georgia 99% 98% 99% 97% 99% 98%Hawaii 98% 95% 98% 96% 97% 93%Idaho 99% 98% 99% 98% 98% 96%Illinois 99% 97% 98% 97% 96% 93%Indiana 98% 97% 99% 97% 92% 48%Iowa 99% 99% 99% 98% - -Kansas 99% 98% 99% 98% 99% 97%Kentucky 99% 96% 99% 96% 99% 96%Louisiana ≥99% ≥99% ≥99% ≥99% ≥99% ≥99%Maine 97% 94% 97% 94% 95% 90%Maryland 99% 99% 99% 99% 96% 97%Massachusetts 99% 99% 99% 99% 99% 99%Michigan 96% >95% 96% >95% - -Minnesota 98% 95% 98% 94% 98% 88%Mississippi 98% 97% 99% 97% 99% 97%Missouri 99% 99% 99% 99% 99% 99%Montana 98% 96% 98% 96% 97% 94%Nebraska 98% 98% 98% 98% 98% 99%Nevada 99% 95% 99% 95% 92% 86%
10 NCEO
State Name
Reading/Language Arts Mathematics Science
All Students
Students with Dis-abilities
All Students
Students with Dis-abilities
All Students
Students with Dis-abilities
New Hampshire 96% 90% 96% 90% 91% 84%New Jersey 98% 96% 98% 96% - -New Mexico 99% 98% 99% 98% ≥99% -New York 91% 86% 91% 94% 74% 70%North Carolina 99% 92% 95% 92% 99% 93%North Dakota 98% 95% 98% 96% 91% 88%Ohio 99% - 99% - 99% -Oklahoma 99% 98% 99% 99% 99% 98%Oregon 95% 95% 94% 89% 90% 93%Pennsylvania 98% 94% 98% 94% 97% 92%Rhode Island 96% 90% 96% 90% 98% 93%South Carolina 99% 98% 99% 98% - -South Dakota 99% 99% 99% 99% - -Tennessee 98% 99% 99% 99% - -Texas 99% 99% 99% 99% 99% 99%Utah 98% 99% 98% 99% 98% 99%Vermont 99% - 99% - 97% -Virginia 99% 98% 99% 99% 99% 97%Washington 98% 95% 98% 95% 89% 88%West Virginia 99% 98% 99% 98% 99% 97%Wisconsin 96% 96% 97% 96% 97% 95%Wyoming 99% 99% 99% 99% 99% 99%
Notes: Data were compiled from review of publicly available documents on SEA websites. Websites were re-viewed between February and June 2021. Cells with dashes indicate no data were found. All percentages are rounded to the nearest whole number.
Based on existing publicly available data on SEA websites for the 2018–19 school year:
• 32 states reported meeting the 95 percent assessment participation rate for all three content area assessments (reading/language arts, mathematics, and science) for all students
• 20 states reported meeting the 95 percent assessment participation rate for all three content area assessments (reading/language arts, mathematics, and science) for students with dis-abilities
Table 1. State Assessment Participation Rates for All K–12 Students and Students with Disabilities, by Content Area, for 2018–19 (continued)
11NCEO
• 13 states reported meeting the 95 percent participation rate for only reading/language arts and mathematics assessments for all students
• 17 states reported meeting the 95 percent participation rate for only reading/language arts and mathematics assessments for students with disabilities
State Strategies to Address Assessment Participation
General State Communications Strategies
Zavadsky et al. (2017) at the Building State Capacity and Productivity Center developed a toolbox for SEAs to use in developing a comprehensive and centralized communication strategy that reaches internal and external stakeholders. Developing a comprehensive and centralized com-munication plan can support states in communicating testing purpose and importance clearly and address stakeholder questions and concerns about testing. In turn, addressing stakeholder ques-tions and clarifying the value of testing can encourage student participation in state assessments.
When developing or refining a state communication plan, Zavadsky et al. (2017) recommended that states consider how to communicate their vision and goals to reach diverse stakeholders. The toolbox asked SEAs to consider different stakeholders’ needs and levels of understanding when crafting communication tools. To encourage student participation in state assessments, SEAs might consider how communication tools improve understanding of state testing:
• What do our stakeholders know about our state assessment system? What do stakeholders know about testing requirements?
• What are stakeholder misconceptions about testing and its purposes?
• What do they know about the different types of assessments administered and why each assessment type is important for measuring student understanding?
• What are the different ways the SEA uses assessment data? What does data use look like across different levels of leadership (e.g., state, district, school)?
• How does state testing fit within the state’s strategic plan or goals?
At the student level, states can also provide districts and schools with suggestions and supports for “engaging students in the assessment process.” Educators and school leaders can consider how to keep students apprised of all changes to state content standards and assessments. Ide-ally this would include communication tools that are age-appropriate and inform students of
12 NCEO
the purpose and importance of testing (Ryan, 2019). This will ensure that state communication about assessment reaches a wide range of stakeholders and includes students in communication about the importance of assessment participation.
To work directly with schools that do not meet the 95 percent participation requirement, SEAs may also consider the supports given to schools to develop action plans to increase participation. An action plan can help SEA, district, and school staff take a closer look at contextual factors that are impacting assessment participation and identify action steps that are appropriate for each setting. States might consider developing action plan guidance or a template to specify the considerations and components that should be included in an action plan. This might include:
• Identifying all stakeholders who will be involved in developing and implementing an action plan.
• Identifying all assessment participation data that will be analyzed to understand assessment participation, including data for subgroup participation rates.
• Assessing data to identify root causes of low participation rates.
• Identifying strategies that fit school contexts and address their particular needs.
• Identifying a timeline and milestones for action plan implementation and monitoring.
An action plan template or guide can help state, district, and school staff systematically collect and analyze data that provide understanding of issues related to assessment participation and identify targeted strategies to improve assessment participation. States might consider how exist-ing communications and supports help their districts and states with communicating assessment purpose, participation requirements, and testing impact on students.
In their consolidated ESSA plans, states indicated how they will factor assessment participa-tion in school accountability designations, as well as proposed interventions to increase student assessment participation. Across ESSA plans, multiple states require districts and schools that do not test at least 95 percent of their students to develop and submit improvement plans (Edu-cation Week, 2017). These improvement plans are meant to help districts and schools analyze the reasons why participation rates fall below 95 percent and identify actions and supports that will be implemented to increase assessment participation. Multiple states also incorporate as-sessment participation into school accountability decisions; for schools that do not assess at least 95 percent of their students, this may be in the form of docking points from school grade or rating calculations or prohibiting schools from receiving the highest possible rating (see state examples). More information on states’ plans to address state assessment participation can be found in Table A-1 in Appendix A.
13NCEO
Examples of Strategies Several States Used to Address Assessment Participation
New Jersey, New York, and Washington SEA staff developed and disseminated action plan tem-plates for their schools to use in assessing their assessment participation rates. Each of these state resources walks stakeholders through the process of collecting relevant information about as-sessment participation, analyzing information, and identifying appropriate action steps to increase assessment participation rates.
New Jersey Guidance for Action Plan Development
The New Jersey Department of Education created a guidance document (n.d.) that walks stake-holders through the stages and considerations for establishing an action plan:
• Identify members for a team (e.g., teachers, administrators, counselors, parents, students) that will identify root causes of low assessment participation rate and develop an action plan that addresses these causes.
• Identify and review data that informs assessment participation patterns and possible barriers or challenges to participation.
• Use data analyses to identify specific actions and realistic timeframes for increasing assess-ment participation. Planning may also include borrowing ideas from other districts and states.
• Identify team members who can best communicate the action plan to stakeholder groups and bolster support from stakeholders.
• Develop a plan to monitor activities and make plan adjustments as needed. This also includes metrics for communicating and sharing the action plan with stakeholders.
New York State Action Plan Template and Resources
The New York State Department of Education (NYSED) outlines the following steps for schools that “persistently and substantially fail to the meet the 95% participation requirement” (New York State Department of Education, n.d.).
• School must conduct a participation rate self-assessment.
• School must develop a participation rate improvement plan that includes an analysis of the cause for low assessment participation and a list of potential strategies to address participation that the school will pursue in the following year.
• Any school that ranks in the bottom 10 percent of assessment participation statewide must submit its self-assessment and plan to the state commissioner of education for review and ap-proval.
To support district, public school, and charter school leaders, NYSED disseminated a memo detail-ing requirements for a Participation Rate Improvement Plan (PRIP) to identify specific steps and actions that schools will take to increase student assessment participation. The PRIP requires schools to provide context for why assessment participation rates were below 95 percent, identify the stakeholders who were consulted in the development of the PRIP, and the strategies and activi-ties that the school will implement to improve assessment participation. For support with stake-holder communication about state assessments and their purposes, the NYSED developed the Assessments Toolkit, which contains materials (e.g., informational letters, frequently asked ques-tions about state assessments) that can be adapted to communicate state assessment system information to different stakeholder groups.
14 NCEO
Washington School Improvement Plan Template
The Washington Office of Superintendent of Public Instruction (OSPI) (n.d.) developed a school improvement plan template that schools can use during the state’s Consolidated Program Review process to share the analysis of the assessment participation rate and actions that will be applied to increase the participation rate. The Consolidated Program Review process is used to monitor federally funded programs about their compliance with federal monitoring requirements. This OSPI template requires schools to identify all student groups that did not meet the 95 percent participa-tion rate requirement, the factors or causes underlying participation rates, and the strategies that will be implemented to increase participation. The template also includes an optional section to identify any supports that the school’s district will provide in increasing participation rates.
Conclusion
States are required to have policies that include all students in assessments used for state ac-countability. Most students participate in the general assessment with or without accommoda-tions; a limited number of students with the most significant cognitive disabilities participate in the AA-AAAS. Across states, there are some common challenges impacting states’ assessment participation rates. In some cases, these challenges may be due to resource and capacity chal-lenges that impact the states’ assessment administration. With the frequent use of digitally-based assessments for state testing systems, issues with equipment or connectivity can adversely impact students’ participation rates. The impact of equipment or connectivity challenges requires states to develop contingency plans that ensure technology issues are resolved. As part of the federal peer review requirements for assessments used for state accountability, states are required to submit evidence of established contingency plans to address possible technology challenges during test administration (U.S. Department of Education, 2018b). To support states, the Council of Chief State School Officers (2015) developed a report to help states identify different types of technology-related assessment interruptions, potential reporting and accountability implica-tions, and possible responses to attend to interruptions. This report guides states through ana-lyzing technology-related interruptions and making decisions regarding using associated data for reporting and accountability (e.g., invalidating scores, assigning caution to score analyses).
Assessment administration plans must also account for the possibility of accessibility issues that impact students’ ability to fully participate in and complete state assessments. This includes ensuring that the assessments are accessible to students with disabilities and English learners, including English with disabilities, and making sure that appropriate accommodations are available.
On an individual level, some students and families may choose to opt out of state testing, whether due to concerns about how assessment data may be used to evaluate students and their schools, concerns about the amount of school time devoted to testing, or other reasons (e.g., concerns
15NCEO
about students’ emotional responses to testing). For these stakeholders, states may need to revisit how their communication tools explain the state’s assessment system, its purpose, use, and goals. Are there clear and consistent state messages about why assessments are important for the learning process? Are state communication tools transparent about testing systems and how data collected from state assessments are used? Revisiting state communication tools may help to identify any areas where messaging about state testing needs to be clarified or refined to address stakeholder questions and concerns about testing.
To increase student participation in state testing and to maintain high participation rates, states may want to consider how their logistical plans and communication tools encourage participa-tion. To support districts and schools, states might consider:
• What messages do our districts and schools receive about our state’s testing system? How consistent is this messaging across stakeholders? How do our communication tools address different stakeholders’ understandings of our testing system?
• How do our communication tools explain accessibility features and accommodations avail-able to support all students participating in assessments?
• How transparent are our communication tools about state testing and how assessment data are used?
• How do we support our districts and schools in analyzing data to identify challenges reach-ing the 95 percent participation rate requirement?
• How do our state’s contingency plans help districts and schools in cases where technology or equipment challenges impact assessment administration?
• How can our state’s supports be used in different school contexts (e.g., in-person instruc-tion, remote instruction, hybrid instruction)? Are our supports adaptable to different school contexts?
Finally, throughout their communication with families, educators, students, and policymakers, states should consider emphasizing the importance of state tests, and how they support content standards, equity, and quality instruction.
16 NCEO
References
Alaska Department of Education and Early Development. (2016, November 18). Feds grant waiver for last year’s interrupted student assessments; Alaska will resume testing this spring. https://education.alaska.gov/news/releases/2016/Waiver2015-2016Assessments.pdf
Bennett, R. (2016). Opt out: An examination of issues. Education Testing Service Research Report Series.
Blad, E., & Ujifusa, A. (2021, April 7). Biden education department approves one request to cancel state tests but rejects others. Education Week.
Brown, E. (2016, April 14). Technical glitches plague computer-based standardized tests nationwide. Washington Post. https://www.washingtonpost.com/local/education/technical-glitches-plague-computer-based-standardized-tests-nationwide/2016/04/13/21178c7e-019c-11e6-9203-7b8670959b88_story.html
California Teachers Association. (n.d.). Opt out of testing. https://www.cta.org/our-advocacy/opt-out-of-standardized-testing
Center on Standards and Assessment Implementation. (2016). Assessment opt-out. https://csaa.wested.org/resource/assessment-opt-out/
Center on Standards and Assessment Implementation. (2017). Accountability requirements for subgroups of students. https://csaa.wested.org/resource/accountability-requirements-for-subgroups-of-students/
Council of Chief State School Officers. (2015). Recommendations for addressing the impact of test administration interruptions and irregularities. Council of Chief State School Officers.
Dahlstrom-Hakki, I. H., Alstad, Z. G., & Reed, D. K. (2019). Challenges assessing the con-ceptual understanding of students with disabilities in statistics. Learning Disability Quarterly, 42(3), 175–185.
Davis, J. & Martin, D. B. (2018). Racism, assessment, and instructional practices: Implications for mathematics teachers of African American students. Journal of Urban Mathematics Educa-tion, 11(1–2), 45–68.
Donaldson, E. (2021, March 1). Texas students can only take STAAR tests in person. These families plan to opt out. The Dallas Morning News.
17NCEO
Education Commission of the States. (2020, June 25). State information request: COVID-19 assessment and accountability pauses. https://www.ecs.org/state-information-request-covid-19-assessment-and-accountability-pauses/
Education Week. (2017, April 19). Approved ESSA plans: Explainer and key takeaways from each state. https://www.edweek.org/policy-politics/approved-essa-plans-explainer-and-key-takeaways-from-each-state
Gonzales, J. (2019, April 4). Gov. Bill Lee: Tennessee will return to paper-based TNReady tests in the 2019–20 school year. The Tennessean.
Guidry, L. (2021, April 25). With many students still virtual, some are opting out of in-person state testing. Lafayette Daily Advertiser.
Howell, C. (2021, April 29). State students’ exams totaled at 1.2 million. Arkansas Democrat Gazette.
Lazarus, S., Goldstone, L., Wheeler, T., Paul, J., Prestridge, S., Sharp, T. Hochstetter, A., Warren, S. (2021). CCSSO accessibility manual: How to select, administer, and evaluate use of accessibility supports for instruction and assessment of all students. Council of Chief State School Officers (CCSSO).
Lorenzo, S. (2015). Opt out policies by state. National Association of State Boards of Educa-tion Policy Update, 22(6).
Marion, S. (2021, January 5). One-sided “advice” on remote test administration isn’t fair to states. Center for Assessment. https://www.nciea.org/blog/educational-assessment/one-sided-advice-remote-test-administration-isnt-fair-states
Milliard, T. (2015, April 15). Common core testing crashes in Nevada. Reno Gazette Journal.
Murphy, J. (2019, April 2). State cancels computer-based testing Wednesday due to software glitch. Democrat & Chronicle.
National Academy of Education. (2021, February). Educational assessments in the COVID-19 era and beyond. https://naeducation.org/wp-content/uploads/2021/02/Educational-Assessments-in-the-COVID-19-Era-and-Beyond.pdf
National Center for Education Statistics. (n.d.). Table 2.22. Administration of computer-based assessments in English language arts (ELA) and mathematics in grades 4 and 8, school year when state transitioned to the administration of computer-based assessments, and availability of a paper and pencil option. https://nces.ed.gov/programs/statereform/tab2_22.asp
18 NCEO
National Center for Fair and Open Testing. (2020, December 2). National call to suspend high-stakes testing in spring 2021. https://www.fairtest.org/national-call-suspend-highstakes-testing-spring-20
National Center on Education Outcomes & Center on Standards and Assessment Implementa-tion. (2018). Proceedings of the 1% cap national convening: Supporting states in implementing ESSA’s 1% state-level cap on participation of students in the AA-AAAS. National Center on Educational Outcomes. https://nceo.umn.edu/docs/OnlinePubs/NCEO_CSAI_CapProceedings_508compliance_042619.pdf
New Jersey Department of Education. (n.d.). Meeting participation targets for New Jersey state assessments: Action plan development guide. https://www.state.nj.us/education/title1/account-ability/progress/15/ActionPlan.pdf
New York State Education Department. (n.d.). Additional things every stakeholder should know about student participation in statewide assessments under the every student succeeds act (ESSA). http://www.p12.nysed.gov/assessment/ei/2018/2018-additional-information-assessments-essa.pdf
New York State Department of Education. (n.d.). Assessments toolkit. http://www.nysed.gov/assessments-toolkit
Office of Elementary and Secondary Education, U.S. Department of Education. (n.d.). State requests for waivers for ESEA provisions for SSA-administered programs. https://oese.ed.gov/offices/office-of-formula-grants/school-support-and-accountability/essa-state-plans-assessment-waivers/
Pizmony-Levy, O., & Green Saraisky, N. (2016). Who opts out and why? Results from a na-tional survey on option out of standardized tests. Research Report. Teachers College, Columbia University.
Ryan, E. (2019, July 11). Three ways to better engage students to get the most from educational assessments. NWEA. https://www.nwea.org/blog/2019/three-ways-to-better-engage-students-to-get-the-most-from-educational-assessments/
Sawchuk, S. (2016, January 5). ESSA loosens reins on teacher evaluations, qualifications. Education Week.
Stone, E., & Davey, T. (2011). Computer-adaptive testing for students with disabilities: A review of the literature. Educational Testing Service.
19NCEO
Ujifusa, A. (2021, April 23). Biden administration’s level of tolerance for cutting standardized tests comes into focus. Education Week.
U.S. Department of Education. (2016). Every student succeeds act accountability, state plans, and data reporting: summary of final regulations. https://www2.ed.gov/policy/elsec/leg/essa/essafactsheet1127.pdf
U.S. Department of Education. (2017a). Every student succeeds act assessments under title I, part a & title I, part b: Summary of final regulations. https://www2.ed.gov/policy/elsec/leg/essa/essaassessmentfactsheet1207.pdf
U.S. Department of Education. (2017b). Requirements for the cap on the percentage of students who may be assessed with an alternate assessment aligned with alternate academic achieve-ment standards. https://www2.ed.gov/admins/lead/account/saa/onepercentcapmemo51617.pdf
U.S. Department of Education. (2018a). Additional information regarding the requirements to request a waiver from the one percent cap on the percentage of students who may be assessed with an alternate assessment aligned with alternate academic achievement standards (AA-AAAS). https://oese.ed.gov/files/2020/02/ossstateassessmentltr.pdf
U.S. Department of Education. (2018b). A state’s guide to the U.S. Department of Education’s assessment peer review process. https://www2.ed.gov/admins/lead/account/saa/assessmentpeer-review.pdf
U.S. Department of Education. (2019). Opportunities and responsibilities for state and local report cards under the elementary and secondary education act of 1965, as amended by the every student succeeds act. https://www2.ed.gov/policy/elsec/leg/essa/report-card-guidance-final.pdf
United State Department of Education. (2020, June 9). Additional information regarding the requirements to request a waiver for the 2020–21 (SY) from the one percent cap on the per-centage of students with the most significant cognitive disabilities who may be assessed with an alternate assessment aligned with alternate academic achievement standards (AA-AAAS). https://sites.ed.gov/idea/files/osep-oese-letter-to-state-directors-06-09-2020.pdf
U.S. Department of Education. (2021, February 22). Chief state school officers letter. https://oese.ed.gov/files/2021/02/DCL-on-assessments-and-acct-final.pdf
Walker, M. A. (2016, September 3). State testing trips over technology troubles. The Atlanta Journal-Constitution.
Washington Office of Superintendent of Public Instruction. (n.d.). School improvement plan summary: 95% participation rate on state assessments. https://www.k12.wa.us/sites/default/
20 NCEO
files/public/consolidatedreview/pubdocs/95%20Percent%20Participation%20Rate%20SIP%20Summary%202020.docx
Zavadsky, H., Berry, T., & Savage, T. (2017). BSCP Center Strategic Communication Toolbox. Building State Capacity and Productivity Center at Westat.
21NCEO
Appendix A
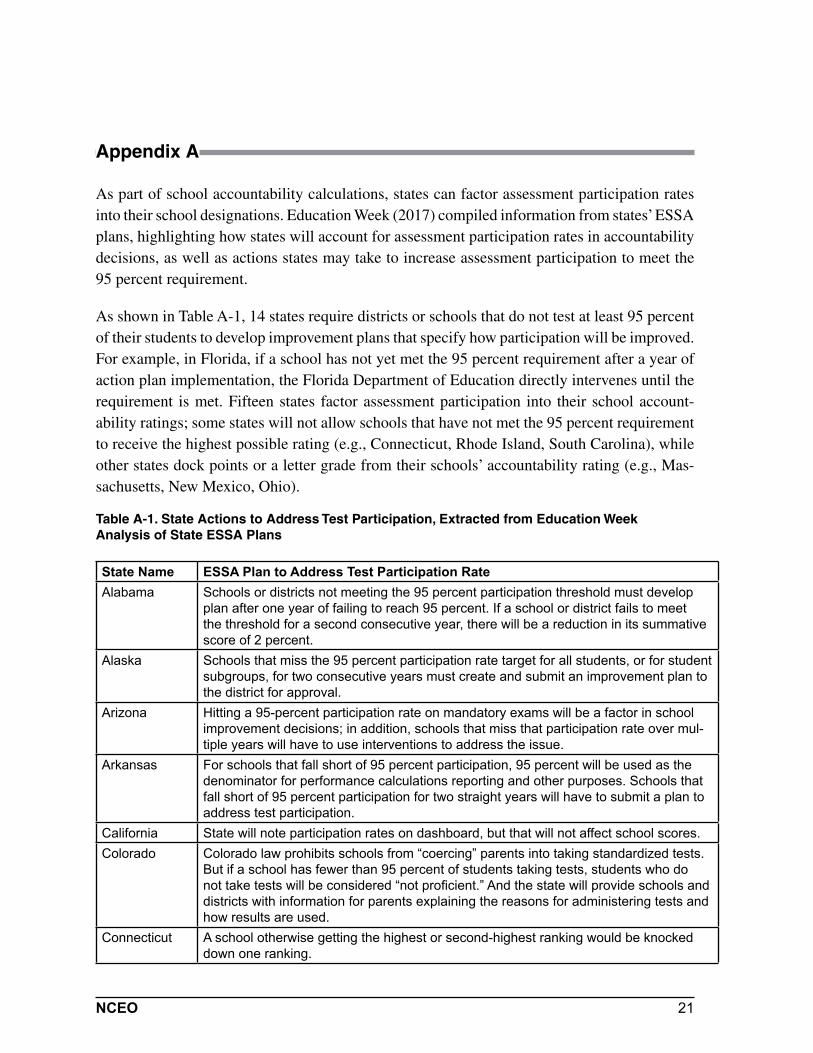
As part of school accountability calculations, states can factor assessment participation rates into their school designations. Education Week (2017) compiled information from states’ ESSA plans, highlighting how states will account for assessment participation rates in accountability decisions, as well as actions states may take to increase assessment participation to meet the 95 percent requirement.
As shown in Table A-1, 14 states require districts or schools that do not test at least 95 percent of their students to develop improvement plans that specify how participation will be improved. For example, in Florida, if a school has not yet met the 95 percent requirement after a year of action plan implementation, the Florida Department of Education directly intervenes until the requirement is met. Fifteen states factor assessment participation into their school account-ability ratings; some states will not allow schools that have not met the 95 percent requirement to receive the highest possible rating (e.g., Connecticut, Rhode Island, South Carolina), while other states dock points or a letter grade from their schools’ accountability rating (e.g., Mas-sachusetts, New Mexico, Ohio).
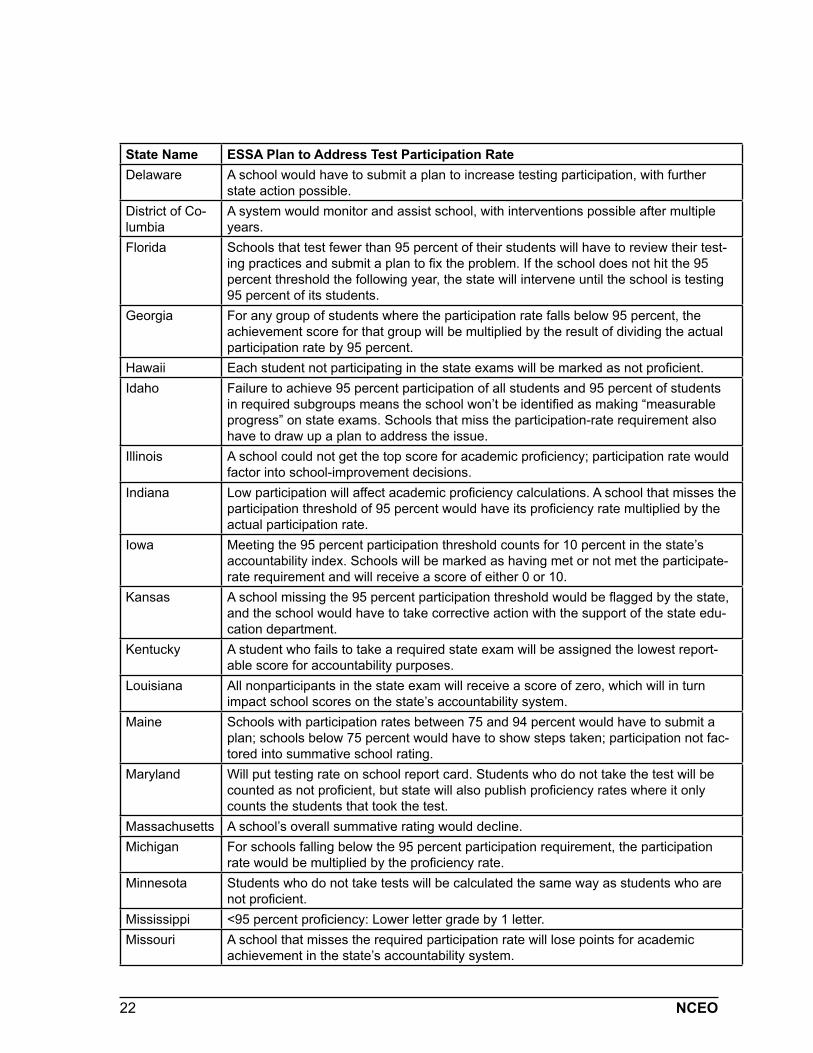
Table A-1. State Actions to Address Test Participation, Extracted from Education Week Analysis of State ESSA Plans
State Name ESSA Plan to Address Test Participation RateAlabama Schools or districts not meeting the 95 percent participation threshold must develop
plan after one year of failing to reach 95 percent. If a school or district fails to meet the threshold for a second consecutive year, there will be a reduction in its summative score of 2 percent.
Alaska Schools that miss the 95 percent participation rate target for all students, or for student subgroups, for two consecutive years must create and submit an improvement plan to the district for approval.
Arizona Hitting a 95-percent participation rate on mandatory exams will be a factor in school improvement decisions; in addition, schools that miss that participation rate over mul-tiple years will have to use interventions to address the issue.
Arkansas For schools that fall short of 95 percent participation, 95 percent will be used as the denominator for performance calculations reporting and other purposes. Schools that fall short of 95 percent participation for two straight years will have to submit a plan to address test participation.
California State will note participation rates on dashboard, but that will not affect school scores.Colorado Colorado law prohibits schools from “coercing” parents into taking standardized tests.
But if a school has fewer than 95 percent of students taking tests, students who do not take tests will be considered “not proficient.” And the state will provide schools and districts with information for parents explaining the reasons for administering tests and how results are used.
Connecticut A school otherwise getting the highest or second-highest ranking would be knocked down one ranking.
22 NCEO
State Name ESSA Plan to Address Test Participation RateDelaware A school would have to submit a plan to increase testing participation, with further
state action possible.District of Co-lumbia
A system would monitor and assist school, with interventions possible after multiple years.
Florida Schools that test fewer than 95 percent of their students will have to review their test-ing practices and submit a plan to fix the problem. If the school does not hit the 95 percent threshold the following year, the state will intervene until the school is testing 95 percent of its students.
Georgia For any group of students where the participation rate falls below 95 percent, the achievement score for that group will be multiplied by the result of dividing the actual participation rate by 95 percent.
Hawaii Each student not participating in the state exams will be marked as not proficient.Idaho Failure to achieve 95 percent participation of all students and 95 percent of students
in required subgroups means the school won’t be identified as making “measurable progress” on state exams. Schools that miss the participation-rate requirement also have to draw up a plan to address the issue.
Illinois A school could not get the top score for academic proficiency; participation rate would factor into school-improvement decisions.
Indiana Low participation will affect academic proficiency calculations. A school that misses the participation threshold of 95 percent would have its proficiency rate multiplied by the actual participation rate.
Iowa Meeting the 95 percent participation threshold counts for 10 percent in the state’s accountability index. Schools will be marked as having met or not met the participate-rate requirement and will receive a score of either 0 or 10.
Kansas A school missing the 95 percent participation threshold would be flagged by the state, and the school would have to take corrective action with the support of the state edu-cation department.
Kentucky A student who fails to take a required state exam will be assigned the lowest report-able score for accountability purposes.
Louisiana All nonparticipants in the state exam will receive a score of zero, which will in turn impact school scores on the state’s accountability system.
Maine Schools with participation rates between 75 and 94 percent would have to submit a plan; schools below 75 percent would have to show steps taken; participation not fac-tored into summative school rating.
Maryland Will put testing rate on school report card. Students who do not take the test will be counted as not proficient, but state will also publish proficiency rates where it only counts the students that took the test.
Massachusetts A school’s overall summative rating would decline.Michigan For schools falling below the 95 percent participation requirement, the participation
rate would be multiplied by the proficiency rate.Minnesota Students who do not take tests will be calculated the same way as students who are
not proficient.Mississippi <95 percent proficiency: Lower letter grade by 1 letter.Missouri A school that misses the required participation rate will lose points for academic
achievement in the state’s accountability system.
23NCEO
State Name ESSA Plan to Address Test Participation RateMontana Students that do not take tests will be assigned the lowest average score for each
missing measure.Nebraska A school that fails to test 95 percent of students on state exams will see its school rat-
ing drop. Specifically, a school that tests between 90 and 95 percent of students will drop by one rating, and a school that tests less than 90 percent of students will drop by two ratings. A school that tests less than 85 percent of students will get the lowest possible rating.
Nevada A school failing to meet the 95 percent threshold would initially be labeled with a “warning,” then subject to increasing penalties after multiple years.
New Hamp-shire
Will note on state report card if a school’s participation in tests falls below 95 percent.
New Jersey As ESSA requires, each student at the school causing a participation rate below 95 percent would be scored not proficient.
New Mexico A school will have its A-F grade decrease by one letter if 95 percent of students do not take the state English/language arts or math test.
New York Schools and districts where test participation continuously falls below 95 percent need to come up with a plan to address the issue. Schools that fall in the bottom 10 percent of test participation in the state will need to come up with a plan to address the issue and get it approved by the state. Additional steps will be taken if the plan does not improve test participation.
North Carolina If a school misses the 95 percent participation threshold, the plan says that “the greater of either 95 percent of the subgroup or the number of students in the subgroup participating in the assessment will, for the purposes of measuring, calculating and reporting, be the denominator.”
North Dakota A school or district where test participation fell below 95 percent would be labeled as having insufficient participation and would be required to implement a plan to improve its test participation.
Ohio If a subgroup at a school fails to meet the 95 percent participation threshold, the school’s grade will be reduced by one letter.
Oklahoma Test participation that drops below 95 percent will be incorporated into the school’s academic achievement indicator.
Oregon Schools where one or more student groups fail to hit 95 percent participation have to develop a plan to improve participation rates; Oregon law allows parents to opt their children out of these tests for any reason.
Pennsylvania Participation rate will be published on report cards. Schools with less than 95 percent participation will be required to submit improvement plan. Schools and districts may also need to undergo an assessment audit.
Puerto Rico The participation rate for exams will be included in the school quality indicator for ac-countability purposes.
Rhode Island Schools with less than 95 percent participation will have this noted on report cards. Districts must submit a plan for corrective action. If the “all students” group misses this target, it will not be eligible for a five-star rating. A low participation rate will also affect a school’s academic proficiency calculation.
South Carolina Schools that miss the 95 percent participation threshold cannot get the highest overall rating, or highest rating for academic achievement. They also have to adopt a plan to increase test participation.
24 NCEO
State Name ESSA Plan to Address Test Participation RateSouth Dakota A school with less than 95 percent participation will affect its academic proficiency
calculation.Tennessee A school would get an F grade on the relevant indicator for all student groups not
reaching 95 percent participation.Texas Less than 95 percent participation affects a school’s academic proficiency calculation.Utah Will publish participation rates on report card; per ESSA’s requirement, the state will
also count non-tested students in excess of 5 percent as nonproficient.Vermont School’s initial summative score would be multiplied by the percentage of students
who took the exam.Virginia A school must develop a plan if school fails to reach 95 percent participation rate. After
three years, must undertake unspecified “additional actions and interventions.”Washington Participation rate will impact proficiency rate calculation. A school with less than 95
percent participation must be addressed in school improvement plan and such a school will not receive awards based on accountability performance. After three years below the threshold, a school’s accountability rating will drop a step.
West Virginia Nonparticipants up to 95 percent of the students that should have been tested are retained in both the numerator and denominator of the calculation. In the numerator, however, they are assigned zero academic performance points and do not contribute positively to a schools’ performance determination.
Wisconsin Achievement calculations will be based upon the higher of 95 percent of students ex-pected to participate or the number of students tested in excess of 95 percent.
Wyoming Non-participants in excess of 5 percent at a school are counted as “not proficient” on the state assessment. This will be included in the achievement indicator.

NCEO is an affiliated center of the Institute on Community Integration