Embed Size (px)
Citation preview

Sourcing perspective from Russia
Global Sourcing, Local successGlobal Sourcing, Local successEindhoven 15Eindhoven 15thth of October of October

2
Emerging markets – leveraging our brand franchise and global reach
• Capitalize on our China legacy and heritage
• Leverage the brand and drive profitable growth in India
• Pursue opportunities in high growth countries ranging from Indonesia to Vietnam
• Capture the opportunities in Brazil as the leading economy in Latin America
• Stay connected to the Russian market for future potential
• SESA* partnership with UN/governments– Safe and reliable lighting solutions – higher-quality light – renewable or mechanical energy– cost-competitive with fuel-based lamps – payback 6-12 months, target is 3-6 months.
* SESA; Sustainable Energy Solutions for Africa
Capture the growth opportunities in Middle East, Russia, Asia and LATAM
Design compelling value propositions forDeveloping Economies

Agenda
EE regional development trends.
EE & Russia business outlook in 2009.
Sourcing perspective from Russia
Summary

4
C EE ( EE: Russia & Ukraine, Belarus)

5
Pre-transitional Transitional Convergence
•Economic contraction
•Balance of payment crisis
•Soaring inflation
•Non EU member.Tighter fiscal and monetary policy•Inflation/ exchange rates / managed exch. rate regimes•Governmental support
•EU members.•Rising living standards•Inflation•Linearization completed•Private sector dominates•Debt maturities lengthen•Access to international capital markets
Unattractive Attractive Maturing
Source: EIU
Attractiveness curve

Gross domestic product (GDP) at current market pricesin US$ million (selected countries)
Source: EIU 2009
Average Cost of Labor per hour in US$ Consumer Prices (% change pa ; av) (Inflation)
Average cost of labor in EE will reach China's level in 2010

Source: EIU 2009
Exchange Rates (local currency per US$)
Exchange rate change in EE might require further product localization to have natural hedging in local currencies

Business sales trends by sector and region in 2005-09Average annual sales growth by region and sector(best-case scenarios for 2009, %)
Source: EIU 2009The key global business trends in 2009-10
Consumer confidence will be hit as unemployment rises, house prices collapse and credit becomes scarcer and more expensive. Personal asset values have crumbled. People will save more and spend less to get their own personal balance sheets in order and they won’t have access to loans to refinance debt. In the developed West we have:⇒ Weak credit outlook + poor consumer confidence = weak business outlookIn emerging markets we have:⇒ Blocked and weak credit outlook + moderate but slowing consumer demand = weaker businessoutlook
Business trends in Emerging Market are positive

European Business Expansion 2009-2013
SOURCE: Cushman & Wakefield “EUROPEAN CITIES MONITOR”, 2009
Within the next 5 years Warsaw, Moscow and Bucharest expected tosee the greatest FDI influx
• In 2009 GDP will grow 4-5% in emerging markets (thanks a lot to China and India) and fall in the major developed markets by minus 4%
• In 2010 emerging markets will grow 3% to 5.5% while developed ones will struggle at zero to 1.0%
• In later years 2011-2014 emerging markets grow +5-6%, developed ones +2.0%
• It is no longer the case that if you downgrade US GDP by 1% then emerging markets go down 2.5%.
• In a curious way decoupling has taken place when we thought this decoupling model was in doubt
EM – GDP difference
• Sales growth will come from emerging markets – this is the story of last 5 years and next 50 years
• Western markets are big volume, low growth and emerging markets are low volume, big growth – but the volume is starting to get interesting in several of them
• By 2006-7 --- 40% of Unilever sales were coming from emerging markets
– 32% of DuPont sales stem from thee markets– 22% of global sales for P&G but 38% of global sales growth– 38% of HSBC growth and 80% of Nokia’s sales growth
• These proportions will continue during the crisis and rise later
EM -the sales difference
Agenda
Eastern Europe Sourcing Group Philips Lighting, October 2009
EE regional development trends.
EE & Russia business outlook in 2009.
Sourcing perspective from Russia
Summary

14
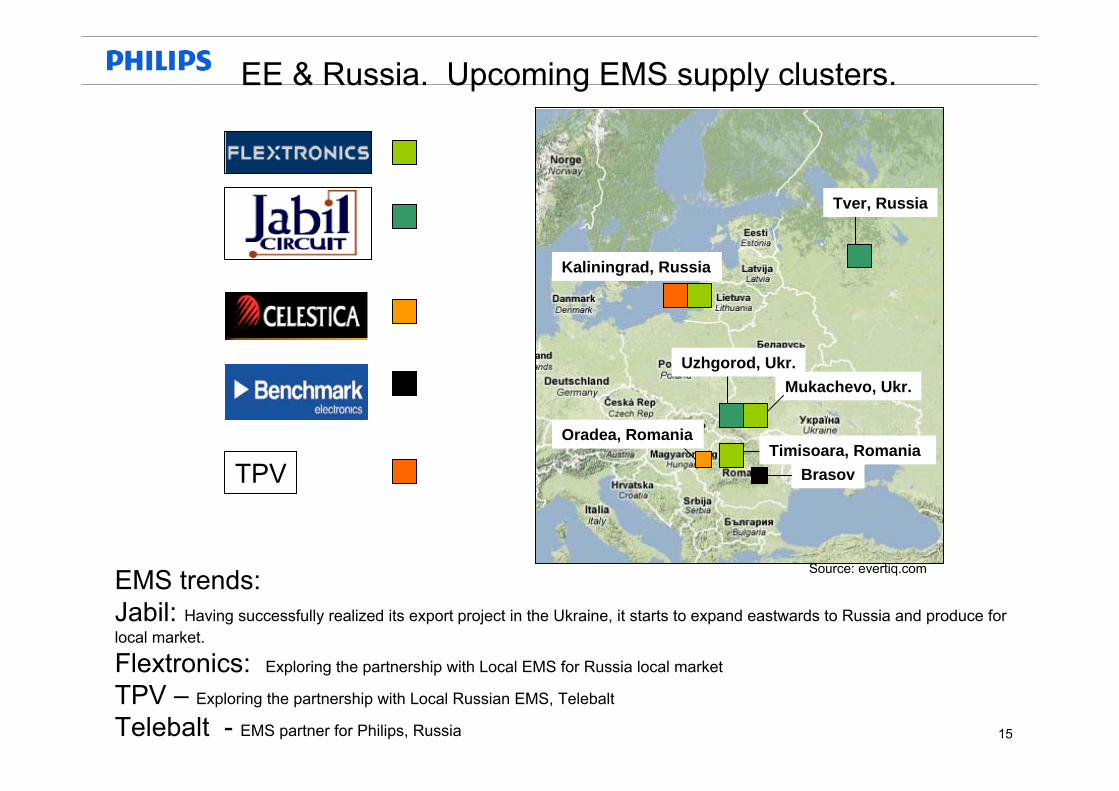
EE- key trend and developmentSupply clusters
I - export oriented: EU members Romania, Slovakia, Czech, Poland, Bulgaria, Hungary; Ukraine; Belarus ( governmental directives)
II – Mixed orientation:-Export orientated : Energy and Raw materials; -Domestic oriented economies : Russia (local for local for finish goods). Potential characteristics: growth of localization level- Import duties for finished good up to 20% ; import quotas might be installed as well.-economic free zones for export and domestic market
Russia, Belarus, Kazakhstan intend to build up separate trade zone since 2010
15
Mukachevo, Ukr.
Oradea, Romania
Brasov
Uzhgorod, Ukr.
Source: evertiq.com
Tver, Russia
Timisoara, Romania
EMS trends:Jabil: Having successfully realized its export project in the Ukraine, it starts to expand eastwards to Russia and produce for local market.
Flextronics: Exploring the partnership with Local EMS for Russia local market
TPV – Exploring the partnership with Local Russian EMS, Telebalt
Telebalt - EMS partner for Philips, Russia
TPV
Kaliningrad, Russia
EE & Russia. Upcoming EMS supply clusters.

16
1 truck day
2 truck days
3 truck days
Uzhgorod is located close to two EU-borders:Hungary ± 20kmSlovakia ± 5km
Turkey solution for any customer
Material supply through Jabil Consolidation Center in Polgar (Hungary) operated by K&N – 140 km from Uzhgorod.
Average EU border crossing time – 4 hours.
Customs clearance direct on the plant through dedicated customs staff 8:00-20:00.
Product delivery through JCC in Polgar (HU) to any place in the world using local and global logistics service providers (trucking, air) depending on the customer requirements.
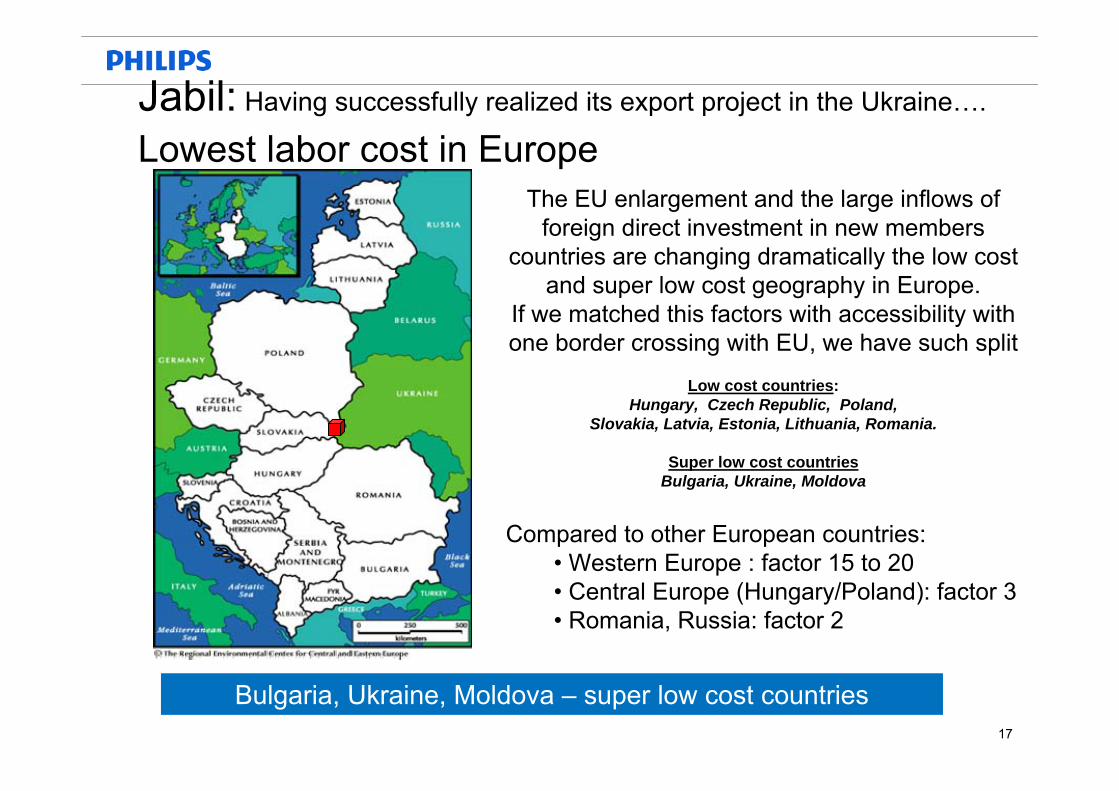
Jabil: Having successfully realized its export project in the Ukraine….
Trans Carpathian Region – Logistics, TurnKey Solution
Trans Carpathian Region – bring cost benefits next to Logistics advantage
17
The EU enlargement and the large inflows of foreign direct investment in new members
countries are changing dramatically the low cost and super low cost geography in Europe.
If we matched this factors with accessibility with one border crossing with EU, we have such split
Low cost countries: Hungary, Czech Republic, Poland,
Slovakia, Latvia, Estonia, Lithuania, Romania.
Super low cost countriesBulgaria, Ukraine, Moldova
Compared to other European countries:• Western Europe : factor 15 to 20• Central Europe (Hungary/Poland): factor 3• Romania, Russia: factor 2
Jabil: Having successfully realized its export project in the Ukraine….
Lowest labor cost in Europe
Bulgaria, Ukraine, Moldova – super low cost countries
18
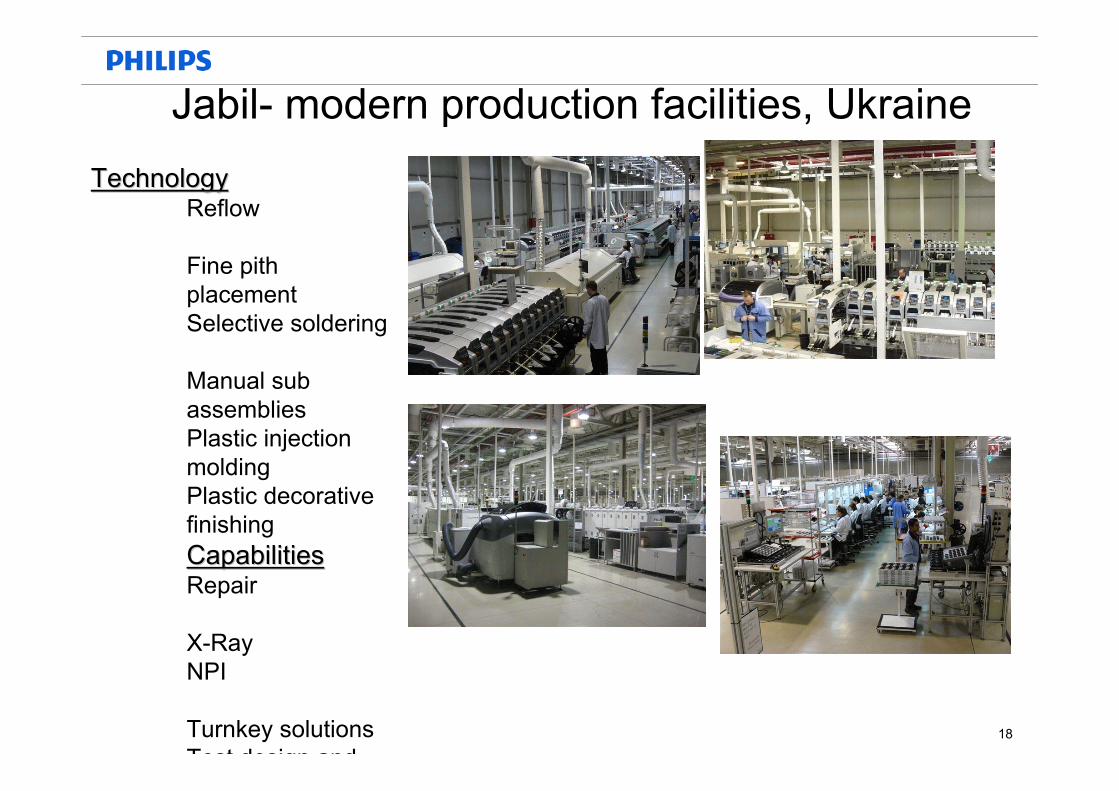
Jabil- modern production facilities, Ukraine TechnologyTechnology
Reflow
Fine pith placementSelective soldering
Manual sub assembliesPlastic injection moldingPlastic decorative finishingCapabilitiesCapabilitiesRepair
X-RayNPI
Turnkey solutionsTest design and
19
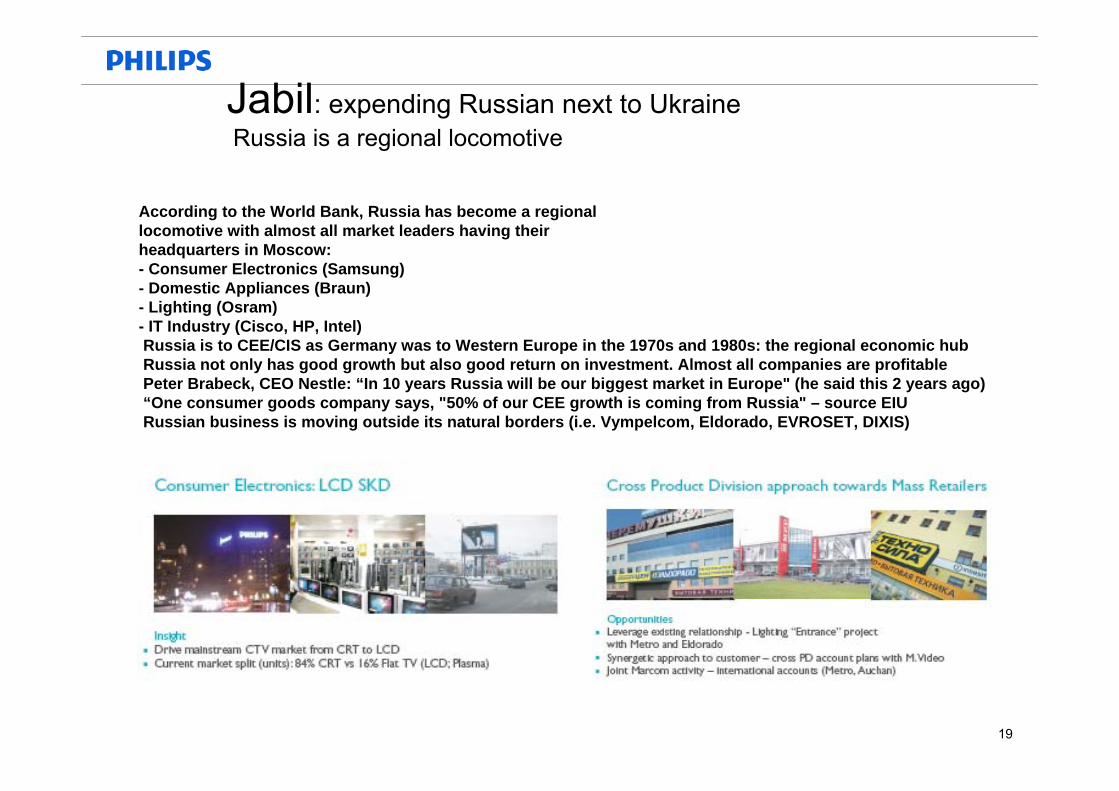
According to the World Bank, Russia has become a regionallocomotive with almost all market leaders having theirheadquarters in Moscow:- Consumer Electronics (Samsung)- Domestic Appliances (Braun)- Lighting (Osram)- IT Industry (Cisco, HP, Intel)Russia is to CEE/CIS as Germany was to Western Europe in the 1970s and 1980s: the regional economic hubRussia not only has good growth but also good return on investment. Almost all companies are profitablePeter Brabeck, CEO Nestle: “In 10 years Russia will be our biggest market in Europe" (he said this 2 years ago)“One consumer goods company says, "50% of our CEE growth is coming from Russia" – source EIURussian business is moving outside its natural borders (i.e. Vympelcom, Eldorado, EVROSET, DIXIS)
Jabil: expending Russian next to UkraineRussia is a regional locomotive

20
Factory Outside Russia 15% import duty
(Panel, ROM, AV, Profit)
Parts And
ComponentsJabil factory
RussiaWarehouse
0% import duty panel8,8% duty for ROM0% when ROM localized
Finished product import
Mainland Russia local production
Russia Warehouse
Business case scenarios 32” PFL-TV set 1) Finished product import from other Eastern Europe factories2) Production in Mainland Russia ( based on the customer request)
Jabil: expending Russian trade zone next to UkraineLocalization in Russia is to avoid duty impact
Tver, Russia
Import duties and lead-time ( time to market) are one of the key drivers to localize in Russia
Cogs index 100
Cogs index 93
Cogs index 85
Agenda
EE regional development trends. BRIC 2009-2011
EE & Russia business outlook in 2009.
Sourcing perspective from Russia
Summary

Moscow
Major industries
1. Energy, utilities & miningThe general tendency for the first nine months of 2008 was for oil export revenues to continue to go up, while exportvolumes decreased slightly. In the first nine months of 2008, Russia reduced oil exports to 166 million tonnes, or by 6.5%year–on-year. Oil export revenues rose by 62.5% to USD 125 billion.
2. MetallurgyAlong with oil and gas, metallurgy plays a key role in Russia’s economy. Metals and metal products make up the second-
largest commodity group in Russian exports. Russian iron and steel account for 51.9% of the European metals and mining industry’s value.
Year-on-year growth for metals and metal products in the first nine months of 2008 was 1.5%. In the same period, Russia produced 40.2 million tones of cast iron and ferrous alloys (4.4% year-on-year growth) and 56.8 million tonnes of steel (5% year-on-year growth). The leading players of Russia’s nonferrous sector are RUSAL, UMMC, Norilsk Nickel, and VSMPO-AVISMA.
3. Retail & consumerRussian retailing is experiencing explosive growth as rapidly rising real wages and disposable incomes drive personal
consumption. Retailers require financing for both consolidation and for expansion into the regions outside Moscow and St. Petersburg. In 2008, Russia was ranked the third most attractive retail market in the Global Retail Development Index. However, personal consumption is expected to decline as a result of the economic downturn, creating new challenges for retail in Russia. The retail industry’s turnover in 2008 was around USD 561 billion
4. ManufacturingAnother attractive sector as financing is required for both increases in capacity and modernization and upgrading offacilities. In more developed markets, operational gains often come from cost cutting measures, while in Russia the majorchallenges are frequently coping with growth and with upgrading technology.
5. Automotive sector ( growth rate #1 in Europe)The Russian government has offered tax breaks to companies that start major assembly lines in Russia. Ford, Renault, GM,
Toyota, Volkswagen, KIA, Great Wall, Hyundai, Fiat, Ssang Yong, Hyundai, Fiat, Isuzu and others are already assembled in Russia. Suzuki, Nissan, Peugeot Citroen, Mitsubishi and others are building factories or have announced plans to set up assembly plants in Russia. An influx of foreign car component manufacturers in the next few years is expected. Practically the same tax breaks are being offered to large-scale car component producers.
Russia business outlook in 2009. Investments, projects, companies
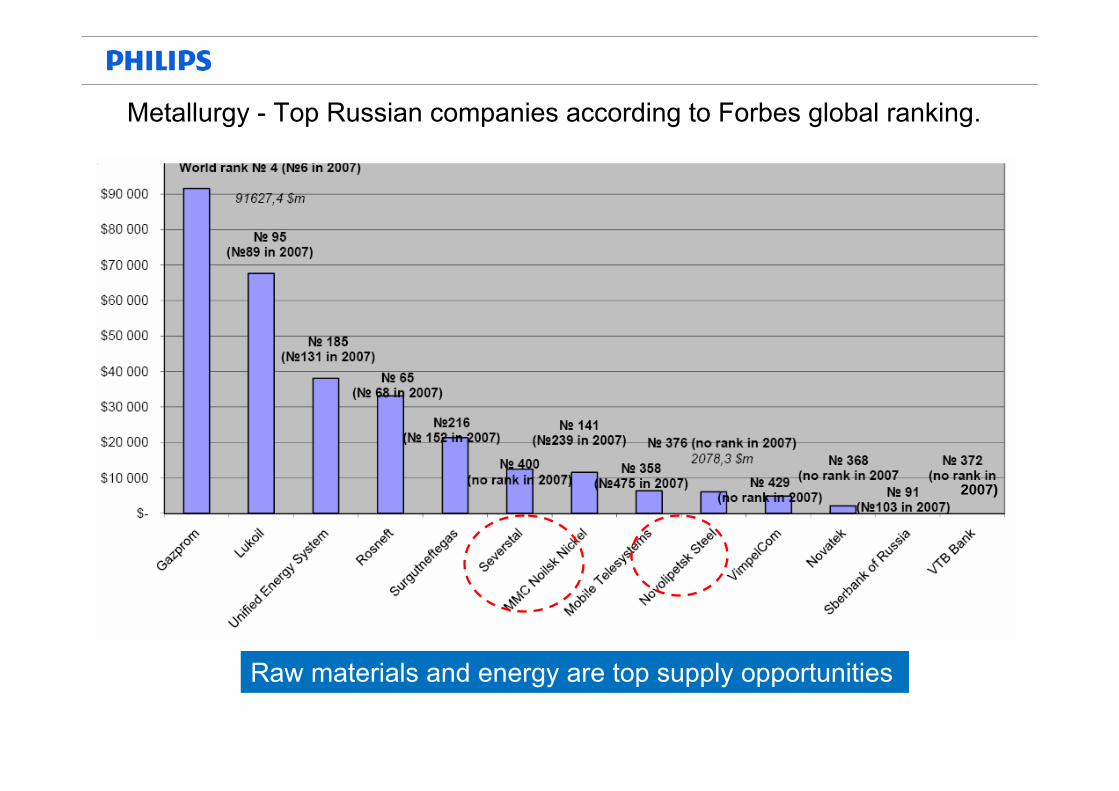
Metallurgy - Top Russian companies according to Forbes global ranking.
2007)
Raw materials and energy are top supply opportunities

24Steel - cost curves
• Estimated cost curve in 2009 (right) for HR steel more flat and much lower than estimated cost curve 2008 (left)
• Current HRC prices €365/tonne in Europe, $473/tonne in USA, $410/tonne in Far East and $468/tonne in China
• Cost estimations with pricing assumptions scrap, iron ore and coking coal of -37%, -30% and -55% 2009 vs. 2008.
Source: JP Morgan Steel, March 2009
Steel - cost curve
25
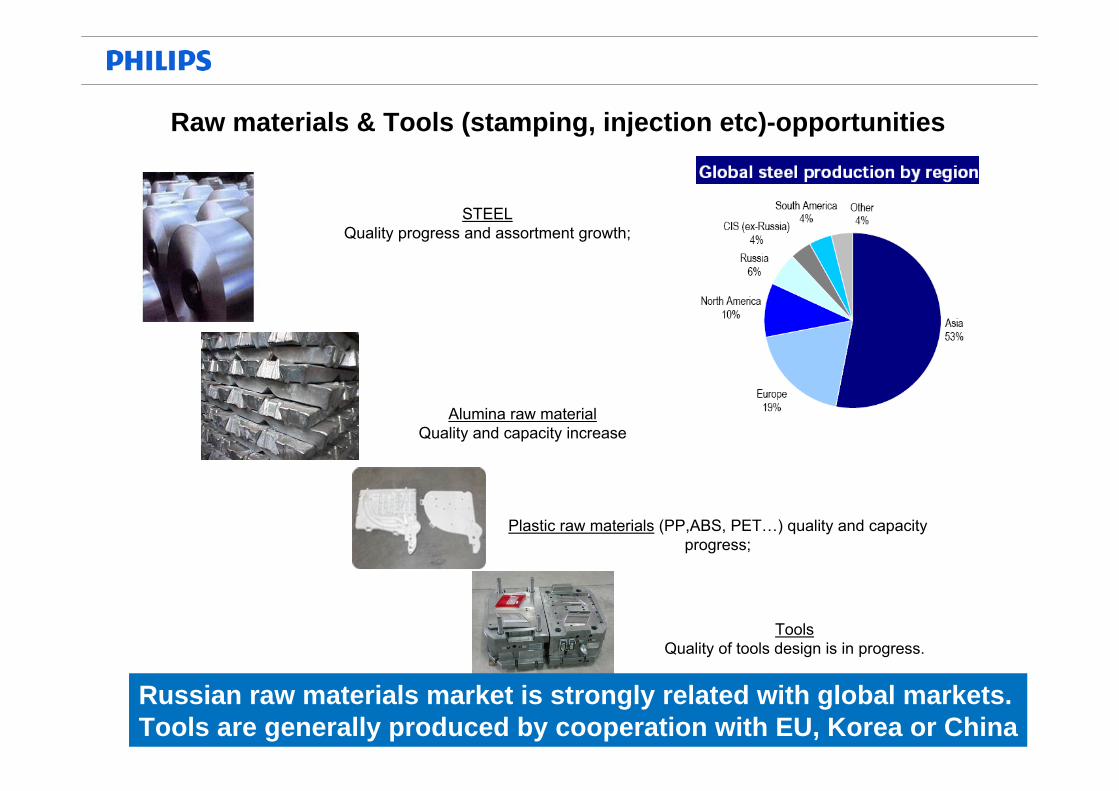
STEELQuality progress and assortment growth;
Alumina raw materialQuality and capacity increase
Plastic raw materials (PP,ABS, PET…) quality and capacity progress;
ToolsQuality of tools design is in progress.
Raw materials & Tools (stamping, injection etc)-opportunities
Russian raw materials market is strongly related with global markets.Tools are generally produced by cooperation with EU, Korea or China

26
Small stamping parts (Watch factories-Moscow &Yaroslavl) -parts for medical cardio stimulators
Small stamping parts ( Ural area) - parts for air jets &satellite connectors
stamping parts (Plast IK -Samara) -parts for LADA cars
Big stamping parts (INTERCOS-Saint –Petersburg area) - parts for Boeing air jets,
washing machine housings
Stamping parts samples from different regions
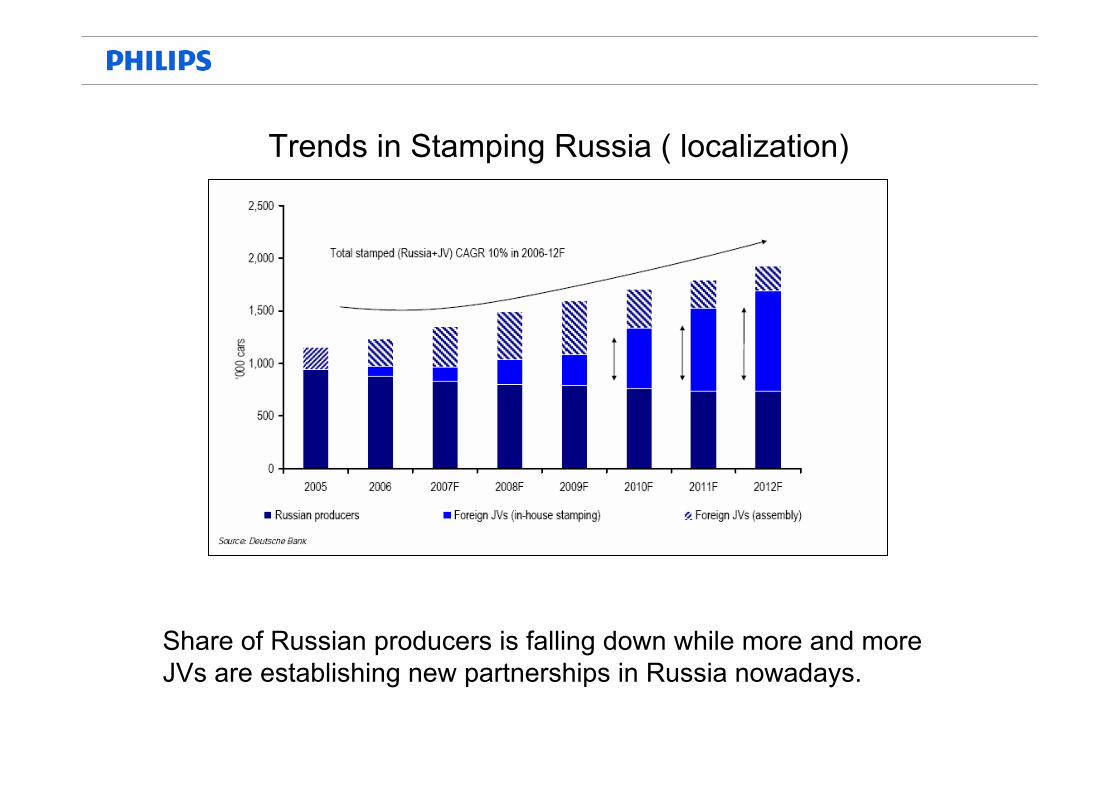
Trends in Stamping Russia ( localization)
Share of Russian producers is falling down while more and moreJVs are establishing new partnerships in Russia nowadays.
28
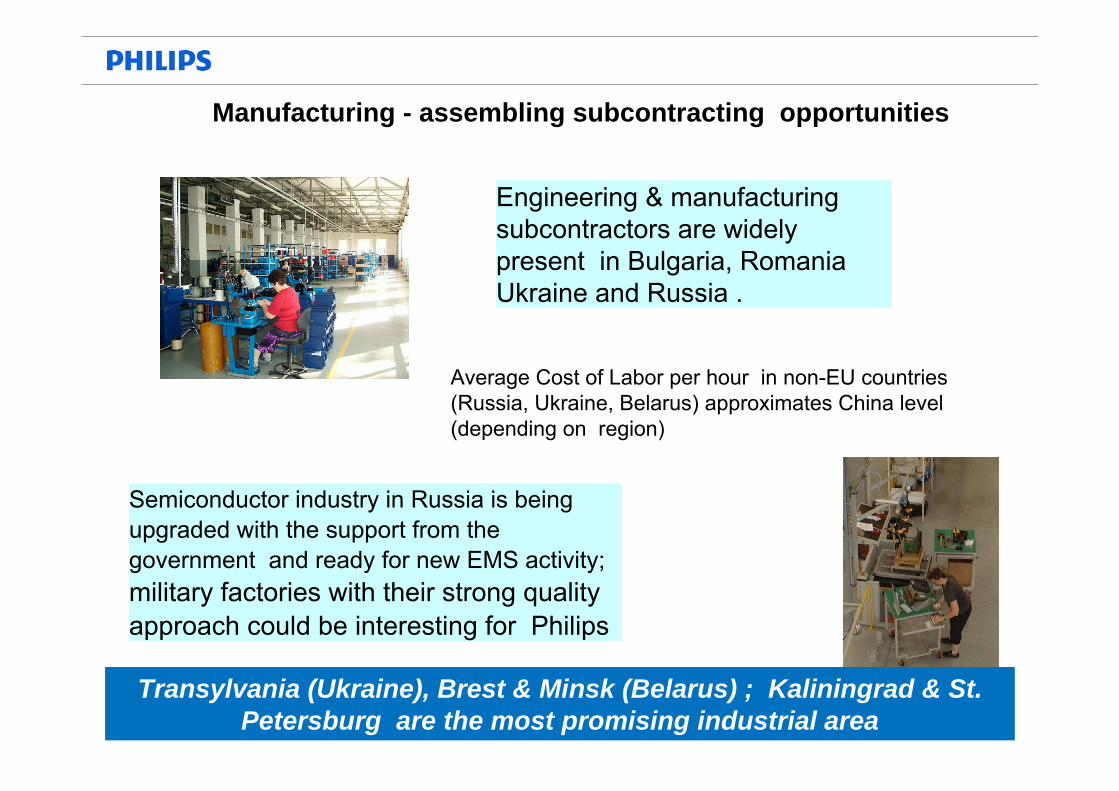
Engineering & manufacturing subcontractors are widely present in Bulgaria, Romania Ukraine and Russia .
Average Cost of Labor per hour in non-EU countries (Russia, Ukraine, Belarus) approximates China level (depending on region)
Semiconductor industry in Russia is being upgraded with the support from the government and ready for new EMS activity; military factories with their strong quality approach could be interesting for Philips
Manufacturing - assembling subcontracting opportunities
Transylvania (Ukraine), Brest & Minsk (Belarus) ; Kaliningrad & St. Petersburg are the most promising industrial area
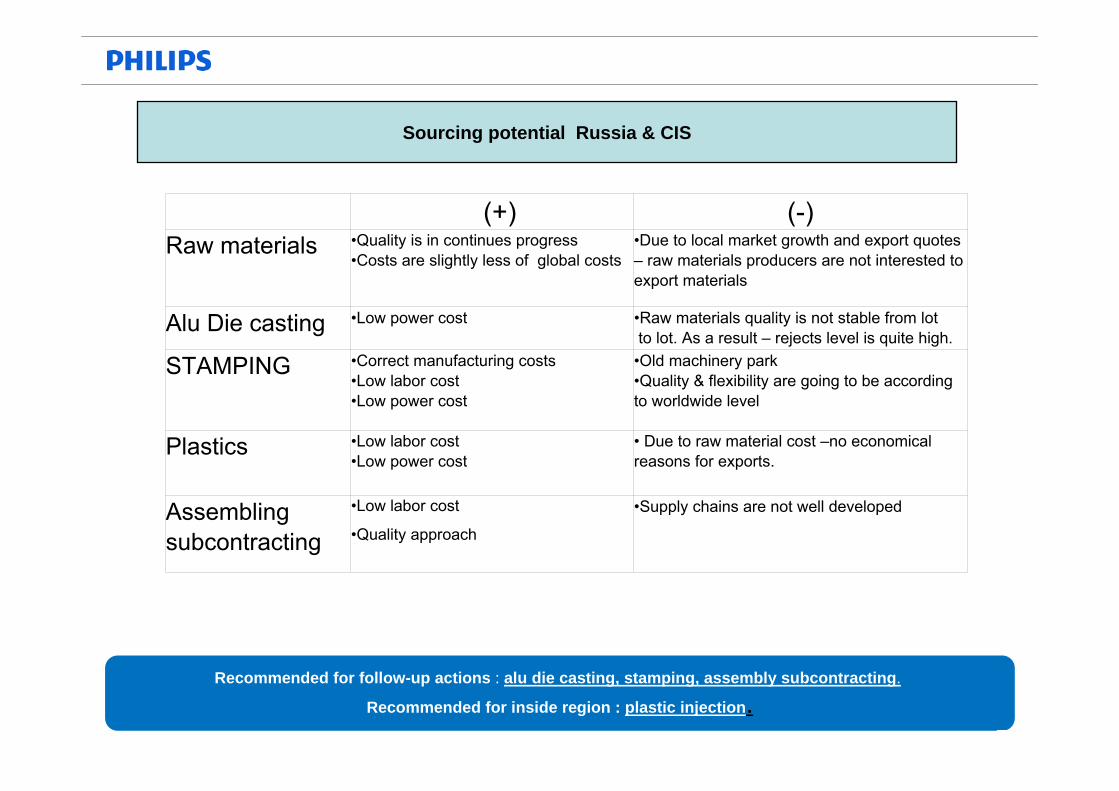
(+) (-)Raw materials •Quality is in continues progress
•Costs are slightly less of global costs•Due to local market growth and export quotes – raw materials producers are not interested to export materials
Alu Die casting •Low power cost •Raw materials quality is not stable from lot to lot. As a result – rejects level is quite high.
STAMPING •Correct manufacturing costs •Low labor cost•Low power cost
•Old machinery park•Quality & flexibility are going to be according to worldwide level
Plastics •Low labor cost•Low power cost
• Due to raw material cost –no economical reasons for exports.
Assembling subcontracting
•Low labor cost
•Quality approach
•Supply chains are not well developed
Recommended for follow-up actions : alu die casting, stamping, assembly subcontracting.
Recommended for inside region : plastic injection.
Sourcing potential Russia & CIS
Rec
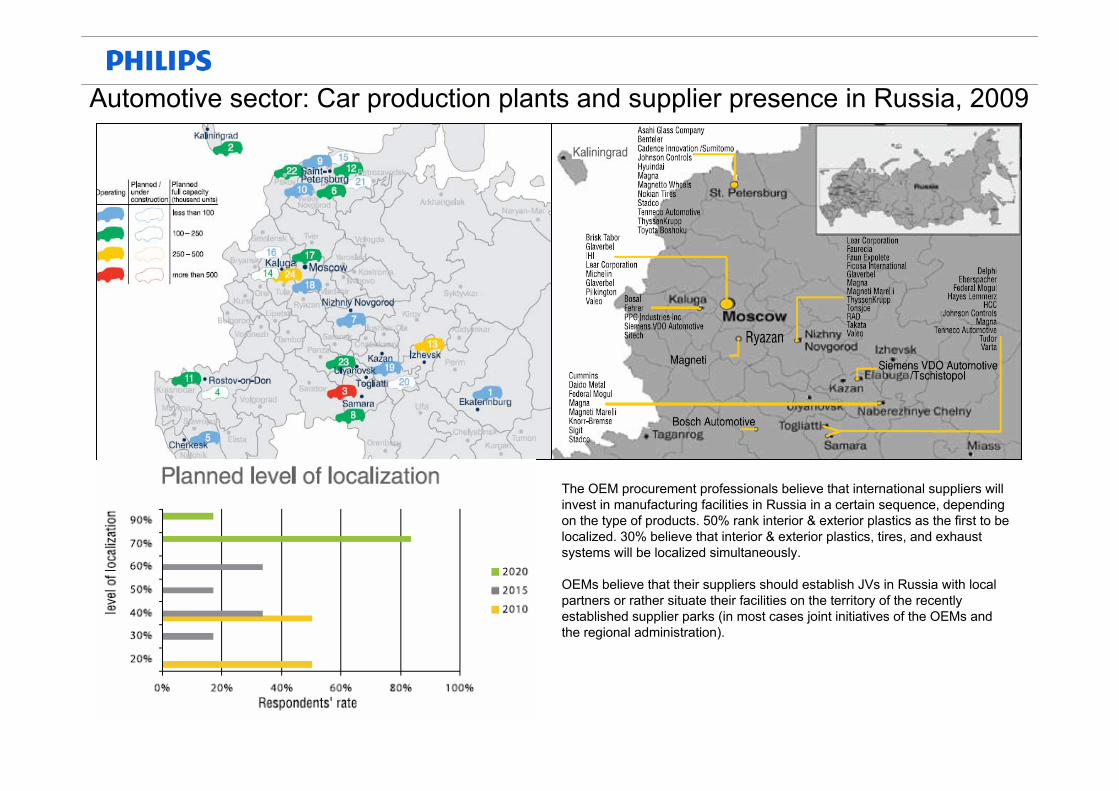
Automotive sector: Car production plants and supplier presence in Russia, 2009
The OEM procurement professionals believe that international suppliers will invest in manufacturing facilities in Russia in a certain sequence, depending on the type of products. 50% rank interior & exterior plastics as the first to be localized. 30% believe that interior & exterior plastics, tires, and exhaust systems will be localized simultaneously.
OEMs believe that their suppliers should establish JVs in Russia with localpartners or rather situate their facilities on the territory of the recently established supplier parks (in most cases joint initiatives of the OEMs and the regional administration).
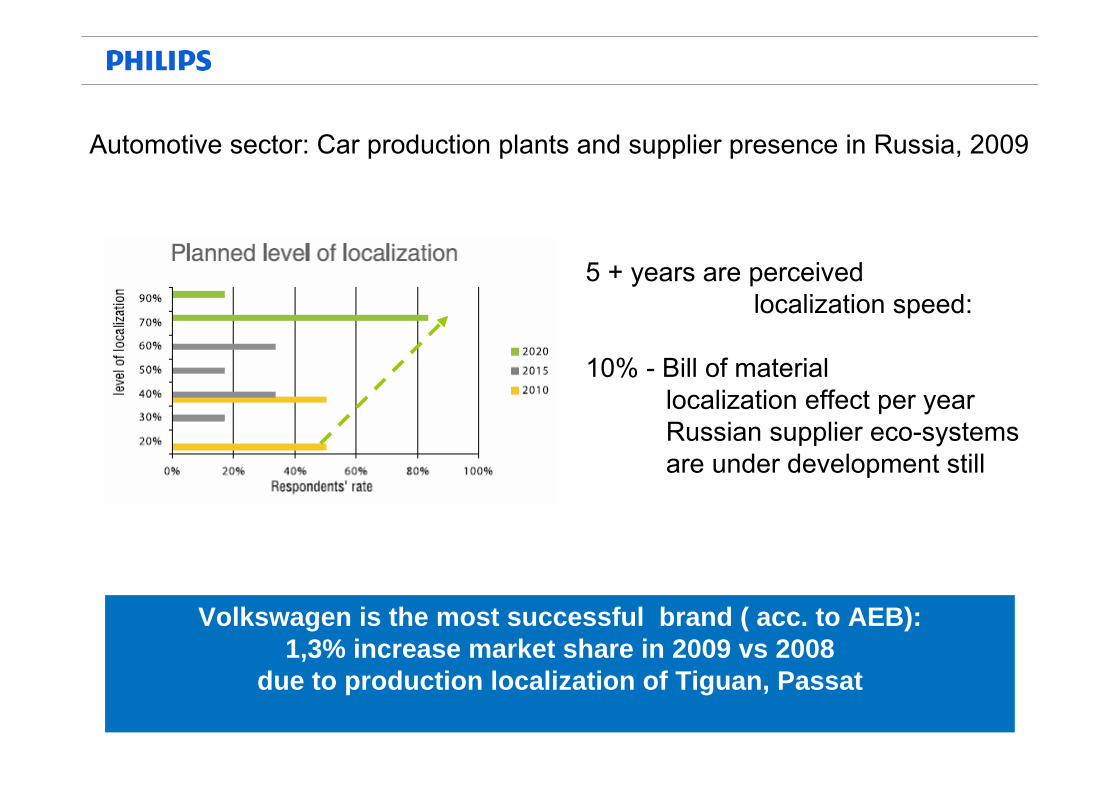
Automotive sector: Car production plants and supplier presence in Russia, 2009
5 + years are perceived localization speed:
10% - Bill of materiallocalization effect per yearRussian supplier eco-systemsare under development still
Volkswagen is the most successful brand ( acc. to AEB): 1,3% increase market share in 2009 vs 2008
due to production localization of Tiguan, Passat
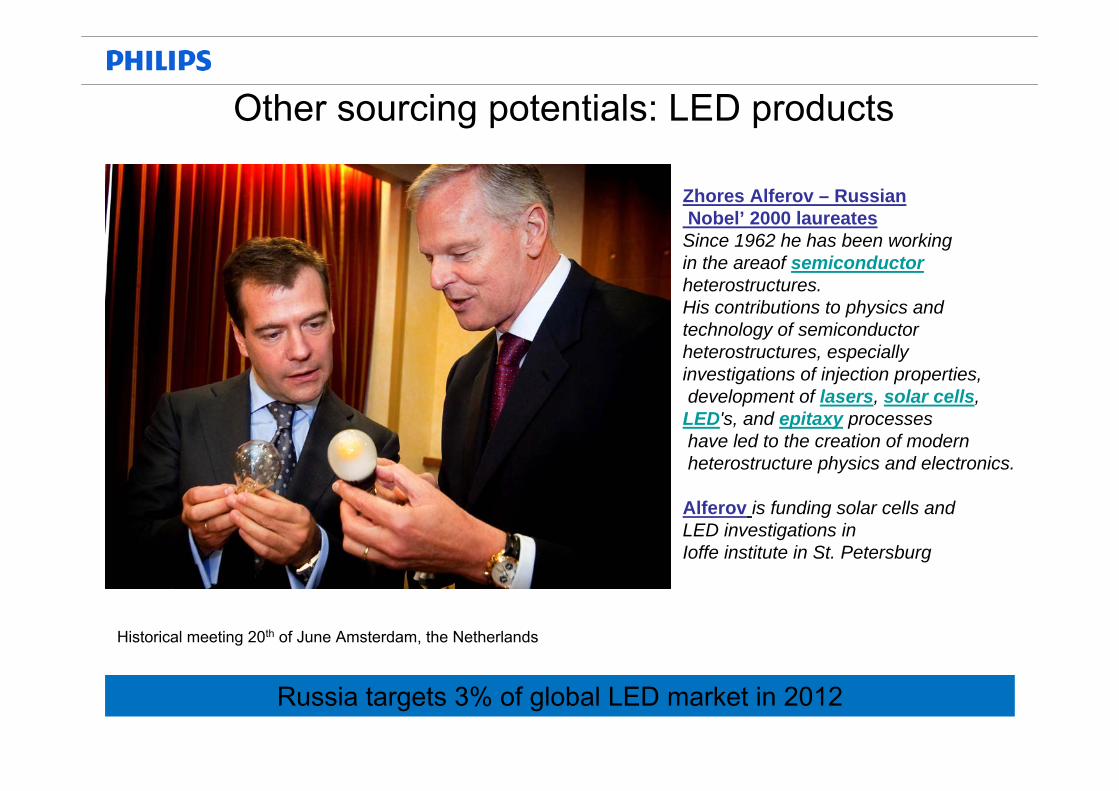
Other sourcing potentials: LED products
Historical meeting 20th of June Amsterdam, the Netherlands
Zhores Alferov – RussianNobel’ 2000 laureates
Since 1962 he has been working in the areaof semiconductorheterostructures.His contributions to physics and technology of semiconductor heterostructures, especially investigations of injection properties,development of lasers, solar cells,
LED's, and epitaxy processeshave led to the creation of modernheterostructure physics and electronics.
Alferov is funding solar cells and LED investigations in Ioffe institute in St. Petersburg
Russia targets 3% of global LED market in 2012

33
LED project in UralsAt the recent RosNano Forum an agreement was signed by RosNano, ONEXIM and the Ural Optical and Mechanical Plant to establish a joint company to manufacture new generation lightingproducts (LED).
Solar and SSL related opportunities
IntegralIntegral, Belarus is currently in the process of privatization. Agreements about joint activity with Philips Lumileds ( L2-L3)
Plus:`Svetlana, St. Petersburg–LED Project, cooperation with Bearzi Engineeringfor automotive application
OLED, city of Vladimir:The project related to OLEDs manufacturingin cooperation with European companies
and institutions is in the early stage ofdevelopment.–
Solar Energy–a vertically integrated company manufacturing equipment for solar cells producing up to 10 MWT peryear, purchased from GT Solar.
Companies in Russia traditionally working in the field of sapphire products manufacturing:1. Monocrystal– one production facilities, Stavropol. Sapphire ingots; substrates, optical parts
The Russian State Corporation of Nanotechnologies was granted over$5B for funding of projects related to nanotechnology development in
Russia
Agenda
Eastern Europe Sourcing Group Philips Lighting, October 2009
EE regional development trends. BRIC 2009-2011
EE & Russia business outlook in 2009.
Sourcing perspective from Russia
Summary

• Energy and Raw Materials– Russia is expected to remain attractive for energy-intensive commodities such as
glass– Same for metals, because of ore availability and energy
• Recommendation is inventorise raw material spend and identify cost reduction opportunities by moving to EE
• In many cases, local supply will be required to optimally benefit from local end market opportunities (Local For Local)
– Import duties– Transportation cost– National corporate citizenship – government relations and support
• Recommendation to define priority list of end products to be localized out of sales ramp up plan portfolio
• Plastic, metal parts, PCB’s etc increasingly available for EE and bordering Central EuropePhilips and EMS factories
Conclusions and recommendations


Until the middle of 2008, Russia’s trade balance continued to move from strength to strength. Record volumes and prices on main exports in the energy sector and metals, first and foremost, conditioned a steady balance of payments. The biggest problem for Russian exports is that they are dominated by inefficient commodities with low added value: 64.7% are mineral resources (oil, petroleum products, gas), 16.1% are metals, gems, precious metals and related goods.
Machinery, equipment and transport vehicles account for only 5.6%, chemicals and rubber for 5.9%.
The drop in oil, metal and other commodity prices significantly affected the trade balance in the third and fourth quarter of 2008. Both export and import volumes decreased significantly, especially in the fourth quarter; nevertheless, the trade balance was positive.
Russia’s main trading partners are Germany, the Netherlands, Italy, China, Ukraine, Belarus, Turkey, Poland, Finland,the US, Kazakhstan, Japan and South Korea.
In the midterm, it is expected that imports will catch up with exports.
Eastern Europe Sourcing Group Philips Lighting, October 2009
Russia`s trade balance 2001-2008

Eastern Europe Sourcing Group Philips Lighting, October 2009
STRENGTHS■ Lack of external financing gap■ Dependence on commodity pricesWEAKNESSES■ Structural inefficiencies , lack of domestic investment base■ Improving sentiment
Russia outlook 2007-2011


![IMP PPT for SALES n SOURCING [Compatibility Mode]](https://img.pdfslide.net/doc/110x75/58e9fd4d1a28ab89748b4ffd/imp-ppt-for-sales-n-sourcing-compatibility-mode.jpg)