Embed Size (px)
Citation preview

1
PLEASE NOTE:
This report is based on SARS verified stats. The verified stats will be corrected up to two
years in arrears.
Where the term ‘poultry’ is used, this may refer to imports of chicken, turkey, duck, goose
or guinea fowl.
If, as a regular user of this report, you would like other data included or data presented in
a different format (e.g. tables), please contact us on [email protected] with your
suggestions.
1. IMPORTS FOR 2017
Poultry imports for 2017 totalled 556 877 t down 0.6 % on 2016 imports. Imports for 2017 are up
25 % over the 5-year average for poultry imports. The percentage contributions from the major
importing countries are shown in Graph 1:
Brazil 60.6%
United States 15.6%
Argentina 5.9%
Ireland 4.4%
Belgium 4.2%
Denmark 3.0%
Canada 2.6%
Spain 2.0%
Thailand 0.7%
Other 0.9%
Graph 1: Country of origin for poultry imports (2017)
SOUTH AFRICAN POULTRY MEAT IMPORTS: COUNTRY REPORT MAY 2018
Any and all information, data, know-how, documentation, materials and other communications, written
or oral, which are disclosed or provided to SAPA or its designees by a SAPA member shall be
regarded as confidential information belonging to that member and will not be disclosed to any other
member.

2
Brazil was the main country of origin in 2017, accounting for 60.6 %, or 337 476 t, of total poultry
imports into South Africa. With AI affecting EU trade, the US was the second largest importer into
the country, with 15.6 % or 87 059 t. Argentina and Canada increased exports to South Africa, in
the absence of many of the EU nations, to account for 5.9 % (32 816 t) and 2.6 % (14 431 t) of
2017 imports, respectively. Of the EU exporters, only Ireland, Belgium, Denmark and Spain
exported significant quantities to South Africa in 2017: 24 746 t (4.4 %), 23 451 t (4.2 %), 16 884 t
(3.0 %) and 11 138 t (2.0 %), respectively. Thailand exported 4 109 t to South Africa in 2017 (0.7
% of total imports). All other importing countries contributed only 0.9 % to imports of poultry into
South Africa in 2017. If the EU countries are considered as a single entity, 14.0 % of poultry
imports entered SA through the EU in 2017, compared to 48.1 % in 2016 and 47.1 % in 2015.
This drop in 2017 reflects the impact of the trade bans on EU countries affected by avian
influenza. In Graph 2, the EU countries are grouped together as a single entity.
2. MONTHLY IMPORTS FOR MAY 2018
Poultry imports into South Africa totalled 47 085 tonnes in May 2018. Since December 2016,
Brazil has been the main country of origin for South African poultry imports, with the exception of
March 2017 when the States landed over 25 000 t of poultry products here. In May 2018, Brazil
accounted for 67.4 % or 31 728 t of total imports (Graph 3); cf just 37.9 % of total imports back in
March 2017.
Under the terms of the AGOA agreement, US imports of frozen bone in portions resumed in
January 2016. The US may export 65 000 tonnes of bone-in frozen chicken per annum, free
from anti-dumping duties (cycle April to March). The US holds on to second place on the imports
table in May, with 6 269 tonnes (13.3 % of imports). Denmark has moved up to become the third
biggest importer of poultry products into South Africa in May (2 871 tonnes; 6.1 %).
Brazil 60.6%
United States 15.6%
EU 14.0%
Argentina 5.9%
Canada 2.6%
Other 1.3%
Graph 2: Country of origin 2017 (EU countries grouped)

3
Avian influenza reduced Dutch, French, German, Polish, Hungarian and UK imports to almost
zero for most of 2017 and early 2018. Spain and Belgium are currently not exporting to South
Africa but small volumes have arrived from the Netherlands, the UK and Germany in April and
May, which may signal their return to the market. Ireland continues to export and was responsible
for 5.9 % of total imports in May. Argentina, Thailand, Canada, and Chile accounted for 4.2 %,
1.5 %, 1.3 % and 0.2 %, respectively (see graph below). Other countries contributed 0.15 %
collectively. Most European HPAI events are now considered resolved (OIE) although the UK,
the Netherlands, Germany, Denmark and Ireland have all reported cases in wild birds in 2018
(see below under each country). The Netherlands and Germany have reported H5N6 in
commercial and backyard poultry this year. The UK is currently the only country exporting to
South Africa with an open HPAI case at the OIE.
Only 932 kilogrammes of poultry product arrived from France in May 2018, because of AI-related
restrictions on trade. The Argentinians and Thais exported 1 973 and 690 tonnes, respectively.
Canadians landed 596 tonnes in May, and Chile 94 tonnes.
Poland entered the South African market in August 2016, with 82 t of chicken drumsticks and
chicken offal. Polish volumes increased to 2 521 t in November 2016 but the country has
experienced outbreaks of HPAI since late 2016 and no poultry imports were received from
Poland through 2017 or in 2018 YTD.
Graph 4 shows the origin of poultry imports in May 2018, with the EU countries grouped together
as a single entity.
Imports from the EU contributed 12.1 % (5 710 t) of total poultry imports into South Africa in May
(cf 63.1 % in November 2016). EU tonnages were up 22.4 % on a monthly basis but are down
42.6 % on a year-on-year basis.
Brazil 67.4%
United States 13.3%
Denmark 6.1%
Ireland 5.9%
Argentina 4.2%
Thailand 1.5%
Canada 1.3%
Chile 0.2% Other 0.15%
Graph 3: Poultry imports for May 2018

4
COUNTRIES OF ORIGIN
3.1 Poultry imports from Brazil
Poultry imports from Brazil totalled 31 728 t in May 2018, representing 67.4 % of total poultry
imports in volume terms, with an FOB import value of R337.5 million. On a monthly basis, imports
from Brazil decreased by 2.6 % (- 840 t). Imports increased by 13.3 % (+ 3 275 t) compared to
May 2017, illustrating how Brazil’s imports to South Africa have increased since AI-related trade
bans were put in place against EU countries.
Graph 5 shows the monthly imports (t) from Brazil, since May 2014:
Poultry imports from Brazil for May 2018:
Tariff Description Import Quantity in kg
FOB Import Price in R
Unit Price in R per kg
0207.1210 Chicken: Not cut in pieces, Frozen Mechanically Deboned Meat 11,103,847 R 73,359,319 R 6.61 0207.1220 Carcasses (excluding necks and offal) with all cuts (e.g. thighs, wings, legs
and breasts) removed 791,171 R 4,494,651 R 5.68
0207.1290 Chicken: Not cut in pieces, frozen, whole and half chickens 378,104 R 5,798,210 R 15.33 0207.1411 Chicken: Boneless cuts: Breasts 1,496,945 R 32,369,925 R 21.62 0207.1415 Chicken: Boneless cuts: Other 355,590 R 6,387,934 R 17.96 0207.1421 Chicken: Offal: Livers 426,729 R 3,017,555 R 7.07 0207.1423 Chicken: Offal: Feet 1,256,682 R 17,978,680 R 14.31 0207.1429 Chicken: Offal: Other 1,296,229 R 6,658,597 R 5.14 0207.1493 Chicken: Other: Leg quarters 10,596,730 R 125,948,566 R 11.89 0207.1495 Chicken: Other: Wings 1,090,590 R 22,472,642 R 20.61 0207.1496 Chicken: Other: Breasts 3,990 R 54,474 R 13.65 0207.1497 Chicken: Other: Thighs 28,320 R 404,733 R 14.29 0207.1498 Chicken: Other: Drumsticks 1,305,704 R 18,958,393 R 14.52 0207.1499 Chicken: Other: Other 706,754 R 5,470,885 R 7.74 0207.2700 Turkey: Cuts and offal, frozen; Frozen Turkey portions and MRM 703,754 R 11,787,200 R 16.75 1602.3290 Chicken: Flavoured, herbed or marinated 186,912 R 2,326,651 R 12.45
Total for: Brazil in May 2018 31,728,051 R 337,488,415 R 10.64
0
5,000
10,000
15,000
20,000
25,000
30,000
35,000
40,000
May
-14
Jul-
14
Sep
-14
No
v-1
4
Jan
-15
Mar
-15
May
-15
Jul-
15
Sep
-15
No
v-1
5
Jan
-16
Mar
-16
May
-16
Jul-
16
Sep
-16
No
v-1
6
Jan
-17
Mar
-17
May
-17
Jul-
17
Sep
-17
No
v-1
7
Jan
-18
Mar
-18
May
-18
Tonnes Graph 5: Poultry imports from Brazil

5
Brazilian imports in May 2018 included 35.0 % mechanically deboned meat; 11.9 % chicken offal
and carcasses; 33.4 % frozen chicken bone-in leg quarters; 4.1 % frozen chicken drumsticks; 5.8
% other frozen chicken portions (wings, thighs, breasts, other); 5.8 % frozen boneless chicken
portions; and 2.2 % turkey meat. Imports included a small quantity of value-added chicken and
whole frozen chickens. In December 2016, Brazilian imports comprised just 2.9 % bone-in
chicken portions. In May 2018, this figure is 43.3 % (from a high of 46.5 % in February 2018).
Accumulated imports in December 2017 (337 476 t) were 44.4 % higher than in December 2016
(Graph 6). Accumulated Brazilian imports (148 335 t) in 2018 YTD are 25.1 % higher than in the
same period in 2017.
Quarterly poultry imports from Brazil:
Jan Feb Mar Apr May Jun Jul Aug Sep Oct Nov Dec
2015 15,728 33,254 55,456 77,282 98,144 116,639 140,027 161,540 182,111 199,690 221,547 241,180
2016 19,110 36,225 59,584 78,013 101,536 124,429 145,225 162,595 183,621 204,275 218,854 233,787
2017 21,027 40,954 65,860 90,603 118,606 142,380 175,597 209,740 244,564 279,090 308,497 337,476
2018 27,157 51,767 84,038 116,607 148,335
0
50,000
100,000
150,000
200,000
250,000
300,000
350,000
400,000
Tonnes Graph 6: Accumulation of poultry imports from Brazil
0207.1210 Chicken: Frozen MDM 40.5%
0207.1220 Chicken: Carcasses 0.7%
0207.1290 Chicken: Whole, frozen 0.5%
0207.1300 Chicken: Cuts and offal, fresh 0.03%
0207.141* Chicken: Boneless portions, frozen
5.2%
0207.142* Chicken: Offal, frozen 7.4%
0207.149* Chicken: Bone-in portions, frozen
41.7%
0207.2500 Turkey: Whole, frozen 0.03%
0207.2700 Turkey: Frozen MDM 3.7%
1602.3290 Chicken: Flavoured, frozen 0.2%
Graph 7: Poultry imports from Brazil for Q1 2018

6
Mechanically deboned meat (0207.1210) made up 40.5 % (34 055 t) of all imports originating
from Brazil during the 1Q 2018 (total: 84 038 t). During 1Q 2018, the remainder of Brazilian
imports included 7.4 % frozen offal (0207.142*); 41.7 % bone-in chicken portions (35 063 tonnes;
0207.149*); 3.7 % frozen turkey portions and MDM (0207.2700); 5.2 % frozen boneless chicken
portions (0207.141*); 0.7 % frozen chicken carcasses; 0.2 % value-added chicken (1602.3290)
and 0.03 % each whole frozen turkey (0207.2500) and fresh chicken/offal; (0207.1300; Graph 7).
3.2 Poultry imports from the EU
Graph 8 (above) depicts the total monthly poultry imports from the European Union from May
2014 to May 2018. During May 2018, 5 710 t of poultry imports entered the country from the EU;
this is 22.4 % more than in April (+ 1044 t).
0
5,000
10,000
15,000
20,000
25,000
30,000
35,000
May
-14
Au
g-1
4
No
v-1
4
Feb
-15
May
-15
Au
g-1
5
No
v-1
5
Feb
-16
May
-16
Au
g-1
6
No
v-1
6
Feb
-17
May
-17
Au
g-1
7
No
v-1
7
Feb
-18
May
-18
Tonnes Graph 8: Monthly imports from the EU
2,871
22
2,791
25 0
500
1,000
1,500
2,000
2,500
3,000
3,500
Denmark Germany Ireland United Kingdom
Tonnes
Graph 9: Poultry imports from EU countries May 2018

7
EU imports represent 12.1 % of total poultry imports in May. Imports from individual EU countries,
with notable tonnages, are shown in Graph 9 (above). Only four EU nations sent product in
excess of 1 tonne to South Africa in May, because of AI-related trade bans.
The contribution of the EU to total poultry imports reached 60 % in November 2014 (Graph 10)
before the HPAI outbreaks of 2015. EU tonnages rose strongly again through 2016 as the bloc
recovered from the epidemic, hitting 63 % of total imports in November 2016. Imports dropped
dramatically from December 2016 in response to new AI-related trade bans. May 2018 imports
from the EU are down 42.6 % (- 4 231 t) on May 2017 imports and down 82.2 % on the record
EU imports received in November 2016.
0%
10%
20%
30%
40%
50%
60%
70%
80%
90%
100%
May
-14
Jul-
14
Sep
-14
No
v-1
4
Jan
-15
Mar
-15
May
-15
Jul-
15
Sep
-15
No
v-1
5
Jan
-16
Mar
-16
May
-16
Jul-
16
Sep
-16
No
v-1
6
Jan
-17
Mar
-17
May
-17
Jul-
17
Sep
-17
No
v-1
7
Jan
-18
Mar
-18
May
-18
0
10,000
20,000
30,000
40,000
50,000
60,000
70,000
Tonnes Graph 10: Poultry imports from EU vs total poultry imports
Poultry imports from EU, % Poultry imports from EU, t Total poultry imports, t
May
-14
Jul-
14
Sep
-14
No
v-1
4
Jan
-15
Mar
-15
May
-15
Jul-
15
Sep
-15
No
v-1
5
Jan
-16
Mar
-16
May
-16
Jul-
16
Sep
-16
No
v-1
6
Jan
-17
Mar
-17
May
-17
Jul-
17
Sep
-17
No
v-1
7
Jan
-18
Mar
-18
May
-18
0
10,000
20,000
30,000
40,000
Tonnes
Graph 11: Imports of frozen bone-in portions from the EU and other countries
Total imports from the EU countries Total imports from countries excluding EU countries

8
The contribution of frozen bone-in portions imports originating from the EU had been increasing
steadily, relative to imports from other countries (Graph 11, above) but, with AI-related trade bans
applied since November 2016, the EU proportion decreased from > 60 % to 10 % in April 2018.
Quarterly poultry imports from EU:
Frozen bone-in chicken portions (0207.149*) made up 74.4 % (9 940 t) of all imports originating
from the EU during the 1Q 2018 (total: 13 352 t; Graph 12 above).
During the first quarter of 2018, the remainder of EU imports comprised 15.6 % frozen offal
(0207.142*); 4.6 % whole frozen chickens (0207.1290); 0.6 % frozen chicken carcasses
(0207.1220); 0.2 % frozen boneless chicken portions (0207.141*); 3.3 % frozen turkey cuts and
offal (0207.2700); 1.0 % frozen chicken MDM (0207.1210) and 0.3 % of products imported on
other tariff lines.
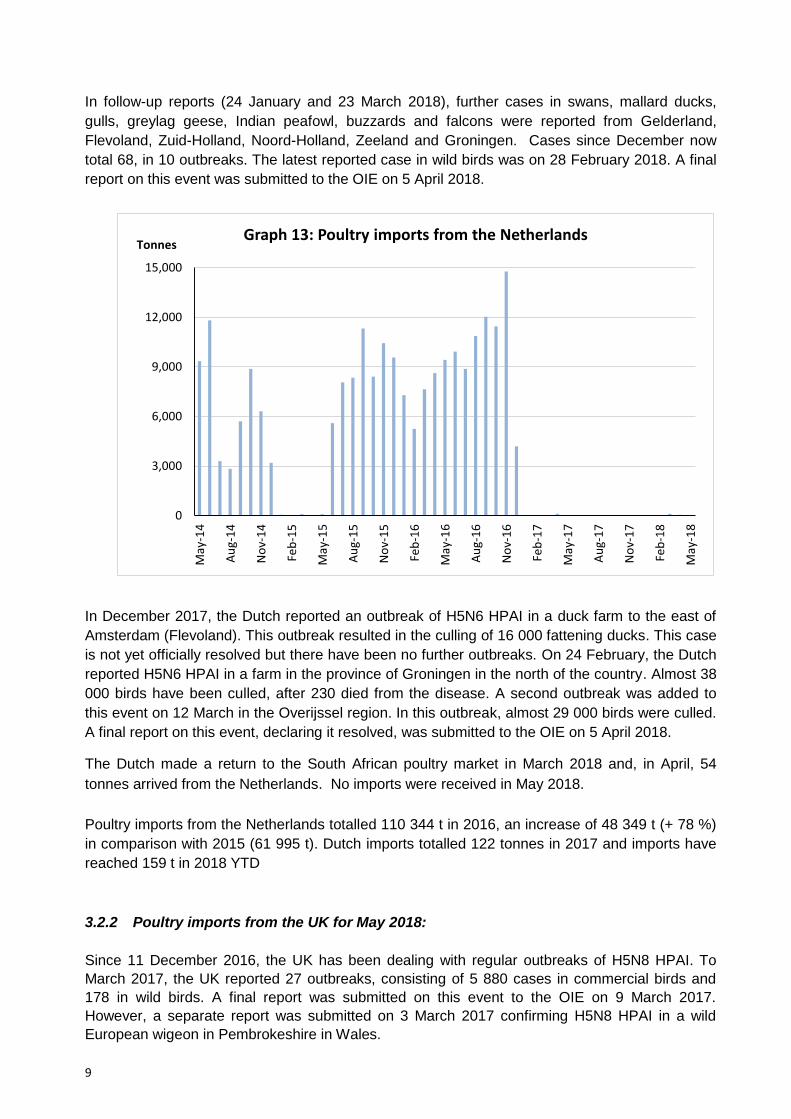
3.2.1 Poultry imports from Netherlands for May 2018: Dutch poultry imports reached a peak in November 2016 (14 769 t; see Graph 13). However,
from November 2016, the Netherlands reported two H5N8 HPAI events to the OIE. The first
event totalled 56 outbreaks (351 cases) with the last outbreak reported on 22 March 2017. The
second event centred on nine farms, totalling 3 658 cases. Over 210 000 birds were culled. Final
reports on both these events were submitted to the OIE on 17 May 2017 and the Dutch officially
declared their avian-influenza free-status regained, under the terms of Article 10.4.3 of the OIE
Terrestrial Animal Health Code (2016). On 22 May 2017, the Netherlands reported two cases of
H5N5 HPAI in wild greylag geese in the Utrecht region of the country. From 9 December 2017, a
new event was opened with the OIE by the Dutch. Mute swans in the Gelderland region were
found to be infected with an H5N6 subtype of the AI virus. This is thought to be a re-assortment
linked to H5N8, and not related to the Asian H5N6 strain.
0207.1210 Chicken: Frozen MDM 1.0%
0207.1220 Chicken: Carcasses 0.6%
0207.1290 Chicken: Whole, frozen 4.6%
0207.141* Chicken: Boneless portions,
frozen 0.2%
0207.142* Chicken: Offal, frozen 15.6%
0207.149* Chicken: Bone-in portions,
frozen 74.4%
0207.2700 Turkey: Frozen cuts and offal
3.3% Other 0.3%
Graph 12: Poultry imports from EU for Q1 2018
9
In follow-up reports (24 January and 23 March 2018), further cases in swans, mallard ducks,
gulls, greylag geese, Indian peafowl, buzzards and falcons were reported from Gelderland,
Flevoland, Zuid-Holland, Noord-Holland, Zeeland and Groningen. Cases since December now
total 68, in 10 outbreaks. The latest reported case in wild birds was on 28 February 2018. A final
report on this event was submitted to the OIE on 5 April 2018.
In December 2017, the Dutch reported an outbreak of H5N6 HPAI in a duck farm to the east of
Amsterdam (Flevoland). This outbreak resulted in the culling of 16 000 fattening ducks. This case
is not yet officially resolved but there have been no further outbreaks. On 24 February, the Dutch
reported H5N6 HPAI in a farm in the province of Groningen in the north of the country. Almost 38
000 birds have been culled, after 230 died from the disease. A second outbreak was added to
this event on 12 March in the Overijssel region. In this outbreak, almost 29 000 birds were culled.
A final report on this event, declaring it resolved, was submitted to the OIE on 5 April 2018.
The Dutch made a return to the South African poultry market in March 2018 and, in April, 54
tonnes arrived from the Netherlands. No imports were received in May 2018.
Poultry imports from the Netherlands totalled 110 344 t in 2016, an increase of 48 349 t (+ 78 %)
in comparison with 2015 (61 995 t). Dutch imports totalled 122 tonnes in 2017 and imports have
reached 159 t in 2018 YTD
3.2.2 Poultry imports from the UK for May 2018:
Since 11 December 2016, the UK has been dealing with regular outbreaks of H5N8 HPAI. To
March 2017, the UK reported 27 outbreaks, consisting of 5 880 cases in commercial birds and
178 in wild birds. A final report was submitted on this event to the OIE on 9 March 2017.
However, a separate report was submitted on 3 March 2017 confirming H5N8 HPAI in a wild
European wigeon in Pembrokeshire in Wales.
0
3,000
6,000
9,000
12,000
15,000
May
-14
Au
g-1
4
No
v-1
4
Feb
-15
May
-15
Au
g-1
5
No
v-1
5
Feb
-16
May
-16
Au
g-1
6
No
v-1
6
Feb
-17
May
-17
Au
g-1
7
No
v-1
7
Feb
-18
May
-18
Tonnes Graph 13: Poultry imports from the Netherlands

10
On 3 May 2017, the UK experienced a new outbreak of H5N8 in a backyard flock in the Wyre
district of Lancashire and, within days, a second outbreak was reported nearby. In early June
2017, H5N8 HPAI was recorded in a backyard flock in Diss, Norfolk. In late July 2017, the UK
reported H5N8 in a mute swan on the Norfolk Broads. Final reports on these events were issued
to the OIE on 13 September 2017.
From 9 January 2018, the UK reported 20 outbreaks, totalling 85 cases in wild birds across
Dorset, Rutland, Hertfordshire, Greater London, Warwickshire, Surrey, Berkshire, Oxfordshire,
South Glamorgan, Northern Ireland, Lincolnshire, Hampshire, Suffolk and Devon. The species
affected by the H5N6 strain include mute swans, gulls, geese, ducks, moorhens, grebes,
pheasants, Eurassian buzzards and goshawks. No further outbreaks were recorded after 28
March 2018 and a final report on this event, declaring it resolved, was submitted to the OIE on 5
April 2018. On 15 June, the UK opened a new report with the OIE after H5N6 avian influenza
was reported in a greylag goose in Northern Ireland.
The British made a return to the South African poultry market in March 2018. In May, 25 tonnes
of frozen chicken offal (“other”) were imported; at an FOB value of R152 720. British imports
accounted for only 0.05 % of total poultry imports into South Africa in May 2018.
Poultry imports from the UK for May 2018:
Tariff Description Import Quantity in kg
FOB Import Price in R
Unit Price in R per kg
0207.1429 Chicken: Offal: Other 25,200 R 152,720 R 6.06
Total for: United Kingdom in May 2018 25,200 R 152,720 R 6.06
Poultry imports from the UK totalled 45 657 t in 2016, an increase of 186 % over 2015 levels (15
985 t). In 2017, imports from the UK amounted to 1 366 tonnes. In 2018 YTD, 125 t of poultry
products have arrived from the UK.
0
1,000
2,000
3,000
4,000
5,000
6,000
7,000
May
-14
Au
g-1
4
No
v-1
4
Feb
-15
May
-15
Au
g-1
5
No
v-1
5
Feb
-16
May
-16
Au
g-1
6
No
v-1
6
Feb
-17
May
-17
Au
g-1
7
No
v-1
7
Feb
-18
May
-18
Tonnes Graph 14: Poultry imports from the UK

11
3.2.3 Poultry imports from Germany for May 2018:
Low and erratic levels of imports have been recorded from Germany over the last three years as
a result of temporary bans on imports because of avian influenza in the 4Q 2014, 3Q 2015, 4Q
2016 and 1H 2017. To 26 May 2017, Germany notified the OIE of 286 outbreaks of H5N8 HPAI
in wild birds and commercial poultry; with the last confirmed outbreak on 9 May 2017. More than
1.15 million birds have been destroyed as part of control measures. Germany also reported three
outbreaks (2 350 cases) of H5N5 HPAI in breeding and fattening turkeys in January 2017. Final
reports on all these outbreaks were submitted to the OIE on 11 August 2017.
However, on 29 August last year, a new notification was made by the Germans to the OIE,
reporting H5N8 HPAI in three wild swans in Sachsen-Anhalt in the centre of the country. A final
report on this event was issued on 4 October 2017. On 18 October, the Germans reported H5N8
in a wild mallard duck in the north-west region of Nieder-Sachsen, on the Dutch border. This
event was declared resolved (23 October 2017).
On 4 January 2018, the Germans reported a single case of H5N6 HPAI in a wild duck near
Bayern. A final report was submitted to the OIE on 2 February 2018. On 20 March 2018, the
Germans reported H5N6 in a backyard flock of rare and endangered fowl, in the northerly
Schleswig-Holstein region. This report has been updated to include a case in a white stork,
found in Niedersachsen on 28 April 2018, and a Eurasian buzzard in a forest in the Nordrhein-
Westfalen region on 5 April 2018. A final report on this event, declaring it resolved, was
submitted to the OIE on 1 June 2018.
In May 2018, 21.5 tonnes of value-added chicken were received from Germany (Graph 15); at an
FOB value of R1.4 million. German imports accounted for only 0.05 % of total poultry imports
into South Africa in May 2018.
0
500
1,000
1,500
2,000
2,500
3,000
3,500
4,000
May
-14
Au
g-1
4
No
v-1
4
Feb
-15
May
-15
Au
g-1
5
No
v-1
5
Feb
-16
May
-16
Au
g-1
6
No
v-1
6
Feb
-17
May
-17
Au
g-1
7
No
v-1
7
Feb
-18
May
-18
Tonnes Graph 15: Poultry imports from Germany

12
Poultry imports from Germany for May 2018:
Tariff Description Import Quantity in kg
FOB Import Price in R
Unit Price in R per kg
1602.3290 Chicken: Flavoured, herbed or marinated 21,528 R 1,434,033 R 66.61
Total for: Germany in May 2018 21,528 R 1,434,033 R 66.61
Poultry imports from Germany were restricted to 554 t in 2015. In 2016, 6 073 t of poultry
products were imported from Germany. In 2017, only 134 t of German poultry products were
imported. In 2018 YTD, 92 t of poultry products have arrived from Germany.
3.2.4 Poultry imports from Ireland for May 2018:
In May 2018, 2 791 t of poultry meat were imported from Ireland at an FOB value of R44.6 m
(Graph 16). Irish imports accounted for 5.9 % of total imports into South Africa in May; an
increase of 1.6 % (+ 43 t) on a monthly basis and an increase of 11.5 % (+ 287 t) on May 2017
imports.
Poultry imports from Ireland for May 2018:
Tariff Description Import Quantity in kg
FOB Import Price in R
Unit Price in R per kg
0207.1290 Chicken: Not cut in pieces, frozen, whole and half chickens 357,600 R 6,312,072 R 17.65 0207.1421 Chicken: Offal: Livers 150,000 R 1,476,002 R 9.84 0207.1423 Chicken: Offal: Feet 274,680 R 3,560,992 R 12.96 0207.1429 Chicken: Offal: Other 327,400 R 2,241,966 R 6.85 0207.1493 Chicken: Other: Leg quarters 1,229,205 R 22,545,003 R 18.34 0207.1495 Chicken: Other: Wings 68,860 R 1,257,247 R 18.26 0207.1497 Chicken: Other: Thighs 105,550 R 2,020,614 R 19.14 0207.1498 Chicken: Other: Drumsticks 197,840 R 3,880,777 R 19.62 0207.1499 Chicken: Other: Other 28,980 R 633,335 R 21.85 0207.2700 Turkey: Cuts and offal, frozen; Frozen Turkey portions and MRM 48,500 R 685,668 R 14.14 1602.3290 Chicken: Flavoured, herbed or marinated 2,520 R 28,787 R 11.42
Total for: Ireland in May 2018 2,791,135 R 44,642,463 R 15.99
0
700
1,400
2,100
2,800
May
-14
Au
g-1
4
No
v-1
4
Feb
-15
May
-15
Au
g-1
5
No
v-1
5
Feb
-16
May
-16
Au
g-1
6
No
v-1
6
Feb
-17
May
-17
Au
g-1
7
No
v-1
7
Feb
-18
May
-18
Tonnes Graph 16: Poultry imports from Ireland

13
Of the Irish imports, 44.0 % were chicken leg quarters; 26.9 % chicken offal (livers, feet and
other); 1.7 % frozen turkey cuts and offal; 12.8 % whole frozen chicken; and 14.4 % other bone-in
portions (wings, thighs, drumsticks and other).
In 2017, Ireland exported 24 746 t of poultry products to South Africa, compared to 15 556 t
during 2016; an increase of 59.1 %. Accumulated Irish imports in 2018 YTD (11 809 t) are 19.9
% higher than the same period in 2017.
From 28 December 2017, the Irish have reported 9 outbreaks (12 cases) of H5N8 HPAI in
whooping and mute swans, European wigeons and grey herons in counties Tipperary, Galway,
Wexford, Roscommon, Leitrim and Cork. This event was declared resolved in a final report on 2
February 2018. On 9 February, in a separate event, the Irish reported a case of highly
pathogenic avian influenza in a white-tailed eagle found in County Tipperary in the centre of the
country. Two more cases were added to this event – a Eurasian buzzard in County Tipperary
(February) and a white-tailed eagle in County Clare (March). This event is not yet resolved with
the OIE.
3.2.5 Poultry imports from France for May 2018: In May 2018, only 932 kilogrammes of poultry meat were imported from France at an FOB value
of R105 012. These imports were pâté de foie gras and other products from ducks, geese or
guinea fowl (total quantity too small to be visible in graph below).
Between December 2015 and August 2016, 81 separate outbreaks of the Eurasian H5N1, H5N2
and H5N9 strains (three events) were reported in the south west of France, resulting in the
destruction of over 280 000 birds. The French were due to regain HPAI-free status in December
2016 but, on 17 November 2016, a fourth HPAI event was reported to the OIE. This event
expanded to 55 outbreaks in all four corners of the country, with the last positive case being
0
500
1,000
1,500
2,000
2,500
3,000
3,500
4,000
May
-14
Au
g-1
4
No
v-1
4
Feb
-15
May
-15
Au
g-1
5
No
v-1
5
Feb
-16
May
-16
Au
g-1
6
No
v-1
6
Feb
-17
May
-17
Au
g-1
7
No
v-1
7
Feb
-18
May
-18
Tonnes Graph 17: Poultry imports from France
14
reported on 10 March 2017. This event was declared closed through the OIE on 18 October
2017. In a fifth event, beginning November 2016, the French had to report a further 485
outbreaks of H5N8 HPAI, totalling 15 900 cases, which resulted in the culling of over 1.29 million
birds (OIE) in the districts of Landes, Hautes-Pyrenees, Gers, Deux-Sevres, Pyrenees-Atlantiq,
Lot-et-Garonne, Aveyron and Tarn. The last positive outbreak was reported was on 26 June
2017. Local producers estimate that some 3.2 million birds were lost to the disease or in the pre-
emptive culls. This event was also declared resolved with the OIE on the 18 October 2017.
In 2016, France exported only 105.4 t of poultry products to South Africa, compared to 24 985 t
during 2015; a decrease of 99.6 %. Accumulated imports into France in 2017 totalled 3.9 tonnes.
In 2018 YTD, imports from France total 3.1 tonnes.
Poultry imports from France for May 2018:
Tariff Description Import Quantity in kg
FOB Import Price in R
Unit Price in R per kg
1602.2010 Pate de foie gras, goose liver paste 322 R 38,316 R 118.99 1602.3990 Ducks, geese or guinea fowl: Other, Not including pastes 610 R 66,696 R 109.34 Total for: France in May 2018 932 R 105,012 R 112.67
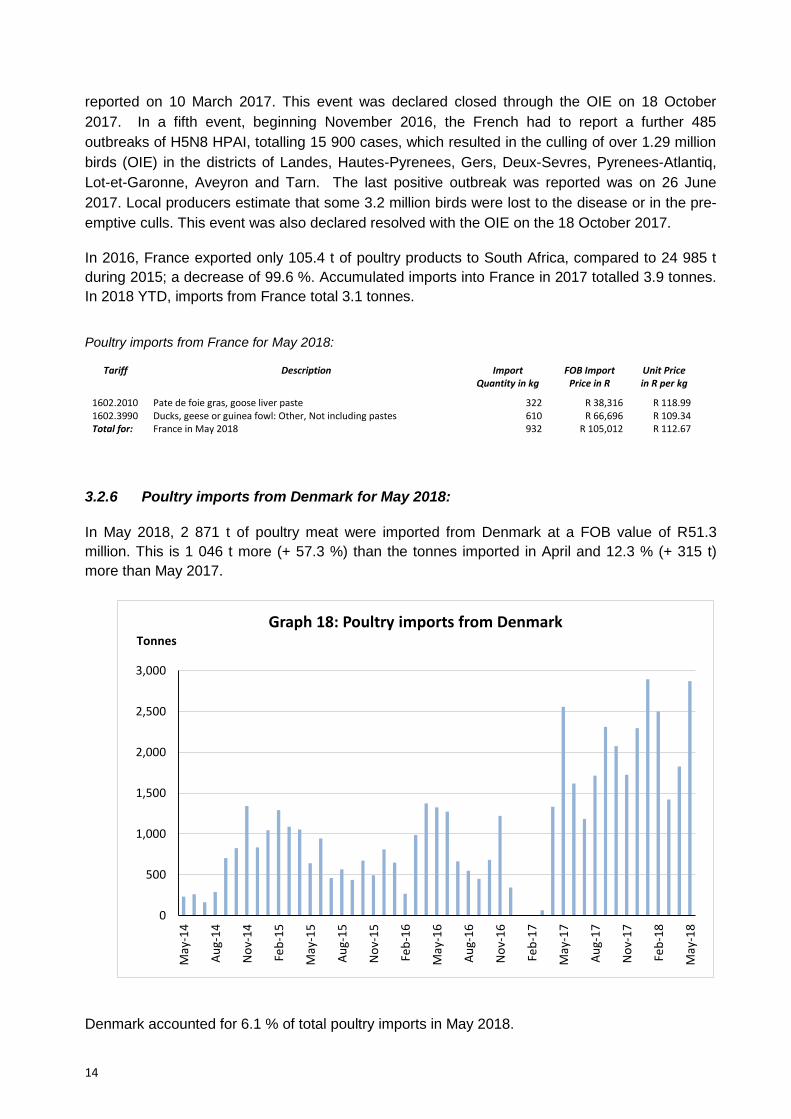
3.2.6 Poultry imports from Denmark for May 2018:
In May 2018, 2 871 t of poultry meat were imported from Denmark at a FOB value of R51.3
million. This is 1 046 t more (+ 57.3 %) than the tonnes imported in April and 12.3 % (+ 315 t)
more than May 2017.
Denmark accounted for 6.1 % of total poultry imports in May 2018.
0
500
1,000
1,500
2,000
2,500
3,000
May
-14
Au
g-1
4
No
v-1
4
Feb
-15
May
-15
Au
g-1
5
No
v-1
5
Feb
-16
May
-16
Au
g-1
6
No
v-1
6
Feb
-17
May
-17
Au
g-1
7
No
v-1
7
Feb
-18
May
-18
Tonnes
Graph 18: Poultry imports from Denmark

15
Of the Danish imports in December, 34.5 % were frozen chicken leg quarters; 20.9 % chicken
wings; 16.8 % chicken thighs; 6.6 % other frozen bone-in portions (“other” and drumsticks); 15.5
% chicken offal (feet and other); 1.9 % mechanically deboned chicken; 2.8 % frozen chicken
carcasses; and 0.9 % whole, frozen chickens.
Poultry imports from Denmark for May 2018:
`
Tariff Description Import Quantity in kg
FOB Import Price in R
Unit Price in R per kg
0207.1210 Chicken: Not cut in pieces, Frozen Mechanically Deboned Meat 54,060 R 289,274 R 5.35 0207.1220 Carcasses (excluding necks and offal) with all cuts (e.g. thighs, wings,
legs and breasts) removed 81,100 R 629,786 R 7.77
0207.1290 Chicken: Not cut in pieces, frozen, whole and half chickens 27,000 R 411,400 R 15.24 0207.1423 Chicken: Offal: Feet 392,417 R 5,952,425 R 15.17 0207.1429 Chicken: Offal: Other 54,000 R 347,492 R 6.44 0207.1493 Chicken: Other: Leg quarters 990,849 R 18,583,860 R 18.76 0207.1495 Chicken: Other: Wings 599,342 R 14,183,143 R 23.66 0207.1497 Chicken: Other: Thighs 482,844 R 8,229,919 R 17.04 0207.1498 Chicken: Other: Drumsticks 16,760 R 379,724 R 22.66 0207.1499 Chicken: Other: Other 173,000 R 2,297,081 R 13.28
Total for: Denmark in May 2018 2,871,372 R 51,304,104 R 17.87
After reporting 36 outbreaks of H5N8 HPAI in wild birds (November 2016), Denmark reclaimed its
HPAI-free status on 22 February 2017. In April 2017, Denmark reported H5N8 in a white-tailed
eagle, but invoked Article 10.4.1.8 of the OIE Terrestrial Animal Health Code, which states that
member states should not impose bans on poultry or poultry commodities in response to
notification of the presence of HPAI in birds other than poultry. They have recently reported a
further nine outbreaks in white-tailed eagles, eleven outbreaks in Eurasian buzzards and a
number of outbreaks in gulls, cormorant, crows and mute swan. Denmark has reported 24
outbreaks to 15 May 2018 (follow-up report number 2). The last reported case was on 15 April
2018. A final report on this event was submitted to the OIE on 22 June.
In 2016, Denmark exported 9 779 t of poultry products to South Africa, compared to 9 508 t
during 2015; an increase of 2.9 %. Imports from Denmark in 2017 totalled 16 884 t; 72.7 % more
than in 2016. Accumulated Danish imports in 2018 YTD are 11 517 t, compared to only 3 956 t in
the same period in 2017.
3.2.7 Poultry imports from Hungary for May 2018: No poultry meat was imported from Hungary in May 2018 (Graph 19). In 2016, Hungary exported
13 174 t of poultry products to South Africa, compared to 10 547 t during 2015; an increase of
24.9 %. Nothing was imported through 2017 or in 2018 YTD.
Hungary experienced a single avian influenza event in late March 2015, which was declared
resolved in an OIE report issued on the 8 April 2015. However, from 1 December 2016, Hungary
reported 294 outbreaks (206 045 cases) of H5N8 HPAI in poultry operations housing fattening
turkeys, geese and ducks. Only 135 of the cases were in wild birds. There have been 95 772
deaths amongst the birds and almost 2 million birds have been culled. The last case reported to
the OIE was dated 18 April 2017 and a final report was submitted on 16 June 2017.

16
3.2.8 Poultry imports from Spain for May 2018:
Through 2018 YTD, no poultry meat has been imported from Spain.
On 3 January 2017, Spain reported a single case of H5N8 HPAI in a wild greylag goose to the
OIE; found in the central north of the country. On 18 February, highly pathogenic H5N8 was
found on a commercial duck farm in the province of Cataluna. A pre-emptive cull of 17 077 birds
followed the death of 723 ducks. This event increased to ten outbreaks, with 997 cases and
nearly 27 000 birds culled. No further cases were reported after 18 February 2017 and the
0
200
400
600
800
1,000
1,200
1,400
1,600
1,800
May
-14
Au
g-1
4
No
v-1
4
Feb
-15
May
-15
Au
g-1
5
No
v-1
5
Feb
-16
May
-16
Au
g-1
6
No
v-1
6
Feb
-17
May
-17
Au
g-1
7
No
v-1
7
Feb
-18
May
-18
Tonnes Graph 19: Poultry imports from Hungary
0
500
1,000
1,500
2,000
2,500
3,000
3,500
4,000
4,500
5,000
May
-14
Au
g-1
4
No
v-1
4
Feb
-15
May
-15
Au
g-1
5
No
v-1
5
Feb
-16
May
-16
Au
g-1
6
No
v-1
6
Feb
-17
May
-17
Au
g-1
7
No
v-1
7
Feb
-18
May
-18
Tonnes Graph 20: Poultry imports from Spain

17
Spanish submitted a final report to the OIE on 30 May 2017, reclaiming the country’s HPAI-free
status with effect from 2 June 2017.
In 2016, Spain exported 39 620 t of poultry products to South Africa, compared to 27 090 t during
2015; an increase of 46.3 %. Accumulated imports from Spain in 2017 totalled 11 138 t; 61 %
less than in 2016.
3.2.9 Poultry imports from Belgium for May 2018:
From late January 2017, Belgium reported H5N8 HPAI in wild birds in the central provinces of the
country: Oost-Vlaanderen, Vlaams Brabant and Wallon Brabant; and in Limburg province,
neighbouring the Netherlands. Between 22 May and 7 July 2017, the country reported at least
eleven outbreaks of HPAI in domestic poultry in the provinces of Luxembourg, Hainut, West
Vlaanderen, Liege and Namur (the southern provinces of Belgium, bordering France).
Confusingly, this report was labeled “non-poultry” on the OIE site, despite being in domestic-type
birds. The last reported case was on 7 July and a final report was submitted on 24 July 2017.
These were the first HPAI events in domestic poultry in Belgium in seven years and the July 2017
to May 2018 crash in Belgian imports relates directly to these outbreaks. There were signs that
the Belgians were returning to the market (340 kilogrammes in December 2017 and 23 tonnes in
January 2018 (Graph 21; volume too small to be visible)), but no Belgian imports were recorded
from February through May 2018.
In 2016, Belgium exported 24 256 t of poultry products to South Africa, compared to 35 613 t
during 2015; a decrease of 31.9 %. Imports from Belgium in 2017 totalled 23 451 tonnes; 3.3 %
down on 2016. Only 23 tonnes have been imported in 2018 YTD.
0
500
1,000
1,500
2,000
2,500
3,000
3,500
4,000
4,500
5,000
May
-14
Au
g-14
No
v-1
4
Feb
-15
May
-15
Au
g-15
No
v-1
5
Feb
-16
May
-16
Au
g-16
No
v-1
6
Feb
-17
May
-17
Au
g-17
No
v-1
7
Feb
-18
May
-18
Tonnes Graph 21: Poultry imports from Belgium

18
3.2.10 Poultry imports from Poland for May 2018:
Poland entered the South African market in August 2016. In May 2018, no imports of poultry
meat were received from Poland.
On 7 December 2016, Polish veterinary authorities notified the OIE of H5N8 HPAI in wild birds
(24 cases). Poland reported a total of 133 outbreaks of HPAI (56 227 cases) in wild birds,
backyard flocks and commercial poultry. On 27 January, Poland added 2 cases of H5N5 in wild
swans, reported from the west of the country. Over 1 million birds were culled in response to the
outbreak but the last outbreak was recorded on 15 March 2017 and Poland submitted a final
report to the OIE on 20 April. The species of domestic bird affected in the outbreaks is not
specified in the OIE report. In 2016, 4 773 t of Polish poultry products were imported but Poland
has been excluded from the South African market from February 2017.
3.3 Poultry imports from Argentina for May 2018:
In May 2018, 1 973 t of poultry meat were imported from Argentina at an FOB value of R18.8 m
(Graph 22). Imports decreased by 32.2 % (- 937 t) on a monthly basis but increased by 22.2 %
on a yearly basis (+ 356 t). During this month, 4.2 % of total poultry imports came from Argentina;
and 36.3 % of Argentinian imports were chicken carcasses; 2.6 % mechanically deboned
chicken; 16.0 % frozen chicken offals (livers and other); 34.1 % frozen chicken wings; 7.0 %
frozen chicken leg quarters; and 5.9 % “other” bone-in portions.
0
500
1,000
1,500
2,000
2,500
3,000
3,500
4,000
4,500
5,000
May
-14
Au
g-1
4
No
v-1
4
Feb
-15
May
-15
Au
g-1
5
No
v-1
5
Feb
-16
May
-16
Au
g-1
6
No
v-1
6
Feb
-17
May
-17
Au
g-1
7
No
v-1
7
Feb
-18
May
-18
Tonnes Graph 22: Poultry imports from Argentina

19
Poultry imports from Argentina for May 2018:
Tariff Description Import Quantity in
kg FOB Import
Price in R Unit Price in
R per kg
0207.1210 Chicken: Not cut in pieces, Frozen Mechanically Deboned Meat 51,900 R 416,511 R 8.03 0207.1220 Carcasses (excluding necks and offal) with all cuts (e.g. thighs,
wings, legs and breasts) removed 716,615 R 3,284,170 R 4.58
0207.1421 Chicken: Offal: Livers 40,800 R 285,800 R 7.00 0207.1429 Chicken: Offal: Other 235,576 R 1,145,730 R 4.86 0207.1493 Chicken: Other: Leg quarters 138,315 R 1,643,468 R 11.88 0207.1495 Chicken: Other: Wings 672,233 R 11,249,125 R 16.73 0207.1499 Chicken: Other: Other 117,300 R 823,893 R 7.02
Total for: Argentina in May 2018 1,972,739 R 18,848,697 R 9.55
In 2016, Argentina exported 18 713 t of poultry products to South Africa, compared to 27 718 t
during 2015; a decrease of 32.5 %. Accumulated imports from Argentina totalled 32 816 t in
2017; 75.4 % up on 2016. Accumulated Argentinian imports in 2018 YTD (15 113 t) are 60 % up
on imports in the same period in 2017.
3.4 Poultry imports from the USA in May 2018:
Imports of frozen bone-in portions, until recently subject to anti-dumping duties, resumed from the
USA in January 2016. Imports from the US totalled a staggering 25 103 t in March 2017 as
annual quota was filled (Graph 23). The following March, 12 664 tonnes were imported at the
end of the quota period. According to SARS data, total US imports of bone-in portions for the
April 2017 – March 2018 cycle was 69 305 tonnes, against a quota of 65 000 tonnes.
Imports in May 2018 totalled 6 269 tonnes and were valued at R70.3 million (FOB). May’s imports
were up 21.6 % (+ 1 114 t) on April’s imports and up 5.5 % on May 2017 levels (+ 329 t).
0
7,000
14,000
21,000
28,000
May
-14
Au
g-1
4
No
v-1
4
Feb
-15
May
-15
Au
g-1
5
No
v-1
5
Feb
-16
May
-16
Au
g-1
6
No
v-1
6
Feb
-17
May
-17
Au
g-1
7
No
v-1
7
Feb
-18
May
-18
Tonnes Graph 23: Poultry imports from the United States

20
American imports accounted for 13.3 % of total imports in May 2018. May’s imports from the US
included 42.1 % frozen chicken leg quarters; 40.2 % frozen chicken drumsticks; 0.9 % frozen
chicken wings; 2.6 % frozen chicken thighs; 2.3 % frozen chicken offal (“other”); 7.0 % boneless
chicken breasts; and 5.0 % frozen turkey cuts/offal.
Poultry imports from the US for May 2018:
Tariff Description Import
Quantity in kg FOB Import
Price in R Unit Price in R per kg
0207.1411 Chicken: Boneless cuts: Breasts 438,684 R 7,640,611 R 17.42 0207.1429 Chicken: Offal: Other 142,634 R 1,622,295 R 11.37 0207.1493 Chicken: Other: Leg quarters 2,640,637 R 27,394,317 R 10.37 0207.1495 Chicken: Other: Wings 54,000 R 804,123 R 14.89 0207.1497 Chicken: Other: Thighs 161,733 R 1,451,952 R 8.98 0207.1498 Chicken: Other: Drumsticks 2,519,710 R 27,535,595 R 10.93 0207.2700 Turkey: Cuts and offal, frozen; Frozen Turkey portions and MRM 311,992 R 3,854,771 R 12.36
Total for: United States in May 2018 6,269,390 R 70,303,664 R 11.21
A total of 331 t of poultry meat was imported during 2015 from the USA. In 2013 and 2014, an
estimated 11 076 and 5 022 t entered SA, so imports had dropped substantially in two years.
However, in 2016, 26 573 t of poultry products were imported from the US. Imports from the US
in 2017 totalled 87 059 t (+ 228 % up on 2016). Accumulated US imports in 2018 YTD (38 768 t)
are 15.4 % down on imports in the same period in 2017.
The US reported a case of H5N2 in a hunted mallard duck in Fergus County, Montana (27
December 2016) and two outbreaks of H7N9 in separate broiler breeder flocks in Lincoln County,
Tennessee (3 and 13 March 2017). In these outbreaks, 128 000 breeders were culled. No further
cases were reported in 2017.
3.5 Poultry imports originating from other countries:
0
200
400
600
800
1,000
1,200
1,400
May
-14
Au
g-1
4
No
v-1
4
Feb
-15
May
-15
Au
g-1
5
No
v-1
5
Feb
-16
May
-16
Au
g-1
6
No
v-1
6
Feb
-17
May
-17
Au
g-1
7
No
v-1
7
Feb
-18
May
-18
Tonnes Graph 24: Poultry imports from Thailand

21
In May 2018, 690 t of poultry meat were imported from Thailand (Graph 24), up from 444 t in April
(+ 246 tonnes; + 55.3 %). In May, 39.8 % of the Thai imports were mechanically deboned
chicken (MDM); 56.8 % frozen boneless chicken cuts (breasts) and 3.3 % duck products.
Thailand accounted for 1.5 % of total poultry exports in May; at an FOB value of R14.5 million.
Poultry imports from Thailand for May 2018:
Tariff Description Import
Quantity in kg FOB Import
Price in R Unit Price in R per kg
0207.1210 Chicken: Not cut in pieces, Frozen Mechanically Deboned Meat 274,890 R 1,869,183 R 6.80
0207.1411 Chicken: Boneless cuts: Breasts 392,268 R 11,543,279 R 29.43
0207.4200 Ducks, Not cut in pieces, frozen 18,998 R 750,966 R 39.53
0207.4500 Ducks, Other, frozen 4,000 R 308,305 R 77.08
1602.3290 Chicken: Flavoured, herbed or marinated 31 R 6,542 R 211.03
Total for: Thailand in May 2018 690,187 R 14,478,275 R 20.98
In 2016, Thailand exported 2 078 t of poultry products to South Africa, compared to 7 616 t during
2015; a decrease of 72.7 %. Imports from Thailand in 2017 totalled 4 019 t; an increase of 93.4
% on 2016. Accumulated Thai imports in 2018 YTD (3 437 t) are 37.9 % up on imports in the
same period in 2017.
In May 2018, 596 t of poultry meat were imported from Canada at an FOB value of R7.7 m
(Graph 25). Canadian imports made up 1.3 % of total poultry imports into South Africa in May and
were up 3.5 % on April 2018 levels (+ 20 t). Imports were down 834 tonnes (- 58.3 %) on May
2017 levels. Of the Canadian imports in May, 55.8 % was frozen turkey cuts and offal; 8.9 % was
frozen chicken bone-in drumsticks and 35.3 % frozen chicken leg quarters.
0
700
1,400
2,100
2,800
May
-14
Au
g-1
4
No
v-1
4
Feb
-15
May
-15
Au
g-1
5
No
v-1
5
Feb
-16
May
-16
Au
g-1
6
No
v-1
6
Feb
-17
May
-17
Au
g-1
7
No
v-1
7
Feb
-18
May
-18
Tonnes Graph 25: Poultry imports from Canada

22
Poultry imports from Canada for May 2018:
Tariff Description Import Quantity in kg
FOB Import Price in R
Unit Price in R per kg
0207.1493 Chicken: Other: Leg quarters 210,400 R 2,140,814 R 10.17 0207.1498 Chicken: Other: Drumsticks 53,000 R 745,856 R 14.07 0207.2700 Turkey: Cuts and offal, frozen; Frozen Turkey portions and MRM 332,991 R 4,770,670 R 14.33
Total for: Canada in May 2018 596,391 R 7,657,340 R 12.84
In 2016, 8 884 t of poultry products were imported from Canada. Accumulated imports from
Canada in 2017 totalled 14 431 t; up 62.4 % on 2016. Accumulated Canadian imports in 2018
YTD (2 755 t) are 67.1 % down on imports in the same period in 2017.
Disclaimer: The views expressed in SAPA STATS reports reflect those of SAPA in collaboration with its independent consultants and do not constitute any specific advice as to decisions or actions that should be taken. While every care has been taken in preparing documents no representation nor warranty or any expressed or implied undertaking is given and no responsibility or liability is accepted by SAPA as to the accuracy or completeness of the information contained herein whether as electronic data or as a finished report. SAPA or its independent consultants do not accept responsibility or liability for any damages of whatsoever nature which any person may suffer as a result of any decision or action taken on the basis of the information contained herein. All opinions and estimates contained in the reports may be changed after publication without notice. All forecasts of future production, prices, trade or feed and feed ingredient trends are based on the opinion of independent consultants contracted to SAPA. These forecasts are for guideline purposes only and SAPA does not, in any way, warrant that these predictions will be realised. SAPA therefore cautions any user of this information to treat it in an appropriate manner. These statistical reports and/or electronic data are placed in the public domain and may be used by other parties conditional to the source of the data/ report being attributed to SAPA.