Embed Size (px)
Citation preview
Jude Ranasinghe
Director of Consultancy and Training
01908 424 387
FINANCE WITH VISION
LG Futures, Technology House, 151 Silbury Boulevard, Milton Keynes MK9 1LH | www.lgfutures.co.uk | T. 01908 424387
Local Government Futures Ltd. Incorporated in England and Wales under registration number: 05308266 | VAT registration number: 855940493
South East England Councils:
Fair Funding for the South East
Stage 2 Research Report
November 2011
Fair Funding for the South East Stage 2 Research Report
FINANCE WITH VISION 2
Contents
1. Introduction ....................................................................................... 3
2. Implications of Changes to the Current Funding Formulae ................. 6
3. Business Rates Retention ............................................................... 25
4. Incentive Measures ......................................................................... 31
Fair Funding for the South East Stage 2 Research Report
FINANCE WITH VISION 3
1. Introduction
1.1 South East England Councils (SEEC) was established in April 2009 to promote the views and
interests of local government in the region, with a large majority of the 74 unitary, county, district
and borough councils across the South East being members of SEEC. Much of SEEC's work
involves making the case for the high level strategic and funding priorities for the South East.
1.2 LG Futures was commissioned by SEEC in March 2011 to undertake research into the specific
public sector funding issues and cost pressures for the South East, with a particular focus upon
local government. The research took place in the context of the Department for Communities
and Local Government's (DCLG's) Local Government Resource Review, which also
commenced in March 2011.
1.3 The report updates previous research carried out by LG Futures in 2007 for the South East
County Leaders Group (SECL), working with Oxford Economics. This 2007 report, “Taken for
Granted: Why Britain needs a Fair Deal for the South East”, considered public sector funding
issues affecting county councils in the South East and parts of the East of England1.
1.4 Stage 1 of LG Futures' research was presented to SEEC Executive Members on 7 June 2011.
This research focused upon the background to the current local government funding system,
funding levels for the South East and key cost pressures for the region. The main summary
findings of the Stage 1 research included:
The SE region received the lowest Formula Grant per head from 2009/10 to 2011/12
and is expected to continue to do so for the provisional 2012/13 allocation. Average
Formula Grant for 2011/12 for the SE region was £374 per head, with the average for
England being £560 per head and the average for London (the highest funded region)
being £834 per head.
The SE has experienced the second highest Council Tax increase over the last 15
years; at 129% (the highest was the East of England at 132% and the lowest was the
North West at 84%).
Of the 10 Strategic Health Authorities (SHAs) nationally, the South Central SHA is the
lowest funded at £1,401 per head, which is 13% below the England average. The South
East Coast SHA, at £1,551 per head, is funded 4% below the England average and is
the 5th lowest funded overall. Taken together, the South East Coast and South Central
SHA's have 58% of their Primary Care Trusts (PCTs) funded in the lower quartile, which
is the largest proportion nationally.
At £257 per head, the SE had the lowest level of capital funding in 2009/10. This
compared with the England average of £412 per head (excluding the Greater London
Authority). The SE has also consistently had the lowest level of capital funding per head
of population of all regions over the period 2005/06 to 2009/10.
1 http://www3.hants.gov.uk/finance_report.pdf
Fair Funding for the South East Stage 2 Research Report
FINANCE WITH VISION 4
The SE has seen the largest increase in relative deprivation between the Indices of
Deprivation 2007 and Indices of Deprivation 2010, with an increase of 6.8%. The second
highest increase was for the East of England, at 2.6%. The SE has also had more
people move into the 20% most deprived areas in England of any region between 2007
and 2010, with an additional 88,500 people in the SE moving into the two most deprived
deciles, compared to a reduction of 151,000 people for the London region.
Over the period 2005/06 to 2009/10, spending on older people's (65+) social care has
increased by 16% in the SE, the largest of any region in England (the England average
was 10%). This can be compared with a population increase of only 8% during the same
period, with spending therefore increasing at twice the rate of the change in population.
Combining population and expenditure projections, spending on older people's social
care is projected to rise faster in the SE than any other region, representing an increase
in spend of 70%, from £1.2bn in 2009/10 to £2.0bn in 2020/21. The equivalent England
increase in spending is 54%, and the next highest regional increase is 56%.
The SE has higher unit costs for a range of social care services. In 2009/10, unit costs in
the SE were: 12% above the national average for nursing and residential care; 7%
above the national average for home care; 12% above the national average for
residential care; and 5% above the national average for foster care. This compares with
the SE region's 4.4% uplift from the Area Cost Adjustment in its needs assessment.
1.5 Given the above context, the intention of the Stage 2 research was to consider the impact of
potential changes to the funding system. The research explored three key themes:
1. Implications of making changes to the current funding formulae. This included
analysing the financial impact of:
i. Potentially making the existing funding system more transparent
ii. Changing specific components/indicators currently used within the
funding system
iii. The operation of a simpler funding formula
2. Business Rates Retention Proposals. The government published its consultation
paper outlining the principle features of a proposed business rates retention scheme, in
July 2011, and eight further technical papers to supplement the initial consultation
paper, in August 2011. Analysis was undertaken to consider:
i. The current net contribution that the SE makes to the national business
rates “pool”
ii. The potential size of the “incentive” available under the proposals
Fair Funding for the South East Stage 2 Research Report
FINANCE WITH VISION 5
iii. The potential impact of various consultation options put forward about the
operation of the scheme
iv. The potential impact of the scheme compared to Formula Grant
3. The operation of other incentive schemes. In addition to the business rates retention
proposals, there are a range of other “incentive” schemes in operation and the key
features of these schemes and specific issues for the SE region have been considered.
The schemes considered were:
i. New Homes Bonus
ii. Community Infrastructure Levy
iii. Business Improvement Districts
iv. Tax Increment Financing
v. Business Rate Supplement
vi. Business Increase Bonus Scheme
vii. Renewable Energy Projects
viii. National Insurance Contribution Reductions
ix. Enterprise Zones

Fair Funding for the South East Stage 2 Research Report
FINANCE WITH VISION 6
2. Implications of Changes to the Current Funding Formulae
Introduction
2.1 This section considers the existing local government funding system (the “four block” model)
and considers changes that could be made to the system, including the potential funding
implications. The changes considered relate to:
i. Potentially making the existing funding system more transparent
ii. Changing specific components/indicators currently used within the funding system
iii. The operation of a simpler funding formula
2.2 The local government funding formulae receive considerable attention and are the subject of
significant debate, both within local government and between local and central government. As
context, it is worth considering some of the key reasons that result in this focus.
2.3 The CLG's July 2011 consultation, “Local Government Resource Review: Proposals for
Business Rates Retention”, identified that, “Britain's local government finance system is one of
the most centralised in the world. The Organisation for Economic Co-operation and
Development (OECD) has calculated that local authorities in the USA, Spain, France, Germany,
Spain and Japan all have greater autonomy over budgets than do their counterparts here.”
2.4 As an illustration, in 2010/11, 74% of total local government revenue spending in England was
derived from central government grants, with only 26% being locally “controlled” (from Council
Tax and sales, fees and charges), although there are restrictions on the extent to which income
can be raised from these sources.
2.5 Clearly, other countries have different contexts; for example, responsibility for different
functions, but local government in England is only able to “control” property taxes i.e. Council
Tax, given that business rates, although currently collected locally, are paid into the national
pool and then distributed as government grant. In addition, even with CLG's business rates
retention proposals, local government will not have control over the multiplier (the rate of tax),
which will continue to be set nationally.
2.6 Given this context, the funding received through Formula Grant (£29.4bn in 2011/12) is highly
important to local government and the mechanism by which this funding is distributed is key.
Alternative means of distributing this funding have therefore been considered as part of this
section. It should be noted that local government funding is often described as a zero-sum
game, in that there is only a fixed quantum of funding available, and distributional changes for
any individual authority or group of authorities results in changes in funding for all other
authorities.

Fair Funding for the South East Stage 2 Research Report
FINANCE WITH VISION 7
2.7 Analysis has therefore been presented to show the scale of change that could result from
alternative means of distribution. It should be noted that this does not necessarily suggest that
such means of distribution are “correct” or more appropriate than the current basis, but instead
are intended to show the extent to which specific changes to individual factors within the system
influence distribution patterns between authorities.
2.8 It should also be noted that damping (as considered further below) can ‘distort’ the change that
would otherwise have occurred from making changes to the funding formulae, as this provides
an additional overlay within the system, in terms of the level of protection applied to authorities.
Current operation of the four block model
2.9 The current local government funding system is based upon the “four block” model, which was
introduced in 2006/07. Authorities are allocated Formula Grant (£29.4bn nationally for
2011/12), which can be used for any revenue purpose, using the following approach:
Relative Needs Block
Less: Relative Resources Amount
Plus: Central Allocation
Plus: Floor Damping Block
Equals: Formula Grant
2.10 In summary, the four blocks are intended to operate as follows:
Relative Needs Block – reflects spending requirements, based on local circumstances,
assessed through Relative Needs Formulae (RNF) and taking account of
population/client numbers and a range of socio-economic and geographical factors
RNF are derived for seven major blocks: Children’s Services; Adults’ Personal Social
Services; Highway Maintenance; Environmental, Protective and Cultural Services;
Police; Fire & Rescue and Capital Financing
Relative Resource Amount – takes account of authorities' relative abilities to raise
local funding through Council Tax
Central Allocation – distributes funding based upon a per capita basis
Damping – provides “protection” through a grant floor
2.11 The system is complex, but the basic principle underpinning the formula is to allocate each
authority the same “basic amount” and then add “top-ups” for deprivation, population density
and sparsity and other factors. Further adjustments are added to reflect the different levels of
input costs (the Area Cost Adjustment) and, to ensure overall affordability, the calculations are
Fair Funding for the South East Stage 2 Research Report
FINANCE WITH VISION 8
scaled to the government’s “control totals” for each of the service blocks. It should be noted that
one feature of the four block model is that it is not possible to break down the grant that an
individual authority receives into separate amounts for the individual services within the RNF.
(i) Potentially making the existing funding system more transparent
2.12 Within the funding system, a series of “thresholds” are determined by the lowest need and
lowest resources authorities. The SE is home to the perceived lowest need authorities for
upper, lower and mixed tier services in 2011/12 (Wokingham for upper tier, Hart for lower tier
and Kent for mixed tier).
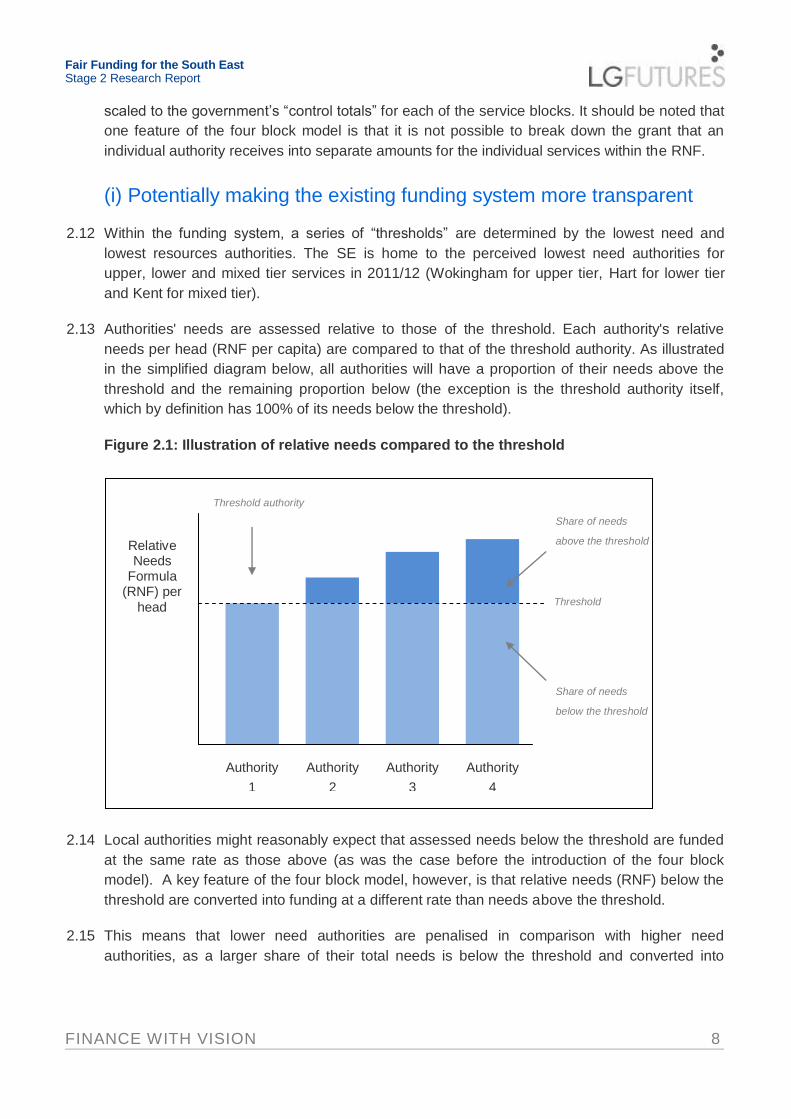
2.13 Authorities' needs are assessed relative to those of the threshold. Each authority's relative
needs per head (RNF per capita) are compared to that of the threshold authority. As illustrated
in the simplified diagram below, all authorities will have a proportion of their needs above the
threshold and the remaining proportion below (the exception is the threshold authority itself,
which by definition has 100% of its needs below the threshold).
Figure 2.1: Illustration of relative needs compared to the threshold
2.14 Local authorities might reasonably expect that assessed needs below the threshold are funded
at the same rate as those above (as was the case before the introduction of the four block
model). A key feature of the four block model, however, is that relative needs (RNF) below the
threshold are converted into funding at a different rate than needs above the threshold.
2.15 This means that lower need authorities are penalised in comparison with higher need
authorities, as a larger share of their total needs is below the threshold and converted into
Relative Needs
Formula (RNF) per
head
Authority
1
Authority
2
Authority
3
Authority
4
Share of needs
above the threshold
Share of needs
below the threshold
Threshold authority
Threshold
Fair Funding for the South East Stage 2 Research Report
FINANCE WITH VISION 9
funding at this lower rate. Councils in the SE are assessed as having the lowest funding needs
in England. On average, they therefore receive less funding for each assessed unit of need.
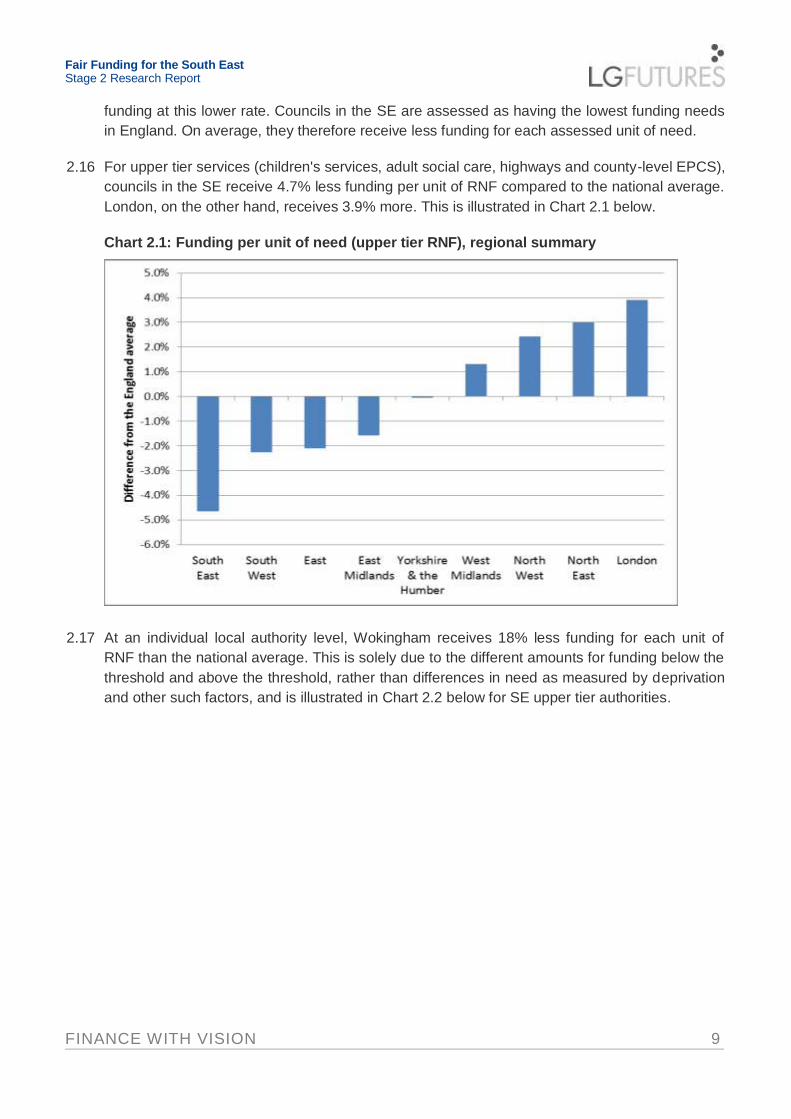
2.16 For upper tier services (children's services, adult social care, highways and county-level EPCS),
councils in the SE receive 4.7% less funding per unit of RNF compared to the national average.
London, on the other hand, receives 3.9% more. This is illustrated in Chart 2.1 below.
Chart 2.1: Funding per unit of need (upper tier RNF), regional summary
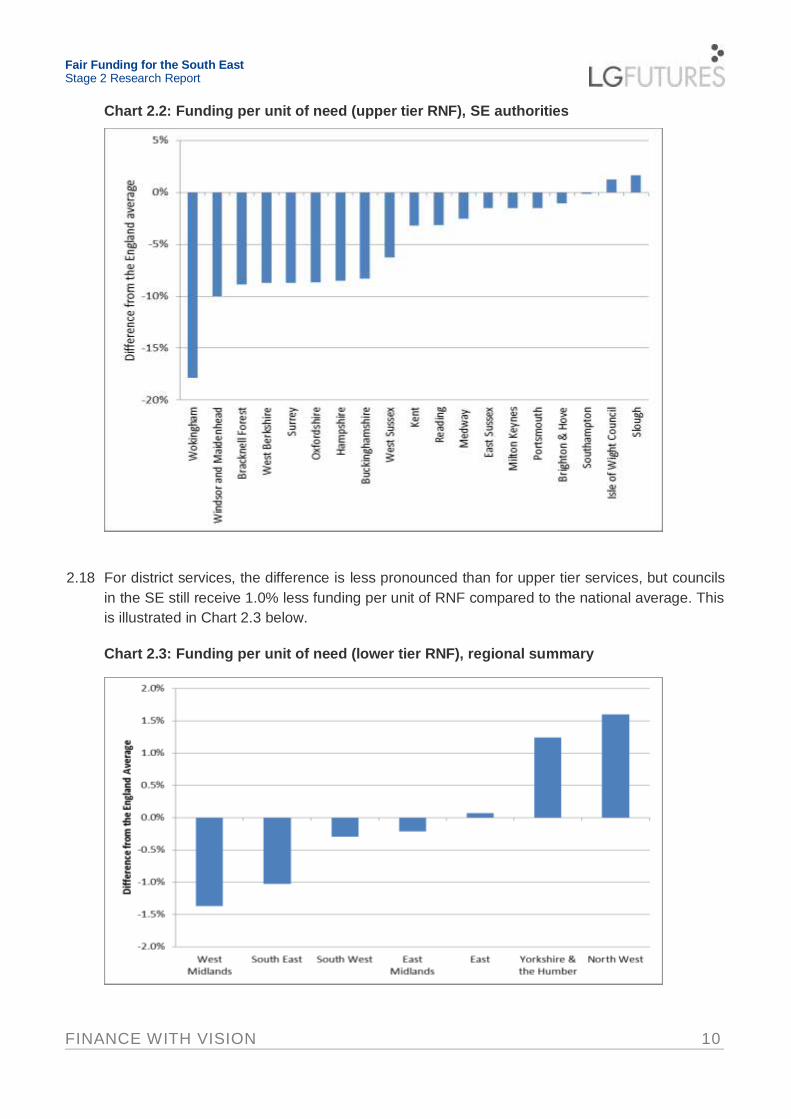
2.17 At an individual local authority level, Wokingham receives 18% less funding for each unit of
RNF than the national average. This is solely due to the different amounts for funding below the
threshold and above the threshold, rather than differences in need as measured by deprivation
and other such factors, and is illustrated in Chart 2.2 below for SE upper tier authorities.
Fair Funding for the South East Stage 2 Research Report
FINANCE WITH VISION 10
Chart 2.2: Funding per unit of need (upper tier RNF), SE authorities
2.18 For district services, the difference is less pronounced than for upper tier services, but councils
in the SE still receive 1.0% less funding per unit of RNF compared to the national average. This
is illustrated in Chart 2.3 below.
Chart 2.3: Funding per unit of need (lower tier RNF), regional summary
Fair Funding for the South East Stage 2 Research Report
FINANCE WITH VISION 11
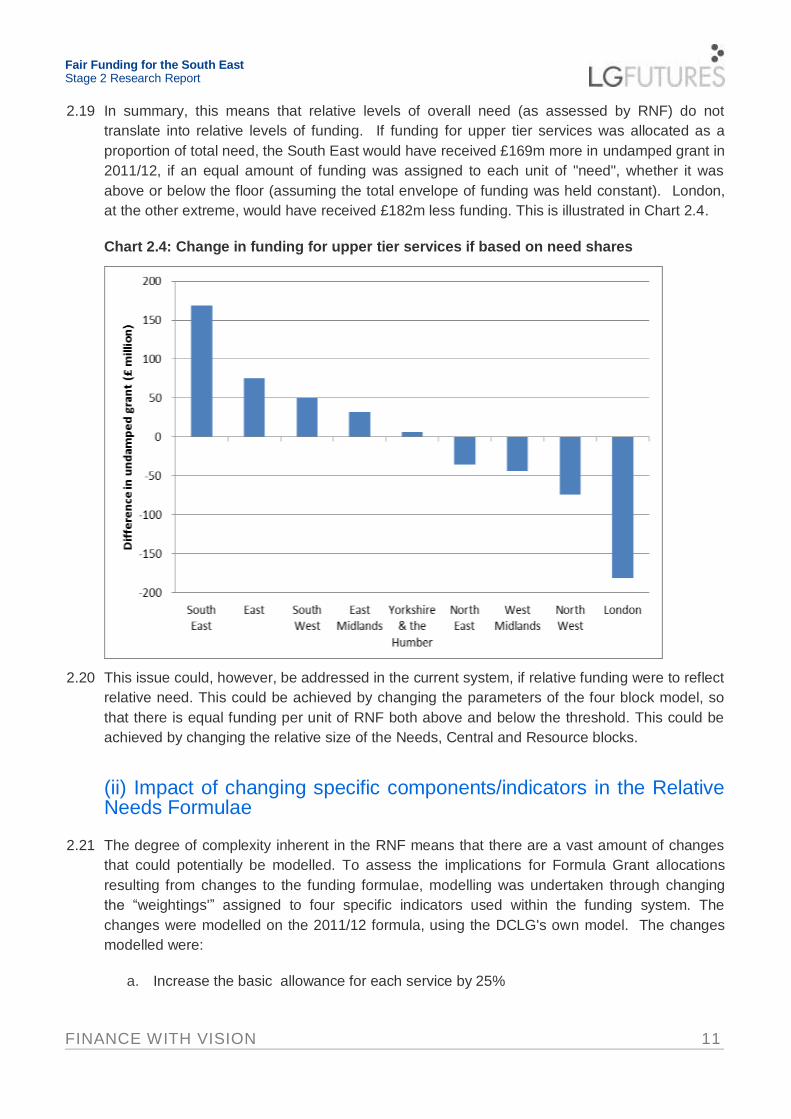
2.19 In summary, this means that relative levels of overall need (as assessed by RNF) do not
translate into relative levels of funding. If funding for upper tier services was allocated as a
proportion of total need, the South East would have received £169m more in undamped grant in
2011/12, if an equal amount of funding was assigned to each unit of "need", whether it was
above or below the floor (assuming the total envelope of funding was held constant). London,
at the other extreme, would have received £182m less funding. This is illustrated in Chart 2.4.
Chart 2.4: Change in funding for upper tier services if based on need shares
2.20 This issue could, however, be addressed in the current system, if relative funding were to reflect
relative need. This could be achieved by changing the parameters of the four block model, so
that there is equal funding per unit of RNF both above and below the threshold. This could be
achieved by changing the relative size of the Needs, Central and Resource blocks.
(ii) Impact of changing specific components/indicators in the Relative Needs Formulae
2.21 The degree of complexity inherent in the RNF means that there are a vast amount of changes
that could potentially be modelled. To assess the implications for Formula Grant allocations
resulting from changes to the funding formulae, modelling was undertaken through changing
the “weightings'” assigned to four specific indicators used within the funding system. The
changes were modelled on the 2011/12 formula, using the DCLG's own model. The changes
modelled were:
a. Increase the basic allowance for each service by 25%
Fair Funding for the South East Stage 2 Research Report
FINANCE WITH VISION 12
b. Reduce the amount allocated for deprivation by 25%
c. Reduce the amount allocated for density by 50%
d. Increase the amount allocated for sparsity by 50%
2.22 As identified previously, these scenarios were chosen to illustrate the order of magnitude of
changes between regions, rather than there being any specific statistical basis for the changes.
As highlighted above, the Formula Grant model includes a damping block to limit the financial
impact of any changes. In order that authorities are protected from detrimental grant changes,
the government sets a guaranteed minimum change in grant, compared to the previous year,
on a like-for-like basis. This is known as the grant “floor”, and is calculated separately for
different groups of authorities, depending on the services they provide.
2.20 As the total amount level of Formula Grant is fixed, the amount paid in floor damping is paid for
by scaling back the grant paid to other authorities who are above the floor. This can have a
perverse effect on the outcome of the modelling, in that authorities that may gain from a change
before damping may lose after damping has taken effect and vice versa.
2.21 As identified further below, the use of these alternative scenarios also illustrate volatility, as
changing a single component can make significant differences to distribution, but with damping
subsequently acting upon such changes, which can reduce the impact of changes in “need”
which result through operation of the formulae itself.
2.22 The use of thresholds, based on the minimum RNF per head for an authority, has already been
described above. For example, Wokingham receives the lowest RNF per head for all the unitary
authorities and the RNFs per head for every other unitary authority are therefore relative to that
of Wokingham’s. Therefore, if there are major changes to the formula and the threshold
authority’s RNF per head changes, the relative difference between the threshold authority and
other authorities also changes. This can have considerable implications for the modelling and
can result in some significant and counterintuitive outcomes.
a. Increasing the basic amount by 25%
2.23 Increasing the amount allocated through the basic allowance reduces the amounts allocated
through deprivation or other top up factors. By implication, therefore, it would be expected that
more resources would be allocated to perceived lower need authorities, to the detriment of
those with higher needs.
2.24 Each service has a basic amount, which is multiplied by the relevant client group as the first
building block in the RNF. For example, the basic formula for Older People’s Personal Social
Services (PSS) is:
Older People’s Basic Amount per person aged 65+ + Age related top up + Deprivation top up
Fair Funding for the South East Stage 2 Research Report
FINANCE WITH VISION 13
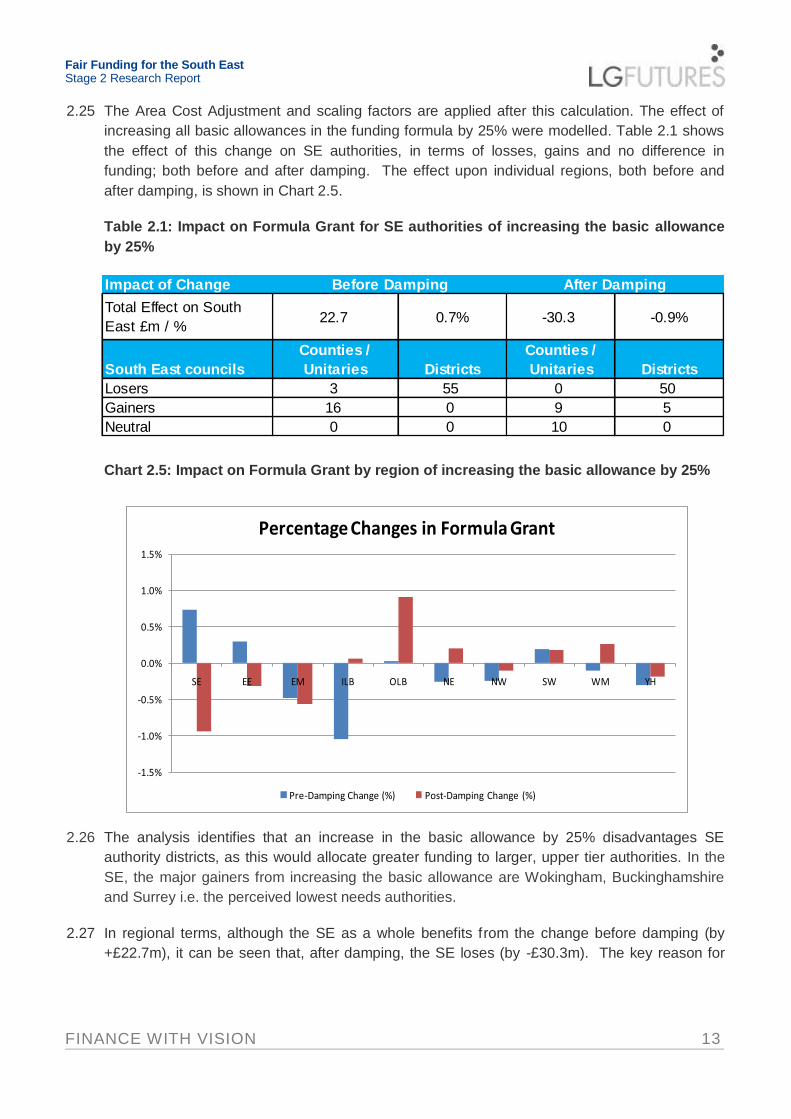
2.25 The Area Cost Adjustment and scaling factors are applied after this calculation. The effect of
increasing all basic allowances in the funding formula by 25% were modelled. Table 2.1 shows
the effect of this change on SE authorities, in terms of losses, gains and no difference in
funding; both before and after damping. The effect upon individual regions, both before and
after damping, is shown in Chart 2.5.
Table 2.1: Impact on Formula Grant for SE authorities of increasing the basic allowance
by 25%
Chart 2.5: Impact on Formula Grant by region of increasing the basic allowance by 25%
2.26 The analysis identifies that an increase in the basic allowance by 25% disadvantages SE
authority districts, as this would allocate greater funding to larger, upper tier authorities. In the
SE, the major gainers from increasing the basic allowance are Wokingham, Buckinghamshire
and Surrey i.e. the perceived lowest needs authorities.
2.27 In regional terms, although the SE as a whole benefits from the change before damping (by
+£22.7m), it can be seen that, after damping, the SE loses (by -£30.3m). The key reason for
Impact of Change
Total Effect on South
East £m / %22.7 0.7% -30.3 -0.9%
South East councils
Counties /
Unitaries Districts
Counties /
Unitaries Districts
Losers 3 55 0 50
Gainers 16 0 9 5
Neutral 0 0 10 0
Before Damping After Damping
-1.5%
-1.0%
-0.5%
0.0%
0.5%
1.0%
1.5%
SE EE EM ILB OLB NE NW SW WM YH
Percentage Changes in Formula Grant
Pre-Damping Change (%) Post-Damping Change (%)
Fair Funding for the South East Stage 2 Research Report
FINANCE WITH VISION 14
this is because of shifting thresholds in the damping block, whereby an increase in the damping
threshold tends to benefit higher needs authorities.
b. Reducing deprivation by 50%
2.28 There is a deprivation top up factor in each of the service blocks, with the exception of
Highways Maintenance and Capital Financing. The individual factors vary between service
blocks. For example, the factors included in the Older People’s PSS block are the proportions of
people aged over 65 who are:
In receipt of Income Support or Pension Credit
In receipt of Attendance Allowance
Living in rented accommodation
Living alone in a household
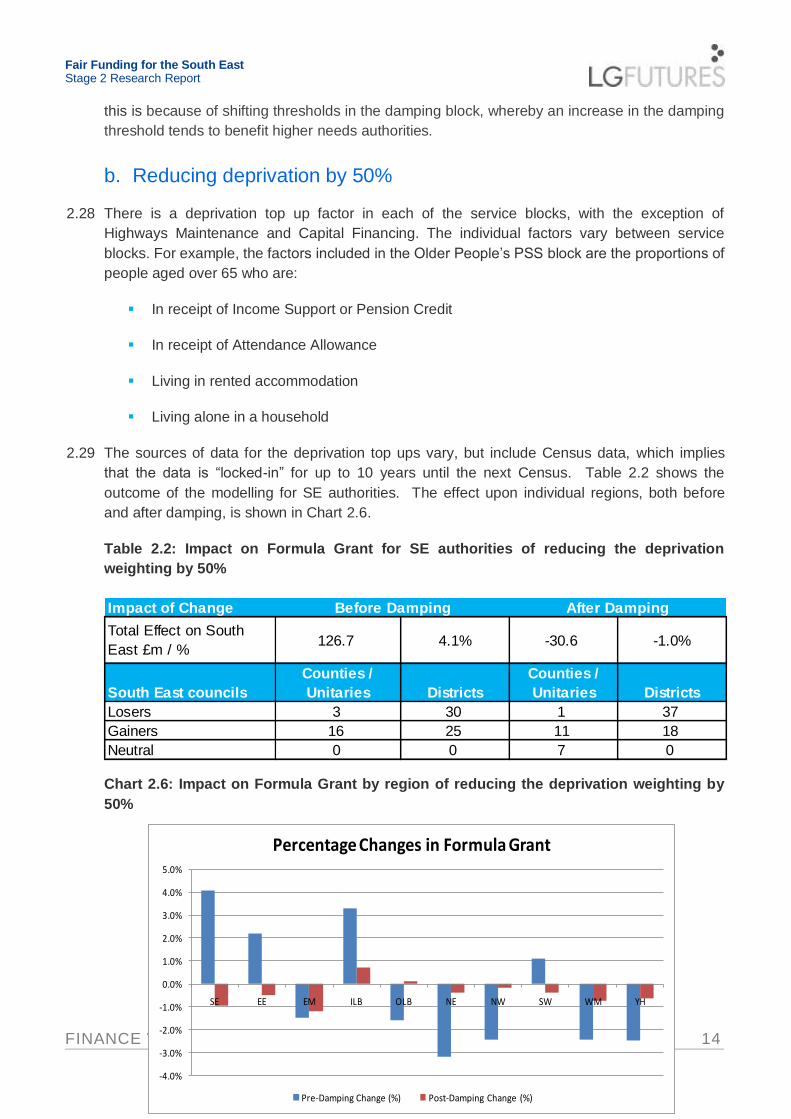
2.29 The sources of data for the deprivation top ups vary, but include Census data, which implies
that the data is “locked-in” for up to 10 years until the next Census. Table 2.2 shows the
outcome of the modelling for SE authorities. The effect upon individual regions, both before
and after damping, is shown in Chart 2.6.
Table 2.2: Impact on Formula Grant for SE authorities of reducing the deprivation
weighting by 50%
Chart 2.6: Impact on Formula Grant by region of reducing the deprivation weighting by
50%
Impact of Change
Total Effect on South
East £m / %126.7 4.1% -30.6 -1.0%
South East councils
Counties /
Unitaries Districts
Counties /
Unitaries Districts
Losers 3 30 1 37
Gainers 16 25 11 18
Neutral 0 0 7 0
Before Damping After Damping
-4.0%
-3.0%
-2.0%
-1.0%
0.0%
1.0%
2.0%
3.0%
4.0%
5.0%
SE EE EM ILB OLB NE NW SW WM YH
Percentage Changes in Formula Grant
Pre-Damping Change (%) Post-Damping Change (%)
Fair Funding for the South East Stage 2 Research Report
FINANCE WITH VISION 15
2.30 Again, the SE gains overall before damping (by +£126.7m), but loses after damping (the loss
being -£30.6m). One of the reasons for this change is that the damping model shifts resources
away from previous gainers from damping, many of whom were in the SE, to the “new” losers
from the change to the deprivation weighting.
2.31 One surprising outcome from the modelling was that Inner London, which attracts a significant
deprivation allocation, is a gainer both before and after damping under this change (although
the change after damping is lower than that before damping). This arises as a result of the
changes in thresholds that occur and highlights the inherent instability of the formula.
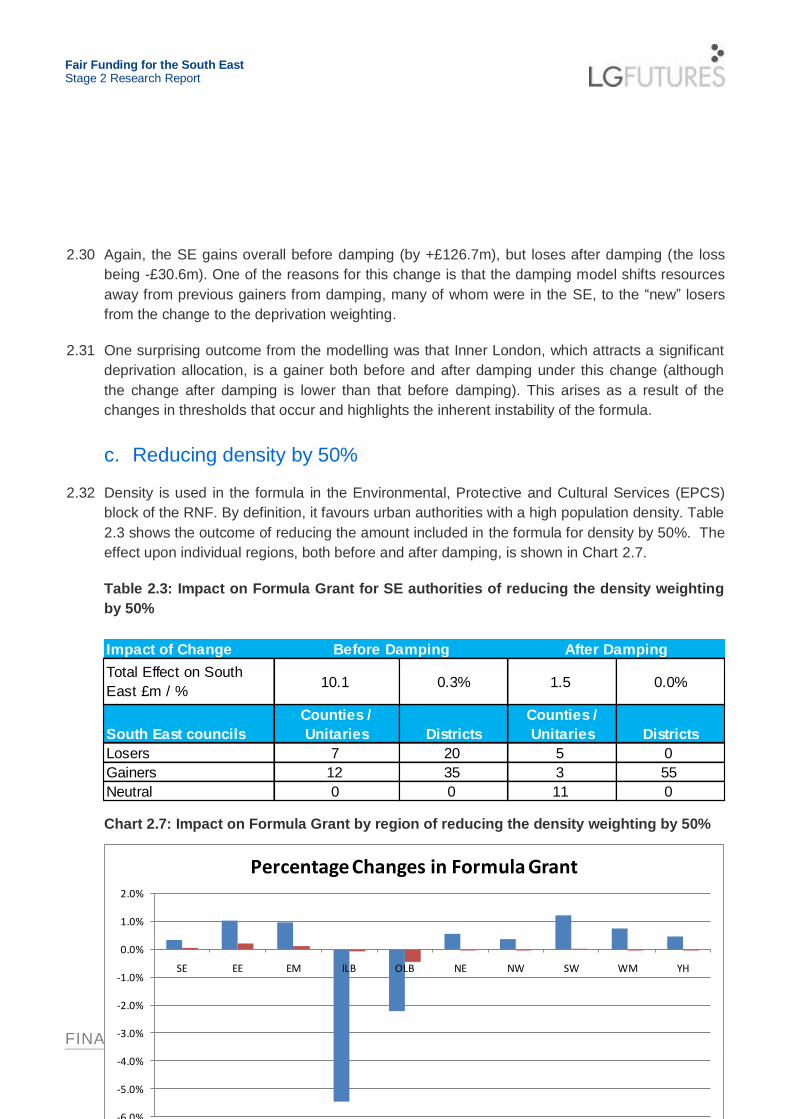
c. Reducing density by 50%
2.32 Density is used in the formula in the Environmental, Protective and Cultural Services (EPCS)
block of the RNF. By definition, it favours urban authorities with a high population density. Table
2.3 shows the outcome of reducing the amount included in the formula for density by 50%. The
effect upon individual regions, both before and after damping, is shown in Chart 2.7.
Table 2.3: Impact on Formula Grant for SE authorities of reducing the density weighting
by 50%
Chart 2.7: Impact on Formula Grant by region of reducing the density weighting by 50%
Impact of Change
Total Effect on South
East £m / %10.1 0.3% 1.5 0.0%
South East councils
Counties /
Unitaries Districts
Counties /
Unitaries Districts
Losers 7 20 5 0
Gainers 12 35 3 55
Neutral 0 0 11 0
Before Damping After Damping
-6.0%
-5.0%
-4.0%
-3.0%
-2.0%
-1.0%
0.0%
1.0%
2.0%
SE EE EM ILB OLB NE NW SW WM YH
Percentage Changes in Formula Grant
Pre-Damping Change (%) Post-Damping Change (%)
Fair Funding for the South East Stage 2 Research Report
FINANCE WITH VISION 16
2.33 The SE gains overall both before (+£10.1m) and after damping (+£1.5m) as a result of this
change. Within the SE, the urban areas of Portsmouth and Brighton and Hove are the largest
losers and Kent and Hampshire are the largest gainers. Inner London is a large loser before
damping, although damping mitigates the impact to close to zero. The absolute scale of the
change is, however, significantly less than for changes resulting from changing the basic
allocation and deprivation weighting, given that density is a relatively smaller component within
the funding formulae.
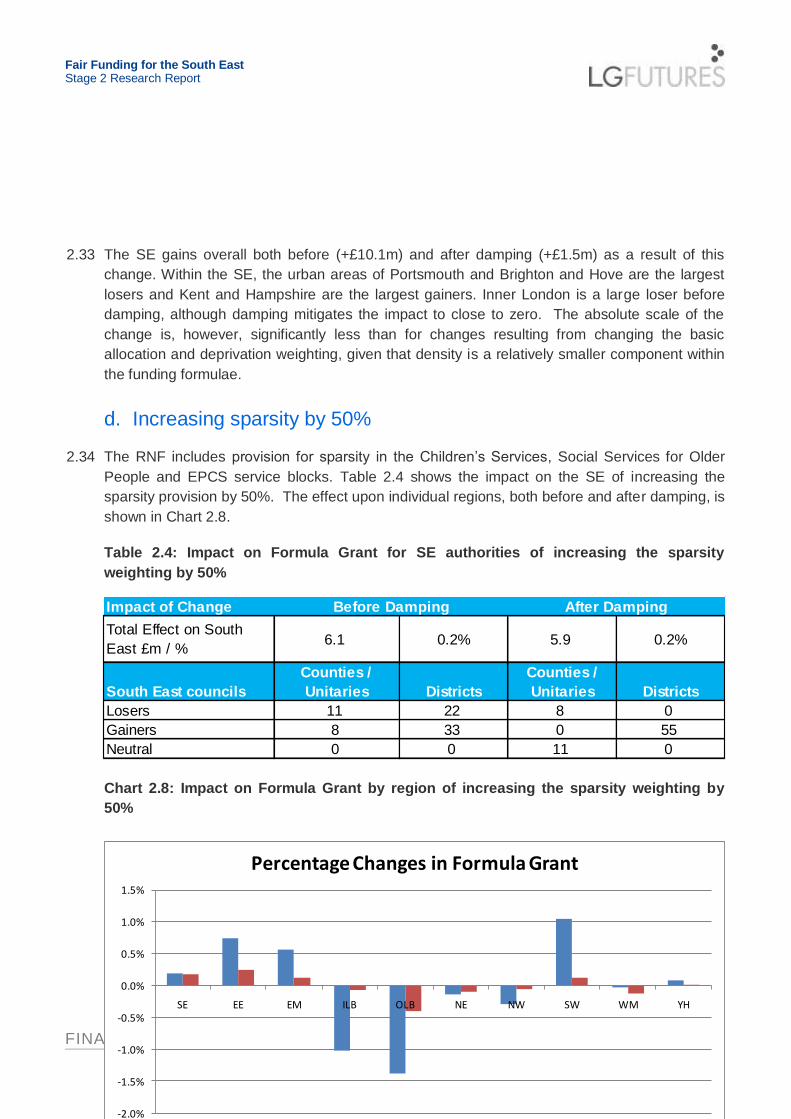
d. Increasing sparsity by 50%
2.34 The RNF includes provision for sparsity in the Children’s Services, Social Services for Older
People and EPCS service blocks. Table 2.4 shows the impact on the SE of increasing the
sparsity provision by 50%. The effect upon individual regions, both before and after damping, is
shown in Chart 2.8.
Table 2.4: Impact on Formula Grant for SE authorities of increasing the sparsity
weighting by 50%
Chart 2.8: Impact on Formula Grant by region of increasing the sparsity weighting by
50%
Impact of Change
Total Effect on South
East £m / %6.1 0.2% 5.9 0.2%
South East councils
Counties /
Unitaries Districts
Counties /
Unitaries Districts
Losers 11 22 8 0
Gainers 8 33 0 55
Neutral 0 0 11 0
Before Damping After Damping
-2.0%
-1.5%
-1.0%
-0.5%
0.0%
0.5%
1.0%
1.5%
SE EE EM ILB OLB NE NW SW WM YH
Percentage Changes in Formula Grant
Pre-Damping Change (%) Post-Damping Change (%)

Fair Funding for the South East Stage 2 Research Report
FINANCE WITH VISION 17
2.35 Increasing the provision for sparsity has a similar outcome to reducing the provision for density;
which is not unexpected, given the types of authorities most affected. As a region, the South
East gains both before (by +£6.1m) and after damping (by +£5.9m). London is a significant
loser from the change, although again this is mitigated by the damping formula. The largest
gainer is the South West, which contains counties such as Devon and Cornwall, although again,
these gains are considerably reduced by damping.
Changing RNF components – key issues
2.36 We have modelled, at a high level, the outcome of changing four individual areas within the
funding formula. Key points arising from this modelling include:
The RNF is a volatile funding formula and changes can result in unexpected outcomes.
This is predominantly because of the use of thresholds; which, coupled with fixed
national control totals, can result in counterintuitive redistribution patterns at a regional
level. For example, Inner London gains from a reduction in deprivation, despite having
some of the most deprived authorities in the country.
The damping arrangements can result in perverse outcomes. For example, the SE gains
from a reduced deprivation weighting before damping, but loses after damping, because
resources are switched to protect the "new" losers arising from the change.
Given that the SE is comprised of authorities with varying demographic and
geographical features, it is highly unlikely that there will be a change to the RNF that
would favour every authority in the region.
There are a large number of changes to the funding formula that could be modelled,
many of which involve the use of judgment and which are therefore not evidence-based.
Although there is clearly potential for ministerial judgment within the funding formulae,
the use of current indicators within the formulae have been statistically tested, and the
options selected for this modelling exercise have been chosen purely for illustrative
purposes, to identify the potential scale of the change.
(iii) Developing a simpler funding formula
2.37 As identified previously, the current funding formulae are complex in nature and contain a large
number of indicators. Modelling therefore took place to identify the effect of a “simple formula”,
with this being developed for two different elements of current funding for local government -
Fair Funding for the South East Stage 2 Research Report
FINANCE WITH VISION 18
social services for older people (an upper tier service) and lower tier Environmental, Protective
and Cultural Services (EPCS). For each of these areas, three separate models were developed,
with each model attributing funding to local authorities based upon:
Model 1: Population only. For this model, funding was simply distributed based on population
only, using the total funding currently allocated to the service area divided by the relevant
population for each service block to give a “per capita” allocation. This was multiplied by the
service block population for each local authority to calculate its allocation.
Model 2: Population and Deprivation. For this model, the approach started with calculating a
standardised IMD score for each local authority. This standardised IMD score was then used to
calculate a weighted service block population for each local authority. The weighted population
was calculated as follows:
Local authority population + (10% of local authority population * IMD standardised score)
Therefore, for local authorities with standardised IMD scores less than 0 (i.e. lower levels of
deprivation), the weighted population would be less than the actual population to represent
lower levels of need. For local authorities with standardised IMD scores greater than 0 (i.e.
higher levels of deprivation), the weighted population would be higher than the actual
population to represent higher levels of need.
A new “per head” allocation was then calculated and this was multiplied by the IMD-weighted
service block population for each local authority to calculate its allocation.
The overall impact of this approach was to increase allocations to local authorities with higher
levels of deprivation. An assumption of 10% was used in this model to approximate the
weighting currently applied to need factors in the RNF. Changing the assumption would have
the following impact:
Using a value of more than 10% would transfer more funding to authorities with higher levels of deprivation, moving funding away from authorities with lower levels of deprivation; and
Using a value of less than 10% would transfer less funding to authorities with higher levels of deprivation, moving funding back to authorities with lower levels of deprivation.
Model 3: Population, Deprivation and Area Costs. For this model, the modelling followed a
similar approach to that outlined above. The IMD weighted population was calculated as
above and the IMD weighted population was then multiplied by the ACA value for each local
authority (ranging from 1.000 to 1.198) to give a new weighted population.
Fair Funding for the South East Stage 2 Research Report
FINANCE WITH VISION 19
A new “per head” allocation was then calculated and this was multiplied by the ACA-and-IMD-
weighted service block population for each local authority to calculate its allocation. The
overall impact of this approach was to increase allocations to local authorities with higher
levels of ACA when compared with the model based on IMD only.
2.37 Variations in deprivation were measured using the Index of Multiple Deprivation (IMD) as a
proxy indicator. Variations in area costs were measured using the Area Cost Adjustment (ACA).
Two main data sources were used to undertake the modelling:
The 2010 Index of Multiple Deprivation (IMD) ; and
The 2011/12 local government settlement data.
2.38 The IMD is a composite indicator, drawing together a range of economic, social and housing
issues. It was used in this analysis as a proxy for need i.e. to identify authorities with higher
levels of need associated with deprivation, which should impact on the amount of funding that
they would receive through the simple models. The IMD provides a single deprivation “score”
for each small area in England and the small area scores are also uplifted to scores for upper
and lower tier authorities.
2.39 For the modelling relating to Older People’s Social Care, the overall scores (and relative
ranking) for upper tier authorities were obtained. For the modelling relating to lower tier EPCS,
the overall scores (and relative ranking) relating to lower tier authorities were obtained.
2.40 Using this data, IMD scores were standardized relative to zero to provide a measure of relative
deprivation compared to other authorities i.e. authorities with a standardized score of less than
zero were the least deprived and authorities with a standardized score of greater than zero
were the most deprived.
2.41 The standardized IMD scores for the upper tier authorities ranged from 2.36 (for the highest
level of deprivation) to -2.07 (for the lowest level of deprivation). This approach provided a
simple method for identifying relative deprivation2.
2.42 The 2011/12 Local Government Settlement Data was obtained from the DCLG. From the
settlement data spreadsheets, data was obtained on:
The quantum of funding allocated through the relative needs formulae (RNF);
The proportion of funding allocated through each RNF;
The proportion of funding allocated to each authority for each RNF;
The relevant service block population data used in each of the funding elements being
investigated (i.e. older people and lower tier population statistics); and
2 The individual IMD scores provide a relative measure of deprivation but need to be interpreted with care i.e. if an authority has a score
which is twice the value of the score for its neighbour, this should not be interpreted as it having twice the level of deprivation. This is why the approach has been used to create standardised scores.
Fair Funding for the South East Stage 2 Research Report
FINANCE WITH VISION 20
The ACA data for each funding stream was used as the measure for variable input costs
to take account of differences in labour costs and business rates.
Modelling approach – changes in funding share
2.43 The RNF data does not explicitly identify how much funding each local authority receives for
each of the funding blocks and the current four block model, on which the Relative Needs
Formula is based, does not allow a simple calculation of the breakdown of an authority’s
Formula Grant into cash amounts for each service block.
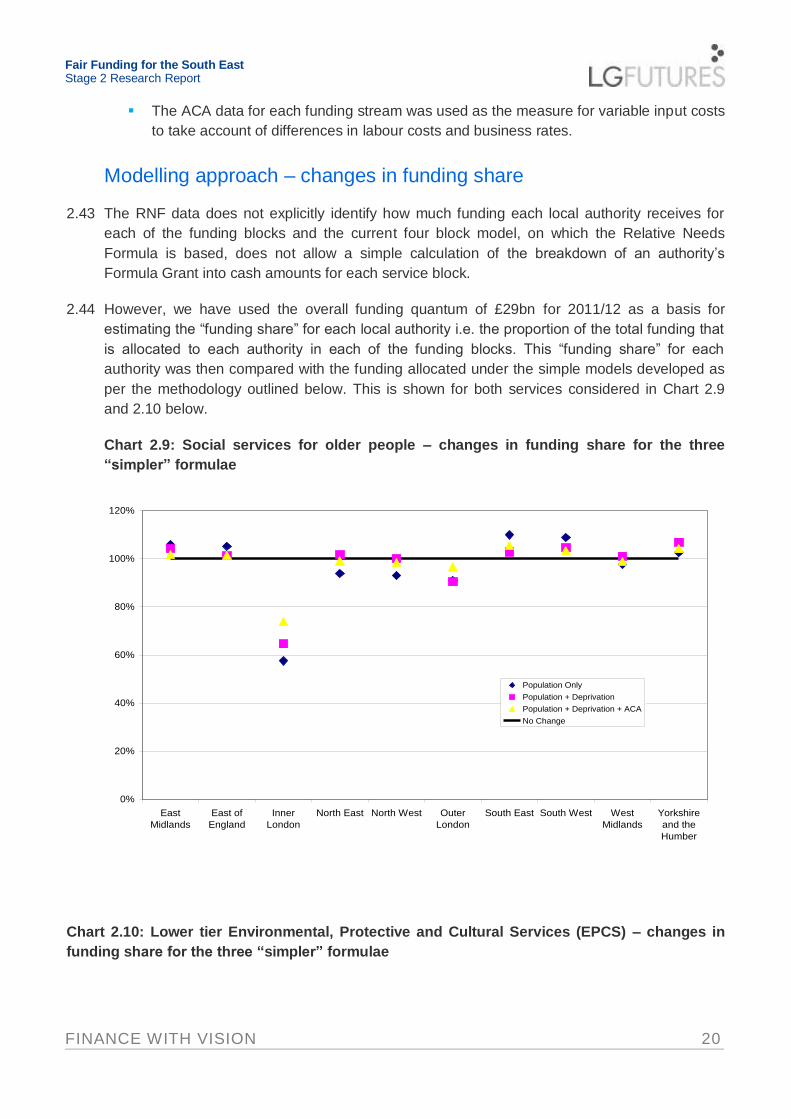
2.44 However, we have used the overall funding quantum of £29bn for 2011/12 as a basis for
estimating the “funding share” for each local authority i.e. the proportion of the total funding that
is allocated to each authority in each of the funding blocks. This “funding share” for each
authority was then compared with the funding allocated under the simple models developed as
per the methodology outlined below. This is shown for both services considered in Chart 2.9
and 2.10 below.
Chart 2.9: Social services for older people – changes in funding share for the three
“simpler” formulae
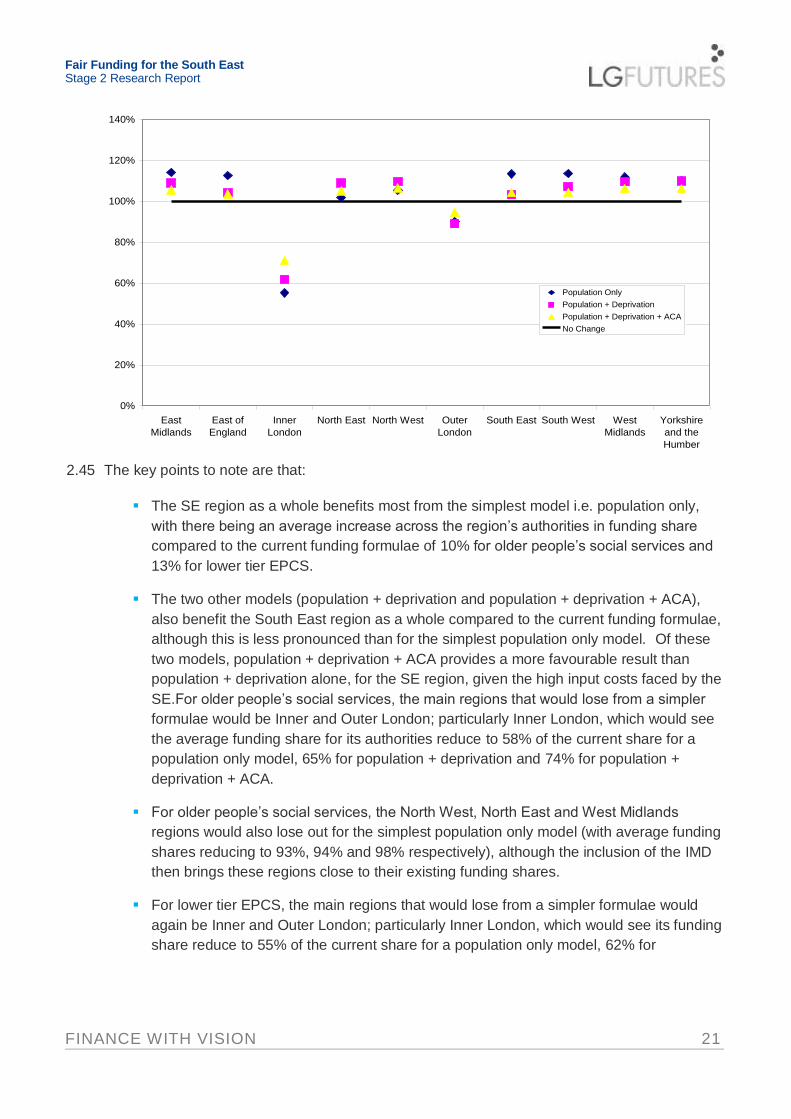
Chart 2.10: Lower tier Environmental, Protective and Cultural Services (EPCS) – changes in
funding share for the three “simpler” formulae
0%
20%
40%
60%
80%
100%
120%
East
Midlands
East of
England
Inner
London
North East North West Outer
London
South East South West West
Midlands
Yorkshire
and the
Humber
Population Only
Population + Deprivation
Population + Deprivation + ACA
No Change
Fair Funding for the South East Stage 2 Research Report
FINANCE WITH VISION 21
2.45 The key points to note are that:
The SE region as a whole benefits most from the simplest model i.e. population only,
with there being an average increase across the region’s authorities in funding share
compared to the current funding formulae of 10% for older people’s social services and
13% for lower tier EPCS.
The two other models (population + deprivation and population + deprivation + ACA),
also benefit the South East region as a whole compared to the current funding formulae,
although this is less pronounced than for the simplest population only model. Of these
two models, population + deprivation + ACA provides a more favourable result than
population + deprivation alone, for the SE region, given the high input costs faced by the
SE.For older people’s social services, the main regions that would lose from a simpler
formulae would be Inner and Outer London; particularly Inner London, which would see
the average funding share for its authorities reduce to 58% of the current share for a
population only model, 65% for population + deprivation and 74% for population +
deprivation + ACA.
For older people’s social services, the North West, North East and West Midlands
regions would also lose out for the simplest population only model (with average funding
shares reducing to 93%, 94% and 98% respectively), although the inclusion of the IMD
then brings these regions close to their existing funding shares.
For lower tier EPCS, the main regions that would lose from a simpler formulae would
again be Inner and Outer London; particularly Inner London, which would see its funding
share reduce to 55% of the current share for a population only model, 62% for
0%
20%
40%
60%
80%
100%
120%
140%
East
Midlands
East of
England
Inner
London
North East North West Outer
London
South East South West West
Midlands
Yorkshire
and the
Humber
Population Only
Population + Deprivation
Population + Deprivation + ACA
No Change
Fair Funding for the South East Stage 2 Research Report
FINANCE WITH VISION 22
population + deprivation and 70% for population + deprivation + ACA. All other regions
except for London benefit from each of the three simpler models for lower tier EPCS.
SE Individual Authority Position
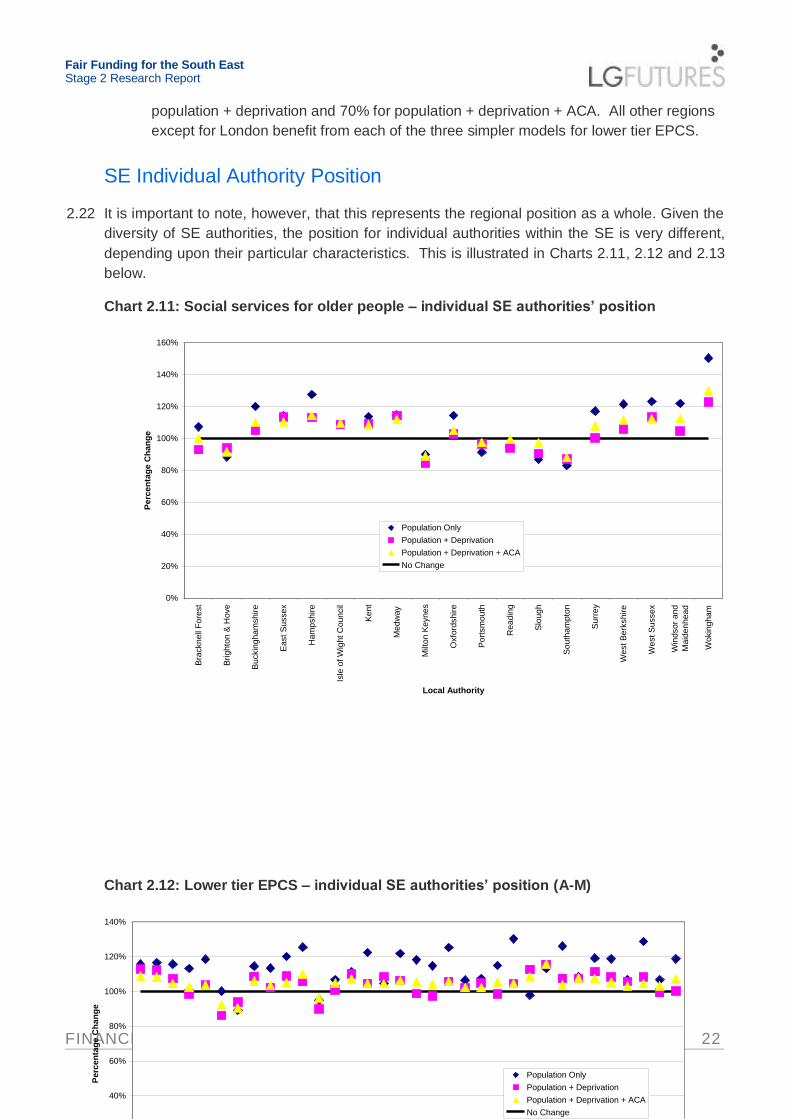
2.22 It is important to note, however, that this represents the regional position as a whole. Given the
diversity of SE authorities, the position for individual authorities within the SE is very different,
depending upon their particular characteristics. This is illustrated in Charts 2.11, 2.12 and 2.13
below.
Chart 2.11: Social services for older people – individual SE authorities’ position
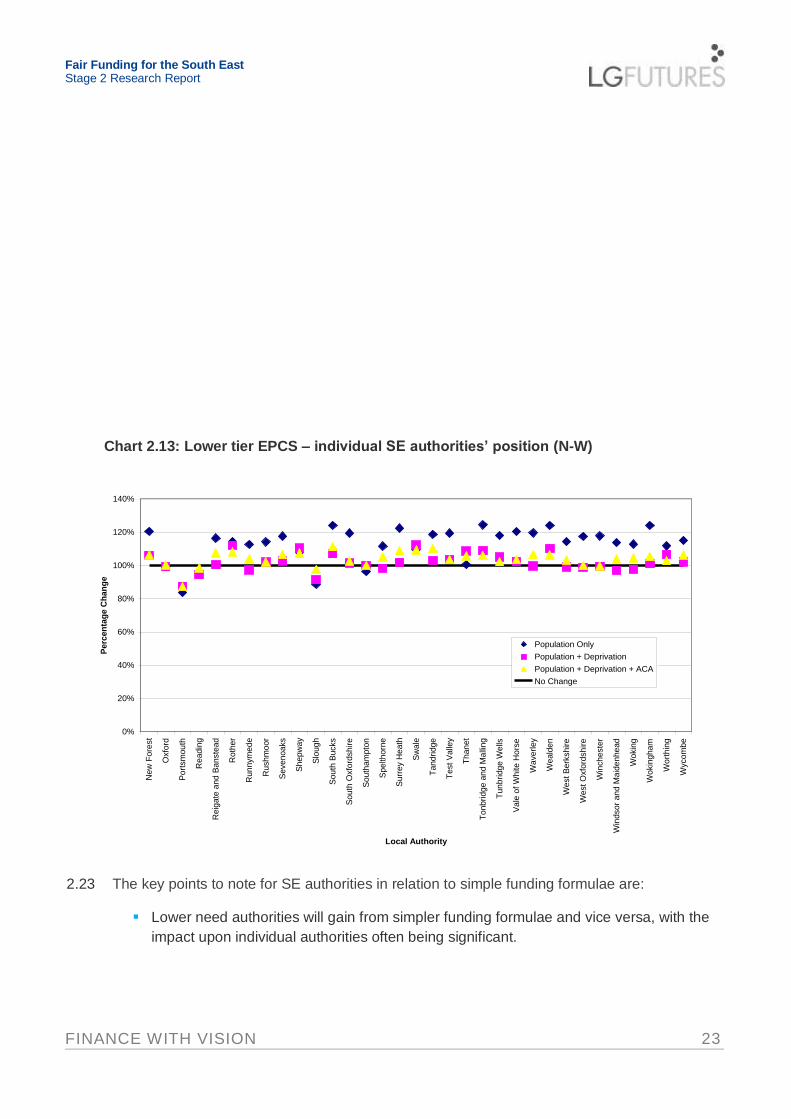
Chart 2.12: Lower tier EPCS – individual SE authorities’ position (A-M)
0%
20%
40%
60%
80%
100%
120%
140%
160%
Bra
cknell
Fore
st
Brighto
n &
Hove
Buckin
gham
shire
East S
ussex
Ham
pshire
Isle
of W
ight C
ouncil
Kent
Medw
ay
Milt
on K
eynes
Oxfo
rdshire
Port
sm
outh
Readin
g
Slo
ugh
South
am
pto
n
Surr
ey
West B
erk
shire
West S
ussex
Win
dsor
and
Maid
enhead
Wokin
gham
Local Authority
Perc
en
tag
e C
han
ge
Population Only
Population + Deprivation
Population + Deprivation + ACA
No Change
0%
20%
40%
60%
80%
100%
120%
140%
Adur
Aru
n
Ashfo
rd
Ayle
sbury
Vale
Basin
gsto
ke a
nd D
eane
Bra
cknell
Fore
st
Brighto
n &
Hove
Cante
rbury
Cherw
ell
Chic
heste
r
Chilt
ern
Cra
wle
y
Dart
ford
Dover
East H
am
pshire
Eastb
ourn
e
Eastleig
h
Elm
bridge
Epsom
and E
well
Fare
ham
Gosport
Gra
vesham
Guild
ford
Hart
Hastings
Havant
Hors
ham
Isle
of W
ight C
ouncil
Lew
es
Maid
sto
ne
Medw
ay
Mid
Sussex
Milt
on K
eynes
Mole
Valle
y
Local Authority
Perc
en
tag
e C
han
ge
Population Only
Population + Deprivation
Population + Deprivation + ACA
No Change
Fair Funding for the South East Stage 2 Research Report
FINANCE WITH VISION 23
Chart 2.13: Lower tier EPCS – individual SE authorities’ position (N-W)
2.23 The key points to note for SE authorities in relation to simple funding formulae are:
Lower need authorities will gain from simpler funding formulae and vice versa, with the
impact upon individual authorities often being significant.
0%
20%
40%
60%
80%
100%
120%
140%
New
Fore
st
Oxfo
rd
Port
sm
outh
Readin
g
Reig
ate
and B
anste
ad
Roth
er
Runnym
ede
Rushm
oor
Sevenoaks
Shepw
ay
Slo
ugh
South
Bucks
South
Oxfo
rdshire
South
am
pto
n
Spelthorn
e
Surr
ey H
eath
Sw
ale
Tandridge
Test V
alle
y
Thanet
Tonbridge a
nd M
alli
ng
Tunbridge W
ells
Vale
of W
hite H
ors
e
Waverley
Weald
en
West B
erk
shire
West O
xfo
rdshire
Win
cheste
r
Win
dsor
and M
aid
enhead
Wokin
g
Wokin
gham
Wort
hin
g
Wycom
be
Local Authority
Perc
en
tag
e C
han
ge
Population Only
Population + Deprivation
Population + Deprivation + ACA
No Change

Fair Funding for the South East Stage 2 Research Report
FINANCE WITH VISION 24
For example, for upper tier authorities in relation to social services for older people,
Wokingham would see its share of funding increase to 150%, 123% and 130% of its
current funding levels for a population only, population + deprivation and population +
deprivation + ACA model respectively.
Conversely, high need authorities would lose out, with Southampton and Slough being
the biggest losers in relation to social services for older people, with a population only
model resulting in them receiving 83% and 87% of their current funding share
respectively.
For lower tier EPCS, Hart would be the largest gainer from a population only model
(receiving 130% of its current funding share), whereas Crawley would only receive 95%
of its current share.
2.24 SEEC will therefore need to consider the effect on individual member authorities, in addition to
the region as a whole, when considering any potential changes to funding formulae. As
considered in the following section of this report, however, if a business rates retention
scheme is introduced by government, under current proposals, the “needs baseline” will be
fixed for a specified period, locking in any potential perceived inequities within the funding
formulae in place at the time that the baseline is set.
Fair Funding for the South East Stage 2 Research Report
FINANCE WITH VISION 25
3 Business Rates Retention
Introduction
3.1 On 18 July 2011, the Department for Communities and Local Government published the paper,
“Local Government Resource Review: Proposals for Business Rates Retention – Consultation”.
The consultation paper included reference to eight further technical papers on business rates
retention, which were subsequently released on 19 August 2011.
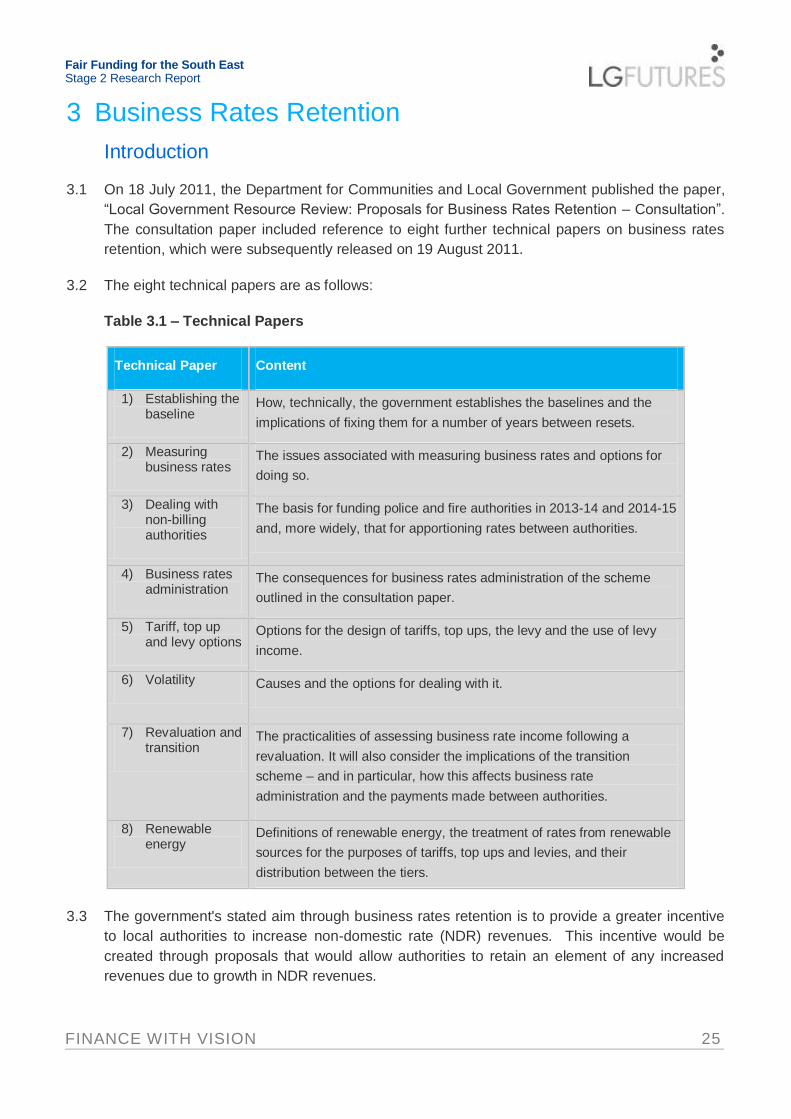
3.2 The eight technical papers are as follows:
Table 3.1 – Technical Papers
Technical Paper Content
1) Establishing the baseline
How, technically, the government establishes the baselines and the
implications of fixing them for a number of years between resets.
2) Measuring business rates
The issues associated with measuring business rates and options for
doing so.
3) Dealing with non-billing authorities
The basis for funding police and fire authorities in 2013-14 and 2014-15
and, more widely, that for apportioning rates between authorities.
4) Business rates administration
The consequences for business rates administration of the scheme
outlined in the consultation paper.
5) Tariff, top up and levy options
Options for the design of tariffs, top ups, the levy and the use of levy
income.
6) Volatility Causes and the options for dealing with it.
7) Revaluation and transition
The practicalities of assessing business rate income following a
revaluation. It will also consider the implications of the transition
scheme – and in particular, how this affects business rate
administration and the payments made between authorities.
8) Renewable energy
Definitions of renewable energy, the treatment of rates from renewable
sources for the purposes of tariffs, top ups and levies, and their
distribution between the tiers.
3.3 The government's stated aim through business rates retention is to provide a greater incentive
to local authorities to increase non-domestic rate (NDR) revenues. This incentive would be
created through proposals that would allow authorities to retain an element of any increased
revenues due to growth in NDR revenues.
Fair Funding for the South East Stage 2 Research Report
FINANCE WITH VISION 26
3.4 The complex nature of local government finance, the need for some element of funding stability,
and, in particular, the variation between local authorities in terms of the amount of business
rates retained locally, means that the proposed scheme will require a number of features to
provide sufficient incentives to all authorities and protect those that are not able to increase
NDR revenues or may have one-off reductions in the amount of NDR collected.
3.5 The key features of the proposed system are as follows:
Local authorities will still need to operate within the existing NDR system. They will not
have control over how the level of tax is determined for ratepayers i.e. the rateable value
of properties or the national multiplier (the rate of tax).
Each local authority will be provided with an initial baseline level of funding - this is
known as its “needs baseline”. Local authorities' needs baselines will be based upon
the 2012/13 Formula Grant allocation (with adjustments for the 2013/14 control totals
and possibly other changes to the formula and underlying data). The needs baseline is
effectively the starting point for the rates retention system.
Not all growth in NDR receipts will be distributed to local authorities – sufficient
resources to fund the New Homes Bonus scheme will be retained centrally. There will
also be deductions for Police authorities, where funding will continue (at least in the
short term) to be provided through a formula-based grant (and potentially for single
purpose Fire and Rescue authorities, depending upon the option chosen from the
consultation).
An additional amount will also need to be removed from the system in 2013/14. This
represents the difference in funding for local authorities between 2013/14 and 2014/15.
It is necessary to remove this amount, as the baselines need to be based upon the
lowest funding point (i.e. in 2014/15). The government plans to distribute the amount
removed from the baseline to local authorities in 2013/14 as section 31 grant, using
authorities’ needs baselines as the basis for apportionment. This funding will be known
as the “2013/14 adjustment grant”.
A system of “tariffs” and “top ups” will be introduced, in order to allow for the fact that
authorities have significantly different capacities to generate NDR income, depending
upon their NDR taxbase. A tariff will be paid by an authority to government where their
NDR income exceeds their needs baseline. A top up will be received by authorities from
government where their NDR income is below their needs baseline. Tariff/top up
amounts could be (i) indexed to RPI or (ii) fixed as a cash amount.
There will be a “reset mechanism”, designed to keep resources broadly in line with
need. Without resets, there is the potential for authorities' levels of need (based upon
population and socio-economic factors, for example), to become significantly higher or
lower than the amount that is being received through rates retention. Each year
between resets, individual authorities will either pay the same tariff or receive the same
top up. Resets could be (i) partial (where authorities benefit from growth in business

Fair Funding for the South East Stage 2 Research Report
FINANCE WITH VISION 27
rates obtained before the reset) or (ii) full (authorities only benefit from any growth in
their local business rates obtained in the time period between two resets).
There will be a “safety net” for payments to local authorities experiencing negative
volatility in business rate income. There could be (i) an “annual” safety net (where
income in any year declines by more than a set percentage when compared to the
previous year's income) or (ii) a “baseline” safety net (where income in any year
declines by more than a set percentage below the baseline funding level).
A “levy” system will scale back the amount of resources that are retained locally (and
this may be linked to the size of authorities' NDR base). Three options have been put
forward for how a levy could be calculated: (i) Flat rate levy, such that an authority pays
x pence of every pound of business rate growth into the levy pot, (ii) Banded levy,
where authorities would be grouped into bands based on their gearing ratios, with the
levy being higher for those authorities in bands with higher levels of gearing or (iii)
Proportional levy, with each authority being assigned an individual levy rate, set such
that a 1% increase in an authority's business rates would result in a fixed percentage
increase in its retained income.
South East authorities – net NDR contributions
3.6 Currently, business rates are collected locally, paid into a national pool and then redistributed to
authorities in the form of Formula Grant. Based on provisional 2012/13 figures, the SE currently
contributes significantly more (£895m) into the national NDR pool than it receives in Formula
Grant.
3.7 In 2012/13, authorities in the SE are projected to collect £3.269bn in business rate receipts.
Meanwhile, they will receive only £2.373bn of Formula Grant in return, including funding for
their police and fire services3. This means that, for every pound of Formula Grant received, the
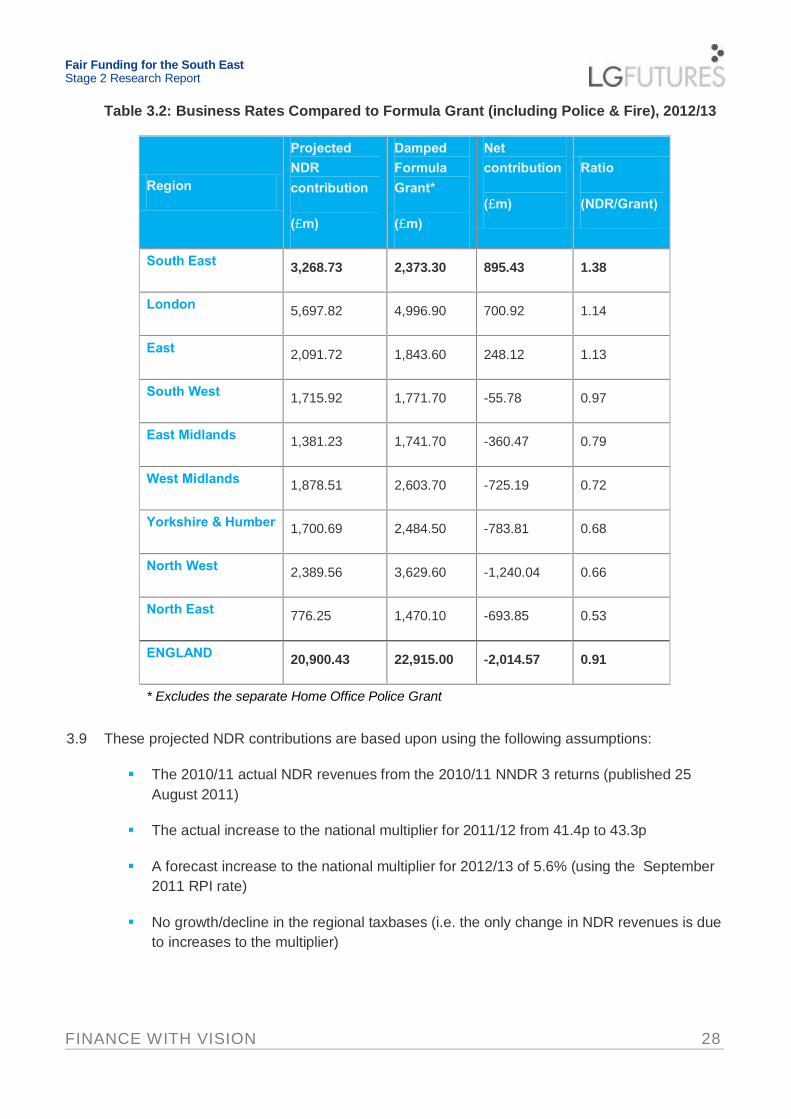
South East contributed £1.38 in business rates. This is summarised in Table 3.2 below.
3.8 This ratio is the highest in England and makes it one of only three net contributing regions,
alongside London and the East of England. The South East's projected net contribution of
£895m to the national funding pool is the largest in absolute terms (London's net contribution is
£701m).
3 Formula Grant includes both redistributed NDR and Revenue Support Grant, but excludes the separate Home Office police grant.
Fair Funding for the South East Stage 2 Research Report
FINANCE WITH VISION 28
Table 3.2: Business Rates Compared to Formula Grant (including Police & Fire), 2012/13
Region
Projected
NDR
contribution
(£m)
Damped
Formula
Grant*
(£m)
Net
contribution
(£m)
Ratio
(NDR/Grant)
South East 3,268.73 2,373.30 895.43 1.38
London 5,697.82 4,996.90 700.92 1.14
East 2,091.72 1,843.60 248.12 1.13
South West 1,715.92 1,771.70 -55.78 0.97
East Midlands 1,381.23 1,741.70 -360.47 0.79
West Midlands 1,878.51 2,603.70 -725.19 0.72
Yorkshire & Humber 1,700.69 2,484.50 -783.81 0.68
North West 2,389.56 3,629.60 -1,240.04 0.66
North East 776.25 1,470.10 -693.85 0.53
ENGLAND 20,900.43 22,915.00 -2,014.57 0.91
* Excludes the separate Home Office Police Grant
3.9 These projected NDR contributions are based upon using the following assumptions:
The 2010/11 actual NDR revenues from the 2010/11 NNDR 3 returns (published 25
August 2011)
The actual increase to the national multiplier for 2011/12 from 41.4p to 43.3p
A forecast increase to the national multiplier for 2012/13 of 5.6% (using the September
2011 RPI rate)
No growth/decline in the regional taxbases (i.e. the only change in NDR revenues is due
to increases to the multiplier)
Fair Funding for the South East Stage 2 Research Report
FINANCE WITH VISION 29
Potential size of the business rates retention incentive
3.10 The potential level of incentives for authorities in the SE region under the proposed business
rates retention system was considered, to identify the scale of the incentive available.
3.11 CLG's proposals to exclude the effects of revaluation when considering business rates growth
will restrict a council's potential income growth to the expansion of its physical taxbase (plus
inflation). Historical data has been used to assess how this would translate to potential real-
terms income growth for the SE.
3.12 Rateable values are based upon market rental values and are assessed independently by the
Valuation Office Agency. All rateable values are reassessed every five years at revaluation, the
last taking effect in April 2010.
3.13 At revaluation, the overall increase in aggregate yield is capped nationally by the Retail Prices
Index (RPI). The multiplier is adjusted to achieve that effect. Therefore, if national rateable
value growth is greater than RPI, as was the case in the 2010 revaluation, the multiplier is
scaled down accordingly.
3.14 This causes considerable variation at the local authority level. Yields in each authority can
increase or fall significantly, depending on whether the rateable value in that area has grown
faster or slower than the national average. Authorities whose rateable value growth has been
less than the national average see a reduction in their business rate yields.
3.15 At the 2010 revaluation, for example, over 200 billing authorities experienced a fall in the rates
they collected. The SE region saw its business rates yield fall by 3.8% (£136m).
3.16 Under a retained business rates system, this would cause considerable turbulence in local
authorities' retained income. To deal with this turbulence, government is proposing to neutralise
the effects of revaluations on business rate retention. It is proposed that "tariffs and top ups
should be adjusted at revaluation to ensure that, as far as possible, business rates income is
unaffected." In other words, CLG will "ensure that retained income is the same after revaluation
as immediately before"4.
3.17 Retained business rates will therefore be limited to growth in business rate yield between
revaluation years. Between revaluation years, gross business rate yield growth is comprised of:
The increase in the multiplier, which increases with RPI each year; and
The growth in each authority's rateable value. Between revaluation years, this reflects
the establishment of new businesses in an area, minus the impact of any closures or
relocations. The net impact on the authority's tax base will depend on both the change in
4 Technical Paper 7, paragraphs 2.5 and 3.7
Fair Funding for the South East Stage 2 Research Report
FINANCE WITH VISION 30
the number of physical properties or “hereditaments” and the average rateable value of
each5.
3.18 Whilst providing stability, government's decision to neutralise the effects of revaluations will
have major implications for the incentives provided by the business rates retention system.
Analysis was therefore carried out to assess:
The proportion of rateable value growth that, historically, has been attributable to
revaluations (both nationally and among South East authorities); and
The potential “real terms” business rate growth for South East authorities once
revaluations are excluded, based on historical taxbase data.
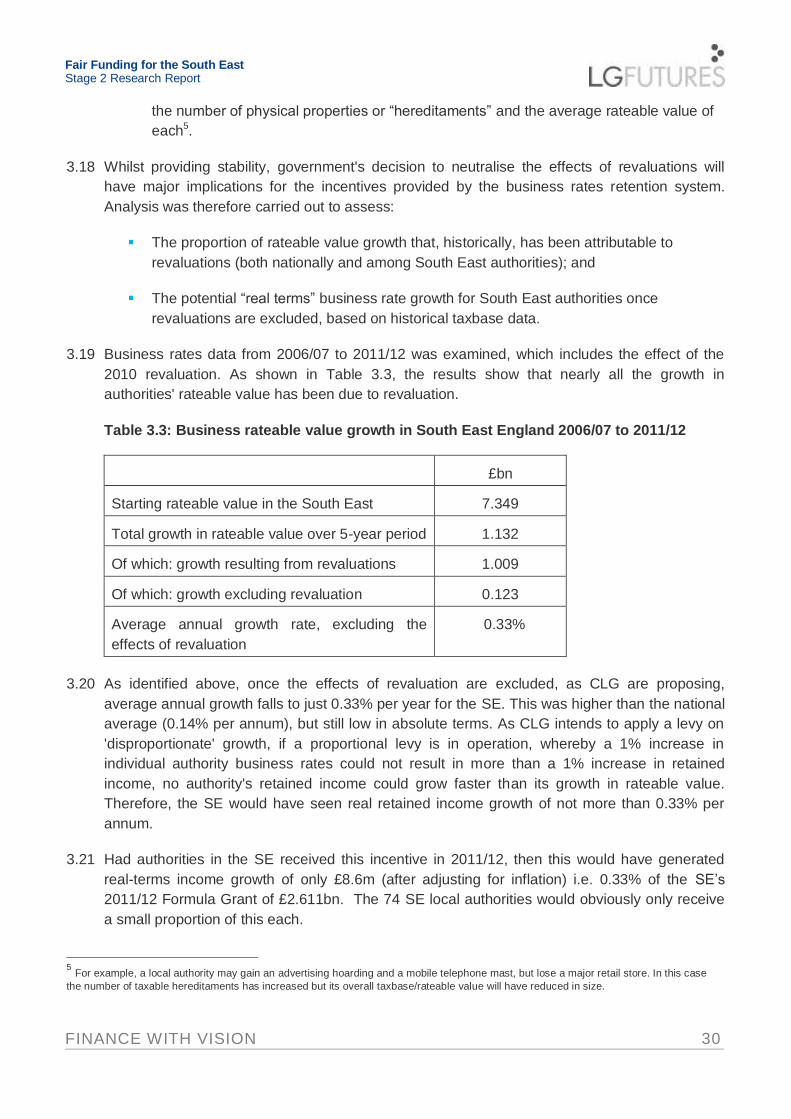
3.19 Business rates data from 2006/07 to 2011/12 was examined, which includes the effect of the
2010 revaluation. As shown in Table 3.3, the results show that nearly all the growth in
authorities' rateable value has been due to revaluation.
Table 3.3: Business rateable value growth in South East England 2006/07 to 2011/12
£bn
Starting rateable value in the South East 7.349
Total growth in rateable value over 5-year period 1.132
Of which: growth resulting from revaluations 1.009
Of which: growth excluding revaluation 0.123
Average annual growth rate, excluding the
effects of revaluation
0.33%
3.20 As identified above, once the effects of revaluation are excluded, as CLG are proposing,
average annual growth falls to just 0.33% per year for the SE. This was higher than the national
average (0.14% per annum), but still low in absolute terms. As CLG intends to apply a levy on
'disproportionate' growth, if a proportional levy is in operation, whereby a 1% increase in
individual authority business rates could not result in more than a 1% increase in retained
income, no authority's retained income could grow faster than its growth in rateable value.
Therefore, the SE would have seen real retained income growth of not more than 0.33% per
annum.
3.21 Had authorities in the SE received this incentive in 2011/12, then this would have generated
real-terms income growth of only £8.6m (after adjusting for inflation) i.e. 0.33% of the SE’s
2011/12 Formula Grant of £2.611bn. The 74 SE local authorities would obviously only receive
a small proportion of this each.
5 For example, a local authority may gain an advertising hoarding and a mobile telephone mast, but lose a major retail store. In this case
the number of taxable hereditaments has increased but its overall taxbase/rateable value will have reduced in size.
Fair Funding for the South East Stage 2 Research Report
FINANCE WITH VISION 31
Business rates retention compared to the current system
3.22 As identified above, the government's business rates retention proposals set out a number of
options in terms of the potential operation of the system. To assess the potential impact of
these proposals on the SE authorities, a five-year resource projection has been undertaken.
These projections are then compared to estimates of the authorities’ income had the current
distribution methodology been retained (that is, if the funding had continued to be distributed via
the existing four block model instead).
Step 1: Resource projections
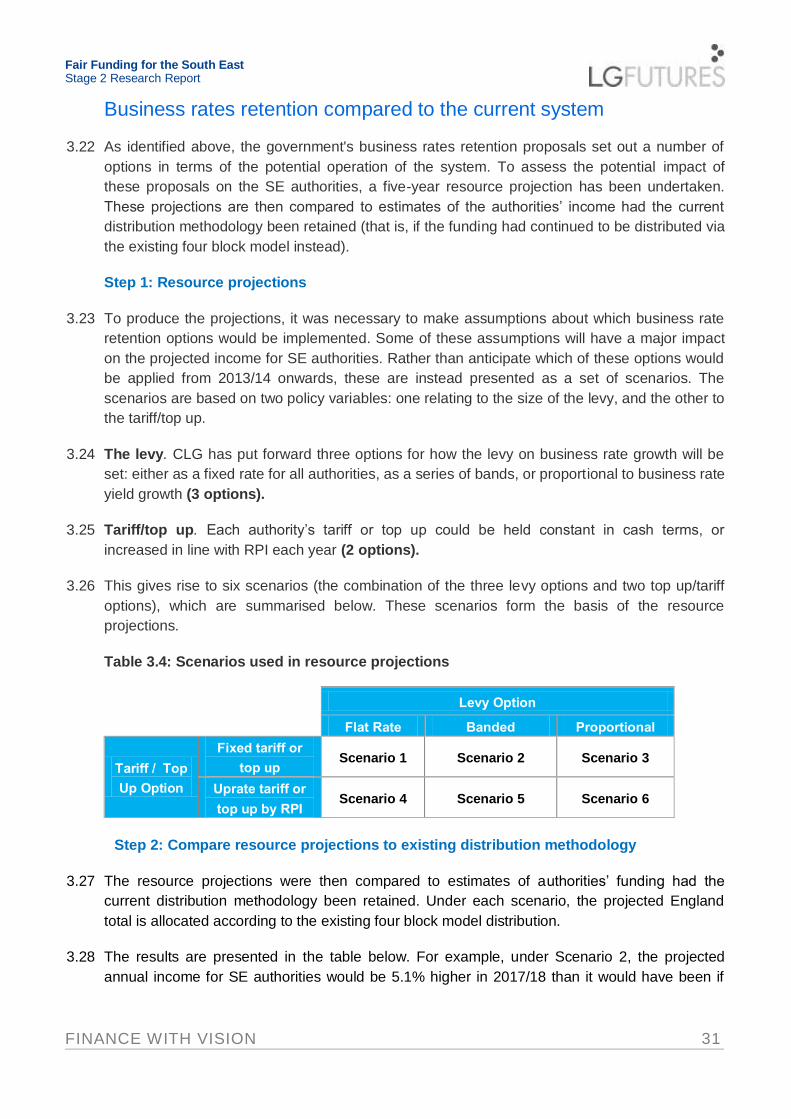
3.23 To produce the projections, it was necessary to make assumptions about which business rate
retention options would be implemented. Some of these assumptions will have a major impact
on the projected income for SE authorities. Rather than anticipate which of these options would
be applied from 2013/14 onwards, these are instead presented as a set of scenarios. The
scenarios are based on two policy variables: one relating to the size of the levy, and the other to
the tariff/top up.
3.24 The levy. CLG has put forward three options for how the levy on business rate growth will be
set: either as a fixed rate for all authorities, as a series of bands, or proportional to business rate
yield growth (3 options).
3.25 Tariff/top up. Each authority’s tariff or top up could be held constant in cash terms, or
increased in line with RPI each year (2 options).
3.26 This gives rise to six scenarios (the combination of the three levy options and two top up/tariff
options), which are summarised below. These scenarios form the basis of the resource
projections.
Table 3.4: Scenarios used in resource projections
Levy Option
Flat Rate Banded Proportional
Tariff / Top
Up Option
Fixed tariff or
top up Scenario 1 Scenario 2 Scenario 3
Uprate tariff or
top up by RPI Scenario 4 Scenario 5 Scenario 6
Step 2: Compare resource projections to existing distribution methodology
3.27 The resource projections were then compared to estimates of authorities’ funding had the
current distribution methodology been retained. Under each scenario, the projected England
total is allocated according to the existing four block model distribution.
3.28 The results are presented in the table below. For example, under Scenario 2, the projected
annual income for SE authorities would be 5.1% higher in 2017/18 than it would have been if
Fair Funding for the South East Stage 2 Research Report
FINANCE WITH VISION 32
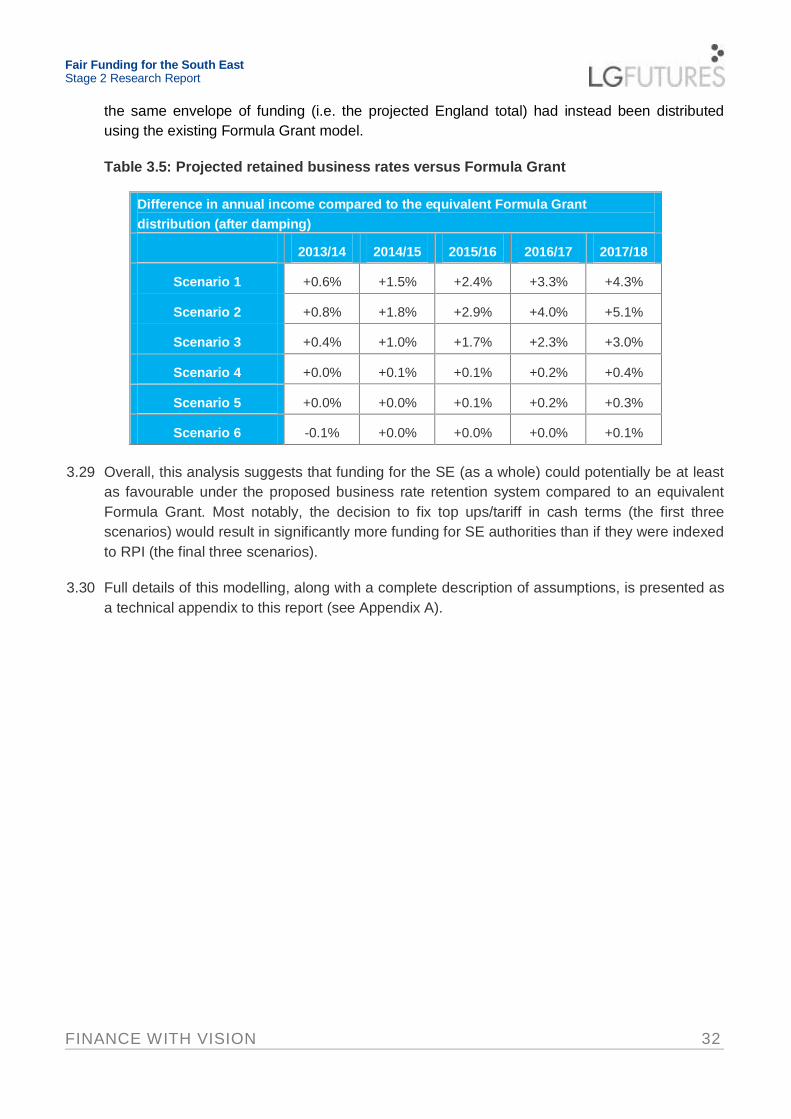
the same envelope of funding (i.e. the projected England total) had instead been distributed
using the existing Formula Grant model.
Table 3.5: Projected retained business rates versus Formula Grant
Difference in annual income compared to the equivalent Formula Grant
distribution (after damping)
2013/14 2014/15 2015/16 2016/17 2017/18
Scenario 1
Fixed & Flat
+0.6% +1.5% +2.4% +3.3% +4.3%
Scenario 2
Fixed & Banded
+0.8% +1.8% +2.9% +4.0% +5.1%
Scenario 3
Fixed & Proportional
+0.4% +1.0% +1.7% +2.3% +3.0%
Scenario 4
Uprated & Flat
+0.0% +0.1% +0.1% +0.2% +0.4%
Scenario 5
Uprated & Banded
+0.0% +0.0% +0.1% +0.2% +0.3%
Scenario 6
Uprated & Proportional
-0.1% +0.0% +0.0% +0.0% +0.1%
3.29 Overall, this analysis suggests that funding for the SE (as a whole) could potentially be at least
as favourable under the proposed business rate retention system compared to an equivalent
Formula Grant. Most notably, the decision to fix top ups/tariff in cash terms (the first three
scenarios) would result in significantly more funding for SE authorities than if they were indexed
to RPI (the final three scenarios).
3.30 Full details of this modelling, along with a complete description of assumptions, is presented as
a technical appendix to this report (see Appendix A).
Fair Funding for the South East Stage 2 Research Report
FINANCE WITH VISION 33
4. Incentive Measures
Introduction
4.1 The Local Government Resource Review places emphasis on the importance of changes to the
local government finance system to reward authorities that aim for growth, by ensuring that they
receive the benefits from stimulating housing and economic development. This reflects the
intention set out in the Coalition Agreement that: “We will provide incentives for local authorities
to deliver sustainable development, including for new homes and businesses.” (Coalition
Agreement, May 2010.)
4.2 A key criticism of the current local government funding system is that local authorities do not
benefit significantly from any increases in their council taxbase, as these may be “equalised
away” by the operation of the Formula Grant system. Equally, there may be little direct fiscal
incentive to an authority to grow its business rates base, as any increases will be pooled for
redistribution to all local authorities in England.
4.3 In addition to the specific business rates retention proposals considered in section 3, a number
of measures have been introduced, or are being considered, with the intention of providing
greater financial incentives to local authorities to develop both their domestic and business
taxbases. A number of these incentives deal with similar issues; for example, the use of the
proceeds from business rates in relation to Business Improvement Districts; Tax Increment
Financing; Business Rate Supplement; Business Increase Bonus Scheme; Renewable Energy
Projects; and Enterprise Zones. These are described in this section and include:
i. The New Homes Bonus
ii. The Community Infrastructure Levy
iii. Business Improvement Districts
iv. Tax Increment Financing
v. Business Rate Supplement
vi. Business Increase Bonus Scheme
vii. Renewable Energy Projects
viii. National Insurance Contribution Reductions
ix. Enterprise Zones
Fair Funding for the South East Stage 2 Research Report
FINANCE WITH VISION 34
i. New Homes Bonus
Key features
4.4 In the summer of 2010, the Housing Minister, Grant Shapps MP, announced the government's
proposal to introduce a New Homes Bonus (NHB). The intention of the scheme would be to
provide a financial incentive to local authorities to encourage house building, with the
government match funding the additional council tax generated when a new home is built or a
property is brought back into use, including an additional amount for affordable homes.
Consultation proposals were published in November 2010 and details of the final scheme were
announced in February 2011. The main features of the scheme are:
The NHB scheme did not require primary legislation and the scheme was introduced for
the 2011/12 financial year. Grant allocations to individual local authorities for 2011/12
were announced on 4 April 2011.
The scheme will provide local authorities with a New Homes Bonus (NHB) grant, equal
to the national average for the council tax band on each additional property and paid for
the following six years as an unringfenced grant. Currently, this means for a new Band
D property, a grant of £1,439 per annum, or £8,634 over six years. The amount paid will
be reviewed annually.
To help ensure that affordable homes are sufficiently prioritised within supply, there will
be a flat rate enhancement of £350 per annum for each additional affordable home -
equal to around 25% of the current Band D council tax.
The NHB will also apply to empty properties brought back into use, to strengthen the
incentive for local authorities to identify empty properties and to work with owners to find
innovative solutions that allow these properties to be brought back into use.
DCLG has allocated £200m to fund the scheme fully in 2011/12, using resources from
the cessation of the Housing Planning and Delivery Grant. For the following three years
of the Spending Review (2012/13 to 2014/15), £250m per annum has been allocated for
the NHB, with funding beyond these levels coming from Formula Grant.
The payment of the New Homes Bonus will be split between tiers in shire areas: 80% to
the lower tier and 20% to the upper tier, as a starting point for local negotiation. Local
authorities will have flexibility on how to spend the NHB grant, which, in many cases, will
involve advanced planning with other local service providers to ensure the timely delivery
of infrastructure for new development. Also, authorities may choose to pool some
funding at the level of the Local Enterprise Partnership, to invest in shared priorities
which support long term prosperity for the area.
Potential issues for SE authorities
Fair Funding for the South East Stage 2 Research Report
FINANCE WITH VISION 35
4.5 Local authorities in the South East received £34.1 million (17.1%) of the England total for the
NHB of £199.3 million in 2011/12. For five districts in the South East, the NHB grant was
equivalent to more than 10% of their Formula Grant for 2011/12. The 17.1% share of the NHB
grant going to authorities in the SE can be compared with their share of 2011 projected
population (16.3%), the share of council taxbase (18.0%) and the share of Formula Grant
(10.9%).
4.6 Authorities in the SE therefore currently benefit more from the NHB than they would from a
comparable increase to aggregate Formula Grant. For the second and subsequent years of the
scheme, where any funding above £250 million is taken from Formula Grant, if the reduction in
Formula Grant was made as a pro rata percentage reduction to Formula Grant, for each £200
million of additional funding through the NHB, SE local authorities would lose £21.8 m in
Formula Grant, but gain £34.1 m in NHB grant – a net gain of £12.3 m.
4.7 However, the net effect on grant from 2012/13 onwards will depend crucially on how the
adjustment is made to the Formula Grant system to accommodate any transfer from Formula
Grant to the NHB. Rather than just top-slicing the overall amount of Formula Grant, one option
would be to make an adjustment to the EPCS control totals, and particularly to the lower tier
EPCS block, to reflect the fact that the tier split of the NHB is 20% for upper tier authorities and
80% for lower tier. Depending on how this was undertaken, and on any other related changes
to the revenue grant system, the net gain for SE authorities arising from the NHB might be
significantly reduced.
4.8 The introduction of the NHB is likely to be of net benefit to local authorities in the SE, and, for a
number of districts, represents a substantial increase in revenue funding. However, in the
longer term, the net effect for SE authorities will depend on the changes that are made to the
Formula Grant system to accommodate the transfer of funding to the NHB. For the SE region
as a whole, it could be argued that, to retain the incentive effect of the NHB, there should be a
pro rata top slice to Formula Grant, rather than making changes to grant mechanisms which
would "equalise away" some of the benefits to authorities in the SE. This is an issue that the
SE authorities will need to keep under review, as part of the potential other changes to be made
to the Formula Grant system.
ii. Community Infrastructure Levy
Key features
4.9 The Community Infrastructure Levy (CIL) will allow local authorities to raise funds from
developers undertaking new building projects in their area. The funding raised can be used to
fund a wide range of infrastructure needed as a result of development – such as new road
schemes, schools, health and social care facilities, and parks. The CIL will be charged by
district and unitary authorities. The CIL is seen by the government as fairer, faster and more
certain and transparent than the current system of planning obligations, which may cause delay
as a result of lengthy negotiations. Currently, only 6% of all planning permissions bring any
contribution to the cost of supporting infrastructure.

Fair Funding for the South East Stage 2 Research Report
FINANCE WITH VISION 36
4.10 Though the CIL came into force from April 2010, no local authority has yet implemented the
new levy. This is partly due to changes to regulations, including the Community Infrastructure
Levy Regulations (Amendment) Regulations 2011, and changes to the levy set out in the
Localism Bill. The Planning Advisory Service is working with a group of local authorities – the
front runners – to develop their charging schedules and consider effective ways of implementing
the levy in their local areas. Initially, eight local authorities were selected to be front runners –
but none from the South East. However, at the end of June 2011, another 20 local authorities
were selected to join the front runners project, including 4 authorities from the South East –
Elmbridge, Milton Keynes, Oxford and Wycombe. It seems likely that income from the first CIL
schemes will come on stream for some councils in 2012/13.
4.11 Rates for the new levy will be set in consultation with local communities and developers and are
intended to provide developers with more certainty about how much they will be expected to
contribute. Local authorities are required to spend the levy on the infrastructure needed to
support the development of the area, and the Planning Act 2008 provides a wide definition of
the infrastructure that can be funded by the levy.
4.12 The Localism Bill proposes changes to the levy to make it more flexible. It will allow the money
raised to be spent on maintaining infrastructure, as well as building new infrastructure. It will
give local authorities greater freedom in setting the rate that developers should pay in different
areas. Also, the Bill will give the government the power to require that some of the funding
raised from the levy goes directly to the neighbourhoods where development takes place. This
should help ensure that those experiencing the effects of new developments should also benefit
from improvements to infrastructure.
4.13 Charging authorities must produce a charging schedule which sets out the rate for their levy.
One standard rate may be set or specific rates for different areas and types of development,
although differential rates must be justified by the economic viability of any new development.
The charging schedule must be subject to consultation with local business and communities
and must undergo a public examination by an independent person before it can be formally
approved.
4.14 The levy will be charged on most new developments that involve an increase in floor space,
although most developments under 100 square metres will not pay. The charge will be based
on pounds per square metre of net additional increases in floor space of any given
development. There will be mandatory exemptions for social housing and charities, and
authorities will have the option to offer relief in exceptional circumstances; for example, where
the levy would have a determining impact upon the economic viability of a development.
4.15 The government has estimated that the CIL has the potential to raise an additional £1 billion of
funding for local infrastructure by 2016, though this will depend on the potential take-up of the
levy (estimated at between 82% and 92% of authorities) and the amount charged (the modelling
is based upon £5,000 per dwelling). Charging authorities will be able to use funds from the levy
to recover the cost of administration, with regulations allowing them to retain up to 5% of the
levy for administrative expenses.
Fair Funding for the South East Stage 2 Research Report
FINANCE WITH VISION 37
Potential issues for SE authorities
4.16 It is not yet possible to provide any estimates of the potential impact of CIL on either individual
local authorities or on groups of authorities. Much will depend upon the charging rates selected
by individual authorities and the extent of permitted new development. The general assumption
is that SE authorities will benefit from the scheme – for example, the House of Commons
Library note on CIL suggests that: “The latest version (of CIL) has been introduced to help
finance the infrastructure needed to increase the supply of housing, particularly in areas of high
demand like the South East.”
4.17 SE authorities are likely to benefit significantly from the introduction of the CIL, though much will
depend on the extent to which the additional funding for new infrastructure will overcome some
of the resistance to new housing and business development. SE authorities will need to take
account of the lessons learnt by the four front runners in designing their draf t charging scheme
and ensure that the specific circumstances of the SE are built into the CIL.
iii. Business Improvement Districts
Key features
4.18 A Business Improvement District (BID) is a flexible funding mechanism to manage and improve
a clearly defined commercial area, taking the form of an additional levy on all defined business
ratepayers in the area, following a majority vote. Once the vote is successful, which must take
the form of a majority of the business ratepayers in terms of numbers and the proportion of their
rateable value, the BID levy becomes mandatory on all defined ratepayers, and is treated in the
same way as the business rate.
4.19 A “cap” may allow high rateable value properties to pay a maximum defined levy, below that of
the relevant percentage of rateable value. Unlike similar arrangements in other countries, BIDs
in England levy on the occupiers of business properties rather than the owners. The maximum
length of a BID is five years, before it is subject to another vote.
4.20 The statutory basis for BIDs was the Local Government Act 2003, supplemented by the
Business Improvement District Regulations 2004. The first BID ballot took place in November
2004. To date, there have been 135 successful BID votes and only 26 negative ballots. Most of
the schemes appear to cover predominantly retail or office areas that are not too run down,
where businesses can afford a small additional levy to make improvements to their area. The
majority of successful BID areas are in town centres.
4.21 The experience of BIDs from other countries suggests that there is no optimum size or type of
BID, but it must be designed to be fit for purpose in each individual case. In England, local
authorities have an important role in assisting the development of BIDs, and it is essential that a
strong partnership is formed between the local authority and the BID proposer at an early stage.
Fair Funding for the South East Stage 2 Research Report
FINANCE WITH VISION 38
Potential issues for SE authorities
4.22 The SE accounts for a very limited proportion of BID areas. For example, BIDs have been
established in Reading, Brighton, Worthing, and Winchester, focusing on town centre renewal,
but there have been negative ballots in Maidstone, Runnymede, Oxford and Southampton.
4.23 There appears to be relatively limited scope for local authorities in the SE to benefit from BIDs,
but it may be worth considering whether there is a case to examine the successful and
unsuccessful BID votes in the SE and to examine whether there are any changes to the BIDs
legislation which could help expand the number of BID areas in the SE.
iv. Tax Increment Financing
Key features
4.24 The Deputy Prime Minister announced the introduction of Tax Increment Financing (TIF) in
September 2010, so that English local authorities would be allowed to borrow against the
predicted growth in their locally raised business rates to fund key infrastructure and other capital
projects, which will support locally driven economic development and growth. The TIF proposal
will require primary legislation, so it is unlikely that the scheme could be up and running before
2013/14 at the earliest. TIF will operate within a carefully designed framework of rules, which
the government will work closely with councils to design.
4.25 TIF has been used extensively in the USA as a way of using higher land values and future tax
revenues to facilitate development of defined areas and to fund necessary infrastructure
improvements. Under a TIF scheme, an area is designated for improvement, and future growth
in property tax revenues from that area are earmarked to pay for the necessary development
expenditure. TIF therefore captures increases in tax revenues without any change in the tax
rate. As property values increase as a result of developments such as transport improvements,
TIF enables the local authority to benefit from increased revenue and to utilise the revenue to
pay for public improvements.
4.26 The Local Government Resource Review paper on Business Rates Retention6 considers how
the proposals for business rates retention would work with a TIF scheme. It points out that local
retention of business rates will remove the most important barrier to TIF schemes, namely that
local authorities are currently not able to retain any of their business rates and therefore cannot
borrow against any predicted increase in their income from them. With local retention,
borrowing for TIF schemes would come under the prudential capital system, allowing local
authorities to borrow for capital projects against future predicted increases in business rate
growth.
6 http://www.communities.gov.uk/publications/localgovernment/resourcereviewbusinessrates
Fair Funding for the South East Stage 2 Research Report
FINANCE WITH VISION 39
4.27 However, such borrowing can only take place if there is a degree of certainty about the future
tax revenue streams and whether there are sufficient guarantees that they will be retained
within the authority. Two options are set out in the Business Rates Retention paper in which
TIF could be operated within the business rates retention system:
The first would allow local authorities to determine for themselves whether to invest in a
TIF scheme, but would not exempt revenues from the impact of the retention scheme;
The second would involve stronger government controls on the ability to bring forward a
TIF scheme, but would guarantee revenues, without the risk of loss to the levy and reset
process. Under this option, business rate growth resulting from a TIF scheme would be
disregarded in any reassessment of top ups and tariffs. However, this approach would
require government approval of TIF schemes in order to limit the number of schemes
coming forward and to maintain resources for the reset.
4.28 There are different benefits and risks to the two approaches. The first would offer local
authorities free access to TIF schemes, though the risk of loss of income to the levy and reset
may have a disincentive effect on the number of schemes coming forward. The second option
would offer greater guarantees that revenues from business growth would be available to meet
the costs of any borrowing. However, this would also mean the government taking a more
centralised approach and potentially limiting the number of TIF schemes that it approves.
4.29 In terms of revaluation, CLG has implied that business rates in designated TIF areas will be
treated the same as other business rate growth. This would mean that local authorities could
borrow against the expected increase in business rates due to the creation of new
hereditaments in the TIF area, but not from subsequent increases in the value of these
premises due to revaluation. Similarly, it would not benefit from the increase in the rateable
value of existing commercial premises in the TIF area, as this could only come about as a result
of revaluation.
4.30 An authority’s ability to borrow against future income growth would therefore be limited to the
additional business rate revenue generated by the construction of new properties, not from an
increase in the market rental value of existing ones. This will limit the incentives for forming a
TIF area. However Option 2 could offer a different form of incentive, by providing authorities
with the opportunity to effectively ‘ring fence’ the additional business rate growth by exclud ing it
from the calculation of the levy and any re-assessment of top ups and tariffs.
Potential issues for SE authorities
4.31 It is likely that TIF could provide a useful addition to the resources for infrastructure for local
authorities in the SE. However, there may be concerns with the proposal to introduce a bid-
based process for TIFs, at least initially. This could disadvantage SE councils, as there may be
an emphasis on the use of TIF in particularly disadvantaged areas.
4.32 Local authorities in the SE will need to keep the proposals for the introduction of TIF schemes
under review, particularly during the passage of the relevant legislation, and consider whether
Fair Funding for the South East Stage 2 Research Report
FINANCE WITH VISION 40
to work up proposals for schemes which could be included in any initial bid round, should there
be one.
v. Business Rate Supplement
Key features
4.33 The final report of the Lyons Inquiry into Local Government, published in March 2007, included
a recommendation that local authorities should be able to levy a supplementary business rate
(SBR). Other aspects of business rates would remain unchanged: Lyons proposed that the
current system of business rates should be retained, including the RPI cap on the year-on-year
increase in the rate poundage, and suggested that the conditions were not right for a full-scale
relocalisation of business rates. The Lyons report did not make specific recommendations
about the level of any supplement, though the option of an upper cap was considered. To give
some sense of scale, the report exemplified the effect of a 1p supplement, which would have
raised about £415 million nationally.
4.34 In October 2007, the Government published a White Paper on Business Rate Supplements
(BRS) as part of the announcement on the Comprehensive Spending Review 2007. The White
Paper set out the Government's proposals with respect to the introduction of a BRS in England,
though agreed to limited consultation on technical issues before the proposals were finalised.
4.35 The power to levy a BRS required primary legislation, which was provided by the Business
Rates Supplements Act 2009. The Government is using the Localism Bill to amend the 2009
Act so that all businesses will have the right to have a binding vote on any local authority
proposals to introduce a local supplement on business rates, as already applies for Business
Improvement Districts, even if the revenues raised from the BRS are less than a third of the
total cost of an economic development project (see below).
4.36 The key principles set out in the White Paper which would apply to locally set BRS are:
Revenue raised from BRS must be spent on economic development projects. These
projects must be set out in advance and there will be a statutory requirement to consult
with local businesses regarding spending plans;
A national upper limit of 2p will apply to local BRS;
Properties with rateable values of £50,000 or less will be exempt from paying BRS. It
will be left to local authorities developing proposals for BRS to consider whether there
should be other exemptions - for example, for ratepayers contributing to a Business
Improvement District;
Where the revenues raised from a local BRS make up more than a third of the total cost
of an economic development project, there will be the requirement for a 'double lock'
ballot of affected businesses. A 'double lock' ballot requires both a majority of
businesses by number and rateable value to agree to the supplement;

Fair Funding for the South East Stage 2 Research Report
FINANCE WITH VISION 41
Only the highest tier local authority in an area would have the power to levy BRS.
Potential issues for SE authorities
4.37 The only example to date of the use of the BRS is to part-fund Crossrail, allowing prudential
borrowing of up to £3.5 billion by the GLA to meet around 22% of the total cost of £15.9 billion.
The Mayor of London introduced the supplement from April 2010, and it will cease once the
debt has been fully repaid. Some parts of the SE – particularly to the west of London – may
benefit from the improved transport links which should result from Crossrail, without any of their
ratepayers having to incur the levy.
vi. Business Increase Bonus Scheme
Key features
4.38 The Local Growth White Paper described proposals that the government is working on to
introduce a Business Increase Bonus scheme, to reward those authorities where growth in the
business rates yield exceeds a threshold by allowing them to keep the increase:
Up to a certain level
For a period of six years
Where there is additional growth in subsequent years, the authority would also retain
that growth
4.39 This scheme has clear similarities to the New Homes Bonus scheme. It is intended to provide
an incentive to all councils to seek long term sustainable growth in their business rates base,
and ensure that local communities factor in economic growth when taking decisions about how
their local area should develop.
Potential issues for SE authorities
4.40 There are doubts as to whether a Business Increase Bonus scheme could work in conjunction
with a locally raised and retained business rate. This would go further than the Business
Increase Bonus scheme, with incentive effects likely to be stronger and more predictable, over
longer time periods. It is possible that the Business Increase Bonus Scheme could be dropped
in favour of alternative mechanisms to achieve a local retention of business rates.
vii. Renewable Energy Projects
Key features
4.41 The UK government has a legally-binding target of generating 15% of energy from renewable
sources by 2020 and is committed to delivering a huge expansion of UK renewable energy over
the next decade. To meet these commitments, the government will work with communities to

Fair Funding for the South East Stage 2 Research Report
FINANCE WITH VISION 42
make the most of opportunities both onshore as well as offshore. The government recognises
that communities hosting renewable energy installations play a vital role in meeting this target,
and believes that it is right that these communities should be rewarded for the contribution such
installations make to ensure the UK has a secure supply of energy and reduces CO2 emissions
from energy.
4.42 Local communities that host renewable energy projects will therefore be rewarded by allowing
them (i.e. local authorities) to keep the business rates that they generate. A technical paper7,
published as part of the Local Government Resource Review, sets out more details on how the
proposal will work. A number of issues are considered, including:
The types of renewable energy schemes to be covered by the proposal
What is meant by a “new renewable energy project”
How different types of projects – new schemes or the expansion of existing schemes -
would be treated
Who would determine whether a project met the definition to qualify as a renewable
energy project
How the business rate income from a renewable energy project might be split between
authorities in two tier areas
Potential issues for South East authorities
4.43 Although this proposal may be welcomed as an incentive to communities to expand renewable
energy, it is likely to have only a very marginal impact on local authority funding.
viii. National Insurance Contributions Reduction
Key features
4.44 In the June 2010 Budget, the government announced a National Insurance Contributions (NICs)
holiday from 22 June 2010 until 5 September 2013, which aimed to help areas currently
dependent on the public sector transition to a more sustainable private sector-led model of
economic growth. This means that, during a three-year qualifying period, new businesses that
start-up will receive substantial reductions in their employer NICs.
Potential issues for SE authorities
4.45 This scheme does not apply to the Greater South East - i.e. South East, East of England and
London. There clearly could be a case that new businesses in more deprived parts of the SE
should also qualify for the reduction to employers' NICs.
7 http://www.communities.gov.uk/publications/localgovernment/resourcereviewtechnicalpaper8

Fair Funding for the South East Stage 2 Research Report
FINANCE WITH VISION 43
xi. Enterprise Zones
Key features
4.46 The first 11 vanguard Enterprise Zones were announced in the Budget 2011 and will be based
within the following 11 Local Enterprise Partnerships: Birmingham and Solihull; Sheffield City
Region; Leeds City Region; Liverpool City Region; London; Greater Manchester; West of
England; the Black Country; Derby and Nottingham; Tees Valley and the North East - though
none in the South East. All Enterprise Zones will benefit from:
A business rate discount worth up to £275,000 per eligible business over a five-year
period
All business rates growth within the zone for a period of at least 25 years will be shared
and retained by the local area, to support the Partnership's economic priorities and
ensure that Enterprise Zone growth is reinvested locally
Government help to develop radically simplified planning approaches for the zone using,
for example, existing local powers to grant automatic planning permission
Government support to ensure that superfast broadband is rolled out throughout the
zone, achieved through guaranteeing the most supportive regulatory environment and, if
necessary, public funding
Potential issues for SE authorities
4.47 Although none of the original Enterprise Zones were based in the South East, 3 of the 13 new
Enterprise Zones announced in August 2011 were successful bids from the SE - at Discovery
Park in Sandwich, Kent; Science Vale Enterprise Zone in Oxfordshire; and the Daedalus Airfield
in Gosport.
Fair Funding for the South East Stage 2 Research Report
FINANCE WITH VISION 44
5. Summary
5.1 The Stage 1 research identified issues in relation to the operation of the current funding
formulae and how this affected funding levels for the SE region. The Stage 2 research for SEEC
has considered the implications of making changes to the current funding formulae, business
rates retention proposals and the operation of other incentive schemes.
5.2 Key findings in relation to these areas are as follows:
1. Implications of making changes to the current funding formulae
(i) The local government funding system in England is highly centralised. In 2010/11,
74% of total local government revenue spending in England was derived from central
government grants, with only 26% being locally “controlled” (from Council Tax and
sales, fees and charges), although there are restrictions on the extent to which income
can be raised from these sources. This places significant attention upon the funding
received through Formula Grant (£29.4bn in 2011/12) and the mechanism by which
this funding is distributed.
(ii) Through the funding system, perceived lower need authorities are penalised in
comparison with higher need authorities, as a larger share of their total needs is below
the threshold and is converted into funding at a different (lower) rate. For upper tier
services, councils in the SE receive 4.7% less funding per unit of Relative Needs
Formula (RNF) compared to the national average. London, on the other hand,
receives 3.9% more. For district services, the difference is less pronounced than for
upper tier services, but councils in the SE still receive 1.0% less funding per unit of
RNF compared to the national average. If funding for upper tier services was allocated
as a proportion of total need, the South East would have received £169m more in
undamped grant in 2011/12. London, at the other extreme, would have received
£182m less funding.
(iii) To assess the implications for Formula Grant allocations resulting from changes to the
funding formulae, for illustrative purposes, modelling was undertaken through changing
the “weightings'” assigned to four specific indicators used within the funding system –
(a) increasing the basic allowance for each service by 25%, (b) reducing the amount
allocated for deprivation by 25%, (c) reducing the amount allocated for density by 50%
and (d) increasing the amount allocated for sparsity by 50%.
(iv) This modelling identified that, as the RNF is a volatile funding formula, changes can
result in unexpected outcomes. This is predominantly because of the use of
thresholds; which, coupled with fixed national control totals, can result in
counterintuitive redistribution patterns at a regional level. For example, Inner London
gains from a reduction in deprivation, despite having some of the most deprived
authorities in the country. The damping arrangements can also result in perverse
outcomes. For example, the SE gains from a reduced deprivation weighting before
Fair Funding for the South East Stage 2 Research Report
FINANCE WITH VISION 45
damping, but loses after damping, because resources are switched to protect the
"new" losers arising from the change. It is important to note that, given that the SE is
comprised of authorities with varying demographic and geographical features, it is
highly unlikely that there will be a change to the RNF that would favour every authority
in the region.
(v) Modelling also took place to identify the effect of a “simple formula”, with this being
developed for two different elements of current funding for local government - social
services for older people (an upper tier service) and lower tier Environmental,
Protective and Cultural Services (EPCS). For each of these areas, three separate
models were developed, with each model attributing funding to local authorities based
upon: Model 1 Population only, Model 2 Population and Deprivation and Model 3
Population, Deprivation and Area Costs.
(vi) The SE region as a whole benefits most from the simplest model i.e. population only,
with there being an average increase across the region’s authorities in funding share
compared to the current funding formulae of 10% for older people’s social services and
13% for lower tier EPCS. The two other models (population + deprivation and
population + deprivation + ACA), also benefit the South East region as a whole
compared to the current funding formulae, although this is less pronounced than for the
simplest population only model.
(vii) As with changes to funding formulae weightings, the use of simpler formulae has very
different effects on different authorities in the SE, depending upon their perceived level
of need. For example, for upper tier authorities in relation to social services for older
people, Wokingham would see its share of funding increase to 150% of its current
funding levels for a population only model, whereas Southampton and Slough would
receive only 83% and 87% of their current funding shares respectively. Similarly, for
lower tier EPCS, Hart would be the largest gainer from a population only model
(receiving 130% of its current funding share), whereas Crawley would only receive
95% of its current share.
(viii) It should also be noted that, even when significant formula changes are made, the
effect of damping means that any changes in “need” can be negated or may be
counterintuitive.
(ix) However, if a business rates retention scheme is introduced by government, under
current proposals, the “needs baseline” will be fixed for a specified period, locking in
any potential perceived inequities within the funding formulae in place at the time that
the baseline is set.
2. Business rates retention
(i) The complex nature of local government finance, the need for some element of funding
stability, and, in particular, the variation between local authorities in terms of the
amount of business rates retained locally, means that the proposed business rates
Fair Funding for the South East Stage 2 Research Report
FINANCE WITH VISION 46
scheme will require a number of features to provide sufficient incentives to all
authorities and protect those that are not able to increase NDR revenues or may have
one-off reductions in the amount of NDR collected.
(ii) Based upon provisional 2012/13 figures, the SE currently contributes the largest
amount on absolute terms (£895m) into the national NDR pool than it receives in
Formula Grant. London's net contribution is £701m and the East of England is the only
other region to make a net positive contribution (£248m). This means that, for every
pound of Formula Grant received, the South East contributed £1.38 in business rates.
(iii) Analysis of business rates data from 2006/07 to 2011/12, including the effect of the
2010 revaluation, identified that nearly all the growth in authorities' rateable value has
been due to revaluation. For the SE, of the total growth of £1.132bn over the five-year
period, £1,009bn was due to revaluation and only £0.123bn due to growth in the
physical taxbase. As CLG are proposing to exclude revaluation from the incentive, this
equates to average annual growth of just 0.33% per year for the SE. Had authorities in
the SE received this incentive in 2011/12, then this would have generated real-terms
income growth of only £8.6m (after adjusting for inflation) i.e. 0.33% of the SE’s
2011/12 Formula Grant of £2.611bn. The 74 SE local authorities would obviously only
receive a small proportion of this each.
(iv) Analysis of Formula Grant forecasts for the SE from 2013/14 to 2017/18 compared
with a number of business rates retention scenarios, identifies that, in overall terms,
the SE region could be better off under a business rate retention system than the
corresponding Formula Grant distribution, although results should be interpreted with
caution, given the number of modelling assumptions involved. The position for
individual SE authorities would also vary, according to their particular circumstances.
The SE region as a whole benefits most from scenarios in which the top up/tariff is
fixed, rather than uprated with RPI, as SE authorities are, on average, more likely to be
subject to tariffs rather than top ups, and so will be better off with a tariff fixed in cash
terms rather than uprated in line with RPI.
3. Operation of other incentive schemes
(i) In addition to the specific business rates retention proposals, a number of measures
have been introduced, or are being considered, with the intention of providing greater
financial incentives to local authorities to develop both their domestic and business
taxbases.
(ii) Some of these incentive schemes represent significant sources of funding and are
likely to be of benefit to the SE region as a whole e.g. the New Homes Bonus. Other
schemes have not yet been implemented within authorities, and so their potential effect
cannot yet be determined e.g. the Community Infrastructure Levy. The SE will need to
keep a watching brief on such incentive schemes to ensure that the region is provided
with the opportunity to benefit from these schemes e.g. Tax Increment Financing, given

Fair Funding for the South East Stage 2 Research Report
FINANCE WITH VISION 47
that not all schemes have been applied to the SE previously e.g. as with the National
Insurance Contributions reduction.
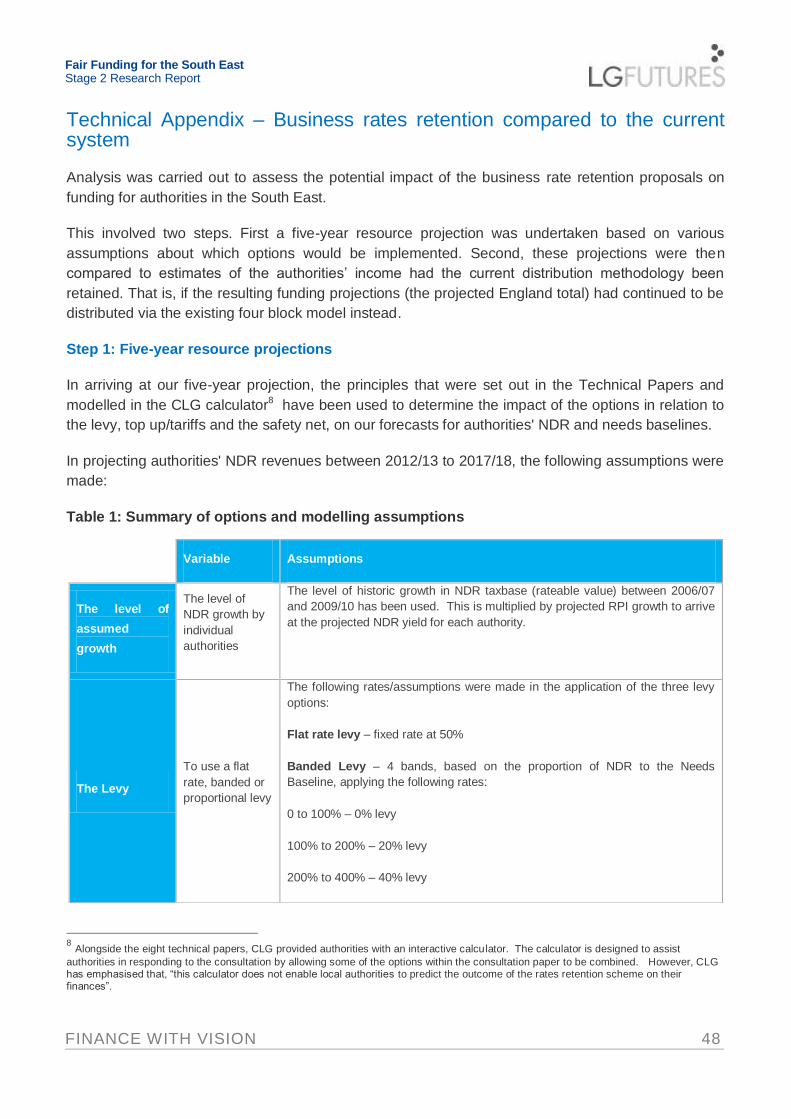
Fair Funding for the South East Stage 2 Research Report
FINANCE WITH VISION 48
Technical Appendix – Business rates retention compared to the current system
Analysis was carried out to assess the potential impact of the business rate retention proposals on
funding for authorities in the South East.
This involved two steps. First a five-year resource projection was undertaken based on various
assumptions about which options would be implemented. Second, these projections were then
compared to estimates of the authorities’ income had the current distribution methodology been
retained. That is, if the resulting funding projections (the projected England total) had continued to be
distributed via the existing four block model instead.
Step 1: Five-year resource projections
In arriving at our five-year projection, the principles that were set out in the Technical Papers and
modelled in the CLG calculator8 have been used to determine the impact of the options in relation to
the levy, top up/tariffs and the safety net, on our forecasts for authorities' NDR and needs baselines.
In projecting authorities' NDR revenues between 2012/13 to 2017/18, the following assumptions were
made:
Table 1: Summary of options and modelling assumptions
8 Alongside the eight technical papers, CLG provided authorities with an interactive calculator. The calculator is designed to assist
authorities in responding to the consultation by allowing some of the options within the consultation paper to be combined. However, CLG has emphasised that, “this calculator does not enable local authorities to predict the outcome of the rates retention scheme on their finances”.
Variable Assumptions
The level of
assumed
growth
The level of
NDR growth by
individual
authorities
The level of historic growth in NDR taxbase (rateable value) between 2006/07
and 2009/10 has been used. This is multiplied by projected RPI growth to arrive
at the projected NDR yield for each authority.
The Levy
To use a flat
rate, banded or
proportional levy
The following rates/assumptions were made in the application of the three levy
options:
Flat rate levy – fixed rate at 50%
Banded Levy – 4 bands, based on the proportion of NDR to the Needs
Baseline, applying the following rates:
0 to 100% – 0% levy
100% to 200% – 20% levy
200% to 400% – 40% levy
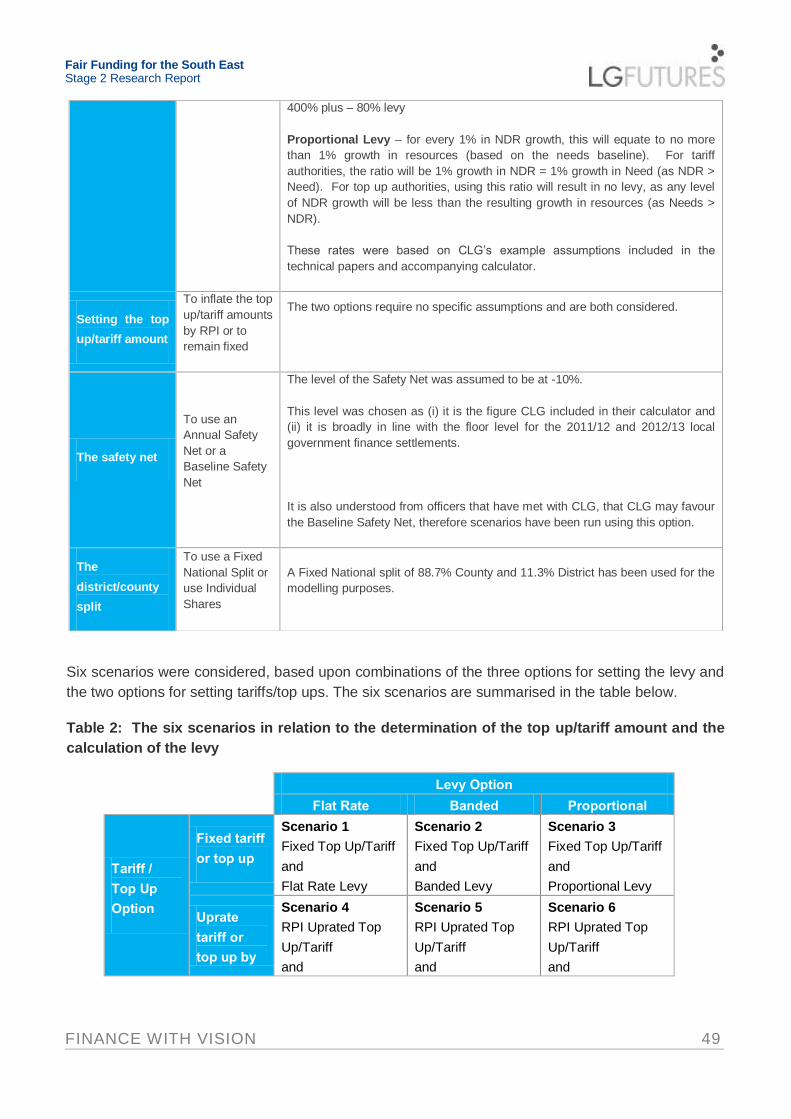
Fair Funding for the South East Stage 2 Research Report
FINANCE WITH VISION 49
Six scenarios were considered, based upon combinations of the three options for setting the levy and
the two options for setting tariffs/top ups. The six scenarios are summarised in the table below.
Table 2: The six scenarios in relation to the determination of the top up/tariff amount and the
calculation of the levy
Levy Option
Flat Rate Banded Proportional
Tariff /
Top Up
Option
Fixed tariff
or top up
Scenario 1
Fixed Top Up/Tariff
and
Flat Rate Levy
Scenario 2
Fixed Top Up/Tariff
and
Banded Levy
Scenario 3
Fixed Top Up/Tariff
and
Proportional Levy
Uprate
tariff or
top up by
Scenario 4
RPI Uprated Top
Up/Tariff
and
Scenario 5
RPI Uprated Top
Up/Tariff
and
Scenario 6
RPI Uprated Top
Up/Tariff
and
400% plus – 80% levy
Proportional Levy – for every 1% in NDR growth, this will equate to no more
than 1% growth in resources (based on the needs baseline). For tariff
authorities, the ratio will be 1% growth in NDR = 1% growth in Need (as NDR >
Need). For top up authorities, using this ratio will result in no levy, as any level
of NDR growth will be less than the resulting growth in resources (as Needs >
NDR).
These rates were based on CLG’s example assumptions included in the
technical papers and accompanying calculator.
Setting the top
up/tariff amount
To inflate the top
up/tariff amounts
by RPI or to
remain fixed
The two options require no specific assumptions and are both considered.
The safety net
To use an
Annual Safety
Net or a
Baseline Safety
Net
The level of the Safety Net was assumed to be at -10%.
This level was chosen as (i) it is the figure CLG included in their calculator and
(ii) it is broadly in line with the floor level for the 2011/12 and 2012/13 local
government finance settlements.
It is also understood from officers that have met with CLG, that CLG may favour
the Baseline Safety Net, therefore scenarios have been run using this option.
The
district/county
split
To use a Fixed
National Split or
use Individual
Shares
A Fixed National split of 88.7% County and 11.3% District has been used for the
modelling purposes.
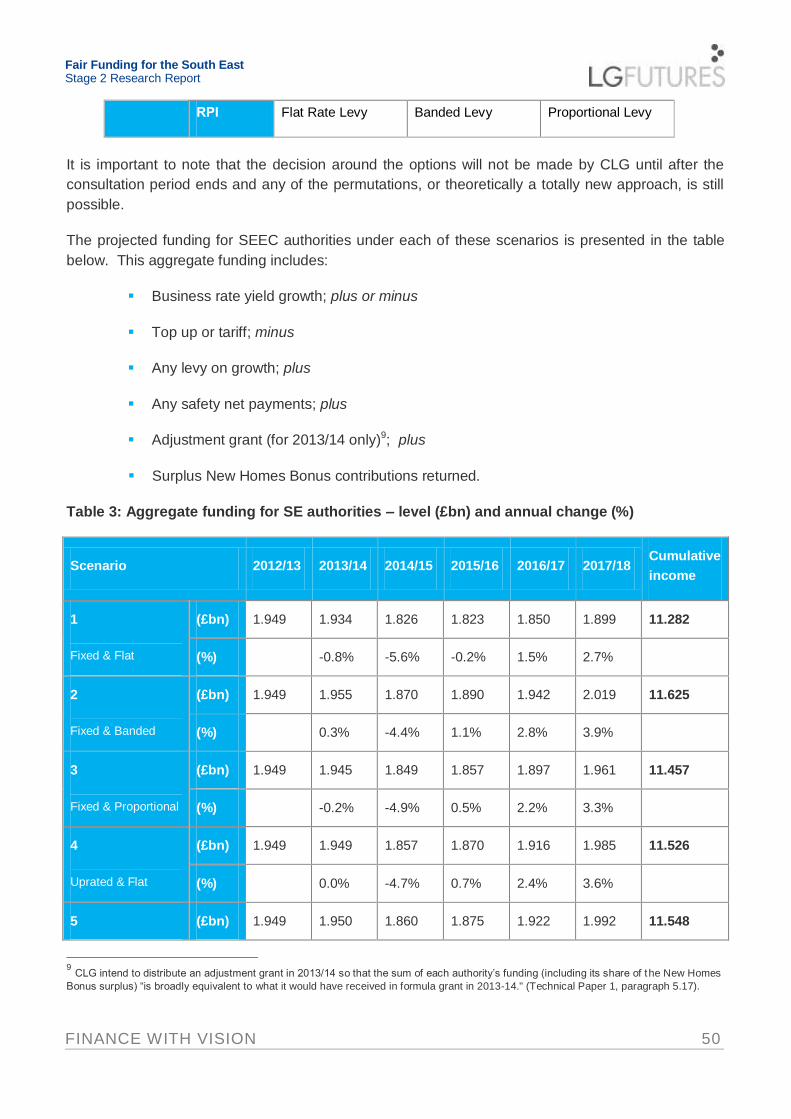
Fair Funding for the South East Stage 2 Research Report
FINANCE WITH VISION 50
RPI Flat Rate Levy Banded Levy Proportional Levy
It is important to note that the decision around the options will not be made by CLG until after the
consultation period ends and any of the permutations, or theoretically a totally new approach, is still
possible.
The projected funding for SEEC authorities under each of these scenarios is presented in the table
below. This aggregate funding includes:
Business rate yield growth; plus or minus
Top up or tariff; minus
Any levy on growth; plus
Any safety net payments; plus
Adjustment grant (for 2013/14 only)9; plus
Surplus New Homes Bonus contributions returned.
Table 3: Aggregate funding for SE authorities – level (£bn) and annual change (%)
Scenario 2012/13 2013/14 2014/15 2015/16 2016/17 2017/18 Cumulative
income
1
Fixed & Flat
(£bn) 1.949 1.934 1.826 1.823 1.850 1.899 11.282
(%) -0.8% -5.6% -0.2% 1.5% 2.7%
2
Fixed & Banded
(£bn) 1.949 1.955 1.870 1.890 1.942 2.019 11.625
(%) 0.3% -4.4% 1.1% 2.8% 3.9%
3
Fixed & Proportional
(£bn) 1.949 1.945 1.849 1.857 1.897 1.961 11.457
(%) -0.2% -4.9% 0.5% 2.2% 3.3%
4
Uprated & Flat
(£bn) 1.949 1.949 1.857 1.870 1.916 1.985 11.526
(%) 0.0% -4.7% 0.7% 2.4% 3.6%
5 (£bn) 1.949 1.950 1.860 1.875 1.922 1.992 11.548
9 CLG intend to distribute an adjustment grant in 2013/14 so that the sum of each authority’s funding (including its share of the New Homes
Bonus surplus) “is broadly equivalent to what it would have received in formula grant in 2013-14." (Technical Paper 1, paragraph 5.17).

Fair Funding for the South East Stage 2 Research Report
FINANCE WITH VISION 51
Uprated & Banded (%) 0.0% -4.6% 0.8% 2.5% 3.7%
6
Uprated &
Proportional
(£bn) 1.949 1.949 1.858 1.872 1.918 1.988 11.535
(%) 0.0% -4.7% 0.7% 2.5% 3.6%
The most favourable outcome for the SE appears to be Scenario 2, where the top up/tariff is fixed in
cash terms and a banded levy system is used. This gives the greatest level of cumulative income
over the six year period, of £11.625 billion. The worst outcome appears to be Scenario 1, with a fixed
tariff/top up and flat rate levy, which results in the lowest cumulative income (of £11.282 billion).
However, it is important to note that these figures reflect not only differences in the distribution of
funding, but the overall level of NDR retained nationally. The latter varies according to the option put
forward by CLG. For example, given a flat rate levy, there is significantly more funding retained at the
England level when the tariff is increased in line with RPI (Scenario 4) than when it is fixed (Scenario
1). This is because the levy only applies to business rate growth above RPI in Scenario 4, but applies
to all growth in Scenario 1.
It may therefore be more informative to compare the projections by assuming a fixed level of NDR is
retained nationally. Under each scenario, each authority's cumulative income was scaled to a fixed
national amount (income under Scenario 6 was used as the reference). The results are presented in
the table below.
Table 4: Scaled funding for SEEC authorities
Difference in cumulative income compared to Scenario 6
2012/13- 2017/18
Scenario 1 Scenario 2 Scenario 3 Scenario 4 Scenario 5
£m 226.27 274.34 159.09 11.99 8.37
% +2.0% +2.4% +1.4% +0.1% +0.1%
Assuming a fixed amount of NDR was retained locally, the SE does significantly better under fixed top
up/tariff options (Scenarios 1, 2 and 3) than when it is uprated with RPI (Scenarios 4, 5, and 6).
According to this modelling, Scenario 2 continues to result in the best outcome for the SE. Scenario
1, the worst outcome described above, is now the second best.
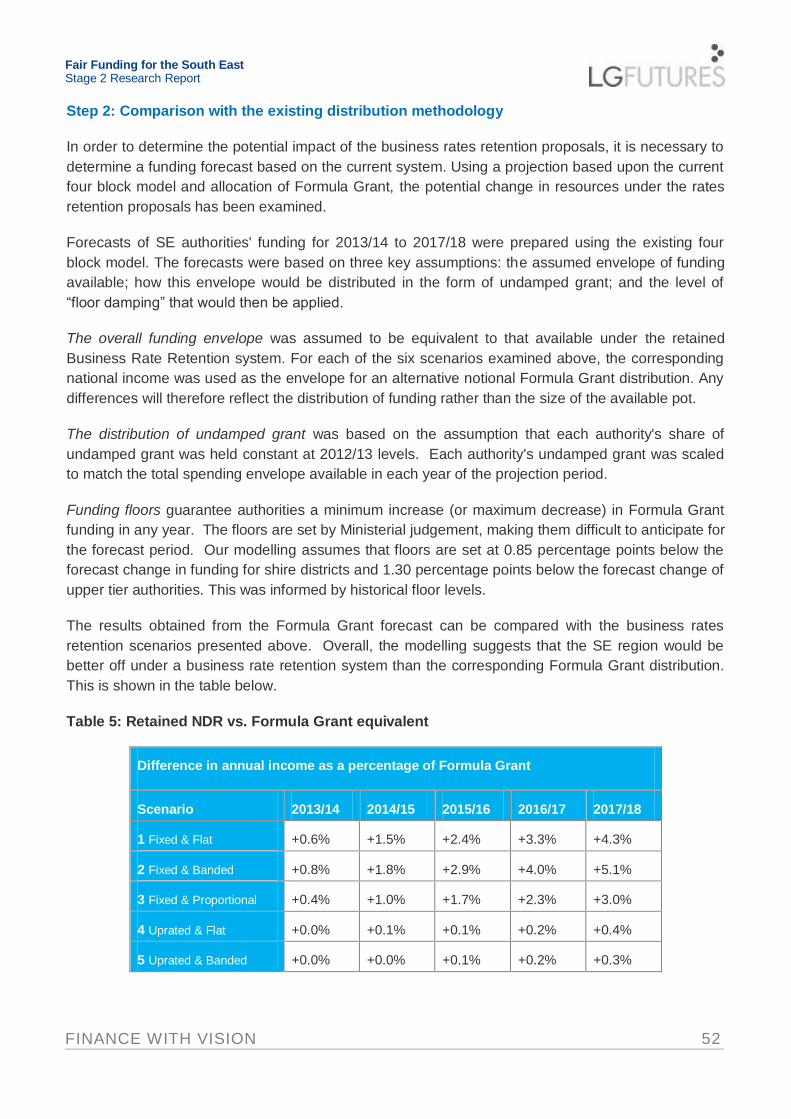
Fair Funding for the South East Stage 2 Research Report
FINANCE WITH VISION 52
Step 2: Comparison with the existing distribution methodology
In order to determine the potential impact of the business rates retention proposals, it is necessary to
determine a funding forecast based on the current system. Using a projection based upon the current
four block model and allocation of Formula Grant, the potential change in resources under the rates
retention proposals has been examined.
Forecasts of SE authorities' funding for 2013/14 to 2017/18 were prepared using the existing four
block model. The forecasts were based on three key assumptions: the assumed envelope of funding
available; how this envelope would be distributed in the form of undamped grant; and the level of
“floor damping” that would then be applied.
The overall funding envelope was assumed to be equivalent to that available under the retained
Business Rate Retention system. For each of the six scenarios examined above, the corresponding
national income was used as the envelope for an alternative notional Formula Grant distribution. Any
differences will therefore reflect the distribution of funding rather than the size of the available pot.
The distribution of undamped grant was based on the assumption that each authority's share of
undamped grant was held constant at 2012/13 levels. Each authority's undamped grant was scaled
to match the total spending envelope available in each year of the projection period.
Funding floors guarantee authorities a minimum increase (or maximum decrease) in Formula Grant
funding in any year. The floors are set by Ministerial judgement, making them difficult to anticipate for
the forecast period. Our modelling assumes that floors are set at 0.85 percentage points below the
forecast change in funding for shire districts and 1.30 percentage points below the forecast change of
upper tier authorities. This was informed by historical floor levels.
The results obtained from the Formula Grant forecast can be compared with the business rates
retention scenarios presented above. Overall, the modelling suggests that the SE region would be
better off under a business rate retention system than the corresponding Formula Grant distribution.
This is shown in the table below.
Table 5: Retained NDR vs. Formula Grant equivalent
Difference in annual income as a percentage of Formula Grant
Scenario 2013/14 2014/15 2015/16 2016/17 2017/18
1 Fixed & Flat
Fixed & Flat
+0.6% +1.5% +2.4% +3.3% +4.3%
2 Fixed & Banded
Fixed & Banded
+0.8% +1.8% +2.9% +4.0% +5.1%
3 Fixed & Proportional
Fixed & Proportional
+0.4% +1.0% +1.7% +2.3% +3.0%
4 Uprated & Flat
Uprated & Flat
+0.0% +0.1% +0.1% +0.2% +0.4%
5 Uprated & Banded
Uprated & Banded
+0.0% +0.0% +0.1% +0.2% +0.3%

Fair Funding for the South East Stage 2 Research Report
FINANCE WITH VISION 53
6 Uprated & Proportional
Uprated & Proportional
-0.1% +0.0% +0.0% +0.0% +0.1%
3.1 Again, the SE authorities benefit most from scenarios in which the top up/tariff is fixed, rather
than uprated with RPI. For example, under Scenario 2, total annual income is 5.1% higher in
2017/18 under the business rate retention system than if an equivalent national amount had
been distributed using Formula Grant. The differences are less pronounced when the top
up/tariff is uprated in line with RPI (Scenarios 4, 5 and 6).
3.2 These results largely reflect the high level of gearing in the SE. The region's gearing ratio (NDR
receipts divided by baseline funding) is projected to be around 1.4 in 2013/14, the highest in
England. By definition, this means that SE authorities are, on average, more likely to be subject
to tariffs rather than top ups, and so will be better off with a tariff fixed in cash terms rather than
uprated in line with RPI.
3.3 Overall, this analysis suggests that funding for the SE (as a whole) could potentially be at least
as favourable under the proposed business rate retention system compared to an equivalent
Formula Grant. CLG's decision on whether or to not to uprate top ups/tariff in line with inflation
will be a major determinant of funding for SE authorities.
3.4 The analysis is based on a number of major assumptions – for example, the size of the levy and
level of floors under an alternative Formula Grant distribution and any conclusions should
therefore be interpreted with caution. Outcomes will also clearly differ for individual SE
authorities, given the differences in their nature across the region.