Embed Size (px)
Citation preview

SOUTH EAST EUROPE:THE EU ROAD OR THE ROAD TO NOWHERE?An energy roadmap for 2050: Technical analysis
20502050
2 South East Europe: The EU Road Or The Road To Nowhere? An energy roadmap for 2050: Technical analysis
This publication has been produced with the assistance of the European Union. The contents of this publication are the sole responsibility of SEE Change Net on behalf of the SEE SEP implementing partners and can in no way be taken to reflect the views of the EU.
This work is licensed under a Creative Commons Attribution-NonCommercial 3.0 Unported License. If you wish to use any data from this report for commercial purposes, please contact SEE Change Net.
JUNE 2016
SEE 2050 ENERGY MODEL
SEE 2050 CARBON CALCULATOR

3South East Europe: The EU Road Or The Road To Nowhere? An energy roadmap for 2050: Technical analysis
CONTENTS
* According to the UN, Kosovo is “under the United Nations Interim Administration Mission in Kosovo (UNMIK) established pursuant to Security Council Resolution 1244.” In this publication it is referred to as “Kosovo”.
** According to the UN, the official name for Macedonia is “The Former Yugoslav Republic of Macedonia”
Foreword: The future is
low emissions prosperity 6
Executive Summary 7
Glossary, List of Figures, List of Tables 8
Introduction 9
Motivation/Rationale
for 2050 Energy Model 10
Methods 12
Description of model 12
Supply side information 23
Demand-side information 26
Developing a Smart Grid 29
Supervisory Control
and Data Acquisition 29
Advanced Metering Infrastructure 29
Transmission interconnectivity 29
Transformer aging 30
Smart buildings 30
Feed-in tariffs as a policy option 31
Demand-side management
as a supply resource 32
Building resilient, reliable smart grids 32
Fix intermittency issues 33
Complete necessary grid upgrades 33
PV as way to address feeder issues 33
Technology and Jobs 34
Electrification of the transport sector 36
Heat pumps 37
Flexibility as a response
to intermittence 38
Data 44
Historical trends 44
Data collection process 44
Limitations 44
Results 45
Discussion 52
Conclusion 53
Appendices 54
List of References 58
Croatia
Bosnia and Herzegovina Serbia
Kosovo*Montenegro
Albania
Macedonia**

4 South East Europe: The EU Road Or The Road To Nowhere? An energy roadmap for 2050: Technical analysis
CEKOR
With approximately 25 million potential new EU
citizens in South East Europe, who are all energy
consumers, energy is perhaps one of the most
complex issues which is facing the region. It has
inter-related and far reaching impacts on several
areas, including society, the economy and the
environment, particularly as South East Europe
faces the imminent deregulation of the market in a
less than ideal governance environment.
The South East Europe Sustainable Energy Policy
(SEE SEP) programme is designed to tackle these
challenges. This is a multi-country and multi-
year programme which has 17 CSO partners from
across the region (Albania, Bosnia and Herzegovina,
Croatia, Kosovo, Macedonia, Montenegro and
Serbia) and the EU, with SEE Change Net as lead
partner. It is financially supported by the European
Commission.
The contribution of the SEE SEP project is to
empower CSOs and citizens to better influence
policy and practice towards a fairer, cleaner and
safer energy future in SEE.
PARTNERS SUPPORTERS
ractal raktalF F

5South East Europe: The EU Road Or The Road To Nowhere? An energy roadmap for 2050: Technical analysis
JUNE 2016
Authors
Noah Kittner (Energy and Resources Group, Renewable and Appropriate Energy Laboratory – University of California, Berkeley, USA)
Daniel M. Kammen (Energy and Resources Group, Goldman School of Public Policy, Renewable and Appropriate Energy Laboratory – University of California, Berkeley, USA)
Contributing authors
Garret Tankosić-Kelly (SEE Change Net)
Ana Ranković (Fractal)
Naida Taso (SEE Change Net)
Publication Manager
Masha Durkalić (SEE Change Net)
Peer Review Group
Stephan Singer Global Energy Policy Director, WWF International and Editor in Chief of WWF’s The Energy Report, 100% Renewable Energy by 2050
Andrzej Kassenberg Co-founder and President of the Institute for Sustainable Development and Co-founder of the Polish Energy Efficiency Foundation
Andreas Tuerk Expert on International and National Energy Policy, Joanneum Research Graz
Milka Mumović Electricity Expert, Energy Community Secretariat
Calliope Panoutsou Chair for Biomass Supply at European Biofuels Technology Platform and Senior Research Fellow at Imperial College London
Contributors
Lira Hakani (EDEN Center, Albania)
Igor Kalaba (Center for Environment, Bosnia and Herzegovina)
Maja Božičević Vrhovčak (DOOR, Croatia)
Sonja Risteska (Analytica, Macedonia)
Pippa Gallop (CEE Bankwatch Network)
Petra Remeta (WWF Adria)
Francesca Antonelli (WWF Mediterranean)
Dragana Mileusnić (CAN Europe)
This report is based on the South East Europe 2050 Carbon Calculator, built by a team of regional CSO energy modelers:
Ana Ranković (Fractal, Serbia)
Naida Taso (SEE Change Net, Bosnia and Herzegovina)
Lira Hakani (EDEN Center, Albania)
Irma Filipović Karadža (Public Interest Advocacy Center – CPI, Bosnia and Herzegovina)
Tanja Jokić (Public Interest Advocacy Center – CPI, Bosnia and Herzegovina)
Ivana Rogulj (DOOR, Croatia)
Anyla Beqa (Advocacy and Training Resource Center, Kosovo)
Sonja Risteska (Analytica, Macedonia)
Ana Stojilovska (Analytica, Macedonia)
Sanja Orlandić (Green Home, Montenegro)
Zvezdan Kalmar (CEKOR, Serbia)
We would also like to thank the team of international and regional experts who contributed to the creation of the South East Europe 2050 Carbon Calculator:
Daniel M. Kammen Renewable and Appropriate Energy Laboratory, University of California, Berkeley, USA
Noah Kittner Renewable and Appropriate Energy Laboratory, University of California, Berkeley, USA
Felicia Lee Renewable and Appropriate Energy Laboratory, University of California, Berkeley, USA
Besim Islami Energy Consultant and Former Chairman of National Agency of Energy of Albania
Tomislav Pukšec Research Assistant, Faculty of Mechanical Engineering and Naval Architecture, University of Zagreb
Aleksandar Dedinec Research Center for Energy, Informatics and Materials of the Macedonian Academy of Sciences and Arts
Michel Cornet Energy and Climate Change Manager, Climact
Guy Turner Founder and CEO of Trove Research Ltd
Pei-Hao Li Industrial Technology Research Institute – ITRI
Cheng-Ta Chu Industrial Technology Research Institute – ITRI
Laura Aylett 2050 Calculators and Engagement, International Climate Change, Department of Energy and Climate Change (DECC), UK Government
We would like to thank all the partner organisations of SEE SEP (South East Europe Sustainable Energy Policy) Partnership, as well as all other experts and supporters, for the preparation of this report, and their help in making it.
Cover DesignAna Lukenda
TypesettingIvan Hrašovec

FOREWORD
The future is low emissions prosperityWhen I am asked what the most important joint policy for the European
Union and the neighbourhood countries of South East Europe is
today, I answer without hesitation – energy. Energy policy can be our
springboard for secure and sustainable growth but also the bridge that
connects the EU and its neighbours, literally and metaphorically.
To achieve greater resilience, independence and sustainability in energy
we need to not only make full use of all energy sources, including sun
and wind, but also change the way we use energy. This requires having
a clear strategy as well as clear policies. I would like to share two points
in this regard which I think are particularly relevant for the region of
South East Europe.
The first is that we all know we need to reduce our greenhouse gases emissions, and we must do it in a way
that will allow us to remain competitive. Balancing the two goals is a huge challenge but this is exactly what
the future has to be – low emissions prosperity. Achieving it requires new technologies, some of which we are
already developing, which will turn the “green revolution” into an opportunity for all.
This brings me to my second point: we need to invest more in energy research to inform policy. This is why
I welcome the development of the South East Europe 2050 Energy Model and I congratulate the consortium
who worked on it, including Renewable and Appropriate Energy Laboratory (RAEL) of University of California,
Berkeley, Climact, Trove Research, SEE Change Net, their SEE SEP partners and independent experts. The open
source model, also used by the International Energy Agency and 20 countries in other regions, forms the basis
of this policy paper. It allows policymakers to clearly visualise the impact of their everyday decision-making
on the energy systems out to 2050 and to better define concrete steps towards achieving full low emissions
prosperity.
If we are to meet our energy needs, reduce our environmental footprint including greenhouse emissions and
raise the competitiveness of our economies, using all the limited resources we have at our disposal, we need
to choose the right policy options carefully. I am convinced that this EU Road Map policy document and the
SEE 2050 Energy Model make an important contribution to making this choice.
Signed by
Jerzy Buzek, Member of the European Parliament, Chair of the Committee on Industry, Research and Energy of the European Parliament
Brussels, Belgium, June 3 2016
Photo: EPP Group
EXECUTIVE SUMMARYPolicymakers and political leaders in South East
Europe (SEE)1 now stand at a pivotal crossroads.
Each UN member state in the SEE region committed
at the COP21 UN Climate Change Conference2 in
Paris to strive to keep global temperature increase
below 1.5° C and those countries are also committed
to membership of the EU3; which brings with it
stringent conditionality in energy and environment
amongst many other sectors4. Policymakers in South
East Europe therefore need to choose between the
current coal-based path of development or advance
toward an EU accession pathway and a sustainable
environment through integrated planning that utilizes
diversified renewables, increased energy efficiency
programs, and coordinated retirements of existing
coal plants.
This paper provides the technical analysis that explains
the critical pathway to achieve European integration
and UN Climate commitments, described using the
South East Europe 2050 Carbon Calculator; a policy
decision-making tool that generates techno-economic
scenarios for future decarbonization of the energy sec-
tor. The tool, which was developed by the Department
of Energy and Climate Change (DECC) UK and now
used by the International Energy Agency (IEA)5 and sev-
eral dozen countries6 across the globe, is based on an
open source design and emphasizes helping policy-
makers explore pathways and scenarios by changing
levers and ambition levels in an online calculator tool.
1 For the purpose of this paper South East Europe is defined as the following countries: Albania, Bosnia and Herzegovina, Croatia, Kosovo, Macedonia, Montenegro, and Serbia. Kosovo is not a member of the UNFCCC and therefore did not sign the Paris Agreement. However, Kosovo is actively seeking EU membership.
2 http://www.cop21.gouv.fr/en/
3 http://ec.europa.eu/enlargement/countries/check-current-status/index_en.htm
4 http://ec.europa.eu/enlargement/policy/conditions-membership/index_en.htm
5 Global Calculator: http://bit.ly/1TVd8BH
6 http://seechangenetwork.org/2050-energy-model-for-south-east-europe/
Two key pathways are articulated and examined: a
coal-dependent case called the “Road to Nowhere”
based on planned coal investments and the “EU
Road” case where South East European countries
successfully comply with the current EU environmen-
tal and climate policies.
We identify four main conclusions:
1) moving toward renewables in the electricity supply along the EU Road is directly cost competitive with the coal-dependent case;
2) demand-side management yields oppor-tunities for technological improvement, waste reduction, increased comfort/reduction of energy poverty, and job creation in the region;
3) the low-carbon transition offers the South East Europe countries to become leaders, not laggards, and;
4) all of these benefits accrue before considering the external costs of coal to public health and the environment.
Taken together, these findings highlight for a region
once seen as both troubled and a ‘policy taker’, not
a policy maker, a clear economic, environmental
and policy benefit from the aggressive pursuit of a
regional clean energy partnership.

8 South East Europe: The EU Road Or The Road To Nowhere? An energy roadmap for 2050: Technical analysis
GlossarySEE South East EuropeUN United NationsCOP Conference of PartiesEU European UnionDECC Department of Energy and
Climate ChangeIEA International Energy AgencyUNFCCC United Nations Framework
Convention on Climate ChangeSCADA Supervisory Control and Data Acquisition AMI Advanced Metering InfrastructurePV PhotovoltaicW WattNDCs National determined contributionsGHG Greenhouse gasCSO Civil society organizationSEE SEP South East Europe Sustainable
Energy PolicyGW GigawattWACC Weighted Average Cost of CapitalGDP Gross Domestic ProductWB World BankIMF International Monetary FundTWh Terawatt-hourkWh Kilowatt-hourEPBD European Performance Building DirectiveCHP Combined heat and powerLED Light emitting diodeCFL Compact fluorescent lightbulbICT Information and communication
technologyCNG Compressed Natural GasKt KilotonPkm Passenger-kilometerSO2 Sulfur dioxideNOx Nitrous oxidesPM Particulate matterEUR EuroUSD US DollarLCOE Levelized cost of electricityCAPEX Capital expenditureO&M Operations and Maintenance TREES TrainingforEnergyEfficient
Social HousingCm CentimeterEV Electric vehicleCSP Concentrating solar powerDC Direct currentAC Alternating currentFIT Feed-in tariffDSM Demand-side managementLTC Load tap changerFACTS Flexible AC transmission devicesHVDC High Voltage DCNZEBs Near-zero energy buildingsEECG EnergyEfficiencyCoordinationGroupNEEAP NationalEnergyEfficiencyActionPlan2DS 2°C ScenarioIPCC Intergovernmental Panel
on Climate ChangeCAISO California Independent System OperatorIED Industrial Emissions Directive
List of Figures
Figure 1. Primary energy supply per country & technology.
Figure 2. Decoupling of growth from energy consumption in the EU.
Figure 3. Coal-dependent pathway for primary energy supply from 2010–2050 in South East Europe.
Figure 4. EU Road for primary energy supply from 2010–2050 in South East Europe.
Figure 5. Balkan wind atlas from KfW.
Figure 6. Solar resource for South East Europe developed by the European Commission.
Figure 7. European solar PV installations (number) from 2007–2011.
Figure 8. Job creation through energy renovation of the building stock.
Figure 9.Actionstoreduceemissionsintegratingend-useefficiencywithelectrificationeffortsinCalifornia.
Figure 10. The role of transport in achieving CO2 reduction goals from the IEA, 2DS scenario.
Figure 11. Potential ramp requirements from overgeneration of solar PV in California due to changing times of generation and peak load in evening times when sun does not shine.
Figure 12.TheexperienceofCaliforniadealingwithsignificantmid-dayexpansionof solar PV generation from California Independent System Operator.
Figure 13. Timing and scale of different planning systems necessary to plan for flexibility and a changing grid.
Figure 14. Final energy demand by sector for coal-dependent pathway from 2010 to 2050.
Figure 15. Primary energy supply by source for coal-dependent pathway from 2010 to 2050.
Figure 16. Greenhouse gas emissions by source for coal-dependent pathway from 2010 to 2050.
Figure 17. Electricity demand by sector for coal-dependent pathway from 2010 to 2050.
Figure 18. Electricity supply by source for coal-dependent pathway from 2010 to 2050.
Figure 19. Emissions from electricity for coal-dependent pathway from 2010 to 2050.
Figure 20. Final energy demand by sector for EU Road pathway from 2010 to 2050.
Figure 21. Primary energy supply by source for EU Road pathway from 2010 to 2050.
Figure 22. Greenhouse gas emissions by source for EU Road pathway from 2010 to 2050.
Figure 23. Electricity demand by sector for EU Road pathway from 2010 to 2050.
Figure 24. Electricity supply by source for EU Road pathway from 2010 to 2050.
Figure 25. Emissions from electricity for EU Road pathway from 2010 to 2050.
Figure 26. Energy system costs by sector for the EU Road and coal-dependent pathway from 2010 to 2050.
List of Tables
Table 1. The supply, demand and global, assumptions comparing the EU Road and coal-based pathways.
Table 2. Progress in capacity factors for wind by country to 2050.
Table 3. Range of capital expenditure cost for different technologies in South East Europe until 2050 in €/kW.
Table 4. Range of LCOE prices for EU and SEE used for validation and input in energy model.
Table 5. Sovereign credit ratings for selected EU and SEE countries.
Table 6. Costs for EU Road scenario.
Table 7. Costs for coal-based “Road to Nowhere” scenario.

9South East Europe: The EU Road Or The Road To Nowhere? An energy roadmap for 2050: Technical analysis
INTRODUCTION
With drastic reductions in the cost of solar and wind power and the aging of existing energy infrastructure
in the region, South East Europe faces a choice to follow a pathway relying solely on new coal development,
without any significant solar or wind, or advance toward EU accession by utilizing cleaner energy technologies
and energy efficiency measures by planning from now until 2050. The price of solar PV alone is expected to
drop from approximately €6.6/W in 2002 to €0.9/W by 20207. Further advances in wind technology and other
dispatchable renewable electricity options have altered the landscape for future investments in new genera-
tion capacity, where wind prices are expected to drop as well by 20–30% by 20308. Here we provide the techni-
cal analysis that explains the critical pathways described by the 2050 South East Europe Carbon Calculator9, a
policy decision-making tool that develops techno-economic scenarios for future decarbonization of the energy
sector in South East Europe. This document, using the 2050 Calculator, projects two scenarios and includes
sliding levers to develop the changes across different economic sectors for outcomes using the online calcula-
tor tool. The pathways follow the case focused on future planned coal development and the “EU Road” case
where South East European countries successfully comply with EU environmental and climate regulations.
The following sections outline the technical specifications of each pathway, including the methods, data, and
results of the South East Europe 2050 Carbon Calculator. The scenarios explore different energy development
pathways that follow along the coal trajectory and the EU Road. Developed alongside expert consultation
across the region with engineers, policymakers, and academic institutions, we investigate supply and demand-
side interventions in the energy sector to provide fairer, cleaner, and more efficient energy at a competitive
cost with current coal-based proposals.
With a significant regional aim for individual states to accede into the European Union combined with Croatia’s
recent accession in 2013, countries including Montenegro and Serbia can set the stage for Macedonia,
Albania, Bosnia & Herzegovina, and Kosovo’s entry. Emerging EU policy, such as the Energy Union Strategy,
shows that the EU considers South East Europe as an important region when resolving energy issues and
that cooperation between the EU and the Energy Community countries is necessary to meet EU energy policy
objectives. This Energy Community, a regional entity based on the Energy Community Treaty, represents an
international organization dealing with energy policy in six South East Europe countries, Moldova, and Ukraine
that work with the EU to bring EU energy policy into non-EU or prospective member states. The advantages
of systems-thinking across the regional energy picture, set forth through the Energy Community, can set
concrete examples to provide feasible pathways for nations to collaborate, join the EU, and create a fairer,
cleaner, and more efficient energy sector. Therefore, it becomes a particularly important institution to facilitate
transitions from centralized to distributed electricity generation paradigms and protect countries from going
bankrupt on new energy assets. As many centralized investments are becoming less financially viable in
Western Europe and the US, South East European countries run the risk of creating stranded assets when
7 Costs reflected in 2015 EUR. Zheng, C., & Kammen, D. M. (2014). An innovation-focused roadmap for a sustainable global photovoltaic industry. Energy Policy, 67, 159-169.
8 Lantz, E., Wiser, R., & Hand, M. (2012). The past and future cost of wind energy. National Renewable Energy Laboratory, Golden, CO, Report No. NREL/TP-6A20-53510.
9 For full calculator and web tool, visit: http://www.see2050carboncalculator.net

10 South East Europe: The EU Road Or The Road To Nowhere? An energy roadmap for 2050: Technical analysis
building large-scale coal-fired power plants with large generating capacity and high operating costs10. The
centralized development paradigm increasingly faces direct competition from more resilient, decentralized
power system designs. To get to the EU Road, the analysis presented demonstrates the cost and technical
needs to meet energy demand in the region through energy efficiency and renewable electricity supply that
simultaneously facilitates regional economic growth.
This report highlights four main findings: 1) moving toward renewables in the electricity supply along the EU
Road is directly cost competitive with the coal-dependent case, 2) demand-side management yields opportuni-
ties for technological improvement, waste reduction, increased comfort/reduction of energy poverty, and job
creation in the region, 3) the low-carbon transition offers the South East Europe countries an opportunity to
become leaders, not laggards, and 4) all of these benefits accrue before considering the external costs of coal
to public health and the environment.
Motivation/Rationale for 2050 Energy Model
Increased global concern for climate change culminating in the 2015 Paris Agreement spawned a heightened
need to identify and detail technical pathways that achieve low-carbon and sustainable development across
individual countries and across the world11. With six countries in South East Europe in agreement with the
Paris Agreement and a view toward EU membership, detailing the path forward toward emission reductions
and a healthier society remains critical. Countries provided flexibly designed national determined contributions
(NDCs). Furthermore, the current EU goal is to reduce greenhouse gas emissions by 80–95% by 2050 based
on 1990 levels with an interim target of at least 40% reductions by 203012. Each country in South East Europe
is now signatory to the Energy Community Treaty and is either on the path or plans to apply for EU member-
ship before 203013.
Institutions like the Energy Community will only strengthen and support regional development aims while
addressing problems at the intersection of the environment, energy sector, and society. Future planned
coal-fired power plants—namely in Bosnia and Herzegovina, Croatia, Kosovo, Montenegro, and Serbia not only
contribute to global climate change, but will incur irreversible regional costs to public health and the environ-
ment14. This model estimates the opportunity cost of these developments by using an accounting stock
10 For further information on stranded assets and their relationship in South East Europe coal projects, see the Smith School report. http://www.smithschool.ox.ac.uk/research-programmes/stranded-assets/publications.php http://bankwatch.org/sites/default/files/SEE-IFI-energy.pdf
11 2015 Paris Agreement was signed on 22 April 2016 and six countries in South East Europe have signed, all except Kosovo as it is not part of the UN or UNFCCC. http://www.un.org/sustainabledevelopment/blog/2016/04/parisagreementsingatures/
12 http://ec.europa.eu/clima/policies/strategies/2030/index_en.htm
13 Croatia joined the EU in 2013. Montenegro and Serbia have started membership talks. Macedonia and Albania are candidate countries. Kosovo and Bosnia and Herzegovina are potential candidates for EU membership. Being in the Energy Community and being in the EU are mutually exclusive. Croatia is already an EU member state therefore it is no longer in the Energy Community.
14 A recent study put the cost of coal on public health in South East Europe at 8.5 billion euros in health costs (HEAL, 2016). http://www.env-health.org/resources/press-releases/article/eur8-5-billion-in-health-costs

11South East Europe: The EU Road Or The Road To Nowhere? An energy roadmap for 2050: Technical analysis
framework and energy decision-making tool to analyze
costs and emissions of the coal-based proposals
on the table within South East Europe developed by
the UK Department of Energy and Climate Change
(DECC). With the technical calculator, we answer
questions of technical resource availability, sectoral
energy intensity, cost of scenario pathways, achieving
emission reduction targets and air quality, which relate
to energy security and public acceptance through
the stakeholder consultations. There are two main
aspects that drive change in the model – technologi-
cal levers and policy drivers.
Technological levers for change: The technology avail-
able to achieve national and regional decarbonization
is evolving rapidly. Particularly dramatic are the
changes in global production volume and price of
solar photovoltaic and solar thermal technologies,
and wind power, but game-changing innovations are
also ongoing in biomass energy, micro-hydro, and in
conventional flow-battery, and other evolving storage
technologies.
Policy drivers of change: Innovations in energy policy
across the world have provided years of historical
lessons for South East Europe countries. Facing the
prospects of EU accession, countries in South East
Europe can be proactive to shift the policy in favor of
environmentally and health-friendly renewable energy
policies that will address climate change and improve
regional air quality. For instance, the EU has a regional
target for at least a 40% reduction in GHG emissions by 2030 and following that a long-term target of 80–95%
emission reductions by 2050. Achieving EU accession and simultaneously meeting environmental conserva-
tion goals requires significant action and coordination across the region.
The purpose of the model is to evaluate the costs and options, given the rapidly declining cost of solar PV,
wind power, and sustainable biomass technologies for power generation. We investigate to what extent is the
alternative EU Road cost-effective and economically empowering compared to the plans for new coal capacity.
We analyze pathways through simultaneous action using technological levers and policy drivers.
In the Paris Agreement, all countries agreed
to formulate and communicate long-term
low greenhouse gas emission development
strategies. The European Commission, in its post-
Paris Communication, agreed to develop such a
strategy before 2020. To facilitate the preparation
of this strategy, the Commission will prepare an
in-depth analysis of the economic and social
transformations to feed the political debate in the
European Parliament, Council, and with stakehold-
ers. It is clear that both the global net-zero goal
and the 1.5°C objective from the Paris Agreement
change the whole landscape of Europe’s long-
term emission reduction objectives. It will be
crucial to ensure the roadmap is developed based
on the latest scientific evidence of the global
carbon budget and the EU’s fair share of targets
and reductions. Setting a new long-term target
should both help to identify policies, lifestyle
changes and technology developments needed,
and should as well identify new short – and
mid-term targets for 2025, 2030 and even 2050.
With this in mind, countries of South East Europe
need to strive towards the full decarbonization
in the second half of the century, to comply with
the Paris Agreement and the requirements of the
EU accession, but also to reap the benefits of
decarbonization: including jobs, better health, and
reduced dependency on fossil fuels.
12 South East Europe: The EU Road Or The Road To Nowhere? An energy roadmap for 2050: Technical analysis
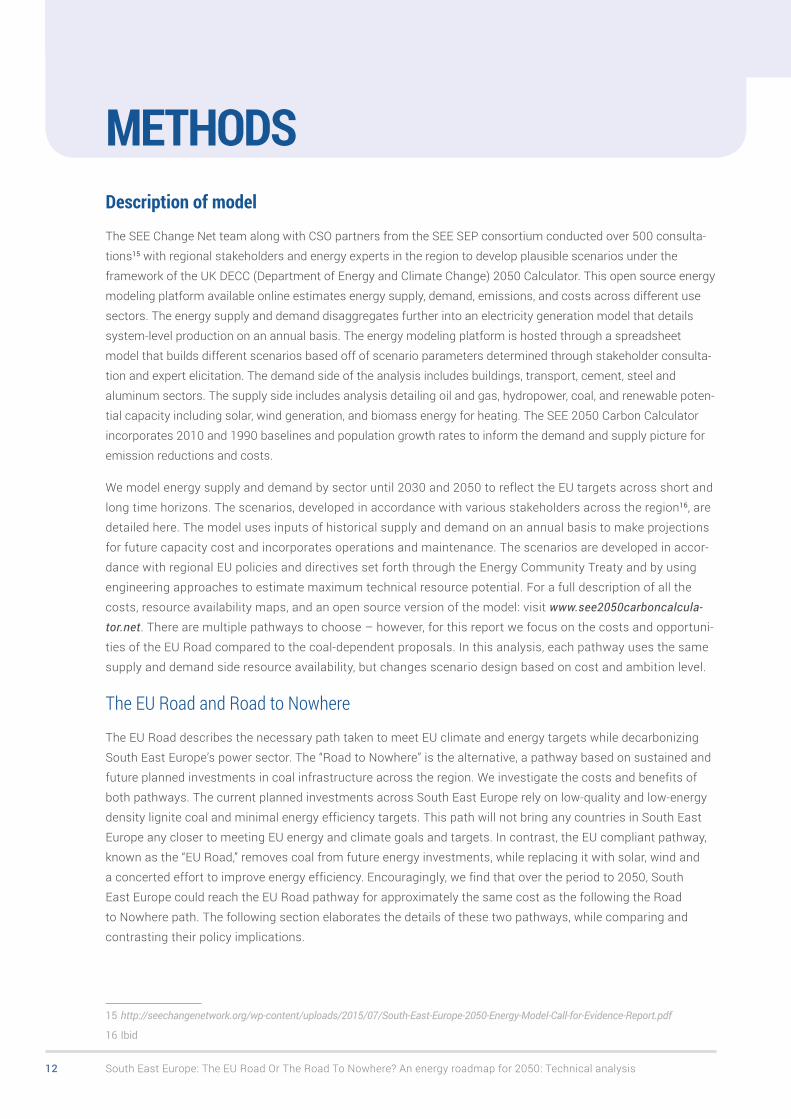
METHODSDescription of model
The SEE Change Net team along with CSO partners from the SEE SEP consortium conducted over 500 consulta-
tions15 with regional stakeholders and energy experts in the region to develop plausible scenarios under the
framework of the UK DECC (Department of Energy and Climate Change) 2050 Calculator. This open source energy
modeling platform available online estimates energy supply, demand, emissions, and costs across different use
sectors. The energy supply and demand disaggregates further into an electricity generation model that details
system-level production on an annual basis. The energy modeling platform is hosted through a spreadsheet
model that builds different scenarios based off of scenario parameters determined through stakeholder consulta-
tion and expert elicitation. The demand side of the analysis includes buildings, transport, cement, steel and
aluminum sectors. The supply side includes analysis detailing oil and gas, hydropower, coal, and renewable poten-
tial capacity including solar, wind generation, and biomass energy for heating. The SEE 2050 Carbon Calculator
incorporates 2010 and 1990 baselines and population growth rates to inform the demand and supply picture for
emission reductions and costs.
We model energy supply and demand by sector until 2030 and 2050 to reflect the EU targets across short and
long time horizons. The scenarios, developed in accordance with various stakeholders across the region16, are
detailed here. The model uses inputs of historical supply and demand on an annual basis to make projections
for future capacity cost and incorporates operations and maintenance. The scenarios are developed in accor-
dance with regional EU policies and directives set forth through the Energy Community Treaty and by using
engineering approaches to estimate maximum technical resource potential. For a full description of all the
costs, resource availability maps, and an open source version of the model: visit www.see2050carboncalcula-
tor.net. There are multiple pathways to choose – however, for this report we focus on the costs and opportuni-
ties of the EU Road compared to the coal-dependent proposals. In this analysis, each pathway uses the same
supply and demand side resource availability, but changes scenario design based on cost and ambition level.
The EU Road and Road to Nowhere
The EU Road describes the necessary path taken to meet EU climate and energy targets while decarbonizing
South East Europe’s power sector. The “Road to Nowhere” is the alternative, a pathway based on sustained and
future planned investments in coal infrastructure across the region. We investigate the costs and benefits of
both pathways. The current planned investments across South East Europe rely on low-quality and low-energy
density lignite coal and minimal energy efficiency targets. This path will not bring any countries in South East
Europe any closer to meeting EU energy and climate goals and targets. In contrast, the EU compliant pathway,
known as the “EU Road,” removes coal from future energy investments, while replacing it with solar, wind and
a concerted effort to improve energy efficiency. Encouragingly, we find that over the period to 2050, South
East Europe could reach the EU Road pathway for approximately the same cost as the following the Road
to Nowhere path. The following section elaborates the details of these two pathways, while comparing and
contrasting their policy implications.
15 http://seechangenetwork.org/wp-content/uploads/2015/07/South-East-Europe-2050-Energy-Model-Call-for-Evidence-Report.pdf
16 Ibid
13South East Europe: The EU Road Or The Road To Nowhere? An energy roadmap for 2050: Technical analysis
From a technical perspective, the EU Road envisions a dramatic shift from traditional centralized grid struc-
tures to a more distributed paradigm in the electricity sector. Transport and buildings will experience mode and
use shifts. They may change from simple energy consumers to producers. Transportation and buildings may
become electrified as a way to achieve decarbonization goals. Electric vehicles provide flexibility in transit and
electrification of buildings for heating can alleviate stresses on fossil – or biomass-based heat in buildings.
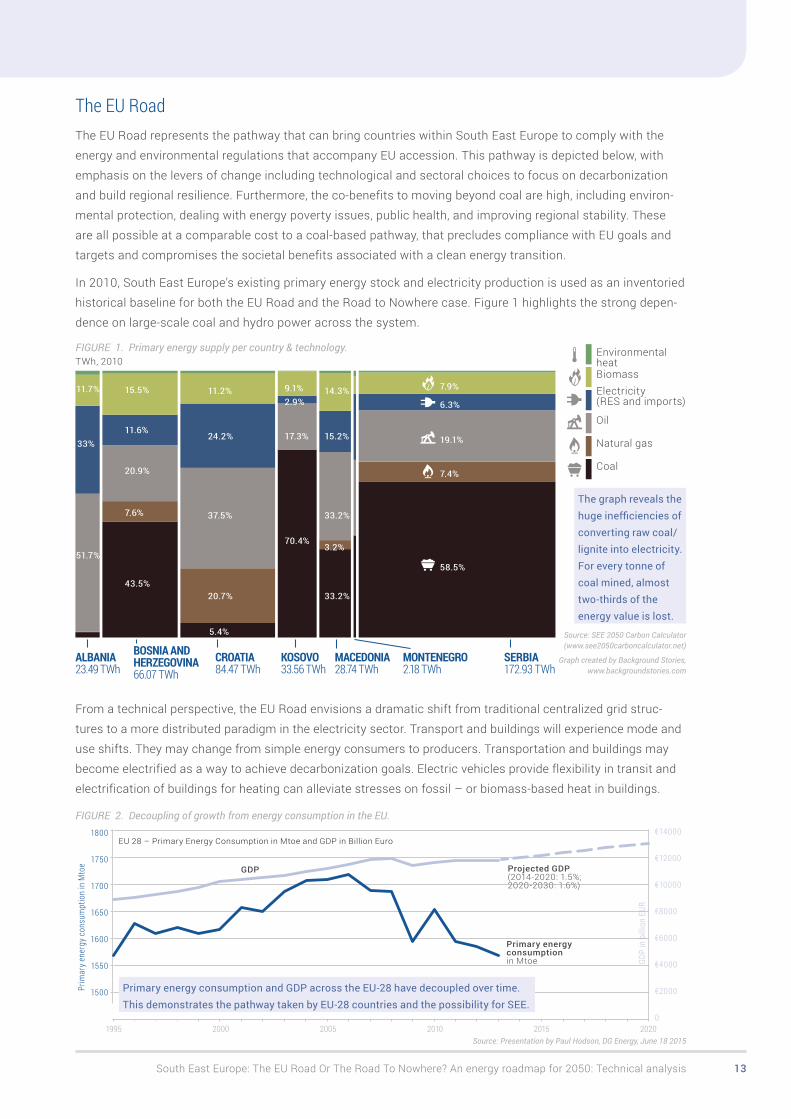
The EU RoadThe EU Road represents the pathway that can bring countries within South East Europe to comply with the
energy and environmental regulations that accompany EU accession. This pathway is depicted below, with
emphasis on the levers of change including technological and sectoral choices to focus on decarbonization
and build regional resilience. Furthermore, the co-benefits to moving beyond coal are high, including environ-
mental protection, dealing with energy poverty issues, public health, and improving regional stability. These
are all possible at a comparable cost to a coal-based pathway, that precludes compliance with EU goals and
targets and compromises the societal benefits associated with a clean energy transition.
In 2010, South East Europe’s existing primary energy stock and electricity production is used as an inventoried
historical baseline for both the EU Road and the Road to Nowhere case. Figure 1 highlights the strong depen-
dence on large-scale coal and hydro power across the system.
TWh, 2010FIgURE 1. Primary energy supply per country & technology. Environmental
heatBiomassElectricity (RES and imports)
Oil
Natural gas
Coal
The graph reveals the huge inefficiencies of converting raw coal/lignite into electricity. For every tonne of coal mined, almost two-thirds of the energy value is lost.
33%
11.7%
51.7%
ALBANIA23.49 TWh
20.9%
11.6%
43.5%
7.6%
15.5%
CROATIA84.47 TWh
SERBIA172.93 TWh
MONTENEGRO2.18 TWh
KOSOVO33.56 TWh
BOSNIA AND HERZEGOVINA66.07 TWh
5.4%
24.2%
20.7%
37.5%
11.2%
17.3%
2.9%
70.4%
9.1%
58.5%
19.1%
7.4%
6.3%
7.9%
3.2%
15.2%
33.2%
33.2%
14.3%
Source: Presentation by Paul Hodson, Dg Energy, June 18 20151995 2000 2005 2010 2015 2020
Projected GDP (2014-2020: 1.5%; 2020-2030: 1.6%)
1800
1750
1700
1650
1600
1550
1500Prim
ary e
nerg
y con
sum
ptio
n in
Mto
e
€14000
€12000
€10000
€8000
€6000
€4000
€2000
0
GDP
in b
illio
n EU
R
GDP
Primary energy consumption in Mtoe
EU 28 – Primary Energy Consumption in Mtoe and GDP in Billion Euro
FIgURE 2. Decoupling of growth from energy consumption in the EU.
Primary energy consumption and GDP across the EU-28 have decoupled over time. This demonstrates the pathway taken by EU-28 countries and the possibility for SEE.
Source: SEE 2050 Carbon Calculator (www.see2050carboncalculator.net)
graph created by Background Stories, www.backgroundstories.com
MACEDONIA28.74 TWh

14 South East Europe: The EU Road Or The Road To Nowhere? An energy roadmap for 2050: Technical analysis
The EU Road details the necessary investments to achieve an 80% reduction in greenhouse gas emis-
sions from 1990 levels. This compares to the coal-dependent pathway, which achieves some incremental
greenhouse gas emission reductions, but does not achieve the steep reductions necessary to meet EU
climate targets. This model explores the extent to which the EU Road pathway is technically feasible and cost
competitive with a coal-based path.
“Road to Nowhere” case
The “Road to Nowhere” case follows an unambitious pathway in terms of supporting diverse renewable energy
projects and pursues minimal effort in energy efficiency targets. This path contains planned coal plants due to
be built by 2025 and quantifies the direct financial and environmental costs. The projections and assumptions
are outlined in the figures and table below for supply, demand and greenhouse gas emissions. Following this
coal-dependent path hinders some countries from meeting increasingly ambitious EU climate commit-
ments. Also, new coal plants incur additional stranded investment risk that will be difficult to recover due to
technological path dependency. This pathway maintains heavy reliance on lignite coal across the region. The
following figures display the supply, demand, and emissions picture of a coal-dependent path.
The EU Road presents a set of ambition levels for technology levers and policy drivers against the coal-
dependent case summarized in Table 1. The assumptions are detailed in a side-by-side comparison to explain
the differences between the EU Road pathway and the Road to Nowhere. These critical assumptions represent
a wide divergence in both choice and environmental and climate impacts, yet interestingly enough, at a com-
parable overall system cost. This represents the feasibility of the clean energy transition and road to the EU,
highlighting the point that it is more of a choice, than a necessity to build more coal and that even on a cost
basis, there are multiple opportunities to meet future energy needs while enabling a better society—in terms of
environment, health, job creation, and political stability.
Figures 3 and 4 detail the primary energy supply pathways for the coal-dependent “Road to Nowhere” and
the “EU Road” respectively. Each path uses 2010 as a baseline year taking existing stocks and accounting for
future investments in different primary energy supply sources.Final Energy Demand Primary Energy Supply Greenhouse Gas Emissions
TWh/
yr
Conversion and distribution losses Industry Transport Lighting & appliancesHeating and cooling Agriculture and others Total final demand Business as usual
2010 2015 2020 2025 2030 2035 2040 2045 20500
100
200
300
400
500
600
TWh/
yr
Environmental heat Biomass Electricity (RES) and net imports CoalOil and petroleum products Gas Total final supply Business as usual
2010 2015 2020 2025 2030 2035 2040 2045 20500
100
200
300
400
500
600
MtC
O2e
/yr
Bioenergy credits CCS Fuel combustion Industrial processes & solventsAgriculture, waste & others Total net excluding international aviation Business as usualEU Target (vs. 1990)
2010 2015 2020 2025 2030 2035 2040 2045 2050-50
0
50
100
150
200
250
Energy http://www.see2050carboncalculator.net/2050/see/Energy.php?code=2010101010101010101111111111111201020102020103010101010101010...
1 of 2 2.6.2016 15:34
FIgURE 3. Coal-dependent pathway for primary energy supply from 2010–2050 in South East Europe.
Final Energy Demand Greenhouse Gas Emissions
TWh/
yr
Conversion and distribution losses Industry Transport Lighting & appliancesHeating and cooling Agriculture and others Total final demand Business as usual
2010 2015 2020 2025 2030 2035 2040 2045 20500
100
200
300
400
500 ● Conversion and distribution losses2030 : 75.4
TWh/
yr
Primary Energy Supply
Environmental heat Biomass Electricity (RES) and net imports CoalOil and petroleum products Gas Total final supply Business as usual
2010 2015 2020 2025 2030 2035 2040 2045 20500
100
200
300
400
500
MtC
O2e/
yr
Bioenergy credits CCS Fuel combustion Industrial processes & solventsAgriculture, waste & others Total net excluding international aviation Business as usualEU Target (vs. 1990)
2010 2015 2020 2025 2030 2035 2040 2045 2050-50
0
50
100
150
200
Energy http://www.see2050carboncalculator.net/2050/see/Energy.php?code=203030303030303030333333333333320302030203010303020102030303...
1 of 2 2.6.2016 23:36
FIgURE 4. EU Road for primary energy supply from 2010–2050 in South East Europe.
Source: SEE 2050 Carbon Calculator (www.see2050carboncalculator.net)
15South East Europe: The EU Road Or The Road To Nowhere? An energy roadmap for 2050: Technical analysis
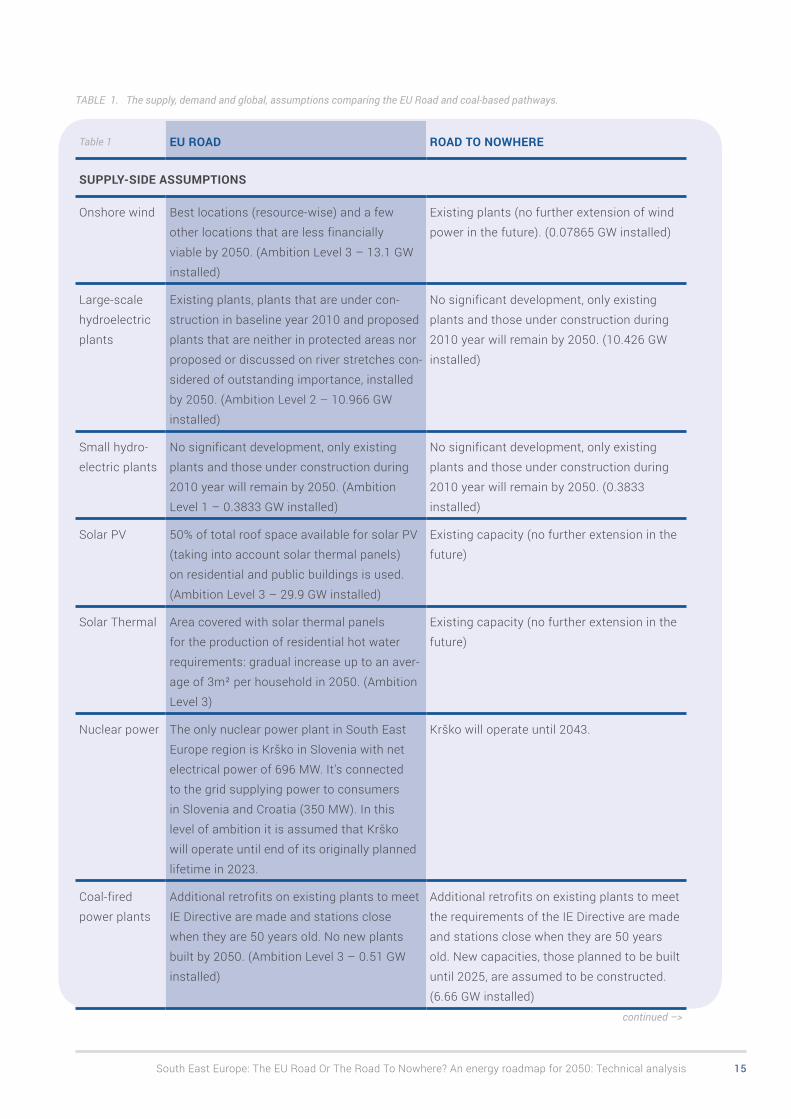
TABLE 1. The supply, demand and global, assumptions comparing the EU Road and coal-based pathways.
Table 1 EU ROAD ROAD TO NOWHERE
SUPPLY-SIDE ASSUMPTIONS
Onshore wind Best locations (resource-wise) and a few
other locations that are less financially
viable by 2050. (Ambition Level 3 – 13.1 GW
installed)
Existing plants (no further extension of wind
power in the future). (0.07865 GW installed)
Large-scale
hydroelectric
plants
Existing plants, plants that are under con-
struction in baseline year 2010 and proposed
plants that are neither in protected areas nor
proposed or discussed on river stretches con-
sidered of outstanding importance, installed
by 2050. (Ambition Level 2 – 10.966 GW
installed)
No significant development, only existing
plants and those under construction during
2010 year will remain by 2050. (10.426 GW
installed)
Small hydro-
electric plants
No significant development, only existing
plants and those under construction during
2010 year will remain by 2050. (Ambition
Level 1 – 0.3833 GW installed)
No significant development, only existing
plants and those under construction during
2010 year will remain by 2050. (0.3833
installed)
Solar PV 50% of total roof space available for solar PV
(taking into account solar thermal panels)
on residential and public buildings is used.
(Ambition Level 3 – 29.9 GW installed)
Existing capacity (no further extension in the
future)
Solar Thermal Area covered with solar thermal panels
for the production of residential hot water
requirements: gradual increase up to an aver-
age of 3m² per household in 2050. (Ambition
Level 3)
Existing capacity (no further extension in the
future)
Nuclear power The only nuclear power plant in South East
Europe region is Krško in Slovenia with net
electrical power of 696 MW. It’s connected
to the grid supplying power to consumers
in Slovenia and Croatia (350 MW). In this
level of ambition it is assumed that Krško
will operate until end of its originally planned
lifetime in 2023.
Krško will operate until 2043.
Coal-fired
power plants
Additional retrofits on existing plants to meet
IE Directive are made and stations close
when they are 50 years old. No new plants
built by 2050. (Ambition Level 3 – 0.51 GW
installed)
Additional retrofits on existing plants to meet
the requirements of the IE Directive are made
and stations close when they are 50 years
old. New capacities, those planned to be built
until 2025, are assumed to be constructed.
(6.66 GW installed)
continued –>

16 South East Europe: The EU Road Or The Road To Nowhere? An energy roadmap for 2050: Technical analysis
Table 1 EU ROAD ROAD TO NOWHERE
Imports of
electricity
Only if demand exceeds supply electricity
consumed in 2050 is from imports.
Biomass Locally-sourced biomass use will increase
by 20% compared to 2010 based on better
management and afforestation. (Ambition
level 2)
10% increase from 2010 levels by 2050
(linear growth rate)
Biofuels 3% of national liquid transport fuel consump-
tion addressed with locally produced liquid
biomass. (Ambition level 2)*
* Based on Renewable Energy Directive by 2020, the EU aims to have 10% of the transport fuel of every EU country come from renewable sources such as biofuels.
GLOBAL ASSUMPTIONS
Demographic
evolution
By 2050, the SEE population will decrease
by ≈10%, from 22.6 million to 20.6 million
people. This is due to the projected decline in
most countries, especially Croatia and Serbia;
Kosovo is the exception with the youngest
population in Europe and expected popula-
tion growth by 5% by 2050.
Structure of households will be influenced by
a variety of factors. Number of persons per
household is assumed at 2.8 on average in
the region.
Same demographic evolution assumed
for the purpose of scenario exercise and
comparison.
Economic
growth
Average regional GDP growth of ≈2.5% per
year. over the period by 2050.
The team has opted for GDP growth
assumptions which seem sensible over the
long-term, even if they might be lower than
pre-economic crisis levels or future growth
projections17.
Same GDP growth assumed for the purpose
of scenario exercise and comparison.
continued –>
17 In case of SEE 2050 Energy Models, World Bank, IMF and PRIMES GDP projections have all been taken into consideration during the modelling process.

17South East Europe: The EU Road Or The Road To Nowhere? An energy roadmap for 2050: Technical analysis
Table 1 EU ROAD ROAD TO NOWHERE
DEMAND-SIDE ASSUMPTIONS
Buildings Energy consumption of buildings sector
decreases by 34% (43 TWh) compared to
today’s level (2010).
Energy consumption of buildings sector
increases by 44% (55 TWh) compared to
today’s level (2010).
New buildings
and retrofit
programs
Performance levels in building codes for new
buildings and retrofits follow the EPBD18 and
EE policy framework; there is an early action
with relatively small time lag compared to EU
targets.
• All new buildings are nearly zero-energy
from 2025: they are well insulated and
generate power from rooftop solar panels
which is fed back into the grid.
• Retrofitting of existing buildings ramps up
– starting with significant improvements
like wall and loft insulation and super-
glazing, but reaching energy cuts of 90% or
more from 2030.
• Around ¾ of the existing buildings are
renovated. This requires a sharp increase in
renovation rates, from currently lower than
1% per year towards 2%–2.5% as of 2020.
Floor space per person in the region grows
moderately by 2050; at the same time, com-
fort levels improve (85% of space area heated
in 2050). People lower their thermostats – to
a lower but safe level of warmth.
Service sector floor area grows, driven by the
growth in Value added for services which is
assumed to increase 2.3% annually.
Performance levels in building codes
are characterized by slow and shallow
improvements:
• Heat demand of each new building will
decrease to standard of “very low energy”
of 30kWh/heated m² by 2030
• Shallow renovation, heat demand of
renovated buildings will be reduced by
20%–40%
• Less than half of the existing buildings are
renovated by 2050, with ≤ 1.5% per year
from 2020
Floor space per person in the region grows
moderately by 2050; at the same time, com-
fort levels improve (85% of space area heated
in 2050). People increase their thermostats
– to a higher level of warmth compared to
today.
Service sector floor area grows, driven by the
growth in Value added for services which is
assumed to increase 2.7% annually.
continued –>
18 “Nearly zero-energy” buildings are mandatory according to EPBD (European Performance Building Directive) for all new buildings as of 2021. EPBD Directive 2010/31/EU: “By December 31, 2018, new buildings occupied and owned by public authorities must be nearly zero-energy buildings. By December 31, 2020, all new buildings must be nearly zero-energy buildings”.
18 South East Europe: The EU Road Or The Road To Nowhere? An energy roadmap for 2050: Technical analysis
Table 1 EU ROAD ROAD TO NOWHERE
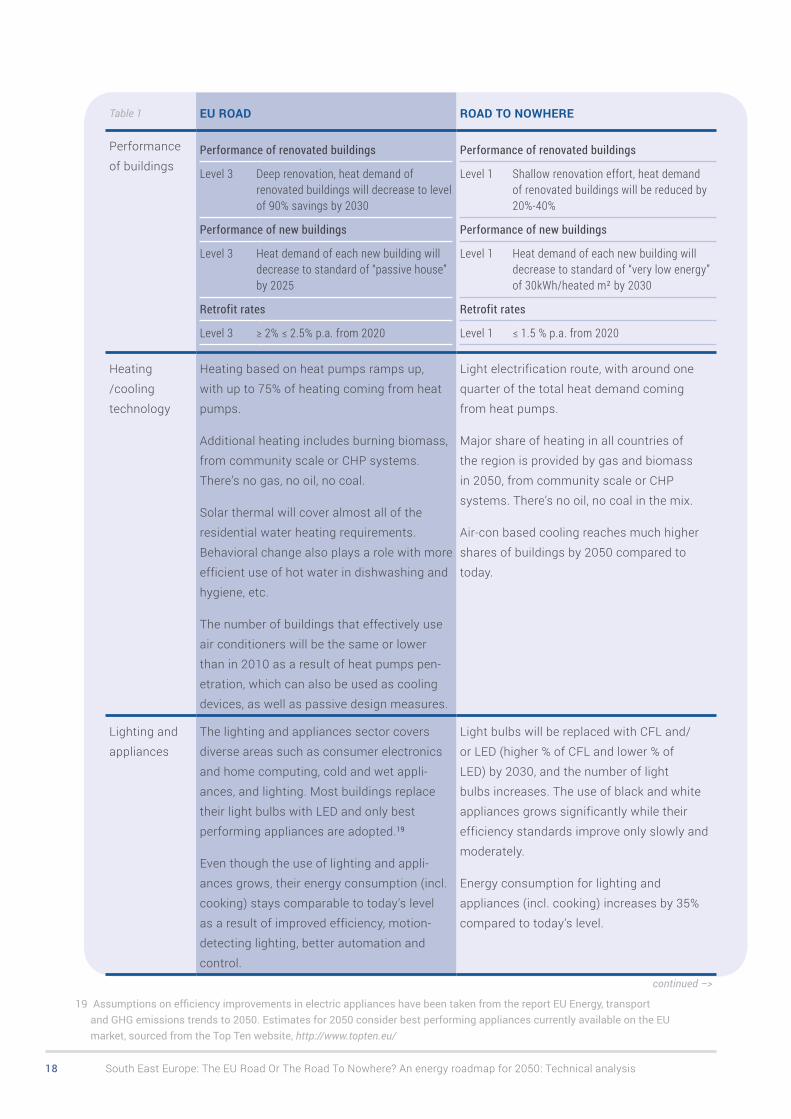
Performance
of buildingsPerformance of renovated buildings
Level 3 Deep renovation, heat demand of renovated buildings will decrease to level of 90% savings by 2030
Performance of new buildings
Level 3 Heat demand of each new building will decrease to standard of “passive house” by 2025
Retrofit rates
Level 3 ≥ 2% ≤ 2.5% p.a. from 2020
Performance of renovated buildings
Level 1 Shallow renovation effort, heat demand of renovated buildings will be reduced by 20%-40%
Performance of new buildings
Level 1 Heat demand of each new building will decrease to standard of “very low energy” of 30kWh/heated m² by 2030
Retrofit rates
Level 1 ≤ 1.5 % p.a. from 2020
Heating
/cooling
technology
Heating based on heat pumps ramps up,
with up to 75% of heating coming from heat
pumps.
Additional heating includes burning biomass,
from community scale or CHP systems.
There’s no gas, no oil, no coal.
Solar thermal will cover almost all of the
residential water heating requirements.
Behavioral change also plays a role with more
efficient use of hot water in dishwashing and
hygiene, etc.
The number of buildings that effectively use
air conditioners will be the same or lower
than in 2010 as a result of heat pumps pen-
etration, which can also be used as cooling
devices, as well as passive design measures.
Light electrification route, with around one
quarter of the total heat demand coming
from heat pumps.
Major share of heating in all countries of
the region is provided by gas and biomass
in 2050, from community scale or CHP
systems. There’s no oil, no coal in the mix.
Air-con based cooling reaches much higher
shares of buildings by 2050 compared to
today.
Lighting and
appliances
The lighting and appliances sector covers
diverse areas such as consumer electronics
and home computing, cold and wet appli-
ances, and lighting. Most buildings replace
their light bulbs with LED and only best
performing appliances are adopted.19
Even though the use of lighting and appli-
ances grows, their energy consumption (incl.
cooking) stays comparable to today’s level
as a result of improved efficiency, motion-
detecting lighting, better automation and
control.
Light bulbs will be replaced with CFL and/
or LED (higher % of CFL and lower % of
LED) by 2030, and the number of light
bulbs increases. The use of black and white
appliances grows significantly while their
efficiency standards improve only slowly and
moderately.
Energy consumption for lighting and
appliances (incl. cooking) increases by 35%
compared to today’s level.
continued –>
19 Assumptions on efficiency improvements in electric appliances have been taken from the report EU Energy, transport and GHG emissions trends to 2050. Estimates for 2050 consider best performing appliances currently available on the EU market, sourced from the Top Ten website, http://www.topten.eu/

19South East Europe: The EU Road Or The Road To Nowhere? An energy roadmap for 2050: Technical analysis
Table 1 EU ROAD ROAD TO NOWHERE
Transport Energy consumption of transport sector
decreases by 45% (37 TWh) and emissions
decrease by 60% compared to today’s level.
The use of diesel or petrol is reduced by 65%.
Energy consumption of transport sector
increases by 47% (38 TWh) compared to
today’s level.
Transport
demand
With currently low mobility rates, far below
the EU average, distance travelled by person
will increase by 90% by 2050 (average,
region).
There is an increase in goods movements
per person by 65% by road and rail and water
overall in the region. There’s a greater use
of ICT (Information and Communications
Technologies), more efficient routing and
fewer kilometers travelled per delivery.
Moderate growth in freight transport also
implies that we buy less things from shops.
Future GDP growth has been taken to induce
an increase in transport demand but there’s
also a push and effort to decouple transport
demand from GDP growth (role of ICT, urban
planning, work patterns, etc.).20
Distance travelled by person will increase by
130% by 2050 (average, region), induced by
the economic growth.
There is an increase in total freight transport
volume by 100% by road and rail and water
overall in the region.
Freight and passenger transport growth rates
are induced by GDP growth while decoupling
– actions and effort thought to influence
future mobility patterns (urban planning, ICT,
work patterns, etc.) – remains low.
Transport
modal split
There’s a shift away from car travel,
particularly in urban areas. The proportion of
passenger kilometers travelled by car falls,
but there’s an increase in cycling for short
distance journeys and rail travel in medium-
long distance journeys.
There’s an increase in car sharing, with 1 in
10 car journeys having an extra person(s) on
board.
2010 Level 3
Non-motorized transport (cycling, walking)
0.5% 8%
Share of bus pkm in total 30% 37%
Share of rail pkm in total 2.5% 9%
Share of car pkm in total 67% 46%
There is a shift to rail in freight transport,
with around 25% that’s currently going on
road shifting to rail.
Car oriented mobility remains dominant in the
region by 2050. The proportion of passenger
kilometers travelled by car is 60%, and there’s
a slight increase in cycling and rail travel.
Just as today – major share of freight trans-
port will be going on road.
continued –>
20 Some countries have already seen a trend of delinking suggesting the ways in which trends like urbanization (compact cities vs. sprawling cities), rising fuel costs, environmental consciousness, an aging society and digitalization influence mobility.

20 South East Europe: The EU Road Or The Road To Nowhere? An energy roadmap for 2050: Technical analysis
Table 1 EU ROAD ROAD TO NOWHERE
Transport
technology
Following the expected trends in the EU,
where the vast majority of the region’s cars
originate, around 80% of cars will be electric
or plug-in hybrids by 2050.
Switching from petrol and diesel to electric
cars will reduce pollution, especially in
cities, but infrastructures must be ready.
Electrification of transport will decrease
dependence on imported oil.
Freight transport poses a challenge; by 2050
it is predominantly fueled by oil and CNG,
with a small share of electric trucks. Biofuel
use stays on lower levels, until a number
of sustainability concerns are overcome to
enable biofuel consumption to increase in the
future.
Fully electric and plug-in hybrid trucks, as
well as electric vans, are available already.
Given that a large transition to electricity is
a key theme following the Paris Agreement,
energy used in transport could be diminished
and emissions reduced to zero at a faster
pace than anticipated in SEE 2050 Carbon
Calculator.
The vast majority of the region’s vehicles,
80% of cars, will run on oil.
Vehicle
efficiency
Ambitious vehicle replacement rates bring
the SEE region closer to the EU vehicle
efficiency standards. Efficiency for new pas-
senger cars (internal combustion engines –
ICE) follow from the EU policy where a target
value of 95 g/km of CO2 for 2020 for the new
car fleet is currently in place, with further
improvements expected by 2050.
Level 3
BUS ICE 35% efficiency improvements by 2050
CAR ICE 45% efficiency improvements by 2050
Efficiency of the vehicle fleet in the SEE
region will improve but at a very slow pace.
Level 1
BUS ICE 15% efficiency improvements by 2050
CAR ICE 15% efficiency improvements by 2050
continued –>
21South East Europe: The EU Road Or The Road To Nowhere? An energy roadmap for 2050: Technical analysis
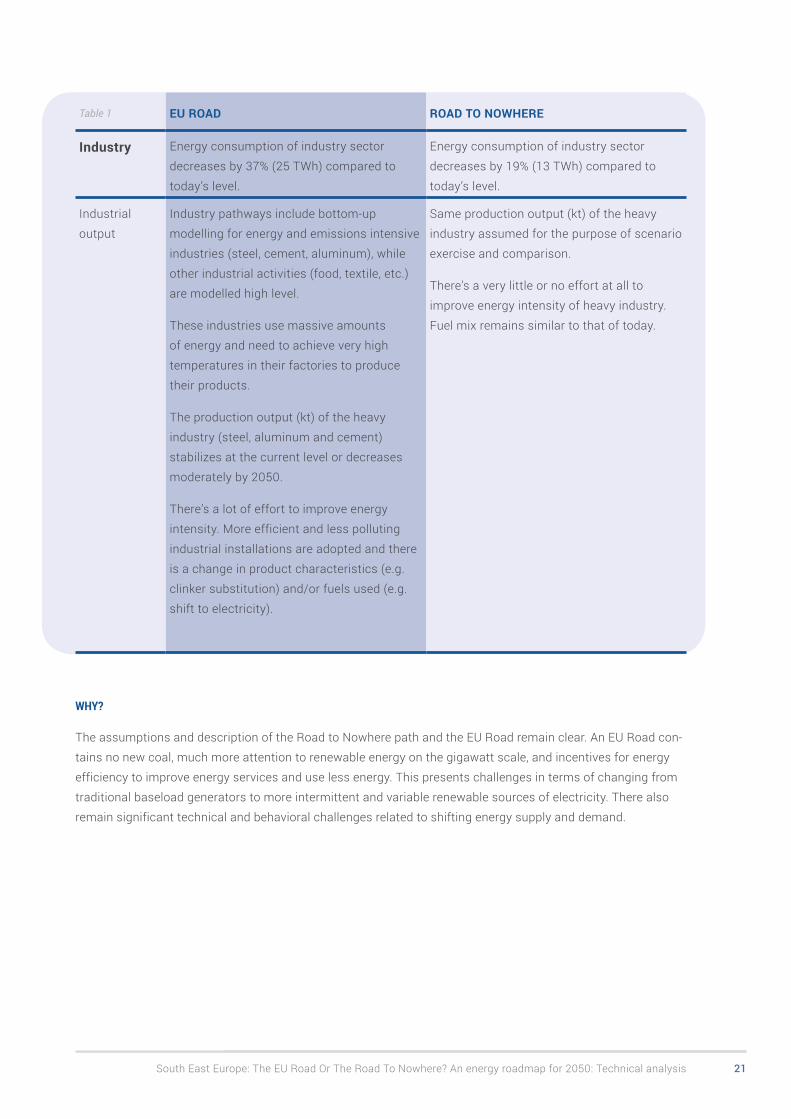
Table 1 EU ROAD ROAD TO NOWHERE
Industry Energy consumption of industry sector
decreases by 37% (25 TWh) compared to
today’s level.
Energy consumption of industry sector
decreases by 19% (13 TWh) compared to
today’s level.
Industrial
output
Industry pathways include bottom-up
modelling for energy and emissions intensive
industries (steel, cement, aluminum), while
other industrial activities (food, textile, etc.)
are modelled high level.
These industries use massive amounts
of energy and need to achieve very high
temperatures in their factories to produce
their products.
The production output (kt) of the heavy
industry (steel, aluminum and cement)
stabilizes at the current level or decreases
moderately by 2050.
There’s a lot of effort to improve energy
intensity. More efficient and less polluting
industrial installations are adopted and there
is a change in product characteristics (e.g.
clinker substitution) and/or fuels used (e.g.
shift to electricity).
Same production output (kt) of the heavy
industry assumed for the purpose of scenario
exercise and comparison.
There’s a very little or no effort at all to
improve energy intensity of heavy industry.
Fuel mix remains similar to that of today.
WHY?
The assumptions and description of the Road to Nowhere path and the EU Road remain clear. An EU Road con-
tains no new coal, much more attention to renewable energy on the gigawatt scale, and incentives for energy
efficiency to improve energy services and use less energy. This presents challenges in terms of changing from
traditional baseload generators to more intermittent and variable renewable sources of electricity. There also
remain significant technical and behavioral challenges related to shifting energy supply and demand.
17
18
19
20

22 South East Europe: The EU Road Or The Road To Nowhere? An energy roadmap for 2050: Technical analysis
But the benefits are enormous…
The benefits of the EU Road are enormous. Electricity prices in South East Europe are currently less than
half the price of the EU average. However, this “social pricing” of electricity generation and transmission is an
illusion and comes at a high cost. South East Europe citizens already pay this full cost of an unsustainable
electricity system—it just doesn’t show up on the electric bill. These costs include subsidies paid through
taxation, loss of income, and opportunities due to corruption.
Social and environmental disasters are already unfolding across the region. Energy poverty remains a problem,
where rural populations face low well-being from lacking adequate household heating services or face disproportion-
ate costs for electricity. The latest Energy Community report on energy efficiency21 highlights that “at least 50% of
the population spends more than 10% of their net income on energy.” This falls under a standard definition of fuel
poverty. Only ambitious building renovations and low-cost more sustainable renewable electricity supply can tackle
real causes of increasing electricity prices and costs incurred through the transmission and distribution system.
There are increasing premature deaths from air pollution – a study by HEAL estimated over 7000 premature
deaths per year caused by existing lignite based coal fired power plants in South East Europe22. Air pollution
poses a significant threat to public health, but can be avoided by pursuing the EU Road. This would save on
healthcare costs and improve air quality for breathing and exercise. The continued dependence on lignite coal
for power will continue the combustion and release of particulate matter, sulfur dioxide, nitrous oxides, and
mercury which reduce quality of life.
Climate change is causing extreme weather related events, affecting the supply and demand of electricity
generation and consumption. Extreme floods in Serbia during 2014 caused an estimated €1.7–1.8 billion in
damages23. Changing river flows and water levels cause problems not only for hydropower plants, but cooling
requirements for large lignite thermal plants. Large-scale, centralized projects also pose risks for human
resettlement and food shortages due to changing resource availability and climate activities.
Most important to the economy, unemployment rates have persisted throughout South East Europe due to
a lack of economic productivity and growth. Foreign direct investment, creditor, and lending agencies have
reduced credit ratings for countries across the region24. However, we find that there is significant jobs growth
potential by promoting energy efficiency targets and distributed renewable energy supply technologies for
the electricity sector. Often times, the decentralized nature of distributed energy resources facilitates quicker
deployment schedules than large centralized projects and requires more human labor during the installation
process. This promotes education and workforce skills training, which is important. The technology and jobs
section later compares jobs creation potential for decentralized solar and wind projects with centralized
baseload thermal plants. This clean energy transition toward distributed energy can promote jobs and skills
training desperately needed in South East Europe and spur economic growth beyond the current paradigm.
The following sections describe each of these concepts and technologies and how existing technology and
policies exist in practice for each ambition level advocated in the EU Road. The following section outlines the
supply and demand-side technological levers and policy drivers to meet the EU Road or continue on the Road
to Nowhere pathway.
21 Energy Community. 2015. Tapping On its Energy Efficiency Potential Energy Community Secretariat. https://www.energy-community.org/portal/page/portal/ENC_HOME/DOCS/3750146/18B2AB6BA84663F2E053C92FA8C064DA.PDF
22 http://env-health.org/IMG/pdf/factsheet_eu_and_western_balkan_en_web.pdf
23 Second Report on the Implementation of Social Inclusion and Poverty Reduction Strategy. 2015. http://socijalnoukljucivanje.gov.rs/wp-content/uploads/2014/11/Second-National-Report-on-Social-Inclusion-and-Poverty-Reduction-final.pdf
24 See Appendix for credit ratings for different countries’ sovereign credit ratings.

23South East Europe: The EU Road Or The Road To Nowhere? An energy roadmap for 2050: Technical analysis
Supply side information
On the supply side of the equation, our team gathered historical generation data by country for coal, oil, gas,
hydro, wind, solar, and biomass. Presently, lignite coal accounts for more than 50% of all generation capacity
and the region faces plans to increase the share in the coal-dependent pathway. Further information on the
differences between ambition levels is included in the Appendix 1.
Hydro resource availability
The small – and large-hydro resource data were all formulated using figures developed by the SEE SEP
Hydropower Working Group. For hydropower, capacity factors were calculated for each country in 2010 and
then we assume constant future capacity factors until 2050. Though this may ignore future effects of climate
change, this assumption keeps the accounting across countries standardized, as it remains uncertain the
extent that water level changes will impact hydropower production.
Onshore wind resource availability
Figure 5 highlights the variation in onshore wind resource availability across the SEE region with stronger
resources in the upper altitude areas of Montenegro, Bosnia and Herzegovina, and Croatia.
FIgURE 5. Balkan wind atlas from KfW.

24 South East Europe: The EU Road Or The Road To Nowhere? An energy roadmap for 2050: Technical analysis
Wind resource availability was obtained by the Balkan Wind Atlas commissioned by KfW and summarized in
Table 2. The consultancy Sander and Partner also constructed lever settings for this model. It is likely that
the wind technical potential used in this model is a lower-bound on regional wind potential because we have
excluded production from sites in areas where topographic altitude is above 1800 meters, areas where the
slope of the topography exceeds 20%, wooded lands, and areas within 900 meters of villages, all which could
increase the available wind resource if included.
Country Average capacity factor in 2010 (%)
Average capacity factor in 2050 (%)
Technical potential (GW)
Albania 25 35 2.55
Bosnia and Herzegovina 31 39 7.55
Croatia 31 33 4.97
Kosovo 25 33 1.55
Macedonia 28 33 1.25
Montenegro 32 37 0.72
Serbia 30 39 10.36TABLE 2. Progress in capacity factors for wind by country to 2050.
Solar resource
FIgURE 6. Solar resource for South East Europe developed by the European Commission. For further information on solar data—please see http://re.jrc.ec.europa.eu/pvgis/cmaps/eur.htm

25South East Europe: The EU Road Or The Road To Nowhere? An energy roadmap for 2050: Technical analysis
Figure 6 details the solar resource across South East Europe. We observe a strong regional solar resource,
notably as one moves further South. Compared to other regions in Germany and Western Europe where the
solar resource is smaller and there is on average cloudier weather, the SEE resource is less variable through-
out the year and more stable. There is seasonal discrepancy in solar resource between summer and winter
months, and our model accounts for such variation. Inputs on solar potential are derived from the Belgium
model developed by Climact25. The technical potential assessment used spatial information on total available
roofspace for solar development (including potential sites that would support solar thermal) on residential
and public buildings. Then, we used solar irradiation data developed by Suri et al. 2007 and Huld et al 2012 for
South East Europe.26 Therefore, the area of available land for solar is constrained by roofspace.
Biomass resource
Baseline biomass resource data came from Energy Community reports, notably the “Study on the Biomass
Consumption for Energy Purposes in the Energy Community.” All biomass resources available within the model
must come from domestic production and we assume no imports of biomass resource.
Cost projections of electricity supply options
The levelized cost of electricity (LCOE) for intermittent renewables has rapidly declined alongside supply short-
ages for gas in the region. Therefore, new investments in solar, wind, and also biomass are now beginning to
become cost competitive. Future investments in coal will require bulky sums of capital during construction
and operation. The ability to rapidly purchase and deploy distributed renewable resources takes advantage of
existing resource availability and the critical nature of addressing energy supply shortages due to the regional
plague of energy poverty. Table 3 details the range of capital expenditure costs over time for the different tech-
nologies explored in the SEE 2050 Carbon Calculator. The costs change over time and are reported estimates
from regional experts detailed in the Appendix.
TechnologyCAPEX 2010
CAPEX 2015
CAPEX 2020
CAPEX 2025
CAPEX 2030
CAPEX 2035
CAPEX 2040
CAPEX 2045
CAPEX 2050
Coal (low-high) 1600–2300 1600–2300 1600–2300 1600–2300 1600–2300 1600–2300 1600–2300 1600–2300 1600–2300
Gas 700–800 688–738 674–723 664–712 654–701 640–686 626–672 612–657 599–642
Onshore wind 1300–1550 1200–1400 1140–1330 1313–1125 1110–1295 1107–1292 1104–1288 1092–1274 1080–1260
Large hydro 1270–3320 1270–3320 1270–3320 1270–3320 1270–3320 1270–3320 1270–3320 1270–3320 1270–3320
Small hydro 1270–5000 1270–5000 1270–5000 1270–5000 1270–5000 1270–5000 1270–5000 1270–5000 1270–5000
Solar PV 1000–1200 869–1127 669–868 474–614 278–361 261–338 243–316 222–287 200–259
TABLE 3. Range of capital expenditure cost for different technologies in South East Europe until 2050 in €/kW.
The capital expenditure figures used in the model show a sensitivity across a range of potential future
prices. The assumptions are summarized in the appendices based on critical analyses in South East Europe.
Operations and Maintenance (O & M) costs used in the model are detailed online in the Call for Evidence
report27.
25 http://climactv2.voxteneo.net/pathways/2011110111110011111011011110112121212121214141212101311111001101110f1011111101001/emissions
26 Šúri M., Huld T.A., Dunlop E.D. Ossenbrink H.A., 2007. Potential of solar electricity generation in the European Union member states and candidate countries. Solar Energy, 81, 1295–1305, http://re.jrc.ec.europa.eu/pvgis/.
Huld T., Müller R., Gambardella A., 2012. A new solar radiation database for estimating PV performance in Europe and Africa. Solar Energy, 86, 1803–1815.
27 http://seechangenetwork.org/south-east-europe-2050-energy-model-conclusions-on-the-call-for-evidence-process/

26 South East Europe: The EU Road Or The Road To Nowhere? An energy roadmap for 2050: Technical analysis
Table 4 reports the range of LCOE prices compared across the EU and further information on the assumptions
for weighted average cost of capital (WACC) and credit sovereignty ratings are located in Appendix 2.
LCOE Range (EUR/MWh) 2015 European Union LCOE Range (EUR/MWh) 2015 South East Europe
Coal (lignite) 50 – 100 80–100
CCGT 70 – 90 80–100
Wind 50 – 100* 60–70
Hydro (large scale) 25 – 100 60–150
Solar 90 – 200 80–105
TABLE 4. Range of LCOE prices for EU and SEE used for validation and input in energy model.
* Highly dependent on local wind speeds
Electricity prices are heavily regulated across South East Europe. With the liberalization of electricity markets
within the region and unbundling of state-owned transmission and distribution enterprises, the price of elec-
tricity will increase. However, this may not alone incentivize demand for renewables or investments in energy
efficiency in absence of good policy and appropriate incentives. The true costs of energy are not quantified in
the current scheme. Short-sightedness in planning will result in extreme consequences for public health and
the environment, without considering the implications of rate structures, market designs, and hidden subsidies
for fossil-fuel based generation. In terms of capacity expansion, the switch to a lower marginal-cost, renew-
ables based electricity sector changes the policy and financial environment, while inspiring new and innovative
approaches. Overall, investments for new electricity supply will be essential to achieve EU Road targets of 80%
greenhouse gas emission reductions from 1990 levels by 2050.
Demand-side information
The demand portion of the model aggregates public residential, commercial (service), industrial, and transport
consumption information to project energy demand across sectors until 2050. The model also disaggregates
demand into sectoral building stock and energy consumption to analyze priority technological and policy
interventions. These interventions reflect different levels of ambition with regard to regional policy decisions
and technology choices on the EU accession road.
Buildings demand
For example, the model uses a stock-turnover model to explain technological improvement over time until
2050 in energy demand from households. The model assumes different rates of the pre-2010 building stock
renovation before 2050, and takes homes to different levels of energy consumption per square meter based
on the ambition level, ranging from low energy performance levels for new and renovated buildings to passive-
house designed buildings (<15 kWh/m²) as highlighted by the case in Croatia detailed below in the text. The
residential demand can be decreased in the model by several pathways – ranging from insulation, water
heating, to passive-house and near-zero building design principles28.
Insulating households could drastically reshape the demand picture for energy consumption in South East
Europe as evidenced through the model. Increasing insulation reduces energy used to heat homes through
traditional sources including biomass, but also inefficient resistive loads including electric space heaters that
require functional electric distribution systems. Electrifying the household heating sector through the use of
heat pumps, could help shift demand to alternative sectors. Secondly, electrifying the transportation sector
28 For further information see Conclusions on the Call for Evidence process: http://seechangenetwork.org/south-east-europe-2050-energy-model-conclusions-on-the-call-for-evidence-process/

27South East Europe: The EU Road Or The Road To Nowhere? An energy roadmap for 2050: Technical analysis
could also shift energy demand across sectors, providing a useful way to manage emissions from energy
consumption and reduce loads.
A clear example of energy in buildings retrofit occurred in Hungary29. These deep “efficiency” retrofits typically
utilize prefabricated technology and modular building panels to reduce energy consumption on a square meter
basis. A baseline study from Hungary documented average savings from 213 kWh/m^2 in building energy
consumption to 39 kWh/m^2. More than just the energy savings from the building retrofit, the Hungary case
highlights how seasonal summer and winter comfort can improve through more controllable loads. In the
Hungary case, 16 cm polystyrene insulation was installed. A 21–34 cm layer of insulation installed at the
roof yielded significant savings on the order of 80% of household energy consumption (TREES, Paris Mines
Tech 2016). Critical factors that affected energy consumption in both winter and summer included opening
windows, placement of ventilation units, ambient temperature, and use of venetian blinds in residential space.
These factors play a large role in the summer as well. This is a trend across many European states, and could
transfer easily across Serbia, Bosnia and Herzegovina, and the rest of South East Europe facing seasonal
changes in weather for building energy management.
Domestic hot water heating accounts for significant shares of energy use and therefore building retrofits
that address water heating through solar thermal technologies would also be able to reduce demand. These
technologies remain cost competitive with alternative fossil-based water heating devices and/or electric water
heaters.
Nearly zero-energy buildings already exist in most EU member states with notable pilot cases across Europe
in Graz, Austria, Sofia, Bulgaria, and Šparna Hiža, Croatia. In Croatia, nearly zero-energy building movement
already significantly reduced energy demand in several case studies30. In this country, nearly zero-energy
buildings have achieved annual energy footprints of less than 15 kWh/m²/year for heating. Key characteristics
include the use of 20 cm of stone wool, triple-glazed windows and solar thermal for domestic water heating.
Furthermore, the cost-effective nature of this new building construction demonstrated31 no additional costs
compared to baseline residential buildings in Croatia and remained about 912 EUR/m². This cost compares
to a baseline residential building and the return on investment is clear, as for the same investment, the owner
saves on fuel costs in a low-energy house. For the same upfront investment, the buildings can use less energy.
Combining building energy demand reductions with energy supply options — for instance – electrifying house-
hold heating through the use of heat pumps could provide significant savings that would drastically improve
energy use across South East Europe.
Pulling together a suite of projects to address heightened energy demand in the region will help improve
energy efficiency targets and efficiency, and reduce the pressure for electricity supply to provide energy
services to South East Europe. In an electricity supply constrained system, demand-side management and
improvements become supply-side resources and equally useful in addressing the transition to a low-carbon
society and lowering household costs for energy.
29 For further information on case study see MINES Paris Tech analysis: http://direns.mines-paristech.fr/Sites/TREES/Material/TREES_3.2_Dunaujvaros_text_261007.pdf
30 Multi-family apartment building Šparna hiža, Koprvnica, Croatia http://www.buildup.eu/en/practices/cases/multi-family-apartment-building-sparna-hiza-koprvnica-croatia
31 http://www.buildup.eu/en/news/overview-selected-international-examples-nearly-zero-energy-buildings

28 South East Europe: The EU Road Or The Road To Nowhere? An energy roadmap for 2050: Technical analysis
Transportation demand
For regional transportation demand, we used the framework developed by the EU in its Roadmap to a Single
European Transport Area – Towards a competitive and resource efficient transport system32. The Roadmap
includes concrete initiatives for the next decade to build a competitive transport system as well as dramati-
cally reduce Europe’s dependence on imported oil and cut carbon emissions in transport by 60% by 2050.
Contributing to a 60% cut in transport emissions by the middle of the century, key goals, among others,
include no more conventionally-fuelled cars in cities and a 50% shift of medium distance intercity passenger
and freight journeys from road to rail and waterborne transport. We also account for electric vehicle (EV) adop-
tion and the electrification of the transportation sector. Emerging EV manufacturers, including Tesla33, pose
as potential market entrants for electrifying transportation while experiencing significant decreasing costs on
a wide scale with the goal of a 30,000 USD model by 2016 for consumers, directly competitive with upper-tier
four-passenger automobiles. The model also explores how different levels of improvement in performance and
increase of railway traffic, coupled with reduced share of cars, respond to a need to sooner or later meet the
EU noise and outdoor air pollution standards and greenhouse gas emission reduction targets, as the region
currently suffers from high rates of motorized pollution, congestion and noise.
The projections for demand use sustainable mobility planning outcomes developed through already imple-
mented EU projects to test targets and projections estimated by the model. In the electrification of transporta-
tion, as prospective EU member states with an extremely large proportion of our current car stock coming
from EU sources, the model assumes that the region will follow the EU electrification trends with perhaps
some lag in the early years but steadily increasing as the region is absorbed into the EU.
32 Roadmap to a Single European Transport Area – Towards a more competitive and resource efficient transport system. http://ec.europa.eu/transport/themes/strategies/2011_white_paper_en.htm
33 www.teslamotors.com

29South East Europe: The EU Road Or The Road To Nowhere? An energy roadmap for 2050: Technical analysis
DEVELOPING A SMART GRIDDeveloping a smart grid remains a critical goal regionally and facilitates a wider transi-tion to renewables as an integral part of the EU Road. New technologies, defined by the advent of the smart grid, improve the monitoring and control of the transmission and distribution systems by linking information networks and nodes. By merging routine grid upgrades with smart grid improvements, South East Europe could emerge as a leader in meeting EU environmental and climate goals. The Smart Grid is an information systems network that uses communication technology through the internet to assist with controls and operations of the electricity grid in real-time.
Supervisory Control and Data Acquisition
Supervisory control and data acquisition services (SCADA) have emerged as technological opportunities
for change to improve the efficiency and distribution of electricity within South East Europe. Controllability
of loads, data sharing, and advanced metering infrastructure (AMI) can help the transition toward a more
efficient electric power system. More importantly, it will also cater to the integration of higher shares of inter-
mittent renewable energy generation, primarily sourced from solar PV, wind, and existing hydropower plants.
Advanced Metering Infrastructure
Advanced Metering Infrastructure (AMI) deployed in Italy and Germany showcase the ability of new technolo-
gies to facilitate and integrate demand-response programs with monitoring of residential, commercial, and
industrial energy consumption. Montenegro is already piloting a program to deploy smart meters. Albania
also plans to follow suit with increased distribution-system level monitoring and smart meter deployment
programs. This new technology allows for distribution-level systems planning and operations management
previously unattainable. This reduces costs of distributed energy systems and improves ability for utility com-
panies to collect on debts from commercial losses (i.e. Kosovo suffers from about 16% commercial losses due
to theft on the system34). Better monitoring and management can improve efficiency in existing infrastructure
and facilitate EU Road pathway. Given that new distribution equipment will require AMI regardless, due to tech-
nological changes, the grid improvements have the potential to leapfrog existing systems that do not provide
the same level of services as across the EU.
Transmission interconnectivity
A lack of transmission system interconnectivity hinders regional development and electricity market integration in
the Road to Nowhere case. First, expanding the market area for regional transmission trade provides opportuni-
ties to leverage excess hydropower supply and use it for grid stability and backup during blackouts. Using excess
supply in different areas allows for load balancing and lower electricity prices through market competition.
Most countries in South East Europe, notably Kosovo, Serbia, Bosnia & Herzegovina, and Macedonia experience
disproportionately high retail electricity rates for consumers, further pushing low-income groups into poverty due
34 ERO, Energy Regulatory Office. 2014 Tariff Rates for Kosovo. ERO Code: V_638_2014, 2014. http://ero-ks.org/Vendimet/English/2014/V_638_2014_final_eng.pdf

30 South East Europe: The EU Road Or The Road To Nowhere? An energy roadmap for 2050: Technical analysis
to high household heating and electric costs. This deters industry from investment. Furthermore, the expansion
of the transmission interconnection system provides necessary upgrades while facilitating the global expansion
of distributed energy resources as electricity generating options. This includes the potential for concentrating
solar power (CSP) in Bosnia & Herzegovina to support existing steel factories which combines parabolic trough
mirrors and molten salt-based thermal storage to provide dispatchable, baseload electricity. The modeling effort
here highlights that regional cooperation is necessary to achieve a low-carbon transition for EU accession in the
EU road. At the same time, a low-carbon transition could actually bring about regional cooperation by facilitating
infrastructural upgrades and improvements in neighboring systems. To achieve lower electricity costs overall,
transmission interconnectivity that utilizes smarter inverters, high voltage DC transmission cables, and further
electronics within grid architecture will be necessary and sensible investments to avoid further costs down
the road. The Road to Nowhere pathway does not enable this type of market exchange and system-level load
balancing.
Transformer aging
Aging transformers in the region could pose problems. However, the new investments to replace them may be
offset by the incorporation of new distributed energy resources on the grid. Including more distributed energy
resources within the power supply mix could inject reactive power back into the grid in a positive way that
could reduce the need to purchase future load tap changers, voltage regulators, and extra capacitors on the
grid for voltage support and frequency regulation.
Smart buildings
Smart buildings have significant potential to aid the integration of renewable electricity into the South
East European supply mix, while simultaneously providing enhanced monitoring on the demand side. The
technological capacity for new buildings to include smart sensors and monitors provide better information for
grid operators to forecast load. Also, smart buildings can self-generate electricity using distributed electricity
resource generation including rooftop photovoltaics and/or backup on-site storage. Secondly, they can
manage loads and electrify the heating sector with the use of heat pumps. Smart buildings already appear
across Europe, and when government and public institutions take the initiative to invest in these technologies,
it can spur adoption across the private sector and enable new partnerships. The advent of smart building
infrastructure calls for enhanced demand management, better information for system-wide energy demands,
and environmental data including building temperature, insulation, and required heating energy per unit area.
Critical to South East Europe’s deployment of sustainable energy options is the inclusion of smart buildings as
a way to manage loads on the demand-side and transition the grid architecture to more distributed networks
that improve system reliability and performance.

31South East Europe: The EU Road Or The Road To Nowhere? An energy roadmap for 2050: Technical analysis
Feed-in tariffs as a policy option
Feed-in tariffs (FIT) share a history of success and failure across Europe, however key to their success remains design
implementation. As a policy tool, feed-in tariffs will be critical to enable the EU Road and necessary for the 100%
renewables case to deploy rapid decarbonization schemes. Taking the case of Italy, it becomes clear that through
feed-in tariff type subsidies, the transition to lower-carbon electricity generators becomes much quicker and enables
a smoother transition that can encourage technological learning across economies of scale, as demonstrated in the
Figure 7. The rapid uptake of solar PV installations within Italy between 2010–2011 is illustrated by the feed-in tariff
design policy. This could serve as an example for rapid rates of adoption and growth in the similar resource rich areas
of South East Europe. Italy did exhibit a reduction in initial ambition from 23 GW of solar by 2012, due to oversubsi-
dization, however this economic inefficiency is mostly explained by the rapid decline in cost of photovoltaics from a
technological point-of-view. Therefore, policy design in South East Europe can learn from Italy to create more dynamic
feed-in tariff rates, that benefit the consumer and place less pressure on government subsidies to promote renewable
energy. Properly designed FIT schemes should ensure sustainable development and take into account environmental
impacts of proposed projects through environmental impact assessments. For example, hydropower plants located in
protected areas should not be eligible to receive public feed-in tariff subsidies, which has posed a problem in the past
for South East Europe. On a direct cost basis, we find that solar PV has improved such that it could provide lower-cost
and improved reliability in the electricity sector in South East Europe before needing to implement feed-in tariffs.
However, due to large coal subsidies35 in several countries including Kosovo, Bosnia and Herzegovina, and Serbia, it
would be useful to take lessons from Italy’s rapid solar development sector and apply them in a cautious way in South
East Europe. This would broaden technological basis, improve job opportunities, and regional economic growth.
FIgURE 7. European solar PV installations (number) from 2007–201136.Source: Ameli & Kammen, 2014
35 Risks for coal and electricity investments in the Western Balkans, Ukraine and Moldova due to state-aid rules. http://bankwatch.org/publications/risks-coal-and-electricity-investments-western-balkans-ukraine-and-moldova-due-state-ai
36 Ameli, N., Kammen, D.M. 2014. Innovations in financing that drive cost parity for long-term electricity sustainability: An assessment of Italy, Europe’s fastest growing solar PV market. Energy for Sustainable Development, 19, 130–137.

32 South East Europe: The EU Road Or The Road To Nowhere? An energy roadmap for 2050: Technical analysis
Demand-side management as a supply resource
Enabling future grid infrastructural upgrades, including smart meters could allow for large scale demand
response programs for industrial or commercial uses across the region. Currently, there are no reported
demand-side management based programs and this could not only reduce peak loads from the overall grid,
but could reduce the need for baseload power to deal with the intermittency of solar and wind-based genera-
tion. Energy efficiency or load reduction strategies could also reduce peak supply needs. The regional concern
surrounding energy supply security would benefit greatly from coordinated system planning. Therefore,
strategic investments in demand-side management going forward would greatly reduce the need for future
supply-side investments. Given the current supply infrastructure, prioritizing and reducing demand first would
ease the integration of variable and intermittent renewables. The increasing variability of supply combined
with continued reliance on variable demand means that new technologies to control load or shift demand will
greatly assist grid operators when working on infrastructure planning projects.
Building resilient, reliable smart grids
The transition to a smart grid requires investment in system monitoring equipment, infrastructure, and new
architectures to deal with increasingly complex systems. Installing smart meters at households and commercial
buildings offers greater flexibility in management and can significantly reduce the large reported losses across the
region that can be as much as 30% by country, with Albania even at 40% in combined technical and commercial
losses37. Furthermore, the lack of an integrated trading system for electricity reduces resiliency of the system in
the case of emergency disasters. The July 2014 explosion of a generator in Kosovo A lignite plant required a surge
in imports to make up for lost electricity that resulted in rolling blackouts across the country. Also, the Kolubara,
Kostolac, and Šikulje mines in Serbia and Bosnia and Herzegovina experienced severe damage during the floods
in the same year38. The flooded mines decreased coal electricity generation and increased the need to import elec-
tricity across the region. The weak regional transmission interconnection with Albania could be further improved
to take advantage of excess supply and more resilience to avoid cascade effects from poor generation infrastruc-
ture. Secondly, since most losses within the electricity sector across South East Europe occur in the distribution
system rather than the transmission system, then the upgrade to resilient systems requires advanced metering
and improvements in voltage regulators, load tap changers, and capacitor banks all along the distribution
system, all which are of considerable age and require new investment. There is no choice in upgrading existing
infrastructure across South East Europe, as it has already started to fail, evidenced by frequent electricity outages
including brownouts and blackouts. Therefore, if upgrades are inevitable, transition to a digital infrastructure and
electronic grid will pay dividends forward as EU accession targets must be met. The inclusion of smart inverters,
flexible AC transmission (FACTS) devices, and high voltage DC (HVDC) infrastructure can all enable a smart digital
management system. The increased use of electronics within the electric grid improves system performance,
reliability, and resiliency, and therefore comprises a key component for future power systems in South East Europe
as it looks to comply with the EU environmentally, and in an integrated market context.
37 Losses for the transmission and distribution system are available by country in South East Europe from the Energy Community web portal: https://www.energy-community.org/pls/portal/docs/3356393.PDF
38 For further information on the flooding, the following reports detail the damages from the Sikulje and Kostolac mines flooding: http://tuzlalive.ba/aktuelna-tema-zasto-je-potopljen-rudnik-sikulje/ (in Bosnian), http://www.balkanmagazin.net/struja/cid189–100744/izgradnja-bloka-b3-u-k… (in Serbian)

33South East Europe: The EU Road Or The Road To Nowhere? An energy roadmap for 2050: Technical analysis
Fix intermittency issues
The lack of grid preparedness remains a common critique of integrating variable wind and solar energy into
the South East European grid. However, since substantial investment in the electricity sector will increase
in the future due to necessary upgrades, proper investments and measures should ensure the integration
of renewables and address issues of intermittency. Voltage excursions on the grid and reverse power flow
may become issues due to distributed solar PV, however, in some cases, studies have shown the benefits of
deferred investment in capacitor banks and load tap changers39. Furthermore, lignite coal-based electricity
in several countries, notably Kosovo, Bosnia & Herzegovina and Serbia sometimes are variable despite the
purported baseload label of coal fired power plants.
Complete necessary grid upgrades
The grid will need to fundamentally improve in South East Europe to meet any future energy demand.
Transitioning to a renewable system will also necessitate or potentially contribute to the improvement of grid
devices and performance. The purchase and installation of new transmission interconnections will expand
balancing areas and provide opportunities for an open energy market. Market integration across the region
remains an obligation under the Energy Community Treaty, and will promote regional coordination that could
help countries accede to the EU.
PV as way to address feeder issues
Increased solar PV across the distribution system could also address issues in the feeder system. Distributed
solar may necessitate further grid upgrades to accommodate new technologies, however, the grid will
need upgrades for any new capacity. Secondly, with the improvement of distribution feeders (especially for
countries like Kosovo), the distribution company can improve revenues and also monitor electricity. This
would enable future demand response programs or other forms of energy efficiency interventions that could
effectively reshape both electricity supply and demand across the region.
39 Gil, H. A., & Joos, G. (2006). On the quantification of the network capacity deferral value of distributed generation. Power Systems, IEEE Transactions on, 21(4), 1592–1599.

34 South East Europe: The EU Road Or The Road To Nowhere? An energy roadmap for 2050: Technical analysis
TECHNOLOGY AND JOBSSeveral case studies are already emerging throughout the region taking advantage of new technologies
and lessons from around Europe to support an advanced economy and job creation as a pathway to EU
accession. For instance, heat pumps installed in public buildings could contribute to a growing trend toward
electrifying the household heating sector, one of the largest contributors to primary energy consumption in
the region. Expanding the utilization of heat pumps within the region could inspire cross-regional learning and
development. This technology significantly reduces costs in the household and commercial heating sectors.
Renovating buildings presents a huge potential to create direct new jobs in the construction sector. A study
developed by Copenhagen Economics estimated the renovation of the European building stock to promote
almost 1,000,000 new jobs summarized in Figure 7. The study suggested due to increased human labor
requirement for the insulation and promotion of energy efficiency technologies within buildings, then this
could promote skills training and job creation. For South East Europe especially, this remains a critical piece of
the economic puzzle and the Road to Nowhere path would maintain little-to-no additional job creation because
of the reliance on centralized and highly mechanized lignite plants. Without building renovations and retrofits,
the building stock will continue to decay and infrastructural value will decline in economic value.
A recently published study from Copenhagen Economics (Naess-Schmidt et al , 2012) has calculated that the energy renovation of the European building stock could lead to 760,000 to 1,480,000 new jobs.*
Available studies are summarized in tables below.
Total numbers of jobs created by energy renovations in the housing stockTotal jobs Source/year New jobs Period/Year SectorEC (2003; in BPIE, 2012) 280,000 to 450,000 2020 BuildingsEC (2005) 1,000,000 direct and indirect jobs 2005–2015 BuildingsEC (2011-a) 1,400,000 2011–2015 BuildingsEC (2012) 850,000 (per year) 2011–2020 BuildingsNaess-Schmidt et al. 2012 760,000 to 1,480,000 2012–2020 BuildingsSources: Various.
Numbers of jobs created by energy renovation of the housing stock per €1 million investmentJobs/€1 millionSource/Year New jobs Period/Year SectorUNEP (2008) 11.3 to 13.5 full-time equivalent jobs 2000 ResidentialL Union Social pour l’Habitat (2001) related 142 jobs in thermal renovation 2011 PropertyILO (2012) stock 15,7 direct and indirect jobs 2012 HousingEEIF (2012) stock 19 new local and non-transferable jobs 2012 ConstructionBPIE (2011) stock 17 new net jobs 2010 ConstructionSources: Various.
* According to Copenhagen Economics, these jobs will to a very large extent be ‘new jobs’ at a time of economic underperfor-mance. In fact, these jobs are likely to remain in the energy efficiency sector. However, as the economy returns to it structural level, there will be no positive effect on total employment in the economy.
FIgURE 8. Job creation through energy renovation of the building stock. For further information see Meijer, F., Visscher, H., Nieboer, N., & Kroese, R. (2012) Jobs creation through energy renovation of the housing stock. NEUJOBS Working Document. http://www.iza.org/conference_files/neujobs_2014/4.pdf

35South East Europe: The EU Road Or The Road To Nowhere? An energy roadmap for 2050: Technical analysis
Another option to consider for the low-carbon transition in South East Europe includes the utilization of existing
sites for concentrating solar power (CSP) development even though not considered in the model. For instance,
in Bosnia and Herzegovina, abandoned aluminum facilities already could demarcate the land area necessary for
specific CSP projects. By integrating CSP and other large-scale photovoltaic or wind developments with existing
or previous industry, and combining with molten salt thermal storage, systems can run on clean energy and use
biomass stocks to support seasons when solar or hydropower outputs decline. However, only solar photovoltaic
technologies appear in the SEE 2050 Carbon Calculator at this time.
Improving regional grid transmission intra-connections for better load balancing and renewable integration sup-
port remains a key feature of expanded investment in grid infrastructure. Geographically, resource sharing makes
sense due to inequitable distribution of renewable energy resources across countries. Wei et al. investigated job
creation potential from renewable energy and energy efficiency initiatives to calculate average lifetime employ-
ment per unit of energy and found that in the US the renewable energy and low carbon sectors generate more
jobs per unit energy delivered than fossil fuel-based sectors and solar PV creates the most job growth potential
compared to wind, biomass, and geothermal technologies (Wei et al., 2010)40. These results would apply in
the European context as well because most plants employ a comparative number of people across locations
(for instance a typical 300 MW coal unit employs 200–300 people). Solar PV and energy efficiency operations
including building retrofits specifically require more distributed labor during installation and transportation of
materials. Building energy cooperatives alongside international development projects, joint municipal and state
ventures, and private sector initiatives across the region all contribute to job creation and technological develop-
ment. These cooperative ventures need not only occur across supply side trading, but also in the demand sector,
specifically with regard to buildings. The current plans documenting Kosovo, Macedonia, Montenegro and Serbia
progress related to nearly zero-energy buildings (NZEBs) is described in the countries’ reports on implementation
of EPBD from 2013/201441. So far there is however limited use of the possibility to develop targets and plans for
increasing the number of NZEBs. The Work Programme of their Energy Efficiency Coordination Group (EECG)
for 2015–2016 foresees activities on harmonized development of the NZEB concept and action plans and the
promotion of existing EU applications and concepts42. The report on NZEB targets, available NZEBs and plans in
the next round of the National Energy Efficiency Action Plans (NEEAPs) should be available as of June 2016.
The benefits of integrating energy efficiency opportunities as a critical role in decarbonization of the grid are
clear. Figure 9 highlights the potential for efficiency to decrease greenhouse gas emissions while synergizing
with electrification efforts and low-carbon fuel substitution. In California’s case, energy efficiency programs facili-
tate significant reductions in energy demand and can simultaneously reduce greenhouse gas emissions intensity
of key industries. For instance, in Kosovo, it is estimated that nearly 2000 GWh of energy savings potential could
be leveraged toward reducing the need for new coal capacity.
40 Wei, M., Patadia, S., & Kammen, D. M. (2010). Putting renewables and energy efficiency to work: How many jobs can the clean energy industry generate in the US?. Energy Policy, 38(2), 919–931.
41 Energy Efficiency Action Plans. (2015). Energy Community. Available online at: https://www.energy-community.org/portal/page/portal/ENC_HOME/AREAS_OF_WORK/Instruments/Energy_Efficiency/EEAPs
42 For further information see the Task Force Coordination Group Work Programmes at https://www.energy-community.org/portal/page/portal/ENC_HOME/AREAS_OF_WORK/Instruments/Energy_Efficiency/Task_Force_Coordination_group/Work_Programmes

36 South East Europe: The EU Road Or The Road To Nowhere? An energy roadmap for 2050: Technical analysis
1. Efficiency
Fuels Electricity
Demand
GH
G In
tens
ity
2. Electrification
Fuels Electricity
Demand
GH
G In
tens
ity
3+4. “Low-Carbon” Fuels + Electric
Fuels Electricity
Demand
GH
G In
tens
ity
GHG Intensity-Demand Diagram
Four Actions to Reduce Emissions
Fuels Electricity
Demand
GH
G In
tens
ity 2050 BAU Emissions (830 MtCO2e)
“LOW-CARBON” FUELS + ELECTRICITY
EFFICIENCYELECTRIFICATION
Summary
Fuels Electricity
Demand
GH
G In
tens
ity
2050 Target Emissions (80 MtCO2e)
FIgURE 9. Actions to reduce emissions integrating end-use efficiency with electrification efforts in California.Source: CCST, 2011
South East Europe can also benefit from significant infrastructural upgrades that will facilitate transitioning
toward efficiency and electrification in the transportation sector.
Electrification of the transport sector
Electrification within the transport sector remains a critical piece of the path toward deep decarbonization.
Different initiatives underway in Scandinavia already highlight the potential for plug-in hybrid electric vehicles
with Oslo a leading city in EV adoption and charging stations. Furthermore, vehicle-to-grid interactions can spur
innovation in the distribution system to improve reliability and provide ancillary services. In the European Union,
roadmaps are already enabling the electrification of vehicles as regional tools. The expansion of regional power
grid networks through the electrification of vehicles has initiated discussion. In South East Europe, electrification
of transportation will facilitate emission reductions on the EU road, as the burden of gasoline powered vehicles
can switch to utilizing domestic electricity resources. These transitions are being led by countries like Norway,
where 50,000 electric vehicles were registered by April 2015. This has been achieved through policy and financial
mechanisms that include tax exemptions, prioritized parking allotments, free parking, and the ability to drive in
bus or carpool lanes which can be replicated in South East European context. Looking toward 2050, electrification
of vehicles will be necessary and a critical step toward meeting the EU Road, and avoiding the Road to Nowhere.
Globally, electric vehicles remain critical to decarbonization goals. Figure 10 illustrates the key role of
transport CO2 reductions in the International Energy Agency’s (IEA) “2DS” scenario (2°C Scenario), which
describes a future energy system that would limit average global temperature increases to 2°C by 2050.
The IEA 2DS indicates that the global transport sector must contribute about one-fifth of the total reduction
of GHG emissions from energy use in 2050. Meeting the 2030 target of the IEA 2DS implies that the global
stock of electric cars should maintain annual growth rates above 25% by 2025 and in the range of 7% to 10%
between 2030 and 2050. Even still, leading scientists suggest that limiting global warming to 2°C could still
result in catastrophic events, and 1.5°C remains a stronger target (IPCC, 2014). The Paris Agreement struck

37South East Europe: The EU Road Or The Road To Nowhere? An energy roadmap for 2050: Technical analysis
in 2015 underscores this notion that countries have agreed globally to contribute to greenhouse gas emission
reductions and South East Europe could present the case as a leader, not a laggard, for other transition econo-
mies facing the choice of centralized large-scale coal and hydro development versus the more distributed,
decentralized path that includes electrification of the transport sector in accordance with decarbonization of
the electricity sector. A large transition to electricity is a key theme, and the EU Road demonstrates this ability
for South East Europe to lead, following the Paris Agreement.
© OECD/IEA 2016 Global EV outlook 2016 Beyond one million electric cars
Page | 7
Introduction and scope
Introduction
The 21st Conference of the Parties (COP21) to the United Nations Framework Convention on Climate Change (UNFCCC) held in Paris in December 2015 reaffirmed the urgent need to strengthen, in the context of the transition to sustainable development and poverty eradication, the global response to the threat of climate change. The Paris Agreement, announced in December 2015, clearly set the objective to limit the global average temperature increase well below 2°C (UNFCCC, 2015a).
Meeting the objective set by the Paris Agreement can be achieved only provided that greenhouse gas (GHG) emissions from the energy system and non-energy sectors are reduced. The importance of mitigating emissions in the energy system is reflected in the 2DS of the IEA Energy Technology Perspectives (ETP) series (IEA, 2016a): the 2DS sets the target of cutting energy-related GHG emissions to roughly 15 gigatonnes (Gt) by 2050 (less than half of the 33 Gt emitted in 2013), and requires that they continue to fall thereafter (IEA, 2015c).
The transport sector accounts for about a quarter (23%) of global energy-related GHG emissions (IEA, 2015b). The ambitious GHG emissions reduction required to limit global warming to less than 2°C is unlikely to be achievable without a major contribution from the transport sector. The IEA 2DS indicates that the global transport sector must contribute about one-fifth of the total reduction of GHG emissions from energy use in 2050 (Figure 4).
Figure 4 ● GHG emissions reductions by sector to 2050 on a 2DS trajectory versus a 6DS trajectory
0
10
20
30
40
50
60
2013 2020 2025 2030 2035 2040 2045 2050
GtC
O2
Other transformation 6%
Buildings 14%
Transport 18%
Industry 23%
Power generation 39%
6DS trajectory
2DS trajectory
* The IEA 6°C Scenario (6DS) is largely an extension of current trends and excludes the adoption of transformative policies of the energy system. By 2050, energy use almost doubles (compared with 2010) and total GHG emissions rise even more, leading to an average global temperature rise projected to be at least 6°C in the long term.
Note: GtCO2 = gigatonnes of carbon dioxide.
Key point • Transport accounts for 18% of GHG emissions abatement in the 2DS (decarbonisation scenario) versus the 6DS (conservative projection based on the existing policy framework), by 2050.
EVs2, primarily BEVs and PHEVs, are seen as a major contributor to the 2DS GHG emissions reduction goal in transport, as they increase energy efficiency and reduce carbon intensity of
2 Electric cars include battery electric, plug-in hybrid electric, and fuel cell electric vehicles (BEVs, PHEVs, and FCEVs). The scope of this report, however, is limited to BEVs and PHEVs. References to electric cars and electric vehicles used in this report shall be interpreted as references regarding exclusively these two categories. An extensive discussion on the status and prospects of FCEVs is available in the IEA Hydrogen and Fuel Cells Technology Roadmap (IEA, 2015a).
*
FIgURE 10. The role of transport in achieving CO2 reduction goals from the IEA, 2DS scenario. Source: global EV Outlook 2016: Beyond one million electric cars, IEA, 2016
Heat pumps
Heat pumps are important to electrify space heating in residences and commercial buildings across South
East Europe. Existing projects in Sweden exhibit the transformative properties of heating electrification, as
they lead Europe with hundreds of thousands of installed heat pump units43. On a per capita basis, Sweden
leads European nations for electrification of household heating and has jumpstarted the economy with an
annual turnover of 700–800 million euros44. Transferring the learning and experience from developing over
30 TWh of installed heat pump generation in Sweden to South East Europe would address many of the issues
during wintertime and displace the heavy reliance on biomass fuels in households. This could offer health and
environmental benefits within households in addition to cost savings. Therefore, electric heat pumps could
serve as an example technological approach to electrification of household heating, which is established
globally as a transition necessary to achieve decarbonization goals.
43 Ground source heat pumps in Greece and Turkey have also been exploited on a pilot and demonstration scales for district heating, for instance at the National Technical University of Athens. Sanner, B., Karytsas, C., Mendrinos, D., & Rybach, L. (2003). Current status of ground source heat pumps and underground thermal energy storage in Europe. Geothermics, 32(4), 579–588.
44 Swedish Heat Pump Industry. http://cleantechfunding.org/2014/03/26/the-evolution-of-the-swedish-heat-pump-industry-an-efficient-use-of-development-resources/
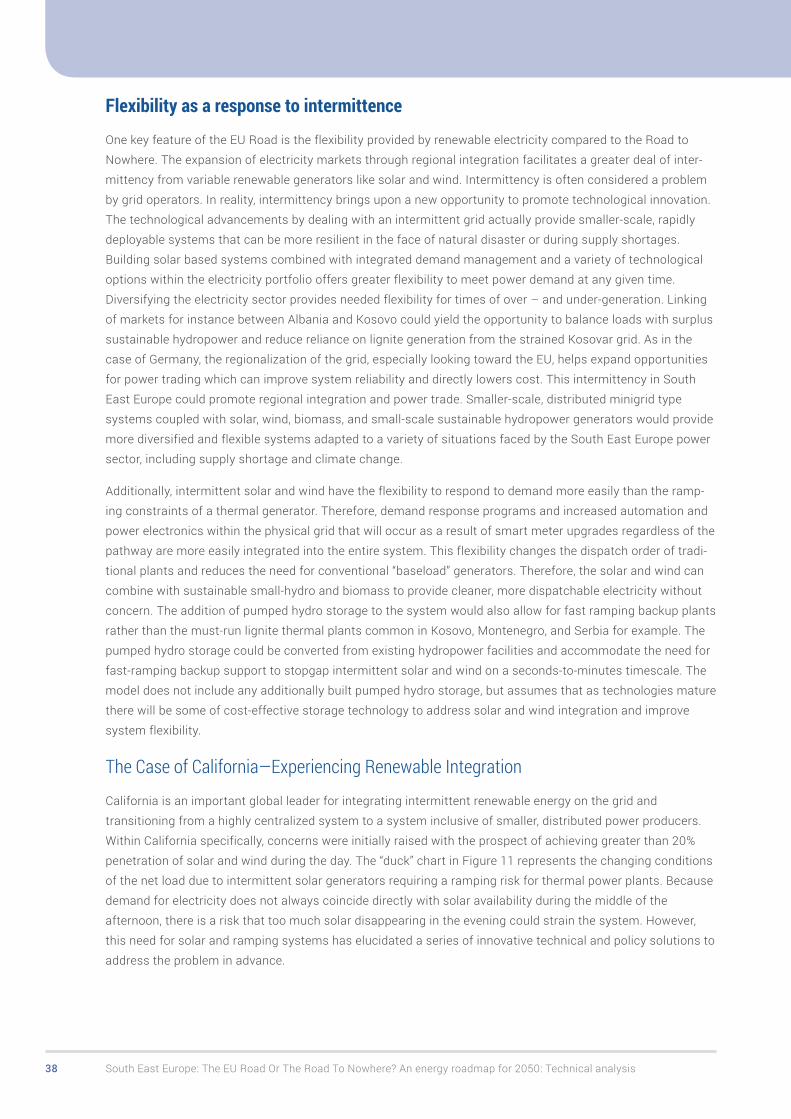
38 South East Europe: The EU Road Or The Road To Nowhere? An energy roadmap for 2050: Technical analysis
Flexibility as a response to intermittence
One key feature of the EU Road is the flexibility provided by renewable electricity compared to the Road to
Nowhere. The expansion of electricity markets through regional integration facilitates a greater deal of inter-
mittency from variable renewable generators like solar and wind. Intermittency is often considered a problem
by grid operators. In reality, intermittency brings upon a new opportunity to promote technological innovation.
The technological advancements by dealing with an intermittent grid actually provide smaller-scale, rapidly
deployable systems that can be more resilient in the face of natural disaster or during supply shortages.
Building solar based systems combined with integrated demand management and a variety of technological
options within the electricity portfolio offers greater flexibility to meet power demand at any given time.
Diversifying the electricity sector provides needed flexibility for times of over – and under-generation. Linking
of markets for instance between Albania and Kosovo could yield the opportunity to balance loads with surplus
sustainable hydropower and reduce reliance on lignite generation from the strained Kosovar grid. As in the
case of Germany, the regionalization of the grid, especially looking toward the EU, helps expand opportunities
for power trading which can improve system reliability and directly lowers cost. This intermittency in South
East Europe could promote regional integration and power trade. Smaller-scale, distributed minigrid type
systems coupled with solar, wind, biomass, and small-scale sustainable hydropower generators would provide
more diversified and flexible systems adapted to a variety of situations faced by the South East Europe power
sector, including supply shortage and climate change.
Additionally, intermittent solar and wind have the flexibility to respond to demand more easily than the ramp-
ing constraints of a thermal generator. Therefore, demand response programs and increased automation and
power electronics within the physical grid that will occur as a result of smart meter upgrades regardless of the
pathway are more easily integrated into the entire system. This flexibility changes the dispatch order of tradi-
tional plants and reduces the need for conventional “baseload” generators. Therefore, the solar and wind can
combine with sustainable small-hydro and biomass to provide cleaner, more dispatchable electricity without
concern. The addition of pumped hydro storage to the system would also allow for fast ramping backup plants
rather than the must-run lignite thermal plants common in Kosovo, Montenegro, and Serbia for example. The
pumped hydro storage could be converted from existing hydropower facilities and accommodate the need for
fast-ramping backup support to stopgap intermittent solar and wind on a seconds-to-minutes timescale. The
model does not include any additionally built pumped hydro storage, but assumes that as technologies mature
there will be some of cost-effective storage technology to address solar and wind integration and improve
system flexibility.
The Case of California—Experiencing Renewable Integration
California is an important global leader for integrating intermittent renewable energy on the grid and
transitioning from a highly centralized system to a system inclusive of smaller, distributed power producers.
Within California specifically, concerns were initially raised with the prospect of achieving greater than 20%
penetration of solar and wind during the day. The “duck” chart in Figure 11 represents the changing conditions
of the net load due to intermittent solar generators requiring a ramping risk for thermal power plants. Because
demand for electricity does not always coincide directly with solar availability during the middle of the
afternoon, there is a risk that too much solar disappearing in the evening could strain the system. However,
this need for solar and ramping systems has elucidated a series of innovative technical and policy solutions to
address the problem in advance.

39South East Europe: The EU Road Or The Road To Nowhere? An energy roadmap for 2050: Technical analysis
3
This report is available at no cost from the National Renewable Energy Laboratory (NREL) at www.nrel.gov/publications.
2 Background: Why Ducks Lead to Overgeneration The CAISO duck chart itself illustrates the general challenge of accommodating solar energy and the potential for overgeneration and solar curtailment. In the chart, each line represents the net load, equal to the normal load minus wind and PV generation. The “belly” of the duck represents the period of lowest net load, where PV generation is at a maximum. The belly grows as PV installations increase between 2012 and 2020. While the amount of PV in 2020 is not shown directly, it can be estimated by comparing the 2012 curve to the 2020 curve. In this case, the normal load (i.e., no PV and adjustments for load growth) at about 1-2 p.m. on March 31, 2020 appears to be about 22,000 megawatts (MW), while PV is generating about 10,000 MW, leaving about 12,000 MW to be met with other resources. In this case, PV provides perhaps 45% of the total demand in this one hour. The duck chart also points to the period of overgeneration risk, which could result in curtailed energy.
Figure 1. The CAISO duck chart
Source: CAISO 2013
The CAISO duck chart document does not explicitly quantify the amount of expected curtailment during this period, but it describes two main causes:
The first occurs as the ISO [independent system operator] prepares to meet the upcoming upward ramps [using conventional generation] that occur in the morning and in the late afternoon. The existing fleet includes many long-start resources that need time to come on line before they can support upcoming ramps.
FIgURE 11. Potential ramp requirements from overgeneration of solar PV in California due to changing times of generation and peak load in evening times when sun does not shine. Source: CAISO, 2013
For Operating Day:
Renewable Resources
Peak Production
Time
Max.
Peak Production (MW)
Daily Production (MWh)
Solar Thermal 11:46 639 5,335
Solar 13:23 5,591 52,117
Wind 22:44 3,135 54,782
Small Hydro 17:56 280 3,871
Biogas 17:26 191 4,446
Biomass 15:46 337 7,709
Geothermal 5:52 1,041 23,766
Total Renewables 152,025
Total 24-Hour System Demand (MWh): 737,173
36,464
Time: 16:51
Previous Renewables Watch reports and data are available at http://www.caiso.com/green/renewableswatch.html
Page 1 of 2
Wednesday, July 22, 2015
Renewables Production
24-Hour Renewables Production
This table gives numeric values related to the production from the various types of renewable resources for the reporting day. All values are hourly average unless otherwise stated. Peak Production is an average over one minute. The total renewable production in megawatt-hours is compared to the total energy demand for the ISO system for the day. Solar PV and Solar thermal generators that are directly connected to the power grid. “Solar PV” is defined as solar generating units that utilize solar panels containing a photovoltaic material. “Solar Thermal” is defined as solar generating units that
convert sunlight into heat and utilize fossil fuel or storage for production which may occur after sunset.
This table gives numeric values related to the production from the various types of renewable resources for the reporting day. All values are hourly average unless otherwise stated. Peak Production is an average over one minute. The total renewable production in megawatt-hours is compared to the total energy demand for the ISO system for the day.
System Peak Demand (MW) *one minute average
Renewables
Nuclear
Thermal
Imports
Hydro
0
5,000
10,000
15,000
20,000
25,000
30,000
35,000
40,000
1 2 3 4 5 6 7 8 9 10 11 12 13 14 15 16 17 18 19 20 21 22 23 24
Hourly Average Breakdown of Total Production By Resource Type
Time of Day
This graph depicts the production of various generating resources across the day.
Meg
awat
ts
Geothermal
Biomass Biogas Small Hydro
Wind
Solar PV
Solar Thermal
0
1,000
2,000
3,000
4,000
5,000
6,000
7,000
8,000
9,000
10,000
1 2 3 4 5 6 7 8 9 10 11 12 13 14 15 16 17 18 19 20 21 22 23 24
Hourly Average Breakdown of Renewable Resources
This graph shows the production of various types of renewable generation across the day.
Time of Day
Meg
awat
ts
The Renewables Watch provides important information about actual renewable production within the ISO grid as California moves toward a 33 percent renewable generation portfolio. The information provided is as accurate as can be delivered in a daily format. It is unverified raw data and is not intended to be used as the basis for operational or financial decisions.
FIgURE 12. The experience of California dealing with significant mid-day expansion of solar PV generation from California Independent System Operator.Source: CAISO, 2015
Figure 12 highlights California’s experience with intermittent renewables, where policy targets of 33% renew-
able generation by 2020 and 50% by 2030 are rapidly being met. The figure above details hourly averages
of renewable resources on July 22, 2015 exposing the significant expansion of solar PV generation during
mid-day. Traditional grid operators balk at the notion of not being able to turn on and off solar PV electricity.
However, in California’s case, as evidenced through the duck curve, much of the solar PV reduces need for

40 South East Europe: The EU Road Or The Road To Nowhere? An energy roadmap for 2050: Technical analysis
gas generation during the day, and innovations in demand response and energy storage alleviate ramping
constraints. The result is a more resilient system that does not rely heavily on one single centralized source of
generation, but a growing network of diversified, distributed options.
Germany and Denmark
Germany and Denmark have also dealt with increased penetrations of solar and wind based generation in
the European context, respectively. In 2013, Germany actually hit a 59% peak load met through intermittent
renewables. In total, the incoming solar radiation within South East Europe greatly exceeds that of Germany,
making solar an attractive option especially in southern states like Albania, Macedonia, and Kosovo. The
case of wind generation in Denmark speaks volumes for South East Europe as the country transitions into
a more integrated energy market. In September 2015, when wind generation exceeded 100% of Denmark’s
demand for one day and generation peaked at 140%, the transmission interconnections set up between
neighboring countries facilitated a great export of excess wind electricity across Western Europe and prices
went negative45. The strong wind fields in Croatia and Serbia would be poised to build excess wind generating
capacity for power export to supply constrained countries for instance, Kosovo and Albania. In other parts of
Croatia and Serbia, they could benefit from imports and two-way exchange. This would facilitate lowered costs
across the entire system. In addition, regional interconnections provide greater flexibility to manage loads
and conduct load following exercises. Supply risk becomes lessened with the expansion of interconnections
to balance renewables. Feasibly, stronger interconnections across with Austria could feed into the rest of the
European Union and enable high penetrations of renewables, and certainly meet the targets laid forth by the
EU Road pathway. However, as is the case elsewhere, a business-as-usual approach will not be able to meet
the flexibility needs of a 21st century power grid.
FIgURE 13. Timing and scale of different planning systems necessary to plan for flexibility and a changing grid.Source: Von Meier, 2016
45 Europe’s storms send power prices plummeting to negative. 9 January 2014. Reuters http://www.reuters.com/article/us-europe-power-prices-idUSBREA080S120140109

41South East Europe: The EU Road Or The Road To Nowhere? An energy roadmap for 2050: Technical analysis
Furthermore, the transition to a modern grid, that remains flexible and resilient requires coordination along
multiple time scales. Figure 13 explains the technologies and coordination efforts necessary to facilitate
distributed renewables. The planning for new types of energy systems occurs across jurisdictional levels, time
scales, and technologies. The policies developed in California and elsewhere help inform the technical aspects
of integrating renewables to encourage a low-carbon transition. In South East Europe, for instance, investment
in distribution system upgrades will significantly augment efforts in replacing decommissioned coal capacity
with solar and wind. The experience in California, highlights the possibilities, not only technically, but as an
economic center where renewables simultaneously stimulate job creation and technical training. Within
South East Europe, an opportunity emerges to enhance cross-cultural exchange of scientific and engineering
information and implement technologies that increase grid efficiency while mitigating the problems of inter-
mittency from solar PV and wind.
Regional Examples
Across South East Europe, we are already observing a grand choice between the Road to Nowhere and EU
Road pathways. The results of the model can be illustrated with several highlights from countries within the
region to meet decarbonization and reliability targets. For instance, Albania’s energy sector is remarkably low-
carbon, however the system relies on hydropower for electricity generation. There are significant opportunities
in the future to expand solar photovoltaic generation through an abundant resource. Additionally, Albania
would serve the region well as an electricity trading hub to countries including Bosnia and Herzegovina
and Kosovo. The potential for regionally transmitted pumped hydropower storage, to provide reservoir and
dispatchable services, akin to Switzerland’s role in the EU power mix, albeit on a much smaller scale, would
greatly benefit regional cooperation and lower overall cost of electricity. Serbia and Bosnia and Herzegovina
are second to Kosovo in terms of electricity generation from lignite coal. There are more efficient and more
cost-effective energy pathways, however, and future investments in lignite coal for Serbia and Bosnia and
Herzegovina are not necessary. The Road to Nowhere pathway would support the extension of large-scale coal
projects. Moving along the EU Road pathway would require a significant shift in thinking by utilizing effective
policies to promote distributed energy resources and a transition from locking in to large centralized projects.
Future proposed lignite-based coal fired power plants in Bosnia and Herzegovina and Serbia would not comply
with EU climate targets, and furthermore would detract from the solar PV, wind, sustainable hydropower, and
biomass opportunities in the region. The energy sector in Macedonia faces grand challenges to comply with
EU policies or goals. The EU Road case requires at least 72% reduction in greenhouse gas emissions from
1990 levels by 2050. However, through our model, the EU Road shows that Macedonia’s energy consumption
could greatly improve through efficiency improvements in the heating and cooling sectors. Trading regionally
would also benefit neighboring states to complement networks in Kosovo, Serbia, and Albania and build a
fully decarbonized electricity system. The vast solar resource in Macedonia complements supply shortages in
neighboring countries like Albania and Kosovo, while could generate up to 50% of supply needs from solar PV
by 2050 at similar cost of other options as estimated by the 2050 SEE SEP energy model. The different path-
ways exist and may not seem easy at first, however, the regional examples highlight paths to decarbonization
and the ability to implement EU requirements, bringing countries further along the path toward accession.
There are ten priority steps found in the model to meet the EU Road and avoid the Road to Nowhere pathway
that remain critical for success. They include the following steps:

42 South East Europe: The EU Road Or The Road To Nowhere? An energy roadmap for 2050: Technical analysis
Buildings: innovate and renovate
Switch on to efficient technologies
A tighter grid
Close down coal
Wind where it blows best
THE EU ROAD
1. BUILDINGS: INNOVATE AND RENOVATEAll new buildings are near-zero energy from 2025:
they are well insulated, use highly efficient heating,
cooling and lighting, and generate power from
rooftop solar panels which is fed back into the grid.
Retrofitting of existing buildings ramps up – starting
with significant improvements like wall and loft
insulation and super-glazing, but reaching energy
cuts of 90% or more after 2030.
2. SWITCH ON TO EFFICIENT TECHNOLOGIES Everyone switches to efficient fluorescent bulbs
and, increasingly, LED lighting by 2030 – part of
a general shift to energy-efficient technology.
Improvements in efficiency of household appliances
means higher standards of living don’t increase
electricity consumption.
3. A TIGHTER GRIDImprovements to infrastructure, management and
law enforcement mean less electricity is lost in the
transmission and distribution network. By 2030,
transmission and distribution losses are cut from
the regional average of 22%46 to 10% – the standard
currently set by Croatia, which has the lowest
distribution losses in the region47.
4. CLOSE DOWN COALMost of the region’s coal power plants are reaching
the end of their life. Retrofits are made on existing
plants so they meet the EU Industrial Emissions
Directive, and all plants close once they are 50 years
old48. A total of 39 units are closed by 2050, and no
new plants built49.
5. WIND WHERE IT BLOWS BESTThere’s a large but managed expansion of wind
power, focused only on the best locations – outside
protected areas – where the largest proportion of
power can be generated. More than 5,000 wind
turbines of 2.5 MW each are installed by 2050.
46 Regional average (excluding Croatia) for year 2014, according to Energy Community Annual Implementation Report, 2015; www.energy-community.org/portal/page/portal/ENC_HOME/ DOCS/3872267/23B450386A075E64E053C92FA8C0F69F.PDF
47 Distribution and transmission losses in Croatia in 2014, Croatian energy regulatory agency (HERA), 2014 annual report: www.hera.hr/hr/docs/HERA_izvjesce_2014.pdf p.35-36
48 This is 10 more years than usual plant lifetimes; with the increasingly poor economics of coal, they may not all be kept in operation this long. However, the reality in the region is that many plants are already more than 40 years old: closing coal plants at 40 would mean that 90% of units would need to be closed between 2018 and 2023.
49 Stanari in Bosnia and Herzegovina, which is currently under test operation, runs for its full foreseen lifetime.

43South East Europe: The EU Road Or The Road To Nowhere? An energy roadmap for 2050: Technical analysis
10 milestones on the road to a fairer, cleaner, sustainable and more efficient energy system in South East Europe
Sunny roofs
Hydro: a steady flow
Different modes of transport
Grow biomass responsibly
A drive toward electric vehicles
THE EU ROAD
6. SUNNY ROOFSSolar panels are installed on half of all suitable
rooftops. Total output in 2050: 50 TWh, a little
more than the 47 TWh generated by coal in the
region in 2010. Total cost: between €5.97 billion and
€7.75 billion. Added to this, 3m2 of solar thermal
installations per household help to meet hot-water
demand.
7. A DRIVE TOWARD ELECTRIC VEHICLESElectric cars become the norm, reducing emissions
and dependence on predominantly imported oil.
Following expected trends in the EU, where the vast
majority of the region’s cars originate, 80% of cars
will be electric or plug-in hybrids by 2050. Cars in the
region also catch up with continually improving EU
efficiency standards.
8. HYDRO: A STEADY FLOWExisting plants and those that were under
construction in 2010 remain in operation. Proposed
plants go ahead provided they are not in protected
areas or river stretches of outstanding quality,
and are built following sustainable hydropower
development guidelines.
9. DIFFERENT MODES OF TRANSPORTThere’s a shift away from car travel, particularly in
urban areas. The proportion of passenger kilometres
travelled by car falls by at least 30% compared to a
2010 baseline, but there’s an increase in cycling, and
rail travel returns to the level it enjoyed before 1990.
While investment is needed into public transport,
cycle networks and urban planning, by 2050 capital
costs and fuel costs are lower than if car travel
continues to increase.
10. GROW BIOMASS RESPONSIBLYThe use of solid biomass – mainly for domestic
heating – increases by 20%, and wood stoves are
made cleaner and more efficient. Biomass use is
based on efficient, sustainable forest management
and reforestation, and none of the wood is imported.
Created by Background Stories, www.backgroundstories.com

44 South East Europe: The EU Road Or The Road To Nowhere? An energy roadmap for 2050: Technical analysis
DATAHistorical trends
Historically, the Balkan region has relied primarily on lignite and hard coal for electricity generation. This is
supplemented with some gas reserves in Serbia and Croatia, however, on the whole the coal resource stocks
have supplied electric generators for decades. The problem, however, remains the reliance on coal-fired power
plants — from an emissions perspective and fly ash waste. Secondly, the centralized-paradigm grid desper-
ately needs upgrades to accommodate any new generation. Advances in smart grid technology – including
SCADA systems (Supervisory Control and Data Acquisition), FACTS (flexible AC transmission system) devices,
smart inverters, and basic supplies in the electric distribution system could transform the ability to manage
and operate the unmonitored grids in SE Europe and facilitate a clean transition to renewables. Thus far, we
have not seen governments or electric utilities sufficiently investing in the necessary power electronics for a
modern electricity grid. Yet these investments would propel South East Europe toward economic recovery and
a sustainable and reliable electric grid.
Data collection process
For each country we collected baseline data (year 2010) through expert elicitation within the region by conven-
ing a stakeholder network of 17 expert civil society, and public interest organizations. They all remained input
providers to the project and scenarios to ensure robustness.
Limitations
This model only addresses supply and demand-side investments in electricity generation, transmission, distri-
bution, household heating, cooking, and energy use, and does not model power flow simulations on an hourly
basis. It is an annual generation model. Costs have their own pre-defined trajectories by 2050. They can be
used only to compare overall energy system costs across pathways. However, the model provides significant
insight into investment and variable costs over time as well as a quantitative framework for comparing the
different pathways across the region and in different countries.

45South East Europe: The EU Road Or The Road To Nowhere? An energy roadmap for 2050: Technical analysis
RESULTSHere are the pathways pictured for South East Europe until 2050. Scenarios included are the coal-dependent and the EU Road (which complies with EU climate and energy targets) for direct generation, emissions, and cost comparison.
Figures 14–25 detail the results of the SEE 2050 Carbon Calculator for the coal-dependent and EU Road
pathways. Figures 14–19 represent the coal-dependent pathway and Figures 20–25 represent the EU Road.
These set of figures output the results of the model from 2010 to 2050 including energy demand by sector,
primary energy supply by source, greenhouse gas emissions by source, electricity demand by sector, electric-
ity production by source, emissions from electricity, and energy system costs by sector. These figures provide
the basis for comparison of each pathway, and when used in the online calculator tool provide an open source
way to explore different energy transition pathways and their effects on greenhouse gas emissions and energy
system costs.
Source: SEE 2050 Carbon Calculator (www.see2050carboncalculator.net)
Final Energy Demand Greenhouse Gas Emissions
TWh/
yr
Conversion and distribution losses Industry Transport Lighting & appliancesHeating and cooling Agriculture and others Total final demand Business as usual
2010 2015 2020 2025 2030 2035 2040 2045 20500
100
200
300
400
500
600 ● Conversion and distribution losses2015 : 128.98
TWh/
yr
Primary Energy Supply
Environmental heat Biomass Electricity (RES) and net imports CoalOil and petroleum products Gas Total final supply Business as usual
2010 2015 2020 2025 2030 2035 2040 2045 20500
100
200
300
400
500
600
MtC
O2e
/yr
Bioenergy credits CCS Fuel combustion Industrial processes & solventsAgriculture, waste & others Total net excluding international aviation Business as usualEU Target (vs. 1990)
2010 2015 2020 2025 2030 2035 2040 2045 2050-50
0
50
100
150
200
250
Energy http://www.see2050carboncalculator.net/2050/see/Energy.php?code=2010101010101010101111111111111201020102020103010101010101010...
1 of 2 2.6.2016 23:03
FIgURE 14. Final energy demand by sector for coal-dependent pathway from 2010 to 2050.

46 South East Europe: The EU Road Or The Road To Nowhere? An energy roadmap for 2050: Technical analysis
Final Energy Demand Greenhouse Gas Emissions
TWh/
yr
Conversion and distribution losses Industry Transport Lighting & appliancesHeating and cooling Agriculture and others Total final demand Business as usual
2010 2015 2020 2025 2030 2035 2040 2045 20500
100
200
300
400
500
600 ● Conversion and distribution losses2015 : 128.98
TWh/
yrPrimary Energy Supply
Environmental heat Biomass Electricity (RES) and net imports CoalOil and petroleum products Gas Total final supply Business as usual
2010 2015 2020 2025 2030 2035 2040 2045 20500
100
200
300
400
500
600
MtC
O2e
/yr
Bioenergy credits CCS Fuel combustion Industrial processes & solventsAgriculture, waste & others Total net excluding international aviation Business as usualEU Target (vs. 1990)
2010 2015 2020 2025 2030 2035 2040 2045 2050-50
0
50
100
150
200
250
Energy http://www.see2050carboncalculator.net/2050/see/Energy.php?code=2010101010101010101111111111111201020102020103010101010101010...
1 of 2 2.6.2016 23:03
FIgURE 15. Primary energy supply by source for coal-dependent pathway from 2010 to 2050.Final Energy Demand Greenhouse Gas Emissions
TWh/
yr
Conversion and distribution losses Industry Transport Lighting & appliancesHeating and cooling Agriculture and others Total final demand Business as usual
2010 2015 2020 2025 2030 2035 2040 2045 20500
100
200
300
400
500
600 ● Conversion and distribution losses2015 : 128.98
TWh/
yr
Primary Energy Supply
Environmental heat Biomass Electricity (RES) and net imports CoalOil and petroleum products Gas Total final supply Business as usual
2010 2015 2020 2025 2030 2035 2040 2045 20500
100
200
300
400
500
600
MtC
O2e
/yr
Bioenergy credits CCS Fuel combustion Industrial processes & solventsAgriculture, waste & others Total net excluding international aviation Business as usualEU Target (vs. 1990)
2010 2015 2020 2025 2030 2035 2040 2045 2050-50
0
50
100
150
200
250
Energy http://www.see2050carboncalculator.net/2050/see/Energy.php?code=2010101010101010101111111111111201020102020103010101010101010...
1 of 2 2.6.2016 23:03
FIgURE 16. Greenhouse gas emissions by source for coal-dependent pathway from 2010 to 2050.
Source: SEE 2050 Carbon Calculator (www.see2050carboncalculator.net)
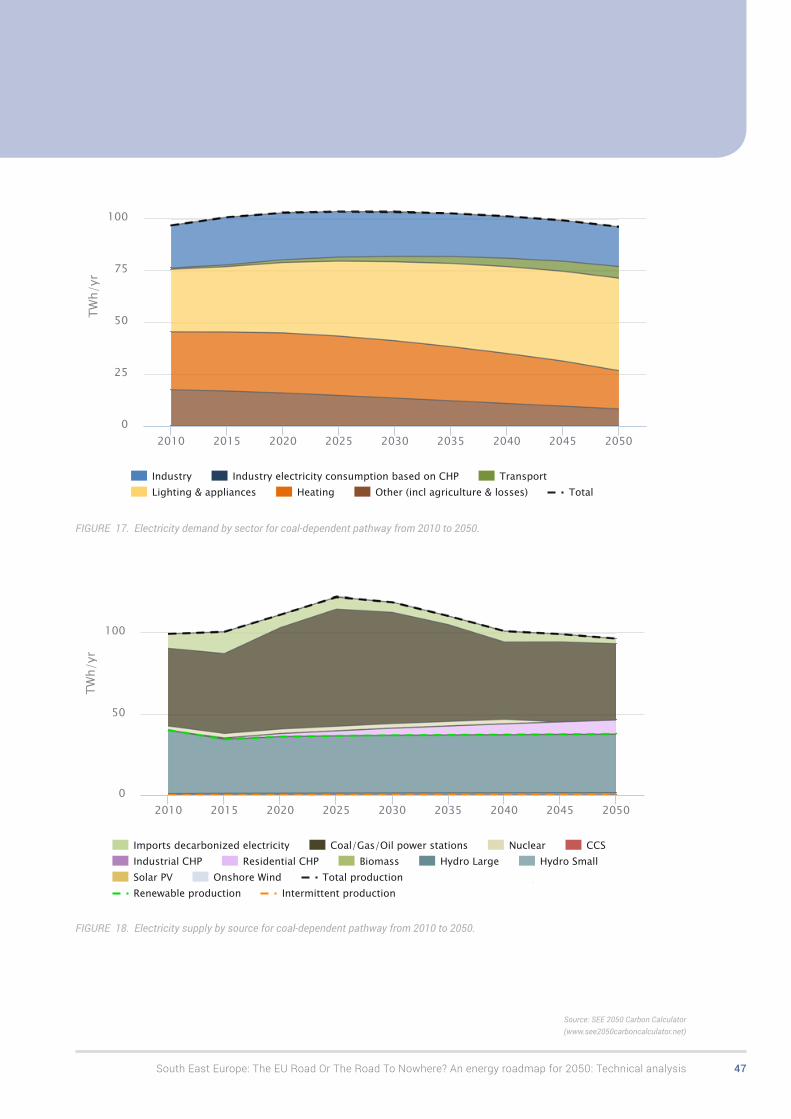
47South East Europe: The EU Road Or The Road To Nowhere? An energy roadmap for 2050: Technical analysis
Electricity Demand Electricity Supply Emissions from Electricity
TWh/
yr
Industry Industry electricity consumption based on CHP TransportLighting & appliances Heating Other (incl agriculture & losses) TotalBusiness as usual
2010 2015 2020 2025 2030 2035 2040 2045 20500
25
50
75
100
125
TWh/
yr
Imports decarbonized electricity Coal/Gas/Oil power stations Nuclear CCSIndustrial CHP Residential CHP Biomass Hydro Large Hydro SmallSolar PV Onshore Wind Total production Business as usual productionRenewable production Intermittent production
2010 2015 2020 2025 2030 2035 2040 2045 20500
50
100
150
MtC
O2e
/yr
Bioenergy credits CCS Fuel combustion Total Business as usual
2010 2015 2020 2025 2030 2035 2040 2045 2050-25
0
25
50
75
100
125
Electricity http://www.see2050carboncalculator.net/2050/see/Electricity.php?code=20101010101010101011111111111112010201020201030101010101010...
1 of 2 2.6.2016 23:10
FIgURE 17. Electricity demand by sector for coal-dependent pathway from 2010 to 2050.Electricity Demand Electricity Supply Emissions from Electricity
TWh/
yr
Industry Industry electricity consumption based on CHP TransportLighting & appliances Heating Other (incl agriculture & losses) TotalBusiness as usual
2010 2015 2020 2025 2030 2035 2040 2045 20500
25
50
75
100
125
TWh/
yr
Imports decarbonized electricity Coal/Gas/Oil power stations Nuclear CCSIndustrial CHP Residential CHP Biomass Hydro Large Hydro SmallSolar PV Onshore Wind Total production Business as usual productionRenewable production Intermittent production
2010 2015 2020 2025 2030 2035 2040 2045 20500
50
100
150
MtC
O2e
/yr
Bioenergy credits CCS Fuel combustion Total Business as usual
2010 2015 2020 2025 2030 2035 2040 2045 2050-25
0
25
50
75
100
125
Electricity http://www.see2050carboncalculator.net/2050/see/Electricity.php?code=20101010101010101011111111111112010201020201030101010101010...
1 of 2 2.6.2016 23:10
FIgURE 18. Electricity supply by source for coal-dependent pathway from 2010 to 2050.
Source: SEE 2050 Carbon Calculator (www.see2050carboncalculator.net)

48 South East Europe: The EU Road Or The Road To Nowhere? An energy roadmap for 2050: Technical analysis
Electricity Demand Electricity Supply Emissions from Electricity
TWh/
yr
Industry Industry electricity consumption based on CHP TransportLighting & appliances Heating Other (incl agriculture & losses) TotalBusiness as usual
2010 2015 2020 2025 2030 2035 2040 2045 20500
25
50
75
100
125
TWh/
yr
Imports decarbonized electricity Coal/Gas/Oil power stations Nuclear CCSIndustrial CHP Residential CHP Biomass Hydro Large Hydro SmallSolar PV Onshore Wind Total production Business as usual productionRenewable production Intermittent production
2010 2015 2020 2025 2030 2035 2040 2045 20500
50
100
150
MtC
O2e
/yr
Bioenergy credits CCS Fuel combustion Total Business as usual
2010 2015 2020 2025 2030 2035 2040 2045 2050-25
0
25
50
75
100
125
Electricity http://www.see2050carboncalculator.net/2050/see/Electricity.php?code=20101010101010101011111111111112010201020201030101010101010...
1 of 2 2.6.2016 23:10
FIgURE 19. Emissions from electricity for coal-dependent pathway from 2010 to 2050.
Final Energy Demand Greenhouse Gas Emissions
TWh/
yr
Conversion and distribution losses Industry Transport Lighting & appliancesHeating and cooling Agriculture and others Total final demand Business as usual
2010 2015 2020 2025 2030 2035 2040 2045 20500
100
200
300
400
500 ● Conversion and distribution losses2030 : 75.4
TWh/
yr
Primary Energy Supply
Environmental heat Biomass Electricity (RES) and net imports CoalOil and petroleum products Gas Total final supply Business as usual
2010 2015 2020 2025 2030 2035 2040 2045 20500
100
200
300
400
500
MtC
O2e
/yr
Bioenergy credits CCS Fuel combustion Industrial processes & solventsAgriculture, waste & others Total net excluding international aviation Business as usualEU Target (vs. 1990)
2010 2015 2020 2025 2030 2035 2040 2045 2050-50
0
50
100
150
200
Energy http://www.see2050carboncalculator.net/2050/see/Energy.php?code=203030303030303030333333333333320302030203010303020102030303...
1 of 2 2.6.2016 23:36
FIgURE 20. Final energy demand by sector for EU Road pathway from 2010 to 2050.
Source: SEE 2050 Carbon Calculator (www.see2050carboncalculator.net)

49South East Europe: The EU Road Or The Road To Nowhere? An energy roadmap for 2050: Technical analysis
Final Energy Demand Greenhouse Gas Emissions
TWh/
yr
Conversion and distribution losses Industry Transport Lighting & appliancesHeating and cooling Agriculture and others Total final demand Business as usual
2010 2015 2020 2025 2030 2035 2040 2045 20500
100
200
300
400
500 ● Conversion and distribution losses2030 : 75.4
TWh/
yr
Primary Energy Supply
Environmental heat Biomass Electricity (RES) and net imports CoalOil and petroleum products Gas Total final supply Business as usual
2010 2015 2020 2025 2030 2035 2040 2045 20500
100
200
300
400
500
MtC
O2e
/yr
Bioenergy credits CCS Fuel combustion Industrial processes & solventsAgriculture, waste & others Total net excluding international aviation Business as usualEU Target (vs. 1990)
2010 2015 2020 2025 2030 2035 2040 2045 2050-50
0
50
100
150
200
Energy http://www.see2050carboncalculator.net/2050/see/Energy.php?code=203030303030303030333333333333320302030203010303020102030303...
1 of 2 2.6.2016 23:36
FIgURE 21. Primary energy supply by source for EU Road pathway from 2010 to 2050.Final Energy Demand Greenhouse Gas Emissions
TWh/
yr
Conversion and distribution losses Industry Transport Lighting & appliancesHeating and cooling Agriculture and others Total final demand Business as usual
2010 2015 2020 2025 2030 2035 2040 2045 20500
100
200
300
400
500 ● Conversion and distribution losses2030 : 75.4
TWh/
yr
Primary Energy Supply
Environmental heat Biomass Electricity (RES) and net imports CoalOil and petroleum products Gas Total final supply Business as usual
2010 2015 2020 2025 2030 2035 2040 2045 20500
100
200
300
400
500
MtC
O2e
/yr
Bioenergy credits CCS Fuel combustion Industrial processes & solventsAgriculture, waste & others Total net excluding international aviation Business as usualEU Target (vs. 1990)
2010 2015 2020 2025 2030 2035 2040 2045 2050-50
0
50
100
150
200
Energy http://www.see2050carboncalculator.net/2050/see/Energy.php?code=203030303030303030333333333333320302030203010303020102030303...
1 of 2 2.6.2016 23:36
FIgURE 22. Greenhouse gas emissions by source for EU Road pathway from 2010 to 2050.
Source: SEE 2050 Carbon Calculator (www.see2050carboncalculator.net)

50 South East Europe: The EU Road Or The Road To Nowhere? An energy roadmap for 2050: Technical analysis
Electricity Demand Electricity Supply Emissions from Electricity
TWh/
yr
Industry Industry electricity consumption based on CHP TransportLighting & appliances Heating Other (incl agriculture & losses) TotalBusiness as usual
2010 2015 2020 2025 2030 2035 2040 2045 20500
25
50
75
100
125
TWh/
yr
Imports decarbonized electricity Coal/Gas/Oil power stations Nuclear CCSIndustrial CHP Residential CHP Biomass Hydro Large Hydro SmallSolar PV Onshore Wind Total production Business as usual productionRenewable production Intermittent production
2010 2015 2020 2025 2030 2035 2040 2045 20500
50
100
150
MtC
O2e
/yr
Bioenergy credits CCS Fuel combustion Total Business as usual
2010 2015 2020 2025 2030 2035 2040 2045 2050-25
0
25
50
75
100
Electricity http://www.see2050carboncalculator.net/2050/see/Electricity.php?code=2030303030303030303333333333333203020302030103030201020303...
1 of 2 2.6.2016 23:38
FIgURE 23. Electricity demand by sector for EU Road pathway from 2010 to 2050.Electricity Demand Electricity Supply Emissions from Electricity
TWh/
yr
Industry Industry electricity consumption based on CHP TransportLighting & appliances Heating Other (incl agriculture & losses) TotalBusiness as usual
2010 2015 2020 2025 2030 2035 2040 2045 20500
25
50
75
100
125
TWh/
yr
Imports decarbonized electricity Coal/Gas/Oil power stations Nuclear CCSIndustrial CHP Residential CHP Biomass Hydro Large Hydro SmallSolar PV Onshore Wind Total production Business as usual productionRenewable production Intermittent production
2010 2015 2020 2025 2030 2035 2040 2045 20500
50
100
150
MtC
O2e
/yr
Bioenergy credits CCS Fuel combustion Total Business as usual
2010 2015 2020 2025 2030 2035 2040 2045 2050-25
0
25
50
75
100
Electricity http://www.see2050carboncalculator.net/2050/see/Electricity.php?code=2030303030303030303333333333333203020302030103030201020303...
1 of 2 2.6.2016 23:38
FIgURE 24. Electricity supply by source for EU Road pathway from 2010 to 2050.
Source: SEE 2050 Carbon Calculator (www.see2050carboncalculator.net)

51South East Europe: The EU Road Or The Road To Nowhere? An energy roadmap for 2050: Technical analysis
Electricity Demand Electricity Supply Emissions from Electricity
TWh/
yr
Industry Industry electricity consumption based on CHP TransportLighting & appliances Heating Other (incl agriculture & losses) TotalBusiness as usual
2010 2015 2020 2025 2030 2035 2040 2045 20500
25
50
75
100
125
TWh/
yr
Imports decarbonized electricity Coal/Gas/Oil power stations Nuclear CCSIndustrial CHP Residential CHP Biomass Hydro Large Hydro SmallSolar PV Onshore Wind Total production Business as usual productionRenewable production Intermittent production
2010 2015 2020 2025 2030 2035 2040 2045 20500
50
100
150
MtC
O2e
/yr
Bioenergy credits CCS Fuel combustion Total Business as usual
2010 2015 2020 2025 2030 2035 2040 2045 2050-25
0
25
50
75
100
Electricity http://www.see2050carboncalculator.net/2050/see/Electricity.php?code=2030303030303030303333333333333203020302030103030201020303...
1 of 2 2.6.2016 23:38
FIgURE 25. Emissions from electricity for EU Road pathway from 2010 to 2050.
FIgURE 26. Billions of EUR/yr
EnergyIndustryTransportBuildings
The EU road
The road to nowhere
0 2.5 5 7.5 10 12.5 15 17.5 20 22.5 25 27.5 30 32.5 35 37.5 40 42.5 45 47.5 50 52.5
Energy system costs by sector for the EU Road and coal-dependent pathway from 2010 to 2050.
Figure 26 depicts the costs necessary to follow the EU Road compared to the Road to Nowhere. We find
directly competitive costs with the coal-dependent path. The EU Road is approximately 49.9 billion EUR/year
on average over a 35 year period or approximately 2300 EUR/person/year. This compares to the coal-depen-
dent “Road to Nowhere” scenario that costs approximately 51.4 billion EUR/year on average or 2380 EUR/
person/year. Cost estimates are expressed as undiscounted real Billion EUR/year between 2010–2050 for
energy system costs including capital expenditures, operating expenditures, and fuel costs. This is not a view
of the energy bill or societal costs and it is not a full cost-benefit analysis. Externalities such as avoided envi-
ronmental impacts are not included. We do note that there is a stark reduction in greenhouse gas emissions
in the EU Road. For instance, the coal-dependent pathway reduces GHG emissions to 75% of 1990 levels,
representing a 25% reduction. However, the EU Road meets the EU goal of 80% reduction in GHG emissions
from 1990 levels. It remains clear that the EU Road could be directly competitive or about 1.5 billion EUR less
per year compared to the Road to Nowhere in infrastructural capital, operating, maintenance, and fuel costs.
This is before considering public health or the environment. Also, primary energy supply and demand are eas-
ily met in both scenarios without compromising safety or security in system functioning.
0 2.5 5 7.5 10 12.5 15 17.5 20 22.5 25 27.5 30 32.5 35 37.5 40 42.5 45 47.5 50 52.5
Bilions of EUR/yr
Source: SEE 2050 Carbon Calculator (www.see2050carboncalculator.net)

52 South East Europe: The EU Road Or The Road To Nowhere? An energy roadmap for 2050: Technical analysis
DISCUSSIONThe pathways presented across the region can be contextualized within global and European trends highlighting
the declining cost of renewable energy, the ability for energy efficiency and renewable measures to bring jobs to
scale at a rapid pace, and the feasibility of integration by using new network architectures that can make South
East Europe become leaders, not laggards in the production of energy and deployment of technological infra-
structure. Policies and global-scale technological innovation will pave the way forward across the EU Road and
coal-dependent pathways. However, the choice will remain which levers for change to prioritize, including feed-in
tariff policies, technological flexibility and improvement through the introduction of new resources.
The main finding from the different pathways within the South East Europe energy sector is that renewables can
compete directly with fossil fuel based options for electricity and energy supply on a pure cost basis before consider-
ing environmental or health externalities through the EU Road. This is true across a number of cases, notably Serbia,
Kosovo, Montenegro, Bosnia and Herzegovina, Macedonia, Croatia, and Albania where the Road to Nowhere leads to
increased coal production along with political, health, and environmental problems. Furthermore, renewable energy
expands the diversity of electricity supply and removes previous constraints on fossil fuel reserves in the region. The
future adoption of more advanced digital technologies including the transition to a smart grid would greatly facilitate
the adoption of wind and solar by grid operators within the region. A coordinated regional transmission network
and market integration could also provide the necessary interconnections to improve transmission system wide
efficiency and lower levelized cost of renewable electricity. The environmental and health costs of the options are
not considered in this study, though should not be ignored, as lignite coal constitutes a majority of coal consumed
within South East Europe and has negative health effects on air quality, including the presence of mercury and sulfur
in particulate emissions, and presents challenges for fly ash removal. The renewable options presented here would
facilitate necessary grid upgrades that require investment regardless, as much of the infrastructure in South East
Europe dates beyond 1970 for electric generation, transmission, and distribution. Distributed PV could even defer
certain upgrades to voltage regulators, load tap changers, and capacitor banks by providing voltage support and
some frequency regulation on the grid in combination with energy storage. The cost of complying with EU climate
and energy targets is comparable to the Road to Nowhere, but the stakes remain high. The EU Road provides the
opportunity for EU accession, tackling energy poverty through lowered service costs, decreased levels of hazardous
air pollution, increased comfort through household heating and increased electric services, including critical political
and economic stability. This would improve overall energy system reliability and resiliency at a comparable cost to
new centralized coal and large hydropower plants.
This analysis highlights the multiple pathways that remain feasible and range of options that could provide more reliable
and resilient energy in both the supply and demand sectors compared to the Road to Nowhere case. The implications of
the findings will impact plans for EU accession and form a regionally-collaborative integrated energy market that will le-
verages excess supply and demand volumes. This expands the load balancing area within the region and lowers total
electric grid system costs. Secondly, it shows that dealing with emissions from the energy sector will not accrue much
cost, especially when considering the cost of business-as-usual investments. Therefore, South East Europe could be-
come a future trendsetting region when joining the EU and could provide an influx of jobs and economic growth in a re-
gion facing dismal employment prospects and current stagnancy in the economy and society. The EU Road is around
€53 billion less costly than the coal-dependent case over the course of 35 years. This is a roughly equivalent compar-
ison in annual costs and it furthermore provides necessary social and environmental safeguards and protection. The
EU Road clearly provides a path toward accession and meeting the EU GHG emission targets of an 80% reduction of
1990 levels by 2050, which enables South East Europe to become a climate leader, not laggard across the world.

53South East Europe: The EU Road Or The Road To Nowhere? An energy roadmap for 2050: Technical analysis
CONCLUSIONThe options detailed here evaluate the emissions, energy supply and demand, electricity generation, and cost
of implementation for South East Europe as a region across the main pathways. The development of clean
energy infrastructure therefore is a political choice, not a technical obstacle. This remains clear throughout the
EU Road path. Decarbonizing energy and addressing global climate change in South East Europe would bring
the region global attention as a leader and primary example for other economies in transition. The outdated
infrastructure and the need to invest regionally may actually provide opportunities for the individual countries
to leapfrog the coal-rich past and establish stronger economies based on renewable energy including solar
and wind electricity. The regional approach allows for greater storage opportunities and market efficiency
that would enable a resilient network. South East Europe has the chance to highlight one example of a region
where distributed energy resources could replace large-scale centralized projects at a comparable cost.
First, we find a large potential energy cost savings by moving toward renewables in the electricity supply and
similar total system costs in the EU Road scenario compared to the coal-based path. Second, we find that
energy efficiency or demand-side management measures offer significant opportunities for reducing unneces-
sary energy demand in the region given the vast resource lost through transmission and distribution systems.
Third, by following this path, South East Europe could become energy leaders as individual states accede to
the EU, rather than laggards, putting them at a climate advantage rather than disadvantage following the 2015
Paris Agreement. Lastly, these benefits all accrue before considering the external costs of air pollution or pub-
lic health of developing future coal-investments in the electricity and industrial sectors. The coal-dependent
path is a road to nowhere, and the EU Road presents a feasible opportunity to enable a cleaner, fairer, and
more efficient power system through emphasized regional coordination and technological innovation within
South East Europe by 2050.
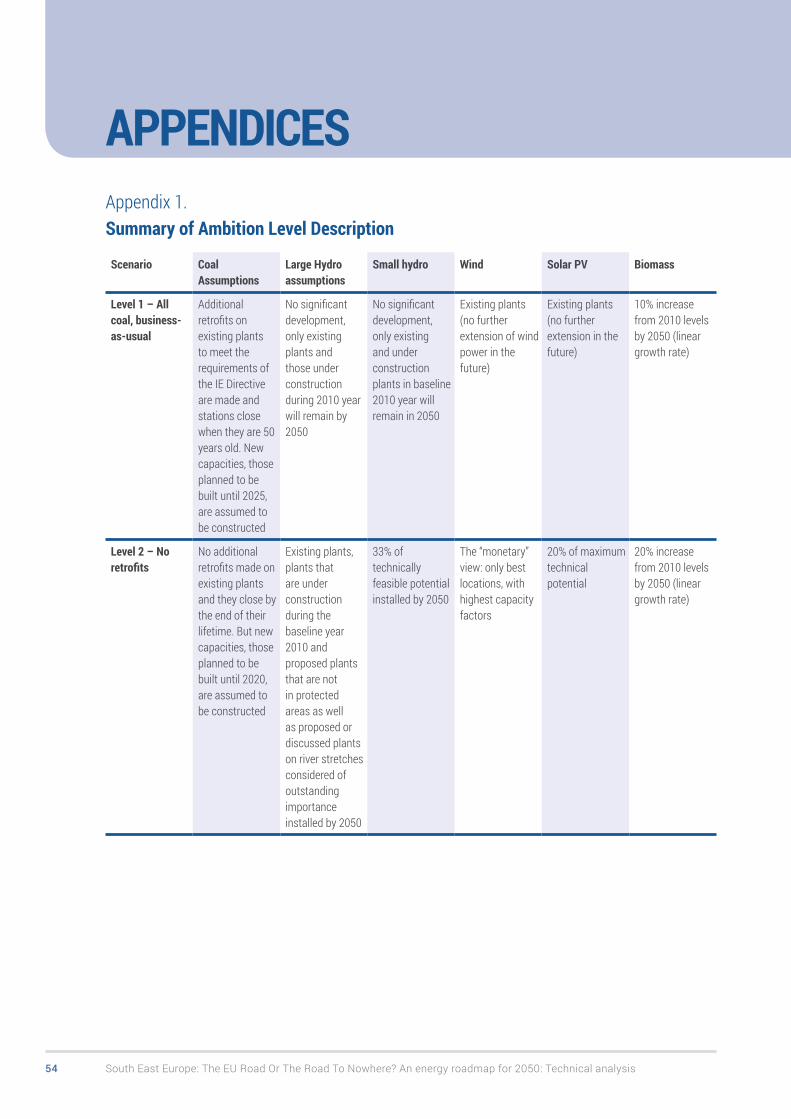
54 South East Europe: The EU Road Or The Road To Nowhere? An energy roadmap for 2050: Technical analysis
APPENDICESAppendix 1. Summary of Ambition Level Description
Scenario Coal Assumptions
Large Hydro assumptions
Small hydro Wind Solar PV Biomass
Level 1 – All coal, business-as-usual
Additional retrofits on existing plants to meet the requirements of the IE Directive are made and stations close when they are 50 years old. New capacities, those planned to be built until 2025, are assumed to be constructed
No significant development, only existing plants and those under construction during 2010 year will remain by 2050
No significant development, only existing and under construction plants in baseline 2010 year will remain in 2050
Existing plants (no further extension of wind power in the future)
Existing plants (no further extension in the future)
10% increase from 2010 levels by 2050 (linear growth rate)
Level 2 – No retrofits
No additional retrofits made on existing plants and they close by the end of their lifetime. But new capacities, those planned to be built until 2020, are assumed to be constructed
Existing plants, plants that are under construction during the baseline year 2010 and proposed plants that are not in protected areas as well as proposed or discussed plants on river stretches considered of outstanding importance installed by 2050
33% of technically feasible potential installed by 2050
The “monetary” view: only best locations, with highest capacity factors
20% of maximum technical potential
20% increase from 2010 levels by 2050 (linear growth rate)

55South East Europe: The EU Road Or The Road To Nowhere? An energy roadmap for 2050: Technical analysis
Scenario Coal Assumptions
Large Hydro assumptions
Small hydro Wind Solar PV Biomass
Level 3 – Stations close at 50 years of life
Additional retrofits on existing plants to meet the requirements of the IE Directive are made and stations close when they are 50 years old. No new plants built by 2050.
Existing plants, plants that are under construction during the baseline year 2010 and proposed or discussed plants that are not in protected areas installed by 2050
66% of technically feasible potential installed by 2050
The “save the climate” view: best locations and a few other locations that are less financially viable
50% of maximum technical potential
25% increase from 2010 levels by 2050 (linear growth rate)
Level 4 – Stations close at 40 years of life
Additional retrofits on existing plants to meet the requirements of the IE Directive are made and stations close when they are 40 years old. No new plants built by 2050.
Technical potential that can really be implemented installed by 2050
100% of technically feasible potential installed by 2050
100% of technically feasible potential installed by 2050 Productive areas exclude areas where topographic altitude is above 1800 m, areas where slope of topography is >20%, wooded areas, inhabited areas with a 900m buffer
70% of technical feasible potential
30% increase from 2010 levels by 2050 (linear growth rate)

56 South East Europe: The EU Road Or The Road To Nowhere? An energy roadmap for 2050: Technical analysis
Appendix 2.Sovereign credit ratings for selected EU and SEE countries
Country Sovereign Credit rating Corporate spread from AAA
Germany AAA —
UK AAA–AA+ 0.5–1.0%
Slovakia A–A2 1.5%
Croatia BB 4.0%
Bulgaria BB+ 4.0%
Bosnia & Herzegovina B–B3 4.0–8.0%
TABLE 5. Sovereign credit ratings for selected EU and SEE countries.

57South East Europe: The EU Road Or The Road To Nowhere? An energy roadmap for 2050: Technical analysis
Appendix 3. Costs for EU Road and “Road to Nowhere” scenarios
EU Road Cost (bn EUR/yr)
2015 2020 2025 2030 2035 2040 2045 2050AVERAGE bn EUR/yr
Buildings 12,309 14,440 15,948 16,472 16,791 17,376 17,744 18,428 16,189
Transport 19,591 24,152 26,225 28,240 29,077 29,402 29,052 26,235 26,497
Industry 0,024 0,065 0,108 0,151 0,185 0,208 0,251 0,285 0,160
Energy 8,219 8,319 7,525 6,670 7,603 7,603 6,153 4,137 7,029
TOTAL 40,143 46,976 49,806 51,533 53,656 54,589 53,200 49,085 49,874
Population (milions)
22,48 22,38 22,15 21,92 21,62 21,33 20,98 20,63
EUR/person/year 1785,7 2099,0 2248,6 2351,0 2481,8 2559,3 2535,7 2379,3 2305,045
TABLE 6. Costs for EU Road scenario.
Road to Nowhere Cost (bn EUR/yr)
2015 2020 2025 2030 2035 2040 2045 2050AVERAGE bn EUR/yr
Buildings 10,182 11,115 11,375 11,778 11,956 12,364 12,540 13,086 11,800
Transport 22,152 25,219 27,663 30,105 32,047 33,753 35,059 35,523 30,190
Industry 0,013 0,014 0,026 0,059 0,071 0,073 0,096 0,118 0,059
Energy 8,062 9,337 8,411 8,458 9,577 10,417 10,158 10,332 9,344
TOTAL 40,409 45,685 47,475 50,400 53,651 56,607 57,853 59,059 51,392
Population (milions)
22,48 22,38 22,15 21,92 21,62 21,33 20,98 20,63
EUR/person/year 1797,6 2041,3 2143,3 2299,3 2481,5 2653,9 2757,5 2862,8 2379,652
TABLE 7. Costs for coal-based “Road to Nowhere” scenario.

58 South East Europe: The EU Road Or The Road To Nowhere? An energy roadmap for 2050: Technical analysis
List of References1. Ameli, N., Kammen, D.M. 2014. Innovations in financing
that drive cost parity for long-term electricity sustainability: An assessment of Italy, Europe’s fastest growing solar PV market. Energy for Sustainable Development, 19, 130-137.
2. BUILD UP (2015). The European Portal for Energy Efficiency in Buildings. European Union.
3. Caldecott, B., Dericks, G., & Mitchell, J. (2015). Stranded Assets and Subcritical Coal. Stranded Assets Programme, SSEE, University of Oxford.
4. Caldecott, B., Kruitwagen, L., Dericks, G., Tulloch, D. J., Kok, I., & Mitchell, J. (2016). Stranded Assets and Thermal Coal: An analysis of environment-related risk exposure. Stranded Assets Programme, SSEE, University of Oxford.
5. CAISO (2013). What the Duck Curve Tells us about Managing a Green Grid. https://www.caiso.com/Documents/FlexibleResourcesHelpRenewables_FastFacts.pdf
6. CAISO (2015). Daily Renewables Watch 22 July 2015. http://content.caiso.com/green/renewrpt/20150722_DailyRenewablesWatch.pdf (Last Accessed 6 June 2016).
7. CCST (2011). Long, CSJ, John, M., Greenblatt, J., Wei, M., Yang, C., Richter, B., Hannegan, B., Youngs, H. California’s Energy Future – The View to 2050 – Summary Report. California Council on Science and Technology. May 2011. http://www.ccst.us/publications/2011/2011energy.pdf
8. CEE Bankwatch (2015). Risks for coal and electricity investments in the Western Balkans, Ukraine and Moldova due to state-aid rules. http://bankwatch.org/publications/risks-coal-and-electricity-investments-western-balkans-ukraine-and-moldova-due-state-ai (accessed 30 May 2016).
9. Climact (2015). Belgian 2050 Pathways Calculator. http://climactv2.voxteneo.net/pathways/2011110111110011111011011110112121212121214141212101311111001101110f1011111101001/emissions
10. Dominković, D. F., Bačeković, I., Ćosić, B., Krajačić, G., Pukšec, T., Duić, N., & Markovska, N. (2016). Zero carbon energy system of South East Europe in 2050. Applied Energy.
11. Energy Community Annual Implementation Report (2015). Energy Community. www.energy-community.org/portal/page/portal/ENC_HOME/DOCS/3872267/23B450386A075E64E053C92FA8C0F69F.PDF
12. Energy Community Secretariat (2014). Annual Implementation Report. Energy Community Secretariat. https://www.energy-community.org/pls/portal/docs/3356393.PDF
13. Energy Community. 2015. Tapping On its Energy Efficiency Potential Energy Community Secretariat. https://www.energy-community.org/portal/page/portal/ENC_HOME/DOCS/3750146/18B2AB6BA84663F2E053C92FA8C064DA.PDF
14. Energy Efficiency Action Plans. (2015). Energy Community. Available online at: https://www.energy-community.org/portal/page/portal/ENC_HOME/AREAS_OF_WORK/Instruments/Energy_Efficiency/EEAPs
15. EPBD (2010). European Performance Building Directive. https://ec.europa.eu/energy/en/topics/energy-efficiency/buildings (Last Accessed 26 May 2016).
16. ERO (2014). Energy Regulatory Office. 2014 Tariff Rates for Kosovo. ERO Code: V_638_2014, 2014. http://ero-ks.org/Vendimet/English/2014/V_638_2014_final_eng.pdf.
17. European Commission (2011). Roadmap to a Single European Transport Area – Towards a more competitive and resource efficient transport system.
18. European Commission (2016). 2030 Climate & Energy Framework. European Commission. http://ec.europa.eu/clima/policies/strategies/2030/index_en.htm (Last Accessed 26 May 2016).
19. European Commission (2016). European Neighbourhood Policy and Enlargement Negotiations.
20. European Commission (2016). European Neighbourhood Policy and Enlargement Negotiations – Conditions for membership. http://ec.europa.eu/enlargement/policy/conditions-membership/index_en.htm (Last Accessed 26 May 2016).
21. European Commission (2016). Renewable Energy Directive – Biofuels. http://ec.europa.eu/energy/en/topics/renewable-energy/biofuels (Last Accessed 26 May 2016).
22. European Commission (2016). Training for Renovated Energy Efficient Social Housing (TREES). European Commission. https://ec.europa.eu/energy/intelligent/projects/en/projects/trees
23. For further information on the flooding, the following reports detail the damages from the Sikulje and Kostolac mines flooding: http://tuzlalive.ba/aktuelna-tema-zasto-je-potopljen-rudnik-sikulje/ (in Bosnian), http://www.balkanmagazin.net/struja/cid189-100744/izgradnja-bloka-b3-u-k… (in Serbian)
24. Gallop, P. (2013). Invest in haste, repent at leisure: Are IFIs behaving as if EU accession criteria and extreme energy losses do not exist in South East Europe. CEE Bankwatch. http://bankwatch.org/sites/default/files/SEE-IFI-energy.pdf (Last Accessed 26 May 2016).
25. Gil, H. A., & Joos, G. (2006). On the quantification of the network capacity deferral value of distributed generation. Power Systems, IEEE Transactions on, 21(4), 1592-1599.
26. HEAL (2016). The health impacts of coal-fired power stations in the Western Balkans. HEAL. http://env-health.org/IMG/pdf/technical_report_balkans_coal_en_lr.pdf (Last Accessed 26 May 2016).
27. HERA (2014). 2014 Annual Report. HERA. https://www.hera.hr/hr/docs/HERA_izvjesce_2014.pdf p.35-36
28. http://ec.europa.eu/enlargement/countries/check-current-status/index_en.htm (Last Accessed 26 May 2016).
29. http://ec.europa.eu/transport/themes/strategies/2011_white_paper_en.htm (Accessed 30 May 2016).

59South East Europe: The EU Road Or The Road To Nowhere? An energy roadmap for 2050: Technical analysis
30. http://tool.globalcalculator.org/globcalc.html?levers=22rfoe2e13be1111c2c2c1n31hfjdcef222hp233f211111fn2211111111/dashboard/en (Last Accessed 26 May 2016.)
31. http://www.buildup.eu/en/practices/cases/multi-family-apartment-building-sparna-hiza-koprvnica-croatia (Last Accessed 30 May 2016).
32. Huld T., Müller R., Gambardella A., 2012. A new solar radiation database for estimating PV performance in Europe and Africa. Solar Energy, 86, 1803-1815.
33. IEA (2015). IEA 2DS Scenario. Energy Technology Perspectives 2015. International Energy Agency.
34. IEA (2016). Global EV Outlook 2016: Beyond one million electric cars. http://www.iea.org/publications/freepublications/publication/Global_EV_Outlook_2016.pdf
35. IMF (2016). IMF Data Mapper. http://www.imf.org/external/datamapper/index.php (Accessed 30 May 2016).
36. Johansson, P. (2014). The evolotuion of the Swedish heat pump industry – an efficient use of development resources? Cleantech Funding. http://cleantechfunding.org/2014/03/26/the-evolution-of-the-swedish-heat-pump-industry-an-efficient-use-of-development-resources/
37. Kammen, D.M., Kittner, N. (2015) Energy in the Balkans. Economist, 411, 8951, 10 September 2015.
38. KfW (2016). Wind Atlas Balkan. http://balkan.wind-index.com
39. Lantz, E., Wiser, R., & Hand, M. (2012). The past and future cost of wind energy. National Renewable Energy Laboratory, Golden, CO, Report No. NREL/TP-6A20-53510.a. Last Accessed 26 May 2016.
40. Meijer, F., Visscher, H., Nieboer, N., & Kroese, R. (2012) Jobs creation through energy renovation of the housing stock. http://www.iza.org/conference_files/neujobs_2014/4.pdf (Accessed 30 May 2016).
41. PRIMES GDP projections. Courtesy of BETTER project. http://www.better-project.net/ (Last Accessed 30 May).
42. Sanner, B., Karytsas, C., Mendrinos, D., & Rybach, L. (2003). Current status of ground source heat pumps and underground thermal energy storage in Europe. Geothermics, 32(4), 579-588.
43. Schaps, K., Eckert, V. 9 January 2014. “Europe’s storms send power prices plummeting to negative.” Reuters. http://www.reuters.com/article/us-europe-power-prices-idUSBREA080S120140109
44. Second National Report on Social inclusion and Poverty Reduction in the Republic of Serbia. 2014. http://socijalnoukljucivanje.gov.rs/wp-content/uploads/2014/11/Second-National-Report-on-Social-Inclusion-and-Poverty-Reduction-final.pdf (Last Accessed 26 May 2016).
45. SEE Change Net (2015). 2050 Energy Model for South East Europe. http://seechangenetwork.org/2050-energy-model-for-south-east-europe/ (Last Accessed 26 May 2016).
46. SEE Change Net (2015). South East Europe 2050 Energy Model – Conclusions on the Call for Evidence Process. http://seechangenetwork.org/south-east-europe-2050-energy model-conclusions-on-the-call-for-evidence-process/
47. SEE Change Net (2015). South East Europe 2050 Energy Model Call for Evidence Report. SEE Change Net. http://seechangenetwork.org/wp-content/uploads/2015/07/South-East Europe-2050-Energy-Model-Call-for-Evidence-Report.pdf (Last Accessed 26 May 2016).
48. Smith School of Enterprise and the Environment (2016). Stranded Assets Research Network List of publications http://www.smithschool.ox.ac.uk/research-programmes/stranded-assets/publications.php (Last Accessed 26 May 2016).
49. South East Europe 2050 Carbon Calculator (2015). http://www.see2050carboncalculator.net
50. Šúri M., Huld T.A., Dunlop E.D. Ossenbrink H.A., 2007. Potential of solar electricity generation in the European Union member states and candidate countries. Solar Energy, 81, 1295–1305, http://re.jrc.ec.europa.eu/pvgis/.
51. Tesla Motors (2016). Tesla Power Wall. www.teslamotors.com (Last Accessed 30 May 2016).
52. Top Ten Europe (2016). Best performing appliances of Europe. http://www.topten.eu (Last Accessed 26 May 2016).
53. TREES (2005). Training for Energy Efficient Social Housing. MINES Paris Tech. http://direns.mines-paristech.fr/Sites/TREES/Material/TREES_3.2_Dunaujvaros_text_261007.pdf (Accessed 30 May 2016).
54. UK DECC (2016). The Global Calculator. Version 23.
55. UK DECC. 2050 Carbon Calculator. http://2050-calculator-tool.decc.gov.uk/ (Last Accessed 26 May 2016).
56. UN (2016). List of parties that signed the Paris Agreement on 22 April. United Nations. http://www.un.org/sustainabledevelopment/blog/2016/04/parisagreementsingatures/ (Last Accessed 26 May 2016).
57. UNFCCC (2015). Paris Climate Change Conference – November 2015. http://unfccc.int/meetings/paris_nov_2015/meeting/8926.php
58. Von Meier, 2006, Electric Power Systems: A Conceptual Introduction (Wiley-IEEE, New York)
59. Wei, M., Patadia, S., & Kammen, D. M. (2010). Putting renewables and energy efficiency to work: How many jobs can the clean energy industry generate in the US?. Energy Policy, 38(2), 919-931.
60. World Bank Group (2016). Global Economic Prospects, January 2016: Spillovers Amid Weak Growth. Washington, DC: World Bank. Washington, DC: World Bank. doi:10.1596/978-1 4648-0675-9. License: Creative Commons Attribution CC BY 3.0 IGO
61. Zheng, C., & Kammen, D. M. (2014). An innovation-focused roadmap for a sustainable global photovoltaic industry. Energy Policy, 67, 159-169.

CEKOR
PARTNERS SUPPORTERS
ractal raktalF F
SEE 2050 CARBON CALCULATOR
SEE 2050 ENERGY MODEL