Embed Size (px)
Citation preview
425
10011 0010 1010 1101 0001 0100 1011South Kitsap
State Assessment Results
425
10011 0010 1010 1101 0001 0100 1011
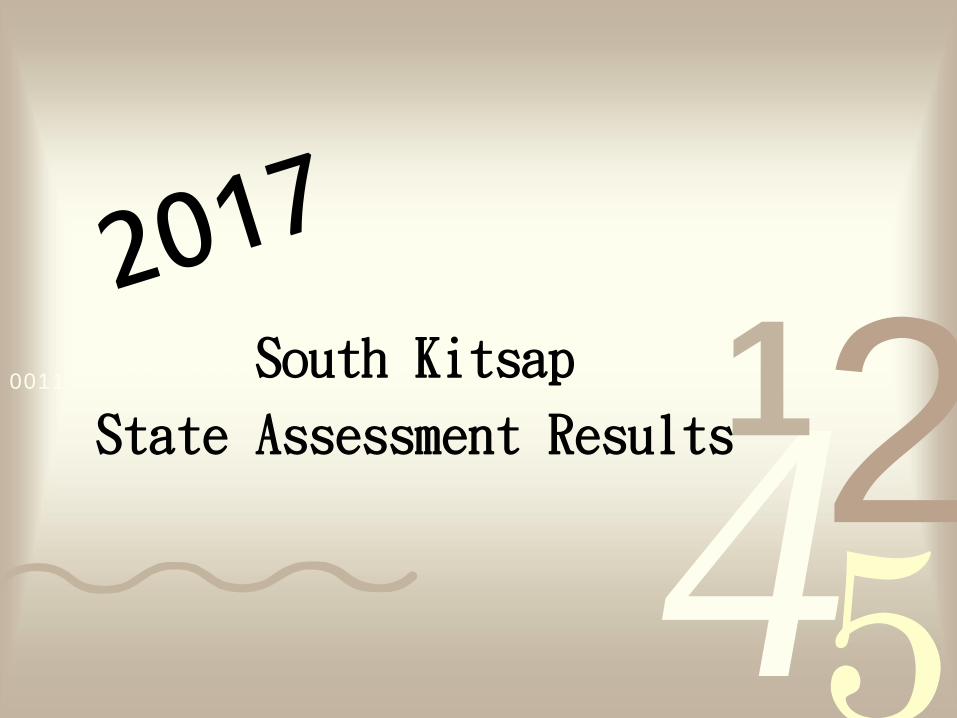
2017 SBAC Results Elementary ELA
State Average District Average%Proficient % in each achievement level %Proficient % in each achievement level
3rd
4th
5th
6th
425
10011 0010 1010 1101 0001 0100 1011
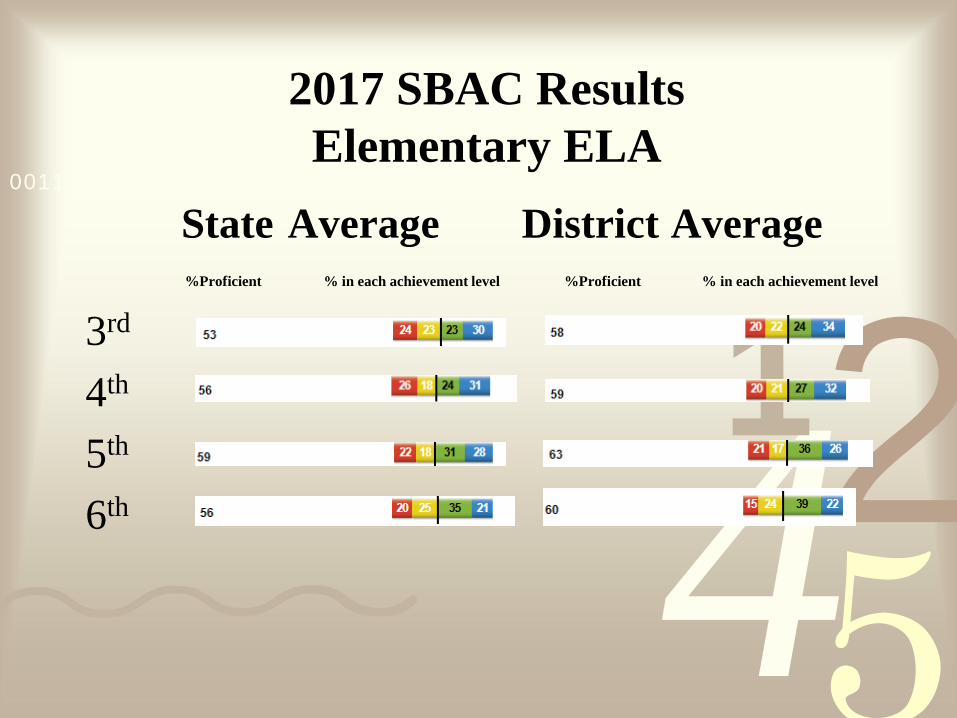
2017 Smarter Balanced Results Secondary ELA
State Average District Average%Proficient % in each achievement level %Proficient % in each achievement level
7th
8th
10th
11th
Data includes: CH, JS, MW, SKHS, Discovery & Explorer
425
10011 0010 1010 1101 0001 0100 1011
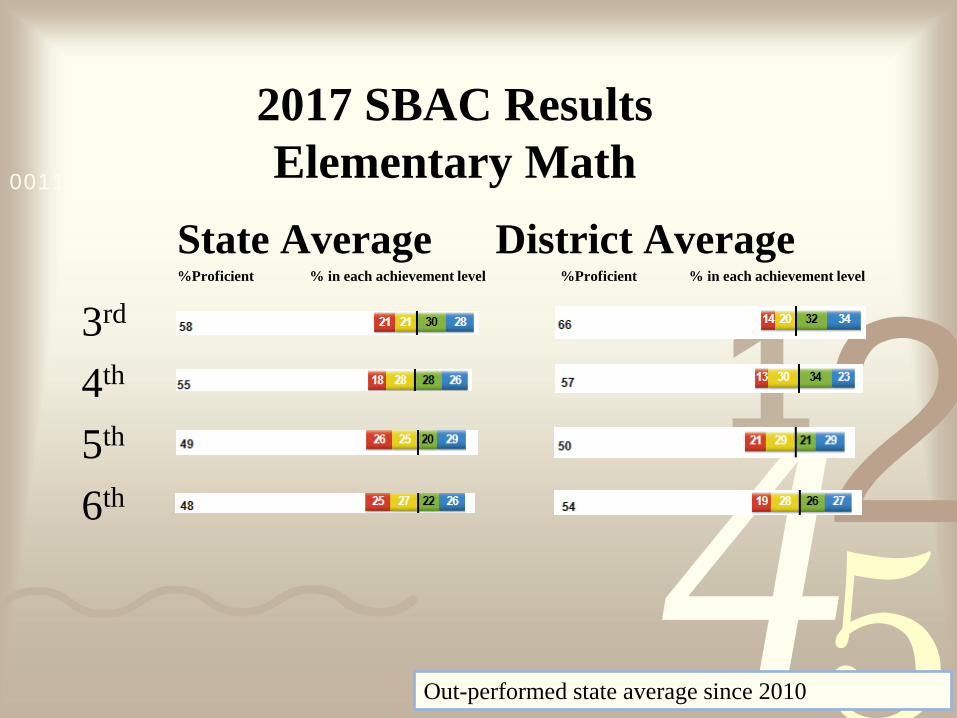
2017 SBAC Results Elementary Math
State Average District Average%Proficient % in each achievement level %Proficient % in each achievement level
3rd
4th
5th
6th
Out-performed state average since 2010
425
10011 0010 1010 1101 0001 0100 1011
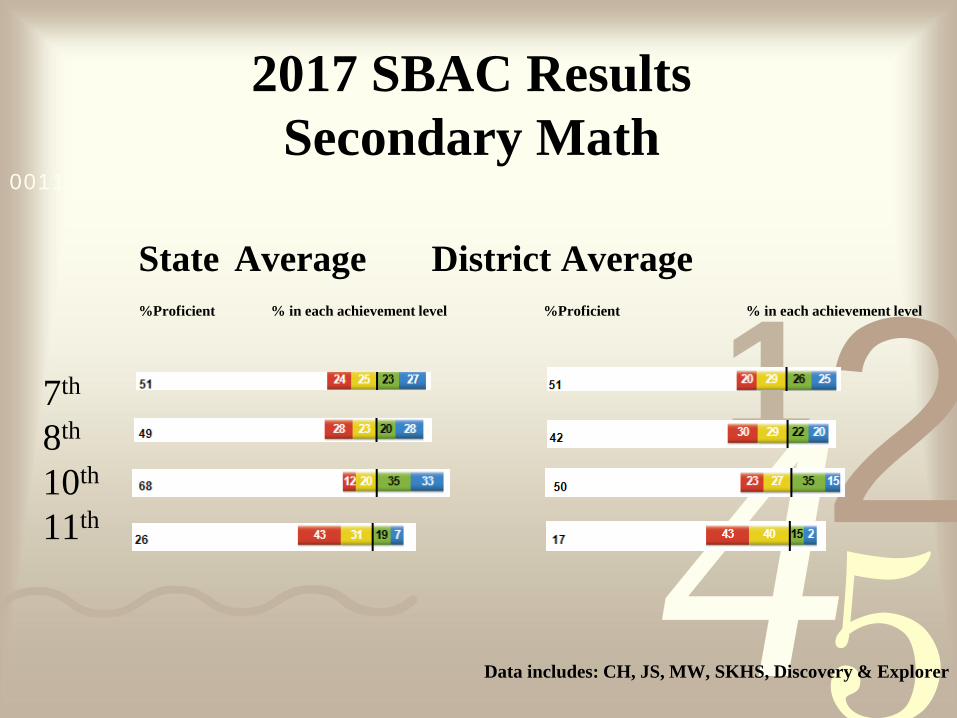
2017 SBAC ResultsSecondary Math
State Average District Average%Proficient % in each achievement level %Proficient % in each achievement level
7th
8th
10th
11th
Data includes: CH, JS, MW, SKHS, Discovery & Explorer

425
10011 0010 1010 1101 0001 0100 1011
End of Course Math*Grade 11 Grade 12
End of Course I (Algebra 1) 26% (31) 50% (8)End of Course II (Geometry) 28% (25) 40% (5)
*Only classes of 2017 and 2018 eligible to take EOC as an option to meet math graduation assessment requirement.

425
10011 0010 1010 1101 0001 0100 1011
2017 Special Education
% Proficient ELAState District
% Proficient MathState District
Grade 3 26 26/28* 30 31/31.5*Grade 4 21 24/ 32.3* 21 25/35.4*Grade 5 19 19/24.7* 14 10/22.4*Grade 6 13 16/34.3* 10 18/34.3*Grade 7 14 11/24.3* 10 13/24.3*Grade 8 13 11/29.7* 9 5/20.8*Grade 10 23 22/51.6* 14 7/10.2*Grade 11 9 5/20* 4 1/6.4*
* Includes WA-AIM and off grade level test results
425
10011 0010 1010 1101 0001 0100 1011
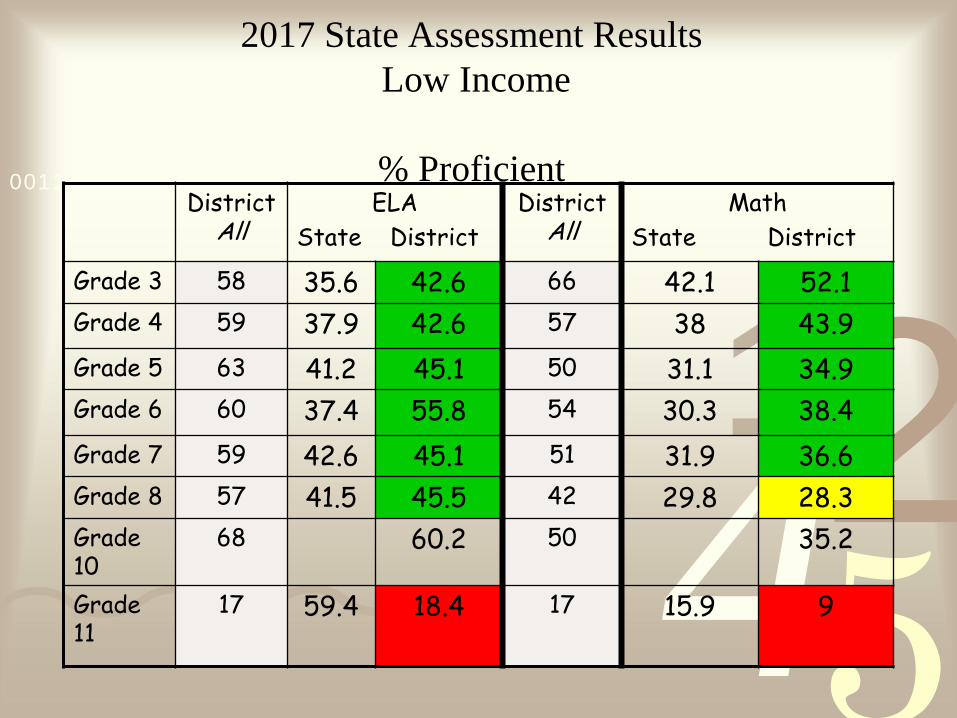
2017 State Assessment ResultsLow Income
% ProficientDistrict
All ELA
State DistrictDistrict
AllMath
State District
Grade 3 58 35.6 42.6 66 42.1 52.1Grade 4 59 37.9 42.6 57 38 43.9Grade 5 63 41.2 45.1 50 31.1 34.9Grade 6 60 37.4 55.8 54 30.3 38.4Grade 7 59 42.6 45.1 51 31.9 36.6Grade 8 57 41.5 45.5 42 29.8 28.3Grade 10
68 60.2 50 35.2
Grade 11
17 59.4 18.4 17 15.9 9
425
10011 0010 1010 1101 0001 0100 1011
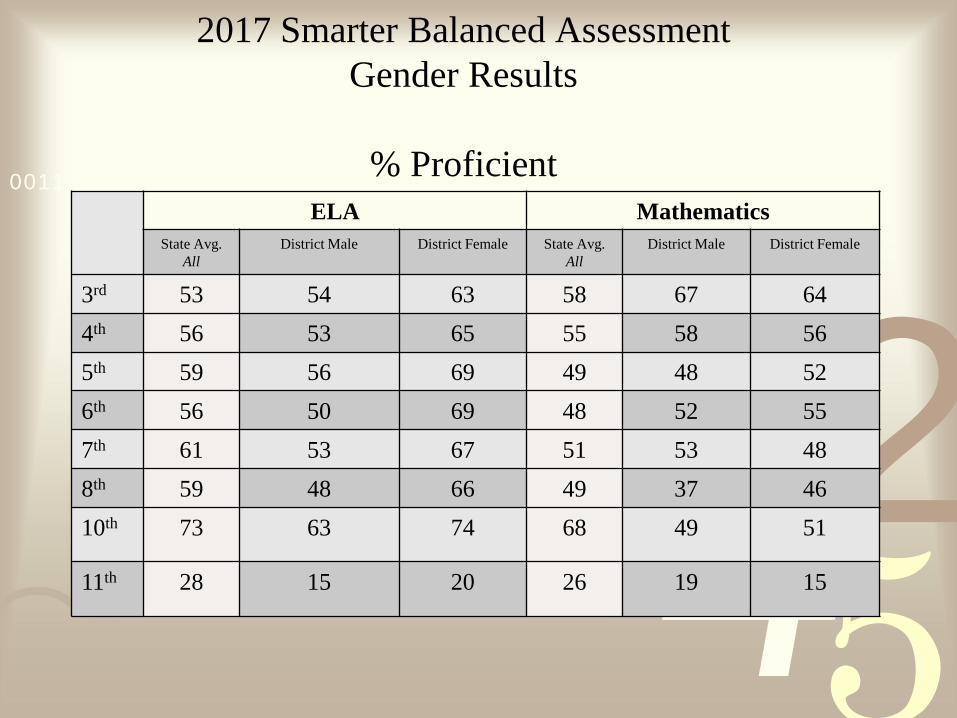
2017 Smarter Balanced AssessmentGender Results
% ProficientELA Mathematics
State Avg. All
District Male District Female State Avg.All
District Male District Female
3rd 53 54 63 58 67 644th 56 53 65 55 58 565th 59 56 69 49 48 526th 56 50 69 48 52 557th 61 53 67 51 53 488th 59 48 66 49 37 4610th 73 63 74 68 49 51
11th 28 15 20 26 19 15
425
10011 0010 1010 1101 0001 0100 1011
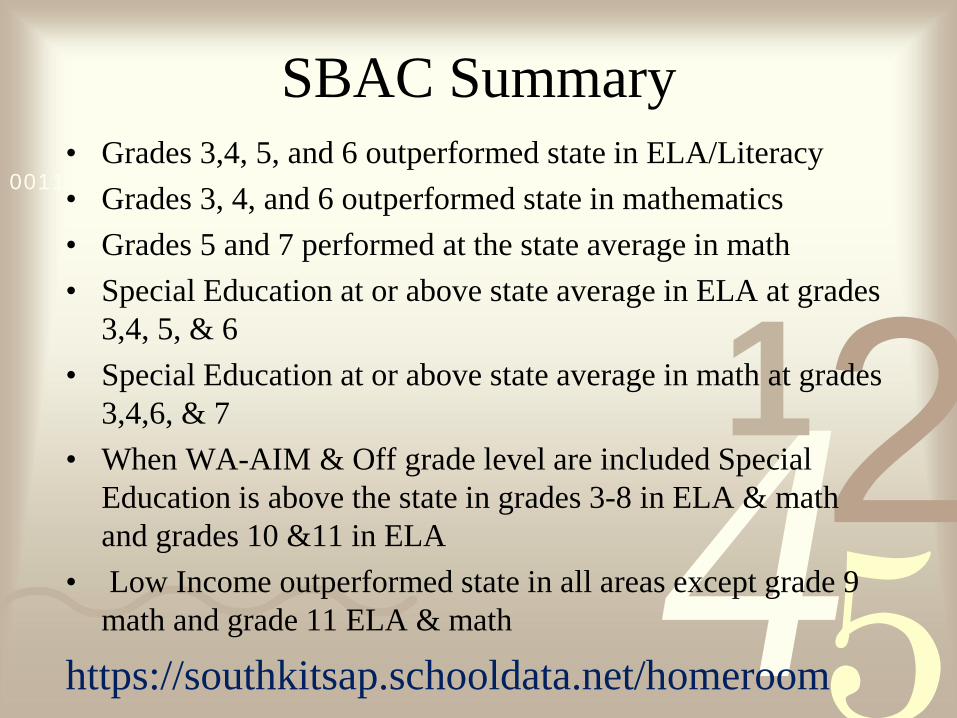
SBAC Summary• Grades 3,4, 5, and 6 outperformed state in ELA/Literacy• Grades 3, 4, and 6 outperformed state in mathematics• Grades 5 and 7 performed at the state average in math• Special Education at or above state average in ELA at grades
3,4, 5, & 6• Special Education at or above state average in math at grades
3,4,6, & 7• When WA-AIM & Off grade level are included Special
Education is above the state in grades 3-8 in ELA & math and grades 10 &11 in ELA
• Low Income outperformed state in all areas except grade 9 math and grade 11 ELA & math
https://southkitsap.schooldata.net/homeroom
425
10011 0010 1010 1101 0001 0100 1011
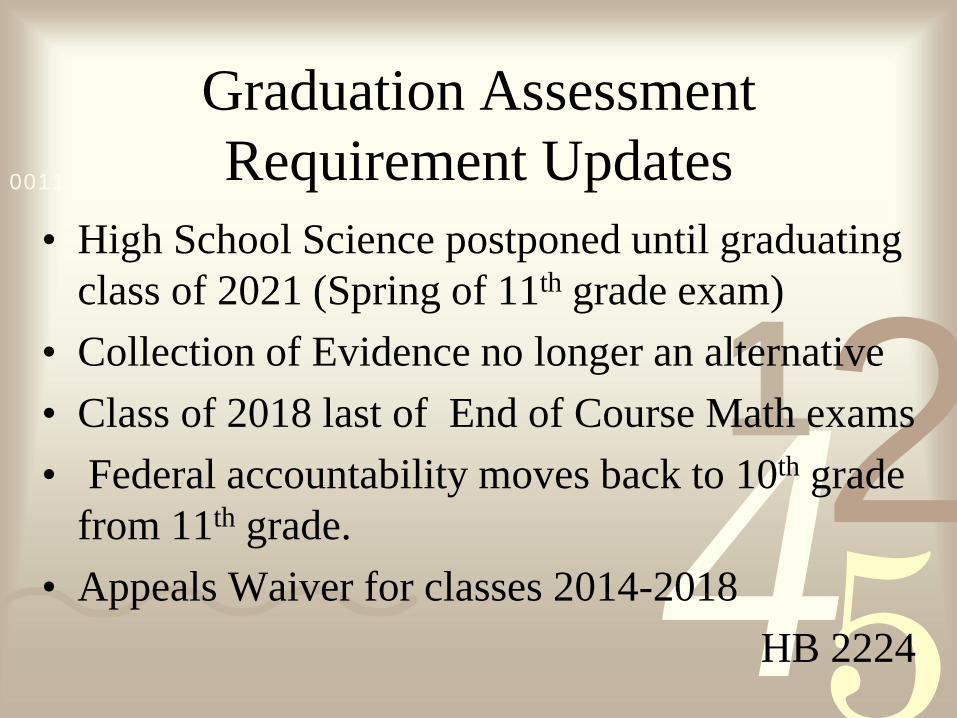
Graduation Assessment Requirement Updates
• High School Science postponed until graduating class of 2021 (Spring of 11th grade exam)
• Collection of Evidence no longer an alternative• Class of 2018 last of End of Course Math exams• Federal accountability moves back to 10th grade
from 11th grade.• Appeals Waiver for classes 2014-2018
HB 2224
425
10011 0010 1010 1101 0001 0100 1011
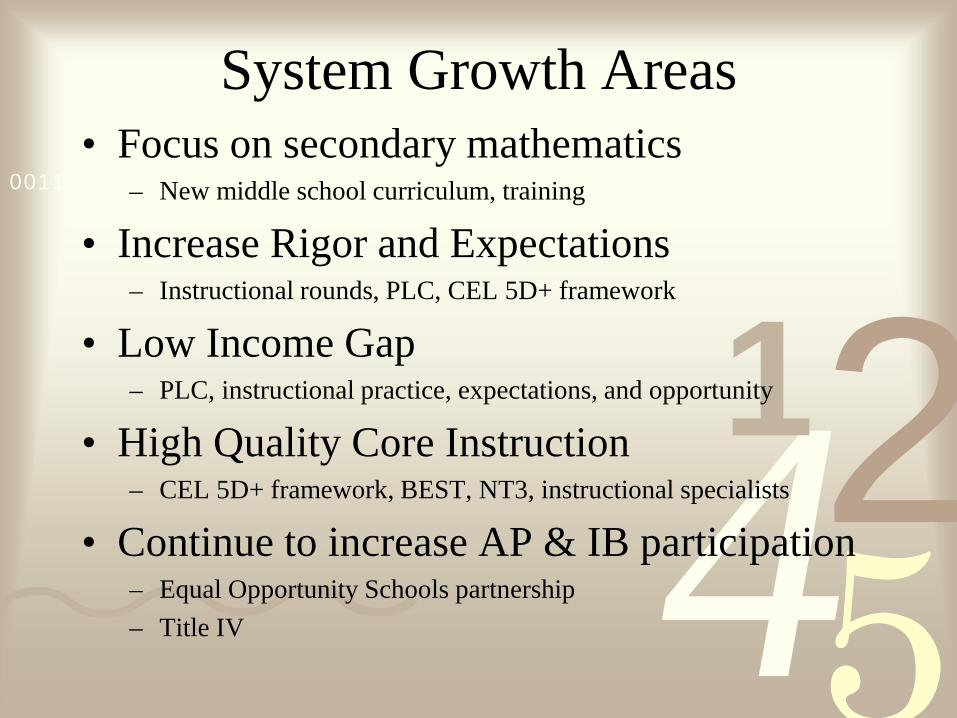
System Growth Areas• Focus on secondary mathematics
– New middle school curriculum, training
• Increase Rigor and Expectations– Instructional rounds, PLC, CEL 5D+ framework
• Low Income Gap– PLC, instructional practice, expectations, and opportunity
• High Quality Core Instruction– CEL 5D+ framework, BEST, NT3, instructional specialists
• Continue to increase AP & IB participation– Equal Opportunity Schools partnership– Title IV
425
10011 0010 1010 1101 0001 0100 1011
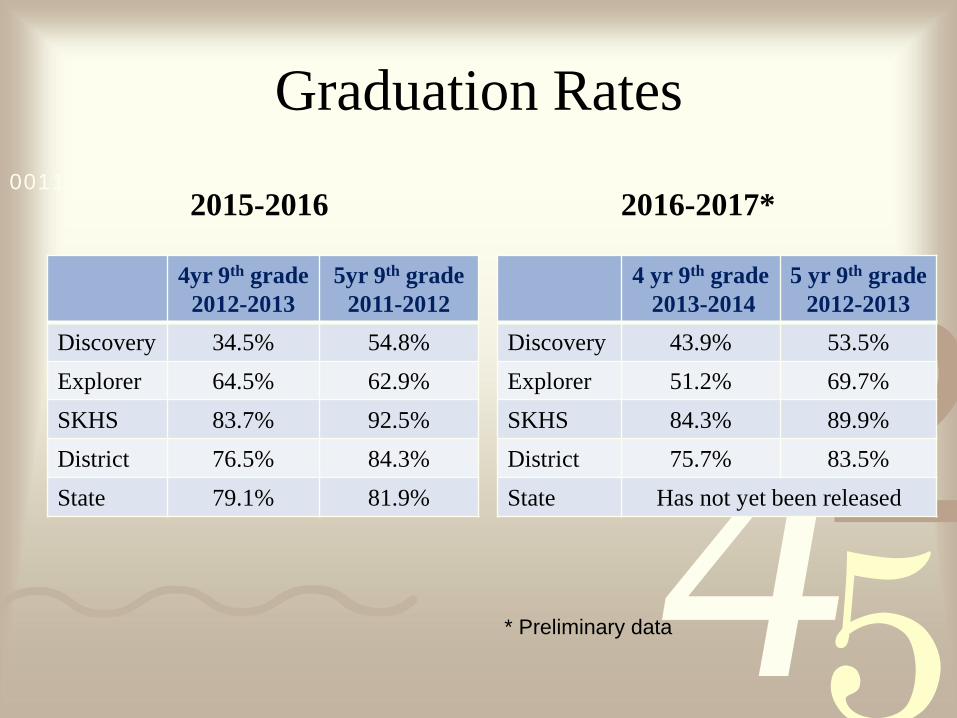
Graduation Rates
2015-2016 2016-2017*
4 yr 9th grade2013-2014
5 yr 9th grade 2012-2013
Discovery 43.9% 53.5%Explorer 51.2% 69.7%SKHS 84.3% 89.9%District 75.7% 83.5%State Has not yet been released
4yr 9th grade2012-2013
5yr 9th grade 2011-2012
Discovery 34.5% 54.8%Explorer 64.5% 62.9%SKHS 83.7% 92.5%District 76.5% 84.3%State 79.1% 81.9%
* Preliminary data
425
10011 0010 1010 1101 0001 0100 1011
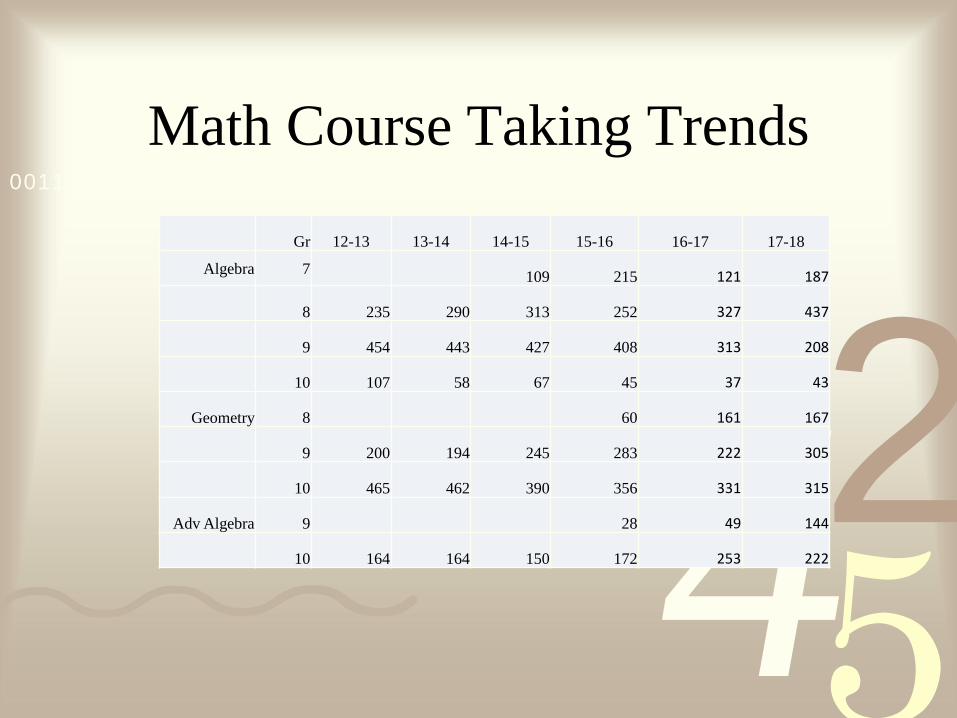
Math Course Taking Trends
Gr 12-13 13-14 14-15 15-16 16-17 17-18
Algebra 7 109 215 121 187
8 235 290 313 252 327 437
9 454 443 427 408 313 208
10 107 58 67 45 37 43
Geometry 8 60 161 167
9 200 194 245 283 222 305
10 465 462 390 356 331 315
Adv Algebra 9 28 49 144
10 164 164 150 172 253 222
425
10011 0010 1010 1101 0001 0100 1011
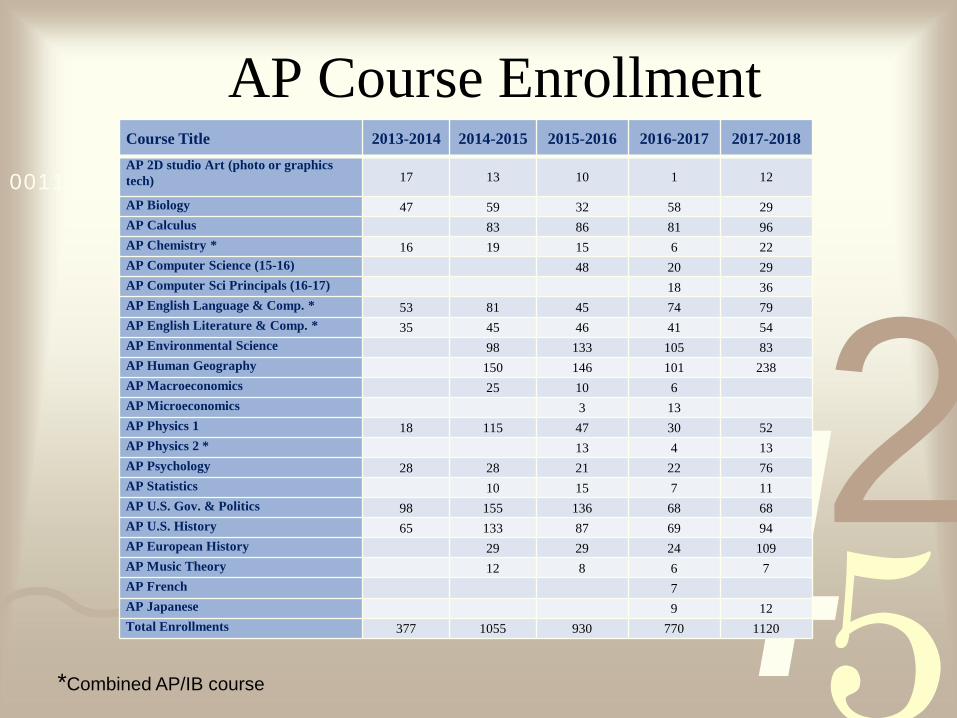
AP Course Enrollment
*Combined AP/IB course
Course Title 2013-2014 2014-2015 2015-2016 2016-2017 2017-2018AP 2D studio Art (photo or graphics tech) 17 13 10 1 12
AP Biology 47 59 32 58 29AP Calculus 83 86 81 96AP Chemistry * 16 19 15 6 22AP Computer Science (15-16) 48 20 29AP Computer Sci Principals (16-17) 18 36AP English Language & Comp. * 53 81 45 74 79AP English Literature & Comp. * 35 45 46 41 54AP Environmental Science 98 133 105 83AP Human Geography 150 146 101 238AP Macroeconomics 25 10 6AP Microeconomics 3 13AP Physics 1 18 115 47 30 52AP Physics 2 * 13 4 13AP Psychology 28 28 21 22 76AP Statistics 10 15 7 11AP U.S. Gov. & Politics 98 155 136 68 68AP U.S. History 65 133 87 69 94AP European History 29 29 24 109AP Music Theory 12 8 6 7AP French 7AP Japanese 9 12Total Enrollments 377 1055 930 770 1120
425
10011 0010 1010 1101 0001 0100 1011
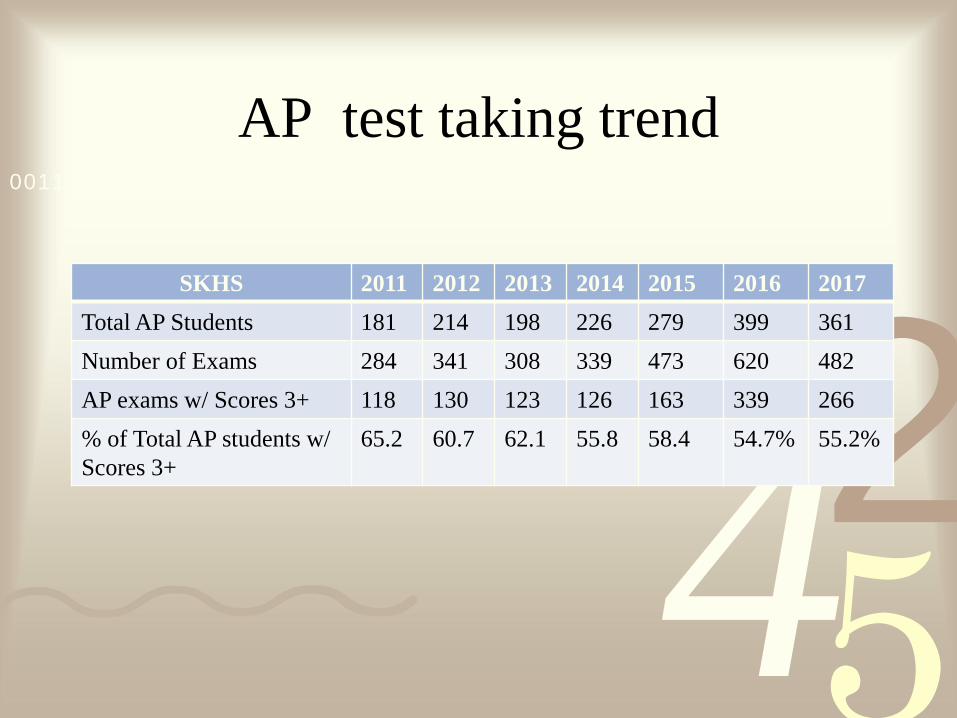
AP test taking trend
SKHS 2011 2012 2013 2014 2015 2016 2017Total AP Students 181 214 198 226 279 399 361Number of Exams 284 341 308 339 473 620 482AP exams w/ Scores 3+ 118 130 123 126 163 339 266% of Total AP students w/Scores 3+
65.2 60.7 62.1 55.8 58.4 54.7% 55.2%

425
10011 0010 1010 1101 0001 0100 1011
IB Course EnrollmentInternational Baccalaureate 2017-2018Biology Higher Level Year 1 17Biology Higher Level Year 2 14Film Year 1 21Film Year 1 4Math Standard Level Year 1 44Math Standard Level Year 2 21Math Studies Year 1 20Personal & Professional Skills 10Theory of Knowledge Year 1 15Theory of Knowledge Year 2 12Spanish Year 1 9Spanish Year 2 9
History of the Americas Higher Level Year 1 21
History of the Americas Higher Level Year 2 25
425
10011 0010 1010 1101 0001 0100 1011
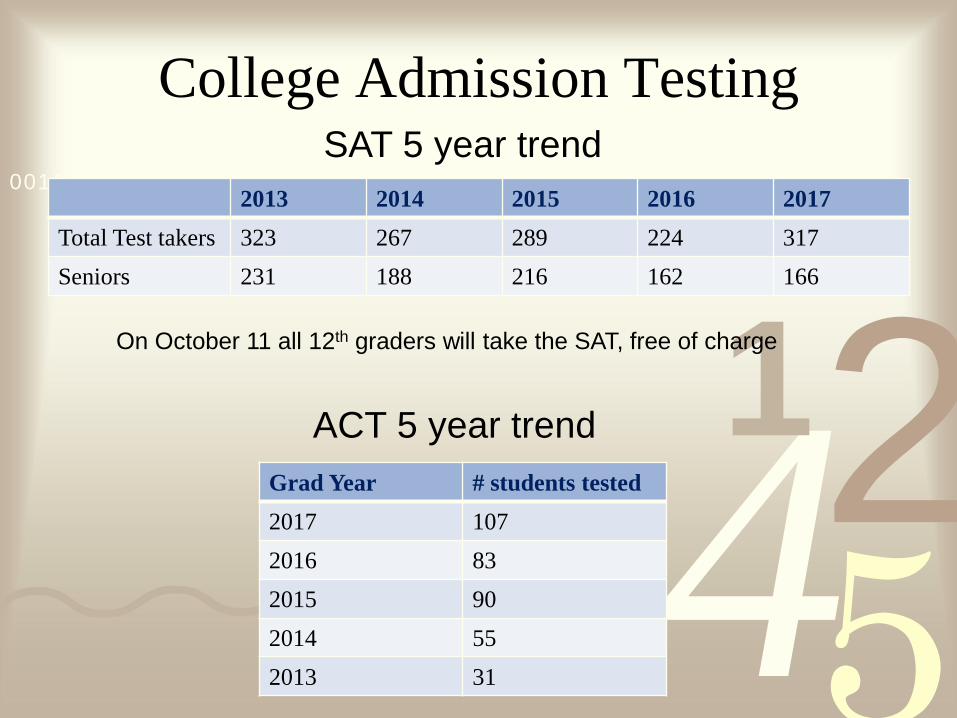
College Admission Testing
2013 2014 2015 2016 2017Total Test takers 323 267 289 224 317Seniors 231 188 216 162 166
SAT 5 year trend
Grad Year # students tested2017 1072016 832015 902014 552013 31
ACT 5 year trend
On October 11 all 12th graders will take the SAT, free of charge
425
10011 0010 1010 1101 0001 0100 1011
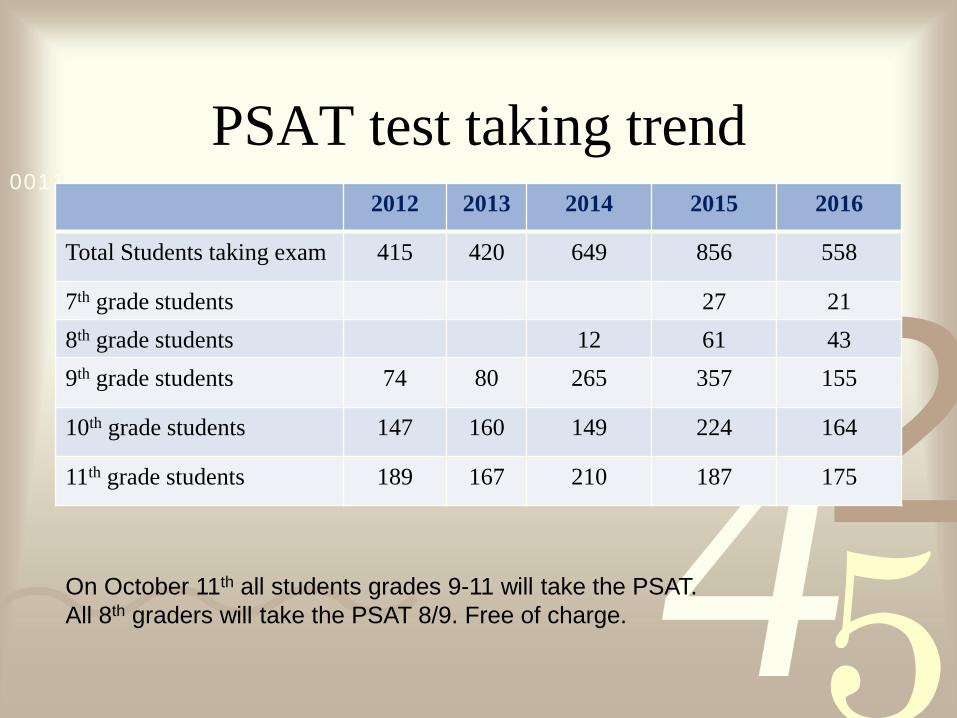
PSAT test taking trend2012 2013 2014 2015 2016
Total Students taking exam 415 420 649 856 558
7th grade students 27 218th grade students 12 61 439th grade students 74 80 265 357 155
10th grade students 147 160 149 224 164
11th grade students 189 167 210 187 175
On October 11th all students grades 9-11 will take the PSAT. All 8th graders will take the PSAT 8/9. Free of charge.
425
10011 0010 1010 1101 0001 0100 1011
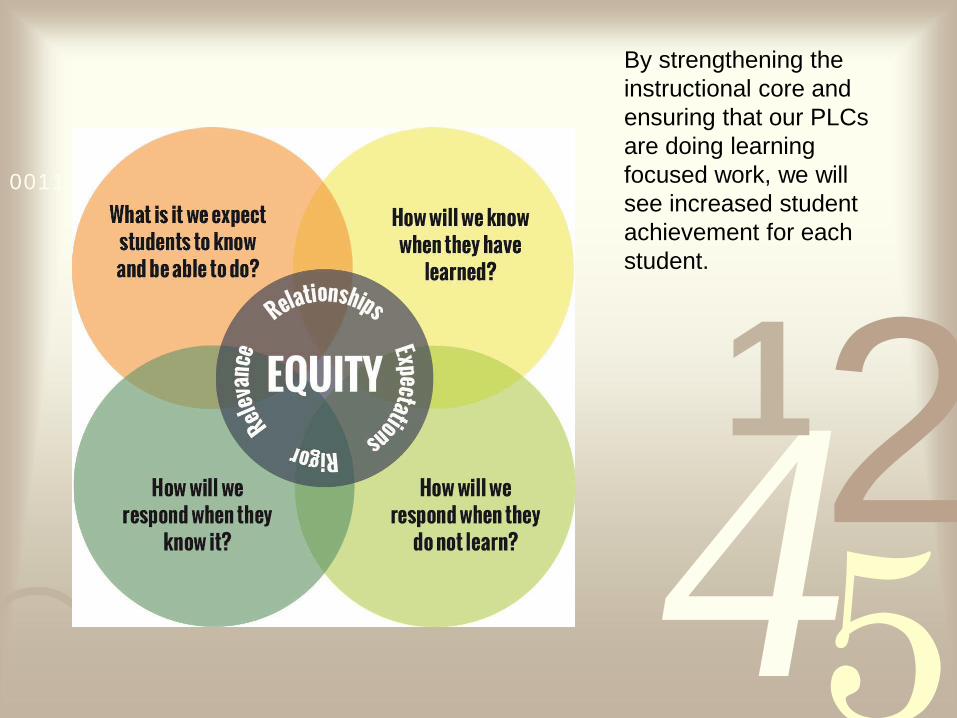
By strengthening the instructional core and ensuring that our PLCs are doing learning focused work, we will see increased student achievement for each student.
425
10011 0010 1010 1101 0001 0100 1011
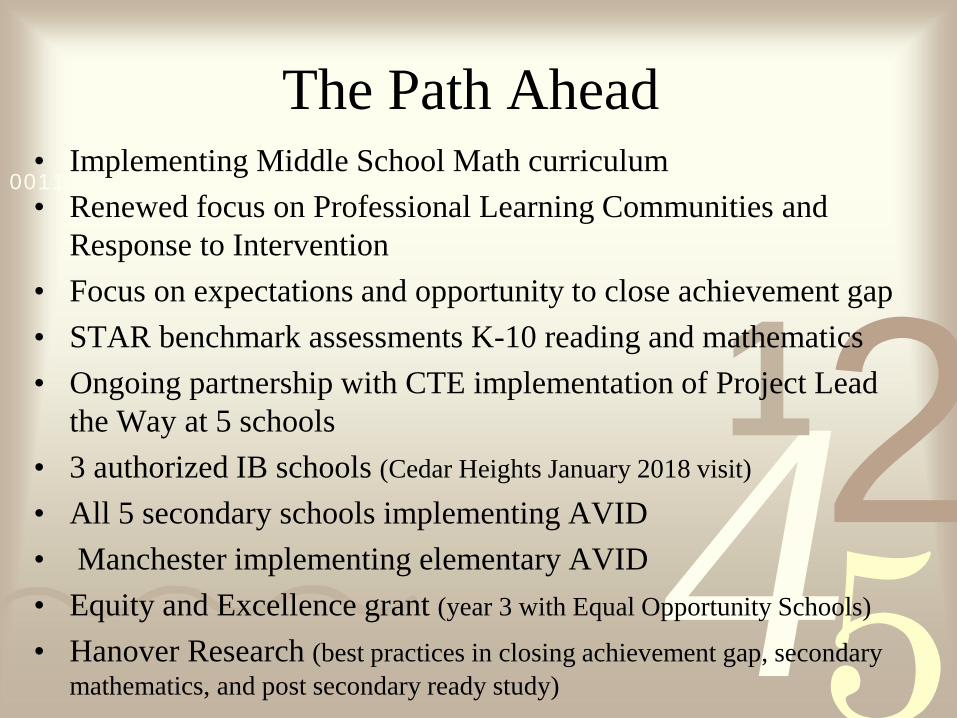
The Path Ahead• Implementing Middle School Math curriculum• Renewed focus on Professional Learning Communities and
Response to Intervention • Focus on expectations and opportunity to close achievement gap• STAR benchmark assessments K-10 reading and mathematics• Ongoing partnership with CTE implementation of Project Lead
the Way at 5 schools• 3 authorized IB schools (Cedar Heights January 2018 visit)
• All 5 secondary schools implementing AVID• Manchester implementing elementary AVID• Equity and Excellence grant (year 3 with Equal Opportunity Schools)
• Hanover Research (best practices in closing achievement gap, secondary mathematics, and post secondary ready study)