Embed Size (px)
Citation preview

South Western Sydney Region
PLANNING… SMARTLY
Consultant Meeting….
30 April, 2010
Session 1
What is a quality outcome?What is a quality outcome?
Session 2
Quality Indicators Quality Indicators and and
Evaluation ToolsEvaluation Tools

SESSION 1
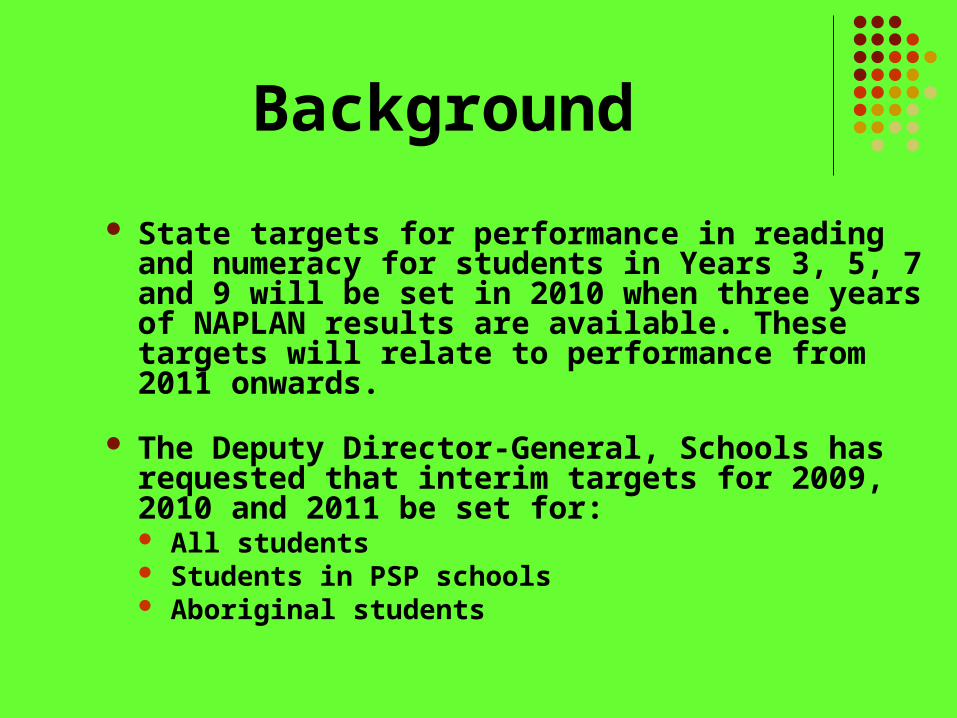
Background
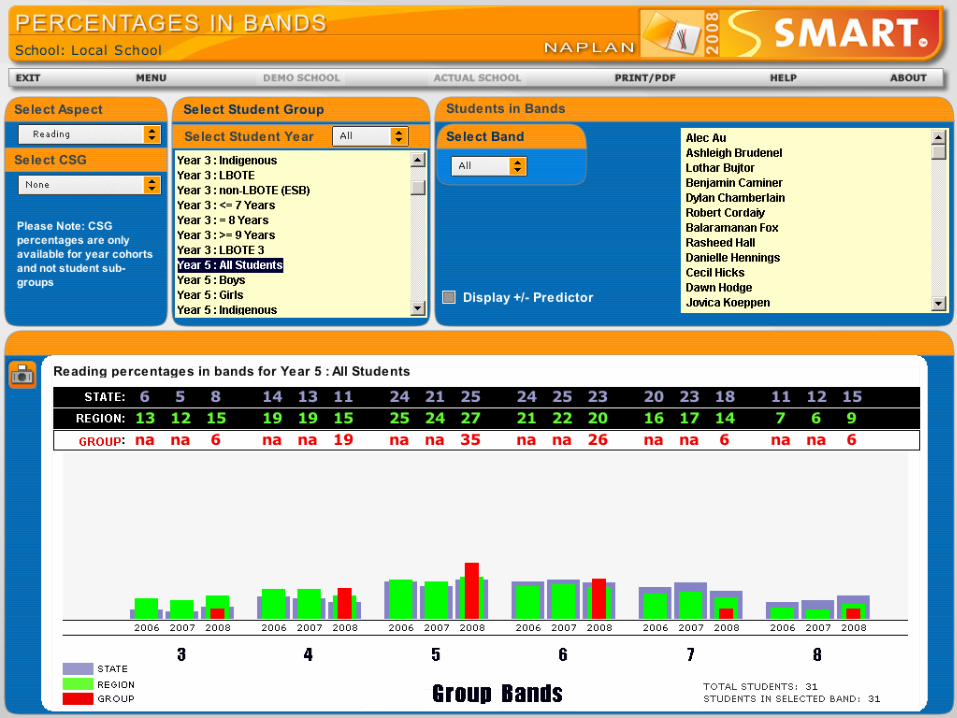
State targets for performance in reading and numeracy for students in Years 3, 5, 7 and 9 will be set in 2010 when three years of NAPLAN results are available. These targets will relate to performance from 2011 onwards.
The Deputy Director-General, Schools has requested that interim targets for 2009, 2010 and 2011 be set for: All students Students in PSP schools Aboriginal students
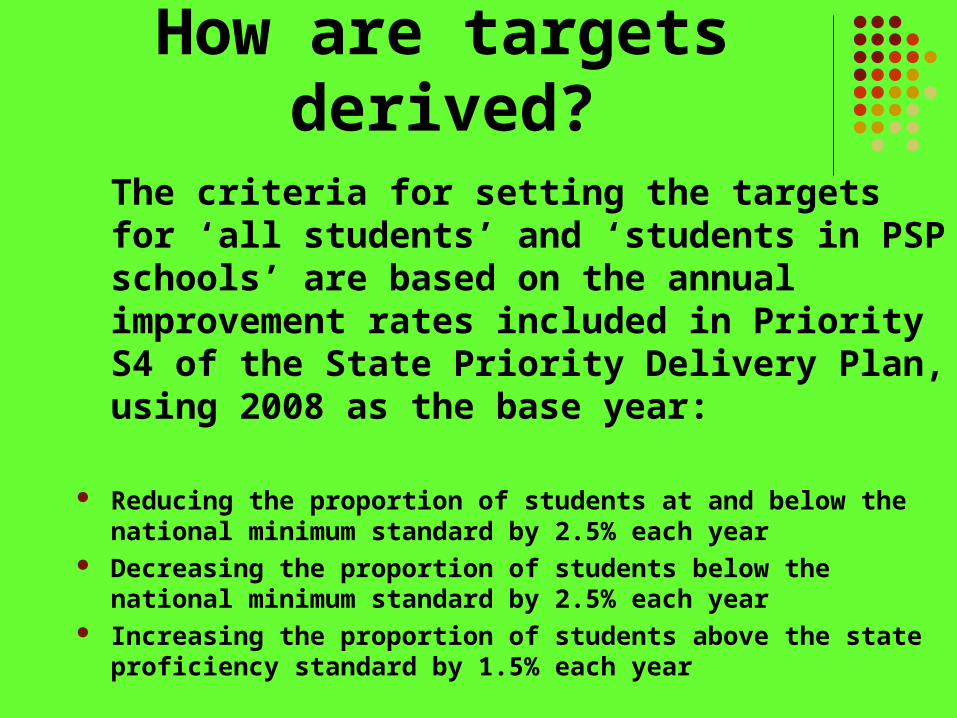
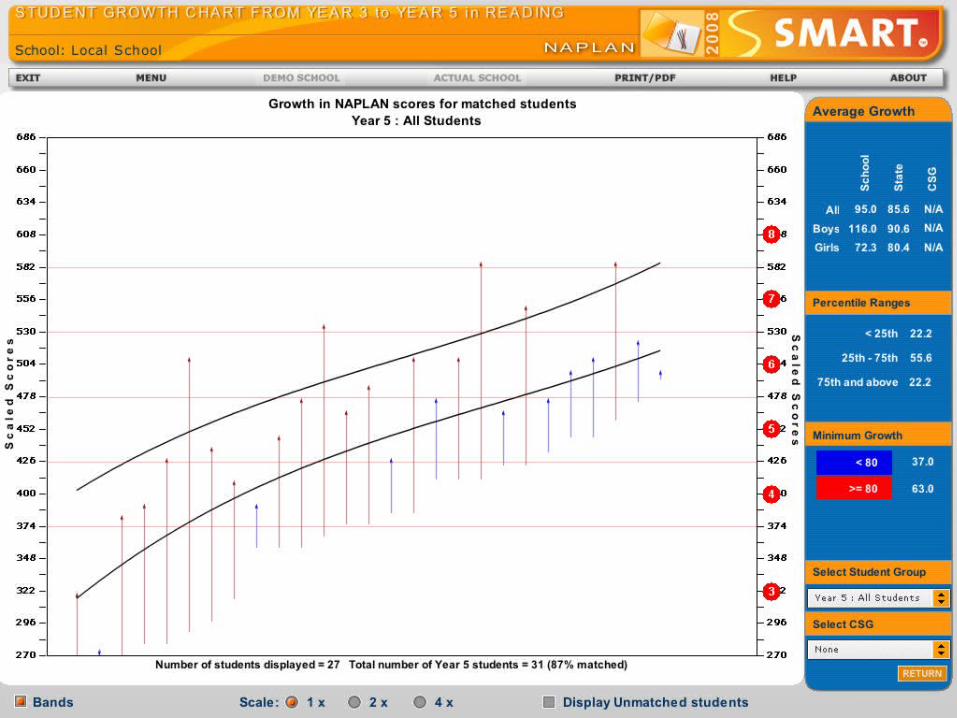
How are targets derived?The criteria for setting the targets for ‘all students’ and ‘students in PSP schools’ are based on the annual improvement rates included in Priority S4 of the State Priority Delivery Plan, using 2008 as the base year:
Reducing the proportion of students at and below the national minimum standard by 2.5% each year
Decreasing the proportion of students below the national minimum standard by 2.5% each year
Increasing the proportion of students above the state proficiency standard by 1.5% each year
They are clear, specific and concise statements that indicate what the consultant aims to achieve by the end of the intervention. Outcomes can be measured or evaluated through the collection of data or observation.
INTENDED OUTCOMES…
SESSION 2
INDICATORS….
Indicators describe progress towards the achievement of targets or intended outcomes that are
linked to implemented strategies

STRATEGIES….
Strategies are the major actions (collectively) or initiatives (collectively) designed to achieve intended outcomes or targets
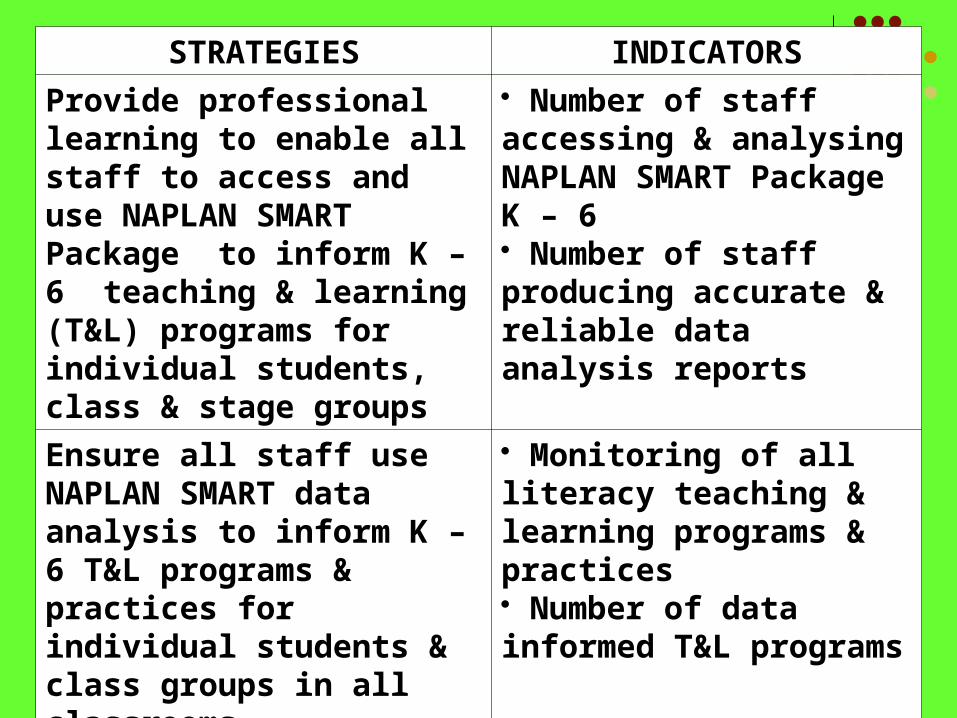
STRATEGIES INDICATORS
Provide professional learning to enable all staff to access and use NAPLAN SMART Package to inform K – 6 teaching & learning (T&L) programs for individual students, class & stage groups
Number of staff accessing & analysing NAPLAN SMART Package K – 6 Number of staff producing accurate & reliable data analysis reports
Ensure all staff use NAPLAN SMART data analysis to inform K – 6 T&L programs & practices for individual students & class groups in all classrooms.
Monitoring of all literacy teaching & learning programs & practices Number of data informed T&L programs
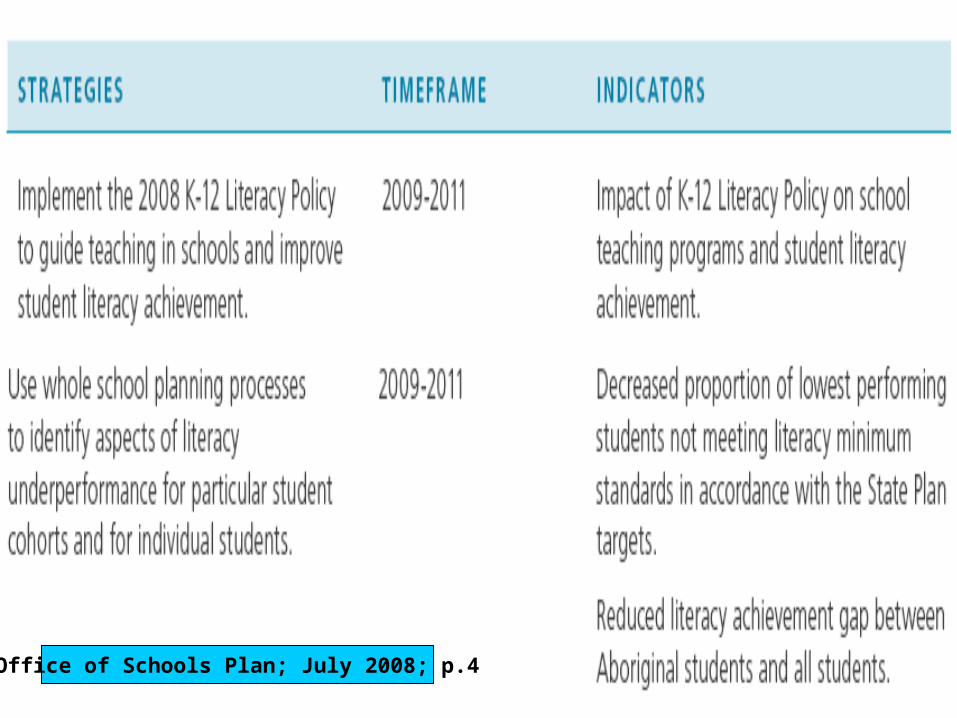
Office of Schools Plan; July 2008; p.4
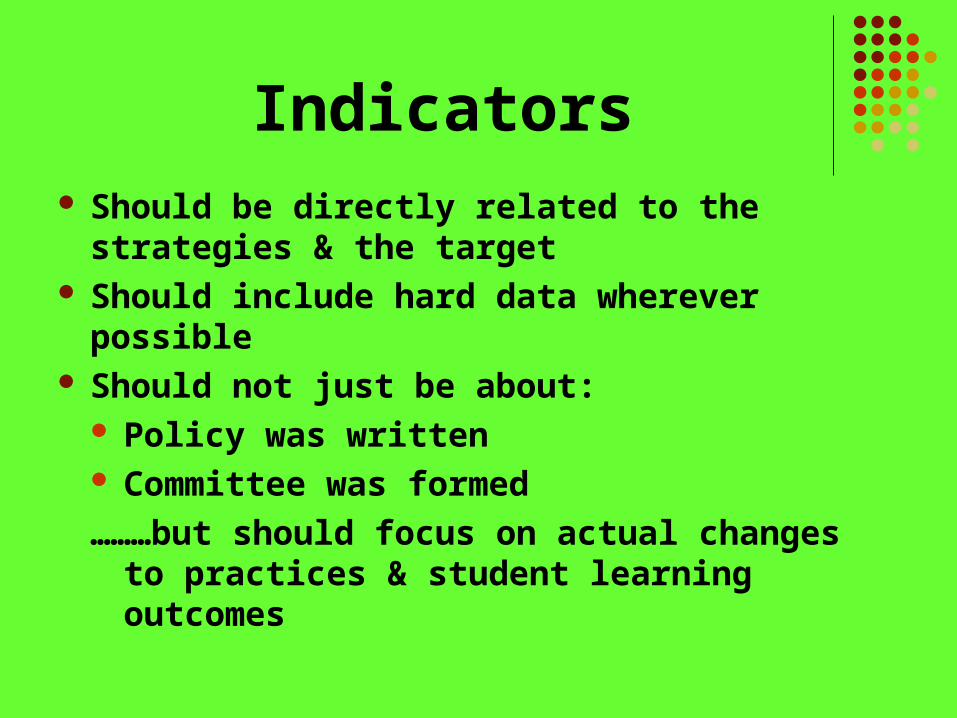
Indicators Should be directly related to the strategies &
the target Should include hard data wherever possible Should not just be about:
Policy was written Committee was formed
………but should focus on actual changes to practices & student learning outcomes
Our success will be measured …..
internal/external performance indicators supporting our statements of performance or progress;
matrices providing evidence of improved practice;
increases in participation rates;
decreases in the incidences of anti-social behaviour; and
increased satisfaction / confidence articulated by parents and staff.
Measurable Indicators
How will you know whether student outcomes have improved?
What type of data gathering will provide the evidence you need?
Generic Measuring Tool

I have not failed. I've just found 10,000 ways that won't work. (Thomas Edison)
JOHN WARREN0407.296.467
SCHOOL EDUCATION GROUPS
Campbelltown
Ingleburn
Macarthur