Embed Size (px)
Citation preview

SOUTHEAST LOS ANGELES INDUSTRIAL AREA Data and Recommendations
Prepared by City of Los Angeles Planning DepartmentGraphic Services Section • December 5, 2006
SUMMARY STATISTICS BY SUB AREA
ANALYSIS AREAAnalysis Area 1Analysis Area 2Analysis Area 3Analysis Area 3A2
Analysis Area 3B2
Analysis Area 4Analysis Area 5Analysis Area 6Analysis Area 7Analysis Area 8Analysis Area 9Analysis Area 10Analysis Area 11Analysis Area 12Analysis Area 13Analysis Area 14Analysis Area 15Analysis Area 16Analysis Area 17Total Area
NO. OF FIRMS643419334598218917504914671525121NA33167491,574
NO. OF JOBS1,8432,1286222263965232,27099877763108589109302744NA4,54184977217,139
Total32.069.335.515.020.420.0100.511.333.764.523.943.211.113.428.5163.9137.726.613.517,139
Industrial/Commercial25.839.231.4NANA14.393.08.025.245.917.233.22.812.225.28.1106.920.212.5521.1
AREA (In Acres)
2Sub-portions of Analysis Area 3
SUMMARY DATA681.5 Total Acres of Land59% Light Industrial Use9% Heavy Industrial use6% Residential Use12% Commercial Use17% Other
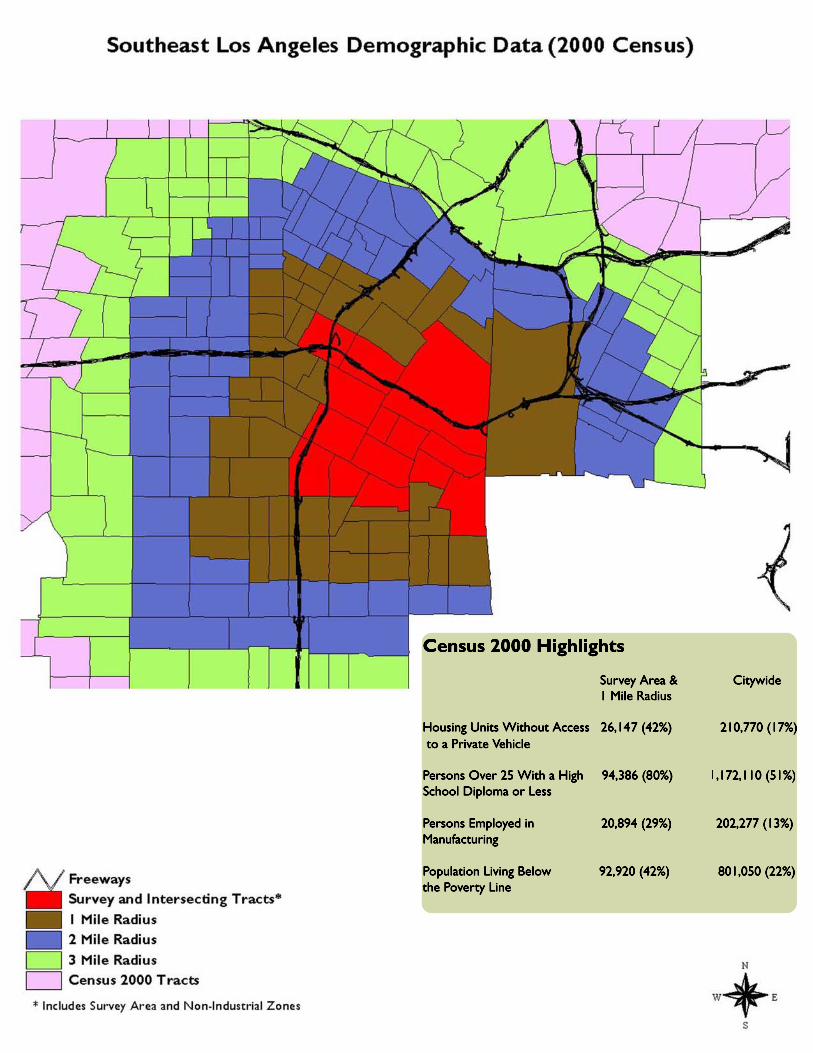
DEMOGRAPHICS (Within 1 Mile)1
20,894 Persons Employed in Manufacturing: 29%92,920 Persons Living in Poverty: 42%94,386 Persons With a HS Diploma or Less: 80%26,147 Housing Units Without Auto Access: 42%1Demographics are for survey area plus 1 mile radius. See enclosed Southeast Los Angeles Demographic Datafor conditions measured against the City as a whole.
CONTENTSSummary Statistics by Sub AreaSub Area Maps - 18 Sub AreasSoutheast Los Angeles Demographic Data
SUMMARY DATA INDEX MAP681.5 Total Acres of Land59% Light Industrial Use9% Heavy Industrial use6% Residential Use12% Commercial Use17% Other
1,574 Businesses292 Manufacturing: 19% of total409 Wholesale Trade: 26% of total
17,139 Jobs29% Manufacturing: 4,913 jobs22% Wholesale Trade: 3,845 jobs
DEMOGRAPHICS (Within 1 Mile)1
20,894 Persons Employed in Manufacturing: 29%92,920 Persons Living in Poverty: 42%94,386 Persons With a HS Diploma or Less: 80%26,147 Housing Units Without Auto Access: 42%1Demographics are for survey area plus 1 mile radius. See enclosed Southeast Los Angeles Demographic Datafor conditions measured against the City as a whole.
CONTENTSSub Area Maps - 18 Sub AreasSoutheast Los Angeles Demographic Data
SUMMARY STATISTICS BY SUB AREA
NO. OF FIRMS NO. OF JOBS Total32.069.335.513.322.520.0
100.511.333.764.523.943.211.113.428.516.9
137.726.613.5
681.5
Industrial/CommercialAREA (In Acres)
2Sub-portions of Analysis Area 3
6434193345982
18917504914671525
121NA3316749
1,574
1,8432,128
622226396523
2,27099
877763108589109302744NA
4,541849772
17,139
25.839.231.412.219.514.393.08.0
25.245.917.233.22.8
12.225.28.1
106.920.212.5
521.1
Potential change areas map not to scale N
ANALYSIS AREAAnalysis Area 1Analysis Area 2Analysis Area 3Analysis Area 3A2
Analysis Area 3B2
Analysis Area 4Analysis Area 5Analysis Area 6Analysis Area 7Analysis Area 8Analysis Area 9Analysis Area 10Analysis Area 11Analysis Area 12Analysis Area 13Analysis Area 14Analysis Area 15Analysis Area 16Analysis Area 17Total Area
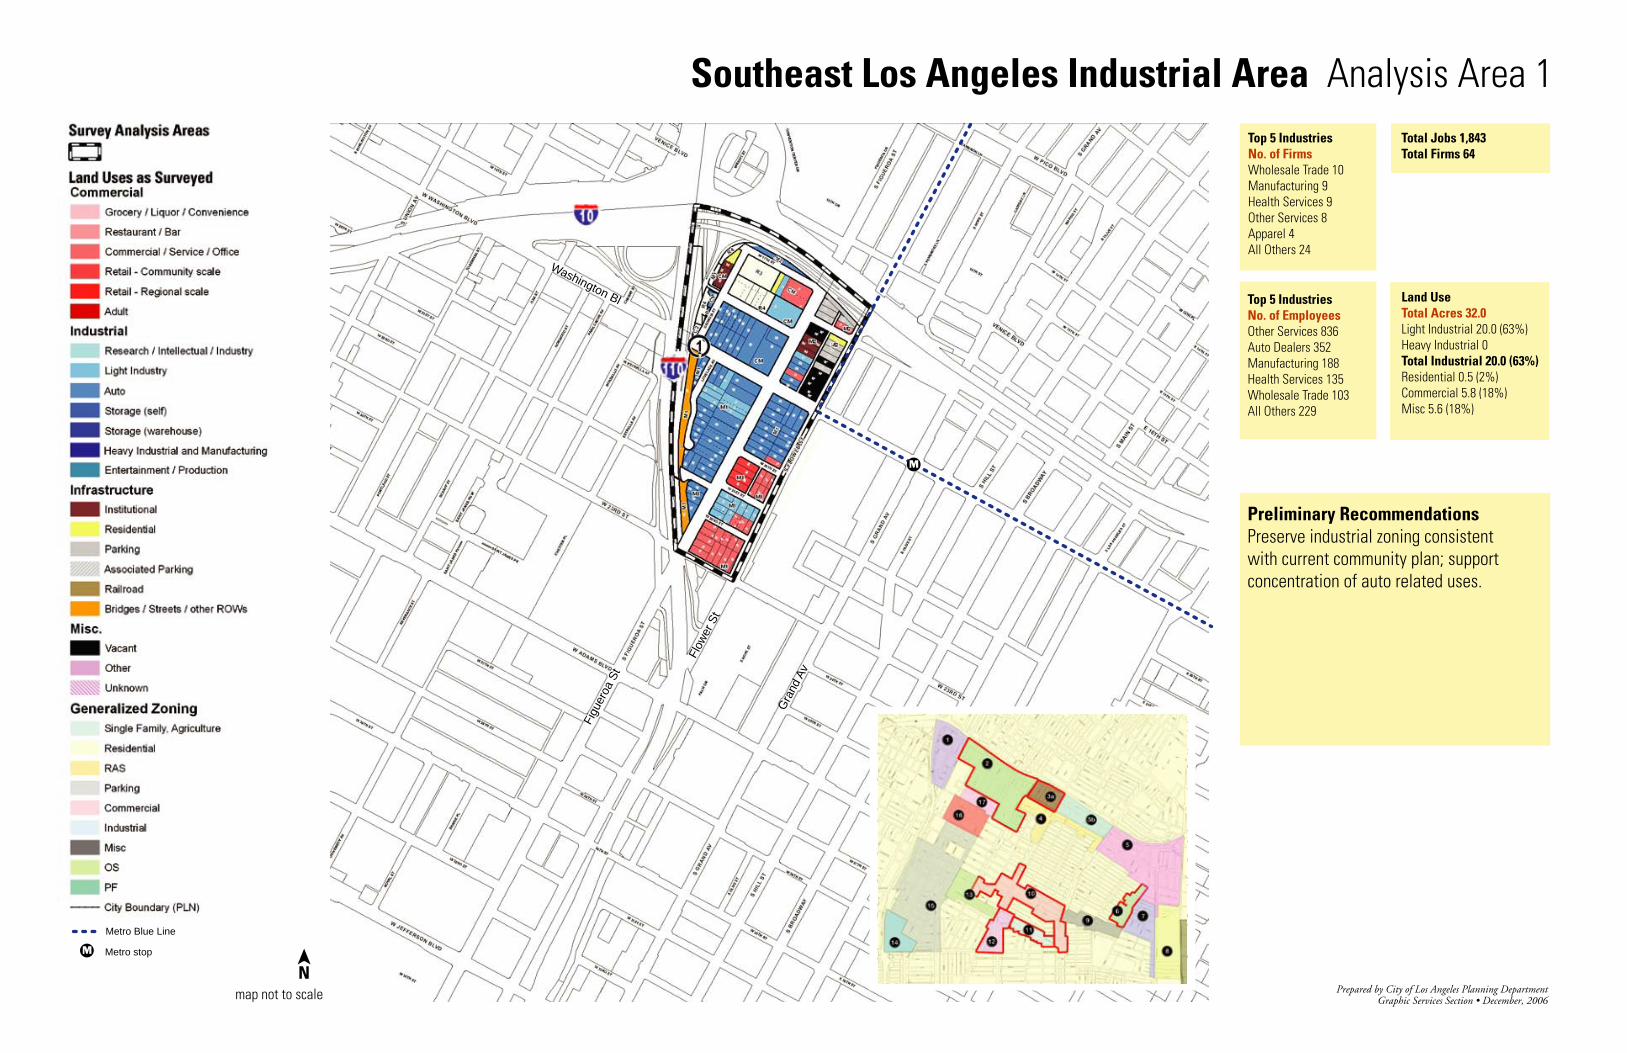
Top 5 IndustriesNo. of FirmsWholesale Trade 10Manufacturing 9Health Services 9Other Services 8Apparel 4All Others 24
Total Jobs 1,843Total Firms 64
Southeast Los Angeles Industrial Area Analysis Area 1
Prepared by City of Los Angeles Planning DepartmentGraphic Services Section • December, 2006map not to scale
Land UseTotal Acres 32.0Light Industrial 20.0 (63%)Heavy Industrial 0Total Industrial 20.0 (63%)Residential 0.5 (2%)Commercial 5.8 (18%)Misc 5.6 (18%)
Preliminary Recommendations Preserve industrial zoning consistent with current community plan; support concentration of auto related uses.
N
Top 5 IndustriesNo. of EmployeesOther Services 836Auto Dealers 352Manufacturing 188Health Services 135Wholesale Trade 103All Others 229
Metro Blue Line
Metro stop
Flow
er S
t
Washington Bl
Figu
eroa
St
Gra
nd A
v
M
M
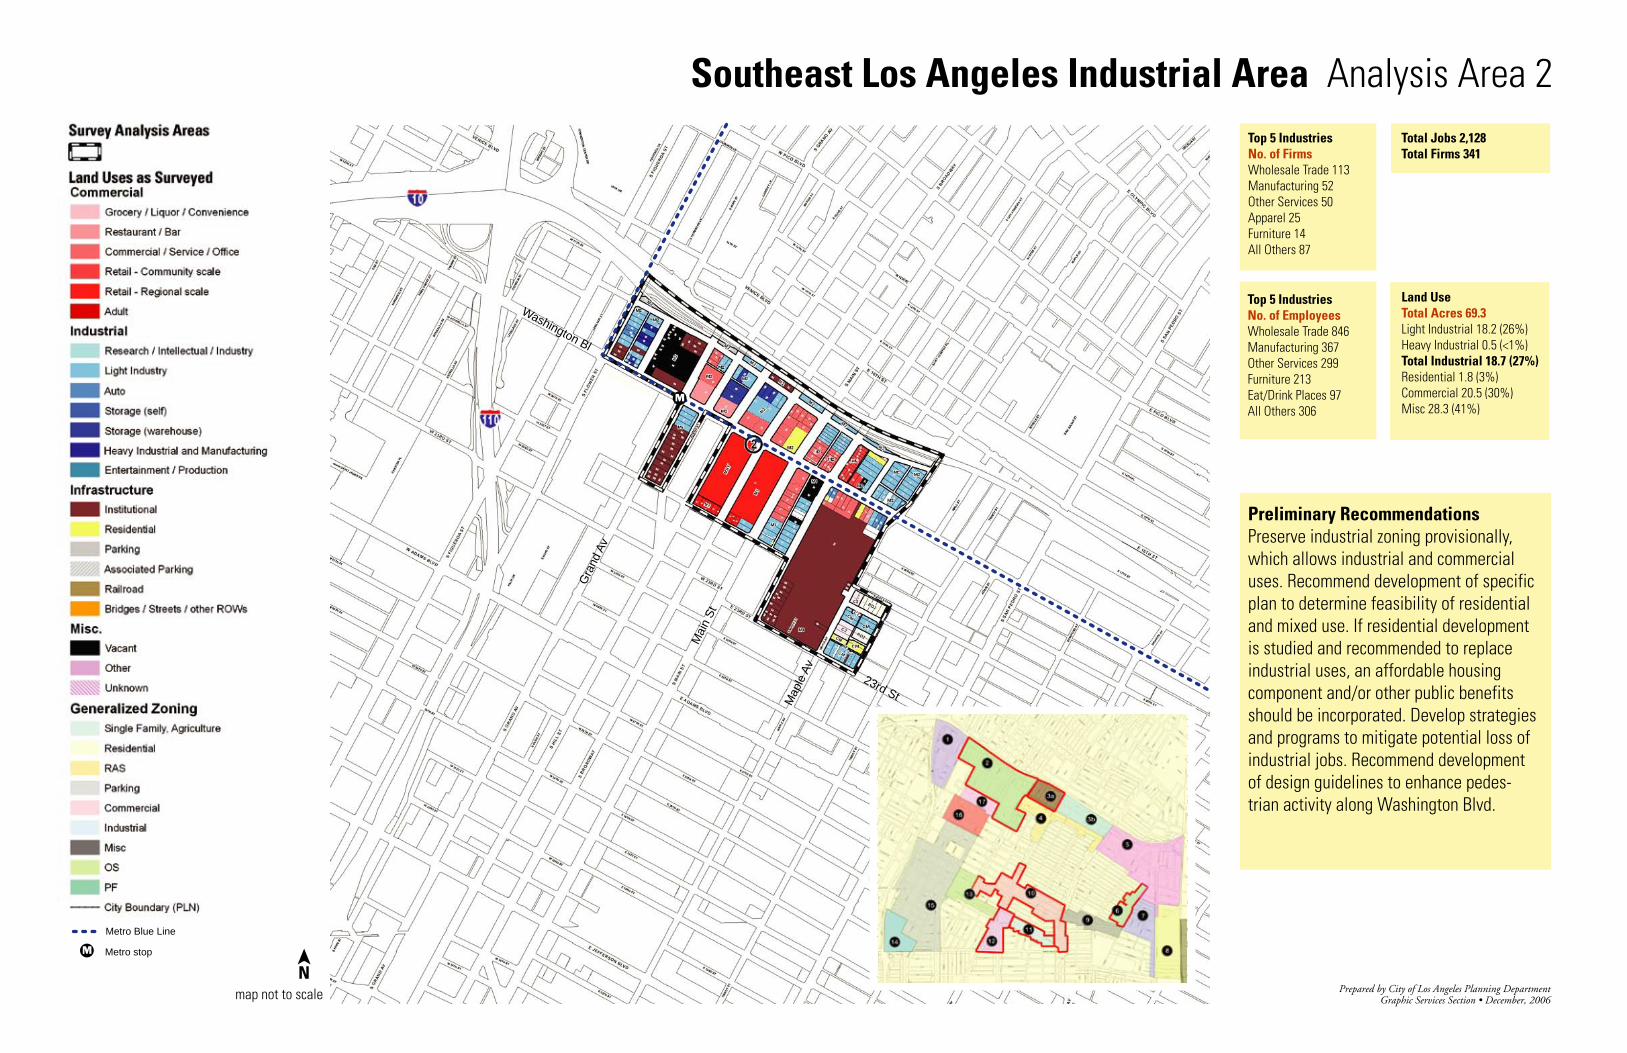
Top 5 IndustriesNo. of FirmsWholesale Trade 113Manufacturing 52Other Services 50Apparel 25Furniture 14All Others 87
Total Jobs 2,128Total Firms 341
Southeast Los Angeles Industrial Area Analysis Area 2
map not to scale
Land UseTotal Acres 69.3Light Industrial 18.2 (26%)Heavy Industrial 0.5 (<1%)Total Industrial 18.7 (27%)Residential 1.8 (3%)Commercial 20.5 (30%)Misc 28.3 (41%)
Preliminary Recommendations Preserve industrial zoning provisionally, which allows industrial and commercial uses. Recommend development of specific plan to determine feasibility of residential and mixed use. If residential development is studied and recommended to replace industrial uses, an affordable housing component and/or other public benefits should be incorporated. Develop strategies and programs to mitigate potential loss of industrial jobs. Recommend development of design guidelines to enhance pedes-trian activity along Washington Blvd.
N
Top 5 IndustriesNo. of EmployeesWholesale Trade 846Manufacturing 367Other Services 299Furniture 213Eat/Drink Places 97All Others 306
Metro Blue Line
Metro stop
Washington Bl
Map
le A
v
Gra
nd A
v
23rd StM
ain
St
M
M
Prepared by City of Los Angeles Planning DepartmentGraphic Services Section • December, 2006
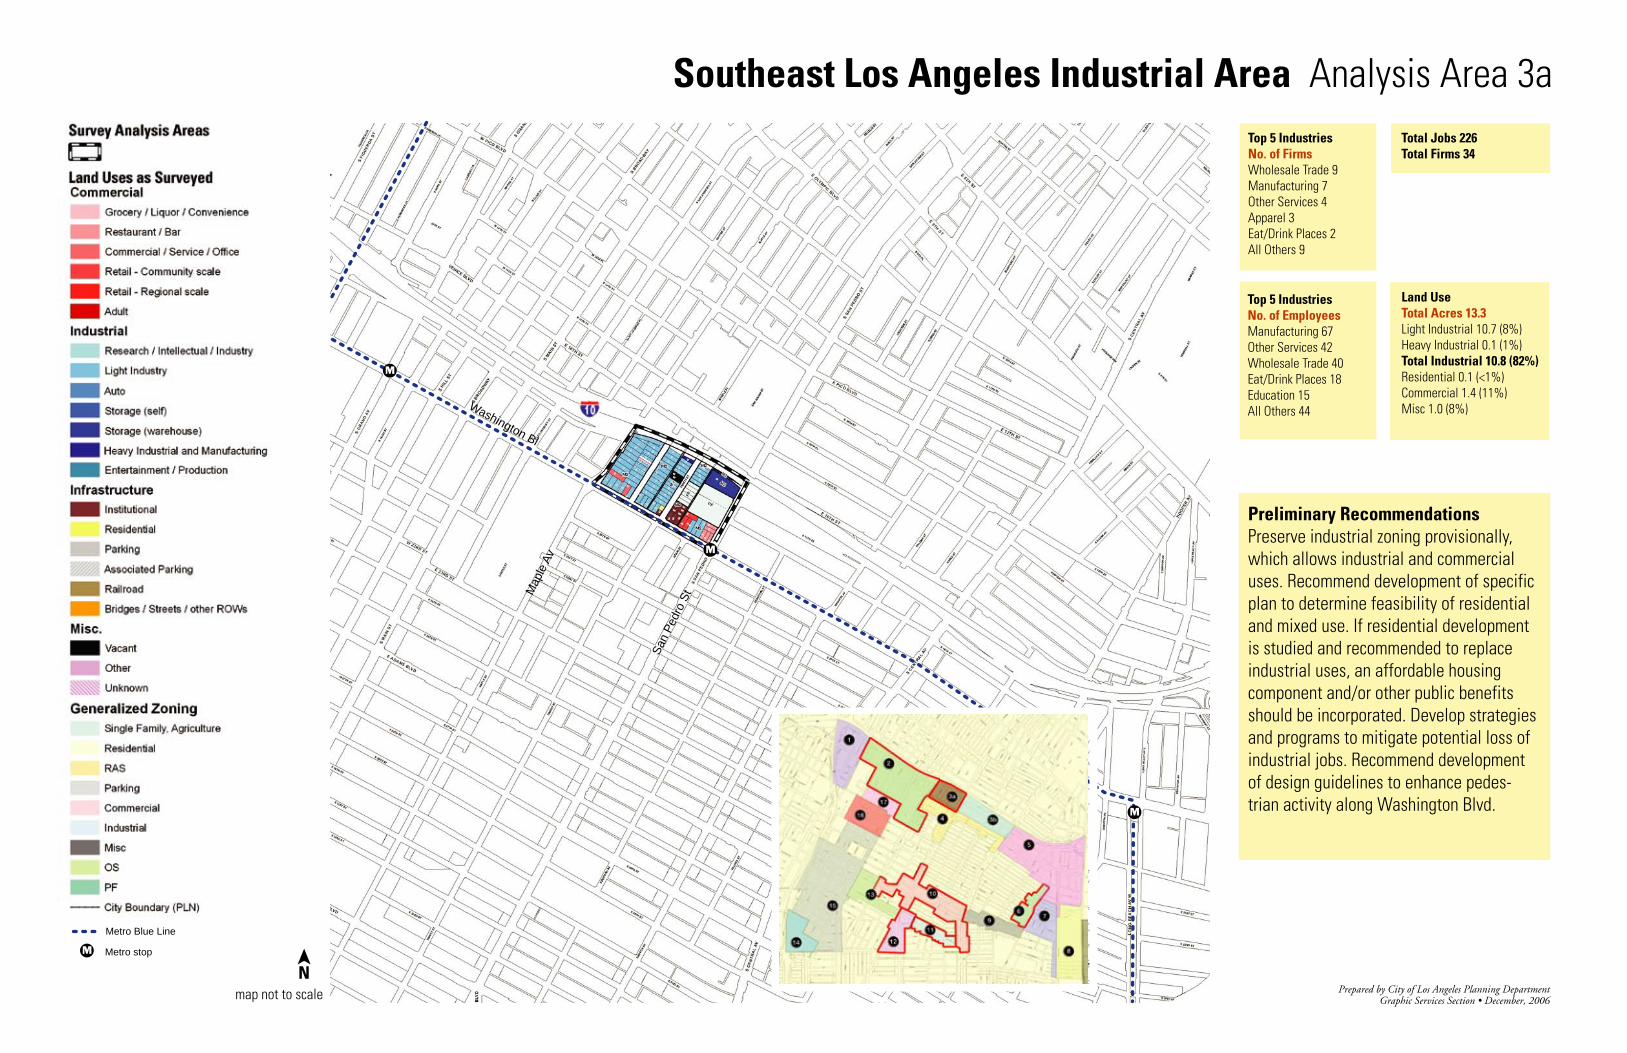
Top 5 IndustriesNo. of FirmsWholesale Trade 9Manufacturing 7Other Services 4Apparel 3Eat/Drink Places 2All Others 9
Total Jobs 226Total Firms 34
Southeast Los Angeles Industrial Area Analysis Area 3a
map not to scale
Land UseTotal Acres 13.3Light Industrial 10.7 (8%)Heavy Industrial 0.1 (1%)Total Industrial 10.8 (82%)Residential 0.1 (<1%)Commercial 1.4 (11%)Misc 1.0 (8%)
Preliminary Recommendations Preserve industrial zoning provisionally, which allows industrial and commercial uses. Recommend development of specific plan to determine feasibility of residential and mixed use. If residential development is studied and recommended to replace industrial uses, an affordable housing component and/or other public benefits should be incorporated. Develop strategies and programs to mitigate potential loss of industrial jobs. Recommend development of design guidelines to enhance pedes-trian activity along Washington Blvd.
N
Top 5 IndustriesNo. of EmployeesManufacturing 67Other Services 42Wholesale Trade 40Eat/Drink Places 18Education 15All Others 44
Metro Blue Line
Metro stopM
M
Washington Bl
Map
le A
v
San
Ped
ro S
t
M
M
M
Prepared by City of Los Angeles Planning DepartmentGraphic Services Section • December, 2006
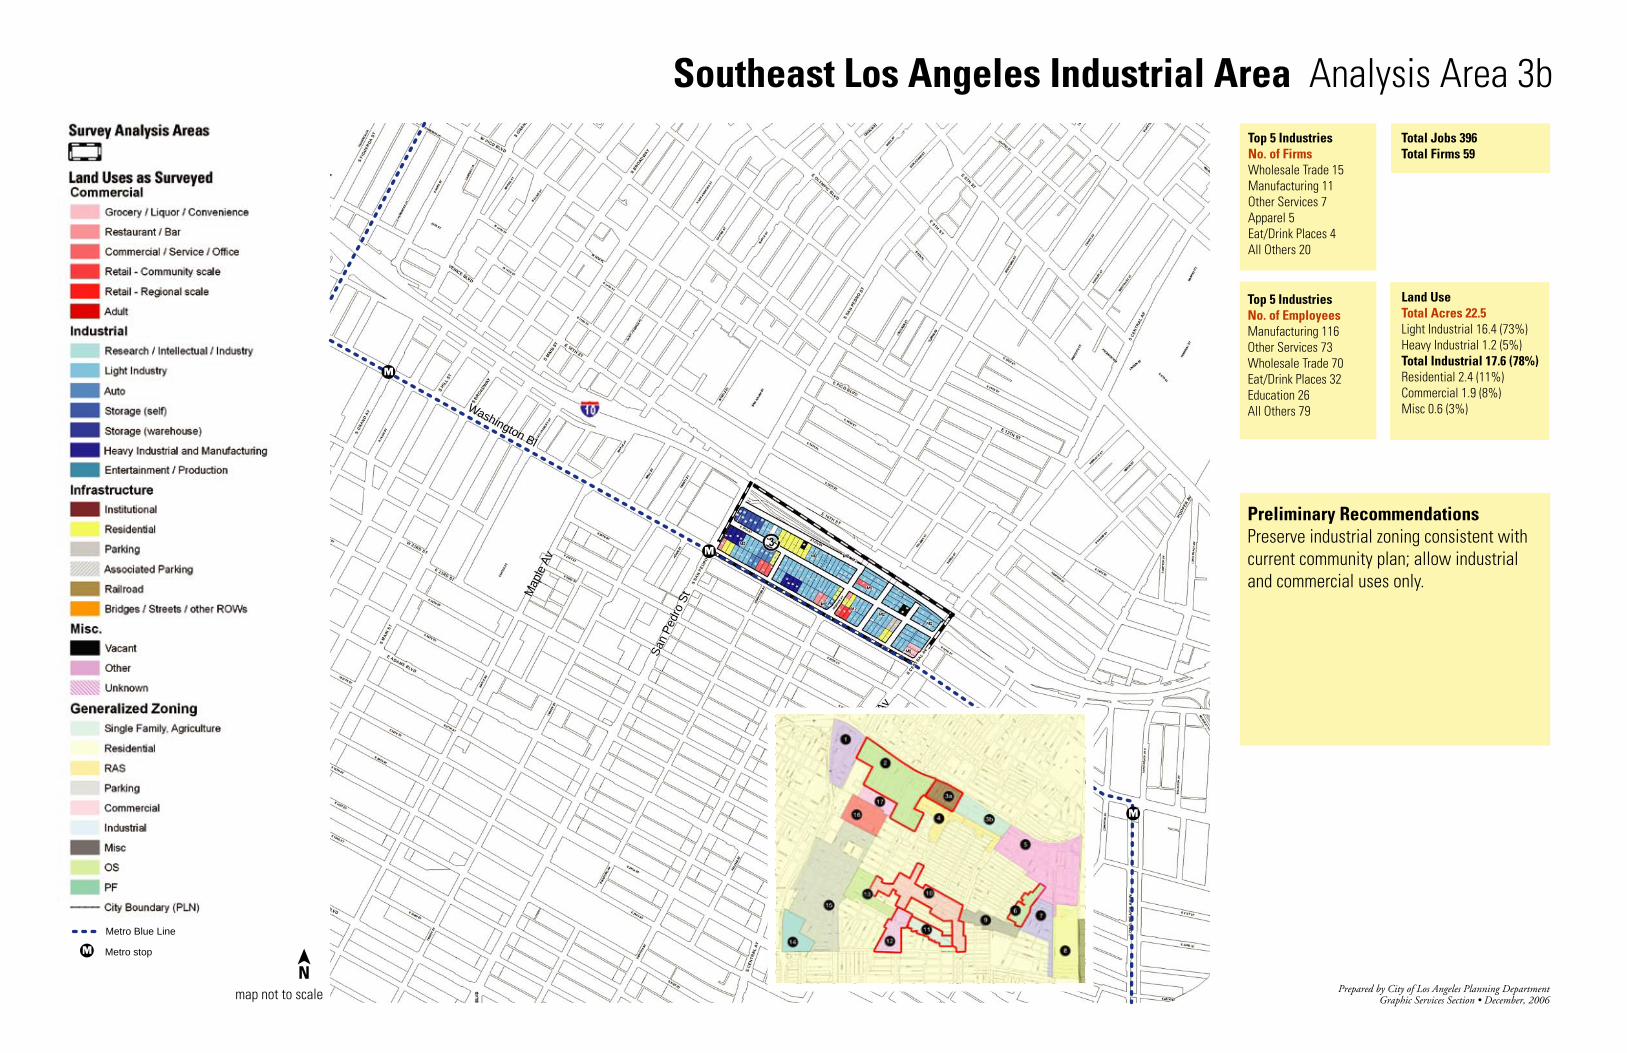
Top 5 IndustriesNo. of FirmsWholesale Trade 15Manufacturing 11Other Services 7Apparel 5Eat/Drink Places 4All Others 20
Total Jobs 396Total Firms 59
Southeast Los Angeles Industrial Area Analysis Area 3b
map not to scale
Land UseTotal Acres 22.5Light Industrial 16.4 (73%)Heavy Industrial 1.2 (5%)Total Industrial 17.6 (78%)Residential 2.4 (11%)Commercial 1.9 (8%)Misc 0.6 (3%)
Preliminary Recommendations Preserve industrial zoning consistent with current community plan; allow industrial and commercial uses only.
N
Top 5 IndustriesNo. of EmployeesManufacturing 116Other Services 73Wholesale Trade 70Eat/Drink Places 32Education 26All Others 79
Metro Blue Line
Metro stopM
M
Washington Bl
Map
le A
v
San
Ped
ro S
t
M
M
M
Cen
tral A
v
Prepared by City of Los Angeles Planning DepartmentGraphic Services Section • December, 2006
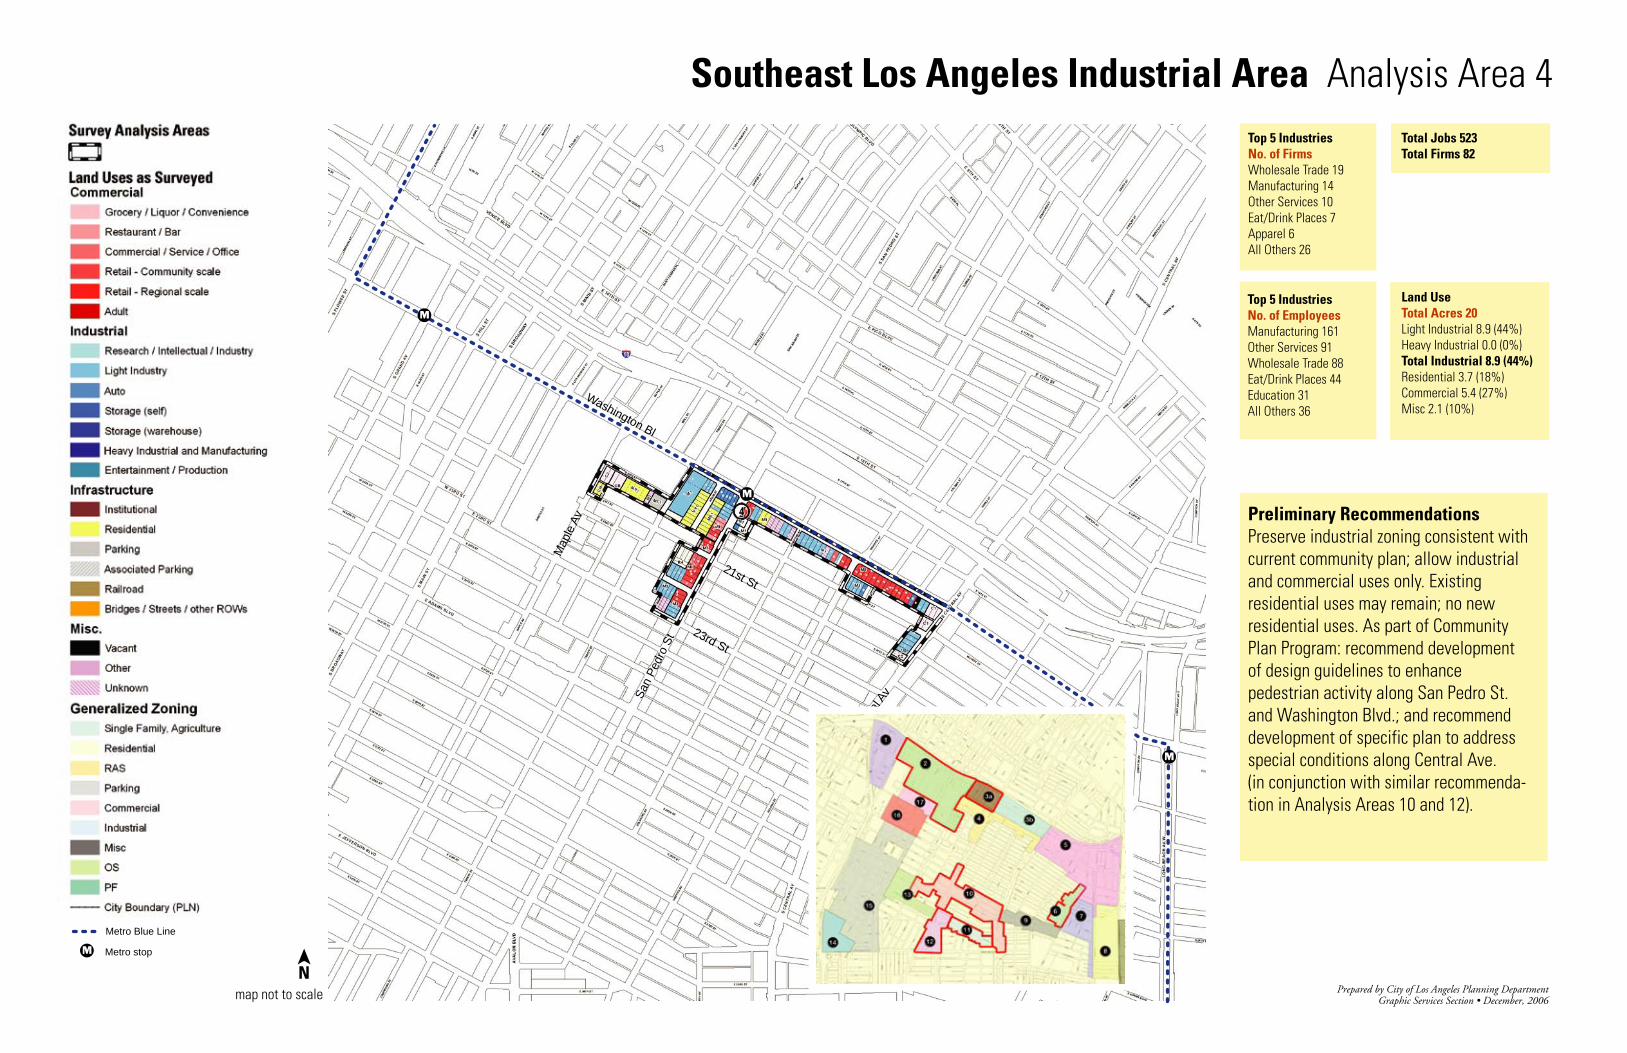
Top 5 IndustriesNo. of FirmsWholesale Trade 19Manufacturing 14Other Services 10Eat/Drink Places 7Apparel 6All Others 26
Total Jobs 523Total Firms 82
Southeast Los Angeles Industrial Area Analysis Area 4
map not to scale
Land UseTotal Acres 20Light Industrial 8.9 (44%)Heavy Industrial 0.0 (0%)Total Industrial 8.9 (44%)Residential 3.7 (18%)Commercial 5.4 (27%)Misc 2.1 (10%)
Preliminary Recommendations Preserve industrial zoning consistent with current community plan; allow industrial and commercial uses only. Existing residential uses may remain; no new residential uses. As part of Community Plan Program: recommend development of design guidelines to enhance pedestrian activity along San Pedro St. and Washington Blvd.; and recommend development of specific plan to address special conditions along Central Ave. (in conjunction with similar recommenda-tion in Analysis Areas 10 and 12).
N
Top 5 IndustriesNo. of EmployeesManufacturing 161Other Services 91Wholesale Trade 88Eat/Drink Places 44Education 31All Others 36
Metro Blue Line
Metro stop
Washington Bl
Map
le A
v
Cen
tral A
v
23rd St
21st St
San
Ped
ro S
t
M
M
M
M
Prepared by City of Los Angeles Planning DepartmentGraphic Services Section • December, 2006
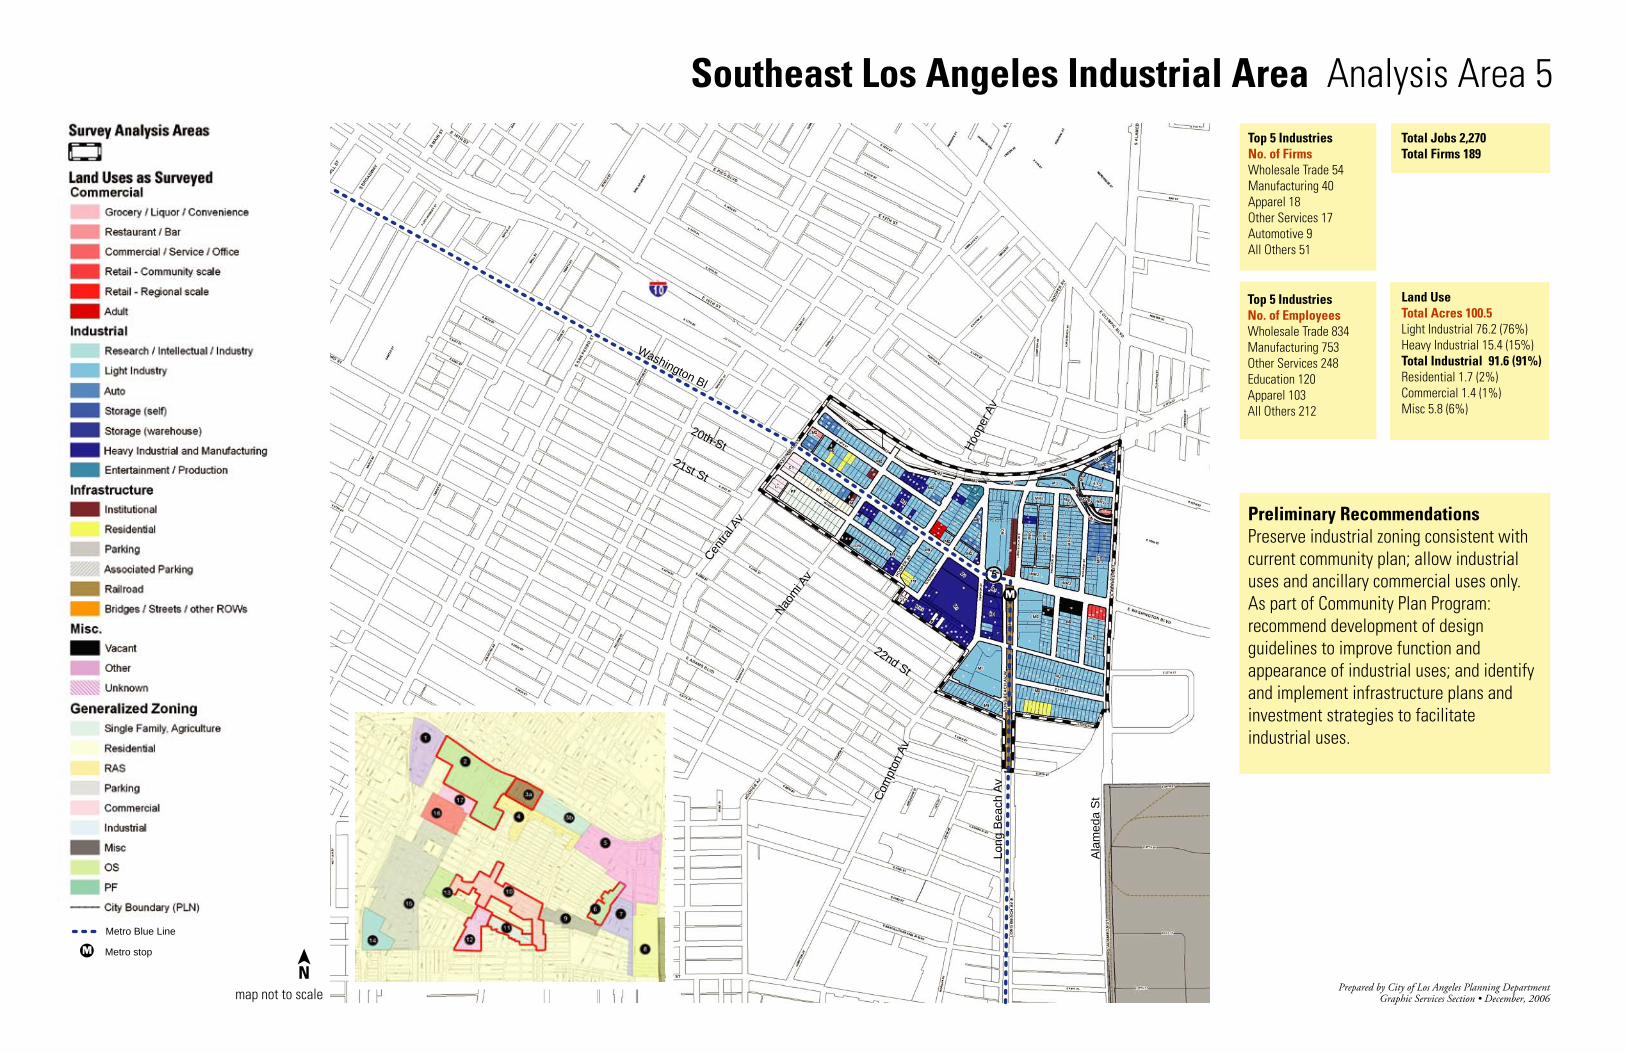
Top 5 IndustriesNo. of FirmsWholesale Trade 54Manufacturing 40Apparel 18Other Services 17Automotive 9All Others 51
Total Jobs 2,270Total Firms 189
Southeast Los Angeles Industrial Area Analysis Area 5
map not to scale
Land UseTotal Acres 100.5Light Industrial 76.2 (76%)Heavy Industrial 15.4 (15%)Total Industrial 91.6 (91%)Residential 1.7 (2%)Commercial 1.4 (1%)Misc 5.8 (6%)
Preliminary Recommendations Preserve industrial zoning consistent with current community plan; allow industrial uses and ancillary commercial uses only. As part of Community Plan Program: recommend development of design guidelines to improve function and appearance of industrial uses; and identify and implement infrastructure plans and investment strategies to facilitate industrial uses.
N
Top 5 IndustriesNo. of EmployeesWholesale Trade 834Manufacturing 753Other Services 248Education 120Apparel 103All Others 212
Metro Blue Line
Metro stop
Cen
tral A
v
Nao
mi A
v
Com
pton
Av
22nd St
21st St
20th St
Washington Bl
Hoo
per A
vLo
ng B
each
Av
Ala
med
a S
t
M
M
Prepared by City of Los Angeles Planning DepartmentGraphic Services Section • December, 2006
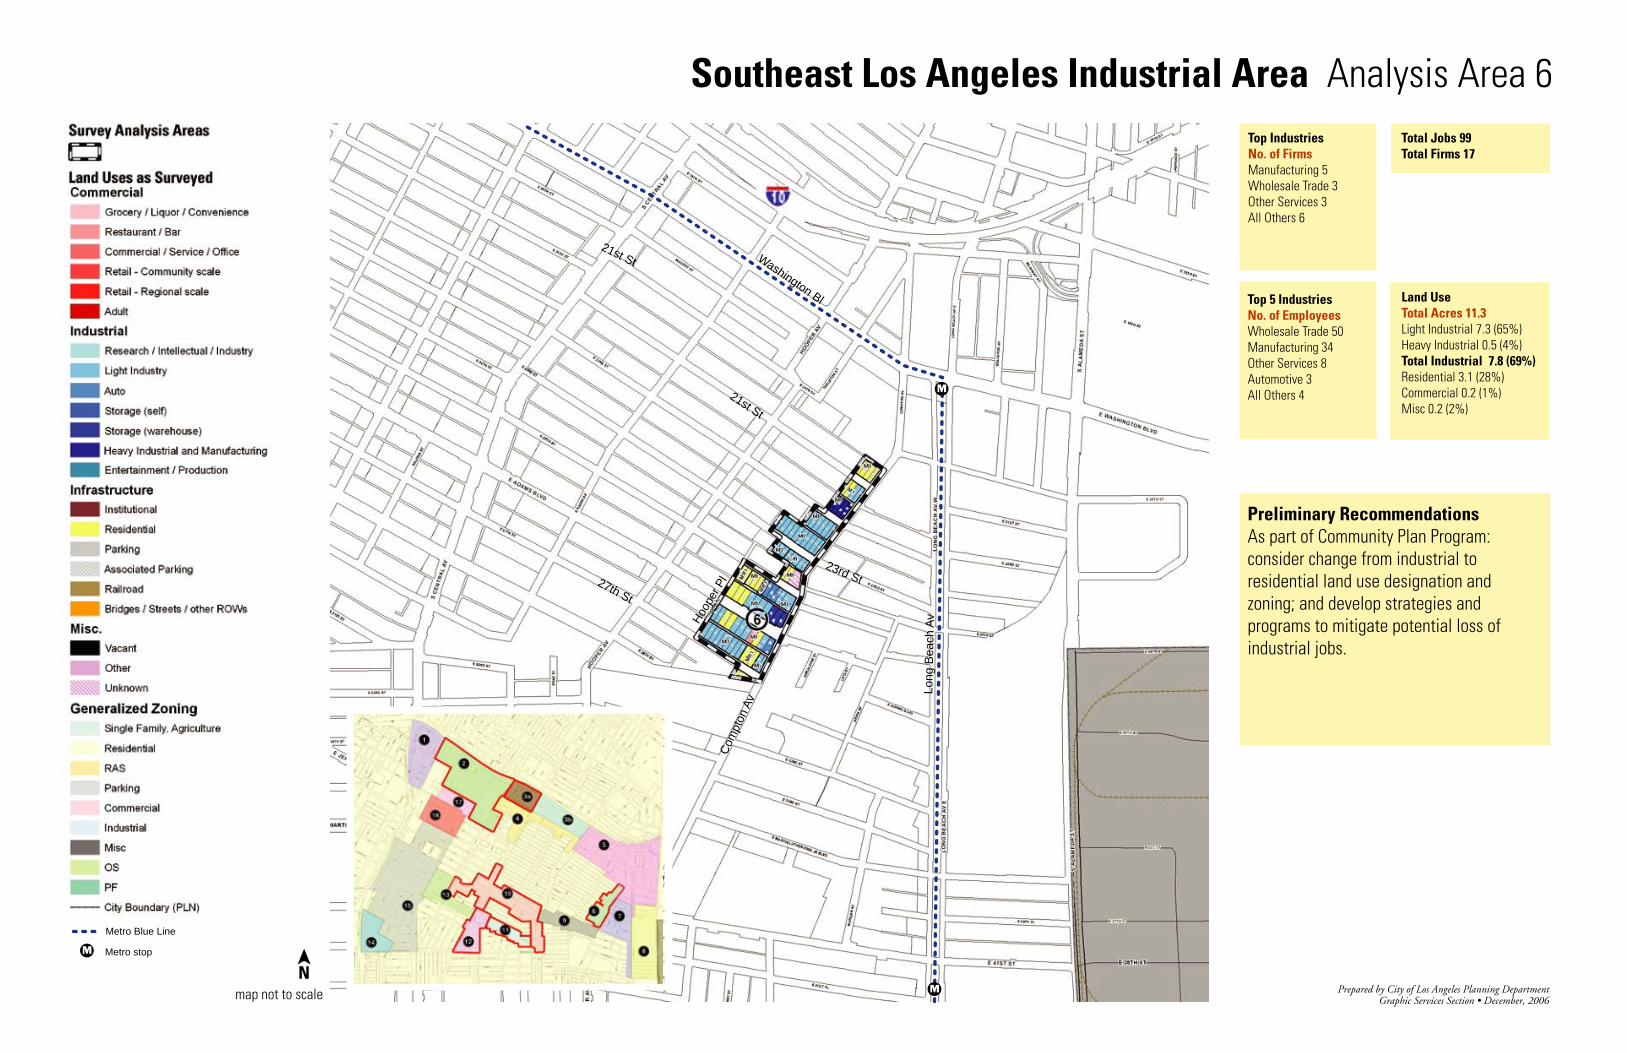
Top IndustriesNo. of FirmsManufacturing 5Wholesale Trade 3Other Services 3All Others 6
Total Jobs 99Total Firms 17
Southeast Los Angeles Industrial Area Analysis Area 6
map not to scale
Land UseTotal Acres 11.3Light Industrial 7.3 (65%)Heavy Industrial 0.5 (4%)Total Industrial 7.8 (69%)Residential 3.1 (28%)Commercial 0.2 (1%)Misc 0.2 (2%)
Preliminary Recommendations As part of Community Plan Program: consider change from industrial to residential land use designation and zoning; and develop strategies and programs to mitigate potential loss of industrial jobs.
N
Top 5 IndustriesNo. of EmployeesWholesale Trade 50Manufacturing 34Other Services 8Automotive 3All Others 4
Metro Blue Line
Metro stop
Analysis Areas 5,8,9,13,14,15,16,17:
Preserve industrial zoning consistent with current community plan; allow industrial uses and ancillary commercial uses only. As part of Community Plan Program: recommend development of design guidelines to improve function and appearance of industrial uses; and identify and implement infrastruc-ture plans and investment strategies to facilitate industrial uses.
Analysis Areas 6, 11:
As part of Community Plan Program: consider change from industrial to residential land use designation and zoning; and develop strategies and programs to mitigate potential loss of industrial jobs.
Analysis Area 7:
Preserve industrial zoning consistent with current community plan; allow industrial and ancillary commercial uses only. As part of Community Plan Program: consider changes to land use designation and zoning, and/or development of design guidelines that provide a better transition between residential and industrial uses.
Analysis Areas 10, 12:
M
M
M
M
Com
pton
Av
21st St Washington Bl
Long
Bea
ch A
vHoo
per P
l27th St
21st St
23rd St
Prepared by City of Los Angeles Planning DepartmentGraphic Services Section • December, 2006
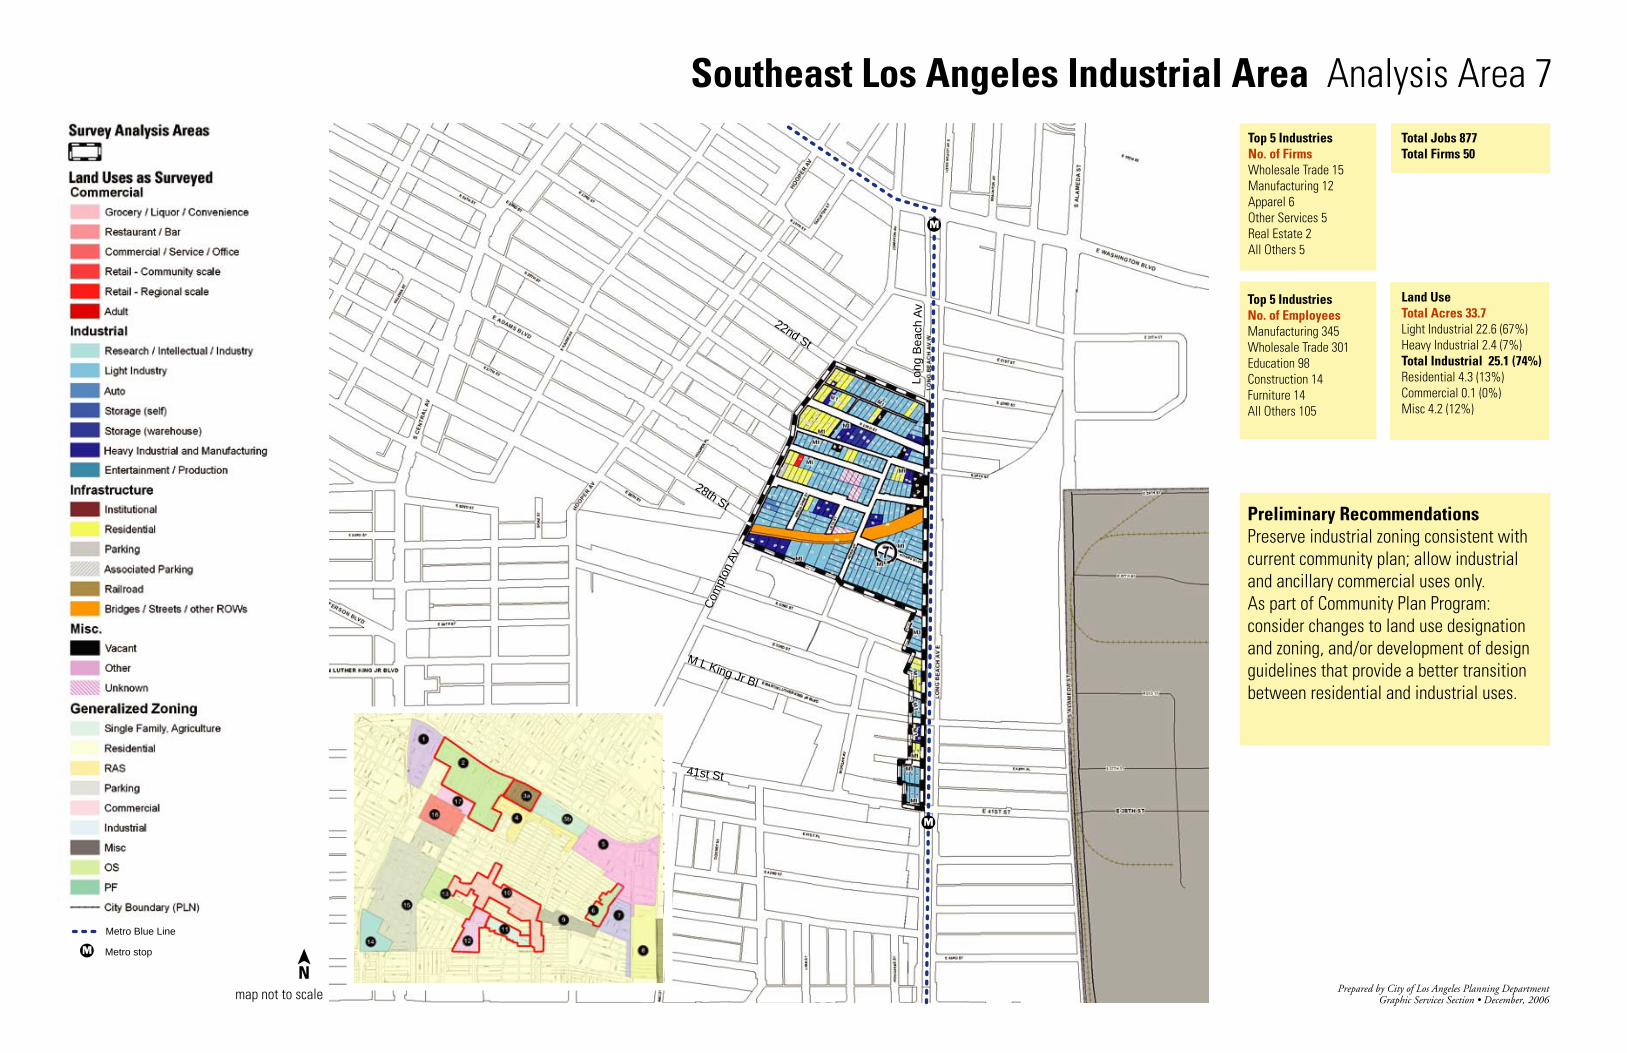
Top 5 IndustriesNo. of FirmsWholesale Trade 15Manufacturing 12Apparel 6Other Services 5Real Estate 2All Others 5
Total Jobs 877Total Firms 50
Southeast Los Angeles Industrial Area Analysis Area 7
map not to scale
Land UseTotal Acres 33.7Light Industrial 22.6 (67%)Heavy Industrial 2.4 (7%)Total Industrial 25.1 (74%)Residential 4.3 (13%)Commercial 0.1 (0%)Misc 4.2 (12%)
Preliminary Recommendations Preserve industrial zoning consistent with current community plan; allow industrial and ancillary commercial uses only. As part of Community Plan Program: consider changes to land use designation and zoning, and/or development of design guidelines that provide a better transition between residential and industrial uses.
N
Top 5 IndustriesNo. of EmployeesManufacturing 345Wholesale Trade 301Education 98Construction 14Furniture 14All Others 105
Metro Blue Line
Metro stopM
M
M
Com
pton
Av
Long
Bea
ch A
v
22nd St
28th St
M L King Jr Bl
41st St
Prepared by City of Los Angeles Planning DepartmentGraphic Services Section • December, 2006
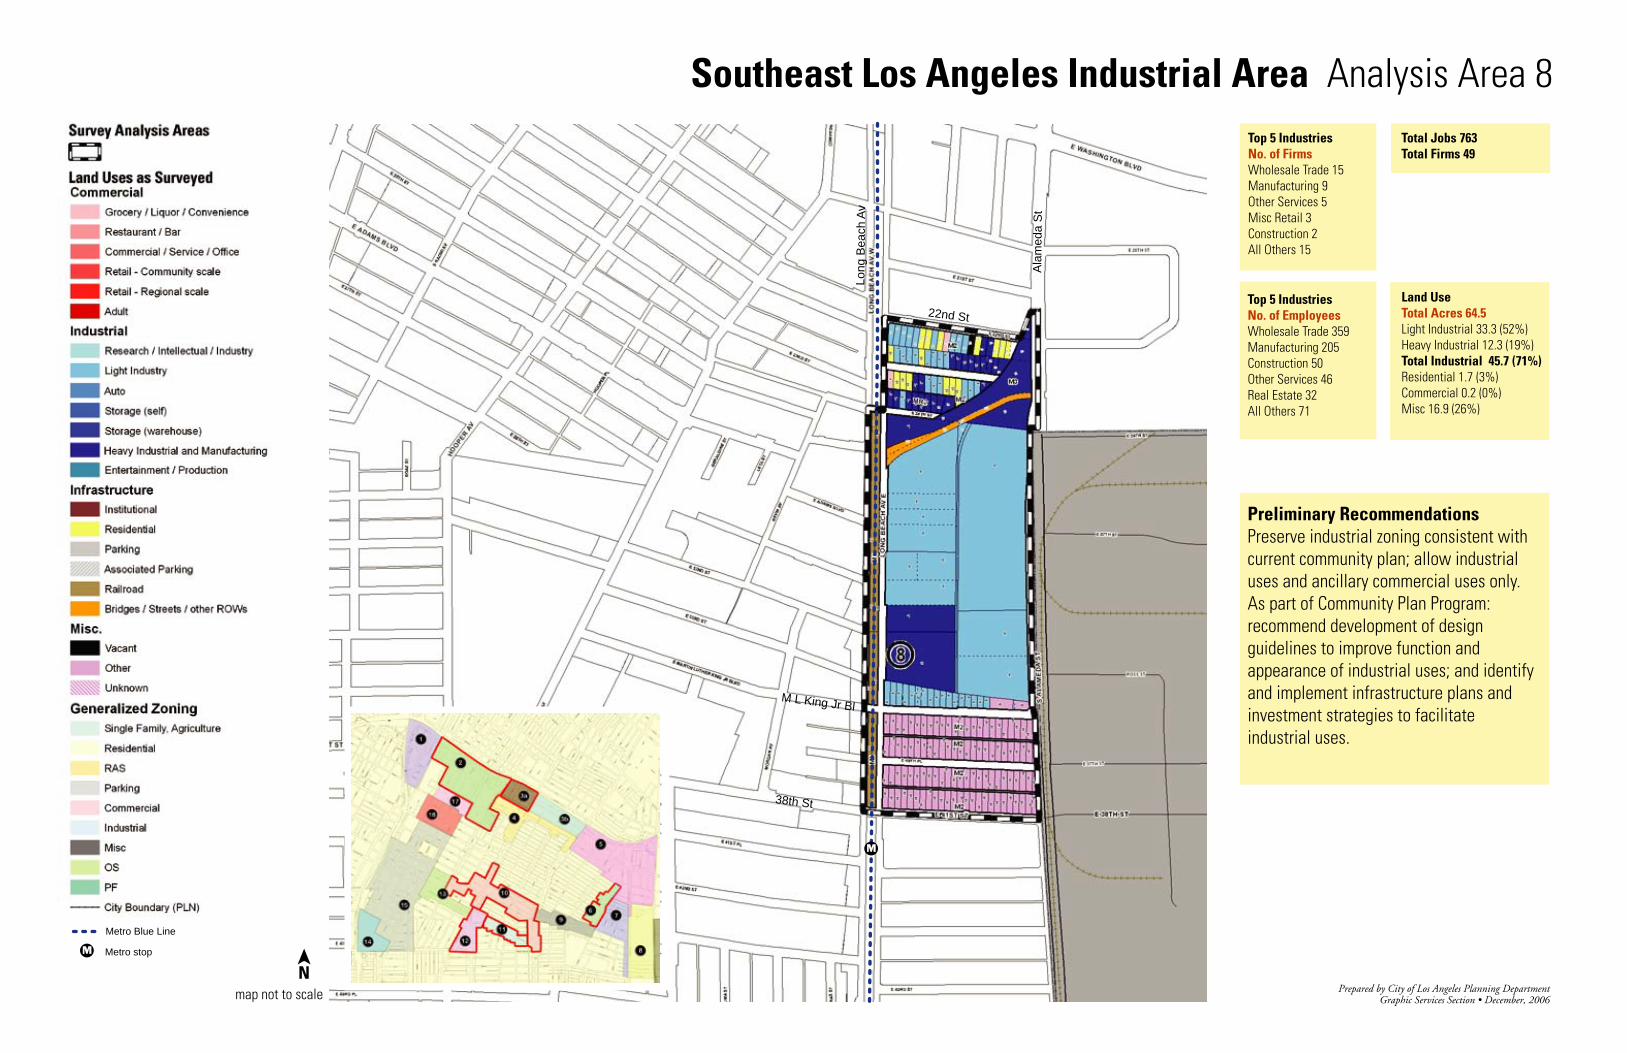
Top 5 IndustriesNo. of FirmsWholesale Trade 15Manufacturing 9Other Services 5Misc Retail 3Construction 2All Others 15
Total Jobs 763Total Firms 49
Southeast Los Angeles Industrial Area Analysis Area 8
map not to scale
Land UseTotal Acres 64.5Light Industrial 33.3 (52%)Heavy Industrial 12.3 (19%)Total Industrial 45.7 (71%)Residential 1.7 (3%)Commercial 0.2 (0%)Misc 16.9 (26%)
Preliminary Recommendations Preserve industrial zoning consistent with current community plan; allow industrial uses and ancillary commercial uses only. As part of Community Plan Program: recommend development of design guidelines to improve function and appearance of industrial uses; and identify and implement infrastructure plans and investment strategies to facilitate industrial uses.
N
Top 5 IndustriesNo. of EmployeesWholesale Trade 359Manufacturing 205Construction 50Other Services 46Real Estate 32All Others 71
Metro Blue Line
Metro stop
M L King Jr Bl
38th St
22nd St
Long
Bea
ch A
v
Ala
med
a S
t
M
M
M
M
Prepared by City of Los Angeles Planning DepartmentGraphic Services Section • December, 2006

Top 5 IndustriesNo. of FirmsWholesale Trade 2Manufacturing 2Other Services 2Furniture 1Automotive 1All Others 6
Total Jobs 108Total Firms 14
Southeast Los Angeles Industrial Area Analysis Area 9
map not to scale
Land UseTotal Acres 23.9Light Industrial 13.1 (55%)Heavy Industrial 3.6 (15%)Total Industrial 16.7 (70%)Residential 1.3 (6%)Commercial 0.5 (2%)Misc 5.4 (23%)
Preliminary Recommendations Preserve industrial zoning consistent with current community plan; allow industrial uses and ancillary commercial uses only. As part of Community Plan Program: recommend development of design guidelines to improve function and appearance of industrial uses; and identify and implement infrastructure plans and investment strategies to facilitate industrial uses.
N
Top 5 IndustriesNo. of EmployeesManufacturing 43Wholesale Trade 30Other Services 22Apparel 6Furniture 4All Others 3
Metro Blue Line
Metro stop
Long
Bea
ch A
v
28th St
Hoo
per A
v
Com
pton
Av
32nd StC
entr
al A
v
M
M
M
Prepared by City of Los Angeles Planning DepartmentGraphic Services Section • December, 2006
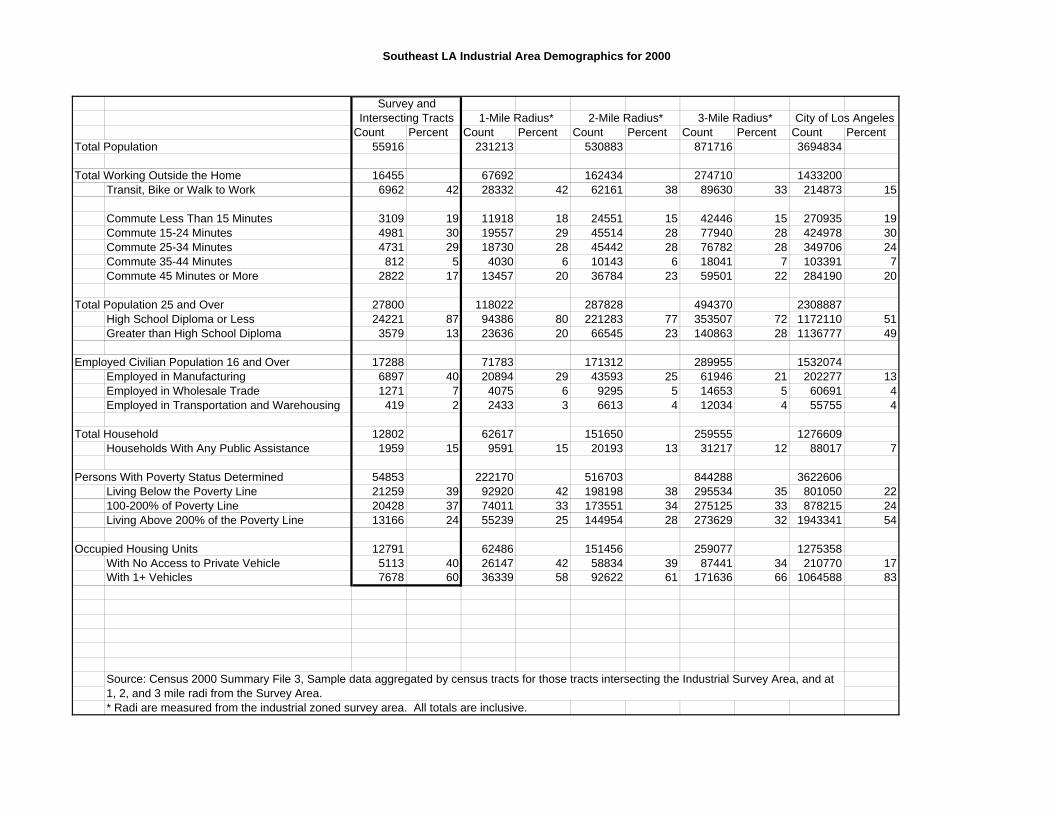
Southeast LA Industrial Area Demographics for 2000
Count Percent Count Percent Count Percent Count Percent Count PercentTotal Population 55916 231213 530883 871716 3694834
Total Working Outside the Home 16455 67692 162434 274710 1433200Transit, Bike or Walk to Work 6962 42 28332 42 62161 38 89630 33 214873 15
Commute Less Than 15 Minutes 3109 19 11918 18 24551 15 42446 15 270935 19Commute 15-24 Minutes 4981 30 19557 29 45514 28 77940 28 424978 30Commute 25-34 Minutes 4731 29 18730 28 45442 28 76782 28 349706 24Commute 35-44 Minutes 812 5 4030 6 10143 6 18041 7 103391 7Commute 45 Minutes or More 2822 17 13457 20 36784 23 59501 22 284190 20
Total Population 25 and Over 27800 118022 287828 494370 2308887High School Diploma or Less 24221 87 94386 80 221283 77 353507 72 1172110 51Greater than High School Diploma 3579 13 23636 20 66545 23 140863 28 1136777 49
Employed Civilian Population 16 and Over 17288 71783 171312 289955 1532074Employed in Manufacturing 6897 40 20894 29 43593 25 61946 21 202277 13Employed in Wholesale Trade 1271 7 4075 6 9295 5 14653 5 60691 4Employed in Transportation and Warehousing 419 2 2433 3 6613 4 12034 4 55755 4
Total Household 12802 62617 151650 259555 1276609Households With Any Public Assistance 1959 15 9591 15 20193 13 31217 12 88017 7
Persons With Poverty Status Determined 54853 222170 516703 844288 3622606Living Below the Poverty Line 21259 39 92920 42 198198 38 295534 35 801050 22100-200% of Poverty Line 20428 37 74011 33 173551 34 275125 33 878215 24Living Above 200% of the Poverty Line 13166 24 55239 25 144954 28 273629 32 1943341 54
Occupied Housing Units 12791 62486 151456 259077 1275358With No Access to Private Vehicle 5113 40 26147 42 58834 39 87441 34 210770 17With 1+ Vehicles 7678 60 36339 58 92622 61 171636 66 1064588 83
* Radi are measured from the industrial zoned survey area. All totals are inclusive.
Survey and
Source: Census 2000 Summary File 3, Sample data aggregated by census tracts for those tracts intersecting the Industrial Survey Area, and at 1, 2, and 3 mile radi from the Survey Area.
City of Los AngelesIntersecting Tracts 1-Mile Radius* 2-Mile Radius* 3-Mile Radius*