Embed Size (px)
Citation preview
Southern Association of Workers’ Compensation Administrators
Convention 2007
A Texas Perspective Lisa Corless
Texas Mutual Insurance Company
Agenda Introduction Texas Workers’ Comp System The Case for Change House Bill 7: Changes the System Health Care Networks Other Texas initiative; eBilling What Does the Future Hold? Questions
About Texas Mutual
• Texas Mutual has been serving the state of Texas since 1991 after the Texas Legislature first chartered the Texas Workers’ Compensation Fund.
• In 2001, the Legislature redesigned the company’s charter and the company was renamed Texas Mutual Insurance Company.
• Texas Mutual is the largest workers’ compensation underwriter in Texas; underwrites approximately 28% of the Texas market.
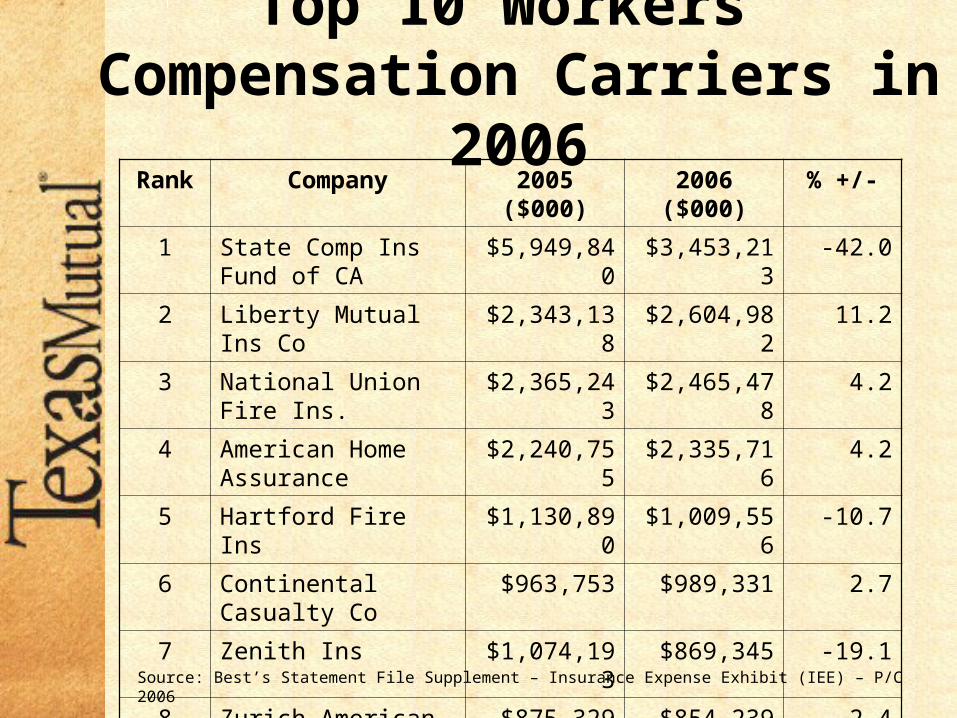
Top 10 Workers’ Compensation Carriers in 2006
Rank Company 2005 ($000) 2006 ($000) % +/-
1 State Comp Ins Fund of CA
$5,949,840 $3,453,213 -42.0
2 Liberty Mutual Ins Co $2,343,138 $2,604,982 11.2
3 National Union Fire Ins. $2,365,243 $2,465,478 4.2
4 American Home Assurance
$2,240,755 $2,335,716 4.2
5 Hartford Fire Ins $1,130,890 $1,009,556 -10.7
6 Continental Casualty Co $963,753 $989,331 2.7
7 Zenith Ins $1,074,193 $869,345 -19.1
8 Zurich American Ins $875,329 $854,239 -2.4
9 Hartford Accident $890,815 $795,238 -10.7
10 Texas Mutual Ins Co $696,850 $740,023 6.2Source: Best’s Statement File Supplement – Insurance Expense Exhibit (IEE) – P/C 2006
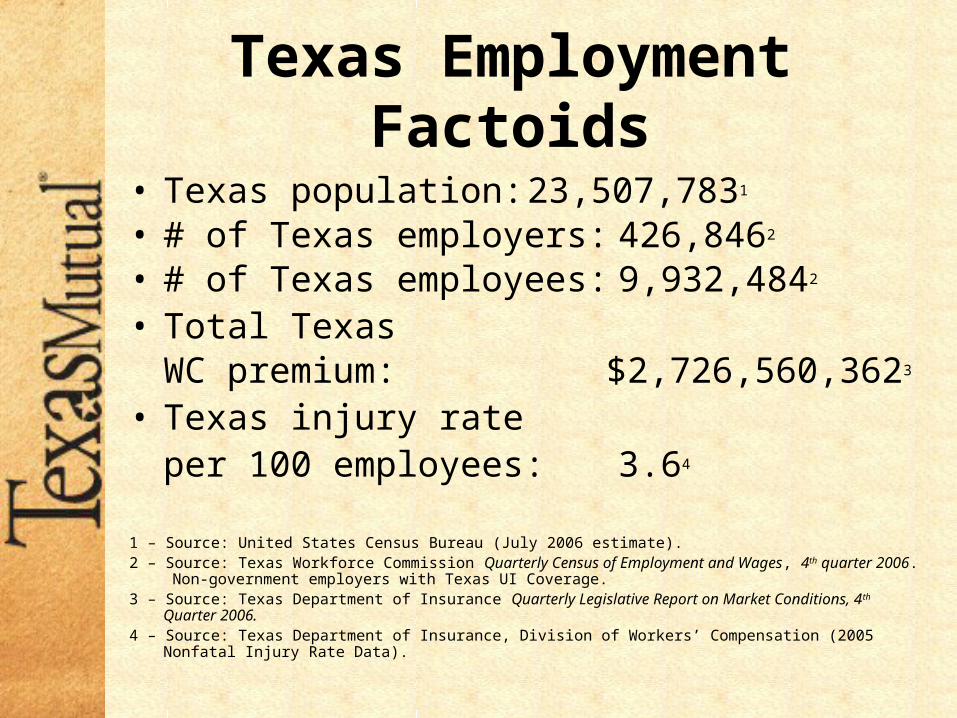
Texas Employment Factoids
• Texas population: 23,507,7831
• # of Texas employers: 426,8462
• # of Texas employees: 9,932,4842
• Total TexasWC premium: $2,726,560,3623
• Texas injury rateper 100 employees: 3.64
1 – Source: United States Census Bureau (July 2006 estimate).2 – Source: Texas Workforce Commission Quarterly Census of Employment and Wages, 4th quarter 2006. Non-
government employers with Texas UI Coverage.3 – Source: Texas Department of Insurance Quarterly Legislative Report on Market Conditions, 4 th Quarter 2006.4 – Source: Texas Department of Insurance, Division of Workers’ Compensation (2005 Nonfatal Injury Rate Data).
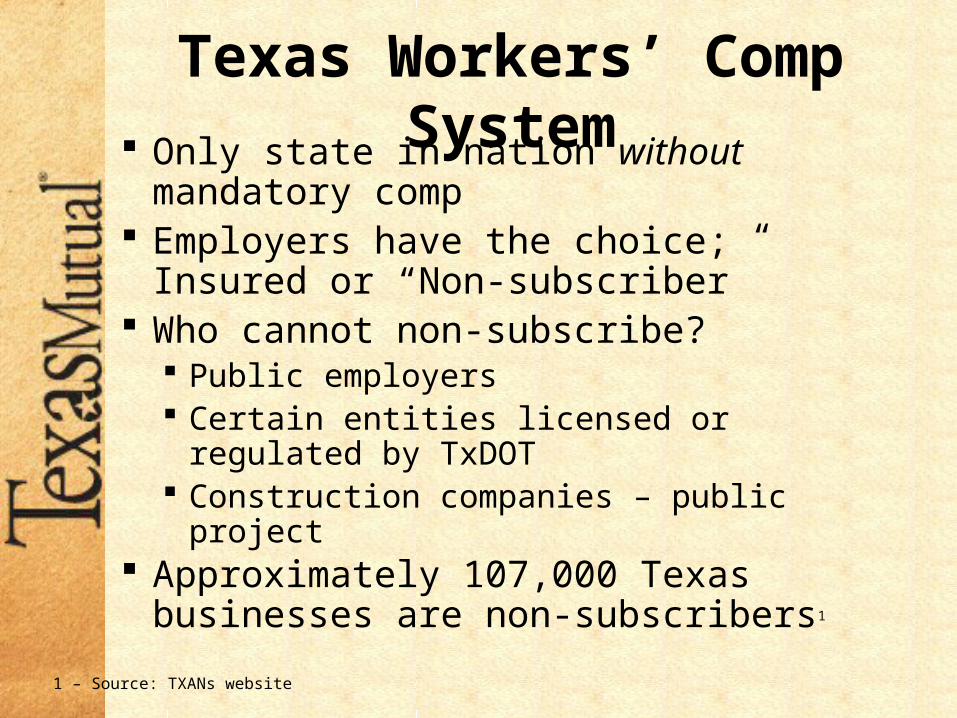
Texas Workers’ Comp System Only state in nation without mandatory
comp Employers have the choice; Insured or
“Non-subscriber” Who cannot non-subscribe?
Public employers Certain entities licensed or regulated by TxDOT Construction companies – public project
Approximately 107,000 Texas businesses are non-subscribers1
1 – Source: TXANs website
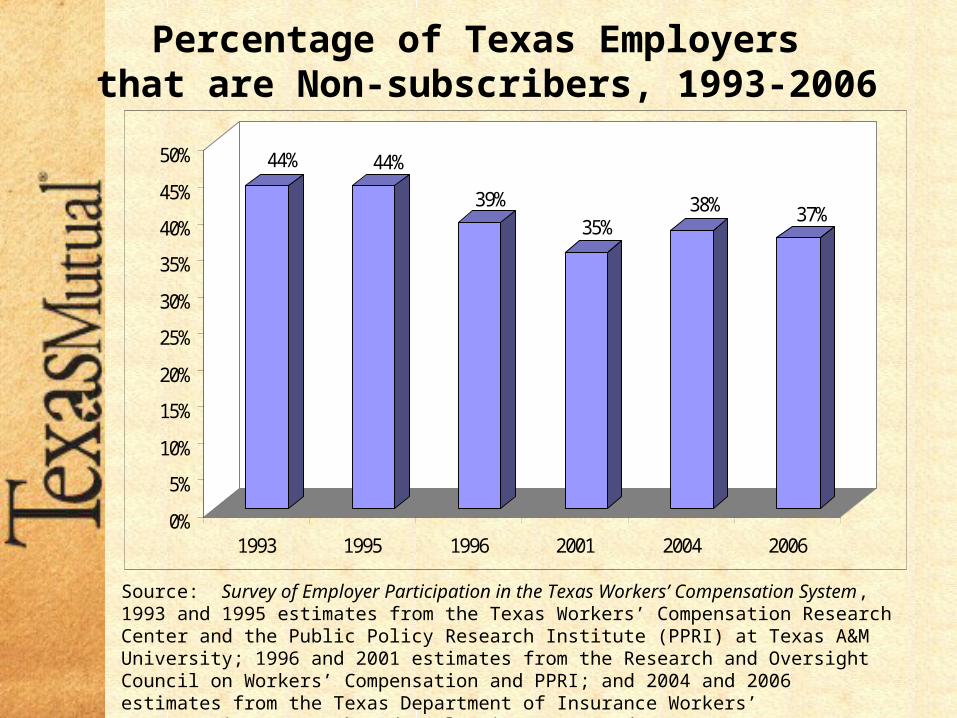
Percentage of Texas Employers that are Non-subscribers, 1993-2006
Source: Survey of Employer Participation in the Texas Workers’ Compensation System, 1993 and 1995 estimates from the Texas Workers’ Compensation Research Center and the Public Policy Research Institute (PPRI) at Texas A&M University; 1996 and 2001 estimates from the Research and Oversight Council on Workers’ Compensation and PPRI; and 2004 and 2006 estimates from the Texas Department of Insurance Workers’ Compensation Research and Evaluation Group and PPRI.
44% 44%
39%
35%38% 37%
0%
5%
10%
15%
20%
25%
30%
35%
40%
45%
50%
1993 1995 1996 2001 2004 2006
The Insured Market
WCRIThe realization of the need for Texas
Workers’ Compensation reform
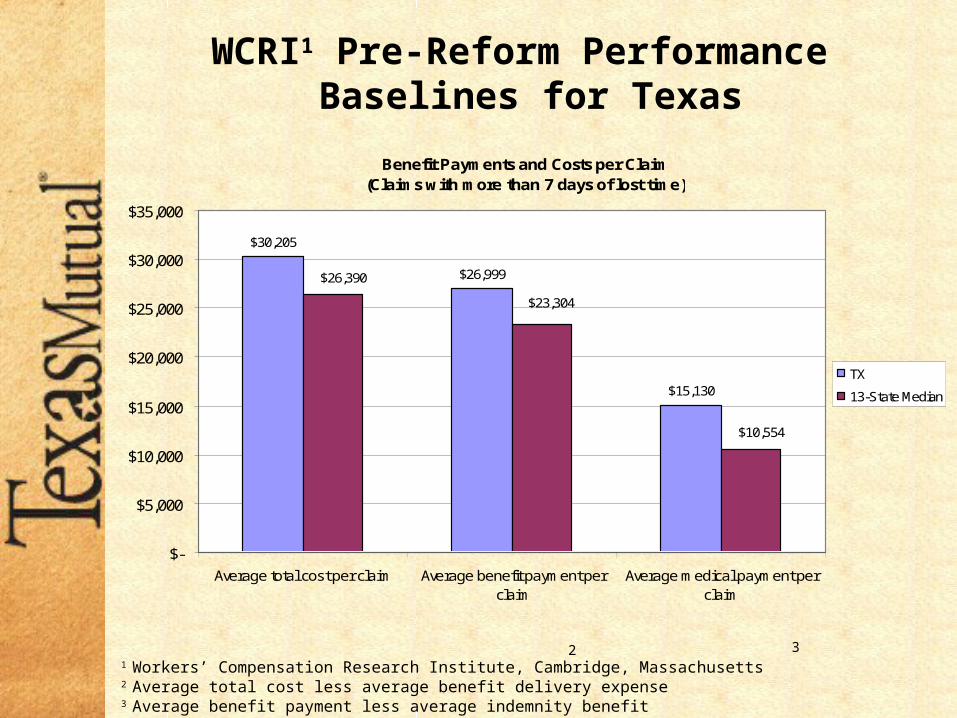
WCRI1 Pre-Reform Performance Baselines for Texas
Benefit Payments and Costs per Claim(Claims with more than 7 days of lost time)
$30,205
$26,999
$15,130
$26,390
$10,554
$23,304
$-
$5,000
$10,000
$15,000
$20,000
$25,000
$30,000
$35,000
Average total cost per claim Average benefit payment perclaim
Average medical payment perclaim
TX
13-State Median
321 Workers’ Compensation Research Institute, Cambridge, Massachusetts2 Average total cost less average benefit delivery expense3 Average benefit payment less average indemnity benefit
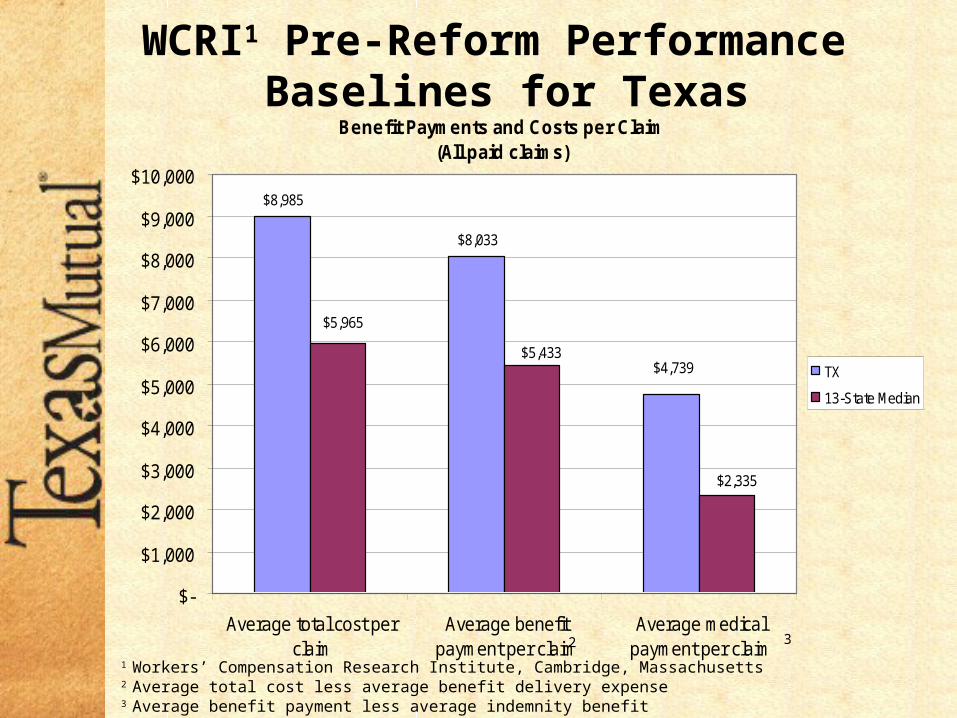
WCRI1 Pre-Reform Performance Baselines for Texas
1 Workers’ Compensation Research Institute, Cambridge, Massachusetts2 Average total cost less average benefit delivery expense3 Average benefit payment less average indemnity benefit
Benefit Payments and Costs per Claim(All paid claims)
$8,985
$8,033
$4,739
$5,965
$2,335
$5,433
$-
$1,000
$2,000
$3,000
$4,000
$5,000
$6,000
$7,000
$8,000
$9,000
$10,000
Average total cost perclaim
Average benefitpayment per claim
Average medicalpayment per claim
TX
13-State Median
2 3
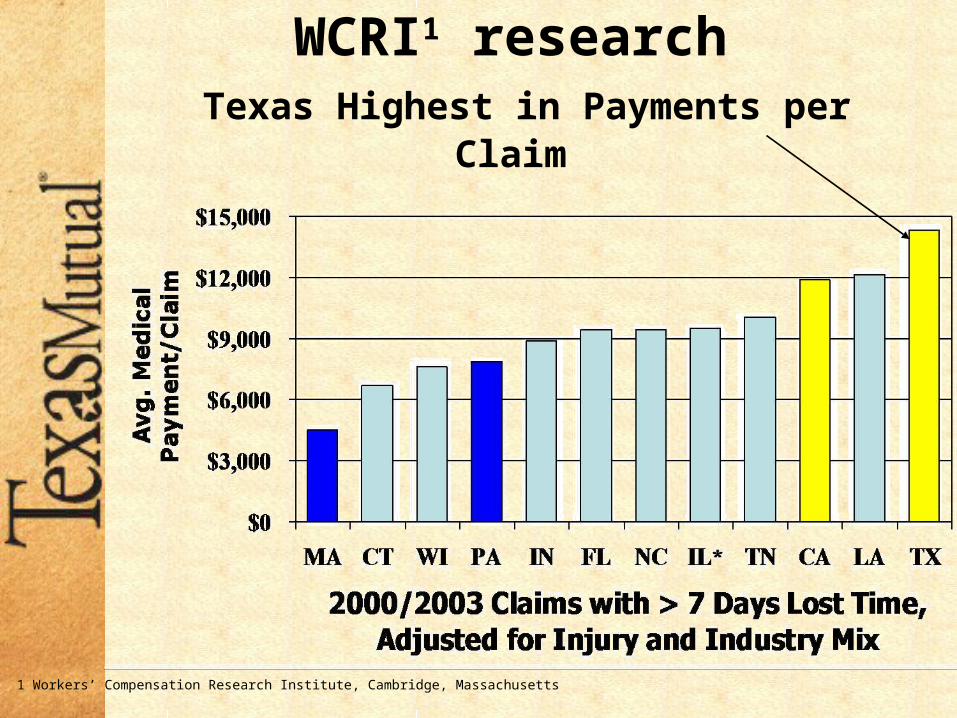
WCRI1 research Texas Highest in Payments per Claim
1 Workers’ Compensation Research Institute, Cambridge, Massachusetts
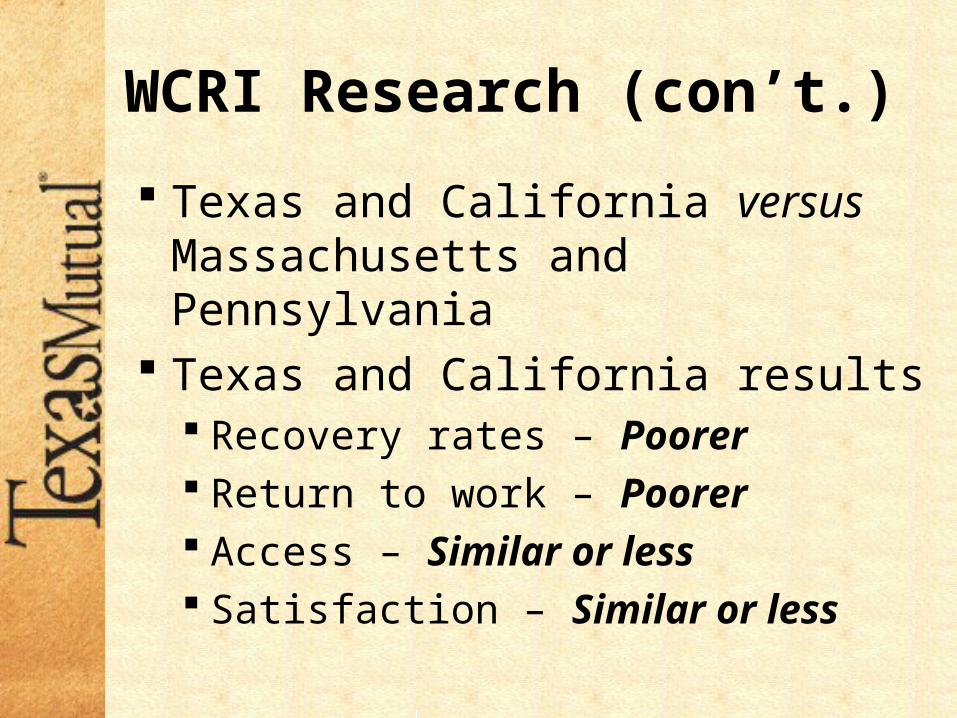
WCRI Research (con’t.)
Texas and California versus Massachusetts and Pennsylvania
Texas and California results Recovery rates – Poorer Return to work – Poorer Access – Similar or less Satisfaction – Similar or less
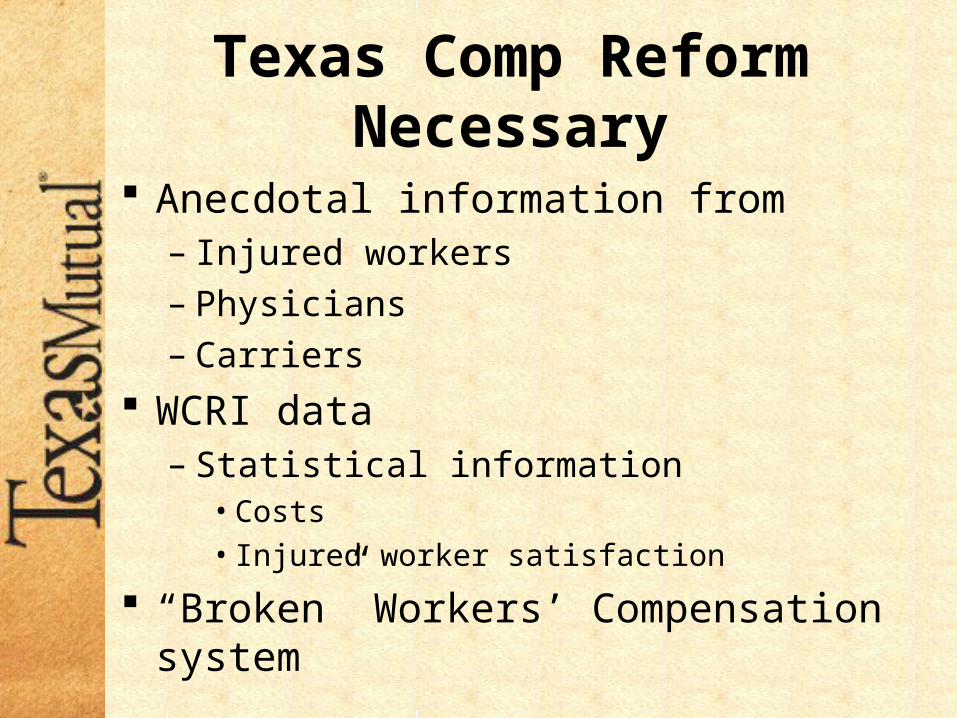
Texas Comp Reform Necessary
Anecdotal information from– Injured workers– Physicians– Carriers
WCRI data – Statistical information
• Costs
• Injured worker satisfaction
“Broken” Workers’ Compensation system
Legislative Session2005
Enacted House Bill 7 Into Law
House Bill 7 System Goals
Improve return to work outcomes for injured workers
• Enhance access and quality of medical care
• Control workers’ compensation costs
• Create a more efficient system
House Bill 7 Overview Introduced Health Care Networks Treating doctors to use treatment and
disability guidelines Emphasis on return to work
Appropriate Stay at work
House Bill 7 Overview (con’t) Performance Based
Oversight Insurance Carrier
Report cards Carriers earn
designations High / Average / Low
Performer
First Report card due August/September 2007
Published on regulator website
Health Care Networks Carriers may establish or contract with
health care networks Employer may elect network Network selects who can serve as
treating doctors Injured worker selects treating doctor from
network
TDI must certify Responsibilities
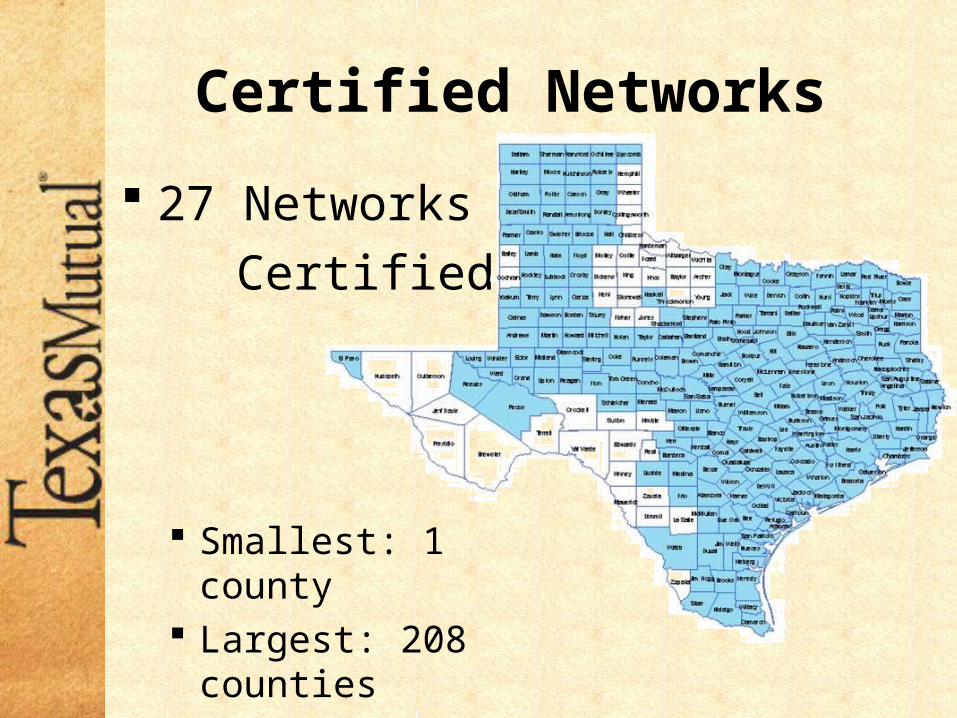
Certified Networks
27 Networks
Certified
Smallest: 1 county Largest: 208 counties
Health Care Networks
First Network Certified late March 2006 Texas Mutual philosophy Most Carriers Adopting “Wait and See
Attitude”
Learning Curve for System Network Report Cards
August/September 2007
Preliminary thoughts on Network efficacy
Other Texas InitiativeseBilling
Texas will become the first state to mandate carrier requirement to accept eBilling from medical providers
Universal format 837 Effective January 1, 2008 eBilling Challenges
– Workers’ Comp is different from Health Care
EFT next!

What does the future hold?
Impact of Networks– Return-to-Work Outcomes
– Total Claim Costs and System Satisfaction
Performance Based Oversight Increased competition for business