Embed Size (px)
Citation preview

Country report
Andualem T. Mengistu, Kiflu G. Molla, and Firew B. Woldeyes
October 2017
SOUTHMOD
ETMOD v1.02014-2016
Ethiopia

Acknowledgements
We thank Andre Decoster and Jukka Pirtila for comments and suggestions in preparation of this country report. We also thank Katrin Gasior and David Mclennan for their support with software and training of users’, respectively. This report draws from and builds on an earlier feasibility study by Mengistu et al. (2015).
Corresponding author: Andualem T. Mengistu ([email protected])
Please cite as
Mengistu, Andualem T., Kiflu G. Molla, and Firew B. Woldeyes (2017). UNU-WIDER SOUTHMOD Country Report: ETMOD v1.0, 2014-2016, UNU-WIDER SOUTHMOD Country Report Series. Helsinki: UNU-WIDER.
About the project
SOUTHMOD – simulating tax and benefit policies for development
SOUTHMOD is a joint project between the United Nations University World Institute for Development Economics Research (UNU-WIDER), the European Union Tax–Benefit Microsimulation Model (EUROMOD) team at the Institute for Social and Economic Research (ISER) at the University of Essex, and Southern African Social Policy Research Insights (SASPRI) in which tax–benefit microsimulation models for selected developing countries are being built. These models enable researchers and policy analysts to calculate, in a comparable manner, the effects of taxes and benefits on household incomes and work incentives for the population of each country.
SOUTHMOD models are currently available for Ecuador (ECUAMOD), Ethiopia (ETMOD), Ghana (GHAMOD), Mozambique (MOZMOD), Namibia (NAMOD), Vietnam (VNMOD), South Africa (SAMOD), Tanzania (TAZMOD), and Zambia (MicroZAMOD). SOUTHMOD models are updated to recent policy systems using national household survey data. This report documents ETMOD, the SOUTHMOD model developed for Ethiopia. This work was carried out by the Ethiopian Development Research Institute (EDRI) in collaboration with the University of Essex and the Department of Economics at KU Leuven, with support from the project partners.
The results presented in this report are derived using ETMOD version 1.0 running on EUROMOD software. The report describes the different tax–benefit policies in place, how the microsimulation model picks up these different provisions, and the database on which the model runs. It concludes with a validation of ETMOD results against external data sources. For further information on access to ETMOD and other SOUTHMOD models see the SOUTHMOD page.
The ETMOD model and its documentation in this country report has been prepared within the UNU-WIDER project on ‘SOUTHMOD—simulating tax and benefit policies for development’, which is part of a larger research project on ‘The economics and politics of taxation and social protection’. For more information, see the SOUTHMOD project page.
Copyright © UNU-WIDER 2017 Information and requests: [email protected] Typescript prepared by Ayesha Chari.
The United Nations University World Institute for Development Economics Research provides economic analysis and policy advice with the aim of promoting sustainable and equitable development. The Institute began operations in 1985 in Helsinki, Finland, as the first research and training centre of the United Nations University. Today it is a unique blend of think tank, research institute, and UN agency—providing a range of services from policy advice to governments as well as freely available original research.
The Institute is funded through income from an endowment fund with additional contributions to its work programme from Denmark, Finland, Sweden, and the United Kingdom.
Katajanokanlaituri 6 B, 00160 Helsinki, Finland
The views expressed in this paper are those of the author(s), and do not necessarily reflect the views of the Institute or the United Nations University, nor the programme/project donors. WIDER does not take any responsibility for results produced by external users of the model.
iii
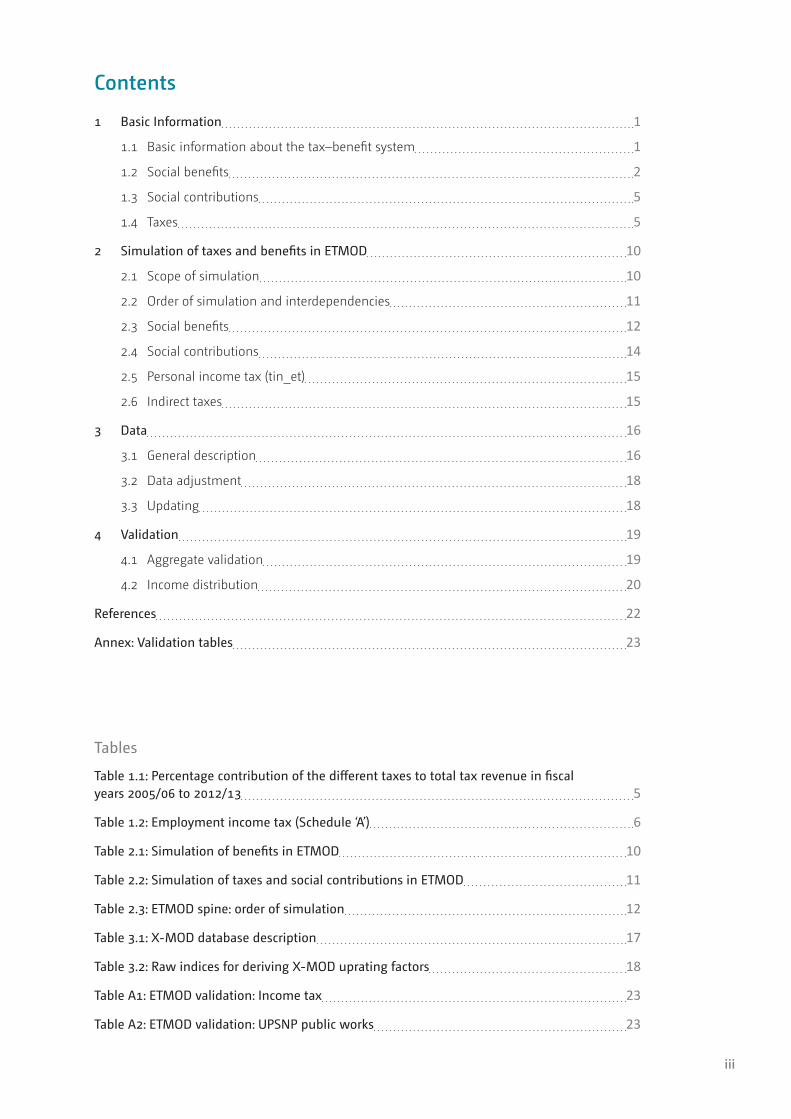
Contents
1 Basic Information 1
1.1 Basic information about the tax–benefit system 1
1.2 Social benefits 2
1.3 Social contributions 5
1.4 Taxes 5
2 Simulation of taxes and benefits in ETMOD 10
2.1 Scope of simulation 10
2.2 Order of simulation and interdependencies 11
2.3 Social benefits 12
2.4 Social contributions 14
2.5 Personal income tax (tin_et) 15
2.6 Indirect taxes 15
3 Data 16
3.1 General description 16
3.2 Data adjustment 18
3.3 Updating 18
4 Validation 19
4.1 Aggregate validation 19
4.2 Income distribution 20
References 22
Annex: Validation tables 23
Tables
Table 1.1: Percentage contribution of the different taxes to total tax revenue in fiscal years 2005/06 to 2012/13 5
Table 1.2: Employment income tax (Schedule ‘A’) 6
Table 2.1: Simulation of benefits in ETMOD 10
Table 2.2: Simulation of taxes and social contributions in ETMOD 11
Table 2.3: ETMOD spine: order of simulation 12
Table 3.1: X-MOD database description 17
Table 3.2: Raw indices for deriving X-MOD uprating factors 18
Table A1: ETMOD validation: Income tax 23
Table A2: ETMOD validation: UPSNP public works 23
iv
Acronyms CPI Consumer price index
CSA Central Statistical Agency
EA Enumeration area
ESS Ethiopia Socioeconomic Survey
ETB Ethiopian Birr
HDI Household disposable income
KTC Ketenas Targeting Committees
MoFED Ministry of Finance and Economic Development
PMT Proxy means test
PPS Probability proportional to size
PSNP Productive Safety Net Programme
SNNPR Southern Nations, Nationalities and Peoples’ Region
SRS Simple random sampling
TOT Turnover tax
UPSNP Urban Productive Safety Net Programme
UPSNP-PW Urban Productive Safety Net Programme public works component
USD US dollar
VAT Value-added tax
Table A3: UPSNP direct support 23
Table A4: ETMOD validation: Pension contribution by government and employee for government staff and armed forces 23
Table A5: ETMOD validation: Value added tax (VAT) revenue (in millions of ETB) 24
Table A6: ETMOD validation: Income inequality 24
Table A7: ETMOD validation: Income distribution across deciles 24
1
1 Basic Information
1.1 Basic information about the tax–benefit system
The organization level of the tax system in Ethiopia depends on the nature of the tax. Payroll tax, self-employment tax, and tax on the profits of sole proprietor businesses are collected at the regional level. Although regions have the legal competence to structure the tax rate for the aforementioned taxes, it has always been the case that the same rates apply in all regions. Other than the tax types mentioned above, the tax rates of all other taxes are set at the federal level and the revenue for all these other taxes, including payroll tax on federal employees, is collected at the national level, and part of the proceeds is then distributed to regions.
Benefits that are part of the social security system (pension, sickness, and disability benefits) are within the competence of the federal government. Other benefit systems, such as the Productive Safety Net Programme (PSNP), are under the purveyor of regions. Although administered by regions, the amount of benefits and the criteria for qualification for PSNP are similar across regions.
In Ethiopia, the fiscal year runs from 8 July to 7 July. For budgetary reasons, main benefit changes usually take place at the beginning of the fiscal year.
The official state pension age is 60 years for both genders. This applies to employees of private organizations and public servants other than the military and police force. For the latter, the retirement age is determined based on the respective legislation regulating the administration of the defence and police forces. The proclamation sets the three types of provisions based on the combination of age and number of service years. First, anyone who has served a minimum of 10 years and reached the age of 60 years is entitled to lifetime retirement pension benefit. Second, employees who have served for a minimum of 25 years can retire at the age of 55 years and receive lifetime pension benefit. Employees who have served 20 years are entitled to retire and start receiving pension benefit when they reach 60 years of age. Finally, if an employee reaches the retirement age of 60 years before completing the 10 years of service required for entitlement of pension benefit, s/he shall be entitled to receive a lump sum retirement gratuity.
There are no benefits based on family composition, such as the presence of dependent children or a lone parent.
The income tax system is an individual system, whereby couples are assessed independently. Employment income tax rates are progressive. Employment income includes any gains in cash or kind from employment by individuals. Exceptions from employment income tax include casual workers who do not work for more than 1 month (in 12 months) for one employer, pension contribution by the employer, and people employed in embassies.
Different income sources are taxed differently. For instance, income from interest on deposits is taxed at the rate of 5 per cent, income from dividend is taxed at the rate of 10 per cent, income derived from rental of property is taxed at the rate of 15 per cent, and income from royalties is taxed at the rate of 5 per cent.
The employment income tax liability is assessed on a monthly basis and employees whose tax is withheld by their employer need not fill a tax return at the end of the fiscal year. All others, whose income is derived from self-employment, rental of property, and so on, need to fill in a tax return annually as their tax liability is assessed on an annual basis.
None of the tax brackets and none of the benefits, with the exception of the PSNP, are indexed to inflation. The amount of benefit, for both conditional and unconditional recipients, under the PSNP is adjusted to the food inflation rate in the closest market in which the recipient is located.
Entitlement to PSNP benefits is based on the poverty status of the household, which is assessed by a community committee. The assessment is verified using a proxy means test (PMT). Finally, household members can decide to exclude themselves from the programme even if they qualify for the support.
2
1.2 Social benefits
A contributory social security system in Ethiopia started in the early 1960s. The current proclamation governing this security system is the Public Servants’ Pension Proclamation No. 714/2011, which establishes the public servants’ pension funds (Civil Service Pension Fund and Military and Police Service Pension Fund). Although there was no coverage for private sector employees until 2011, these employees are currently covered under the Private Sector Employees’ Pension Fund established under the Private Organization Employees’ Pension Proclamation No. 715/2011. This proclamation provides private sector employees with the same benefit structure as civil servants.1
Quite recently, the Ethiopian government introduced the Public Servants’ Pension (Amendment) Proclamation No. 907/2015. The amendment is mainly to include temporary government employees, employed for not fewer than 45 days, under the public employees’ pension scheme. Unlike Proclamation No. 714/2011, which defines a public servant as a permanent public employee, the amendment to this proclamation defines a public servant as a ‘monthly salaried person employed permanently or for definite period or piece of work in a public office, public enterprise or project or program carried out by government’ (Proclamation No. 907/2015, p. 8287).
In this section, we also present descriptions of the pension benefit systems that apply to civil servants and the military and police. To avoid repetition, description of the pension benefit system that applies to private sector employees is not be presented here in detail as, since July 2011, it has been reformed to be the same as the pension benefit system that governs civil servants.
Benefit 1 (Old-age/retirement pension and gratuity): In accordance with Proclamation No. 714/2011, the amount of retirement pension for a public servant is set at 30 per cent of the average salary for the last three years before retirement. For each additional year of service above the required 10 years of service, the retirement pension is increased by 1.25 per cent for a public servant and 1.65 per cent for members of the defence and police forces.2
Benefit 2 (Invalidity and incapacity pension and gratuity): Proclamation No. 714/2011 grants a public servant an invalidity pension payment (of similar amount to normal pension) for life if s/he leaves service after 10 years of service but before the retirement age owing to health problems that prevent him/her from any other gainful employment. On the other hand, if a public servant leaves service before completing 10 years of service owing to health-related problems that prevent him/her from any other gainful employment, s/he is entitled to a lump sum invalidity gratuity payment.
Similarly, public servants who leave service following employment injury (i.e. injury at the workplace) of not less than 10 per cent are entitled to incapacity pension and gratuity payments according to Proclamation No. 714/2011 (pp. 5954–5).
Benefit 3 (Survivors’ pension): If a public servant dies because of employment injury or while receiving pension payments or upon completing 10 years of service, his/her survivors are entitled to pension payments. Specifically, a widow or widower is entitled to 50 per cent of the pension the deceased was or would have been entitled to, and a surviving child below the age of 18 years is entitled to 20 per cent of the pension. Similarly, each parent of the deceased public servant is entitled to 15 per cent of the pension (Proclamation No. 714/2011, pp. 5959–61).
Benefit 4 (Private sector employees’ pension): As indicated earlier, the Private Organization Employees’ Pension Proclamation No. 715/2011 provides the same detailed arrangement regarding pension benefits and gratuity as the public pension scheme that applies to civil servants.
Benefit 5 (Sick leave benefits): According to the Labour Proclamation No. 377/2003, in any 12-month period, civil servants are entitled to a maximum sick leave period of six months, conditional on presenting a medical certificate. Regarding payments during periods of sick leave,
1 All sources to the proclamations in this country report are available at: https://www.lawethiopia.com/.
2 Pension benefits received, contributions collected, and profits earned from investment of pension funds are all exempt from taxes. For details of retirement pension payments for government officials and members of parliament as well as payments for retirement gratuity, see Proclamation No. 714/2011 (pp. 5952–3).
3
the proclamation further stipulates that a civil servant is entitled to 100 per cent of his/her salary for the first month and 50 per cent of his/her wage in the next two months of the sick leave period. Out of the total six-month period, the civil servant is entitled to take the remaining three months of sick leave without pay.
Benefit 6 (Maternity leave benefits): Proclamation No. 377/2003 also grants civil servants a maternity leave with full pay. Specifically, Article 88 of this proclamation states that a female worker is entitled to a paid leave period of 30 consecutive days before the due date of birth and a period of 60 consecutive days of paid leave after the birth of the child.
Benefit 7 (Medical and injury leave benefits): Proclamation No. 377/2003 further grants civil servants medical benefits and paid leave periods if they happen to sustain workplace-related injury. If a civil servant happens to sustain an employment injury, the government institution (as employer) is required to cover medical expenses incurred in relation to the employment injury. Besides, the civil servant is entitled to paid injury leave until s/he recovers and is able to resume work.
1.2.1 Not strictly benefits: Transfer payments and PSNP
Although Ethiopia has several non-contributory benefit schemes provided by non-governmental organizations, most are of a smaller scale and therefore not particularly fitting for a microsimulation model. A social protection transfer payments programme of interest to the microsimulation model at hand is the PSNP, a government safety net programme established in 2005 through multi-donor financing. The main objective of the programme is to help chronically food-insecure rural households develop the capacity to resist shocks, create assets, and become food self-sufficient. To this end, the programme offers transfers in the form of food, cash, or a combination of both to chronically food-insecure rural households through employment in local public good provision or direct support components. Households with able-bodied members participate under the public works component and receive cash (food) transfers conditional on supply of labour to public works aimed at building community assets. On the other hand, households without able-bodied members are covered under the direct support component and receive unconditional cash (food) transfers (i.e. without the need to supply any labour).
The PSNP in Ethiopia is also the second-largest safety net programme in Sub-Saharan Africa, next only to the one in South Africa. The programme started with a coverage of 4.84 million food-insecure rural households, and since December 2006 it has been scaled up significantly to cover 7.57 million households (see Ministry of Agriculture and Rural Development 2010).
The programme covers rural households in the eight major regions of the country: Tigray, Amhara, Oromiya, Southern Nations, Nationalities and Peoples’ Region (SNNPR), Afar, Somali region and rural Harari, and Dire Dawa. Beneficiaries of the PSNP are households that live in chronically food-insecure kebeles or woredas that are defined by the government as chronically food insecure. The 2014 PSNP ‘Programme Implementation Manual’ lists criteria used to classify woredas and households as chronically food insecure as well as the eligibility criteria used for participation in the programme (see Ministry of Agriculture 2014).
According to the 2014 PSNP ‘Programme Implementation Manual’, ‘The daily wage rate of the cash transfer is calculated on the basis of the cost of buying 3 kg of cereal and 0.8 kg of pulses per day (15 kg of cereal and 4 kg of pulses per person per month) in the market.’
The programme also limits the number of days a recipient of conditional transfers is eligible to work. Considering the fact that those eligible for the transfer also have other livelihoods, the number of days per month is set at five days. The combination of the amount of cereals required (per month) and the number of days of work effectively determines the wage rate (3 kg of cereal and 0.8 kg of pulses per day of work). Obviously, these figures set the upper bound of the benefit; that is, we assume that able-bodied persons will work all five days to receive the benefits (100 per cent benefits take up). Note that able-bodied members can, however, work up to a maximum of 15 days per month to secure payments for members who are unable to supply labour. Note also that those persons eligible for unconditional transfer receive the same amount as those who receive the unconditional transfer.
The programme operates under a cash-first principle, which means that the transfer is made in the form of cash in areas where markets are functioning. Since the price of the food items may

4
vary in time and location, there is a need for the cash wage rates to reflect such differences so that the transfers will be equivalent to the amount of food deemed necessary. Considering the need to match the wage rate to the prices in the local market, a wage rate study is conducted annually to determine the cash transfer rates to be used in the programme. The rates set can vary geographically to reflect the differing costs of food items in different markets. Determining the wage rates for each woreda requires data on the price of cereals and pulses in these woredas.
Until recently, the focus has been on providing social protection in rural areas. In 2014, the Government of Ethiopia approved the National Social Protection Policy that aims to provide social protection at the national level. The policy aims to move from fragmented to more comprehensive social protection programmes. To achieve the aims of the policy, the Urban Food Security and Job Creation Strategy was approved in 2015. The first policy instrument that will be used to implement the strategy is the Urban Productivity Safety Net Programme (UPSNP). The UPSNP aims to support the urban poor to ensure food security and create jobs. In the long run, the UPSNP and the rural PSNP will enable the government to operate a national social protection programme.
In the long run, the UPSNP is expected to provide support for more than 4.7 million people living in 972 cities and towns across the country through gradual rollout. The first phase of the programme (the first five years) will focus on cities with more than 100,000 people. Accordingly, 11 cities (one city from each region) have been identified for the first five years. A total of 604,000 beneficiaries (the poorest 12 per cent; that is, about 55 per cent of people living below the poverty line in these 11 cities) will be targeted through a gradual roll-out plan during the first five-year period.3 Given the size of Addis Ababa and the high poverty rate, about 75 per cent of the beneficiaries will be from Addis Ababa.
The programme has two components, namely, safety net support and livelihood services, with an estimated budget of USD 336.00 million and USD 79.00 million, respectively. The safety net support has two sub-components, namely, conditional and unconditional cash transfer. The focus of this study is the safety net component as it involves cash transfer to households to pull them out of poverty and it is the biggest component by far.4
Conditional cash transfers target able-bodied members of eligible households and require participation in public works, such as small-scale infrastructure, urban greenery development, environmental and other service provisions. The daily wage rate for the conditional transfer is ETB 60 per person per day (USD 2.91 equivalent per person per day) for the first year. Depending on the food price situations in each city, the wage rate will be adjusted annually. The maximum number of household members that can receive cash transfer from an eligible household is four, and the maximum number of days each member can engage is 60, 40, and 20 days in the first, second, and third years of receiving the benefit, respectively. Individuals will be allowed to pick days that they will participate in public works to reduce the opportunity cost of participation in public works. The low wage rate is also meant to encourage unskilled workers find other job opportunities.
Unconditional cash transfers target those individuals who for various reasons are unable to perform work. This group will include the elderly, people with disabilities, chronically ill, and urban destitute. It is estimated that beneficiaries receiving unconditional cash transfer will be 16 per cent of the total beneficiaries from the safety net support. The benefit for Unconditional transfer beneficiaries is set at ETB 170 per person per month (USD 8.25equivalent). It is recognized that these individuals will not only require cash transfer but also require housing, healthcare, and psycho-emotional counselling services. A transfer of ETB 600 per person per month for housing and additional overhead costs of 30 per cent for provision of other services will be provided for this category of beneficiaries.
Beneficiaries of the programme will be decided through a combination of geographic targeting, community-based targeting, PMTs, and self-selection. The programme will cover all areas of the city in the third year; however, it will start with the poor areas of the city. To be eligible,
3 The cities targeted for the first phase of the programme are Adama, Addis Ababa, Assayita, Asosa, Dessie, Dire Dawa, Gambella, Hawassa, Harari, Jijiga, and Mekelle.
4 The livelihood support focuses on providing guidance and seed money to start up a business.
5
beneficiaries should be residing in the area for 6 months or more at the start of the programme. In the targeted geographic areas, communities in a given administrative unit will form a committee that will rank households from the poorest to the richest. The ranking process will reveal beneficiaries and the list will be verified by implementing a PMT; the community committee will address inconsistencies through discussion. Finally, people will self-select to participate in the programme given the wage rate in the public works.
1.3 Social contributions
According to Proclamation No. 715/2011, private sector employees are covered under the same contribution and benefit scheme as public sector employees. According to Proclamation No. 714/2011, while a public servant pays 7 per cent of his/her salary as contribution to the Public Sector Employees’ Pension Fund, the employing public office makes a contribution of 11 per cent towards the same fund. Similarly, a private sector employee and his/her employer, respectively, contribute 7 and 11 per cent of the employee’s salary towards the Private Organization Employees’ Pension Fund (see Proclamation No. 715/2011). On the other hand, the respective contributions by the public office and the public servant to the Military and Police Service Pension Fund are 25and 7 per cent of their salary.
1.4 Taxes
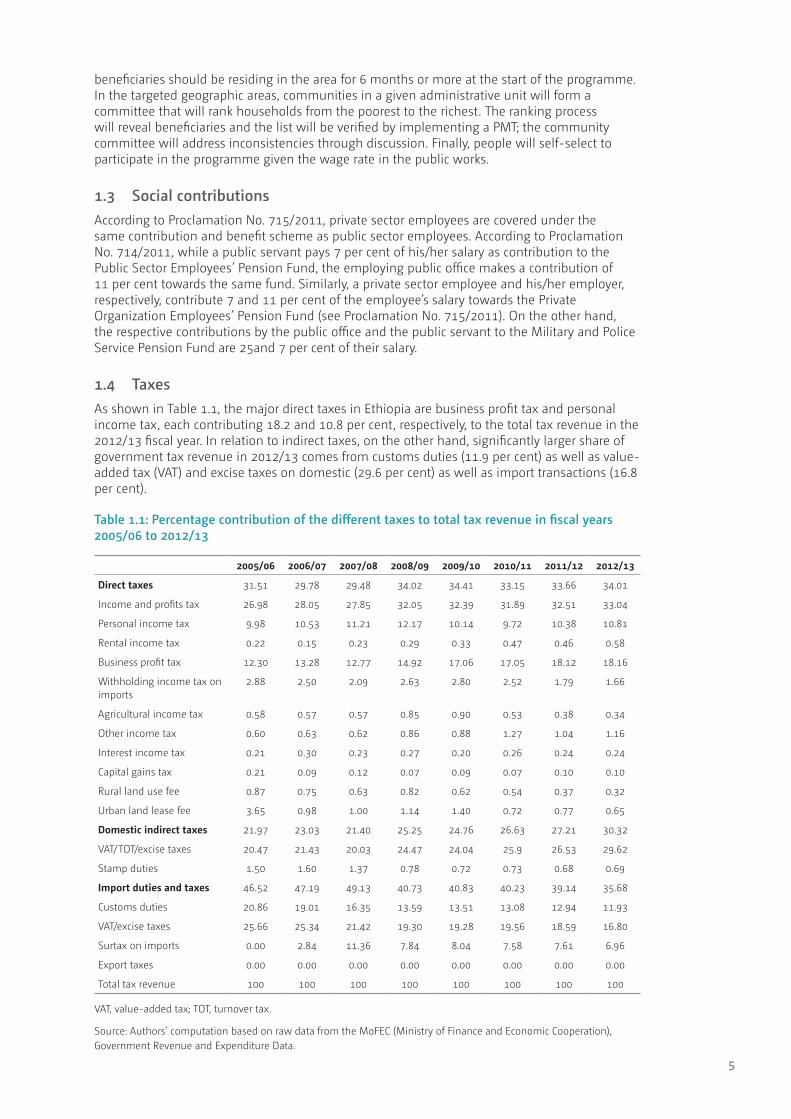
As shown in Table 1.1, the major direct taxes in Ethiopia are business profit tax and personal income tax, each contributing 18.2 and 10.8 per cent, respectively, to the total tax revenue in the 2012/13 fiscal year. In relation to indirect taxes, on the other hand, significantly larger share of government tax revenue in 2012/13 comes from customs duties (11.9 per cent) as well as value-added tax (VAT) and excise taxes on domestic (29.6 per cent) as well as import transactions (16.8 per cent).
Table 1.1: Percentage contribution of the different taxes to total tax revenue in fiscal years 2005/06 to 2012/13
2005/06 2006/07 2007/08 2008/09 2009/10 2010/11 2011/12 2012/13
Direct taxes 31.51 29.78 29.48 34.02 34.41 33.15 33.66 34.01
Income and profits tax 26.98 28.05 27.85 32.05 32.39 31.89 32.51 33.04
Personal income tax 9.98 10.53 11.21 12.17 10.14 9.72 10.38 10.81
Rental income tax 0.22 0.15 0.23 0.29 0.33 0.47 0.46 0.58
Business profit tax 12.30 13.28 12.77 14.92 17.06 17.05 18.12 18.16
Withholding income tax on imports
2.88 2.50 2.09 2.63 2.80 2.52 1.79 1.66
Agricultural income tax 0.58 0.57 0.57 0.85 0.90 0.53 0.38 0.34
Other income tax 0.60 0.63 0.62 0.86 0.88 1.27 1.04 1.16
Interest income tax 0.21 0.30 0.23 0.27 0.20 0.26 0.24 0.24
Capital gains tax 0.21 0.09 0.12 0.07 0.09 0.07 0.10 0.10
Rural land use fee 0.87 0.75 0.63 0.82 0.62 0.54 0.37 0.32
Urban land lease fee 3.65 0.98 1.00 1.14 1.40 0.72 0.77 0.65
Domestic indirect taxes 21.97 23.03 21.40 25.25 24.76 26.63 27.21 30.32
VAT/TOT/excise taxes 20.47 21.43 20.03 24.47 24.04 25.9 26.53 29.62
Stamp duties 1.50 1.60 1.37 0.78 0.72 0.73 0.68 0.69
Import duties and taxes 46.52 47.19 49.13 40.73 40.83 40.23 39.14 35.68
Customs duties 20.86 19.01 16.35 13.59 13.51 13.08 12.94 11.93
VAT/excise taxes 25.66 25.34 21.42 19.30 19.28 19.56 18.59 16.80
Surtax on imports 0.00 2.84 11.36 7.84 8.04 7.58 7.61 6.96
Export taxes 0.00 0.00 0.00 0.00 0.00 0.00 0.00 0.00
Total tax revenue 100 100 100 100 100 100 100 100
VAT, value-added tax; TOT, turnover tax.
Source: Authors’ computation based on raw data from the MoFEC (Ministry of Finance and Economic Cooperation), Government Revenue and Expenditure Data.
6
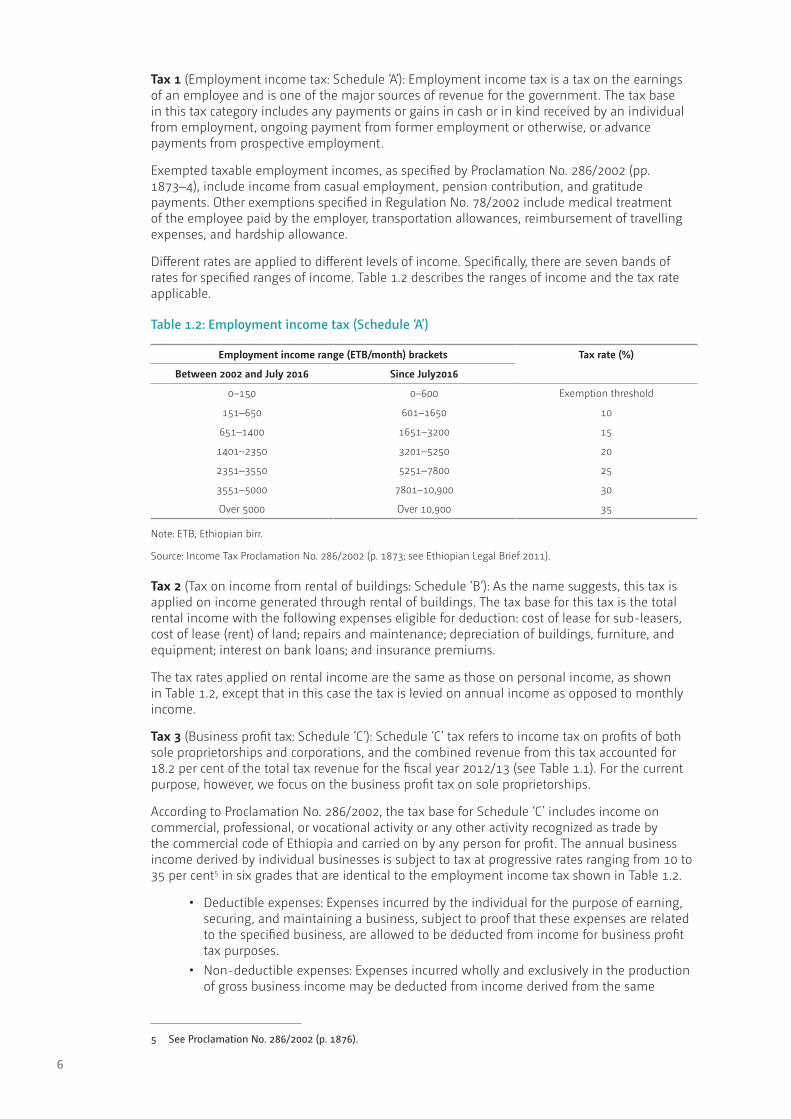
Tax 1 (Employment income tax: Schedule ‘A’): Employment income tax is a tax on the earnings of an employee and is one of the major sources of revenue for the government. The tax base in this tax category includes any payments or gains in cash or in kind received by an individual from employment, ongoing payment from former employment or otherwise, or advance payments from prospective employment.
Exempted taxable employment incomes, as specified by Proclamation No. 286/2002 (pp. 1873–4), include income from casual employment, pension contribution, and gratitude payments. Other exemptions specified in Regulation No. 78/2002 include medical treatment of the employee paid by the employer, transportation allowances, reimbursement of travelling expenses, and hardship allowance.
Different rates are applied to different levels of income. Specifically, there are seven bands of rates for specified ranges of income. Table 1.2 describes the ranges of income and the tax rate applicable.
Table 1.2: Employment income tax (Schedule ‘A’)
Employment income range (ETB/month) brackets Tax rate (%)
Between 2002 and July 2016 Since July2016
0–150 0–600 Exemption threshold
151–650 601–1650 10
651–1400 1651–3200 15
1401–2350 3201–5250 20
2351–3550 5251–7800 25
3551–5000 7801–10,900 30
Over 5000 Over 10,900 35
Note: ETB, Ethiopian birr.
Source: Income Tax Proclamation No. 286/2002 (p. 1873; see Ethiopian Legal Brief 2011).
Tax 2 (Tax on income from rental of buildings: Schedule ‘B’): As the name suggests, this tax is applied on income generated through rental of buildings. The tax base for this tax is the total rental income with the following expenses eligible for deduction: cost of lease for sub-leasers, cost of lease (rent) of land; repairs and maintenance; depreciation of buildings, furniture, and equipment; interest on bank loans; and insurance premiums.
The tax rates applied on rental income are the same as those on personal income, as shown in Table 1.2, except that in this case the tax is levied on annual income as opposed to monthly income.
Tax 3 (Business profit tax: Schedule ‘C’): Schedule ‘C’ tax refers to income tax on profits of both sole proprietorships and corporations, and the combined revenue from this tax accounted for 18.2 per cent of the total tax revenue for the fiscal year 2012/13 (see Table 1.1). For the current purpose, however, we focus on the business profit tax on sole proprietorships.
According to Proclamation No. 286/2002, the tax base for Schedule ‘C’ includes income on commercial, professional, or vocational activity or any other activity recognized as trade by the commercial code of Ethiopia and carried on by any person for profit. The annual business income derived by individual businesses is subject to tax at progressive rates ranging from 10 to 35 per cent5 in six grades that are identical to the employment income tax shown in Table 1.2.
• Deductible expenses: Expenses incurred by the individual for the purpose of earning, securing, and maintaining a business, subject to proof that these expenses are related to the specified business, are allowed to be deducted from income for business profit tax purposes.
• Non-deductible expenses: Expenses incurred wholly and exclusively in the production of gross business income may be deducted from income derived from the same
5 See Proclamation No. 286/2002 (p. 1876).
7
source. However, certain items may not be deducted. The list of these items can be found in Proclamation No. 286/2002 (p. 1876).
Tax 4 (Non-business capital gains tax: Schedule ‘D’): Capital gains tax is payable on gains on realized transfer (sale or gift) of certain investment properties such as buildings held for business, factory, and/or office and on transfer of shares of companies.
The base used to calculate capital gains tax, as specified in Regulation No. 78/2002, is the gain over the inflation-adjusted historical cost of the capital asset or the par value of the share.
Exemptions, as specified in Regulation No. 78/2002, are aggregate annual gains of less than ETB 10,000 realized upon sale of a capital asset. For individuals, gains obtained from the transfer of residential buildings are exempted.
The rates applied for capital gains tax are specified in Proclamation No. 286/2002 as follows: 15 per cent for buildings held for business, factory, and/or office and 30 per cent on capital gains from shares of companies.
Tax 5 (Tax on interest income on deposits: Schedule ‘D’): As specified in Proclamation No. 286/2002, every person deriving income from interest on deposits has to pay tax at the rate of 5 per cent.
Tax 6 (Dividend income tax: Schedule ‘D’): As specified in Proclamation No. 286/2002, income derived from dividends from a share company or withdrawals of profits from a private limited company is subject to tax at the rate of 10 per cent. The withholding agent is required to withhold or collect the tax and account to the tax authority. This tax is a final tax in lieu of income tax.
Tax 7 (Tax on income from royalties: Schedule ‘D’): Proclamation No. 286/2002 (p. 1880) defines royalty as follows:
The term ‘royalty’ means a payment of any kind received as a consideration for the use of, or the right to use, any copyright of literary, artistic or scientific work, including cinematography films, and films or tapes for radio or television broadcasting, any patent, trade work, design or model, plan, secret formula or process, or for the use or for the right to use of any industrial, commercial or scientific equipment, or for information concerning industrial, commercial or scientific experience.
Tax on royalties is at a flat rate of 5 per cent.
Tax 8 (Tax on income from games of chance: Schedule ‘D’): As specified in Proclamation No. 286/2002, any income derived from winnings of games of chance (e.g. lotteries, tombola) is subject to tax at the rate of 15 per cent, except for winnings of less than ETB 100.
Tax 9 (Tax on income from rental of property: Schedule ‘D’): As specified in Proclamation No. 286/2002, taxable income in this category refers to income derived from casual rental of property (including any land, building, or moveable asset) not related to a business activity. This type of income is subject to tax at a flat rate of 15 per cent of the annual gross income.
Tax 10 (Tax on income from rendering of technical services outside Ethiopia: Schedule ‘D’): Proclamation No. 286/2002 stipulates that all payments made in consideration of any kind of technical services rendered outside Ethiopia to resident persons in any form are liable to tax at a flat rate of 10 per cent, which shall be withheld and paid to the tax authority by the payer. According to Proclamation No. 286/2002 (p. 1880), the term ‘technical service’ refers to ‘any kind of expert advice or technological service rendered’.
Tax 11 (Land use and agricultural income tax): As mentioned in Section 2.1, Article 97 of the constitution stipulates that regions shall levy taxes on incomes of private farmers and farmers incorporated in co-operative associations. Accordingly, agricultural income tax is administered by the regional governments and the proceeds are owed to the respective regional governments administering the tax.
Although regional governments are in the process of harmonizing the rates for agricultural income tax, currently the rates levied by the regions vary.
8
Similarly, according to Article 97, regional states are given the power to determine and collect fees for land usufructuary rights. Accordingly, each region levies the land use tax based on the size of holdings, and some regions also take into account fertility of landholdings.
Tax 12 (Customs duty): As shown in Table 1.1, trade tax is a major component of the revenue of the Ethiopian government and customs duty is major component of trade taxes. For example, in the fiscal year 2012/13, revenue from customs duty accounted for 33 per cent of the total revenue from foreign trade taxes. During the same period, the share of customs duty in the total tax revenue was 11.9 per cent (see Table 1.1).
The latest applicable proclamation in Ethiopia on customs duties is Proclamation No. 622/2009.
• Export tax: There is no export tax in Ethiopia except on semi-prepared hides and skins of animals, such as wet blue skin of oxen, wet blue hides of sheep and goat, and pickled hides of sheep. The tax is 150 per cent of the selling price of the hides and skins to be exported. This tax was introduced on 1 January 2010 by Directive No. 25/2009 issued by the Ministry of Finance and Economic Development (MoFED; see also ERCA, no date).
• Import tax: The customs tariff applies to all imports, which are grouped into 97 categories based on the Harmonized System of Tariffs Classification Code.
Customs duty for imported goods in Ethiopia is applied on the actual cost of goods up to the first entry point to the customs territory of Ethiopia. In other words, the CIF (cost + insurance + freight) value of the good is the base for import duty.6
Regarding rates, the customs duty has six bands (0, 5, 10, 20, 30, and 35 per cent) and these can be put into four tariff categories. The first category includes items such as fertilizer, inputs for manufacturing export (using duty drawback and voucher schemes), and aircraft that can be imported duty free. The second category includes items, raw materials and machineries for manufacturing industries, which can be imported with an import duty rate of 5 to 10 per cent. In the third category, there are items such as carton boxes, envelopes, sacks and bags, thread, synthetic filaments, artificial filaments, yarn and synthetic monofilament staple and fibres that can be imported with less than 20 per cent import duty rate. Finally, the fourth category includes items that fall in the 30–35 per cent bands, and these include perfumes, soaps, tiles, transmission belts, ornaments, silk, cotton, jewellery, footwear, motor vehicles, textiles products, and toys. However, as Ethiopia is a member of the Common Market for Eastern and Southern Africa, tariffs applied on imports from other member states are reduced by 10 per cent from the normal levels (see also ERCA, no date).
These rates are applied according to two categories of items: on category 1 items (i.e. items used for productive purpose), a rate that ranges from 0 to 20 per cent is applied. On category 2 items (i.e. non-productive imports, luxury products), a rate that ranges from 30 to 35 per cent is applied.
With regard to the application of this tax, there are items eligible for customs duty waiver and there are rules regarding temporary import and export of goods. Such details can be found in the Customs Proclamation No. 622/2009.
Tax 13 (Import surtax): Surtax on imported goods was introduced in Ethiopia in 2007. The revenue from surtax is meant to provide subsidies for curtailing the damaging effects of price hikes. In the fiscal year 2012/13, surtax on imported goods accounted for 7 per cent of the total tax revenue (see Table 1.1).
Under Regulation No. 133/2007, the council of ministers levied a 10 per cent surtax on all goods imported into Ethiopia except those exempt under Article 5 of the regulation. The list of exempted goods includes investment goods, fertilizers, petroleum and lubricants, aircraft, spacecraft and parts thereof, motor vehicles for freight and passengers, and special-purpose motor vehicles. Some medicines and raw materials are also exempt from surtax. The exemption also applies to imports by persons or organizations exempt from paying customs duty.
6 See Customs Proclamation No. 622/2009 (p. 4624).
9
The basis of computation for surtax payable under these regulations is the sum of CIF value, customs duty, excise tax, and VAT payable on the goods.
Tax 14 (VAT): VAT was introduced in Ethiopia in 2002 via Proclamation No. 285/2002. It has been an important source of revenue since its introduction. For instance, in the fiscal year 2013/14, revenue collected from VAT on imported items accounted for about 16.8 per cent of the total tax revenue.
In terms of implementing the proclamation, with the aim of reducing compliance burden, the application of VAT is limited to businesses with an annual volume of trade exceeding ETB 500,000. For businesses whose annual volume of trade does not reach this threshold, a turnover tax (TOT) is introduced along with VAT. VAT is imposed on both imports and domestic transactions.
The tax base for VAT is (i) every taxable transaction by a registered person; (ii) every import of goods, other than an exempt import; and (iii) an import of services as provided in Article 23 of Proclamation No. 285/2002.
To reduce the disincentive to consume some important goods and services deemed to have social benefits, the proclamation has also introduced zero rating and exemptions.
The list of items that are zero-rated and exempt can be found in the Value-Added Tax Proclamation No. 285/2002 (pp. 1838–41).
Tax 15 (TOT): TOT is charged under the Turnover Tax Proclamation No. 308/2002 introduced on 1 January 2003. TOT is imposed on persons not registered for VAT with the aim of equalization. It is applicable to transactions involving businesses with annual taxable transaction values below ETB 500,000 that have not registered for VAT voluntarily.
The tax base for the purpose of TOT is the gross value of goods supplied and services rendered. A 2 per cent rate is applicable on the gross receipts of goods sold locally. Regarding services, a 10 per cent rate is imposed on all except on contractors, grain mills, tractors, and combine harvesters, which face a 2 per cent TOT rate.
The proclamation also includes a list of exempt items similar to those exempt from VAT. This list is available from the Turnover Tax Proclamation No. 308/2002 (p. 2026).
Tax 16 (Excise tax): Excise tax in Ethiopia is imposed on selected imported as well as domestically produced goods. The latest proclamation applicable with regard to excise tax in Ethiopia is Proclamation No. 307/2002. According to the federal government budget report, in the fiscal year 2014/15, excise tax on imported goods and locally produced goods accounted for 5.4 and 3.7 per cent of the total tax revenue of the central government, respectively (see Table 1.1).
The base for computation of excise tax depends on whether the good is locally produced or imported. For locally produced goods, the base of calculation is the cost of production. The cost of production in this case includes direct labour and raw material costs incurred in the production process as well as the cost of indirect inputs and overhead costs; it does not include costs related to depreciation of machineries. For imported goods, the base for calculation of excise tax is the sum of CIF value and customs duty.7
Excise tax has 10 bands or groups of rates ranging from 10 per cent (on textile products) to 100 per cent (on perfumes and certain alcoholic drinks and passenger cars). These 10 bands of rates, applied depending on the nature of products, are 10, 20, 30, 33, 40, 50, 60, 75, 80, and 100 per cent (see ERCA, no date).
7 For the calculation of the base, refer to ERCA (no date).

10
2 Simulation of taxes and benefits in ETMOD
2.1 Scope of simulation
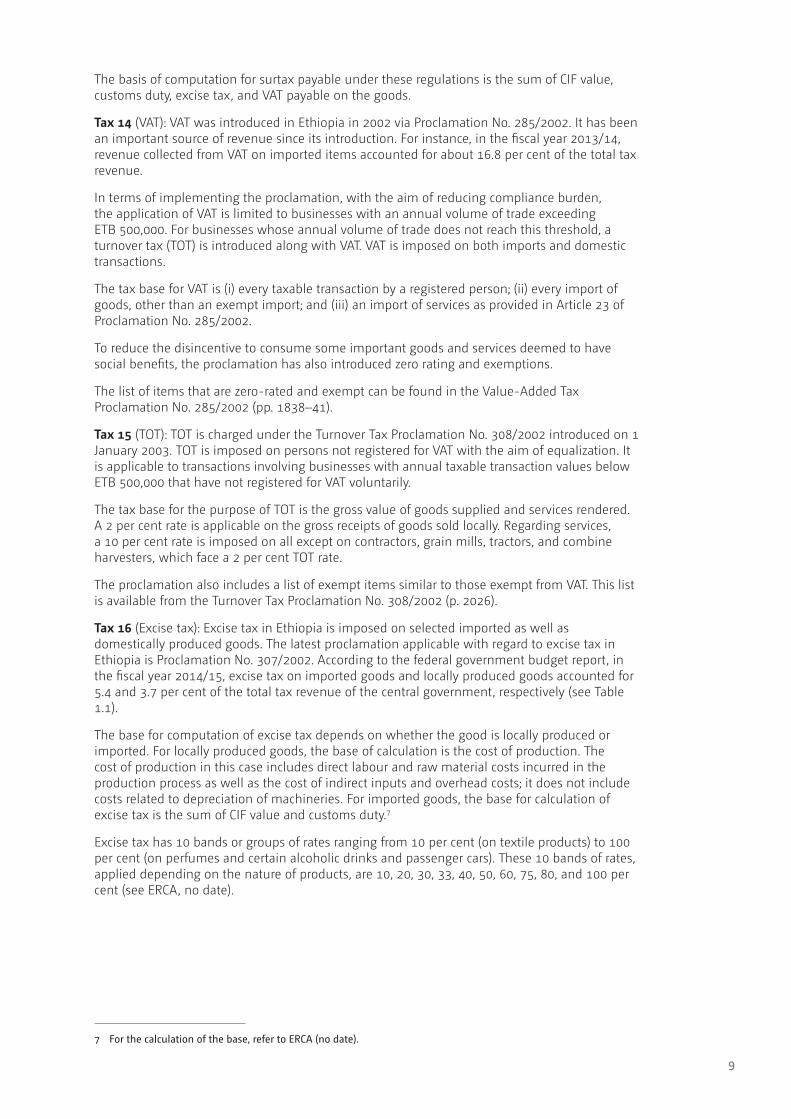
We have not simulated all the taxes and benefits mentioned in the previous section in ETMOD.8 First, data availability is an issue that limits our ability to simulate policies. Second, some policies that can be partially simulated are not simulated because they are beyond the scope of the assignment. While Table 2.1 lists the main benefit categories and indicates their treatment in ETMOD, Table 2.2 does the same for social insurance contributions and taxes.
Table 2.1: Simulation of benefits in ETMOD
Variable name(s)
Treatment in ETMOD Why not fully simulated?
2014 2015 2016 2017 2017a
Old-age pension, gratuity, and survivors’ pension
poa I I I I I There are no data on contribution history
Sickness and maternity benefits
E E E E E No information on sick and maternity leave
Medical and injury leave E E E E E No information on medical leave
Rural PSNP: Direct support bsa00 I I I I I Can be simulated but we have not
Rural PSNP: Public works bsa01 I I I I I Can be simulated but we have not
Urban PSNP: Direct support
bsa00_s — — — S S Simulation of UPSNP-DS has a number of assumptions
Urban PSNP: Public works bsa01_s — — — S S Simulation of UPSNP-DS has a number of assumptions
Notes: ‘I’ variables are included in the microdata but policy is not simulated; ‘E’ policy is excluded from the model as variables are not included in the microdata and policy is not simulated; ‘—’ policy did not exist in that year; ‘S’ policy is simulated although some minor or very specific rules may not be simulated; DS, direct support.
Source: Authors’ compilation.
8 ETMOD is a family of SOUTHMOD. An explanation about the workings of SOUTHMOD can be found in Pirttilä and Wright (2018, forthcoming). The model is implemented using EUROMOD version 2.0.0 (University of Essex 2017).
11
Table 2.2: Simulation of taxes and social contributions in ETMOD
Variable name(s)
Treatment in ETMOD Why not fully simulated?
2014 2015 2016 2017 2017a
Social contribution
Employees tscee_s S S S S S
Taxes
Employment income tax tin_m S S S S S
Tax on income of rental of buildings
— E E E E E We cannot distinguish between rental of buildings from rental of other property which are taxed differently
Business profit tax (self-employment)
tin_s S S S S S
Capital gains tax — E E E E E No information is available
Tax on interest income — E E E E E Cannot be simulated as it is aggregated with other investment income
Tax on dividend — E E E E E Cannot be simulated as it is aggregated with other investment income
Tax on royalties — E E E E E We do not have separate information on royalty income
Tax on game of chances — E E E E E Income from inheritance is mixed with game of chances
Tax on income of rental of property
— E E E E E We cannot distinguish between rental of property from rental of buildings which are taxed differently
Tax on income from rendering of technical services outside Ethiopia
— E E E E E No information
Land use and agricultural income tax
— E E E E E Lack of information on the tax rates
Export tax — E E E E E
Import surtax — E E E E E Data are not disaggregated enough
VAT VAT_et S S S S S
TOT — E E E E E Data are not disaggregated enough
Excise tax — E E E E E Data are not disaggregated enough
Notes: ‘S’ policy is simulated although some minor or very specific rules may not be simulated; ‘—’ policy did not exist in that year; ‘E’ policy is excluded from the model as it is neither included in the microdata nor simulated.
Source: Authors’ compilation.
The benefit systems simulated in ETMOD—the direct support and public works components of the UPSNP, abbreviated hereafter as UPSNP-DS and UPSNP-PW, respectively—have not yet taken effect and are expected to be implemented in early 2017. We have therefore simulated these benefit systems for 2016 using information on the number of beneficiaries and amount of benefits from the project plan, and an updated input data from the fiscal year 2013/14. In relation to taxes simulated in ETMOD, personal income tax has undertaken a reform effective from July 2016. Although the tax rates remain the same, the tax brackets for employment income tax have been changed and attempt is made to simulate this policy change in ETMOD using updated data from the fiscal year 2013/14.
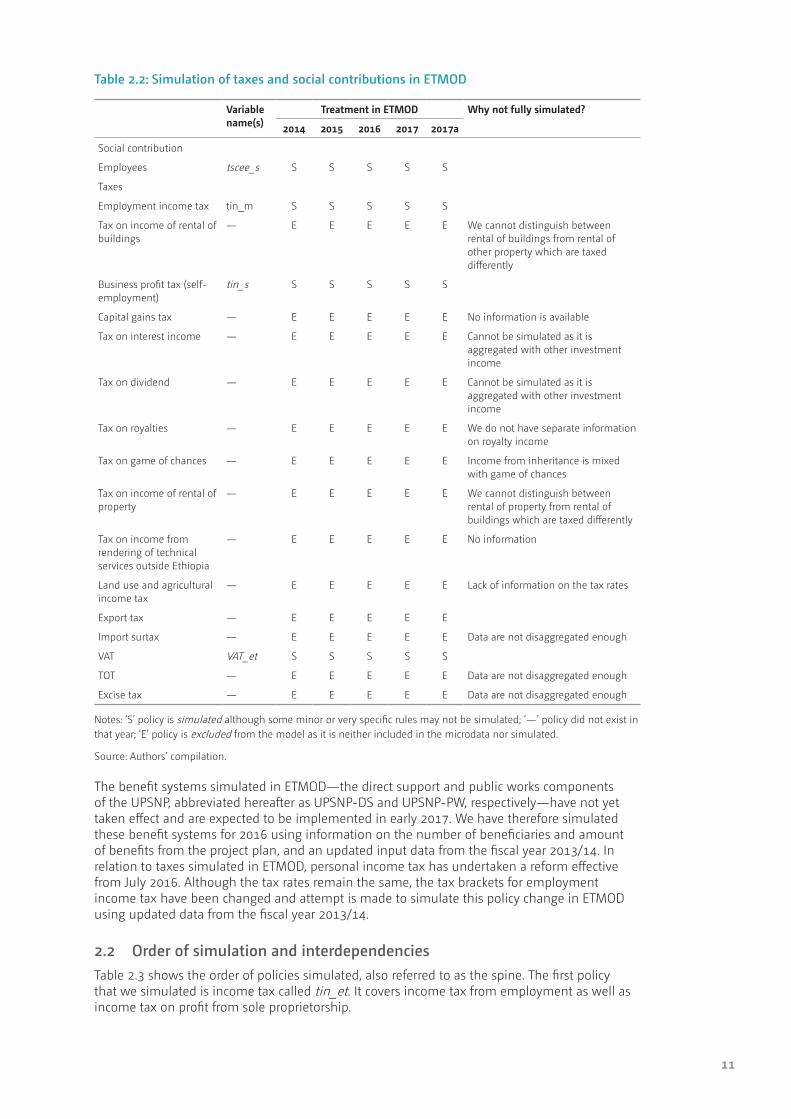
2.2 Order of simulation and interdependencies
Table 2.3 shows the order of policies simulated, also referred to as the spine. The first policy that we simulated is income tax called tin_et. It covers income tax from employment as well as income tax on profit from sole proprietorship.
12
Table 2.3: ETMOD spine: order of simulation
Policy 2014 2015 2016 2017 2017a Description of the instrument and main output
tin_et On On On On On tin_m and tin_s
bsa01_et Off Off On On On bsa01_s
bsa00_et Off Off On On On bsa00_s
tscee_et On On On On On tscee_s
tscer_et On On On On On tscer_s
VAT_et On On Off Off Off VAT_s
Source: Authors’ compilation.
Employment income and profit income tax are simulated separately as the employment income tax in most cases is withheld by the employer on a monthly basis and is not calculated on an annual basis. Income tax from self-employment (business profits tax on sole proprietors) is, however, settled on an annual basis and is therefore treated differently from employment income tax.
The income tax proclamation does not exempt social security contribution from income tax and therefore there are no deductions. Besides, since social insurance contribution is also paid on gross employment income, the order of simulation of income tax policy and pension contribution policy does not matter. For self-employment income, we have used taxable income in the data (i.e. sales minus expenses); as a result, no further adjustment is need in ETMOD.
Following the income tax policy simulations, we have simulated employee pension contribution (tscee_s) and employer pension contribution (tscer_s).
The next sets of simulated policies are benefits from social assistance. We have simulated social assistance for poor households that engage in public works in urban areas, and the policy is called bsa01_et in ETMOD. We have then proceeded to simulating a social assistance benefit for urban households that do not have any able-bodied member. That is, this is the UPSNP-DS component and covers households whose members are chronically ill, disabled, and/or elderly (and it is referred to as bsa00_et in ETMOD).
The tax benefit simulation policy is independent because there is no dependence between different policy items at the moment.
2.3 Social benefits
2.3.1 UPSNP: Public works (bsa01_s)
Definitions
One of the policies that we have simulated is the conditional cash transfer under the UPSNP. UPSNP is provided in 11 cities in Ethiopia: one city from each region and the two city administrations of Addis Ababa and Dire Dawa. The focus in this section will be on the component of the benefits that requires participation in public works (i.e. UPSNP-PW).
The UPSNP-PW is for families with able-bodied household members who need more work. This includes families whose members are either fully unemployed or partially unemployed, having marginal self-employment and/or low wage employment. These households constitute more than 40 per cent of the poor.9 Families with marginal self-employment are families whose members are involved in self-employment that does not make much money. Families with low wage employment are families whose members have wage jobs and are fully employed, but they do not earn enough to cover the needs of the household.
Eligibility conditions
The programme targets the poorest woredas (kebeles outside of Addis Ababa) in its first year. Woredas are the lowest administrative units in Addis Ababa (and kebeles are the lowest administrative units in other cities). Once the programme is fully rolled out, in three years time,
9 Poor is defined as the poorest 15 per cent of the population.
13
all woredas/kebeles will be covered and the programme will cover households in the 11 cities and fulfil the requirements.
Although woreda/kebele is the lowest administrative unit with clear boundary and structure, it is large to rank and select households. In each woreda/kebele, there are community structures called ketenas. These community structures are not formal administrative structures but form the bases for ranking and selecting households for the programme. Ketenas Targeting Committees (KTCs) rank and select households within the ketena boundary. Woreda officers coordinate KTCs ensuring that there is no overlap.
KTCs first update the registered households (with names, age, and gender). They record unregistered households and unregistered members of registered households. The final list includes street dwellers and is drawn up separately by skilled professionals. KTCs rank households from poorest to richest and select households for the programme based on the number of beneficiaries assigned for the woreda. The number of beneficiaries for the woreda is based on the population of each woreda at the time of the programme implementation and the 2011 poverty. The KTCs also provide data for the PMT model developed for the city to verify the selection by KTCs. After discussion on inconsistencies, the programme arrives at a final list of beneficiaries.
In our simulation, we consider the 11 cities chosen for the programme and we consider all households in the city covering all woredas/kebeles. This is done because, at the moment, there is no information as to which woredas/kebeles will be covered in the first year. In addition, the sampling design for the survey data is not disaggregated enough to cover all woredas/kebeles. Moreover, the programme document states that within three years, the programme will be rolled out in all woredas/kebeles in the selected cities.
Within a city, we selected 12 per cent of the households with the lowest total expenditure (i.e. food and non-food expenditure). We prefer to use expenditure to income for ranking households, as there are too many households with zero reported income for the period under consideration. Besides, we believe this will reflect the selection of KTCs as they will only observe households’ expenditures and not their incomes; and/or since it may be safe to assume expenditure is a good proxy for income of poor households.
Income test
The programme does not involve income test for targeting beneficiary households, it rather depends on community ranking. However, the targeting is then verified based on a PMT model that, as of now, is available only for Addis Ababa.
Benefit amount
The amount of benefit received is dependent on the number of household members that are enrolled in the program. If up to four members of the household participate in the UPSNP-PW, each will receive ETB 60 per day for 60 days in a year. If more than four members of the household participate in the programme, they will share the amount that is calculated based on participation of four household members. The maximum number of days is expected to decline in the second and third year of the programme.
ETMOD notes
In the simulation, we have assumed that all households who qualify for the benefit (i.e. households in the lowest 12 per cent) will participate in the programme. We have also assumed that all household members who currently are not earning money from either self-employment or wage employment will participate for the maximum number of days. This assumption simplifies the simulation, but might deviate from real-world practice. Indeed, if a person has been employed by the programme for 60 days for the first year and still finds him/herself in a position of qualifying for the benefit s/he will only be allowed to work for 40 days in the second year. As a result, after the first year it is likely that some people work less than the full 60 days. We are however unable to simulate these details. Besides, we have assumed that only those household members with zero reported employment income (wage or self-employment) are eligible to participate in the UPSNP-PW. In practice, however, those with spare time (although
14
engaged in work) can also take part in the public works programme as long as their earning is not good enough.
2.3.2 UPSNP: Direct support (bsa00_s)
Definitions
UPSNP has a direct support component targeting households whose members are unable to work because they are elderly people, chronically ill or disabled, and/or destitute. Hereafter, we refer to this component of the programme as UPSNP-DS.
Eligibility conditions
Households are selected in the same way as the UPSNP-PW component. However, instead of focusing on households with able-bodied household members, here the focus is on poor households who do not have able-bodied household members and depend on the support of others for their basic needs.
Income test
Similar to UPSNP-PW, there is no income test; rather, the targeting is based on community ranking. However, there is a PMT model that is used for verification and this model is currently available only for Addis Ababa.
Benefit amount
Members who are selected for support receive ETB 170 per person per month. As they do not have other means of supplementing the income from the cash transfer, the urban destitute will need more support for housing, health care, and other services. Therefore, an estimated ETB 600 per person per month for 12 months is provided for housing and there is an additional 30 per cent overhead cost.
ETMOD notes
In the simulation, we have assumed that all households who qualify for the benefit (i.e. households in the lowest 12 per cent) and do not have able-bodied members will participate in the programme. However, since the urban destitute are not in our sample we have not simulated benefits that involve transferring ETB 600 for housing, and we instead focus only on the ETB 170 transfer paid to each member per month.
2.4 Social contributions
Currently, all people employed in either government or private organizations are required to make mandatory pension contributions. However, there is no pension scheme available for self-employed people.
2.4.1 Employee social contributions (tscee_et)
Liability to contributions
As indicated above, employees of both public and private organizations are liable to make pension contributions.
Income base used to calculate contributions
Pension contributions for both private and public sector employees are calculated based on their monthly gross salaries.
Contribution rates
A public servant pays 7 per cent of his/her monthly salary as contribution to the Public Sector Employees’ Pension Fund, whereas private sector employees make the same 7 per cent contribution to the Private Sector Employees’ Pension Fund.
15
2.4.2 Employer social contributions (tscer_et)
Liability to contributions
Both private and public sector employers are liable to make pension contributions on behalf of their respective employees.
Income base used to calculate contributions
The pension contribution made by employers is also based on the monthly gross salaries of their employees.
Contribution rates
The employing public office makes a contribution of 11 per cent towards the Public Sector Employees’ Pension Fund and private sector employers also make the same 11 per cent contribution to the Privet Sector Employees’ Pension Fund. In the case of the military and police force, the employing public office makes a 25 per cent contribution to the Military and Police Service Pension Fund.
2.5 Personal income tax (tin_et)
2.5.1 Tax unit
Under the Ethiopian income tax regime, for both employment and self-employment income taxes, the tax unit is the individual employee and self-employed person. In other words, the system does not allow for joint filing and does not consider other characteristics of the household.
2.5.2 Exemptions
The following sources of income are exempted from taxation under the employment income tax rules: ‘income from casual employment, pension contribution of the employer, and gratitude payments, medical treatment of the employee paid by the employer, transportation allowances, reimbursement of travelling expenses, and hardship allowance’.
2.5.3 Tax allowances
There are no tax allowances in the Ethiopian income tax system.
2.5.4 Tax base
To calculate the tax an employee or self-employed person pays one needs to first determine the tax base by subtracting all exemptions and deductions from gross income. In the current case, the tax base for employment income tax is calculated by subtracting tax exemptions such as medical treatment paid by the employer from the gross income of the employee. The tax base for self-employment income tax, on the other hand, is calculated as the difference between total turnover and cost of operation. In other words, the tax base for self-employment income is the profit of the firm.
2.5.5 Tax schedule
The tax schedule under operation for both employment and self-employment income during the fiscal years 2002/03 to 2015/2016 is given in the first column of Table 1.2. The tax schedule rule changed from July 2016, and this new tax schedule is given in the second column of Table 1.2.
2.6 Indirect taxes
2.6.1 VAT and TOT
There are two kinds of indirect sales taxes in Ethiopia: VAT and TOT. Both taxes are meant to be consumption taxes that impose similar tax rates on the price of final consumption goods. The only difference is that TOT is easier to administer for smaller firms. Accordingly, with the aim

16
of reducing compliance burden, the application of VAT is limited to businesses with an annual volume of trade exceeding ETB 500,000. For businesses whose annual volume of trade does not reach this threshold, TOT is introduced along with VAT. VAT is imposed on both imports and domestic transactions.
2.6.2 Tax base and tax schedule
The tax base for VAT is: (i) every taxable transaction by a registered person; (ii) every import of goods, other than an exempt import; and (iii) an import of services unless exempted. Unless a good is zero-rated or exempted, a uniform VAT rate of 15 per cent is applied.
The tax base for TOT is the gross value of goods supplied and services rendered. A 2 per cent rate is applicable on the gross receipts of goods sold locally. Regarding services, a 10 per cent rate is imposed on all except on contractors, grain mills, tractors, and combine harvesters, which face a 2 per cent TOT rate.
2.6.3 VAT and TOT exemptions
The only items that are zero-rated for VAT purposes, unless specified otherwise, are provision of transport supplies associated with international transport of goods and people, the supply of gold to the national bank, as well as exports of goods and services. In other words, no domestically consumed goods are zero-rated.
Both VAT and TOT have the same exhaustive list of exempted goods and services. The list of goods and services that constitute the consumption basket of consumers and are exempted for VAT and TOT purposes include rental of houses; financial services; specified prescription drugs, educational services, and child care provided by pre-school institutions; transportation services; electricity, kerosene, and water; and supply of books and other printed materials.
ETMOD notes
Although consumers may not directly pay VAT when buying items from sellers that are not VAT registered, we have applied the 15 per cent VAT rate on all consumption items that are eligible for VAT.
3 Data
3.1 General description
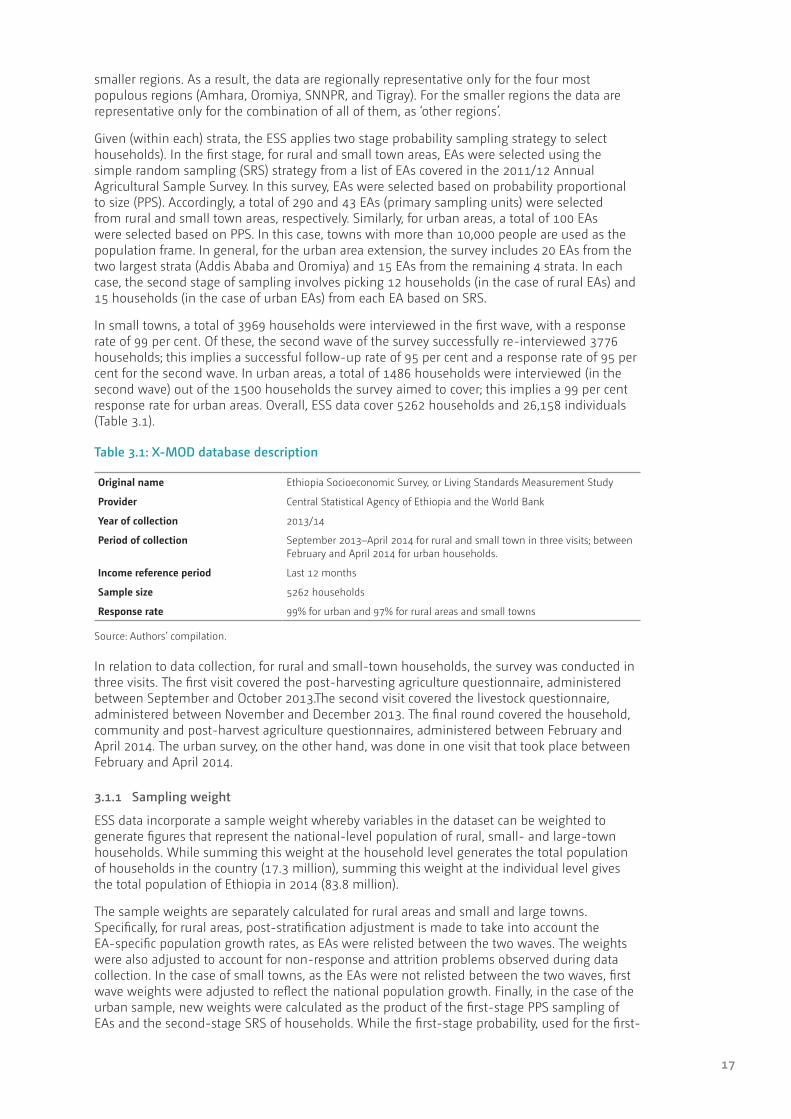
The data used in ETMOD come from the 2013/14 Ethiopia Socioeconomic Survey (ESS). This survey is collected by the Central Statistical Agency (CSA) of Ethiopia in collaboration with the World Bank’s Living Standards Measurement Study team. In this section, we present a general description of the ESS data based on the ‘Ethiopian Socioeconomic Survey, Wave Two (2013/14), Basic Information Document’ prepared by the CSA and World Bank (see CSA and LSMS-ISA 2015).
The first wave of the ESS, which covers rural areas and small towns only, was conducted in 2011/12. The second wave of the ESS was carried out in 2013/14 and it has been extended to cover urban areas as well. Since the plan is to make the ESS a panel data, the rural and small-town households in the second wave were the same as those in the first wave. Although, so far, a panel data is available only for rural and small-town households, when the next (third) wave of the ESS, undertaken in 2015/16, is available, the ESS will have a panel data structure for urban households as well. The long-term plan of the ESS is to generate a panel data by conducting the survey on the same household every two years.
The second wave (2013/14) of the ESS covered all areas of Ethiopia except three zones of Afar and six zones of the Somalia region, and the ESS can be considered nationally representative. Its sub-national representativeness, on the other hand, depends on the size of the region in question. The reason for this heterogeneity in representativeness across regions is due to imposition of a quota. The number of enumeration areas (EAs) in each region is set in such a way that it is possible to draw a certain minimum number of households from each EA. Thus, imposition of the quota makes it difficult to include enough number of EAs from the
17
smaller regions. As a result, the data are regionally representative only for the four most populous regions (Amhara, Oromiya, SNNPR, and Tigray). For the smaller regions the data are representative only for the combination of all of them, as ‘other regions’.
Given (within each) strata, the ESS applies two stage probability sampling strategy to select households). In the first stage, for rural and small town areas, EAs were selected using the simple random sampling (SRS) strategy from a list of EAs covered in the 2011/12 Annual Agricultural Sample Survey. In this survey, EAs were selected based on probability proportional to size (PPS). Accordingly, a total of 290 and 43 EAs (primary sampling units) were selected from rural and small town areas, respectively. Similarly, for urban areas, a total of 100 EAs were selected based on PPS. In this case, towns with more than 10,000 people are used as the population frame. In general, for the urban area extension, the survey includes 20 EAs from the two largest strata (Addis Ababa and Oromiya) and 15 EAs from the remaining 4 strata. In each case, the second stage of sampling involves picking 12 households (in the case of rural EAs) and 15 households (in the case of urban EAs) from each EA based on SRS.
In small towns, a total of 3969 households were interviewed in the first wave, with a response rate of 99 per cent. Of these, the second wave of the survey successfully re-interviewed 3776 households; this implies a successful follow-up rate of 95 per cent and a response rate of 95 per cent for the second wave. In urban areas, a total of 1486 households were interviewed (in the second wave) out of the 1500 households the survey aimed to cover; this implies a 99 per cent response rate for urban areas. Overall, ESS data cover 5262 households and 26,158 individuals (Table 3.1).
Table 3.1: X-MOD database description
Original name Ethiopia Socioeconomic Survey, or Living Standards Measurement Study
Provider Central Statistical Agency of Ethiopia and the World Bank
Year of collection 2013/14
Period of collection September 2013–April 2014 for rural and small town in three visits; between February and April 2014 for urban households.
Income reference period Last 12 months
Sample size 5262 households
Response rate 99% for urban and 97% for rural areas and small towns
Source: Authors’ compilation.
In relation to data collection, for rural and small-town households, the survey was conducted in three visits. The first visit covered the post-harvesting agriculture questionnaire, administered between September and October 2013.The second visit covered the livestock questionnaire, administered between November and December 2013. The final round covered the household, community and post-harvest agriculture questionnaires, administered between February and April 2014. The urban survey, on the other hand, was done in one visit that took place between February and April 2014.
3.1.1 Sampling weight
ESS data incorporate a sample weight whereby variables in the dataset can be weighted to generate figures that represent the national-level population of rural, small- and large-town households. While summing this weight at the household level generates the total population of households in the country (17.3 million), summing this weight at the individual level gives the total population of Ethiopia in 2014 (83.8 million).
The sample weights are separately calculated for rural areas and small and large towns. Specifically, for rural areas, post-stratification adjustment is made to take into account the EA-specific population growth rates, as EAs were relisted between the two waves. The weights were also adjusted to account for non-response and attrition problems observed during data collection. In the case of small towns, as the EAs were not relisted between the two waves, first wave weights were adjusted to reflect the national population growth. Finally, in the case of the urban sample, new weights were calculated as the product of the first-stage PPS sampling of EAs and the second-stage SRS of households. While the first-stage probability, used for the first-

18
stage selection of EAs, is adjusted to account for the difference between the listing counts and the EA population estimates, the product of the adjusted first-and the second-stage weights were then adjusted to account for non-response. The resulting sampling weights were post-stratified to ensure that the sum of the weights within each region matches the 2014 population estimates.
3.2 Data adjustment
In the original dataset, variables were required for ETMOD but with missing information for some individuals. Whenever possible, we have tried to impute values to these variables. In some cases, we have done this based on information on other variables elsewhere in the dataset, and in other cases this is done based on average values generated conditional on geographical locations and household/individual characteristics. As this was not possible for all cases, we have dropped a total of 2382 observations (individuals) from the original dataset. Most of the individuals (2373) dropped from our dataset are household members who have left their respective households since the first wave of the survey and hence do not have information on most of the variables needed for ETMOD. We have not dropped any household from the original dataset, and hence the sampling weight is still valid at the household level. We may, however, need some adjustment to the weights given to individuals as the current weights are calculated without taking into account the fact that there are a large number of (2373) out-migrants who have been dropped from the data.
3.3 Updating
As indicated above, we have used data collected in 2013/14, and attempted to simulate policies in 2014/15,2015/16, and 2016/17. Accordingly, in order to take into account the time inconsistency between the input data year and policy year, we have updated income and expenditure figures to the simulation years. While the consumer price index (CPI) is used to update most of the monetary variables in the data, wage indices for civil and non-civil servants are used to update wage income. That is, to account for changes in the non-simulated variables that have taken place between the year of the input data and the year of the simulated tax–benefit system, each income and expenditure component in the data is updated using the CPI as an uprating factor (see details in Table 3.2).
Table 3.2: Raw indices for deriving X-MOD uprating factors
Index Constant name
Values of the raw indices Source Income components uprated by the index
Notes
2014 2015 2016 2017
CPI $f_cpi 547.987 603.400 667.622 744.831 IMF, World Economic Outlook Database, April 2016
yiy, yse, bsa00, bsa01, ypr, poa, kfb, yfb, xyy
Estimates after 2015
Wage (civil servants)
$f_yem01 100 135 135 170 Ministry of Finance and Economic Cooperation
yem
Wage (non-civil servant)
$f_yem02 100 114 129 147 CSA (various issues): Retail price survey: the wage of unskilled labour
yem
Note: Consumer price index (CPI) (monthly base year: 2000).
Source: Authors’ compilation.

19
4 Validation
4.1 Aggregate validation
This section attempts to validate ETMOD results against external official data. Accordingly, detailed comparisons for employment income tax, number of beneficiaries, transfer amounts for the UPSNP-PW and UPSNP-DS components, as well as the value of VAT collected are presented in the Annex. In the following sub-sections, we discuss the main discrepancies between ETMOD results and external data as well as the potential reasons for the observed discrepancies.
4.1.1 Validation of outputted (simulated) taxes and benefits
4.1.0.1 Income tax
Table 4.1 in the Annex shows the comparison between employment income tax simulated in ETMOD and the total tax amount found in external sources. Because of outliers in employment income reported in the input data, there is a large gap between the simulated and actual income taxes collected. However, once we add the criterion that employment income above the 99th percentile is replaced with the 99th percentile value, the simulated and actual employment income taxes become satisfactorily close to each other.
One can also see that the gap between the simulated income tax and the actual income tax decreases outside the base year. Excluding the outlier figures actually leads to undersimulation of the income tax collected.
4.1.0.2 UPSNP
Table 4.2 in the Annex shows the comparison between the number of beneficiaries and expected amount of transfers for the UPSNP-PW component simulated in ETMOD with external data. As the programme is not yet implemented, we have used data on anticipated number of beneficiaries and budget allocation reported in the UPSNP project document as our external benchmark. ETMOD is expected to underestimate the number of beneficiaries because we require zero earnings for eligibility whereas in the actual project individuals are considered eligible even when they are in marginal employment (see Section 2 for details). We opt for those with no earnings as the threshold for being in marginal employment is not clear. The amount of transfer paid to beneficiaries is also slightly undersimulated and this can be explained by the underestimation of the number of beneficiaries. Besides, as we are likely to overestimate the number of days participants engage in public works, by assuming everybody works the maximum number of days, the underestimation in the amount of transfer is not as much as in the case of number of beneficiaries.
Similarly, Table 4.3 in the Annex shows the comparison between the number of beneficiaries and amount of transfers simulated in ETMOD with external data for the UPSNP-DS component. ETMOD does not include the urban destitute. These are potential beneficiaries with no accommodation and are estimated to be about 22,000 according to the project document. Thus, the simulated number of beneficiaries in ETMOD is underestimated by about the same margin and this is also reflected in the smaller amount of transfer payments simulated in ETMOD.
4.1.2 Social contribution (old-age pension)
As discussed in Section 1.2, currently there are two old-age pension schemes in Ethiopia: public servants pension scheme and private organizations employees’ pension scheme. We have chosen to simulate the pension contribution of public servants because the income data we have for these employees is much better in terms of lack of outliers. The simulation includes both the contribution of employees (7 per cent for all public servants) and the contribution of the government (25 per cent for police and military and 11 per cent for all other public servants).
Table 4.4 in the Annex shows that the pension contribution is well simulated for the base year. The ETMOD simulation result is 92 per cent of the pension contribution raised by the public sector employees’ social security agency for the fiscal year 2013/14.10 The discrepancy between
10 The external data source is the Public Servants’ Social Security Agency (PSSSA) (2008).

20
the two figures becomes much greater once we move away from the base year. For instance, the difference is close to ETB 4 billion for the fiscal year 2014/15.
This result suggests that the uprating factor is not adequate to capture the evolution of wages and number of employees in the Ethiopian labour market.
4.1.3 Simulated VAT
Being a consumption tax, VAT is normally collected when taxpayers purchase goods and services for final consumption. However, this is not always the case because in some cases it is easier to levy the tax (VAT) on goods at the point of origin. For instance, VAT on imported goods is levied at the border. This may not create a large divergence between the simulated and actual VAT collected if the country’s VAT system is such that it is only levied on imported items that are meant for final consumption and/or if the VAT collected on imports is not a large component of the overall tax revenue.
In the case of Ethiopia, however, both conditions do not hold. For instance, VAT is collected at the border on goods that are meant for intermediate input. In addition, the VAT on imported goods constitutes a large share of the overall VAT raised in the country. Because of both these facts, one would expect the simulated VAT amount to lie between the VAT collected from final consumption on domestic goods and services and the VAT collected on domestic as well as imported goods and services.
Table 4.5 in the Annex shows that to be the case for both the base year (2014) and year 2015. Specifically, the simulated VAT amount is 38 per cent higher than the VAT on domestic goods and services that are collected at the point of sale. Note that these domestic goods and services do not include imported items that are consumed in the same fiscal year. On the other hand, the simulated VAT amount is 36 per cent lower than the total VAT amount collected, which includes the VAT collected at the border.
Ideally, we would like to compare the simulated VAT with the one that is levied on goods and services (domestic and imported) that are consumed in the same fiscal year. As there is no such information in the country, we are not able to do so at the moment.
4.2 Income distribution
The income distribution results presented in this section are calculated for individuals based on their household disposable income (HDI), which is computed as the sum of all income sources of all household members less income tax and social insurance contributions. This is equivalized based on the ‘modified OECD’ equivalence scale that sets a value of 1 for the first adult and 0.5 for additional adults in the household. It also sets a value of 0.3 for household members below the age of 14 years. For comparison, we have also presented inequality estimates based on expenditure data used to simulate the VAT.
4.2.1 Income inequality
As shown in Table 4.6 in the Annex, we have calculated six sets of inequality measures based on the simulated income data. The results in the first row are based on the simulated income data without any adjustment for outliers in HDI. One can see that the Gini coefficient based on the per capita disposable income (0.819) is much higher than the World Bank’s income Gini coefficient estimate of 0.336 (see World Bank 2013).
In the second row, we provide the Gini coefficient figures after adjusting for the outliers in HDI figures. Specifically, we capped disposable income levels at the 99th percentile by replacing income levels exceeding the 99th percentile by the value of the 99th percentile. This brings down the estimated Gini coefficient to 0.52 and makes it closer to the estimate of 0.336 we find from external sources.
In the second column, we adjusted the employment and self-employment income figures for the actual number of months the individual makes earnings in a year. This is important because some individuals are active for fewer than 12 months a year and hence their average monthly
21
income will be less than what is reported as monthly income once we make this adjustment.11 This adjustment is not needed for agricultural income as farm income is already evenly distributed across months in a year. However, this adjustment does not make a large difference in our Gini coefficient estimates. It only increased the ETMOD Gini coefficient estimate from 0.819 to 0.827 (Row 1) and from 0.521 to 0.525 (Row 2) when data adjusted for outliers is used.
The fact that our Gini coefficient estimate is based on simulations using data that do not include farmers’ income from livestock can, to some extent, explain why the estimate from ETMOD is higher than the World Bank’s estimate. Excluding livestock-related income can severely underestimate farmers’ income and hence is likely to lead to an exaggerated Gini coefficient estimate. Our calculation also shows that if we exclude farmers from consideration, the resulting Gini coefficient becomes very close to the one we obtain from external sources (see also Table 4.7 in the Annex).12
4.2.2 Expenditure inequality
For the sake of comparison with the result regarding income inequality, we provide inequality figures based on total expenditure data for the household, including imputed values for consumption of own production. The result is that the discrepancy between the Gini coefficient thus calculated and the one we obtain from external sources are close (0.477 and 0.336, respectively). This potentially shows that our income figures may not properly capture the earnings of some sectors of the society.
We would like to emphasize that the expenditure data we use does not include some items that are included in the household consumption and expenditure survey of CSA (which are not relevant for VAT simulation). Including these values (imputation) may further decrease the gap between the two figures.13
11 In the input data, monthly income is given as the amount of earning in a specific period (weekly, monthly, quarterly, etc.) that is converted to a monthly basis without taking into account the actual number of months the individual (enterprise) worked in a year.
12 Note also that the Gini coefficient estimate from the aforementioned external sources is based on the 2010 household consumption expenditure survey (HCES) data, and income inequality may have grown since then.
13 One should also note that the data from the above-indicated external source are based on household expenditure data that relies on the 2010 HCES of CSA.
22
ReferencesCSA (various issues). ‘Retail Price Survey’. Addis Ababa, Ethiopia.
CSA and LSMS-ISA (Central Statistical Agency and Living Standards Measurement Study—Integrated Surveys on Agriculture) (2015). ‘Ethiopia Socioeconomic Survey, Wave Two (2013/14),Basic Information Document’. Addis Ababa and Washington, DC: CSA and World Bank. Available at: http://microdata.worldbank.org/index.php/catalog/2247/get_microdata (accessed 20 July 2017).
ERCA (no date). Import–Export Procedure. Available at: http://www.erca.gov.et/images/Documents/Customs/Import_Export_Procedure/452.pdf (accessed September 2017).
Ethiopian Legal Brief: A Blog about Ethiopian Law (2011–). ‘Federal Laws’ [Federal Laws Year Index, Council of Minister Regulations, Codes, Directives, Constitutions, and Revised Constitutions of Regional States]. Available at: http://chilot.me/federal-laws/ (accessed 20 July 2017).
Federal Negarit Gazeta (several issues). Available at: http://chilot.me/federal-laws/ (accessed 10 November 2015).
Mengistu, Andualem T., Kiflu G. Molla, and Firew B. Woldeyes (2015). Tax–benefit simulation: Feasibility study in Ethiopia. Wider Working Paper 2015/115. Available at: https://www.wider.unu.edu/sites/default/files/wp2015-115.pdf (accessed September 2017).
Ministry of Agriculture (2014). ‘Productive Safety Net Programme Phase IV: Programme Implementation Manual’, version 1.0. Addis Ababa, Ethiopia: Ministry of Agriculture. Available at: https://collaboration.worldbank.org/docs/DOC-21913 (accessed 20 July 2017).
Ministry of Agriculture and Rural Development (2010). ‘Productive Safety Net Programme Implementation Manual, Draft version 3, 25 May 2010’, Addis Ababa, Ethiopia.
Pirttilä, J., and G. Wright (2018, forthcoming). ‘SOUTHMOD: Simulating Taxes and Social Protection for Development, An Introduction’. International Journal of Microsimulation.
Public Servants’ Social Security Agency (PSSSA) (2008). EFY Plan Implementation Report. Addis Ababa, Ethiopia: PSSSA.
University of Essex (2017). EUROMOD version 2.0.0 [software]. May 2017.
World Bank (2013).‘World Development Indicators 2013’. Washington, DC: World Bank. Available at: http://hdr.undp.org/en/content/income-gini-coefficient (accessed 20 July 2017).
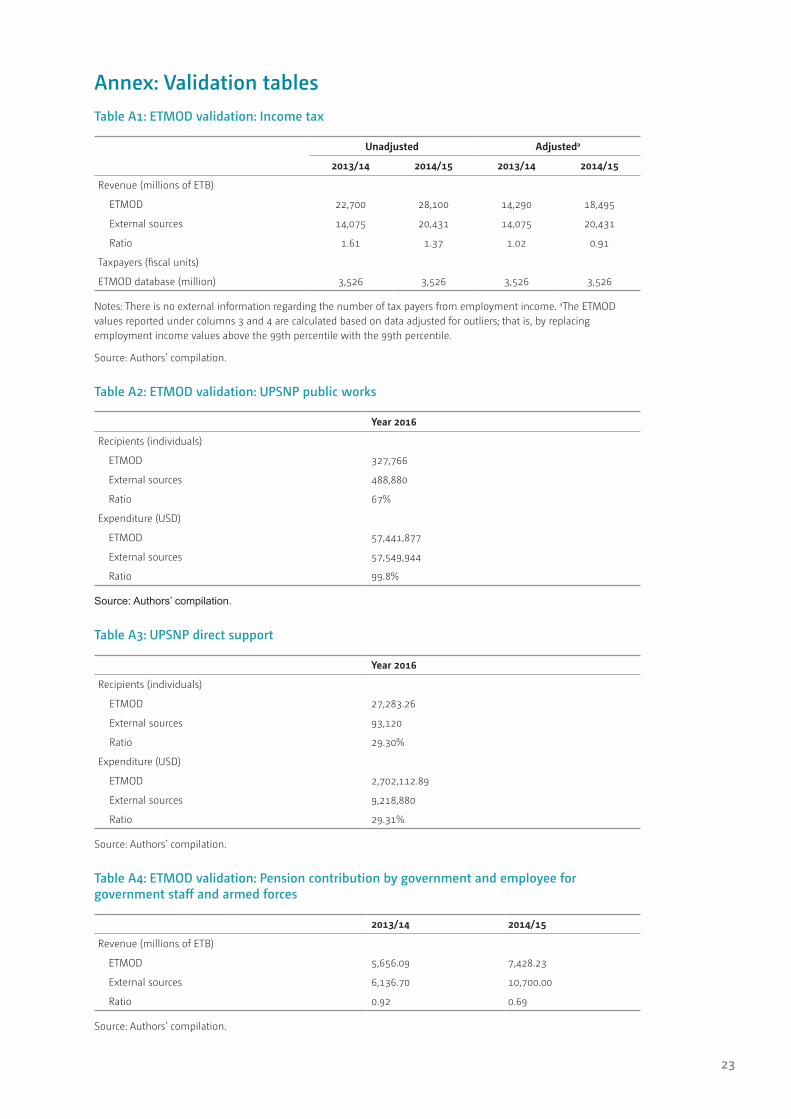
23
Annex: Validation tablesTable A1: ETMOD validation: Income tax
Unadjusted Adjusteda
2013/14 2014/15 2013/14 2014/15
Revenue (millions of ETB)
ETMOD 22,700 28,100 14,290 18,495
External sources 14,075 20,431 14,075 20,431
Ratio 1.61 1.37 1.02 0.91
Taxpayers (fiscal units)
ETMOD database (million) 3,526 3,526 3,526 3,526
Notes: There is no external information regarding the number of tax payers from employment income. aThe ETMOD values reported under columns 3 and 4 are calculated based on data adjusted for outliers; that is, by replacing employment income values above the 99th percentile with the 99th percentile.
Source: Authors’ compilation.
Table A2: ETMOD validation: UPSNP public works
Year 2016
Recipients (individuals)
ETMOD 327,766
External sources 488,880
Ratio 67%
Expenditure (USD)
ETMOD 57,441,877
External sources 57,549,944
Ratio 99.8%
Source: Authors’ compilation.
Table A3: UPSNP direct support
Year 2016
Recipients (individuals)
ETMOD 27,283.26
External sources 93,120
Ratio 29.30%
Expenditure (USD)
ETMOD 2,702,112.89
External sources 9,218,880
Ratio 29.31%
Source: Authors’ compilation.
Table A4: ETMOD validation: Pension contribution by government and employee for government staff and armed forces
2013/14 2014/15
Revenue (millions of ETB)
ETMOD 5,656.09 7,428.23
External sources 6,136.70 10,700.00
Ratio 0.92 0.69
Source: Authors’ compilation.

24
Table A5: ETMOD validation: Value added tax (VAT) revenue (in millions of ETB)
Year ETMOD External sources (excluding VAT on imports)
Ratio External sources (including VAT on imports)
Ratio
2013/14 27,170 19,738 1.38 41,321 0.66
2014/15 29,917 25,453 1.18 45,498 0.66
Source: Authors’ compilation.
Table A6: ETMOD validation: Income inequality
ETMOD 2014 ETMOD 2014 (adjusted for no. months worked)a
ETMOD 2014(based on per capita expenditure)b
External source (World Bank 2013)
Gini coefficient 0.8132917 0.8276797 0.4777289 0.336
Gini coefficient(based on data adjusted for outliers)c
0.5255429 0.5229310 0.4777289 0.336
Notes: aThis is the Gini coefficient that takes into account the fact that farmers have annual income whereas others may work fewer than 12 months per year. bThis is based on the per capita expenditure of the household. Note that own consumption of one’s produce is not included in this data that lowers expenditure levels of rural households thereby increasing the Gini coefficient. cThis is the Gini coefficient based on data adjusted for outliers in household level per capita disposable income. The per capita disposable income level is capped at the 99th percentile; income levels exceeding the 99th percentile are replaced with the 99th percentile.
Source: Authors’ compilation.
Table A7: ETMOD validation: Income distribution across deciles
Income deciles Average per capita disposable income across deciles
Unadjusted data Adjusted dataa
1 7.49 7.49
2 66.38 66.38
3 128.84 128.85
4 190.99 190.99
5 265.00 265.00
6 365.70 365.70
7 522.74 522.74
8 755.51 755.51
9 1218.49 1202.26
10 11,128.82 2428.73
Notes: aNote that this is after adjusting for outliers in household level per capita disposable income values; per capita disposable income values exceeding the 99th percentile are replaced with the 99th percentile.
Source: Authors’ compilation.