Embed Size (px)
Citation preview

St. Cloud State UniversitytheRepository at St. Cloud StateSouthwest Minnesota Economic and BusinessConditions Report
Minnesota Regional Economic and BusinessConditions Report
8-2016
Southwest Minnesota Economic and BusinessConditions Report - Second Quarter 2016King BanaianSt. Cloud State University, [email protected]
Richard A. MacDonaldSt. Cloud State University, [email protected]
Follow this and additional works at: https://repository.stcloudstate.edu/qebcr_sw_mn
Part of the Business Commons, Growth and Development Commons, and the RegionalEconomics Commons
This Research Study is brought to you for free and open access by the Minnesota Regional Economic and Business Conditions Report at theRepositoryat St. Cloud State. It has been accepted for inclusion in Southwest Minnesota Economic and Business Conditions Report by an authorizedadministrator of theRepository at St. Cloud State. For more information, please contact [email protected].
Recommended CitationBanaian, King and MacDonald, Richard A., "Southwest Minnesota Economic and Business Conditions Report - Second Quarter2016" (2016). Southwest Minnesota Economic and Business Conditions Report. 10.https://repository.stcloudstate.edu/qebcr_sw_mn/10

Southwest MinnesotaEconomic and Business Conditions ReportSecond Quarter 2016
This issue is part of a series for the six planning areas of Minnesota – Central, Northeast, Northwest, Southeast, Southwest, and Twin Cities.
The Southwest Minnesota Planning Area consists of 23 counties: Big Stone; Blue Earth; Brown; Chippewa; Cottonwood; Faribault; Jackson; Lac qui Parle; Le Sueur; Lincoln; Lyon; Martin; Murray; Nicollet; Nobles; Pipestone; Redwood; Rock; Sibley; Swift; Waseca; Watonwan; and Yellow Medicine.

1
TABLE OF CONTENTS
Executive Summary ................................................................................1
Southwest Minnesota Leading Economic Indicators Index ....................2
Southwest Minnesota Business Filings ...................................................4
Southwest Minnesota Labor Market Conditions ..................................11
Southwest Minnesota Bankruptcies .....................................................16
Economic Indicators .............................................................................17
Sources ................................................................................................. 19
Executive Summary
A steady improvement in economic conditions in Southwest Minnesota is expected over the next several months according to the predictions of the St. Cloud State University (SCSU) Southwest Minnesota Index of Leading Economic Indicators (LEI). While three of four LEI components were negative in the second quarter, a decline in initial jobless claims in recent months helped keep the index in positive territory in the second quarter. After rising 3.14 points in the first quarter, the Southwest Minnesota LEI increased by 1.27 points in the current quarter. A weakness in the rural outlook, some sluggishness in new business filings earlier in the year, and a smaller number of residential building permits in Mankato earlier in 2016 served as a drag on the leading index in the second quarter. Like elsewhere around the state, the overall economic outlook in Southwest Minnesota is one in which growth is expected, albeit at a rate that is slower than normal.
There were 697 new business filings with the Office of the Minnesota Secretary of State in Southwest Minnesota in the second quarter of 2016 — representing 7.9 percent more new filings than one year earlier. There were 56 new regional business incorporation filings in the second quarter, a 5.1 percent reduction over last year’s second quarter. New LLC filings in Southwest Minnesota rose by 14.5 percent—increasing to 411 in the second quarter of 2016. New assumed names totaled 194 in the second quarter—3 percent fewer filings than in June 2015. There were thirty-six new filings for Southwest Minnesota non-profit in the second quarter—eight more than one year earlier.
Employment of Southwest Minnesota residents declined by 1.2 percent over the year ending June 2016. 2,545 fewer Southwest Minnesota residents have jobs than did one year earlier. The regional unemployment rate was 4.1 percent in June, an increase from a 3.8 percent reading in June 2015. Initial claims for unemployment insurance rose by 158 from year-ago levels in June—a 12.9 percent increase. The Southwest Minnesota labor force contracted by 2,055 (a 0.9 percent decrease) over the year ending June 2016. The average weekly wage in Southwest Minnesota rose at a 4.3 percent rate to a level of $783 in the fourth quarter of 2015. Southwest Minnesota bankruptcies have begun flattening out at historically low levels in recent quarters.
There was a mostly favorable economic performance in the Mankato/North Mankato Metropolitan Statistical Area (MSA)—the largest market in Southwest Minnesota—in the most recent quarter. On the positive side, average hourly earnings rose, employment increased, the labor force expanded, total new business filings rose, the value of building permits accelerated, and the relative cost of living declined. This was partially offset by a decline in the length of the workweek, higher initial jobless claims, and a larger unemployment rate.
2
Southwest Minnesota Leading Economic Indicators Index
Components of SCSU Southwest Minnesota Leading Economic Indicators Index
Component of Index Contribution to LEI, 2nd quarter 2016 Contribution to LEI, 1st quarter 2016Rural Mainstreet Index -0.43 6.20
Southwest Minnesota initial claims for unemployment insurance 2.81 -3.92
Southwest Minnesota new filings of incorporation and LLCs -0.68 1.93
Mankato MSA single-family building permits -0.43 -1.07
TOTAL CHANGE 1.27 3.14
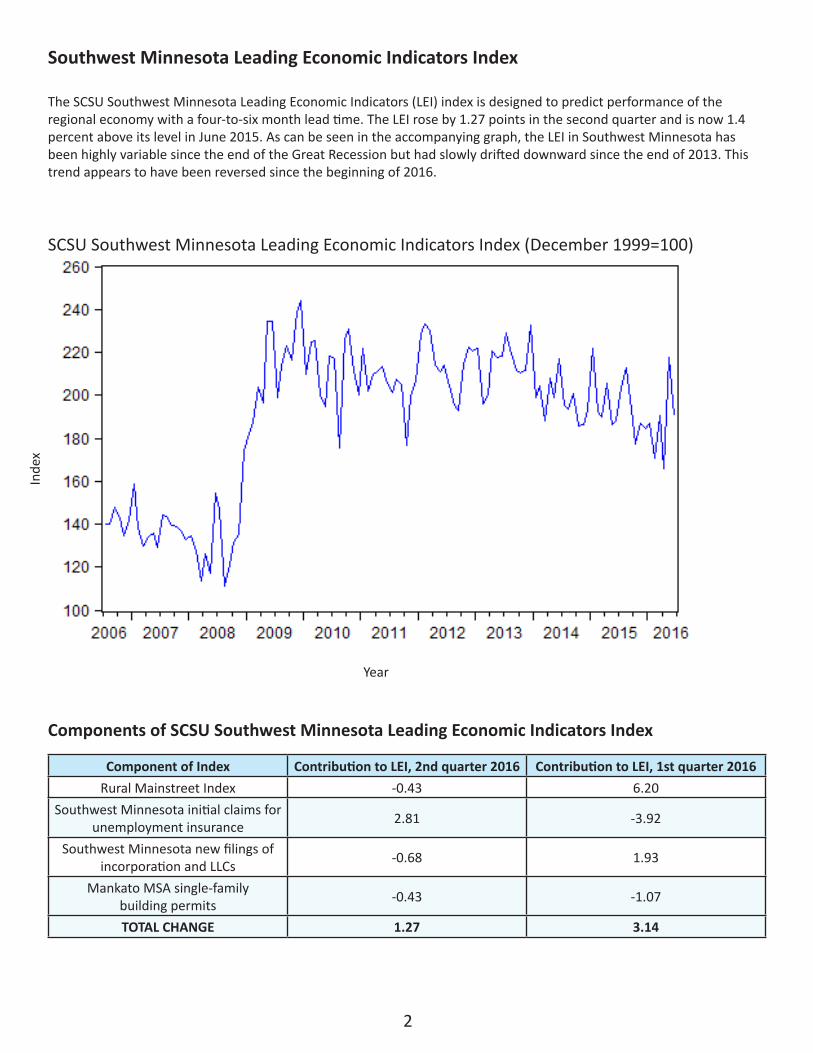
The SCSU Southwest Minnesota Leading Economic Indicators (LEI) index is designed to predict performance of the regional economy with a four-to-six month lead time. The LEI rose by 1.27 points in the second quarter and is now 1.4 percent above its level in June 2015. As can be seen in the accompanying graph, the LEI in Southwest Minnesota has been highly variable since the end of the Great Recession but had slowly drifted downward since the end of 2013. This trend appears to have been reversed since the beginning of 2016.
SCSU Southwest Minnesota Leading Economic Indicators Index (December 1999=100)
Year
Inde
x

3
Leading Economic Indicators Index
The Southwest Minnesota LEI has four components, three of which decreased in the second quarter. A recent decrease in the number of initial jobless claims contributed favorably to the index, but weakness in new business filings for incorporation and LLC earlier in the year, and a smaller number of Mankato/North Mankato Metropolitan Statistical Area (MSA) single family residential building permits weighed on the LEI. The Rural Mainstreet Index from Creighton University uses survey data from rural bankers and business leaders in towns with average population of 1,300 in ten Midwestern states. This index is used as a proxy for economic performance in the rural counties of Southwest Minnesota. This index also had an unfavorable impact on the LEI in the most recent quarter.
2016 2015 Percentage Change
Rural Mainstreet Index, Creighton UniversityJune 44.1 52.6 -16.2%
Southwest Minnesota initial claims for unemployment insuranceJune 1,382 1,224 12.9%
Southwest Minnesota new filings of incorporation and LLCsSecond Quarter 467 418 11.7%
Mankato MSA single-family building permitsJune 12 10 20.0%
Southwest Minnesota Leading Economic Indicators IndexJune (June 1999 = 100) 190.8 188.2 1.4%
SCSU Southwest Minnesota Leading Economic Indicators Index

4
Southwest Minnesota Business Filings
Total New Business Filings—Southwest Minnesota Planning Area (12-month moving total)
Quarter II: 2015
III: 2015
IV: 2015
I: 2016
II: 2016
2016 Quarter II: Percent change from prior year
Southwest Minnesota Total New Business Filings 646 518 550 665 697 7.9%
The graphs in this section show the 12-month moving total for the various new business filings in Southwest Minnesota that are registered with the Office of the Minnesota Secretary of State. Total new business filings rose by 7.9 percent from year earlier levels in the second quarter. This series has now begun to rise again after declining throughout much of 2015. Note that the abrupt increase in new filings in the middle of 2008 is largely a result of increased new LLC filings. This outlier is related to considerably higher filings in the construction industry and appears to be a one-time only transitory event seen in the data in all regions of Minnesota (although less so in the southwest region).
Year
Filin
gs

5
Business Filings
New business incorporations trended downward sharply in Southwest Minnesota from 2005 to 2011, then levelled off until 2013. Since that time, the downward trend has resumed. Second quarter 2016 new regional incorporations decreased by 5.1 percent compared to the same quarter in 2015.
Quarter II: 2015
III: 2015
IV: 2015
I: 2016
II: 2016
2016 Quarter II: Percent change from prior year
Southwest Minnesota New Business Incorporations 59 34 61 56 56 -5.1%
New Incorporations—Southwest Minnesota Planning Area (12-month moving total)
Year
Filin
gs

6
Business Filings
New Limited Liability Companies—Southwest Minnesota Planning Area (12-month moving total)
Quarter II: 2015
III: 2015
IV: 2015
I: 2016
II: 2016
2016 Quarter II: Percent change from prior year
Southwest Minnesota New Limited Liability Companies 359 321 291 391 411 14.5%
There has been a move in Southwest Minnesota, as in the rest of the state, away from traditional incorporation and towards the limited liability company (LLC). While new business incorporations remain an important indicator of new business formation in Southwest Minnesota, LLCs are increasingly useful in evaluating regional economic performance. As seen below, there is considerable upward trend in LLCs in Southwest Minnesota since 2005. After sluggishness in 2015, this growth trend appears to have resumed in the recent quarter. New LLC filings jumped 14.5 percent compared to one year earlier in the most recent quarter.
Year
Filin
gs

7
Business Filings
Second quarter assumed names fell by 3 percent compared to the same period in 2015. As can be seen in the accompanying figure, while this series has been very volatile in recent years, new assumed names are little changed since the beginning of 2013.
New Assumed Names—Southwest Minnesota Planning Area (12-month moving total)
Quarter II: 2015
III: 2015
IV: 2015
I: 2016
II: 2016
2016 Quarter II: Percent change from prior year
Southwest Minnesota New Assumed Names 200 132 163 190 194 -3.0%
Year
Filin
gs

8
Business Filings
There were 36 newly registered non-profits in the second quarter. This is eight more than one year ago. As can be seen in the graph below, the non-profits series has increased considerably since the beginning of 2014.
New Non-Profits—Southwest Minnesota Planning Area (12-month moving total)
Quarter II: 2015
III: 2015
IV: 2015
I: 2016
II: 2016
2016 Quarter II: Percent change from prior year
Southwest Minnesota New Non-Profits 28 31 35 28 36 28.6%
Year
Filin
gs

9
Business Filings
The first map shown below is a visual representation of new business formation around the Southwest Minnesota planning area in the second quarter of 2016. The densest areas of new business formation are in the Mankato metro. Little pockets of new business formation can also be found in Marshall, Redwood Falls, Worthington, Fairmont, New Ulm, New Prague, Waseca, Granite Falls, Montevideo and St. Peter. Well-traveled roadways are also a predictor of new business formation in Southwest Minnesota.
Southwest Minnesota Planning Area--New Business Formation--Quarter 2: 2016

10
Business Filings
The second map shows new business filings for the state as a whole. This visual aid demonstrates the considerable extent to which the Twin Cities metro area dominates new business formation in the state. The map shows how the Twin Cities metro stretches along roadways into the Southeast, Southwest and Central planning areas. The map demonstrates the importance of cities and roadways in encouraging economic development. With each passing quarter, St. Cloud, Rochester, and Mankato appear to be more connected to the Twin Cities metro.
Minnesota--New Business Formation--Quarter 2: 2016

11
Southwest Minnesota Labor Market ConditionsEmployment of residents of the Southwest Minnesota planning area fell by 1.2 percent over the past year. As can be seen in the accompanying graph, the 12-month moving employment average trended upward from the middle of 2014 until the end of 2015, but has declined precipitously in the last three quarters. Using non-seasonally adjusted data, Southwest Minnesota planning area employment in June 2016 (see accompanying table) was 214,522, a decrease of 2,545 over the prior year.
Note: seasonally adjusted labor market data are typically not available to evaluate regional economic performance so some series have been created to illustrate seasonal patterns of the regional labor market. Graphs of these indicators are found in this section of the report. Tabular data are not seasonally adjusted.
Employment—Southwest Minnesota Planning Area (12-month moving average)
Month June 2015
January2016
February 2016
March2016
April2016
May2016
June2016
Employment (Not seasonally
adjusted)217,067 216,983 213,958 216,151 215,616 215,263 214,522
Year
Empl
oym
ent

12
Labor Market Conditions
Empl
oym
ent
The seasonally adjusted unemployment rate in Southwest Minnesota appears to have bottomed out in 2015 and has started to inch up in recent quarters. Both the seasonally and non-seasonally adjusted unemployment rates rose in the second quarter. The non-seasonally adjusted measure now stands at 4.1 percent — an increase from the 3.8 percent rate recorded in June 2015.
Unemployment Rate, seasonally adjusted—Southwest Minnesota Planning Area
Month June 2015
January2016
February 2016
March2016
April2016
May2016
June2016
Unemployment rate(not seasonally adjusted) 3.8% 4.9% 4.8% 4.9% 3.8% 3.4% 4.1%
Year
Une
mpl
oym
ent r
ate

13
Labor Market Conditions
New claims for unemployment insurance in June 2016 were 12.9 percent higher than one year earlier. The accompanying graph shows a seasonally adjusted series of initial unemployment claims. This series drifted upward in 2015 but has levelled out in recent quarters.
Total Initial Claims for Unemployment Insurance, seasonally adjusted—Southwest Minnesota Planning Area
Period June 2015
January2016
February 2016
March2016
April2016
May2016
June2016
Initial claims(Not seasonally adjusted) 1,224 2,053 1,319 1,181 982 1,636 1,382
Year
Clai
ms

14
Labor Market Conditions
The average weekly wage rose by $32 in Southwest Minnesota over the year ending in the fourth quarter of 2015 (this is the most recently available data). This increase represents a 4.3 percent annual rise in the average weekly wage. At $783, the average weekly wage in the Southwest Minnesota planning area is the second lowest of Minnesota’s six planning areas. Only the Northwest Minnesota region has lower weekly earnings.
Quarter 2010:IV 2011:IV 2012:IV 2013:IV 2014:IV 2015:IV Average Weekly Wage $670 $669 $695 $735 $751 $783
Job Vacancies per 100 Unemployed--Southwest Minnesota Planning Area
Quarter
Wag
e

15
Labor Market Conditions
The Southwest Minnesota labor force contracted by 2,055–a 0.9 percent annual decrease—over the year ending June 2016. As can be seen in the accompanying figure, the planning area’s labor force had trended upward since the middle months of 2014, but has declined in 2016.
Labor Force—Southwest Minnesota Planning Area (12-month moving average)
Year (June) 2011 2012 2013 2014 2015 2016Labor Force
(Not seasonally adjusted) 228,578 227,522 223,168 218,820 225,667 223,612
Year
Labo
r For
ce

16
The figure below shows the 12-month moving total for Southwest Minnesota bankruptcies since the second quarter of 2007 (shortly before the beginning of the Great Recession). As can be seen in the figure, this moving total increased until the end of 2009, and steadily declined until the fourth quarter of last year. With 484 bankruptcies over the past twelve months, the level of bankruptcies in Southwest Minnesota has flattened out at historically low levels.
Southwest Minnesota Bankruptcies (12-month moving total)
Southwest Minnesota Bankruptcies
Year (Second Quarter) 2011 2012 2013 2014 2015 2016Annual Bankruptcies(Not seasonally adjusted) 938 812 704 600 472 484
Quarter
Bank
rupt
cies

17
Economic Indicators
Mankato-North Mankato MSA Indicators Period Covered Current
Period Prior Year Annual Percent Change
Long-Term Average (since 1999, unless noted)
Labor Market
Employment June 2016 (m) 56,608 55,361 2.3% ↑ 0.9%
Goods-Producing Employment June 2016 (m) 10,043 10,212 -1.7% ↓ -0.7%
Average Weekly Work Hours - Private Sector June 2016 (m) 30.6 31 -1.3% ↓ 33.1 (since 2008)
Average Earnings Per Hour - Private Sector June 2016 (m) $23.36 $22.00 6.2% ↑ 0.8% (since 2008)
Unemployment Rate June 2016 (m) 3.4% 3.1% NA ↑ 4.1%
Labor Force June 2016 (m) 59,289 58,561 1.2% ↑ 0.6%
Initial Jobless Claims June 2016 (m) 287 252 13.9% ↑ NA
Business Formation
Total New Business Filings Second Quarter 2016 (q) 226 199 13.6% ↑ 155 (since 2000)
New Business Incorporations Second Quarter 2016 (q) 21 21 0.0% ↔ 25 (since 2000)
New Limited Liability Companies Second Quarter 2016 (q) 138 112 23.2% ↑ 71 (since 2000)
New Assumed Names Second Quarter 2016 (q) 57 62 -8.1% ↓ 51 (since 2000)
New Non-profits Second Quarter 2016 (q) 10 4 150.0% ↑ 8 (since 2000)
Mankato / North Mankato Residential Building Permit Valuation,in thousands
June 2016 (m) 5,463 2,890 89.0% ↑ NA
Mankato / North Mankato Cost of Living Index
First Quarter 2016 (q) 93.5 95.3 -1.9% ↓ NA
Southwest Minnesota contains the Mankato/North Mankato MSA, a region of diversified employment sectors with an economic foundation that is based on education, manufacturing, health services and agriculture. The Mankato area accounts for more than one-quarter of the planning area’s employment, so performance in the entire region is greatly influenced by its largest city. As the accompanying table shows, Mankato employment increased over the year ending June 2016. Average hourly earnings rose and the labor force expanded. Total new business filings rose, the value of residential building permits increased and the relative cost of living declined. Initial jobless claims jumped 13.9 percent from June 2015 to now. The length of the workweek fell and the unemployment rate rose.
(m) represents a monthly series

18
Economic Indicators
State and National Indicators
Across the state there was growth in payrolls, higher earnings per hour, and more average weekly hours worked in the private sector over the past twelve months (note that June earnings were lower than three months earlier). The seasonally adjusted unemployment rate rose over the past twelve months. Indicators from the Federal Reserve Bank of Philadelphia suggest improved current and future conditions in the state economy. The Minnesota Business Conditions index improved over the past three months, but was lower than year ago levels. Milk prices continue to fall across the state. As was noted in last quarter’s report, this has been a particularly difficult period for those who make a living in milk production. Enplanements at the Minneapolis-St. Paul airport increased by 2.7 percent over the last twelve months.
The national economic indicators reported in the table are mixed. Over the past twelve months, industrial production and stock prices declined, building permits are lower, and oil prices have continued to fall. However, employment, consumer expenditures, and income all experienced growth over the recent quarter (and year) and the national unemployment rate fell. Retail sales improved. This all seems to fit with a general outlook of positive growth that is lower than normal for the U.S. economy. While there is little fear of recession, sluggish growth conditions persist.
MINNESOTA Indicators Jun 2016 Mar 2015 Jun 2015
Change from one
quarter agoAnnual Change
Nonfarm payroll employment, SA 2,891,800 2,876,200 2,859,500 0.5% 1.1%Average weekly hours worked, private sector 34.3 33.5 34.1 2.4% 0.6%Unemployment rate, seasonally adjusted 3.8% 3.8% 3.6% NA NAEarnings per hour, private sector $26.64 $27.05 $25.71 -1.5% 3.6%Philadelphia Fed Coincident Indicator, MN 180.34 179.04 175.78 0.7% 2.6%Philadelphia Fed Leading Indicator, MN 1.70 1.31 1.50 29.8% 13.3%Minnesota Business Conditions Index 51.6 50.7 54.3 1.8% -5.0%Price of milk received by farmers (cwt) $15.00 $15.80 $17.90 -5.1% -16.2%Enplanements, MSP airport, thousands 1,725.6 1,662.9 1,680.9 3.8% 2.7%
NATIONAL Indicators Jun 2016 Mar 2015 Jun 2015
Change from one
quarter agoAnnual Change
Nonfarm payroll employment, SA, thousands 144,193 143,733 141,724 0.3% 1.7%Industrial production, index, SA 104.1 103.4 104.9 0.7% -0.8%Real retail sales, SA ($) 190,850 188,259 187,323 1.4% 1.9%Real personal income less transfers ($, bill.) 11,849.7 11,828.7 11,661.1 0.2% 1.6%Real personal consumption expenditures ($, bill.) 11,514.3 11,374.4 11,199.2 1.2% 2.8%Unemployment rate, SA 4.9% 5.0% 5.3% NA NANew building permits, SA, thousands 22,634 19,300 24,190 17.3% -6.4%Standard & Poor’s 500 stock price index 2,083.9 2,022 2,099 3.1% -0.7%Oil, price per barrel in Cushing, OK $48.76 $37.55 $59.82 29.9% -18.5%

19
Sources
The Southwest Minnesota Quarterly Economic and Business Conditions Report is a collaboration between the Office of the Minnesota Secretary of State and the School of Public Affairs Research Institute (SOPARI) of St. Cloud State University. All calculations and text are the result of work by SOPARI, which is solely responsible for errors and omissions herein.
Text authored by Professors King Banaian and Rich MacDonald of the Economics Department of St. Cloud State University. Research assistance provided by Alex Franta. Professor David Wall of the SCSU Geography Department provided GIS assistance.
Sources
Council for Community and Economic Research: Cost of Living Index.
Creighton University Heider College of Business: Minnesota Business Conditions Index, Rural MainStreet Index.
Federal Reserve Bank of Philadelphia: Minnesota Coincident Indicator Index, Minnesota Leading Indicators Index.
Federal Reserve Board of Governors: Industrial Production.
Institute for Supply Management: Manufacturing Business Survey, Purchasing Managers Index.
Metropolitan Airports Commission: MSP Enplanements.
Minnesota Department of Employment and Economic Development (and U.S. Department of Labor Bureau of Labor Statistics):
Average Hourly Earnings, Average Weekly Work Hours, Employment, Initial Claims for Unemployment Insurance, Job Vacancies, Labor
Force, Manufacturing Employment, Unemployment Rate.
Office of the Minnesota Secretary of State: Assumed Names, Business Incorporations, Limited Liability Companies, Non-Profits.
Standard & Poor’s: Standard & Poor’s 500 Stock Price Index.
Thomson Reuters and University of Michigan: Index of Consumer Sentiment
U.S. Bankruptcy Courts: Bankruptcies
U.S. Bureau of Census: Durable Goods Orders, Housing Permits, Residential Building Permits, Retail Sales.
U.S. Department of Agriculture: Milk Prices.
U.S. Department of Commerce Bureau of Economic Analysis: Real Personal Consumption, Real Personal Income, Real Wages and
Salaries.
U.S. Energy Information Administration: Oil Prices.