Embed Size (px)
Citation preview
SOUTHWEST MINNESOTAFARM BUSINESS MANAGEMENT ASSOCIATION
ANNUAL REPORT
Staff paper #P21-2Department of Applied Economics
University of MinnesotaSaint Paul, MN 55108
April 2021
In Cooperation with:Center for Farm Financial Management · Department of Applied Economics · University of Minnesota Extension
College of Food, Agricultural and Natural Resource Sciences · University of Minnesota
2020
SOUTHWEST MINNESOTAFARM BUSINESS MANAGEMENT
ASSOCIATION
RoseauKittson
Marshall
Pennington
Polk Red Lake
Lake of the Woods
Beltrami
Norman Mahnomen
Cle
arw
ater
Clay Becker
Otter Tail
Wilk
in
Grant
Stevens Pope Stearns
Douglas
Trav
erse
Big Stone
Swift
ChippewaLac Qui Parle
Renville
Kan
diy
ohi
MeekerWright
McLeod
Hennepin
Carver
SibleyScott
Brown
Nicollet Rice
Blue Earth
Le Sueur
Was
eca
Watonwan
MartinJackson
CottonwoodMurray
RedwoodLincoln
Pip
esto
ne
NoblesRock
Lyon
Yellow Medicine
Faribault Freeborn Mower Fillmore Houston
WinonaOlmstedDodgeStee
le
Wabasha
Goodhue
Dakota
Anoka
Ramse
y
Was
hing
ton
IsantiSherburne
Pine
CarltonAitkin
Cro
w W
ing
Wad
ena
Chi
sag
o
Morrison
Benton
Todd
Kan
abec
Mill
e La
cs
Cass
Hub
bar
d
Itasca
Koochiching
St. LouisLake
Cook
Southwest Minnesota Farm Business Management Association Southwest Research and Outreach Center23669 130th StreetLamberton, MN 56152507-752-5081
Garen Paulson - Extension Educator and Field StaffTonya Knorr - Field StaffNick Sandager - Field StaffGretchen Thillen - Principal Office and Administrative Specialist
Executive Summary
2020 Annual Report of the Southwest Minnesota Farm Business Management Association
by Pauline A. Van Nurden, Garen J. Paulson, Tonya L. Knorr, Rachel A. Purdy, Nick Sandager, and Dale W. Nordquist
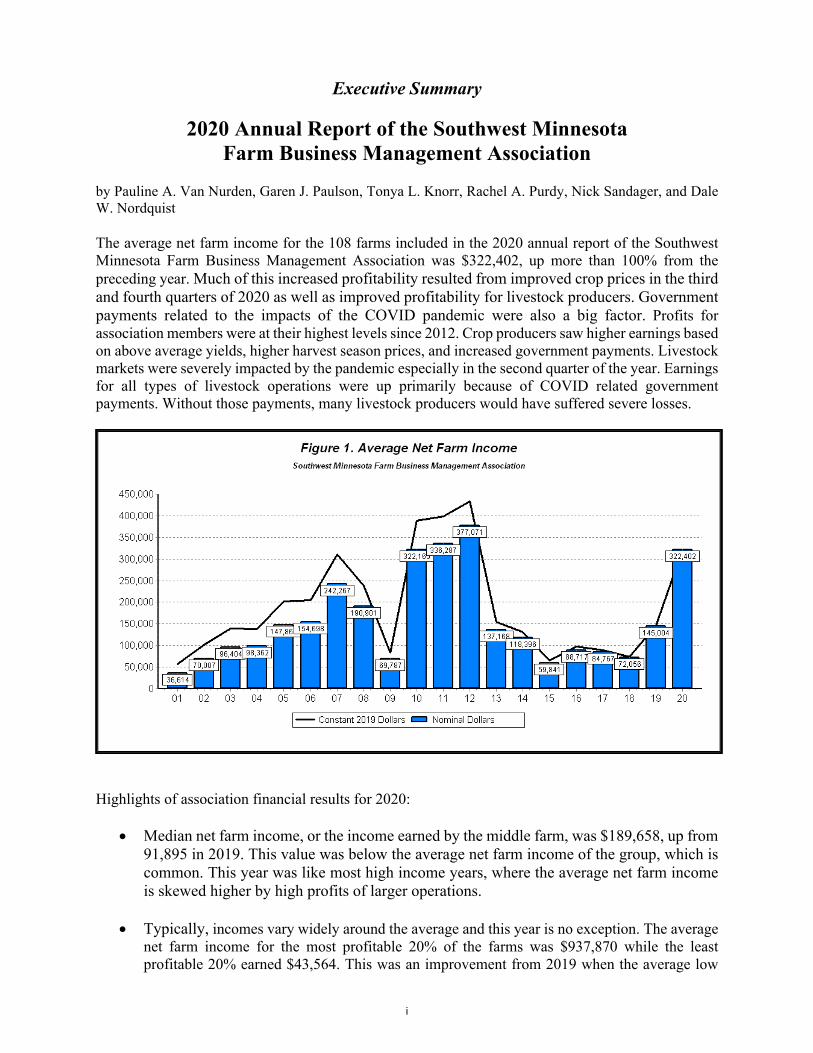
The average net farm income for the 108 farms included in the 2020 annual report of the Southwest Minnesota Farm Business Management Association was $322,402, up more than 100% from the preceding year. Much of this increased profitability resulted from improved crop prices in the third and fourth quarters of 2020 as well as improved profitability for livestock producers. Government payments related to the impacts of the COVID pandemic were also a big factor. Profits for association members were at their highest levels since 2012. Crop producers saw higher earnings based on above average yields, higher harvest season prices, and increased government payments. Livestock markets were severely impacted by the pandemic especially in the second quarter of the year. Earnings for all types of livestock operations were up primarily because of COVID related government payments. Without those payments, many livestock producers would have suffered severe losses.
Highlights of association financial results for 2020:
Median net farm income, or the income earned by the middle farm, was $189,658, up from91,895 in 2019. This value was below the average net farm income of the group, which iscommon. This year was like most high income years, where the average net farm incomeis skewed higher by high profits of larger operations.
Typically, incomes vary widely around the average and this year is no exception. The averagenet farm income for the most profitable 20% of the farms was $937,870 while the leastprofitable 20% earned $43,564. This was an improvement from 2019 when the average low
i
profit farm suffered a loss. As is the case in most high income years, the profits for the high income group were heavily skewed by the earnings of large livestock operations.
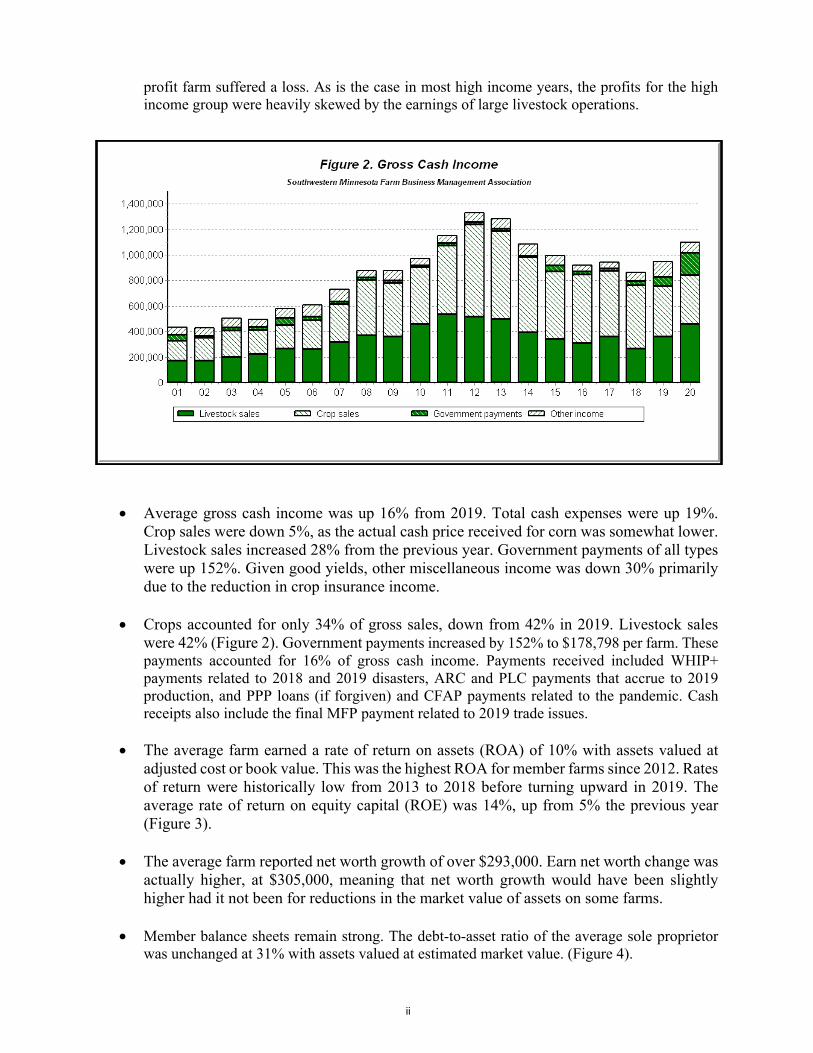
Average gross cash income was up 16% from 2019. Total cash expenses were up 19%.Crop sales were down 5%, as the actual cash price received for corn was somewhat lower.Livestock sales increased 28% from the previous year. Government payments of all typeswere up 152%. Given good yields, other miscellaneous income was down 30% primarilydue to the reduction in crop insurance income.
Crops accounted for only 34% of gross sales, down from 42% in 2019. Livestock saleswere 42% (Figure 2). Government payments increased by 152% to $178,798 per farm. Thesepayments accounted for 16% of gross cash income. Payments received included WHIP+payments related to 2018 and 2019 disasters, ARC and PLC payments that accrue to 2019production, and PPP loans (if forgiven) and CFAP payments related to the pandemic. Cashreceipts also include the final MFP payment related to 2019 trade issues.
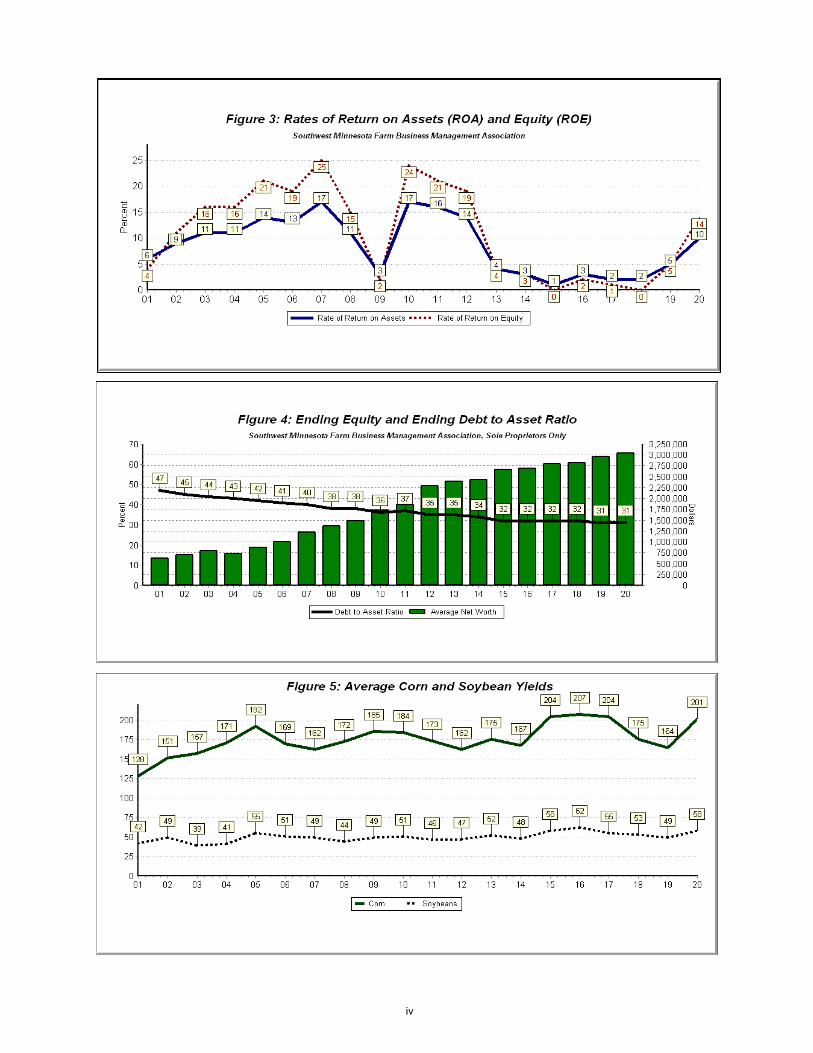
The average farm earned a rate of return on assets (ROA) of 10% with assets valued atadjusted cost or book value. This was the highest ROA for member farms since 2012. Ratesof return were historically low from 2013 to 2018 before turning upward in 2019. Theaverage rate of return on equity capital (ROE) was 14%, up from 5% the previous year(Figure 3).
The average farm reported net worth growth of over $293,000. Earn net worth change wasactually higher, at $305,000, meaning that net worth growth would have been slightlyhigher had it not been for reductions in the market value of assets on some farms.
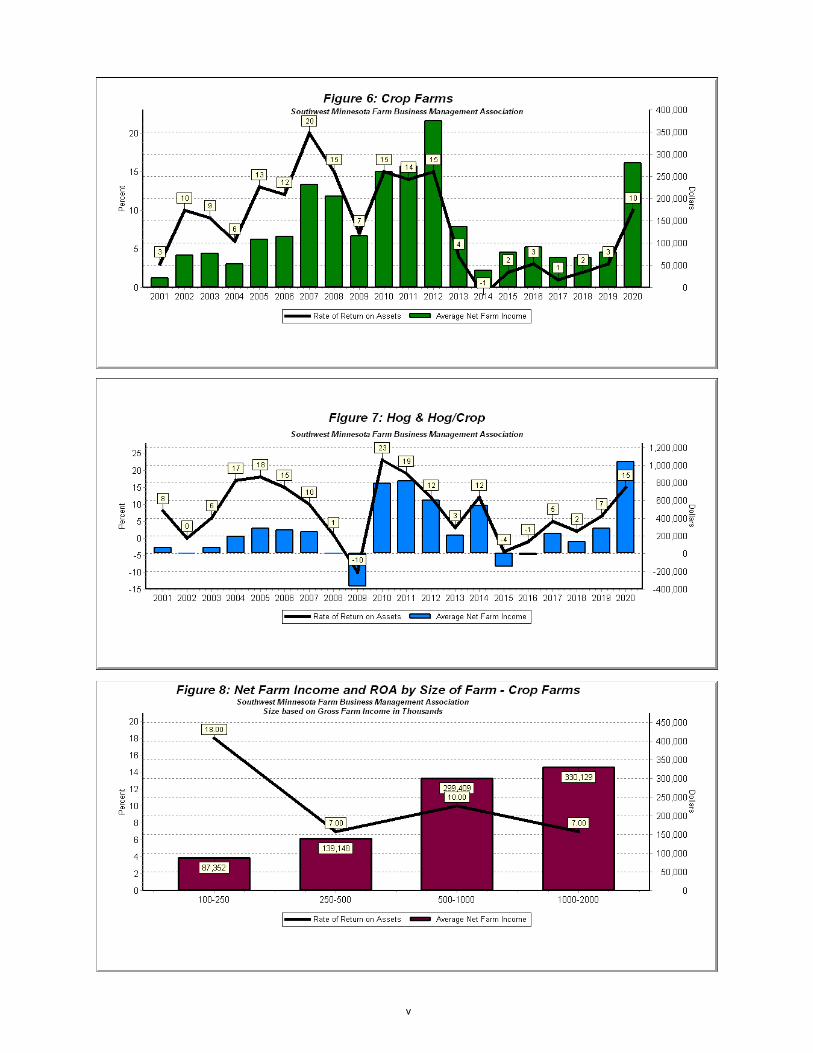
Member balance sheets remain strong. The debt-to-asset ratio of the average sole proprietorwas unchanged at 31% with assets valued at estimated market value. (Figure 4).
ii
The average farm’s working capital improved by over $190,000 in 2020. The average farmwas in a strong working capital position at the end of the year, with working capital togross revenue of 46%, significantly higher than the often used 30% benchmark for strongliquidity.
Debt repayment capacity was very strong. The average farm reported a term debt coverageratio of 4.3:1. A debt repayment coverage position of 4.3:1 means the average farmgenerated $4.30 in income from farm and non-farm sources for each $1.00 of scheduleddebt payments.
iii
iv
v
Crops
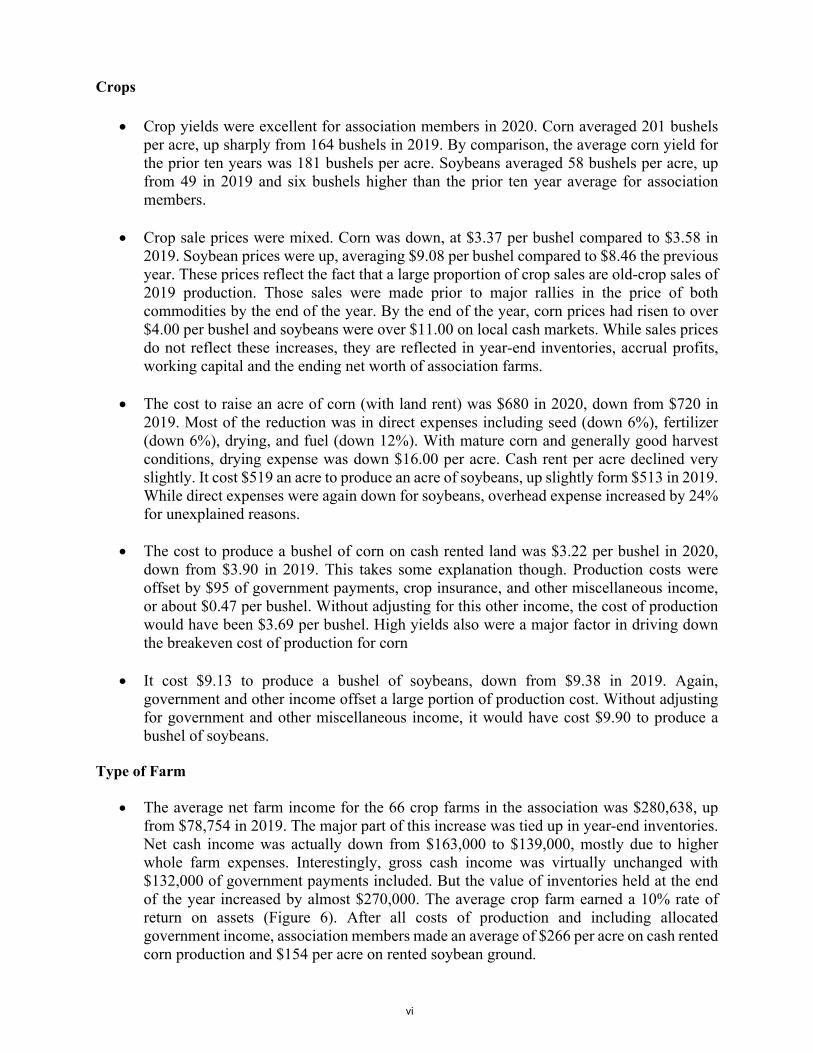
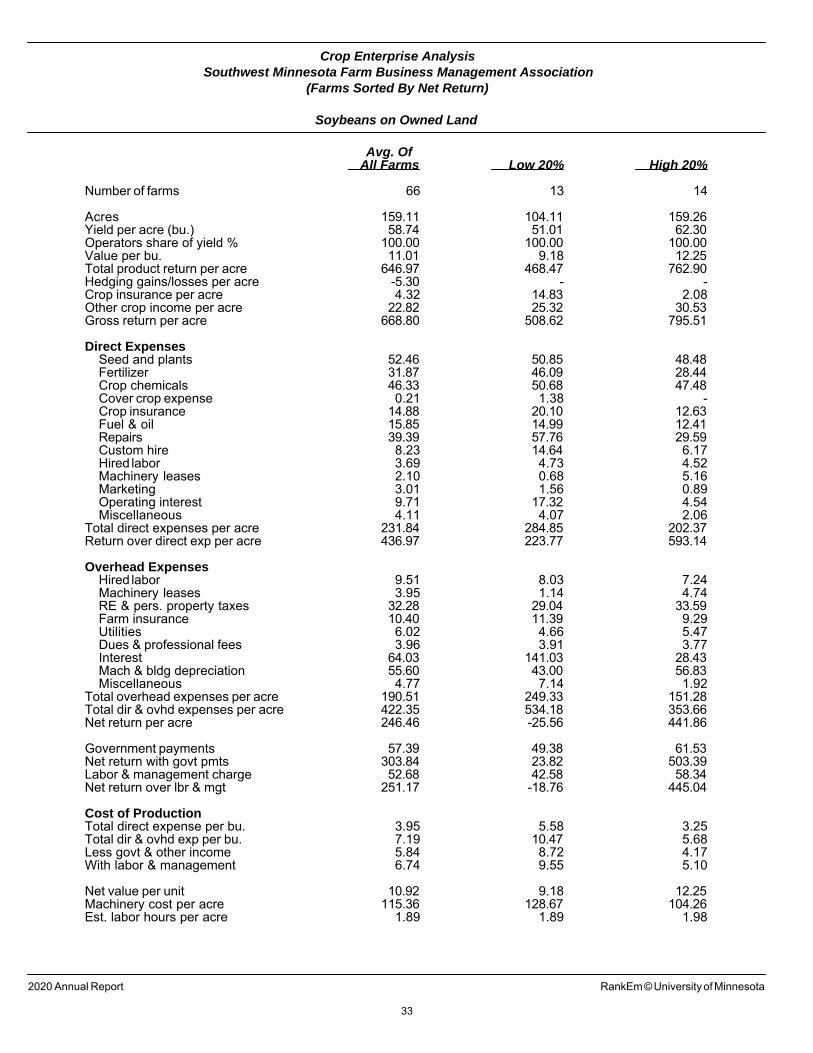
Crop yields were excellent for association members in 2020. Corn averaged 201 bushelsper acre, up sharply from 164 bushels in 2019. By comparison, the average corn yield forthe prior ten years was 181 bushels per acre. Soybeans averaged 58 bushels per acre, upfrom 49 in 2019 and six bushels higher than the prior ten year average for associationmembers.
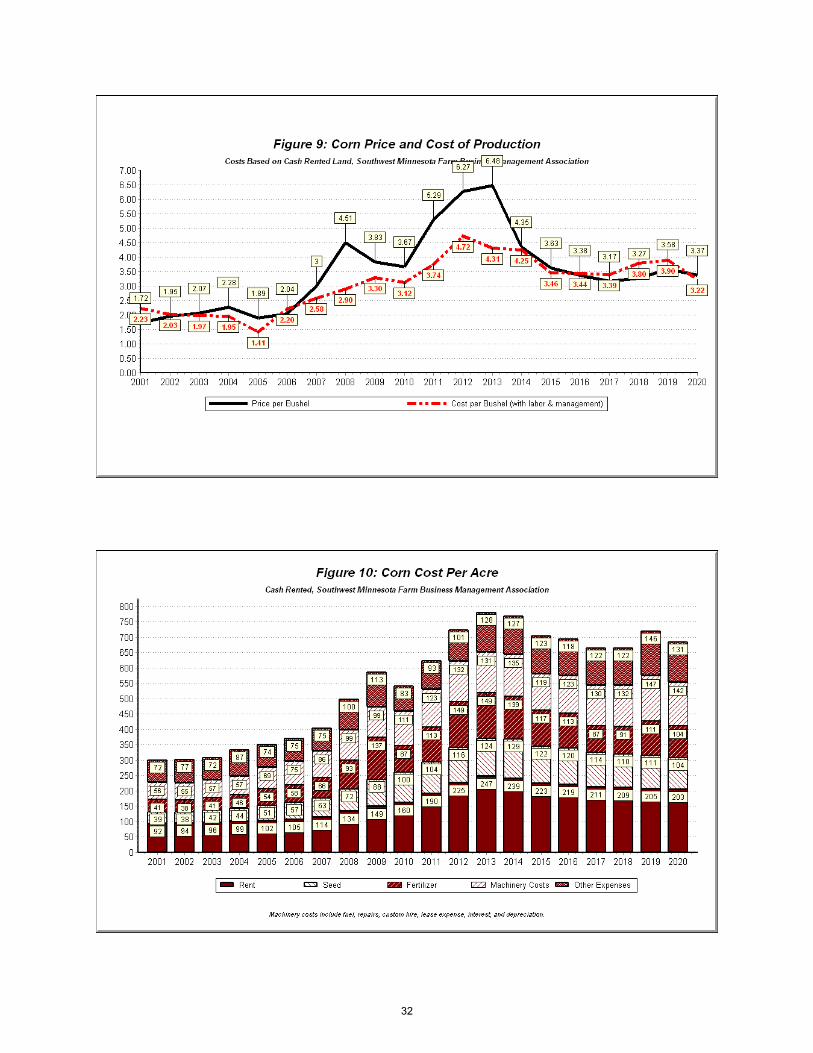
Crop sale prices were mixed. Corn was down, at $3.37 per bushel compared to $3.58 in2019. Soybean prices were up, averaging $9.08 per bushel compared to $8.46 the previousyear. These prices reflect the fact that a large proportion of crop sales are old-crop sales of2019 production. Those sales were made prior to major rallies in the price of bothcommodities by the end of the year. By the end of the year, corn prices had risen to over$4.00 per bushel and soybeans were over $11.00 on local cash markets. While sales pricesdo not reflect these increases, they are reflected in year-end inventories, accrual profits,working capital and the ending net worth of association farms.
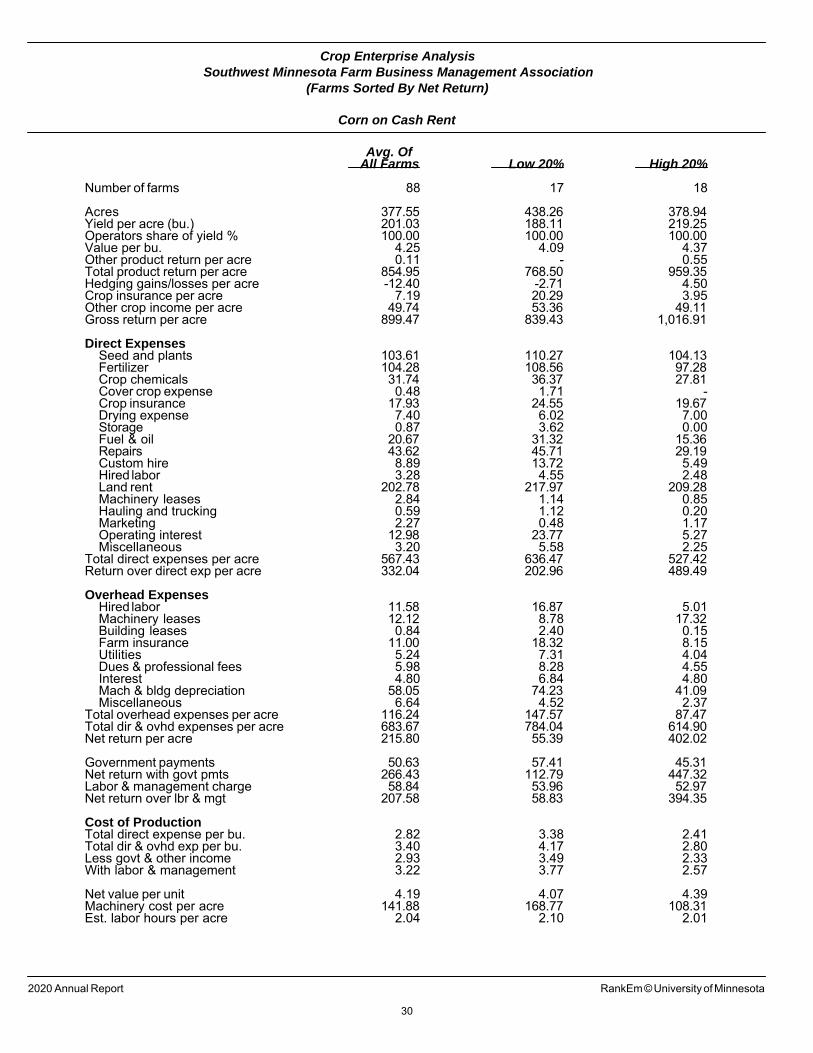
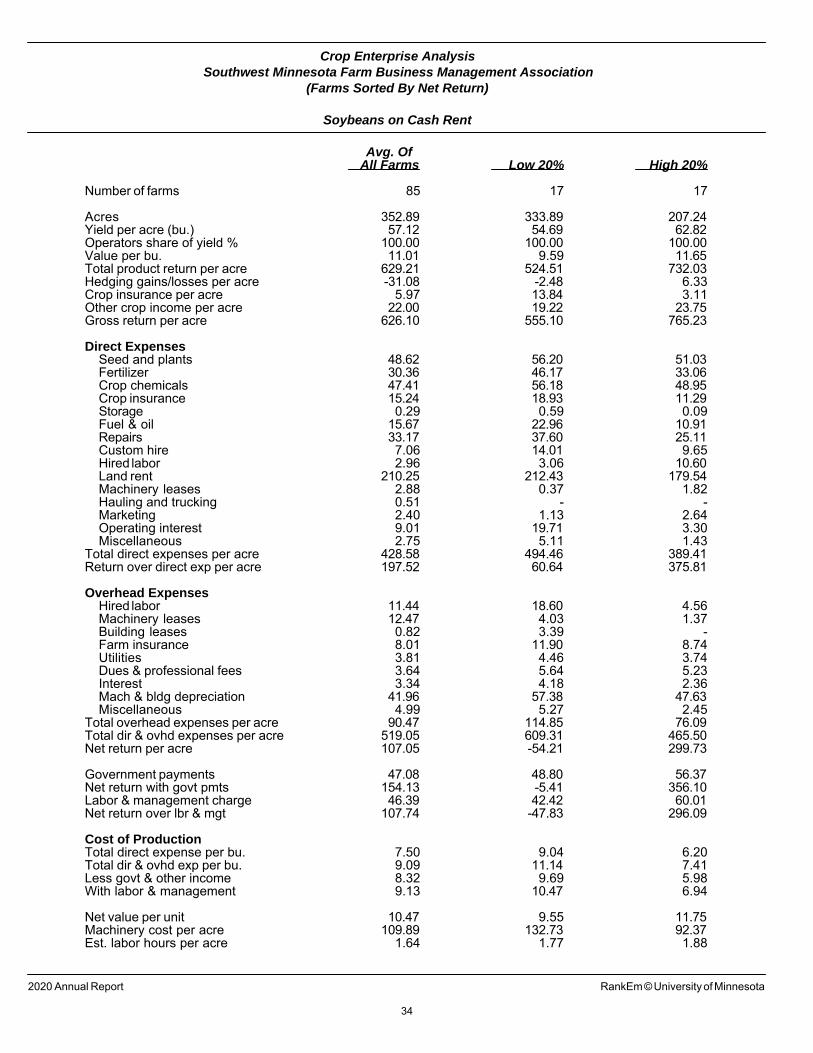
The cost to raise an acre of corn (with land rent) was $680 in 2020, down from $720 in2019. Most of the reduction was in direct expenses including seed (down 6%), fertilizer(down 6%), drying, and fuel (down 12%). With mature corn and generally good harvestconditions, drying expense was down $16.00 per acre. Cash rent per acre declined veryslightly. It cost $519 an acre to produce an acre of soybeans, up slightly form $513 in 2019.While direct expenses were again down for soybeans, overhead expense increased by 24%for unexplained reasons.
The cost to produce a bushel of corn on cash rented land was $3.22 per bushel in 2020,down from $3.90 in 2019. This takes some explanation though. Production costs wereoffset by $95 of government payments, crop insurance, and other miscellaneous income,or about $0.47 per bushel. Without adjusting for this other income, the cost of productionwould have been $3.69 per bushel. High yields also were a major factor in driving downthe breakeven cost of production for corn
It cost $9.13 to produce a bushel of soybeans, down from $9.38 in 2019. Again,government and other income offset a large portion of production cost. Without adjustingfor government and other miscellaneous income, it would have cost $9.90 to produce abushel of soybeans.
Type of Farm
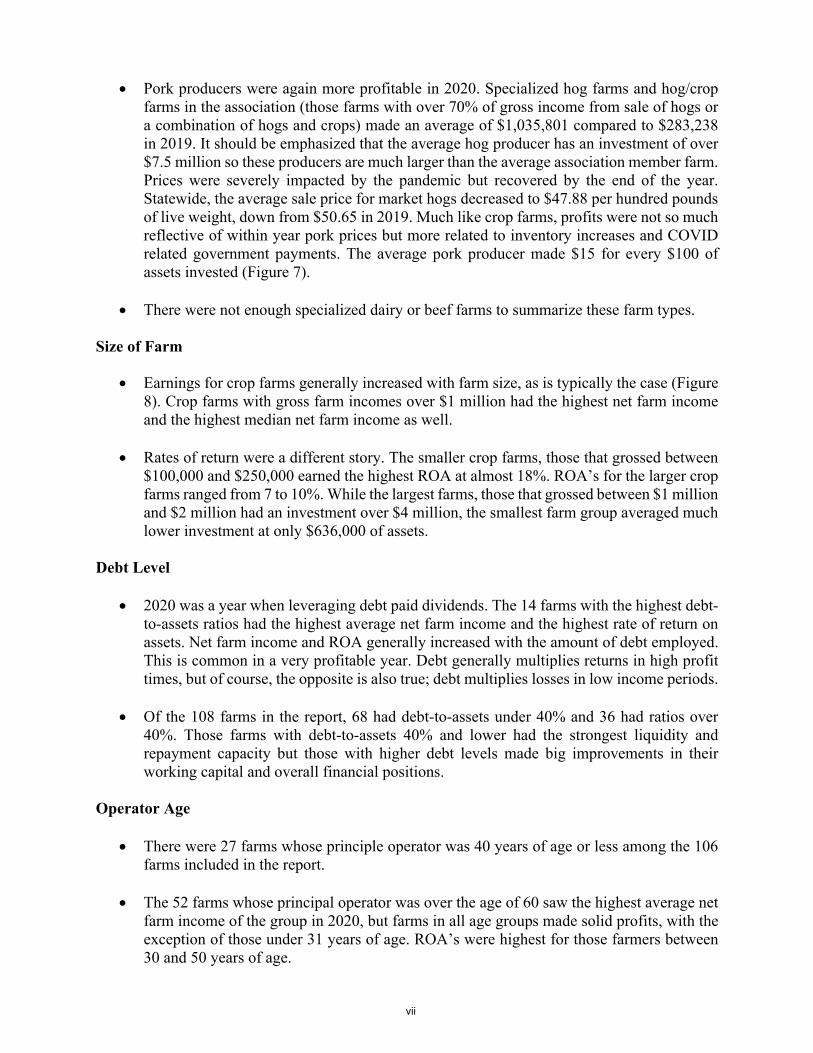
The average net farm income for the 66 crop farms in the association was $280,638, upfrom $78,754 in 2019. The major part of this increase was tied up in year-end inventories.Net cash income was actually down from $163,000 to $139,000, mostly due to higherwhole farm expenses. Interestingly, gross cash income was virtually unchanged with$132,000 of government payments included. But the value of inventories held at the endof the year increased by almost $270,000. The average crop farm earned a 10% rate ofreturn on assets (Figure 6). After all costs of production and including allocatedgovernment income, association members made an average of $266 per acre on cash rentedcorn production and $154 per acre on rented soybean ground.
vi
Pork producers were again more profitable in 2020. Specialized hog farms and hog/cropfarms in the association (those farms with over 70% of gross income from sale of hogs ora combination of hogs and crops) made an average of $1,035,801 compared to $283,238in 2019. It should be emphasized that the average hog producer has an investment of over$7.5 million so these producers are much larger than the average association member farm.Prices were severely impacted by the pandemic but recovered by the end of the year.Statewide, the average sale price for market hogs decreased to $47.88 per hundred poundsof live weight, down from $50.65 in 2019. Much like crop farms, profits were not so muchreflective of within year pork prices but more related to inventory increases and COVIDrelated government payments. The average pork producer made $15 for every $100 ofassets invested (Figure 7).
There were not enough specialized dairy or beef farms to summarize these farm types.
Size of Farm
Earnings for crop farms generally increased with farm size, as is typically the case (Figure8). Crop farms with gross farm incomes over $1 million had the highest net farm incomeand the highest median net farm income as well.
Rates of return were a different story. The smaller crop farms, those that grossed between$100,000 and $250,000 earned the highest ROA at almost 18%. ROA’s for the larger cropfarms ranged from 7 to 10%. While the largest farms, those that grossed between $1 millionand $2 million had an investment over $4 million, the smallest farm group averaged muchlower investment at only $636,000 of assets.
Debt Level
2020 was a year when leveraging debt paid dividends. The 14 farms with the highest debt-to-assets ratios had the highest average net farm income and the highest rate of return onassets. Net farm income and ROA generally increased with the amount of debt employed.This is common in a very profitable year. Debt generally multiplies returns in high profittimes, but of course, the opposite is also true; debt multiplies losses in low income periods.
Of the 108 farms in the report, 68 had debt-to-assets under 40% and 36 had ratios over40%. Those farms with debt-to-assets 40% and lower had the strongest liquidity andrepayment capacity but those with higher debt levels made big improvements in theirworking capital and overall financial positions.
Operator Age
There were 27 farms whose principle operator was 40 years of age or less among the 106farms included in the report.
The 52 farms whose principal operator was over the age of 60 saw the highest average netfarm income of the group in 2020, but farms in all age groups made solid profits, with theexception of those under 31 years of age. ROA’s were highest for those farmers between30 and 50 years of age.
vii
Projected Profitability
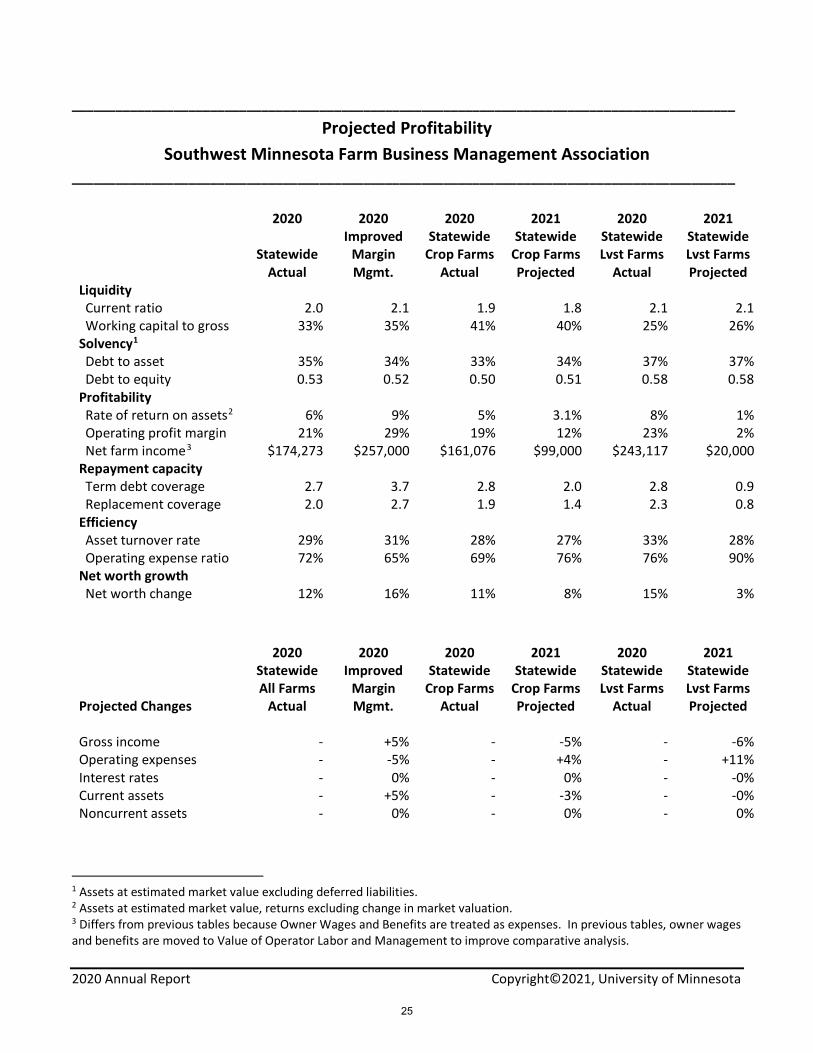
The Projected Profitability report displays actual results for Minnesota farms in 2020 along with projected financial results for 2021. Projected results are based on the authors’ estimates of changes in revenue, operating expenses, interest rates, and asset values. Assumptions are displayed at the bottom of the page. All calculations include SW association farms, as well as farms enrolled in Minnesota State Farm Business Management programs.
2020 All Farms Actual – Average financial results for all farms in 2020. Balance sheetmeasures reflect the average position of Minnesota farms at the end of the year.
2020 Improved Margin Management – Potential impacts of small changes in farmperformance. If Minnesota farms had, on average, improved sales by 5% and cut costs by5%, the net farm income of the average farm would have increased by nearly 50%.
2020 Statewide Crop Farms Actual – Average financial results for the 1307 crop farmsin the Minnesota database for 2020.
2021 Statewide Crop Farms Projected – Even with expected higher crop prices, theaverage net income for Minnesota crop farms is expected to decrease in 2021 because ofreduced government payments and a return to trendline yields. Government payments andother crop income (like crop insurance) are expected to see decreases in this model, as thead hoc payments related to disasters, trade deficits, and the pandemic are expected to belimited in 2021. Operating expenses are expected to increase somewhat because of higherinput and energy costs.
2020 Statewide Livestock Farms Actual – Average financial results for the 612 farmersin the statewide database who received a major portion of their income from livestock andmilk sales for 2020.
2021 Statewide Livestock Farms Projected – Statewide livestock farm profits areprojected to decrease on average in 2021, primarily due to reduced government paymentsand higher feed costs. Hog producers are expected to see profitability for the coming year,even with lower government payments and higher input prices, especially feed costs. Dairyand beef producers are expected to see lower revenues based as stagnant to lower prices,coupled with increased operating expenses, like feed. This is expected to lead to lowerprofits overall for livestock producers in the state in 2021.
The assumptions used to project these results are subjective. We offer these projections as a most likely scenario to help members consider management decisions in a period of tightening margins. Predictions are currently more challenging, as the continued impact of COVID is not known.
Full Report
The complete report provides additional information on whole farm financial performance as well as detailed information on crop and livestock enterprise profitability. The report also includes whole-farm financial condition and performance by business size, type of farm, debt-to-asset ratio, and age of operator.
viii

2020 Annual Report of the Southwest Minnesota1 Farm Business Management Association
by
Pauline A. Van Nurden, Garen J. Paulson, Tonya L. Knorr, Rachel A. Purdy, Nick Sandager, and Dale W. Nordquist2
This report summarizes the individual farm records of the members of the Southwest Minnesota Farm Business Management Association for 2020. Whole-farm information and enterprise costs and returns are reported. The year-end analysis of the individual farms was performed by the Association fieldstaff using the FINPACK software from the Center for Farm Financial Management. The individual analyses were summarized at the Department of Applied Economics using RankEm Central. In addition to the average of all farms, the averages for the high and low-income groups are also presented. The tables are divided into four major groups: whole-farm information, crop enterprises, livestock enterprises, and summary information. The summary information includes whole farm historical trends and information by farm size, type of farm, debt to asset ratio, and operator age. Of the 118 farms in the Southwest Association, the data for 108 farms are included in this report. The rest were omitted because the records were incomplete at the time this report was prepared. In addition to this report, members receive an annual farm business analysis; on-farm instructional visits; end-of-year income tax planning and preparation; periodic meetings, tours, and seminars; a monthly newsletter; and other managerial and educational assistance. Each farmer pays an annual fee which covers much of the cost, with the balance defrayed by University of Minnesota Extension and research programs of the University of Minnesota. The livestock enterprise summaries include data from both Southwest Minnesota Farm Management Association farms and Minnesota State Farm Business Management program farms. This provides a greater number of instances for each enterprise with the goal of providing more accurate benchmark information. Minnesota State FBM programs are distributed across the state and include over 2,240 participating farms. We thank the Minnesota State FBM program and participating producers for making this data available to be included in this report.
1This report was partially funded by a Farm Business Management and Benchmarking Grant from the USDA National Institute of Food and Agriculture. 2Van Nurden, Purdy, and Nordquist are Extension Economists–Center for Farm Financial Management (CFFM), University of Minnesota, Twin Cities; Paulson is an Extension Educator—Ag Business Management for the Association; Knorr and Sandager are financial analysts for the Association. Special thanks to Rann Loppnow, Software Development, CFFM; Katie Carr, Administrative Associate, CFFM; and Gretchen Thillen, Southwest Research and Outreach Center. 1
Southwest Minnesota Farm Business Management Association
Distribution of Membership -- 2020
Number of Number of Farm Records County Units Submitted
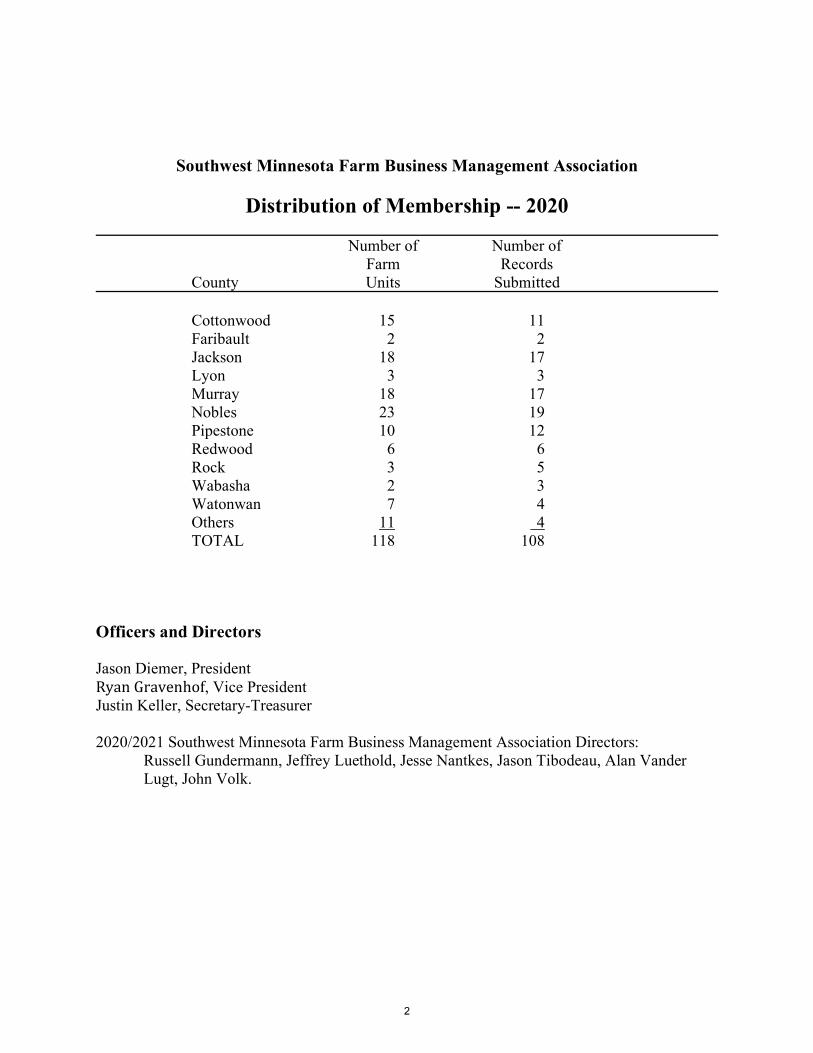
Cottonwood 15 11 Faribault 2 2 Jackson 18 17 Lyon 3 3 Murray 18 17 Nobles 23 19 Pipestone 10 12 Redwood 6 6 Rock 3 5 Wabasha 2 3 Watonwan 7 4 Others 11 4 TOTAL 118 108
Officers and Directors Jason Diemer, President Ryan Gravenhof, Vice President Justin Keller, Secretary-Treasurer 2020/2021 Southwest Minnesota Farm Business Management Association Directors:
Russell Gundermann, Jeffrey Luethold, Jesse Nantkes, Jason Tibodeau, Alan Vander Lugt, John Volk.
2
Southwest Minnesota Farm Business Management Association
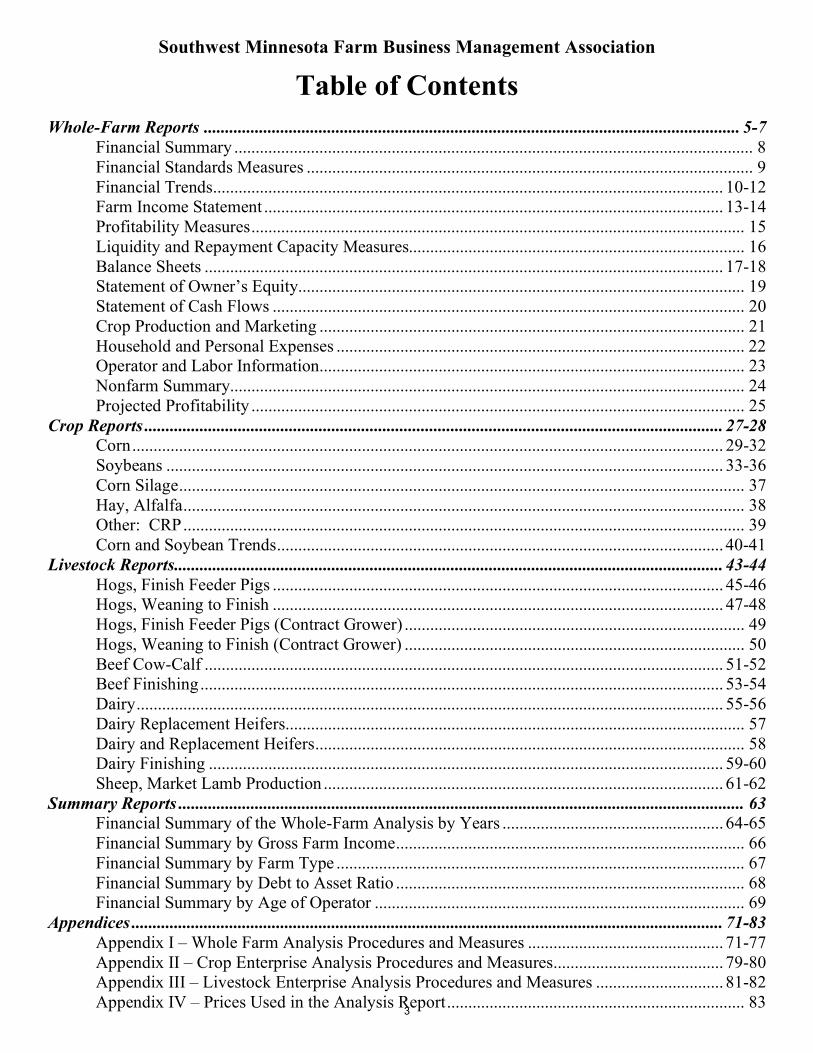
Table of Contents Whole-Farm Reports .............................................................................................................................. 5-7
Financial Summary .......................................................................................................................... 8 Financial Standards Measures ......................................................................................................... 9 Financial Trends ........................................................................................................................ 10-12 Farm Income Statement ............................................................................................................ 13-14 Profitability Measures .................................................................................................................... 15 Liquidity and Repayment Capacity Measures............................................................................... 16 Balance Sheets .......................................................................................................................... 17-18 Statement of Owner’s Equity......................................................................................................... 19 Statement of Cash Flows ............................................................................................................... 20 Crop Production and Marketing .................................................................................................... 21 Household and Personal Expenses ................................................................................................ 22 Operator and Labor Information .................................................................................................... 23 Nonfarm Summary......................................................................................................................... 24 Projected Profitability .................................................................................................................... 25
Crop Reports ........................................................................................................................................ 27-28 Corn ........................................................................................................................................... 29-32 Soybeans ................................................................................................................................... 33-36 Corn Silage ..................................................................................................................................... 37 Hay, Alfalfa .................................................................................................................................... 38 Other: CRP .................................................................................................................................... 39 Corn and Soybean Trends ......................................................................................................... 40-41
Livestock Reports ................................................................................................................................. 43-44 Hogs, Finish Feeder Pigs .......................................................................................................... 45-46 Hogs, Weaning to Finish .......................................................................................................... 47-48 Hogs, Finish Feeder Pigs (Contract Grower) ................................................................................ 49 Hogs, Weaning to Finish (Contract Grower) ................................................................................ 50 Beef Cow-Calf .......................................................................................................................... 51-52 Beef Finishing ........................................................................................................................... 53-54 Dairy .......................................................................................................................................... 55-56 Dairy Replacement Heifers ............................................................................................................ 57 Dairy and Replacement Heifers ..................................................................................................... 58 Dairy Finishing ......................................................................................................................... 59-60 Sheep, Market Lamb Production .............................................................................................. 61-62
Summary Reports ..................................................................................................................................... 63 Financial Summary of the Whole-Farm Analysis by Years .................................................... 64-65 Financial Summary by Gross Farm Income .................................................................................. 66 Financial Summary by Farm Type ................................................................................................ 67 Financial Summary by Debt to Asset Ratio .................................................................................. 68 Financial Summary by Age of Operator ....................................................................................... 69
Appendices ........................................................................................................................................... 71-83 Appendix I – Whole Farm Analysis Procedures and Measures .............................................. 71-77 Appendix II – Crop Enterprise Analysis Procedures and Measures ........................................ 79-80 Appendix III – Livestock Enterprise Analysis Procedures and Measures .............................. 81-82 Appendix IV – Prices Used in the Analysis Report ...................................................................... 83 3

4
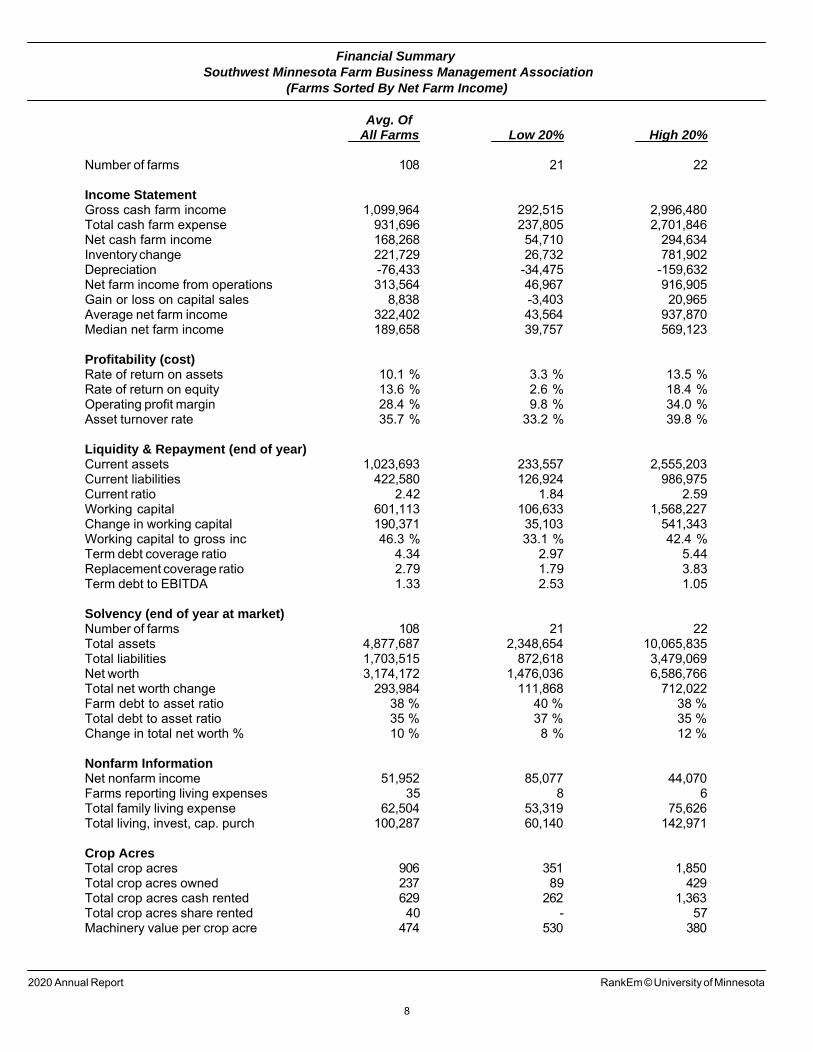
Whole-Farm Reports The whole-farm reports summarize the financial performance of member farms in 2020. Each table includes the average of the 108 farms included in the report and the average 20 percent of the farms with the lowest and highest profits (based on Net Farm Income). Appendix I provides detail on how the whole-farm measures are calculated. Below is a short summary of the whole farm reports.
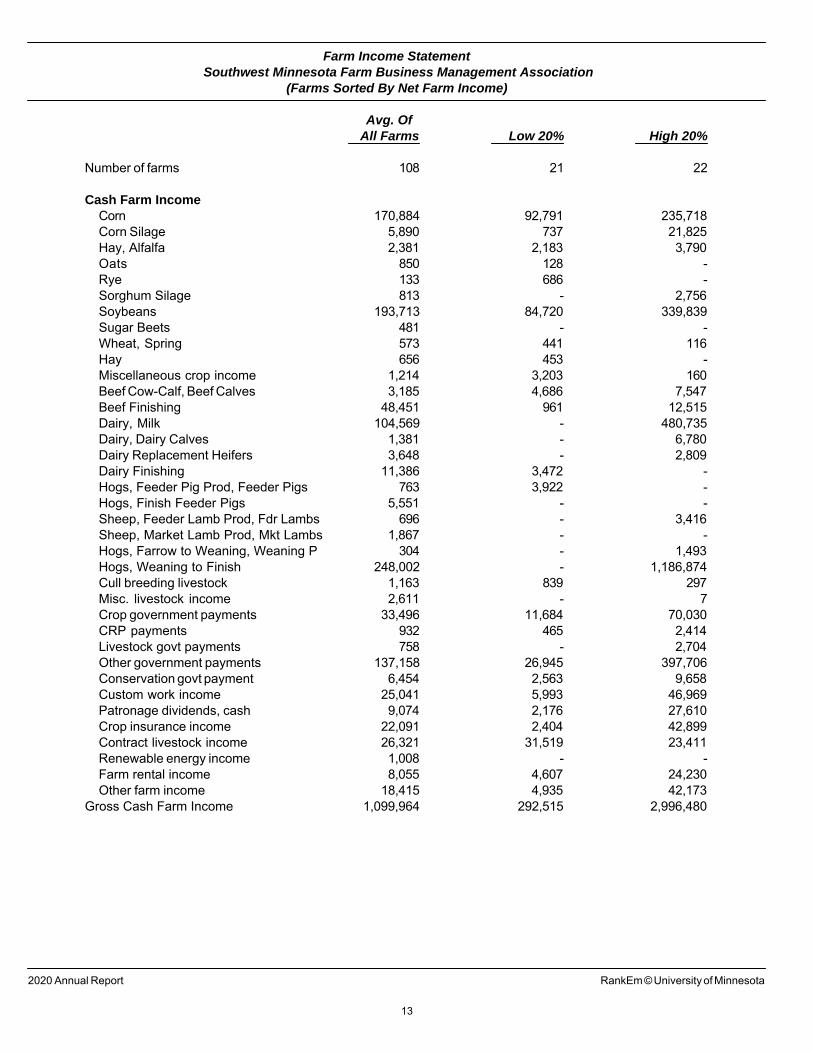
Financial Summary The Financial Summary report provides a summary of the key financial measures and ratios included on the other detailed whole farm reports. All profitability and repayment capacity measures are based on accrual adjusted net farm income. Financial Standards Measures The Farm Financial Standards Council recommends farms use these twenty-one measures as standard measures of farm financial performance. Many are repeated from the Profitability, Liquidity, and Balance Sheet tables. For a complete description, see the Financial Guidelines for Agricultural Producers at http://www. ffsc. org/index. php/order-the-guidelines/ Farm Income Statement The Income Statement calculates the accrual Net Farm Income generated by the average farm for year 2020. Net Farm Income is reported based on accrual adjustments to the cash income and expenses reported for the year. Net Farm Income is the income earned before any compensation for owner labor and management. If owner compensation was included in farm expenses, it has been excluded here to make all farms uniform. Net Farm Income represents the return to the operator's labor, management, and equity capital (net worth). It is the amount the farm contributed to owner family living, income taxes, and net worth growth. However, it does not include any asset appreciation, debt forgiveness or asset repossessions. There were several different government programs that provided payments to farm operations in 2020. There are several government payment income categories found in the detailed income statement report. The different categories included the following payments:
• Crop government payments – Agriculture Risk Coverage (ARC); Price Loss Coverage (PLC) • CRP payments – Conservation Reserve Program (CRP). • Livestock government payments – Dairy Margin Coverage (DMC); Dairy Assistance,
Investment, and Relief Initiative (DAIRI) for MN dairy producers. • Other government payments – loan amounts forgiven for Paycheck Protection Program
(PPP); Wildfire and Hurricane Indemnity Program Plus (WHIP+) disaster program; Market Facilitation Program (MFP) 2.0 3rd tranche related to trade; Coronavirus Food Assistance Program (CFAP) 1 and 2; Economic Injury Disaster Loan (EIDL) Emergency Advance Program; Emergency Animal Mortality Management program from Environmental Quality Incentives Program (EQIP); MN Small Business Relief grant; MN Coronavirus Aid, Relief, and Economic Security (CARES) Act funding for agriculture.
• Conservation government payments – Environmental Quality Incentives Program (EQIP) payments for annual production expenses; Conservation Stewardship Program (CSP); Soil Health and Income Protection Program (SHIPP).
5
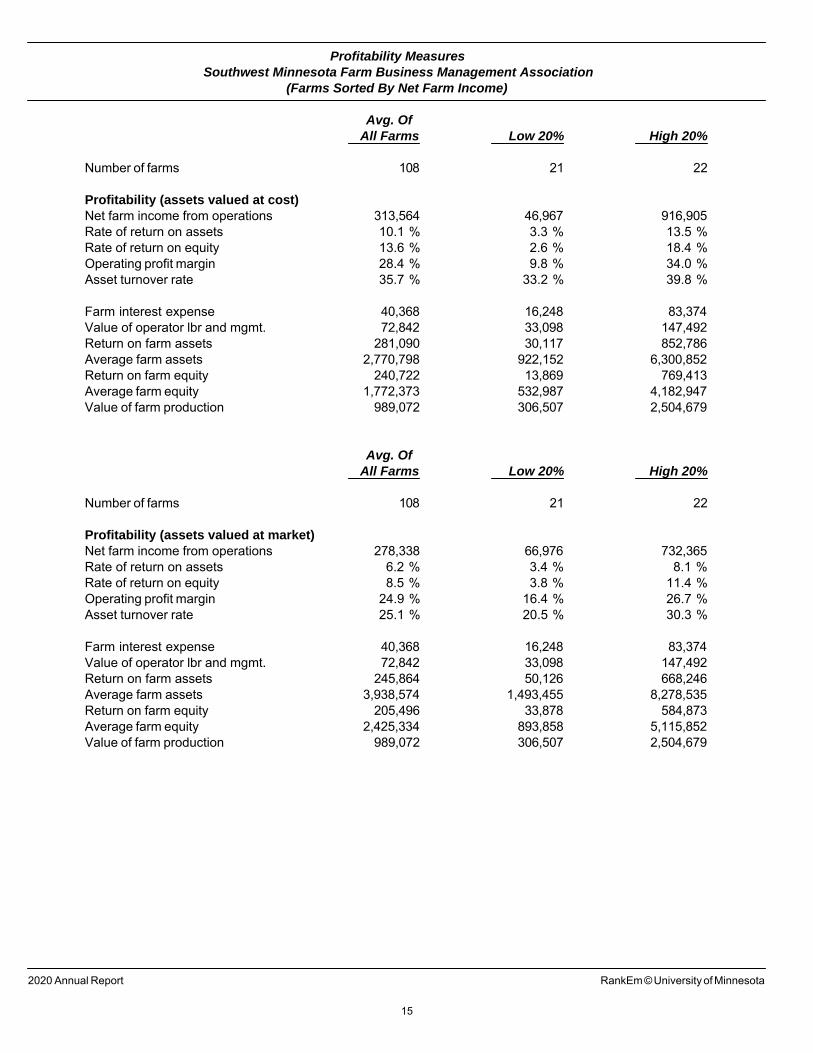
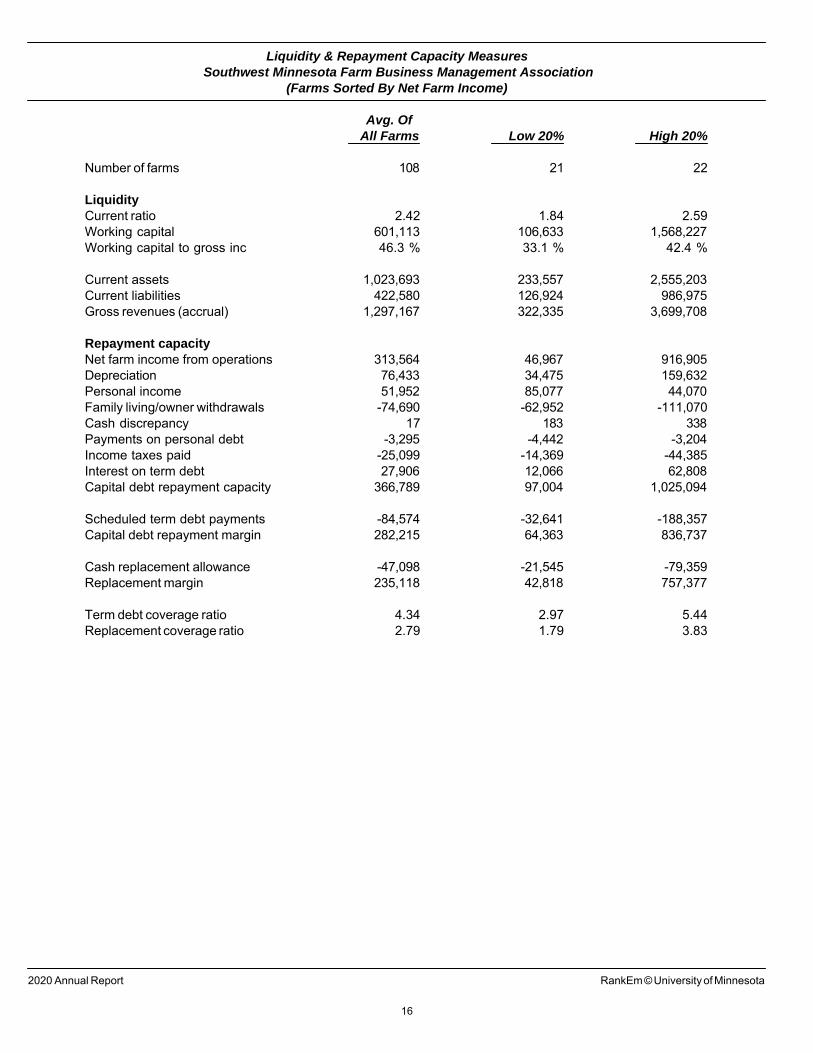
Profitability Measures The profitability measures are calculated based on both the cost value of assets and the market value. When calculated based on the market value of assets, the profitability measures can be compared to interest rates and returns available on alternative investments. When based on cost values, the returns more closely estimate the actual returns from the actual investment. (Cost values do not reflect the tax basis of farm assets. Instead, a method of calculating depreciation is used that estimates economic depreciation over the useful life of the assets. ) The Rate of Return on Assets (ROA) can be thought of as the interest rate earned by all investment in farm assets. Rate of Return on Equity (ROE) is the rate earned on the operator’s equity or net worth in the farm business. If ROE is higher than ROA, borrowed funds more than paid for their cost in interest expense. Operating Profit Margin measures efficiency in farm operations. The higher the margin, the more of the farm income remained in pockets of the farm operator. Asset Turnover Rate measures efficiency in use of capital. Again, the higher the better. Farms with high investment in fixed assets will generally have a lower turnover rate than those who lease a major share of their capital. Liquidity and Repayment Capacity Measures Liquidity reflects the ability of the farm to meet its financial obligations on time. Current Ratio is current farm assets divided by current farm liabilities. Working Capital is current farm assets minus current farm liabilities. Businesses with more working capital are generally in a better position to overcome short-term financial downturns or production problems. Working Capital to Gross Income measures liquidity relative to business size. Repayment capacity measures the ability of the business to meet debt payments and replace capital assets. Term Debt Coverage Ratio measures the ability of the business to meet its scheduled debt payments. A term debt coverage ratio greater than 1.0 indicates that the business produced more than enough earnings to meet its scheduled debt payments. Replacement Coverage Ratio adds the need for capital replacement. A replacement coverage ratio greater than 1.0 indicates that the business produced more than enough earnings to meet its payments and replace its depreciable assets. Balance Sheets Balance sheet reports are included for both the cost and market value of assets. Current assets are identical in both tables, with crop and livestock inventories generally valued at market value. This conforms to the methodology recommended by the Farm Financial Standards Council. On the cost-based table, intermediate and long-term assets are shown at depreciated value using estimated economic, rather than tax, depreciation. On the market table, they are valued at estimated market value. Liabilities are the same on the cost and market tables except for the inclusion of Deferred Liabilities on the market statements. Deferred liabilities are the estimated taxes that would be paid if assets were liquidated at their market values.
6
Net Worth Change on the cost value table is the amount of earned net worth growth or loss for the year. Net worth change on the market value table includes both earned growth and changes in the market valuation of capital assets. Statement of Cash Flows The Statement of Cash Flows displays the sources and uses of cash for the year. Cash From Operating Activities includes sources and uses of cash related to normal farm operations. Cash From Investing Activities reflect cash used to buy and sell capital assets. Cash From Financing Activities includes sources and uses of borrowed funds as well as cash from non-farm activities. Crop Production and Marketing This table reports farm size in acres farmed, average crop yields for major commodities, and average crop sales prices for the calendar year. Yields and prices are reported for the average of all farms for more commodities than those included in the High and Low columns because a minimum of five farms are required to report the yield or price for any group. Household and Personal Expenses This table reports family living and other non-farm expenditures. Only sole proprietors who keep detailed family living records are included. Operator and Labor Information All previous tables report results per farm, regardless of the number of families or operators involved in the operation. This report repeats several measures from previous tables on a Per Operator basis. It also summarizes estimated labor hours used and labor performance. Non-farm Summary This table summarizes non-farm earnings for the average farm and details non-farm assets and liabilities. Projected Profitability Based on the past year’s results and the authors’ estimates of changes in next year’s production, prices and costs, this page projects the financial performance of these farms in the coming year.
7
Financial SummarySouthwest Minnesota Farm Business Management Association
(Farms Sorted By Net Farm Income)
Avg. OfAll Farms Low 20% High 20%
Number of farms 108 21 22
Income StatementGross cash farm income 1,099,964 292,515 2,996,480Total cash farm expense 931,696 237,805 2,701,846Net cash farm income 168,268 54,710 294,634Inventory change 221,729 26,732 781,902Depreciation -76,433 -34,475 -159,632Net farm income from operations 313,564 46,967 916,905Gain or loss on capital sales 8,838 -3,403 20,965Average net farm income 322,402 43,564 937,870Median net farm income 189,658 39,757 569,123
Profitability (cost)Rate of return on assets 10.1 % 3.3 % 13.5 %Rate of return on equity 13.6 % 2.6 % 18.4 %Operating profit margin 28.4 % 9.8 % 34.0 %Asset turnover rate 35.7 % 33.2 % 39.8 %
Liquidity & Repayment (end of year)Current assets 1,023,693 233,557 2,555,203Current liabilities 422,580 126,924 986,975Current ratio 2.42 1.84 2.59Working capital 601,113 106,633 1,568,227Change in working capital 190,371 35,103 541,343Working capital to gross inc 46.3 % 33.1 % 42.4 %Term debt coverage ratio 4.34 2.97 5.44Replacement coverage ratio 2.79 1.79 3.83Term debt to EBITDA 1.33 2.53 1.05
Solvency (end of year at market)Number of farms 108 21 22Total assets 4,877,687 2,348,654 10,065,835Total liabilities 1,703,515 872,618 3,479,069Net worth 3,174,172 1,476,036 6,586,766Total net worth change 293,984 111,868 712,022Farm debt to asset ratio 38 % 40 % 38 %Total debt to asset ratio 35 % 37 % 35 %Change in total net worth % 10 % 8 % 12 %
Nonfarm InformationNet nonfarm income 51,952 85,077 44,070Farms reporting living expenses 35 8 6Total family living expense 62,504 53,319 75,626Total living, invest, cap. purch 100,287 60,140 142,971
Crop AcresTotal crop acres 906 351 1,850Total crop acres owned 237 89 429Total crop acres cash rented 629 262 1,363Total crop acres share rented 40 - 57Machinery value per crop acre 474 530 380
2020 Annual Report RankEm © University of Minnesota
8
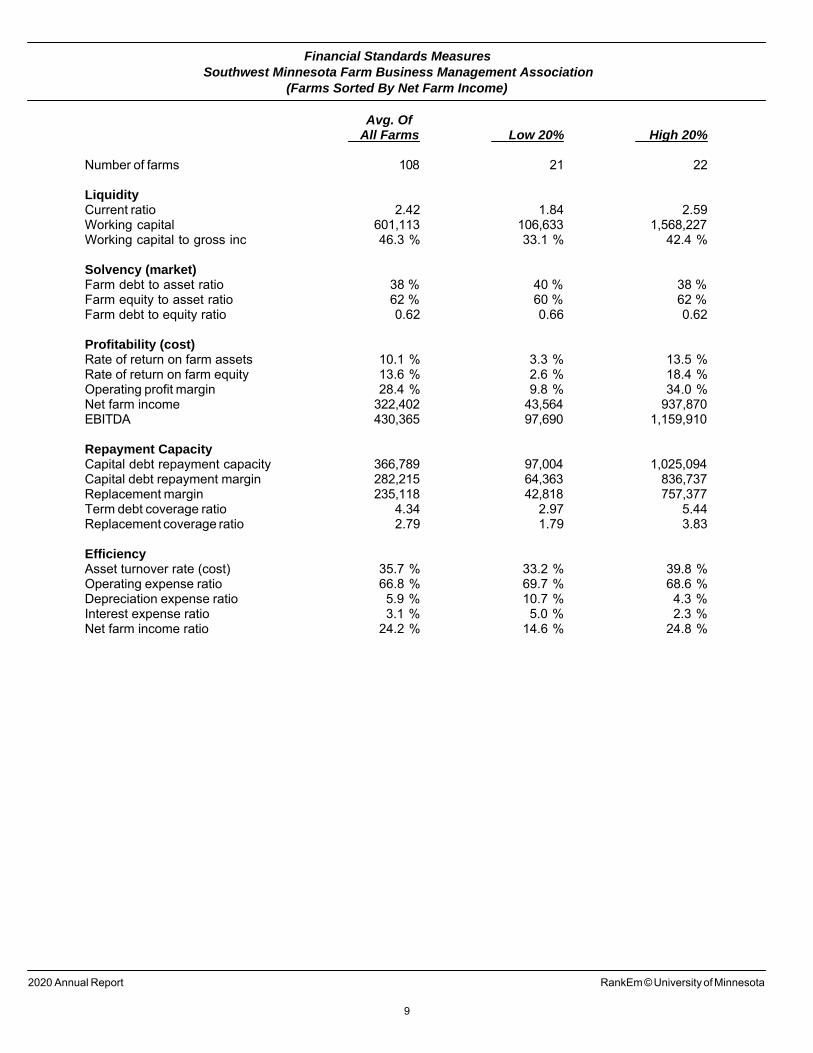
Financial Standards MeasuresSouthwest Minnesota Farm Business Management Association
(Farms Sorted By Net Farm Income)
Avg. OfAll Farms Low 20% High 20%
Number of farms 108 21 22
LiquidityCurrent ratio 2.42 1.84 2.59Working capital 601,113 106,633 1,568,227Working capital to gross inc 46.3 % 33.1 % 42.4 %
Solvency (market)Farm debt to asset ratio 38 % 40 % 38 %Farm equity to asset ratio 62 % 60 % 62 %Farm debt to equity ratio 0.62 0.66 0.62
Profitability (cost)Rate of return on farm assets 10.1 % 3.3 % 13.5 %Rate of return on farm equity 13.6 % 2.6 % 18.4 %Operating profit margin 28.4 % 9.8 % 34.0 %Net farm income 322,402 43,564 937,870EBITDA 430,365 97,690 1,159,910
Repayment CapacityCapital debt repayment capacity 366,789 97,004 1,025,094Capital debt repayment margin 282,215 64,363 836,737Replacement margin 235,118 42,818 757,377Term debt coverage ratio 4.34 2.97 5.44Replacement coverage ratio 2.79 1.79 3.83
EfficiencyAsset turnover rate (cost) 35.7 % 33.2 % 39.8 %Operating expense ratio 66.8 % 69.7 % 68.6 %Depreciation expense ratio 5.9 % 10.7 % 4.3 %Interest expense ratio 3.1 % 5.0 % 2.3 %Net farm income ratio 24.2 % 14.6 % 24.8 %
2020 Annual Report RankEm © University of Minnesota
9
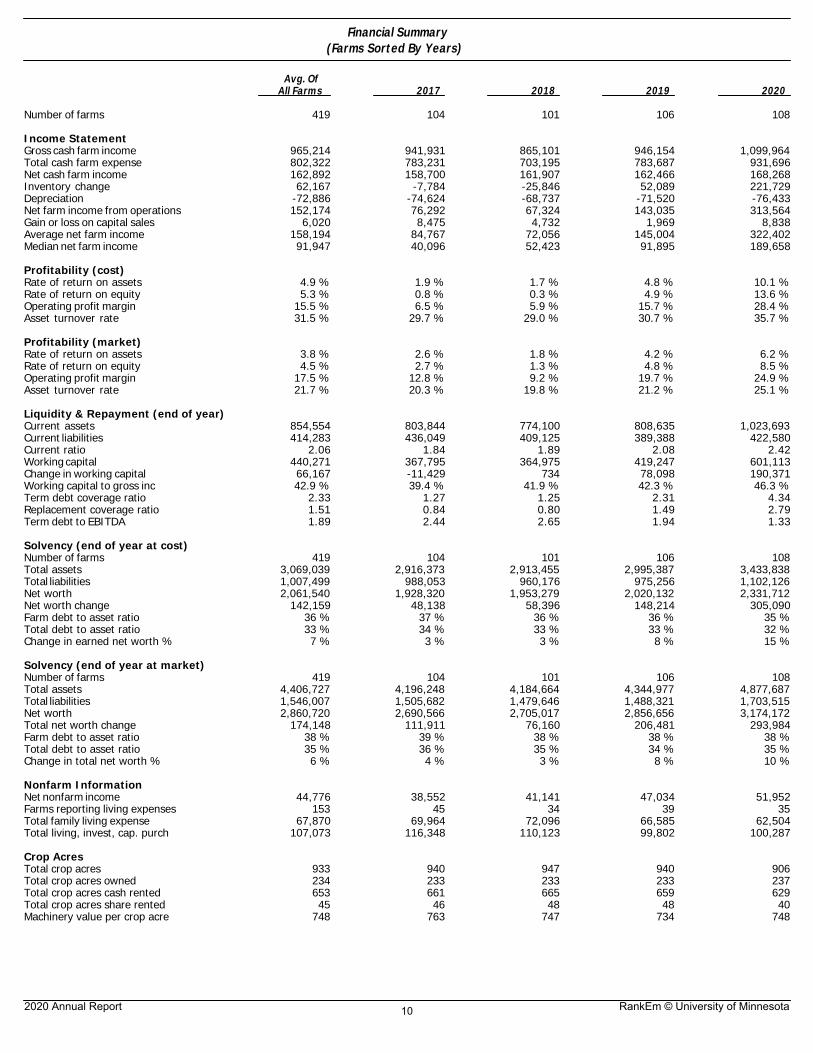
Financial Summary(Farms Sorted By Years)
Avg. OfAll Farms 2017 2018 2019 2020
Number of farms 419 104 101 106 108
Income StatementGross cash farm income 965,214 941,931 865,101 946,154 1,099,964Total cash farm expense 802,322 783,231 703,195 783,687 931,696Net cash farm income 162,892 158,700 161,907 162,466 168,268Inventory change 62,167 -7,784 -25,846 52,089 221,729Depreciation -72,886 -74,624 -68,737 -71,520 -76,433Net farm income from operations 152,174 76,292 67,324 143,035 313,564Gain or loss on capital sales 6,020 8,475 4,732 1,969 8,838Average net farm income 158,194 84,767 72,056 145,004 322,402Median net farm income 91,947 40,096 52,423 91,895 189,658
Profitability (cost)Rate of return on assets 4.9 % 1.9 % 1.7 % 4.8 % 10.1 %Rate of return on equity 5.3 % 0.8 % 0.3 % 4.9 % 13.6 %Operating profit margin 15.5 % 6.5 % 5.9 % 15.7 % 28.4 %Asset turnover rate 31.5 % 29.7 % 29.0 % 30.7 % 35.7 %
Profitability (market)Rate of return on assets 3.8 % 2.6 % 1.8 % 4.2 % 6.2 %Rate of return on equity 4.5 % 2.7 % 1.3 % 4.8 % 8.5 %Operating profit margin 17.5 % 12.8 % 9.2 % 19.7 % 24.9 %Asset turnover rate 21.7 % 20.3 % 19.8 % 21.2 % 25.1 %
Liquidity & Repayment (end of year)Current assets 854,554 803,844 774,100 808,635 1,023,693Current liabilities 414,283 436,049 409,125 389,388 422,580Current ratio 2.06 1.84 1.89 2.08 2.42Working capital 440,271 367,795 364,975 419,247 601,113Change in working capital 66,167 -11,429 734 78,098 190,371Working capital to gross inc 42.9 % 39.4 % 41.9 % 42.3 % 46.3 %Term debt coverage ratio 2.33 1.27 1.25 2.31 4.34Replacement coverage ratio 1.51 0.84 0.80 1.49 2.79Term debt to EBITDA 1.89 2.44 2.65 1.94 1.33
Solvency (end of year at cost)Number of farms 419 104 101 106 108Total assets 3,069,039 2,916,373 2,913,455 2,995,387 3,433,838Total liabilities 1,007,499 988,053 960,176 975,256 1,102,126Net worth 2,061,540 1,928,320 1,953,279 2,020,132 2,331,712Net worth change 142,159 48,138 58,396 148,214 305,090Farm debt to asset ratio 36 % 37 % 36 % 36 % 35 %Total debt to asset ratio 33 % 34 % 33 % 33 % 32 %Change in earned net worth % 7 % 3 % 3 % 8 % 15 %
Solvency (end of year at market)Number of farms 419 104 101 106 108Total assets 4,406,727 4,196,248 4,184,664 4,344,977 4,877,687Total liabilities 1,546,007 1,505,682 1,479,646 1,488,321 1,703,515Net worth 2,860,720 2,690,566 2,705,017 2,856,656 3,174,172Total net worth change 174,148 111,911 76,160 206,481 293,984Farm debt to asset ratio 38 % 39 % 38 % 38 % 38 %Total debt to asset ratio 35 % 36 % 35 % 34 % 35 %Change in total net worth % 6 % 4 % 3 % 8 % 10 %
Nonfarm InformationNet nonfarm income 44,776 38,552 41,141 47,034 51,952Farms reporting living expenses 153 45 34 39 35Total family living expense 67,870 69,964 72,096 66,585 62,504Total living, invest, cap. purch 107,073 116,348 110,123 99,802 100,287
Crop AcresTotal crop acres 933 940 947 940 906Total crop acres owned 234 233 233 233 237Total crop acres cash rented 653 661 665 659 629Total crop acres share rented 45 46 48 48 40Machinery value per crop acre 748 763 747 734 748
2020 Annual Report RankEm © University of Minnesota10
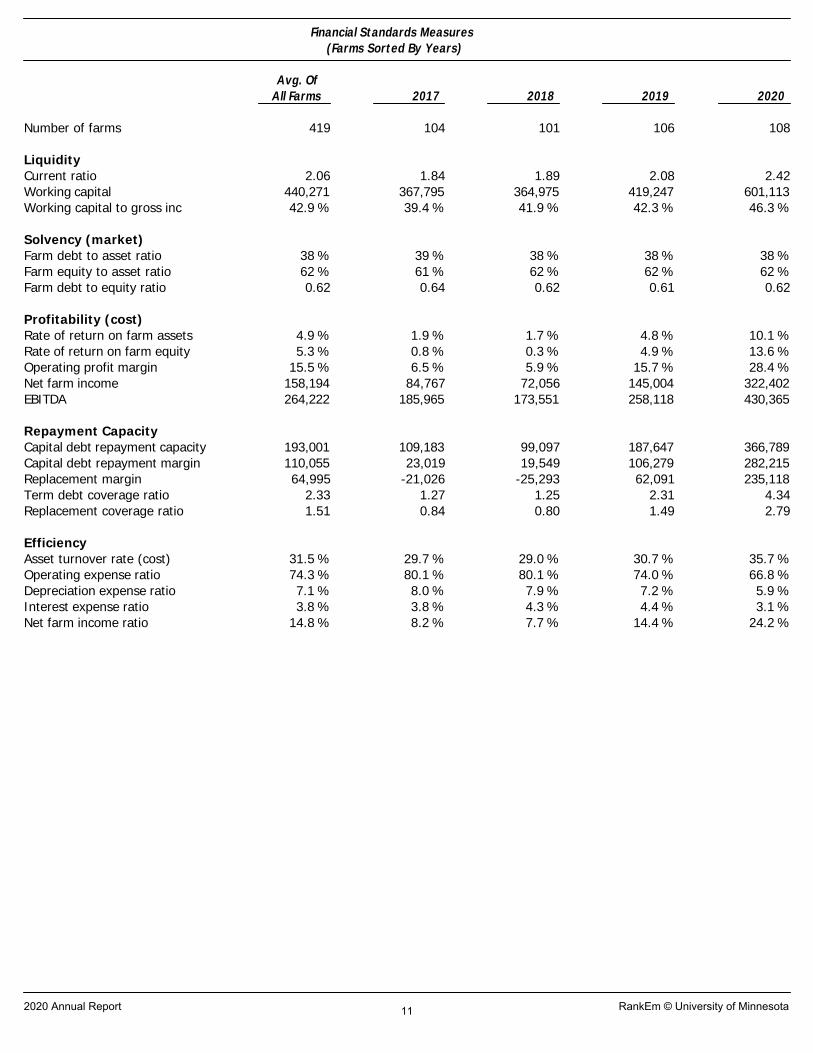
Financial Standards Measures(Farms Sorted By Years)
Avg. OfAll Farms 2017 2018 2019 2020
Number of farms 419 104 101 106 108
LiquidityCurrent ratio 2.06 1.84 1.89 2.08 2.42Working capital 440,271 367,795 364,975 419,247 601,113Working capital to gross inc 42.9 % 39.4 % 41.9 % 42.3 % 46.3 %
Solvency (market)Farm debt to asset ratio 38 % 39 % 38 % 38 % 38 %Farm equity to asset ratio 62 % 61 % 62 % 62 % 62 %Farm debt to equity ratio 0.62 0.64 0.62 0.61 0.62
Profitability (cost)Rate of return on farm assets 4.9 % 1.9 % 1.7 % 4.8 % 10.1 %Rate of return on farm equity 5.3 % 0.8 % 0.3 % 4.9 % 13.6 %Operating profit margin 15.5 % 6.5 % 5.9 % 15.7 % 28.4 %Net farm income 158,194 84,767 72,056 145,004 322,402EBITDA 264,222 185,965 173,551 258,118 430,365
Repayment CapacityCapital debt repayment capacity 193,001 109,183 99,097 187,647 366,789Capital debt repayment margin 110,055 23,019 19,549 106,279 282,215Replacement margin 64,995 -21,026 -25,293 62,091 235,118Term debt coverage ratio 2.33 1.27 1.25 2.31 4.34Replacement coverage ratio 1.51 0.84 0.80 1.49 2.79
EfficiencyAsset turnover rate (cost) 31.5 % 29.7 % 29.0 % 30.7 % 35.7 %Operating expense ratio 74.3 % 80.1 % 80.1 % 74.0 % 66.8 %Depreciation expense ratio 7.1 % 8.0 % 7.9 % 7.2 % 5.9 %Interest expense ratio 3.8 % 3.8 % 4.3 % 4.4 % 3.1 %Net farm income ratio 14.8 % 8.2 % 7.7 % 14.4 % 24.2 %
2020 Annual Report RankEm © University of Minnesota11
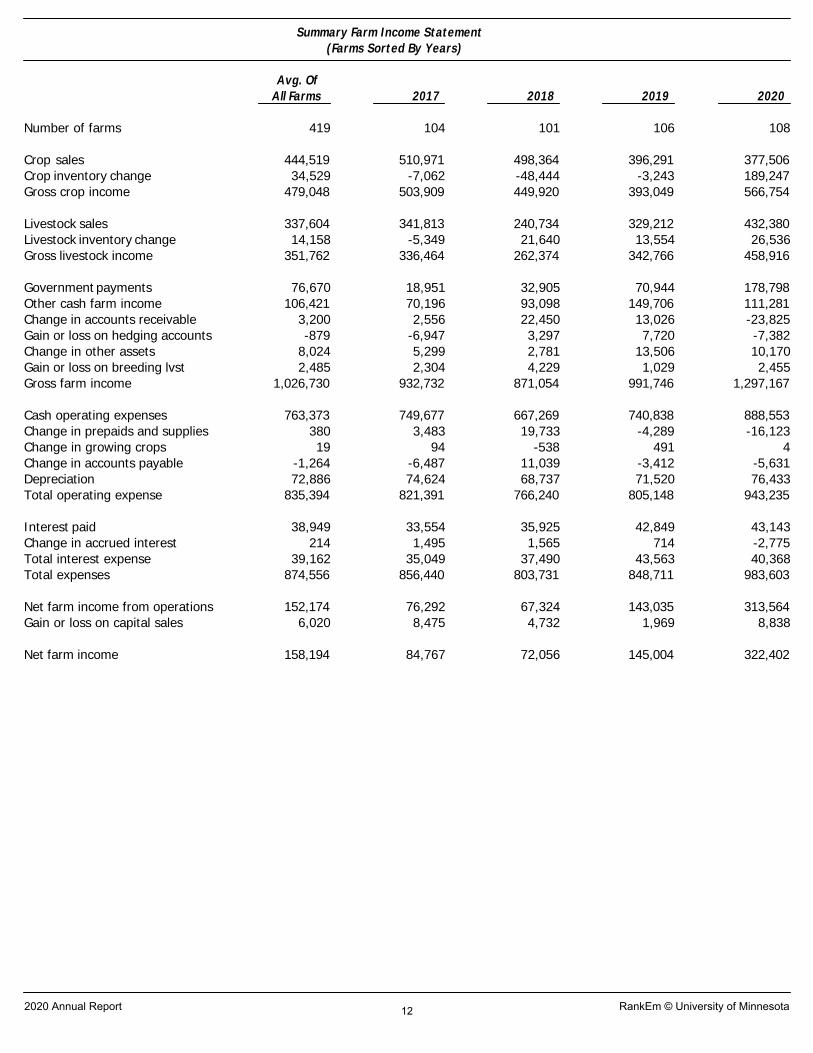
Summary Farm Income Statement(Farms Sorted By Years)
Avg. OfAll Farms 2017 2018 2019 2020
Number of farms 419 104 101 106 108
Crop sales 444,519 510,971 498,364 396,291 377,506Crop inventory change 34,529 -7,062 -48,444 -3,243 189,247Gross crop income 479,048 503,909 449,920 393,049 566,754
Livestock sales 337,604 341,813 240,734 329,212 432,380Livestock inventory change 14,158 -5,349 21,640 13,554 26,536Gross livestock income 351,762 336,464 262,374 342,766 458,916
Government payments 76,670 18,951 32,905 70,944 178,798Other cash farm income 106,421 70,196 93,098 149,706 111,281Change in accounts receivable 3,200 2,556 22,450 13,026 -23,825Gain or loss on hedging accounts -879 -6,947 3,297 7,720 -7,382Change in other assets 8,024 5,299 2,781 13,506 10,170Gain or loss on breeding lvst 2,485 2,304 4,229 1,029 2,455Gross farm income 1,026,730 932,732 871,054 991,746 1,297,167
Cash operating expenses 763,373 749,677 667,269 740,838 888,553Change in prepaids and supplies 380 3,483 19,733 -4,289 -16,123Change in growing crops 19 94 -538 491 4Change in accounts payable -1,264 -6,487 11,039 -3,412 -5,631Depreciation 72,886 74,624 68,737 71,520 76,433Total operating expense 835,394 821,391 766,240 805,148 943,235
Interest paid 38,949 33,554 35,925 42,849 43,143Change in accrued interest 214 1,495 1,565 714 -2,775Total interest expense 39,162 35,049 37,490 43,563 40,368Total expenses 874,556 856,440 803,731 848,711 983,603
Net farm income from operations 152,174 76,292 67,324 143,035 313,564Gain or loss on capital sales 6,020 8,475 4,732 1,969 8,838
Net farm income 158,194 84,767 72,056 145,004 322,402
2020 Annual Report RankEm © University of Minnesota12
Farm Income StatementSouthwest Minnesota Farm Business Management Association
(Farms Sorted By Net Farm Income)
Avg. OfAll Farms Low 20% High 20%
Number of farms 108 21 22
Cash Farm IncomeCorn 170,884 92,791 235,718Corn Silage 5,890 737 21,825Hay, Alfalfa 2,381 2,183 3,790Oats 850 128 -Rye 133 686 -Sorghum Silage 813 - 2,756Soybeans 193,713 84,720 339,839Sugar Beets 481 - -Wheat, Spring 573 441 116Hay 656 453 -Miscellaneous crop income 1,214 3,203 160Beef Cow-Calf, Beef Calves 3,185 4,686 7,547Beef Finishing 48,451 961 12,515Dairy, Milk 104,569 - 480,735Dairy, Dairy Calves 1,381 - 6,780Dairy Replacement Heifers 3,648 - 2,809Dairy Finishing 11,386 3,472 -Hogs, Feeder Pig Prod, Feeder Pigs 763 3,922 -Hogs, Finish Feeder Pigs 5,551 - -Sheep, Feeder Lamb Prod, Fdr Lambs 696 - 3,416Sheep, Market Lamb Prod, Mkt Lambs 1,867 - -Hogs, Farrow to Weaning, Weaning P 304 - 1,493Hogs, Weaning to Finish 248,002 - 1,186,874Cull breeding livestock 1,163 839 297Misc. livestock income 2,611 - 7Crop government payments 33,496 11,684 70,030CRP payments 932 465 2,414Livestock govt payments 758 - 2,704Other government payments 137,158 26,945 397,706Conservation govt payment 6,454 2,563 9,658Custom work income 25,041 5,993 46,969Patronage dividends, cash 9,074 2,176 27,610Crop insurance income 22,091 2,404 42,899Contract livestock income 26,321 31,519 23,411Renewable energy income 1,008 - -Farm rental income 8,055 4,607 24,230Other farm income 18,415 4,935 42,173
Gross Cash Farm Income 1,099,964 292,515 2,996,480
2020 Annual Report RankEm © University of Minnesota
13
Farm Income Statement (continued)Southwest Minnesota Farm Business Management Association
(Farms Sorted By Net Farm Income)
Avg. OfAll Farms Low 20% High 20%
Number of farms 108 21 22
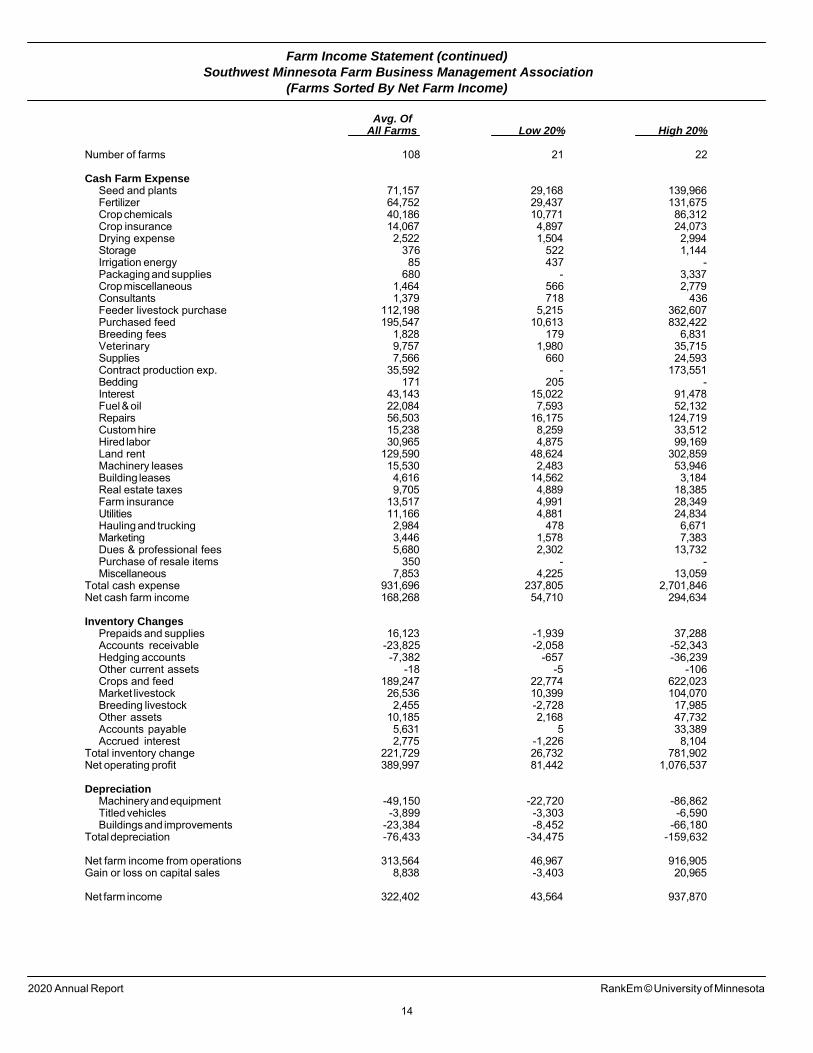
Cash Farm ExpenseSeed and plants 71,157 29,168 139,966Fertilizer 64,752 29,437 131,675Crop chemicals 40,186 10,771 86,312Crop insurance 14,067 4,897 24,073Drying expense 2,522 1,504 2,994Storage 376 522 1,144Irrigation energy 85 437 -Packaging and supplies 680 - 3,337Crop miscellaneous 1,464 566 2,779Consultants 1,379 718 436Feeder livestock purchase 112,198 5,215 362,607Purchased feed 195,547 10,613 832,422Breeding fees 1,828 179 6,831Veterinary 9,757 1,980 35,715Supplies 7,566 660 24,593Contract production exp. 35,592 - 173,551Bedding 171 205 -Interest 43,143 15,022 91,478Fuel & oil 22,084 7,593 52,132Repairs 56,503 16,175 124,719Custom hire 15,238 8,259 33,512Hired labor 30,965 4,875 99,169Land rent 129,590 48,624 302,859Machinery leases 15,530 2,483 53,946Building leases 4,616 14,562 3,184Real estate taxes 9,705 4,889 18,385Farm insurance 13,517 4,991 28,349Utilities 11,166 4,881 24,834Hauling and trucking 2,984 478 6,671Marketing 3,446 1,578 7,383Dues & professional fees 5,680 2,302 13,732Purchase of resale items 350 - -Miscellaneous 7,853 4,225 13,059
Total cash expense 931,696 237,805 2,701,846Net cash farm income 168,268 54,710 294,634
Inventory ChangesPrepaids and supplies 16,123 -1,939 37,288Accounts receivable -23,825 -2,058 -52,343Hedging accounts -7,382 -657 -36,239Other current assets -18 -5 -106Crops and feed 189,247 22,774 622,023Market livestock 26,536 10,399 104,070Breeding livestock 2,455 -2,728 17,985Other assets 10,185 2,168 47,732Accounts payable 5,631 5 33,389Accrued interest 2,775 -1,226 8,104
Total inventory change 221,729 26,732 781,902Net operating profit 389,997 81,442 1,076,537
DepreciationMachinery and equipment -49,150 -22,720 -86,862Titled vehicles -3,899 -3,303 -6,590Buildings and improvements -23,384 -8,452 -66,180
Total depreciation -76,433 -34,475 -159,632
Net farm income from operations 313,564 46,967 916,905Gain or loss on capital sales 8,838 -3,403 20,965
Net farm income 322,402 43,564 937,870
2020 Annual Report RankEm © University of Minnesota
14
Profitability MeasuresSouthwest Minnesota Farm Business Management Association
(Farms Sorted By Net Farm Income)
Avg. OfAll Farms Low 20% High 20%
Number of farms 108 21 22
Profitability (assets valued at cost)Net farm income from operations 313,564 46,967 916,905Rate of return on assets 10.1 % 3.3 % 13.5 %Rate of return on equity 13.6 % 2.6 % 18.4 %Operating profit margin 28.4 % 9.8 % 34.0 %Asset turnover rate 35.7 % 33.2 % 39.8 %
Farm interest expense 40,368 16,248 83,374Value of operator lbr and mgmt. 72,842 33,098 147,492Return on farm assets 281,090 30,117 852,786Average farm assets 2,770,798 922,152 6,300,852Return on farm equity 240,722 13,869 769,413Average farm equity 1,772,373 532,987 4,182,947Value of farm production 989,072 306,507 2,504,679
Avg. OfAll Farms Low 20% High 20%
Number of farms 108 21 22
Profitability (assets valued at market)Net farm income from operations 278,338 66,976 732,365Rate of return on assets 6.2 % 3.4 % 8.1 %Rate of return on equity 8.5 % 3.8 % 11.4 %Operating profit margin 24.9 % 16.4 % 26.7 %Asset turnover rate 25.1 % 20.5 % 30.3 %
Farm interest expense 40,368 16,248 83,374Value of operator lbr and mgmt. 72,842 33,098 147,492Return on farm assets 245,864 50,126 668,246Average farm assets 3,938,574 1,493,455 8,278,535Return on farm equity 205,496 33,878 584,873Average farm equity 2,425,334 893,858 5,115,852Value of farm production 989,072 306,507 2,504,679
2020 Annual Report RankEm © University of Minnesota
15
Liquidity & Repayment Capacity MeasuresSouthwest Minnesota Farm Business Management Association
(Farms Sorted By Net Farm Income)
Avg. OfAll Farms Low 20% High 20%
Number of farms 108 21 22
LiquidityCurrent ratio 2.42 1.84 2.59Working capital 601,113 106,633 1,568,227Working capital to gross inc 46.3 % 33.1 % 42.4 %
Current assets 1,023,693 233,557 2,555,203Current liabilities 422,580 126,924 986,975Gross revenues (accrual) 1,297,167 322,335 3,699,708
Repayment capacityNet farm income from operations 313,564 46,967 916,905Depreciation 76,433 34,475 159,632Personal income 51,952 85,077 44,070Family living/owner withdrawals -74,690 -62,952 -111,070Cash discrepancy 17 183 338Payments on personal debt -3,295 -4,442 -3,204Income taxes paid -25,099 -14,369 -44,385Interest on term debt 27,906 12,066 62,808Capital debt repayment capacity 366,789 97,004 1,025,094
Scheduled term debt payments -84,574 -32,641 -188,357Capital debt repayment margin 282,215 64,363 836,737
Cash replacement allowance -47,098 -21,545 -79,359Replacement margin 235,118 42,818 757,377
Term debt coverage ratio 4.34 2.97 5.44Replacement coverage ratio 2.79 1.79 3.83
2020 Annual Report RankEm © University of Minnesota
16
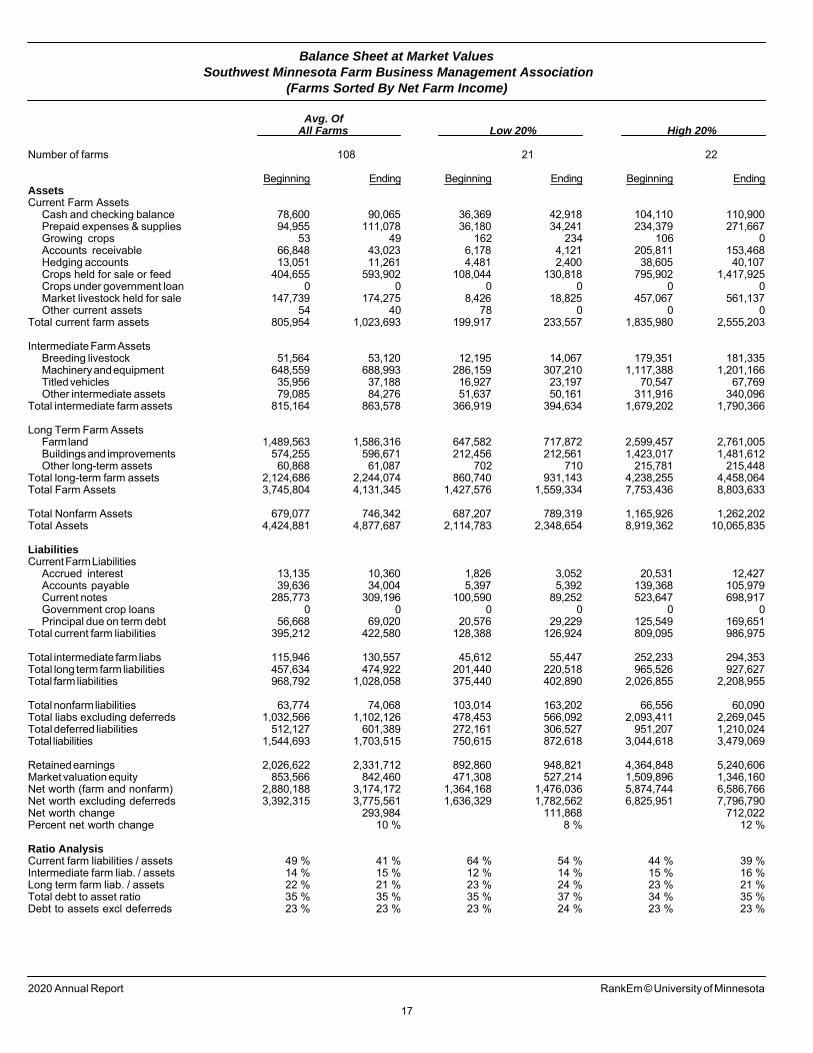
Balance Sheet at Market ValuesSouthwest Minnesota Farm Business Management Association
(Farms Sorted By Net Farm Income)
Avg. OfAll Farms Low 20% High 20%
Number of farms 108 21 22
Beginning Ending Beginning Ending Beginning EndingAssetsCurrent Farm Assets
Cash and checking balance 78,600 90,065 36,369 42,918 104,110 110,900Prepaid expenses & supplies 94,955 111,078 36,180 34,241 234,379 271,667Growing crops 53 49 162 234 106 0Accounts receivable 66,848 43,023 6,178 4,121 205,811 153,468Hedging accounts 13,051 11,261 4,481 2,400 38,605 40,107Crops held for sale or feed 404,655 593,902 108,044 130,818 795,902 1,417,925Crops under government loan 0 0 0 0 0 0Market livestock held for sale 147,739 174,275 8,426 18,825 457,067 561,137Other current assets 54 40 78 0 0 0
Total current farm assets 805,954 1,023,693 199,917 233,557 1,835,980 2,555,203
Intermediate Farm AssetsBreeding livestock 51,564 53,120 12,195 14,067 179,351 181,335Machinery and equipment 648,559 688,993 286,159 307,210 1,117,388 1,201,166Titled vehicles 35,956 37,188 16,927 23,197 70,547 67,769Other intermediate assets 79,085 84,276 51,637 50,161 311,916 340,096
Total intermediate farm assets 815,164 863,578 366,919 394,634 1,679,202 1,790,366
Long Term Farm AssetsFarm land 1,489,563 1,586,316 647,582 717,872 2,599,457 2,761,005Buildings and improvements 574,255 596,671 212,456 212,561 1,423,017 1,481,612Other long-term assets 60,868 61,087 702 710 215,781 215,448
Total long-term farm assets 2,124,686 2,244,074 860,740 931,143 4,238,255 4,458,064Total Farm Assets 3,745,804 4,131,345 1,427,576 1,559,334 7,753,436 8,803,633
Total Nonfarm Assets 679,077 746,342 687,207 789,319 1,165,926 1,262,202Total Assets 4,424,881 4,877,687 2,114,783 2,348,654 8,919,362 10,065,835
LiabilitiesCurrent Farm Liabilities
Accrued interest 13,135 10,360 1,826 3,052 20,531 12,427Accounts payable 39,636 34,004 5,397 5,392 139,368 105,979Current notes 285,773 309,196 100,590 89,252 523,647 698,917Government crop loans 0 0 0 0 0 0Principal due on term debt 56,668 69,020 20,576 29,229 125,549 169,651
Total current farm liabilities 395,212 422,580 128,388 126,924 809,095 986,975
Total intermediate farm liabs 115,946 130,557 45,612 55,447 252,233 294,353Total long term farm liabilities 457,634 474,922 201,440 220,518 965,526 927,627Total farm liabilities 968,792 1,028,058 375,440 402,890 2,026,855 2,208,955
Total nonfarm liabilities 63,774 74,068 103,014 163,202 66,556 60,090Total liabs excluding deferreds 1,032,566 1,102,126 478,453 566,092 2,093,411 2,269,045Total deferred liabilities 512,127 601,389 272,161 306,527 951,207 1,210,024Total liabilities 1,544,693 1,703,515 750,615 872,618 3,044,618 3,479,069
Retained earnings 2,026,622 2,331,712 892,860 948,821 4,364,848 5,240,606Market valuation equity 853,566 842,460 471,308 527,214 1,509,896 1,346,160Net worth (farm and nonfarm) 2,880,188 3,174,172 1,364,168 1,476,036 5,874,744 6,586,766Net worth excluding deferreds 3,392,315 3,775,561 1,636,329 1,782,562 6,825,951 7,796,790Net worth change 293,984 111,868 712,022Percent net worth change 10 % 8 % 12 %
Ratio AnalysisCurrent farm liabilities / assets 49 % 41 % 64 % 54 % 44 % 39 %Intermediate farm liab. / assets 14 % 15 % 12 % 14 % 15 % 16 %Long term farm liab. / assets 22 % 21 % 23 % 24 % 23 % 21 %Total debt to asset ratio 35 % 35 % 35 % 37 % 34 % 35 %Debt to assets excl deferreds 23 % 23 % 23 % 24 % 23 % 23 %
2020 Annual Report RankEm © University of Minnesota
17
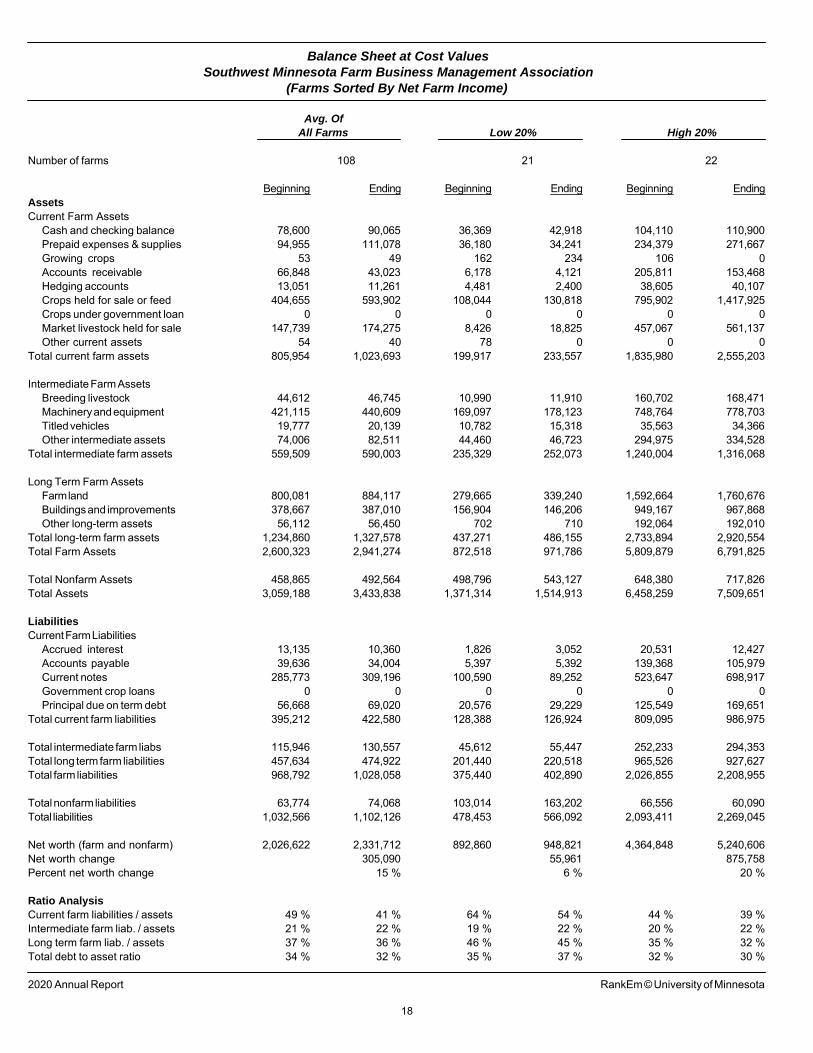
Balance Sheet at Cost ValuesSouthwest Minnesota Farm Business Management Association
(Farms Sorted By Net Farm Income)
Avg. Of
All Farms Low 20% High 20%
Number of farms 108 21 22
Beginning Ending Beginning Ending Beginning EndingAssets
Current Farm AssetsCash and checking balance 78,600 90,065 36,369 42,918 104,110 110,900Prepaid expenses & supplies 94,955 111,078 36,180 34,241 234,379 271,667Growing crops 53 49 162 234 106 0Accounts receivable 66,848 43,023 6,178 4,121 205,811 153,468Hedging accounts 13,051 11,261 4,481 2,400 38,605 40,107Crops held for sale or feed 404,655 593,902 108,044 130,818 795,902 1,417,925Crops under government loan 0 0 0 0 0 0Market livestock held for sale 147,739 174,275 8,426 18,825 457,067 561,137Other current assets 54 40 78 0 0 0
Total current farm assets 805,954 1,023,693 199,917 233,557 1,835,980 2,555,203
Intermediate Farm AssetsBreeding livestock 44,612 46,745 10,990 11,910 160,702 168,471Machinery and equipment 421,115 440,609 169,097 178,123 748,764 778,703Titled vehicles 19,777 20,139 10,782 15,318 35,563 34,366Other intermediate assets 74,006 82,511 44,460 46,723 294,975 334,528
Total intermediate farm assets 559,509 590,003 235,329 252,073 1,240,004 1,316,068
Long Term Farm AssetsFarm land 800,081 884,117 279,665 339,240 1,592,664 1,760,676Buildings and improvements 378,667 387,010 156,904 146,206 949,167 967,868Other long-term assets 56,112 56,450 702 710 192,064 192,010
Total long-term farm assets 1,234,860 1,327,578 437,271 486,155 2,733,894 2,920,554Total Farm Assets 2,600,323 2,941,274 872,518 971,786 5,809,879 6,791,825
Total Nonfarm Assets 458,865 492,564 498,796 543,127 648,380 717,826Total Assets 3,059,188 3,433,838 1,371,314 1,514,913 6,458,259 7,509,651
Liabilities
Current Farm LiabilitiesAccrued interest 13,135 10,360 1,826 3,052 20,531 12,427Accounts payable 39,636 34,004 5,397 5,392 139,368 105,979Current notes 285,773 309,196 100,590 89,252 523,647 698,917Government crop loans 0 0 0 0 0 0Principal due on term debt 56,668 69,020 20,576 29,229 125,549 169,651
Total current farm liabilities 395,212 422,580 128,388 126,924 809,095 986,975
Total intermediate farm liabs 115,946 130,557 45,612 55,447 252,233 294,353Total long term farm liabilities 457,634 474,922 201,440 220,518 965,526 927,627Total farm liabilities 968,792 1,028,058 375,440 402,890 2,026,855 2,208,955
Total nonfarm liabilities 63,774 74,068 103,014 163,202 66,556 60,090Total liabilities 1,032,566 1,102,126 478,453 566,092 2,093,411 2,269,045
Net worth (farm and nonfarm) 2,026,622 2,331,712 892,860 948,821 4,364,848 5,240,606Net worth change 305,090 55,961 875,758Percent net worth change 15 % 6 % 20 %
Ratio Analysis
Current farm liabilities / assets 49 % 41 % 64 % 54 % 44 % 39 %Intermediate farm liab. / assets 21 % 22 % 19 % 22 % 20 % 22 %Long term farm liab. / assets 37 % 36 % 46 % 45 % 35 % 32 %Total debt to asset ratio 34 % 32 % 35 % 37 % 32 % 30 %
2020 Annual Report RankEm © University of Minnesota
18
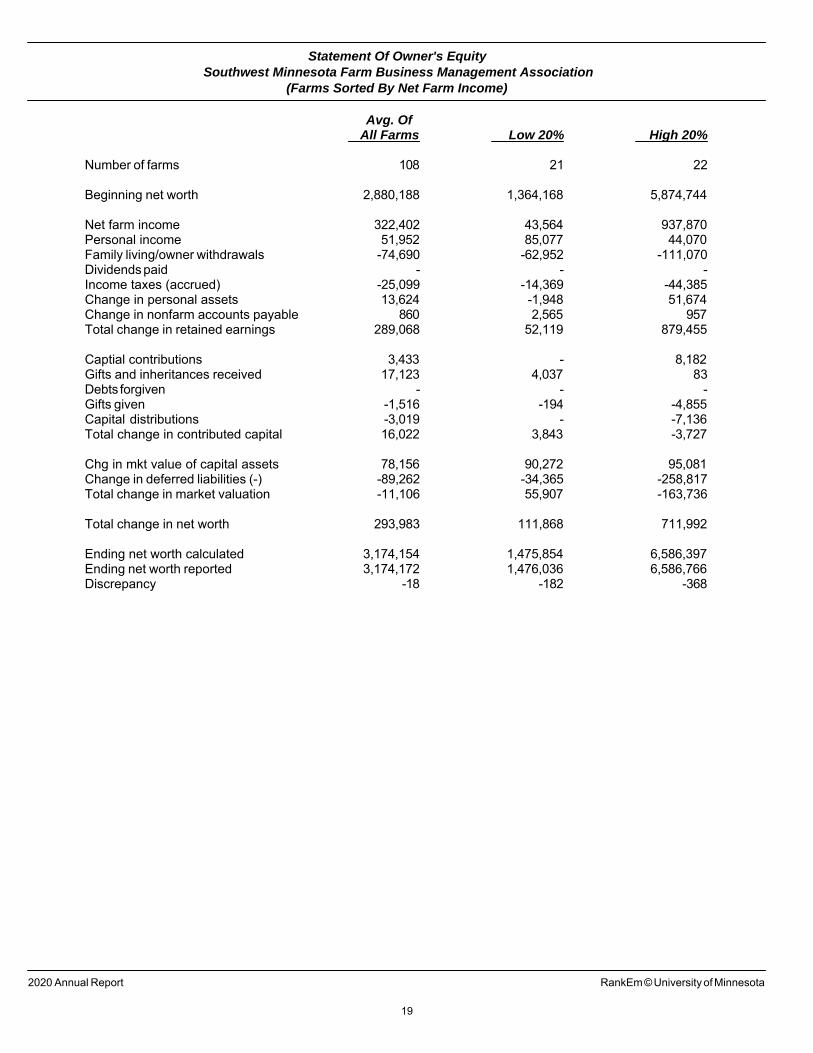
Statement Of Owner's EquitySouthwest Minnesota Farm Business Management Association
(Farms Sorted By Net Farm Income)
Avg. OfAll Farms Low 20% High 20%
Number of farms 108 21 22
Beginning net worth 2,880,188 1,364,168 5,874,744
Net farm income 322,402 43,564 937,870Personal income 51,952 85,077 44,070Family living/owner withdrawals -74,690 -62,952 -111,070Dividends paid - - -Income taxes (accrued) -25,099 -14,369 -44,385Change in personal assets 13,624 -1,948 51,674Change in nonfarm accounts payable 860 2,565 957Total change in retained earnings 289,068 52,119 879,455
Captial contributions 3,433 - 8,182Gifts and inheritances received 17,123 4,037 83Debts forgiven - - -Gifts given -1,516 -194 -4,855Capital distributions -3,019 - -7,136Total change in contributed capital 16,022 3,843 -3,727
Chg in mkt value of capital assets 78,156 90,272 95,081Change in deferred liabilities (-) -89,262 -34,365 -258,817Total change in market valuation -11,106 55,907 -163,736
Total change in net worth 293,983 111,868 711,992
Ending net worth calculated 3,174,154 1,475,854 6,586,397Ending net worth reported 3,174,172 1,476,036 6,586,766Discrepancy -18 -182 -368
2020 Annual Report RankEm © University of Minnesota
19
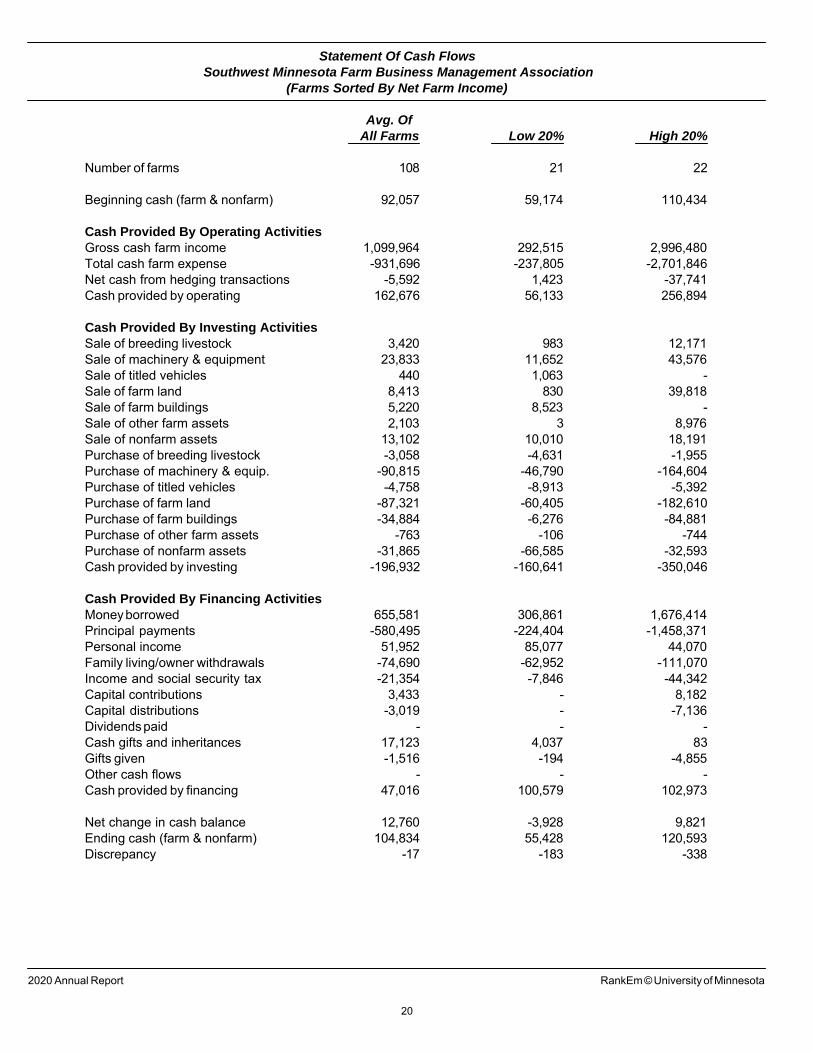
Statement Of Cash FlowsSouthwest Minnesota Farm Business Management Association
(Farms Sorted By Net Farm Income)
Avg. OfAll Farms Low 20% High 20%
Number of farms 108 21 22
Beginning cash (farm & nonfarm) 92,057 59,174 110,434
Cash Provided By Operating ActivitiesGross cash farm income 1,099,964 292,515 2,996,480Total cash farm expense -931,696 -237,805 -2,701,846Net cash from hedging transactions -5,592 1,423 -37,741Cash provided by operating 162,676 56,133 256,894
Cash Provided By Investing ActivitiesSale of breeding livestock 3,420 983 12,171Sale of machinery & equipment 23,833 11,652 43,576Sale of titled vehicles 440 1,063 -Sale of farm land 8,413 830 39,818Sale of farm buildings 5,220 8,523 -Sale of other farm assets 2,103 3 8,976Sale of nonfarm assets 13,102 10,010 18,191Purchase of breeding livestock -3,058 -4,631 -1,955Purchase of machinery & equip. -90,815 -46,790 -164,604Purchase of titled vehicles -4,758 -8,913 -5,392Purchase of farm land -87,321 -60,405 -182,610Purchase of farm buildings -34,884 -6,276 -84,881Purchase of other farm assets -763 -106 -744Purchase of nonfarm assets -31,865 -66,585 -32,593Cash provided by investing -196,932 -160,641 -350,046
Cash Provided By Financing ActivitiesMoney borrowed 655,581 306,861 1,676,414Principal payments -580,495 -224,404 -1,458,371Personal income 51,952 85,077 44,070Family living/owner withdrawals -74,690 -62,952 -111,070Income and social security tax -21,354 -7,846 -44,342Capital contributions 3,433 - 8,182Capital distributions -3,019 - -7,136Dividends paid - - -Cash gifts and inheritances 17,123 4,037 83Gifts given -1,516 -194 -4,855Other cash flows - - -Cash provided by financing 47,016 100,579 102,973
Net change in cash balance 12,760 -3,928 9,821Ending cash (farm & nonfarm) 104,834 55,428 120,593Discrepancy -17 -183 -338
2020 Annual Report RankEm © University of Minnesota
20
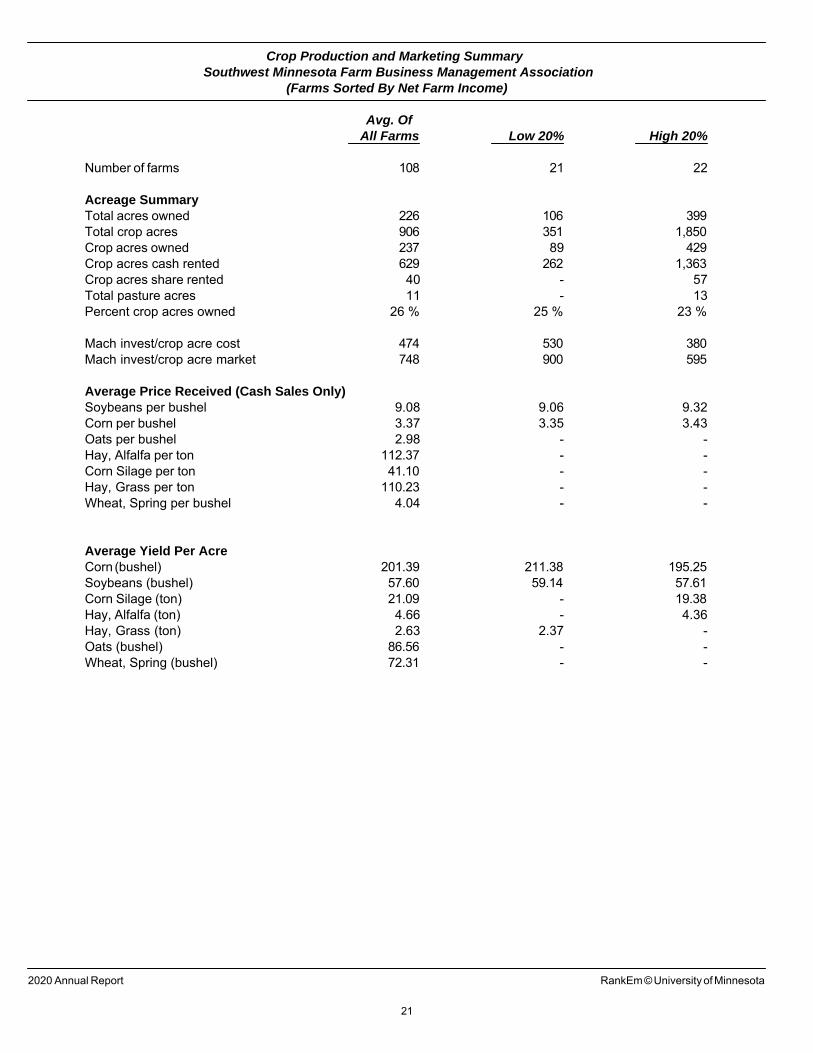
Crop Production and Marketing SummarySouthwest Minnesota Farm Business Management Association
(Farms Sorted By Net Farm Income)
Avg. OfAll Farms Low 20% High 20%
Number of farms 108 21 22
Acreage SummaryTotal acres owned 226 106 399Total crop acres 906 351 1,850Crop acres owned 237 89 429Crop acres cash rented 629 262 1,363Crop acres share rented 40 - 57Total pasture acres 11 - 13Percent crop acres owned 26 % 25 % 23 %
Mach invest/crop acre cost 474 530 380Mach invest/crop acre market 748 900 595
Average Price Received (Cash Sales Only)Soybeans per bushel 9.08 9.06 9.32Corn per bushel 3.37 3.35 3.43Oats per bushel 2.98 - -Hay, Alfalfa per ton 112.37 - -Corn Silage per ton 41.10 - -Hay, Grass per ton 110.23 - -Wheat, Spring per bushel 4.04 - -
Average Yield Per AcreCorn (bushel) 201.39 211.38 195.25Soybeans (bushel) 57.60 59.14 57.61Corn Silage (ton) 21.09 - 19.38Hay, Alfalfa (ton) 4.66 - 4.36Hay, Grass (ton) 2.63 2.37 -Oats (bushel) 86.56 - -Wheat, Spring (bushel) 72.31 - -
2020 Annual Report RankEm © University of Minnesota
21
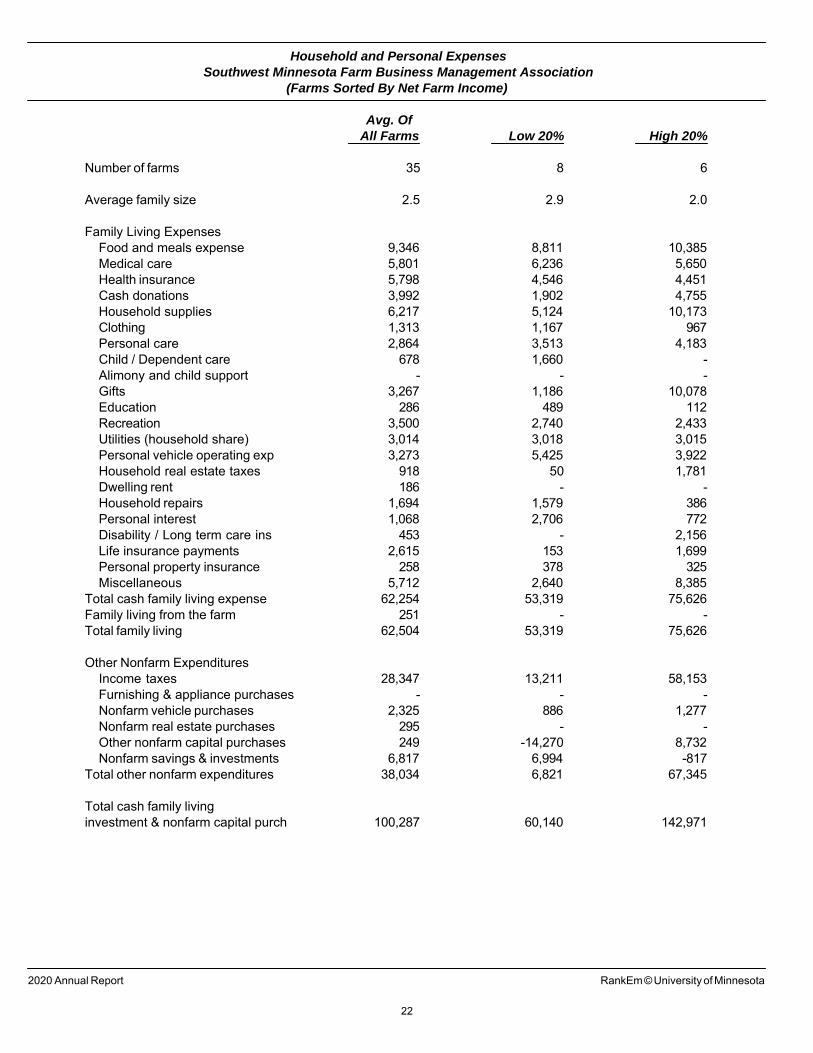
Household and Personal ExpensesSouthwest Minnesota Farm Business Management Association
(Farms Sorted By Net Farm Income)
Avg. OfAll Farms Low 20% High 20%
Number of farms 35 8 6
Average family size 2.5 2.9 2.0
Family Living ExpensesFood and meals expense 9,346 8,811 10,385Medical care 5,801 6,236 5,650Health insurance 5,798 4,546 4,451Cash donations 3,992 1,902 4,755Household supplies 6,217 5,124 10,173Clothing 1,313 1,167 967Personal care 2,864 3,513 4,183Child / Dependent care 678 1,660 -Alimony and child support - - -Gifts 3,267 1,186 10,078Education 286 489 112Recreation 3,500 2,740 2,433Utilities (household share) 3,014 3,018 3,015Personal vehicle operating exp 3,273 5,425 3,922Household real estate taxes 918 50 1,781Dwelling rent 186 - -Household repairs 1,694 1,579 386Personal interest 1,068 2,706 772Disability / Long term care ins 453 - 2,156Life insurance payments 2,615 153 1,699Personal property insurance 258 378 325Miscellaneous 5,712 2,640 8,385
Total cash family living expense 62,254 53,319 75,626Family living from the farm 251 - -Total family living 62,504 53,319 75,626
Other Nonfarm ExpendituresIncome taxes 28,347 13,211 58,153Furnishing & appliance purchases - - -Nonfarm vehicle purchases 2,325 886 1,277Nonfarm real estate purchases 295 - -Other nonfarm capital purchases 249 -14,270 8,732Nonfarm savings & investments 6,817 6,994 -817
Total other nonfarm expenditures 38,034 6,821 67,345
Total cash family livinginvestment & nonfarm capital purch 100,287 60,140 142,971
2020 Annual Report RankEm © University of Minnesota
22
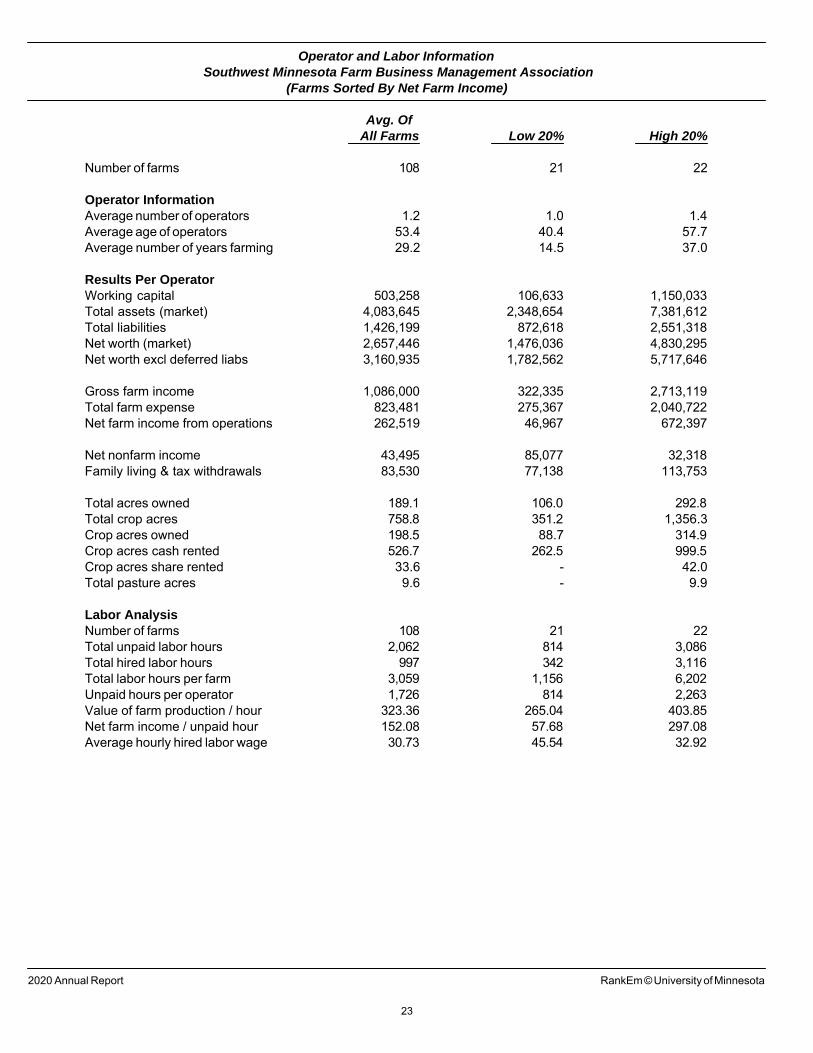
Operator and Labor InformationSouthwest Minnesota Farm Business Management Association
(Farms Sorted By Net Farm Income)
Avg. OfAll Farms Low 20% High 20%
108 21 22
1.2 1.0 1.453.4 40.4 57.729.2 14.5 37.0
503,258 106,633 1,150,0334,083,645 2,348,654 7,381,6121,426,199 872,618 2,551,3182,657,446 1,476,036 4,830,2953,160,935 1,782,562 5,717,646
1,086,000 322,335 2,713,119823,481 275,367 2,040,722262,519 46,967 672,397
43,495 85,077 32,31883,530 77,138 113,753
189.1 106.0 292.8758.8 351.2 1,356.3198.5 88.7 314.9526.7 262.5 999.533.6 - 42.09.6 - 9.9
108 21 222,062 814 3,086
997 342 3,1163,059 1,156 6,2021,726 814 2,263
323.36 265.04 403.85152.08 57.68 297.0830.73 45.54 32.92
Number of farms
Operator Information Average number of operators Average age of operators Average number of years farming
Results Per Operator Working capitalTotal assets (market)Total liabilitiesNet worth (market)Net worth excl deferred liabs
Gross farm incomeTotal farm expenseNet farm income from operations
Net nonfarm incomeFamily living & tax withdrawals
Total acres ownedTotal crop acresCrop acres ownedCrop acres cash rentedCrop acres share rentedTotal pasture acres
Labor AnalysisNumber of farmsTotal unpaid labor hoursTotal hired labor hoursTotal labor hours per farm Unpaid hours per operator Value of farm production / hour Net farm income / unpaid hour Average hourly hired labor wage
2020 Annual Report RankEm © University of Minnesota
23
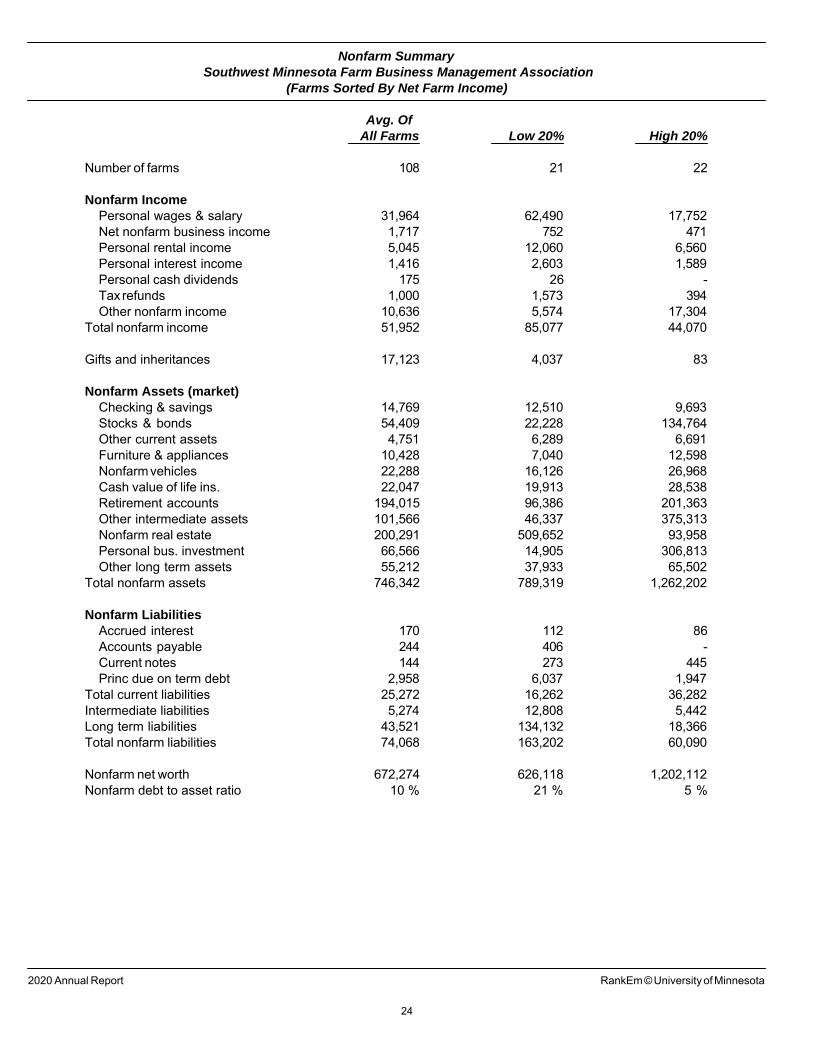
Nonfarm SummarySouthwest Minnesota Farm Business Management Association
(Farms Sorted By Net Farm Income)
Avg. OfAll Farms Low 20% High 20%
Number of farms 108 21 22
Nonfarm IncomePersonal wages & salary 31,964 62,490 17,752Net nonfarm business income 1,717 752 471Personal rental income 5,045 12,060 6,560Personal interest income 1,416 2,603 1,589Personal cash dividends 175 26 -Tax refunds 1,000 1,573 394Other nonfarm income 10,636 5,574 17,304
Total nonfarm income 51,952 85,077 44,070
Gifts and inheritances 17,123 4,037 83
Nonfarm Assets (market)Checking & savings 14,769 12,510 9,693Stocks & bonds 54,409 22,228 134,764Other current assets 4,751 6,289 6,691Furniture & appliances 10,428 7,040 12,598Nonfarm vehicles 22,288 16,126 26,968Cash value of life ins. 22,047 19,913 28,538Retirement accounts 194,015 96,386 201,363Other intermediate assets 101,566 46,337 375,313Nonfarm real estate 200,291 509,652 93,958Personal bus. investment 66,566 14,905 306,813Other long term assets 55,212 37,933 65,502
Total nonfarm assets 746,342 789,319 1,262,202
Nonfarm LiabilitiesAccrued interest 170 112 86Accounts payable 244 406 -Current notes 144 273 445Princ due on term debt 2,958 6,037 1,947
Total current liabilities 25,272 16,262 36,282Intermediate liabilities 5,274 12,808 5,442Long term liabilities 43,521 134,132 18,366Total nonfarm liabilities 74,068 163,202 60,090
Nonfarm net worth 672,274 626,118 1,202,112Nonfarm debt to asset ratio 10 % 21 % 5 %
2020 Annual Report RankEm © University of Minnesota
24
2020 Annual Report Copyright©2021, University of Minnesota
___________________________________________________________________________________________
Projected Profitability Southwest Minnesota Farm Business Management Association
___________________________________________________________________________________________
2020
Statewide Actual
2020 Improved
Margin Mgmt.
2020 Statewide
Crop Farms Actual
2021 Statewide
Crop Farms Projected
2020 Statewide Lvst Farms
Actual
2021 Statewide Lvst Farms Projected
Liquidity Current ratio 2.0 2.1 1.9 1.8 2.1 2.1 Working capital to gross 33% 35% 41% 40% 25% 26% Solvency1 Debt to asset 35% 34% 33% 34% 37% 37% Debt to equity 0.53 0.52 0.50 0.51 0.58 0.58 Profitability Rate of return on assets2 6% 9% 5% 3.1% 8% 1% Operating profit margin 21% 29% 19% 12% 23% 2% Net farm income3 $174,273 $257,000 $161,076 $99,000 $243,117 $20,000 Repayment capacity Term debt coverage 2.7 3.7 2.8 2.0 2.8 0.9 Replacement coverage 2.0 2.7 1.9 1.4 2.3 0.8 Efficiency Asset turnover rate 29% 31% 28% 27% 33% 28% Operating expense ratio 72% 65% 69% 76% 76% 90% Net worth growth Net worth change 12% 16% 11% 8% 15% 3%
Projected Changes
2020 Statewide All Farms
Actual
2020 Improved
Margin Mgmt.
2020 Statewide
Crop Farms Actual
2021 Statewide
Crop Farms Projected
2020 Statewide Lvst Farms
Actual
2021 Statewide Lvst Farms Projected
Gross income - +5% - -5% - -6%Operating expenses - -5% - +4% - +11%Interest rates - 0% - 0% - -0%Current assets - +5% - -3% - -0%Noncurrent assets - 0% - 0% - 0%
1 Assets at estimated market value excluding deferred liabilities. 2 Assets at estimated market value, returns excluding change in market valuation. 3 Differs from previous tables because Owner Wages and Benefits are treated as expenses. In previous tables, owner wages and benefits are moved to Value of Operator Labor and Management to improve comparative analysis.
25

26
Crop Reports
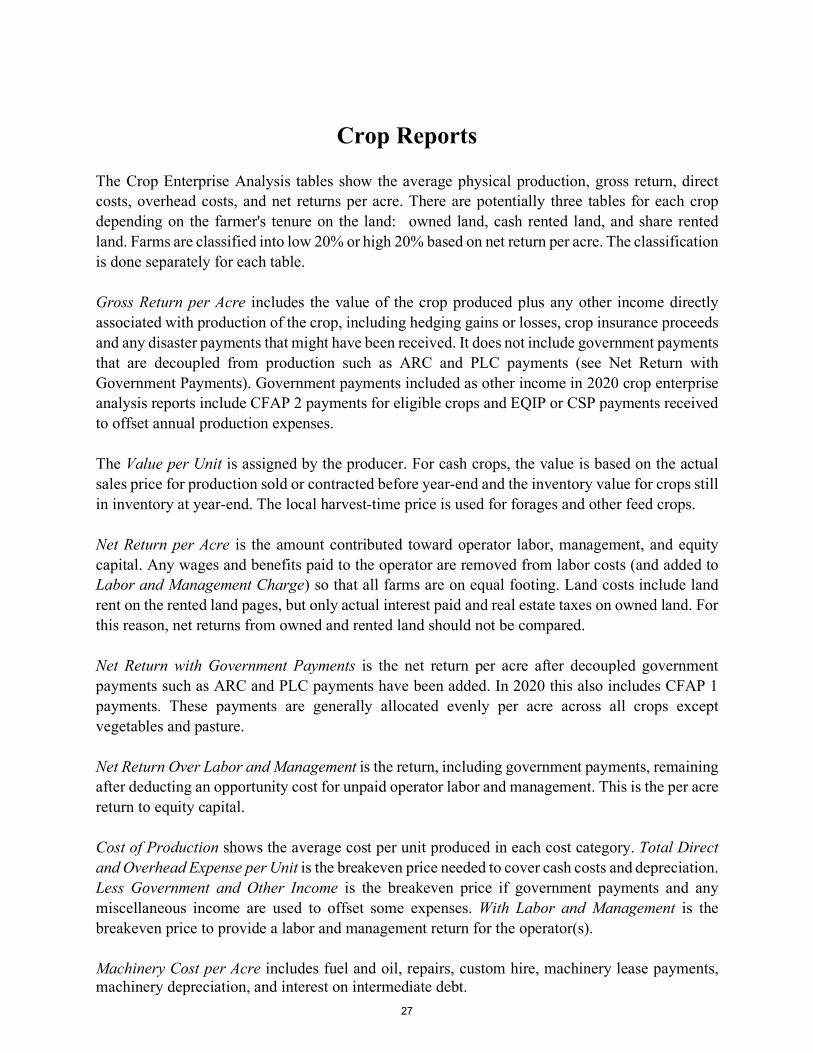
The Crop Enterprise Analysis tables show the average physical production, gross return, direct costs, overhead costs, and net returns per acre. There are potentially three tables for each crop depending on the farmer's tenure on the land: owned land, cash rented land, and share rented land. Farms are classified into low 20% or high 20% based on net return per acre. The classification is done separately for each table. Gross Return per Acre includes the value of the crop produced plus any other income directly associated with production of the crop, including hedging gains or losses, crop insurance proceeds and any disaster payments that might have been received. It does not include government payments that are decoupled from production such as ARC and PLC payments (see Net Return with Government Payments). Government payments included as other income in 2020 crop enterprise analysis reports include CFAP 2 payments for eligible crops and EQIP or CSP payments received to offset annual production expenses. The Value per Unit is assigned by the producer. For cash crops, the value is based on the actual sales price for production sold or contracted before year-end and the inventory value for crops still in inventory at year-end. The local harvest-time price is used for forages and other feed crops. Net Return per Acre is the amount contributed toward operator labor, management, and equity capital. Any wages and benefits paid to the operator are removed from labor costs (and added to Labor and Management Charge) so that all farms are on equal footing. Land costs include land rent on the rented land pages, but only actual interest paid and real estate taxes on owned land. For this reason, net returns from owned and rented land should not be compared. Net Return with Government Payments is the net return per acre after decoupled government payments such as ARC and PLC payments have been added. In 2020 this also includes CFAP 1 payments. These payments are generally allocated evenly per acre across all crops except vegetables and pasture. Net Return Over Labor and Management is the return, including government payments, remaining after deducting an opportunity cost for unpaid operator labor and management. This is the per acre return to equity capital. Cost of Production shows the average cost per unit produced in each cost category. Total Direct and Overhead Expense per Unit is the breakeven price needed to cover cash costs and depreciation. Less Government and Other Income is the breakeven price if government payments and any miscellaneous income are used to offset some expenses. With Labor and Management is the breakeven price to provide a labor and management return for the operator(s). Machinery Cost per Acre includes fuel and oil, repairs, custom hire, machinery lease payments, machinery depreciation, and interest on intermediate debt.
27
Note: The following government payments received by crop producers were not included in the enterprise analysis.
• WHIP+ disaster program – these payments relate to crop losses in 2018 and 2019, not the current production year. Therefore, have been excluded for the 2020 crop enterprise analysis.
• MFP 2.0 3rd tranche payment – this payment, received in February 2020, was accrued (included) in the 2019 enterprise analysis of impacted crops.
• CFAP 3 (now termed Pandemic Assistance for Producers or PAP) – this payment, yet to be received at the time of this writing, will be included in the 2021 crop enterprise analysis of eligible crops.
• Other government program payments not directly related to crop production including: amounts of PPP loans forgiven, EIDL Emergency Advance Program, MN Small Business Relief Grants, and MN CARES Act funding for agriculture.
28
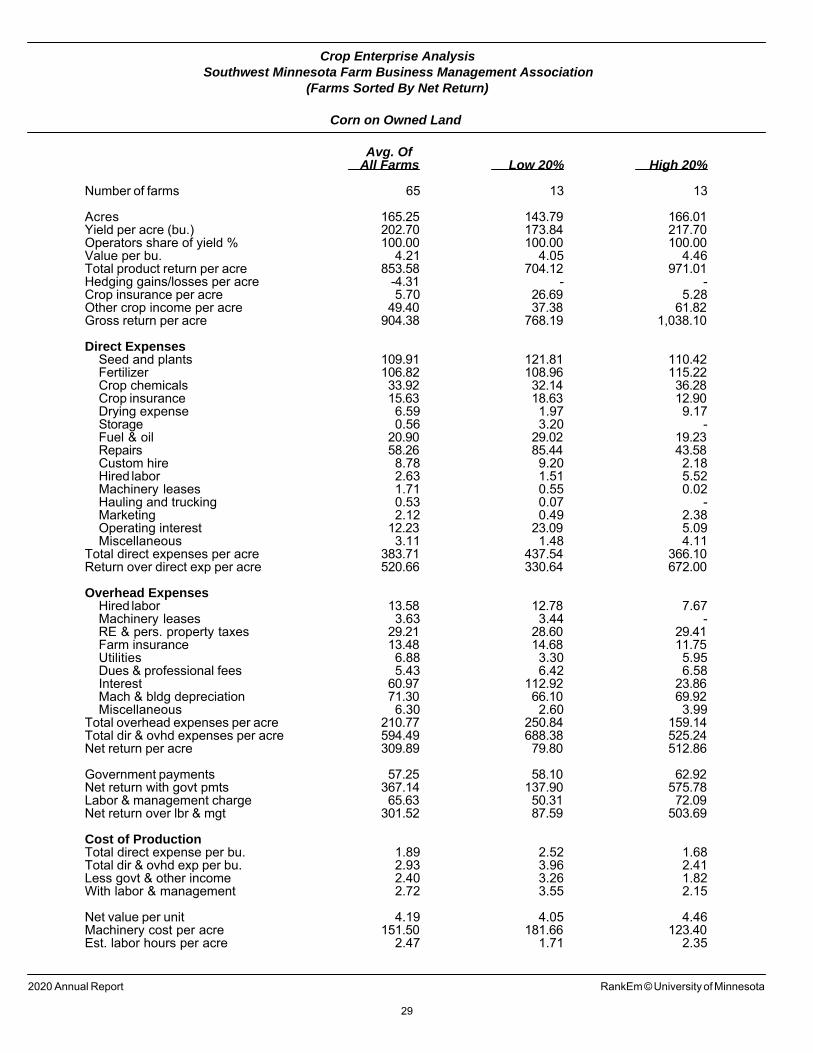
Crop Enterprise AnalysisSouthwest Minnesota Farm Business Management Association
(Farms Sorted By Net Return)
Corn on Owned Land
Avg. OfAll Farms Low 20% High 20%
Number of farms 65 13 13
Acres 165.25 143.79 166.01Yield per acre (bu.) 202.70 173.84 217.70Operators share of yield % 100.00 100.00 100.00Value per bu. 4.21 4.05 4.46Total product return per acre 853.58 704.12 971.01Hedging gains/losses per acre -4.31 - -Crop insurance per acre 5.70 26.69 5.28Other crop income per acre 49.40 37.38 61.82Gross return per acre 904.38 768.19 1,038.10
Direct ExpensesSeed and plants 109.91 121.81 110.42Fertilizer 106.82 108.96 115.22Crop chemicals 33.92 32.14 36.28Crop insurance 15.63 18.63 12.90Drying expense 6.59 1.97 9.17Storage 0.56 3.20 -Fuel & oil 20.90 29.02 19.23Repairs 58.26 85.44 43.58Custom hire 8.78 9.20 2.18Hired labor 2.63 1.51 5.52Machinery leases 1.71 0.55 0.02Hauling and trucking 0.53 0.07 -Marketing 2.12 0.49 2.38Operating interest 12.23 23.09 5.09Miscellaneous 3.11 1.48 4.11
Total direct expenses per acre 383.71 437.54 366.10Return over direct exp per acre 520.66 330.64 672.00
Overhead ExpensesHired labor 13.58 12.78 7.67Machinery leases 3.63 3.44 -RE & pers. property taxes 29.21 28.60 29.41Farm insurance 13.48 14.68 11.75Utilities 6.88 3.30 5.95Dues & professional fees 5.43 6.42 6.58Interest 60.97 112.92 23.86Mach & bldg depreciation 71.30 66.10 69.92Miscellaneous 6.30 2.60 3.99
Total overhead expenses per acre 210.77 250.84 159.14Total dir & ovhd expenses per acre 594.49 688.38 525.24Net return per acre 309.89 79.80 512.86
Government payments 57.25 58.10 62.92Net return with govt pmts 367.14 137.90 575.78Labor & management charge 65.63 50.31 72.09Net return over lbr & mgt 301.52 87.59 503.69
Cost of ProductionTotal direct expense per bu. 1.89 2.52 1.68Total dir & ovhd exp per bu. 2.93 3.96 2.41Less govt & other income 2.40 3.26 1.82With labor & management 2.72 3.55 2.15
Net value per unit 4.19 4.05 4.46Machinery cost per acre 151.50 181.66 123.40Est. labor hours per acre 2.47 1.71 2.35
2020 Annual Report RankEm © University of Minnesota
29
Crop Enterprise AnalysisSouthwest Minnesota Farm Business Management Association
(Farms Sorted By Net Return)
Corn on Cash Rent
Avg. OfAll Farms Low 20% High 20%
Number of farms 88 17 18
Acres 377.55 438.26 378.94Yield per acre (bu.) 201.03 188.11 219.25Operators share of yield % 100.00 100.00 100.00Value per bu. 4.25 4.09 4.37Other product return per acre 0.11 - 0.55Total product return per acre 854.95 768.50 959.35Hedging gains/losses per acre -12.40 -2.71 4.50Crop insurance per acre 7.19 20.29 3.95Other crop income per acre 49.74 53.36 49.11Gross return per acre 899.47 839.43 1,016.91
Direct ExpensesSeed and plants 103.61 110.27 104.13Fertilizer 104.28 108.56 97.28Crop chemicals 31.74 36.37 27.81Cover crop expense 0.48 1.71 -Crop insurance 17.93 24.55 19.67Drying expense 7.40 6.02 7.00Storage 0.87 3.62 0.00Fuel & oil 20.67 31.32 15.36Repairs 43.62 45.71 29.19Custom hire 8.89 13.72 5.49Hired labor 3.28 4.55 2.48Land rent 202.78 217.97 209.28Machinery leases 2.84 1.14 0.85Hauling and trucking 0.59 1.12 0.20Marketing 2.27 0.48 1.17Operating interest 12.98 23.77 5.27Miscellaneous 3.20 5.58 2.25
Total direct expenses per acre 567.43 636.47 527.42Return over direct exp per acre 332.04 202.96 489.49
Overhead ExpensesHired labor 11.58 16.87 5.01Machinery leases 12.12 8.78 17.32Building leases 0.84 2.40 0.15Farm insurance 11.00 18.32 8.15Utilities 5.24 7.31 4.04Dues & professional fees 5.98 8.28 4.55Interest 4.80 6.84 4.80Mach & bldg depreciation 58.05 74.23 41.09Miscellaneous 6.64 4.52 2.37
Total overhead expenses per acre 116.24 147.57 87.47Total dir & ovhd expenses per acre 683.67 784.04 614.90Net return per acre 215.80 55.39 402.02
Government payments 50.63 57.41 45.31Net return with govt pmts 266.43 112.79 447.32Labor & management charge 58.84 53.96 52.97Net return over lbr & mgt 207.58 58.83 394.35
Cost of ProductionTotal direct expense per bu. 2.82 3.38 2.41Total dir & ovhd exp per bu. 3.40 4.17 2.80Less govt & other income 2.93 3.49 2.33With labor & management 3.22 3.77 2.57
Net value per unit 4.19 4.07 4.39Machinery cost per acre 141.88 168.77 108.31Est. labor hours per acre 2.04 2.10 2.01
2020 Annual Report RankEm © University of Minnesota
30
Crop Enterprise AnalysisSouthwest Minnesota Farm Business Management Association
(Farms Sorted By Net Return)
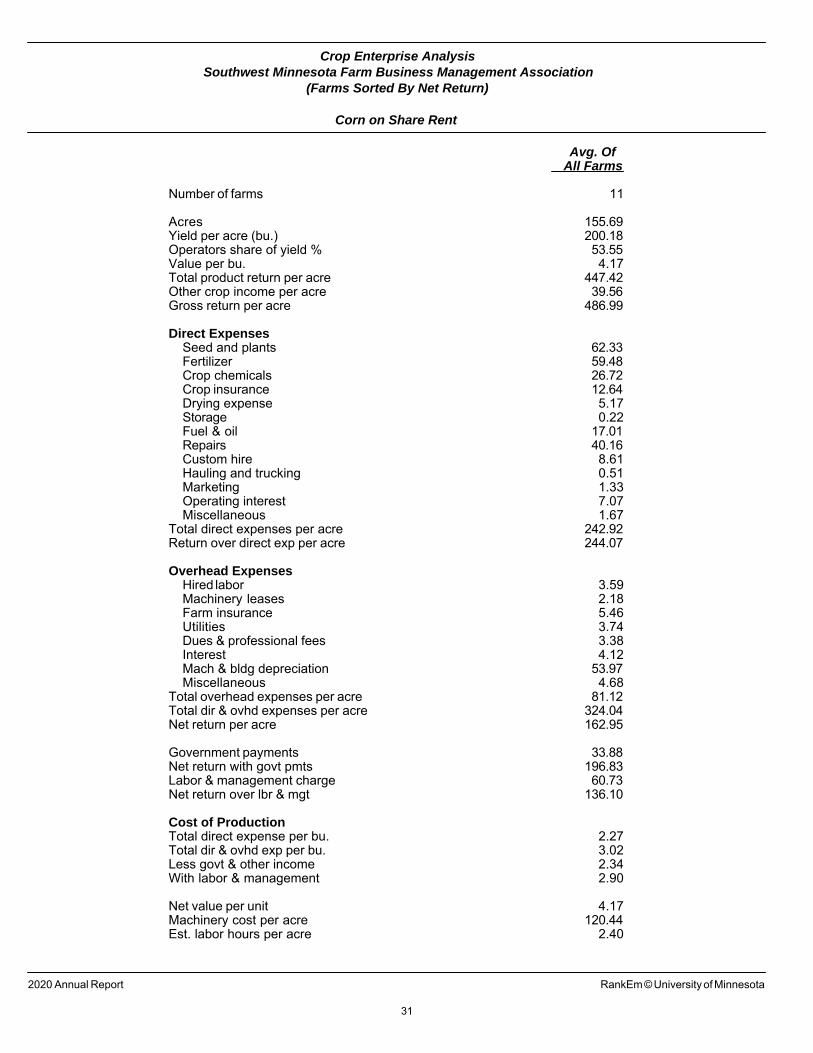
Corn on Share Rent
Avg. OfAll Farms
Number of farms 11
Acres 155.69Yield per acre (bu.) 200.18Operators share of yield % 53.55Value per bu. 4.17Total product return per acre 447.42Other crop income per acre 39.56Gross return per acre 486.99
Direct ExpensesSeed and plants 62.33Fertilizer 59.48Crop chemicals 26.72Crop insurance 12.64Drying expense 5.17Storage 0.22Fuel & oil 17.01Repairs 40.16Custom hire 8.61Hauling and trucking 0.51Marketing 1.33Operating interest 7.07Miscellaneous 1.67
Total direct expenses per acre 242.92Return over direct exp per acre 244.07
Overhead ExpensesHired labor 3.59Machinery leases 2.18Farm insurance 5.46Utilities 3.74Dues & professional fees 3.38Interest 4.12Mach & bldg depreciation 53.97Miscellaneous 4.68
Total overhead expenses per acre 81.12Total dir & ovhd expenses per acre 324.04Net return per acre 162.95
Government payments 33.88Net return with govt pmts 196.83Labor & management charge 60.73Net return over lbr & mgt 136.10
Cost of ProductionTotal direct expense per bu. 2.27Total dir & ovhd exp per bu. 3.02Less govt & other income 2.34With labor & management 2.90
Net value per unit 4.17Machinery cost per acre 120.44Est. labor hours per acre 2.40
2020 Annual Report RankEm © University of Minnesota
31
32
Crop Enterprise AnalysisSouthwest Minnesota Farm Business Management Association
(Farms Sorted By Net Return)
Soybeans on Owned Land
Avg. OfAll Farms Low 20% High 20%
Number of farms 66 13 14
Acres 159.11 104.11 159.26Yield per acre (bu.) 58.74 51.01 62.30Operators share of yield % 100.00 100.00 100.00Value per bu. 11.01 9.18 12.25Total product return per acre 646.97 468.47 762.90Hedging gains/losses per acre -5.30 - -Crop insurance per acre 4.32 14.83 2.08Other crop income per acre 22.82 25.32 30.53Gross return per acre 668.80 508.62 795.51
Direct ExpensesSeed and plants 52.46 50.85 48.48Fertilizer 31.87 46.09 28.44Crop chemicals 46.33 50.68 47.48Cover crop expense 0.21 1.38 -Crop insurance 14.88 20.10 12.63Fuel & oil 15.85 14.99 12.41Repairs 39.39 57.76 29.59Custom hire 8.23 14.64 6.17Hired labor 3.69 4.73 4.52Machinery leases 2.10 0.68 5.16Marketing 3.01 1.56 0.89Operating interest 9.71 17.32 4.54Miscellaneous 4.11 4.07 2.06
Total direct expenses per acre 231.84 284.85 202.37Return over direct exp per acre 436.97 223.77 593.14
Overhead ExpensesHired labor 9.51 8.03 7.24Machinery leases 3.95 1.14 4.74RE & pers. property taxes 32.28 29.04 33.59Farm insurance 10.40 11.39 9.29Utilities 6.02 4.66 5.47Dues & professional fees 3.96 3.91 3.77Interest 64.03 141.03 28.43Mach & bldg depreciation 55.60 43.00 56.83Miscellaneous 4.77 7.14 1.92
Total overhead expenses per acre 190.51 249.33 151.28Total dir & ovhd expenses per acre 422.35 534.18 353.66Net return per acre 246.46 -25.56 441.86
Government payments 57.39 49.38 61.53Net return with govt pmts 303.84 23.82 503.39Labor & management charge 52.68 42.58 58.34Net return over lbr & mgt 251.17 -18.76 445.04
Cost of ProductionTotal direct expense per bu. 3.95 5.58 3.25Total dir & ovhd exp per bu. 7.19 10.47 5.68Less govt & other income 5.84 8.72 4.17With labor & management 6.74 9.55 5.10
Net value per unit 10.92 9.18 12.25Machinery cost per acre 115.36 128.67 104.26Est. labor hours per acre 1.89 1.89 1.98
2020 Annual Report RankEm © University of Minnesota
33
Crop Enterprise AnalysisSouthwest Minnesota Farm Business Management Association
(Farms Sorted By Net Return)
Soybeans on Cash Rent
Avg. OfAll Farms Low 20% High 20%
Number of farms 85 17 17
Acres 352.89 333.89 207.24Yield per acre (bu.) 57.12 54.69 62.82Operators share of yield % 100.00 100.00 100.00Value per bu. 11.01 9.59 11.65Total product return per acre 629.21 524.51 732.03Hedging gains/losses per acre -31.08 -2.48 6.33Crop insurance per acre 5.97 13.84 3.11Other crop income per acre 22.00 19.22 23.75Gross return per acre 626.10 555.10 765.23
Direct ExpensesSeed and plants 48.62 56.20 51.03Fertilizer 30.36 46.17 33.06Crop chemicals 47.41 56.18 48.95Crop insurance 15.24 18.93 11.29Storage 0.29 0.59 0.09Fuel & oil 15.67 22.96 10.91Repairs 33.17 37.60 25.11Custom hire 7.06 14.01 9.65Hired labor 2.96 3.06 10.60Land rent 210.25 212.43 179.54Machinery leases 2.88 0.37 1.82Hauling and trucking 0.51 - -Marketing 2.40 1.13 2.64Operating interest 9.01 19.71 3.30Miscellaneous 2.75 5.11 1.43
Total direct expenses per acre 428.58 494.46 389.41Return over direct exp per acre 197.52 60.64 375.81
Overhead ExpensesHired labor 11.44 18.60 4.56Machinery leases 12.47 4.03 1.37Building leases 0.82 3.39 -Farm insurance 8.01 11.90 8.74Utilities 3.81 4.46 3.74Dues & professional fees 3.64 5.64 5.23Interest 3.34 4.18 2.36Mach & bldg depreciation 41.96 57.38 47.63Miscellaneous 4.99 5.27 2.45
Total overhead expenses per acre 90.47 114.85 76.09Total dir & ovhd expenses per acre 519.05 609.31 465.50Net return per acre 107.05 -54.21 299.73
Government payments 47.08 48.80 56.37Net return with govt pmts 154.13 -5.41 356.10Labor & management charge 46.39 42.42 60.01Net return over lbr & mgt 107.74 -47.83 296.09
Cost of ProductionTotal direct expense per bu. 7.50 9.04 6.20Total dir & ovhd exp per bu. 9.09 11.14 7.41Less govt & other income 8.32 9.69 5.98With labor & management 9.13 10.47 6.94
Net value per unit 10.47 9.55 11.75Machinery cost per acre 109.89 132.73 92.37Est. labor hours per acre 1.64 1.77 1.88
2020 Annual Report RankEm © University of Minnesota
34
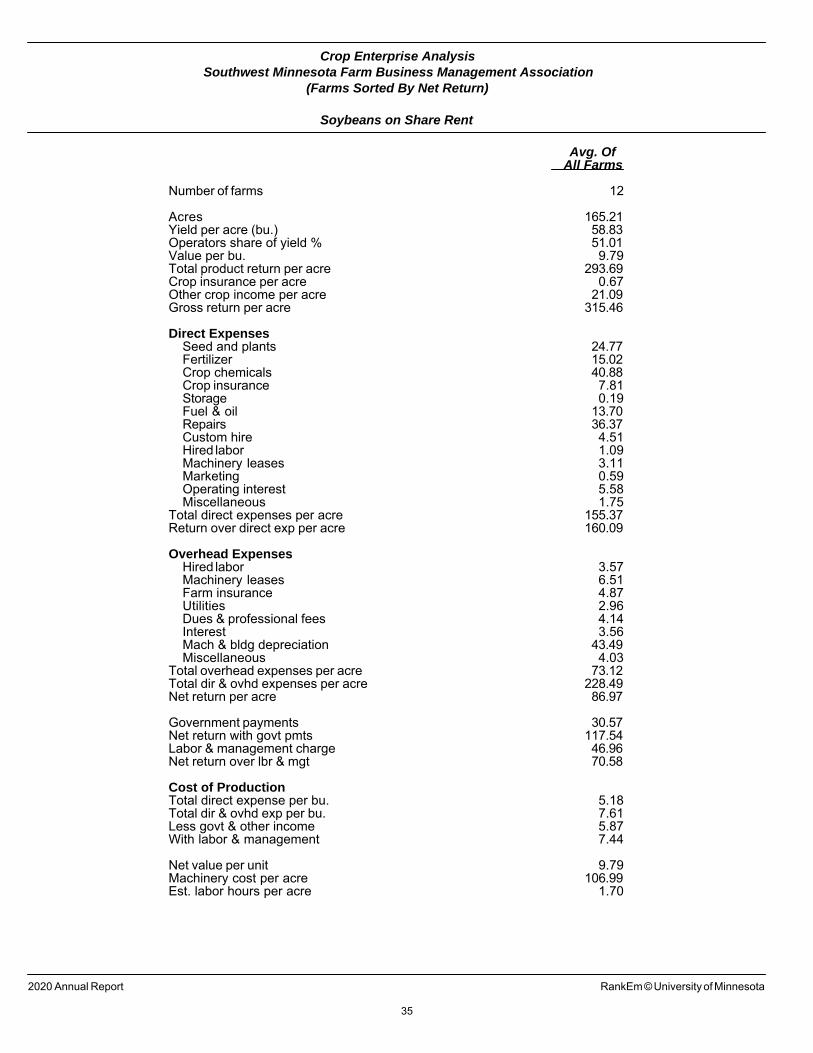
Crop Enterprise AnalysisSouthwest Minnesota Farm Business Management Association
(Farms Sorted By Net Return)
Soybeans on Share Rent
Avg. OfAll Farms
Number of farms 12
Acres 165.21Yield per acre (bu.) 58.83Operators share of yield % 51.01Value per bu. 9.79Total product return per acre 293.69Crop insurance per acre 0.67Other crop income per acre 21.09Gross return per acre 315.46
Direct ExpensesSeed and plants 24.77Fertilizer 15.02Crop chemicals 40.88Crop insurance 7.81Storage 0.19Fuel & oil 13.70Repairs 36.37Custom hire 4.51Hired labor 1.09Machinery leases 3.11Marketing 0.59Operating interest 5.58Miscellaneous 1.75
Total direct expenses per acre 155.37Return over direct exp per acre 160.09
Overhead ExpensesHired labor 3.57Machinery leases 6.51Farm insurance 4.87Utilities 2.96Dues & professional fees 4.14Interest 3.56Mach & bldg depreciation 43.49Miscellaneous 4.03
Total overhead expenses per acre 73.12Total dir & ovhd expenses per acre 228.49Net return per acre 86.97
Government payments 30.57Net return with govt pmts 117.54Labor & management charge 46.96Net return over lbr & mgt 70.58
Cost of ProductionTotal direct expense per bu. 5.18Total dir & ovhd exp per bu. 7.61Less govt & other income 5.87With labor & management 7.44
Net value per unit 9.79Machinery cost per acre 106.99Est. labor hours per acre 1.70
2020 Annual Report RankEm © University of Minnesota
35
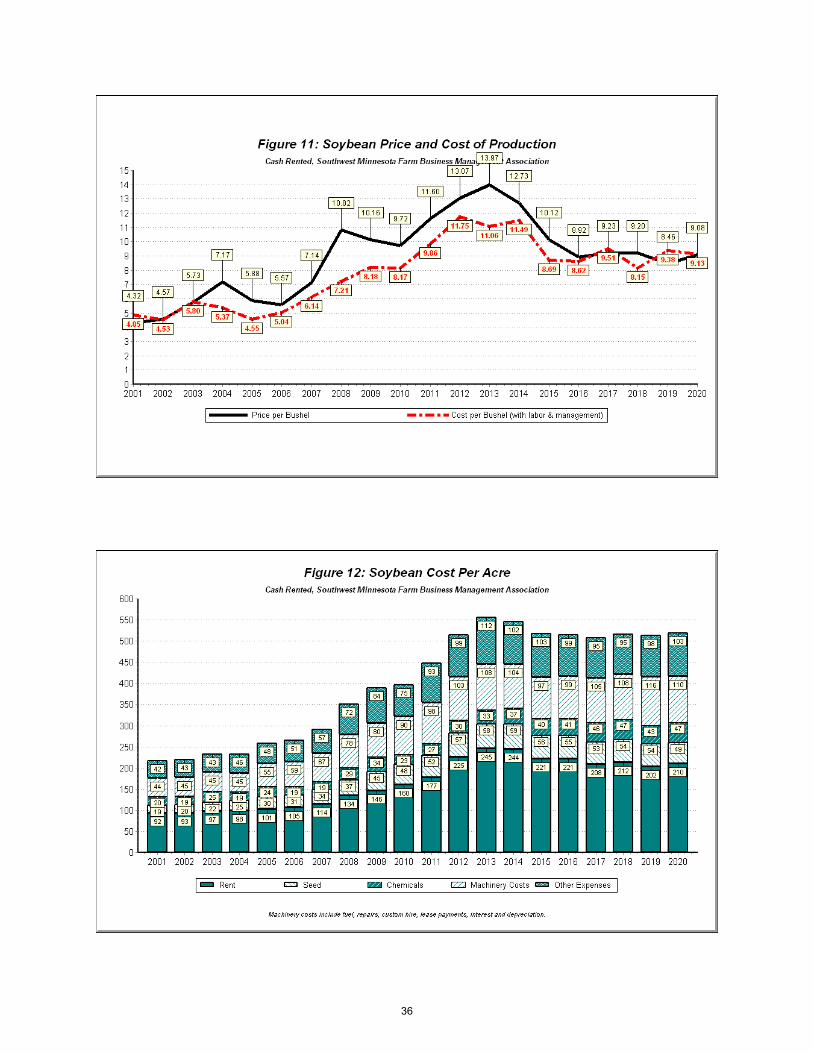
36
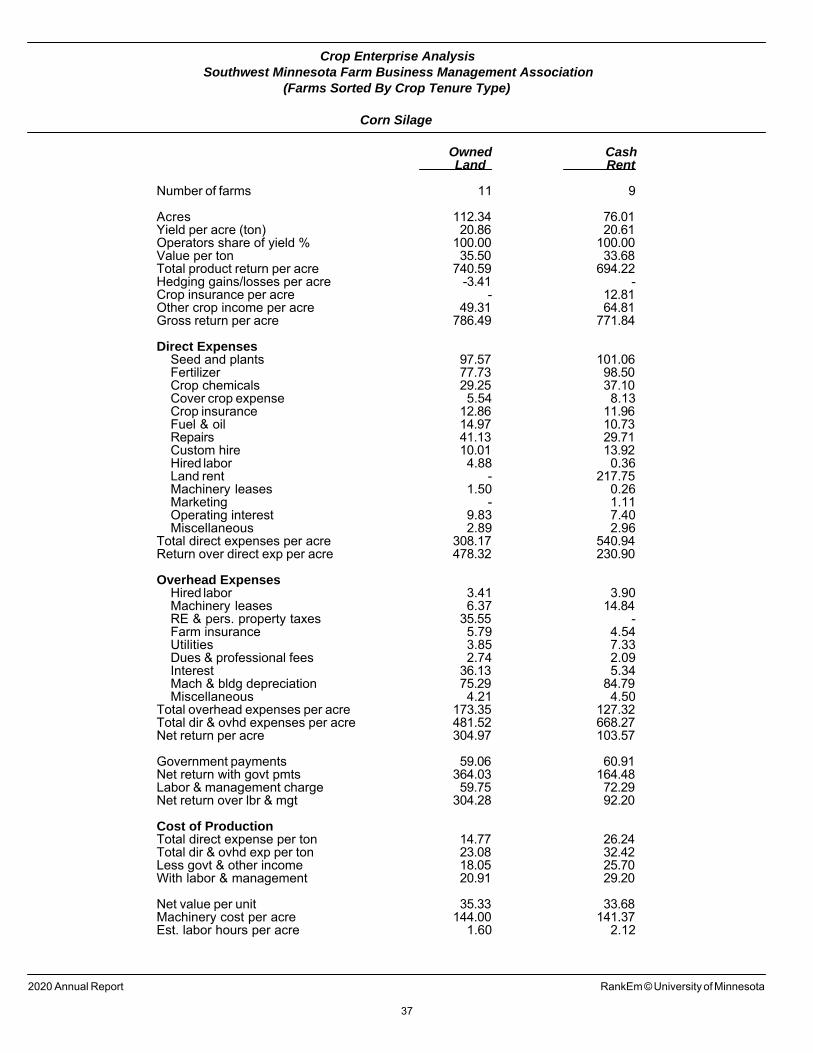
Crop Enterprise AnalysisSouthwest Minnesota Farm Business Management Association
(Farms Sorted By Crop Tenure Type)
Corn Silage
Owned CashLand Rent
Number of farms 11 9
Acres 112.34 76.01Yield per acre (ton) 20.86 20.61Operators share of yield % 100.00 100.00Value per ton 35.50 33.68Total product return per acre 740.59 694.22Hedging gains/losses per acre -3.41 -Crop insurance per acre - 12.81Other crop income per acre 49.31 64.81Gross return per acre 786.49 771.84
Direct ExpensesSeed and plants 97.57 101.06Fertilizer 77.73 98.50Crop chemicals 29.25 37.10Cover crop expense 5.54 8.13Crop insurance 12.86 11.96Fuel & oil 14.97 10.73Repairs 41.13 29.71Custom hire 10.01 13.92Hired labor 4.88 0.36Land rent - 217.75Machinery leases 1.50 0.26Marketing - 1.11Operating interest 9.83 7.40Miscellaneous 2.89 2.96
Total direct expenses per acre 308.17 540.94Return over direct exp per acre 478.32 230.90
Overhead ExpensesHired labor 3.41 3.90Machinery leases 6.37 14.84RE & pers. property taxes 35.55 -Farm insurance 5.79 4.54Utilities 3.85 7.33Dues & professional fees 2.74 2.09Interest 36.13 5.34Mach & bldg depreciation 75.29 84.79Miscellaneous 4.21 4.50
Total overhead expenses per acre 173.35 127.32Total dir & ovhd expenses per acre 481.52 668.27Net return per acre 304.97 103.57
Government payments 59.06 60.91Net return with govt pmts 364.03 164.48Labor & management charge 59.75 72.29Net return over lbr & mgt 304.28 92.20
Cost of ProductionTotal direct expense per ton 14.77 26.24Total dir & ovhd exp per ton 23.08 32.42Less govt & other income 18.05 25.70With labor & management 20.91 29.20
Net value per unit 35.33 33.68Machinery cost per acre 144.00 141.37Est. labor hours per acre 1.60 2.12
2020 Annual Report RankEm © University of Minnesota
37
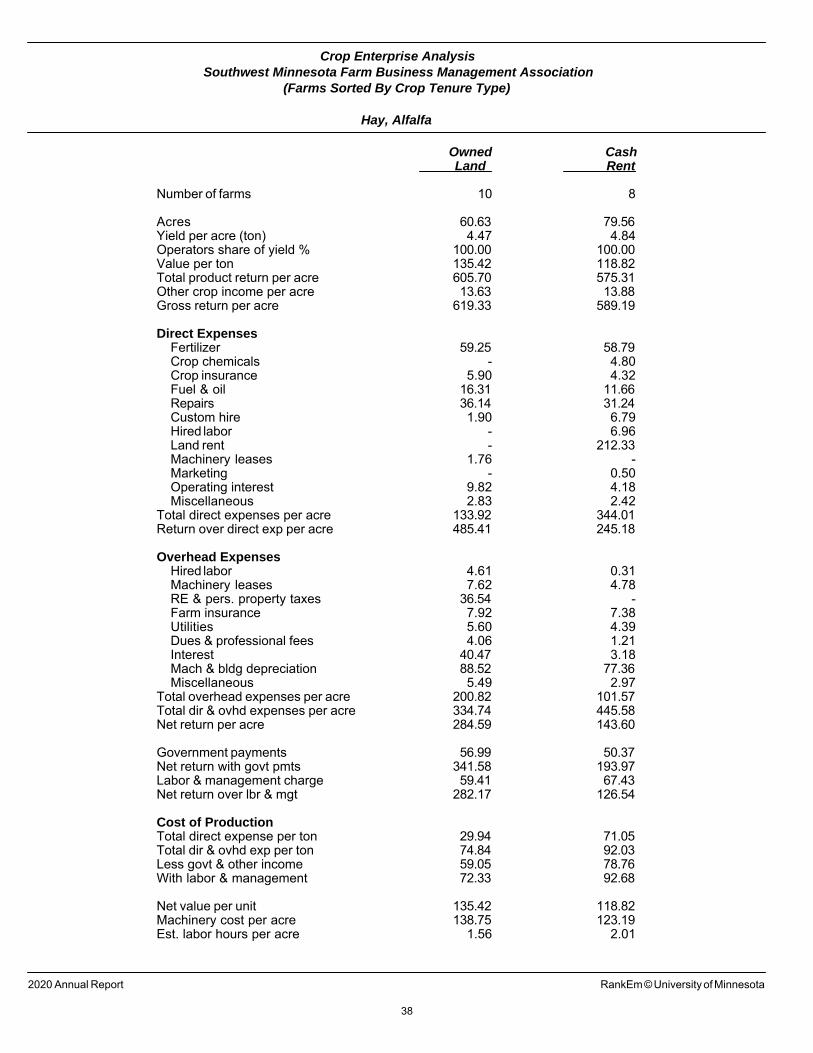
Crop Enterprise AnalysisSouthwest Minnesota Farm Business Management Association
(Farms Sorted By Crop Tenure Type)
Hay, Alfalfa
Owned CashLand Rent
Number of farms 10 8
Acres 60.63 79.56Yield per acre (ton) 4.47 4.84Operators share of yield % 100.00 100.00Value per ton 135.42 118.82Total product return per acre 605.70 575.31Other crop income per acre 13.63 13.88Gross return per acre 619.33 589.19
Direct ExpensesFertilizer 59.25 58.79Crop chemicals - 4.80Crop insurance 5.90 4.32Fuel & oil 16.31 11.66Repairs 36.14 31.24Custom hire 1.90 6.79Hired labor - 6.96Land rent - 212.33Machinery leases 1.76 -Marketing - 0.50Operating interest 9.82 4.18Miscellaneous 2.83 2.42
Total direct expenses per acre 133.92 344.01Return over direct exp per acre 485.41 245.18
Overhead ExpensesHired labor 4.61 0.31Machinery leases 7.62 4.78RE & pers. property taxes 36.54 -Farm insurance 7.92 7.38Utilities 5.60 4.39Dues & professional fees 4.06 1.21Interest 40.47 3.18Mach & bldg depreciation 88.52 77.36Miscellaneous 5.49 2.97
Total overhead expenses per acre 200.82 101.57Total dir & ovhd expenses per acre 334.74 445.58Net return per acre 284.59 143.60
Government payments 56.99 50.37Net return with govt pmts 341.58 193.97Labor & management charge 59.41 67.43Net return over lbr & mgt 282.17 126.54
Cost of ProductionTotal direct expense per ton 29.94 71.05Total dir & ovhd exp per ton 74.84 92.03Less govt & other income 59.05 78.76With labor & management 72.33 92.68
Net value per unit 135.42 118.82Machinery cost per acre 138.75 123.19Est. labor hours per acre 1.56 2.01
2020 Annual Report RankEm © University of Minnesota
38
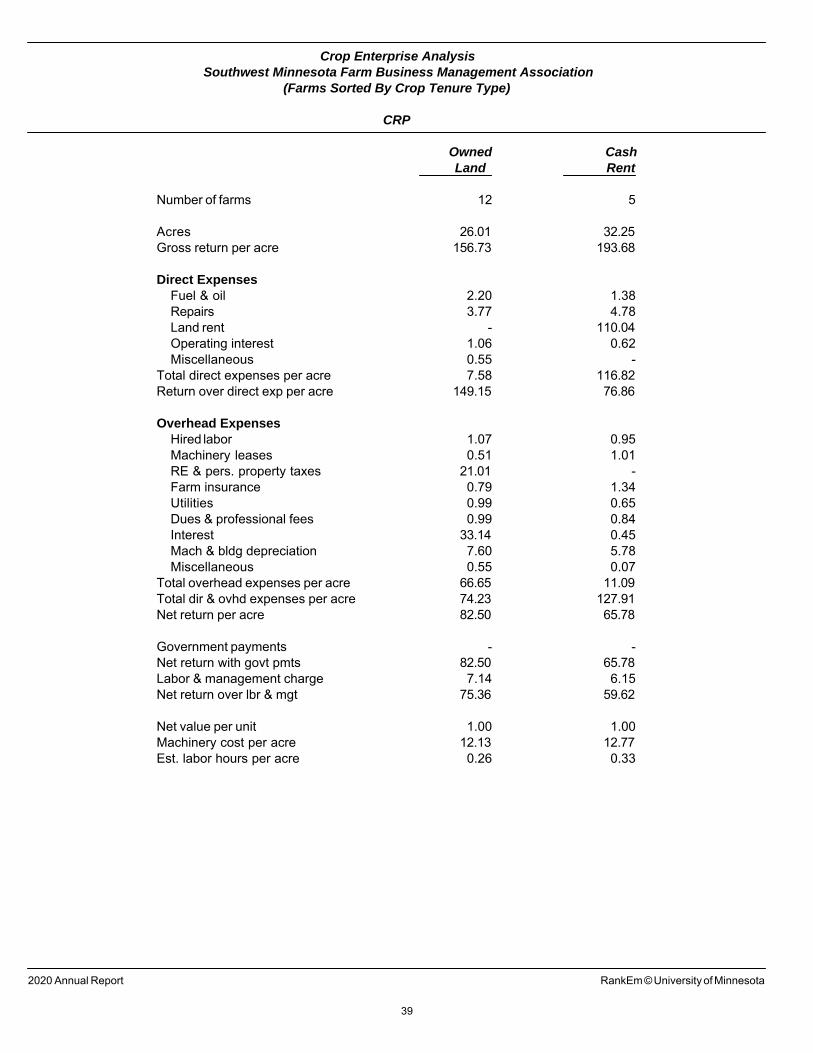
Crop Enterprise AnalysisSouthwest Minnesota Farm Business Management Association
(Farms Sorted By Crop Tenure Type)
CRP
Owned CashLand Rent
Number of farms 12 5
Acres 26.01 32.25Gross return per acre 156.73 193.68
Direct ExpensesFuel & oil 2.20 1.38Repairs 3.77 4.78Land rent - 110.04Operating interest 1.06 0.62Miscellaneous 0.55 -
Total direct expenses per acre 7.58 116.82Return over direct exp per acre 149.15 76.86
Overhead ExpensesHired labor 1.07 0.95Machinery leases 0.51 1.01RE & pers. property taxes 21.01 -Farm insurance 0.79 1.34Utilities 0.99 0.65Dues & professional fees 0.99 0.84Interest 33.14 0.45Mach & bldg depreciation 7.60 5.78Miscellaneous 0.55 0.07
Total overhead expenses per acre 66.65 11.09Total dir & ovhd expenses per acre 74.23 127.91Net return per acre 82.50 65.78
Government payments - -Net return with govt pmts 82.50 65.78Labor & management charge 7.14 6.15Net return over lbr & mgt 75.36 59.62
Net value per unit 1.00 1.00Machinery cost per acre 12.13 12.77Est. labor hours per acre 0.26 0.33
2020 Annual Report RankEm © University of Minnesota
39
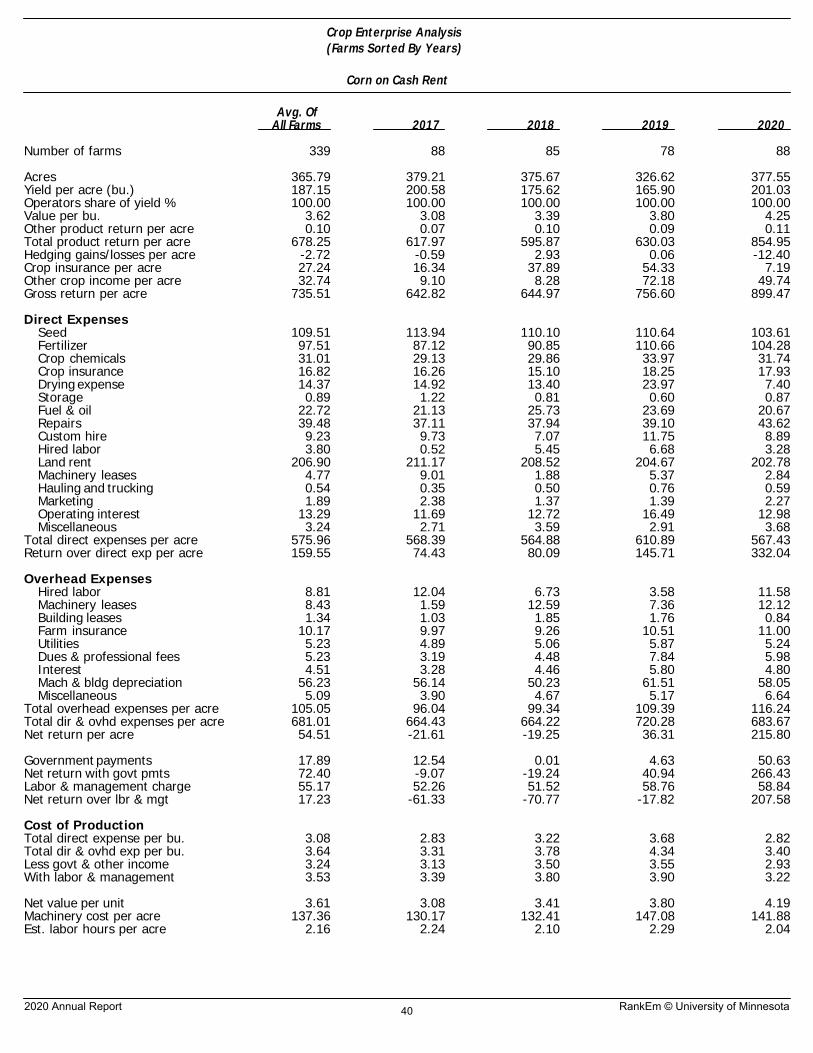
Crop Enterprise Analysis(Farms Sorted By Years)
Corn on Cash Rent
Avg. OfAll Farms 2017 2018 2019 2020
Number of farms 339 88 85 78 88
Acres 365.79 379.21 375.67 326.62 377.55Yield per acre (bu.) 187.15 200.58 175.62 165.90 201.03Operators share of yield % 100.00 100.00 100.00 100.00 100.00Value per bu. 3.62 3.08 3.39 3.80 4.25Other product return per acre 0.10 0.07 0.10 0.09 0.11Total product return per acre 678.25 617.97 595.87 630.03 854.95Hedging gains/losses per acre -2.72 -0.59 2.93 0.06 -12.40Crop insurance per acre 27.24 16.34 37.89 54.33 7.19Other crop income per acre 32.74 9.10 8.28 72.18 49.74Gross return per acre 735.51 642.82 644.97 756.60 899.47
Direct ExpensesSeed 109.51 113.94 110.10 110.64 103.61Fertilizer 97.51 87.12 90.85 110.66 104.28Crop chemicals 31.01 29.13 29.86 33.97 31.74Crop insurance 16.82 16.26 15.10 18.25 17.93Drying expense 14.37 14.92 13.40 23.97 7.40Storage 0.89 1.22 0.81 0.60 0.87Fuel & oil 22.72 21.13 25.73 23.69 20.67Repairs 39.48 37.11 37.94 39.10 43.62Custom hire 9.23 9.73 7.07 11.75 8.89Hired labor 3.80 0.52 5.45 6.68 3.28Land rent 206.90 211.17 208.52 204.67 202.78Machinery leases 4.77 9.01 1.88 5.37 2.84Hauling and trucking 0.54 0.35 0.50 0.76 0.59Marketing 1.89 2.38 1.37 1.39 2.27Operating interest 13.29 11.69 12.72 16.49 12.98Miscellaneous 3.24 2.71 3.59 2.91 3.68
Total direct expenses per acre 575.96 568.39 564.88 610.89 567.43Return over direct exp per acre 159.55 74.43 80.09 145.71 332.04
Overhead ExpensesHired labor 8.81 12.04 6.73 3.58 11.58Machinery leases 8.43 1.59 12.59 7.36 12.12Building leases 1.34 1.03 1.85 1.76 0.84Farm insurance 10.17 9.97 9.26 10.51 11.00Utilities 5.23 4.89 5.06 5.87 5.24Dues & professional fees 5.23 3.19 4.48 7.84 5.98Interest 4.51 3.28 4.46 5.80 4.80Mach & bldg depreciation 56.23 56.14 50.23 61.51 58.05Miscellaneous 5.09 3.90 4.67 5.17 6.64
Total overhead expenses per acre 105.05 96.04 99.34 109.39 116.24Total dir & ovhd expenses per acre 681.01 664.43 664.22 720.28 683.67Net return per acre 54.51 -21.61 -19.25 36.31 215.80
Government payments 17.89 12.54 0.01 4.63 50.63Net return with govt pmts 72.40 -9.07 -19.24 40.94 266.43Labor & management charge 55.17 52.26 51.52 58.76 58.84Net return over lbr & mgt 17.23 -61.33 -70.77 -17.82 207.58
Cost of ProductionTotal direct expense per bu. 3.08 2.83 3.22 3.68 2.82Total dir & ovhd exp per bu. 3.64 3.31 3.78 4.34 3.40Less govt & other income 3.24 3.13 3.50 3.55 2.93With labor & management 3.53 3.39 3.80 3.90 3.22
Net value per unit 3.61 3.08 3.41 3.80 4.19Machinery cost per acre 137.36 130.17 132.41 147.08 141.88Est. labor hours per acre 2.16 2.24 2.10 2.29 2.04
2020 Annual Report RankEm © University of Minnesota40
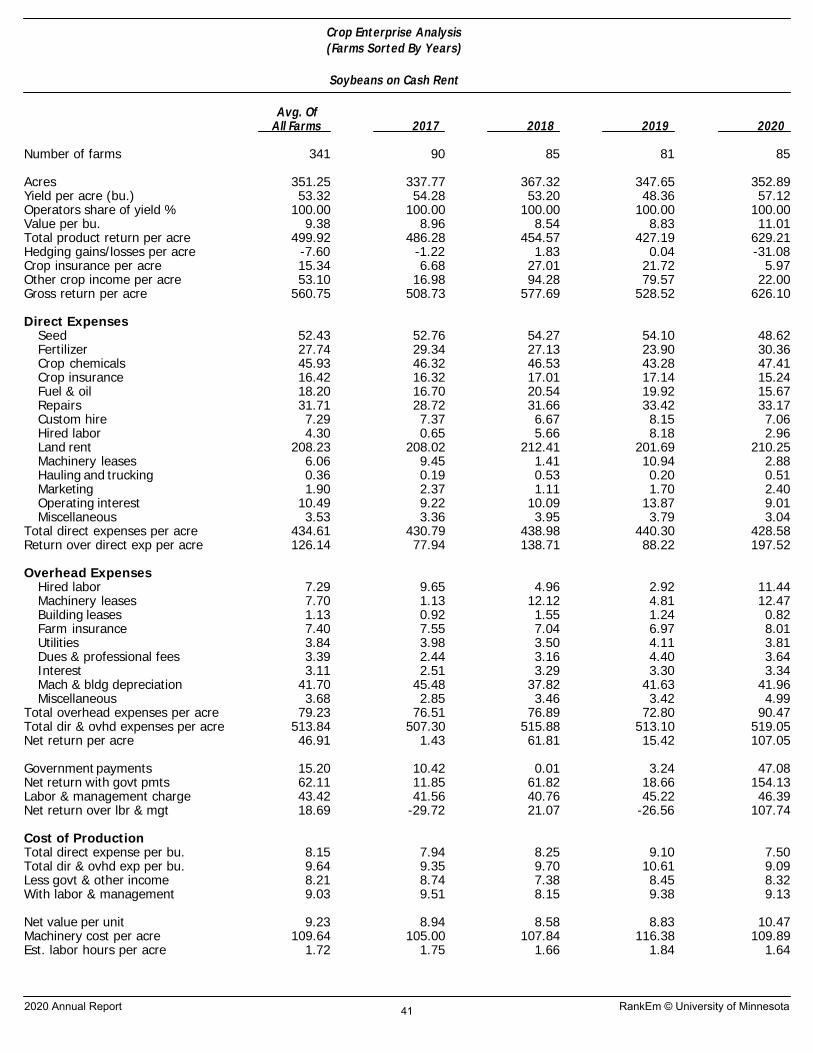
Crop Enterprise Analysis(Farms Sorted By Years)
Soybeans on Cash Rent
Avg. OfAll Farms 2017 2018 2019 2020
Number of farms 341 90 85 81 85
Acres 351.25 337.77 367.32 347.65 352.89Yield per acre (bu.) 53.32 54.28 53.20 48.36 57.12Operators share of yield % 100.00 100.00 100.00 100.00 100.00Value per bu. 9.38 8.96 8.54 8.83 11.01Total product return per acre 499.92 486.28 454.57 427.19 629.21Hedging gains/losses per acre -7.60 -1.22 1.83 0.04 -31.08Crop insurance per acre 15.34 6.68 27.01 21.72 5.97Other crop income per acre 53.10 16.98 94.28 79.57 22.00Gross return per acre 560.75 508.73 577.69 528.52 626.10
Direct ExpensesSeed 52.43 52.76 54.27 54.10 48.62Fertilizer 27.74 29.34 27.13 23.90 30.36Crop chemicals 45.93 46.32 46.53 43.28 47.41Crop insurance 16.42 16.32 17.01 17.14 15.24Fuel & oil 18.20 16.70 20.54 19.92 15.67Repairs 31.71 28.72 31.66 33.42 33.17Custom hire 7.29 7.37 6.67 8.15 7.06Hired labor 4.30 0.65 5.66 8.18 2.96Land rent 208.23 208.02 212.41 201.69 210.25Machinery leases 6.06 9.45 1.41 10.94 2.88Hauling and trucking 0.36 0.19 0.53 0.20 0.51Marketing 1.90 2.37 1.11 1.70 2.40Operating interest 10.49 9.22 10.09 13.87 9.01Miscellaneous 3.53 3.36 3.95 3.79 3.04
Total direct expenses per acre 434.61 430.79 438.98 440.30 428.58Return over direct exp per acre 126.14 77.94 138.71 88.22 197.52
Overhead ExpensesHired labor 7.29 9.65 4.96 2.92 11.44Machinery leases 7.70 1.13 12.12 4.81 12.47Building leases 1.13 0.92 1.55 1.24 0.82Farm insurance 7.40 7.55 7.04 6.97 8.01Utilities 3.84 3.98 3.50 4.11 3.81Dues & professional fees 3.39 2.44 3.16 4.40 3.64Interest 3.11 2.51 3.29 3.30 3.34Mach & bldg depreciation 41.70 45.48 37.82 41.63 41.96Miscellaneous 3.68 2.85 3.46 3.42 4.99
Total overhead expenses per acre 79.23 76.51 76.89 72.80 90.47Total dir & ovhd expenses per acre 513.84 507.30 515.88 513.10 519.05Net return per acre 46.91 1.43 61.81 15.42 107.05
Government payments 15.20 10.42 0.01 3.24 47.08Net return with govt pmts 62.11 11.85 61.82 18.66 154.13Labor & management charge 43.42 41.56 40.76 45.22 46.39Net return over lbr & mgt 18.69 -29.72 21.07 -26.56 107.74
Cost of ProductionTotal direct expense per bu. 8.15 7.94 8.25 9.10 7.50Total dir & ovhd exp per bu. 9.64 9.35 9.70 10.61 9.09Less govt & other income 8.21 8.74 7.38 8.45 8.32With labor & management 9.03 9.51 8.15 9.38 9.13
Net value per unit 9.23 8.94 8.58 8.83 10.47Machinery cost per acre 109.64 105.00 107.84 116.38 109.89Est. labor hours per acre 1.72 1.75 1.66 1.84 1.64
2020 Annual Report RankEm © University of Minnesota41

42
Livestock Reports
The Livestock Enterprise Analysis tables show the average physical production, gross margin over purchase costs, direct costs, overhead costs, and net returns per unit. The livestock enterprise summaries include data from both Southwest Minnesota Farm Management Association farms and Minnesota State Farm Business Management program farms. This provides a greater numbers farms reporting for each enterprise, providing more accurate benchmark information. Minnesota State FBM programs are distributed across the state and include over 2,240 participating farms. We want to thank the Minnesota State FBM program and participating producers for making this data available to be included in this report. The “Dairy” table, if included, contains the information for only the milking herd (which includes dry cows). “Dairy Replacement Heifers” are those heifers kept for replacement into the milking herd. The “Dairy and Replacement Heifers” table is for the whole herd and includes those farms in the “Dairy” and “Dairy Replacement Heifers” tables; it does not include “Dairy Steers.” Gross Margin is the accrual gross value added by the enterprise. It includes income from sale of offspring and livestock products, cull income, non-cash transfers to other enterprises, and the value of production used in the home or for feed. It also includes the value of inventory change from beginning to the end of the year. The cost of livestock purchased, and the value of animals transferred in are deducted. Lastly, other income sources, like government payment income. Government program payments included in the 2020 analysis, for eligible livestock, include CFAP 1 and 2 payments; Emergency Animal Mortality Management program from NRCS EQIP and MN CARES Act funding for agriculture; DMC and MN DAIRI payments; and EQIP and/or CSP funds received for annual production expenses. Net Return is the amount contributed by the enterprise toward operator labor, management, and equity capital. Any wages and benefits paid to the operator are removed from labor costs (and added to Labor and Management Charge) so that all farms are on equal footing. Net Return Over Labor and Management is the return remaining after deducting an opportunity cost for unpaid labor and management. This is the return to equity capital. Cost of Production shows the average cost per unit sold in each cost category. Total direct and overhead expense per unit is the breakeven price needed to cover cash costs and depreciation. For grow/finish enterprises, this includes the purchase cost or transfer in value of the animal. With other revenue adjustments is the breakeven price adjusted for cull sales, other offspring sales, the cost of replacement stock, and any other miscellaneous income. This assumes that some costs can be covered by these other income sources. With labor and management is the final breakeven price to provide a labor and management return for the operator(s). Other Information contains both economic and technical efficiency measures for each enterprise. Rounding of individual items for the report may have caused minor discrepancies with the calculated totals. If fewer than 5 farms have a certain livestock enterprise, that information is not reported. If there are fewer than 25 farms, the high and low groups are not reported.
43
Note: The following government payments received by livestock producers were not included in the enterprise analysis.
• WHIP+ disaster program – these payments relate to crop losses, not livestock production. • MFP 2.0 3rd tranche payment – this payment, received in February 2020, was accrued
(included) in the 2019 enterprise analysis of impacted livestock. • CFAP 3 (now termed Pandemic Assistance for Producers or PAP) – this payment, yet to be
received at the time of this writing, will be included in the 2021 livestock enterprise analysis of eligible livestock.
• Other government program payments not directly related to livestock production including: amounts of PPP loans forgiven, EIDL Emergency Advance Program, MN Small Business Relief Grants, and general MN CARES Act funding for agriculture.
44
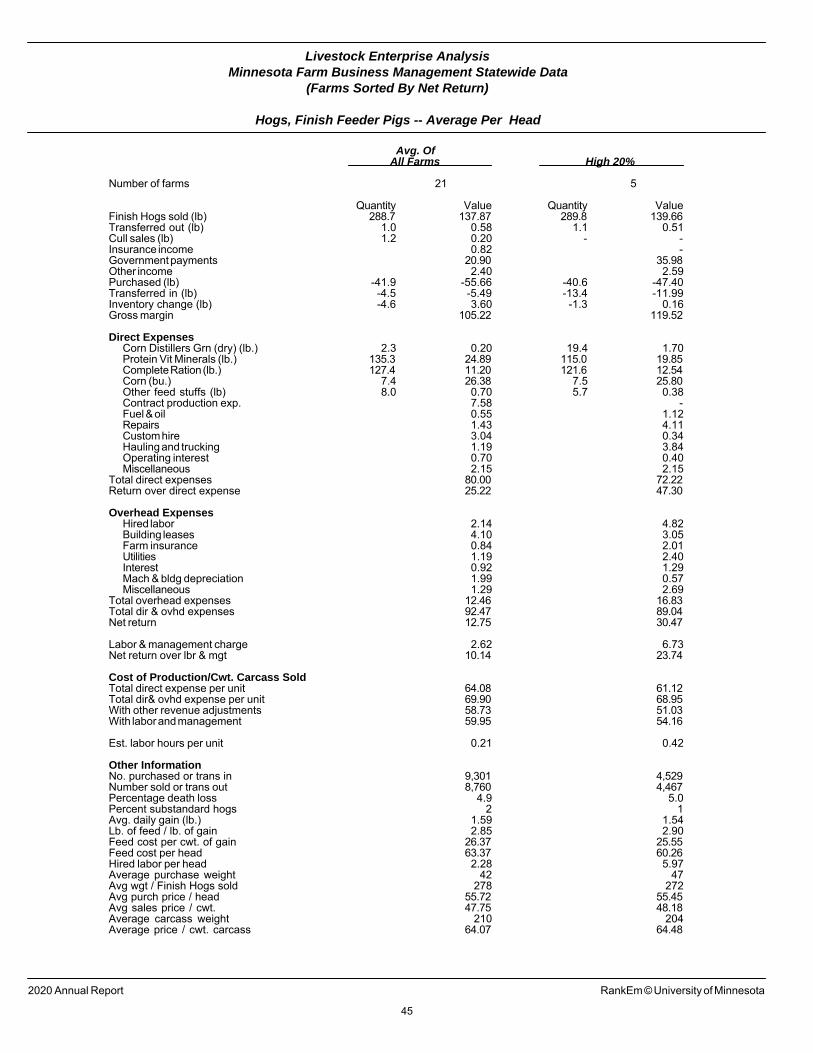
Livestock Enterprise AnalysisMinnesota Farm Business Management Statewide Data
(Farms Sorted By Net Return)
Hogs, Finish Feeder Pigs -- Average Per Head
Avg. OfAll Farms High 20%
Number of farms 21 5
Quantity Value Quantity ValueFinish Hogs sold (lb) 288.7 137.87 289.8 139.66Transferred out (lb) 1.0 0.58 1.1 0.51Cull sales (lb) 1.2 0.20 - -Insurance income 0.82 -Government payments 20.90 35.98Other income 2.40 2.59Purchased (lb) -41.9 -55.66 -40.6 -47.40Transferred in (lb) -4.5 -5.49 -13.4 -11.99Inventory change (lb) -4.6 3.60 -1.3 0.16Gross margin 105.22 119.52
Direct ExpensesCorn Distillers Grn (dry) (lb.) 2.3 0.20 19.4 1.70Protein Vit Minerals (lb.) 135.3 24.89 115.0 19.85Complete Ration (lb.) 127.4 11.20 121.6 12.54Corn (bu.) 7.4 26.38 7.5 25.80Other feed stuffs (lb) 8.0 0.70 5.7 0.38Contract production exp. 7.58 -Fuel & oil 0.55 1.12Repairs 1.43 4.11Custom hire 3.04 0.34Hauling and trucking 1.19 3.84Operating interest 0.70 0.40Miscellaneous 2.15 2.15
Total direct expenses 80.00 72.22Return over direct expense 25.22 47.30
Overhead ExpensesHired labor 2.14 4.82Building leases 4.10 3.05Farm insurance 0.84 2.01Utilities 1.19 2.40Interest 0.92 1.29Mach & bldg depreciation 1.99 0.57Miscellaneous 1.29 2.69
Total overhead expenses 12.46 16.83Total dir & ovhd expenses 92.47 89.04Net return 12.75 30.47
Labor & management charge 2.62 6.73Net return over lbr & mgt 10.14 23.74
Cost of Production/Cwt. Carcass SoldTotal direct expense per unit 64.08 61.12Total dir& ovhd expense per unit 69.90 68.95With other revenue adjustments 58.73 51.03With labor and management 59.95 54.16
Est. labor hours per unit 0.21 0.42
Other InformationNo. purchased or trans in 9,301 4,529Number sold or trans out 8,760 4,467Percentage death loss 4.9 5.0Percent substandard hogs 2 1Avg. daily gain (lb.) 1.59 1.54Lb. of feed / lb. of gain 2.85 2.90Feed cost per cwt. of gain 26.37 25.55Feed cost per head 63.37 60.26Hired labor per head 2.28 5.97Average purchase weight 42 47Avg wgt / Finish Hogs sold 278 272Avg purch price / head 55.72 55.45Avg sales price / cwt. 47.75 48.18Average carcass weight 210 204Average price / cwt. carcass 64.07 64.48
2020 Annual Report RankEm © University of Minnesota
45

Livestock Enterprise AnalysisMinnesota Farm Business Management Statewide Data
(Farms Sorted By Net Return)
Hogs, Finish Feeder Pigs -- Average Per Cwt. Carcass Sold
Avg. OfAll Farms High 20%
Number of farms 21 5
Quantity Value Quantity ValueFinish Hogs sold (lb) 134.91 64.42 134.83 64.97Transferred out (lb) 0.46 0.27 0.50 0.24Cull sales (lb) 0.55 0.10 - -Insurance income 0.38 -Government payments 9.77 16.74Other income 1.12 1.21Purchased (lb) -19.57 -26.01 -18.87 -22.05Transferred in (lb) -2.12 -2.57 -6.24 -5.58Inventory change (lb) -2.14 1.68 -0.58 0.08Gross margin 49.16 55.60
Direct ExpensesCorn Distillers Grn (dry) (lb.) 1.07 0.09 9.01 0.79Protein Vit Minerals (lb.) 63.21 11.63 53.49 9.23Complete Ration (lb.) 59.52 5.23 56.55 5.83Corn (bu.) 3.44 12.32 3.50 12.00Other feed stuffs (lb) 3.75 0.33 2.66 0.18Contract production exp. 3.54 -Fuel & oil 0.26 0.52Repairs 0.67 1.91Custom hire 1.42 0.16Hauling and trucking 0.55 1.79Operating interest 0.33 0.18Miscellaneous 1.00 1.00
Total direct expenses 37.38 33.60Return over direct expense 11.78 22.00
Overhead ExpensesHired labor 1.00 2.24Building leases 1.92 1.42Farm insurance 0.39 0.94Utilities 0.56 1.12Interest 0.43 0.60Mach & bldg depreciation 0.93 0.27Miscellaneous 0.60 1.25
Total overhead expenses 5.82 7.83Total dir & ovhd expenses 43.20 41.42Net return 5.96 14.18
Labor & management charge 1.22 3.13Net return over lbr & mgt 4.74 11.04
Cost of Production/Cwt. Carcass SoldTotal direct expense per unit 64.08 61.12Total dir& ovhd expense per unit 69.90 68.95With other revenue adjustments 58.73 51.03With labor and management 59.95 54.16
Est. labor hours per unit 0.10 0.19
Other InformationNo. purchased or trans in 9,301 4,529Number sold or trans out 8,760 4,467Percentage death loss 4.9 5.0Percent substandard hogs 2 1Avg. daily gain (lb.) 1.59 1.54Lb. of feed / lb. of gain 2.85 2.90Feed cost per cwt. of gain 26.37 25.55Feed cost per head 63.37 60.26Hired labor per head 2.28 5.97Average purchase weight 42 47Avg wgt / Finish Hogs sold 278 272Avg purch price / head 55.72 55.45Avg sales price / cwt. 47.75 48.18Average carcass weight 210 204Average price / cwt. carcass 64.07 64.48
2020 Annual Report RankEm © University of Minnesota
46

Livestock Enterprise AnalysisMinnesota Farm Business Management Statewide Data
(Farms Sorted By Net Return)
Hogs, Weaning to Finish -- Average Per Head
Avg. OfAll Farms
Number of farms 20
Quantity ValueWean-Fin Pig sold (lb) 273.2 130.88Transferred out (lb) 0.0 0.00Cull sales (lb) 1.4 0.16Insurance income 0.23Government payments 19.56Other income 5.01Purchased (lb) -14.6 -40.04Transferred in (lb) -0.4 -1.22Inventory change (lb) 7.6 4.31Gross margin 118.89
Direct ExpensesProtein Vit Minerals (lb.) 121.8 23.93Complete Ration (lb.) 47.9 5.59Corn (bu.) 8.0 27.88DDGS, dry (lb.) 80.7 5.93Other feed stuffs (lb) 1.0 4.89Veterinary 3.43Contract production exp. 11.86Repairs 1.45Custom hire 2.00Hired labor 1.46Hauling and trucking 1.47Operating interest 1.41Miscellaneous 2.09
Total direct expenses 93.40Return over direct expense 25.49
Overhead ExpensesHired labor 0.95Building leases 2.82Farm insurance 0.77Mach & bldg depreciation 2.45Miscellaneous 2.05
Total overhead expenses 9.04Total dir & ovhd expenses 102.43Net return 16.45
Labor & management charge 2.77Net return over lbr & mgt 13.68
Cost of Production/Cwt. Carcass SoldTotal direct expense per unit 64.69Total dir& ovhd expense per unit 69.18With other revenue adjustments 56.86With labor and management 58.24
Est. labor hours per unit 0.21
Other InformationNo. purchased or trans in 25,402Number sold or trans out 23,634Percentage death loss 4.4Percent substandard hogs 2Avg. daily gain (lb.) 1.55Lb. of feed / lb. of gain 2.74Feed cost per cwt. of gain 25.53Feed cost per head 68.22Hired labor per head 2.40Average purchase weight 14Avg wgt / Wean-Fin Pig sold 278Avg purch price / head 39.13Avg sales price / cwt. 47.90Average carcass weight 209Average price / cwt. carcass 64.68
2020 Annual Report RankEm © University of Minnesota
47
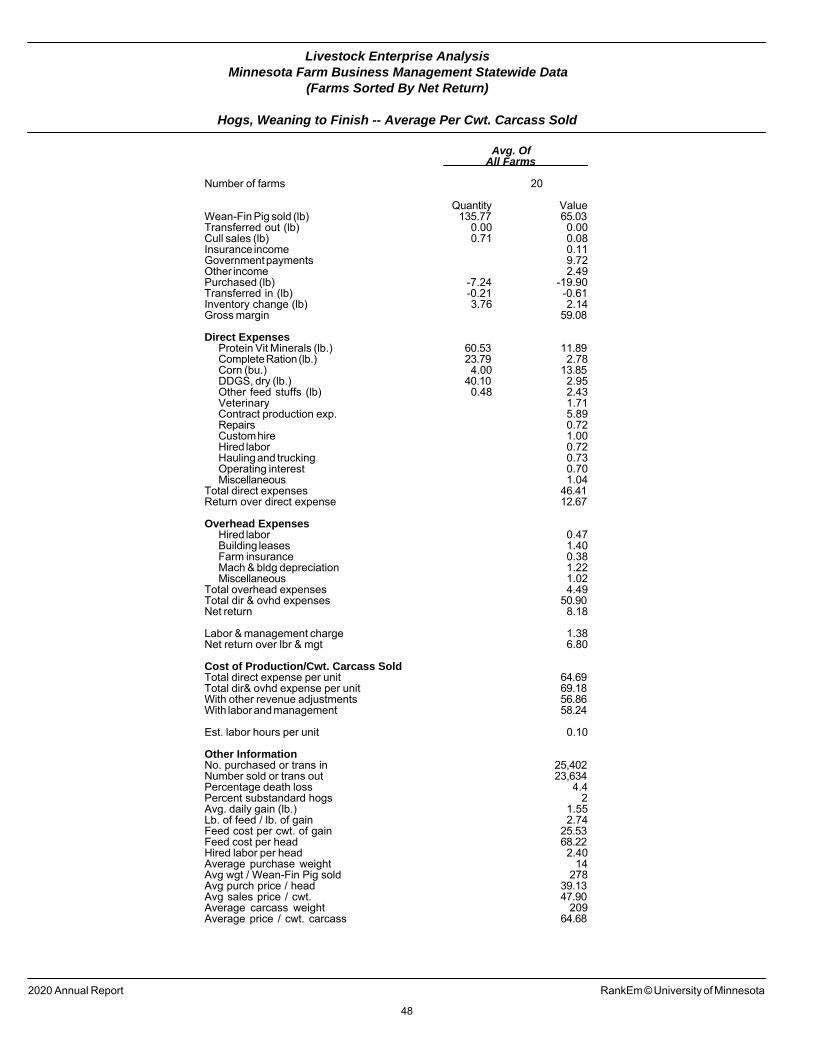
Livestock Enterprise AnalysisMinnesota Farm Business Management Statewide Data
(Farms Sorted By Net Return)
Hogs, Weaning to Finish -- Average Per Cwt. Carcass Sold
Avg. OfAll Farms
Number of farms 20
Quantity ValueWean-Fin Pig sold (lb) 135.77 65.03Transferred out (lb) 0.00 0.00Cull sales (lb) 0.71 0.08Insurance income 0.11Government payments 9.72Other income 2.49Purchased (lb) -7.24 -19.90Transferred in (lb) -0.21 -0.61Inventory change (lb) 3.76 2.14Gross margin 59.08
Direct ExpensesProtein Vit Minerals (lb.) 60.53 11.89Complete Ration (lb.) 23.79 2.78Corn (bu.) 4.00 13.85DDGS, dry (lb.) 40.10 2.95Other feed stuffs (lb) 0.48 2.43Veterinary 1.71Contract production exp. 5.89Repairs 0.72Custom hire 1.00Hired labor 0.72Hauling and trucking 0.73Operating interest 0.70Miscellaneous 1.04
Total direct expenses 46.41Return over direct expense 12.67
Overhead ExpensesHired labor 0.47Building leases 1.40Farm insurance 0.38Mach & bldg depreciation 1.22Miscellaneous 1.02
Total overhead expenses 4.49Total dir & ovhd expenses 50.90Net return 8.18
Labor & management charge 1.38Net return over lbr & mgt 6.80
Cost of Production/Cwt. Carcass SoldTotal direct expense per unit 64.69Total dir& ovhd expense per unit 69.18With other revenue adjustments 56.86With labor and management 58.24
Est. labor hours per unit 0.10
Other InformationNo. purchased or trans in 25,402Number sold or trans out 23,634Percentage death loss 4.4Percent substandard hogs 2Avg. daily gain (lb.) 1.55Lb. of feed / lb. of gain 2.74Feed cost per cwt. of gain 25.53Feed cost per head 68.22Hired labor per head 2.40Average purchase weight 14Avg wgt / Wean-Fin Pig sold 278Avg purch price / head 39.13Avg sales price / cwt. 47.90Average carcass weight 209Average price / cwt. carcass 64.68
2020 Annual Report RankEm © University of Minnesota
48
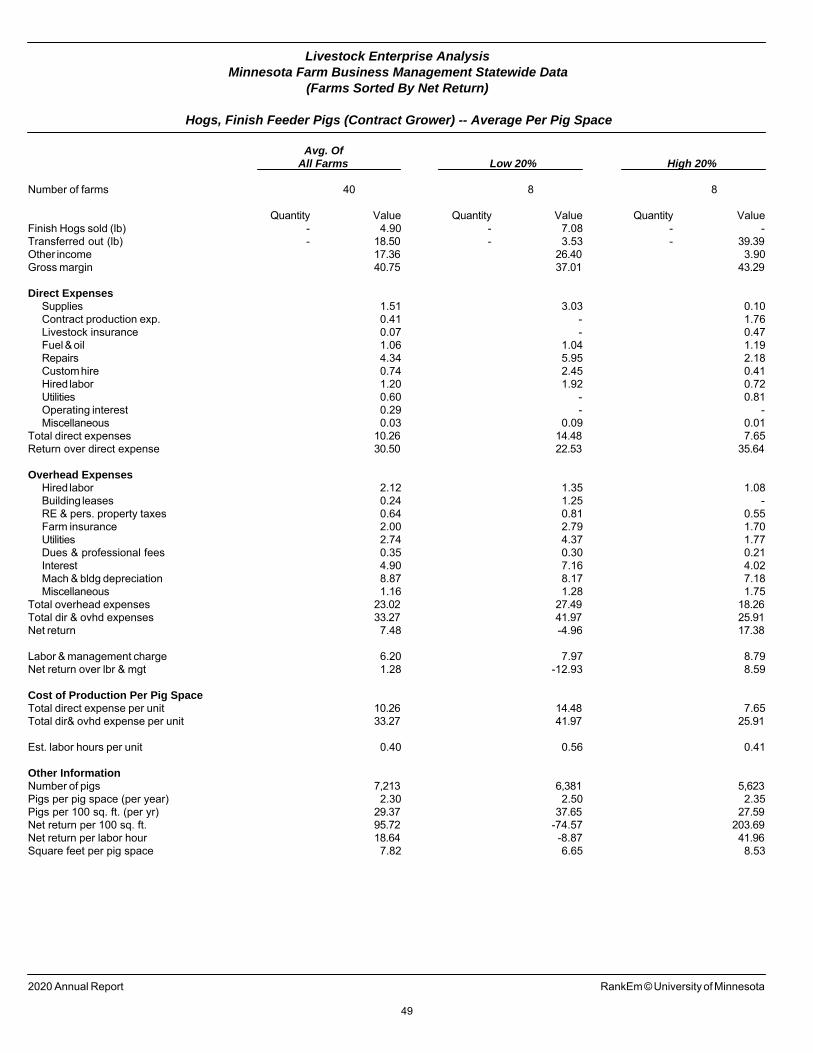
Livestock Enterprise AnalysisMinnesota Farm Business Management Statewide Data
(Farms Sorted By Net Return)
Hogs, Finish Feeder Pigs (Contract Grower) -- Average Per Pig Space
Avg. OfAll Farms Low 20% High 20%
Number of farms 40 8 8
Quantity Value Quantity Value Quantity ValueFinish Hogs sold (lb) - 4.90 - 7.08 - -Transferred out (lb) - 18.50 - 3.53 - 39.39Other income 17.36 26.40 3.90Gross margin 40.75 37.01 43.29
Direct ExpensesSupplies 1.51 3.03 0.10Contract production exp. 0.41 - 1.76Livestock insurance 0.07 - 0.47Fuel & oil 1.06 1.04 1.19Repairs 4.34 5.95 2.18Custom hire 0.74 2.45 0.41Hired labor 1.20 1.92 0.72Utilities 0.60 - 0.81Operating interest 0.29 - -Miscellaneous 0.03 0.09 0.01
Total direct expenses 10.26 14.48 7.65Return over direct expense 30.50 22.53 35.64
Overhead ExpensesHired labor 2.12 1.35 1.08Building leases 0.24 1.25 -RE & pers. property taxes 0.64 0.81 0.55Farm insurance 2.00 2.79 1.70Utilities 2.74 4.37 1.77Dues & professional fees 0.35 0.30 0.21Interest 4.90 7.16 4.02Mach & bldg depreciation 8.87 8.17 7.18Miscellaneous 1.16 1.28 1.75
Total overhead expenses 23.02 27.49 18.26Total dir & ovhd expenses 33.27 41.97 25.91Net return 7.48 -4.96 17.38
Labor & management charge 6.20 7.97 8.79Net return over lbr & mgt 1.28 -12.93 8.59
Cost of Production Per Pig SpaceTotal direct expense per unit 10.26 14.48 7.65Total dir& ovhd expense per unit 33.27 41.97 25.91
Est. labor hours per unit 0.40 0.56 0.41
Other InformationNumber of pigs 7,213 6,381 5,623Pigs per pig space (per year) 2.30 2.50 2.35Pigs per 100 sq. ft. (per yr) 29.37 37.65 27.59Net return per 100 sq. ft. 95.72 -74.57 203.69Net return per labor hour 18.64 -8.87 41.96Square feet per pig space 7.82 6.65 8.53
2020 Annual Report RankEm © University of Minnesota
49

Livestock Enterprise AnalysisMinnesota Farm Business Management Statewide Data
(Farms Sorted By Net Return)
Hogs, Weaning to Finish (Contract Grower) -- Average Per Pig Space
Avg. OfAll Farms Low 20% High 20%
Number of farms 63 12 13
Quantity Value Quantity Value Quantity ValueWean-Fin Pig sold (lb) - 6.37 - 15.60 - 3.74Transferred out (lb) - 11.93 - 2.96 - 30.14Other income 22.76 20.25 13.06Gross margin 41.06 38.82 46.94
Direct ExpensesSupplies 1.10 1.94 0.33Contract production exp. 1.38 0.69 -Fuel & oil 1.57 1.45 2.37Repairs 4.28 6.14 3.31Custom hire 0.84 2.24 0.91Hired labor 1.85 2.78 2.70Utilities 0.87 0.98 0.69Operating interest 0.44 0.88 0.14Miscellaneous 0.22 0.17 0.16
Total direct expenses 12.53 17.27 10.61Return over direct expense 28.53 21.55 36.33
Overhead ExpensesHired labor 0.85 1.91 0.60Machinery leases 0.06 0.30 -Building leases 1.08 2.13 -RE & pers. property taxes 0.79 0.92 0.45Farm insurance 2.03 1.90 2.32Utilities 1.93 2.64 1.77Dues & professional fees 0.68 0.82 0.34Interest 5.04 6.77 3.82Mach & bldg depreciation 8.59 11.14 7.27Miscellaneous 0.76 0.82 0.82
Total overhead expenses 21.80 29.36 17.37Total dir & ovhd expenses 34.34 46.63 27.98Net return 6.73 -7.81 18.96
Labor & management charge 6.17 7.71 6.72Net return over lbr & mgt 0.56 -15.52 12.24
Cost of Production Per Pig SpaceTotal direct expense per unit 12.53 17.27 10.61Total dir& ovhd expense per unit 34.34 46.63 27.98
Est. labor hours per unit 0.35 0.38 0.35
Other InformationNumber of pigs 7,817 7,921 7,840Pigs per pig space (per year) 2.28 2.25 2.21Pigs per 100 sq. ft. (per yr) 29.38 27.43 26.48Net return per 100 sq. ft. 86.68 -95.12 226.76Net return per labor hour 19.22 -20.35 53.45Square feet per pig space 7.76 8.21 8.36
2020 Annual Report RankEm © University of Minnesota
50
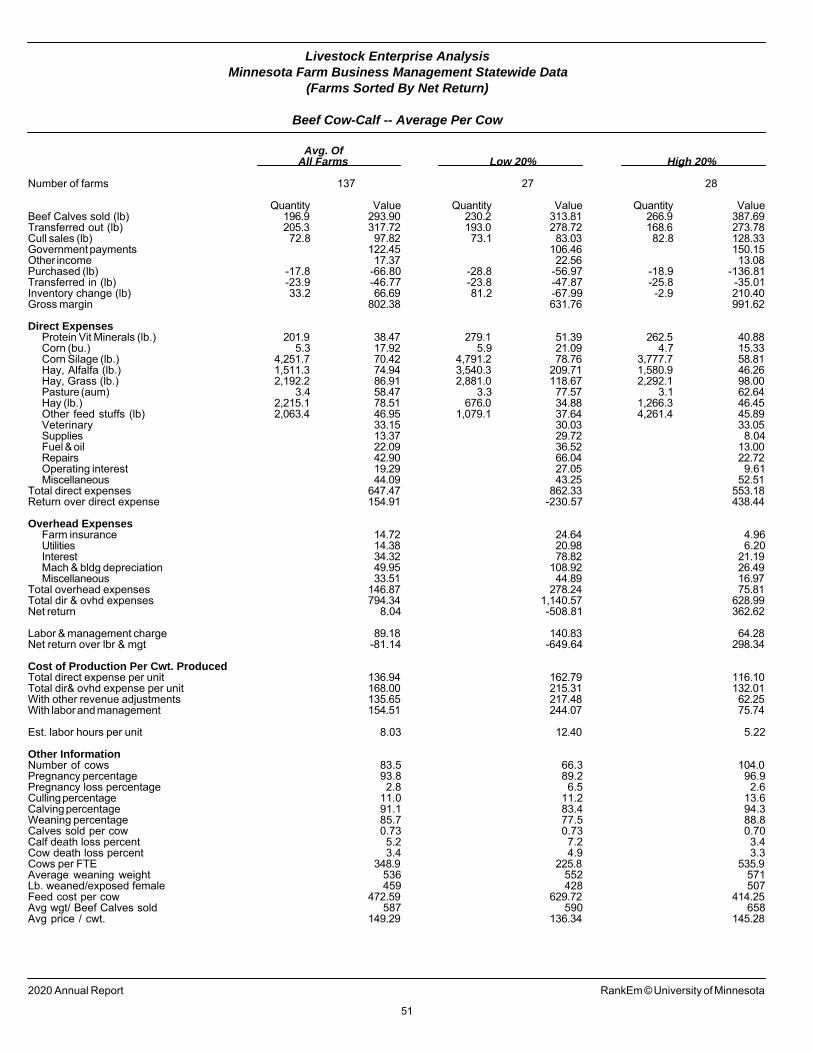
Livestock Enterprise AnalysisMinnesota Farm Business Management Statewide Data
(Farms Sorted By Net Return)
Beef Cow-Calf -- Average Per Cow
Avg. OfAll Farms Low 20% High 20%
Number of farms 137 27 28
Quantity Value Quantity Value Quantity ValueBeef Calves sold (lb) 196.9 293.90 230.2 313.81 266.9 387.69Transferred out (lb) 205.3 317.72 193.0 278.72 168.6 273.78Cull sales (lb) 72.8 97.82 73.1 83.03 82.8 128.33Government payments 122.45 106.46 150.15Other income 17.37 22.56 13.08Purchased (lb) -17.8 -66.80 -28.8 -56.97 -18.9 -136.81Transferred in (lb) -23.9 -46.77 -23.8 -47.87 -25.8 -35.01Inventory change (lb) 33.2 66.69 81.2 -67.99 -2.9 210.40Gross margin 802.38 631.76 991.62
Direct ExpensesProtein Vit Minerals (lb.) 201.9 38.47 279.1 51.39 262.5 40.88Corn (bu.) 5.3 17.92 5.9 21.09 4.7 15.33Corn Silage (lb.) 4,251.7 70.42 4,791.2 78.76 3,777.7 58.81Hay, Alfalfa (lb.) 1,511.3 74.94 3,540.3 209.71 1,580.9 46.26Hay, Grass (lb.) 2,192.2 86.91 2,881.0 118.67 2,292.1 98.00Pasture (aum) 3.4 58.47 3.3 77.57 3.1 62.64Hay (lb.) 2,215.1 78.51 676.0 34.88 1,266.3 46.45Other feed stuffs (lb) 2,063.4 46.95 1,079.1 37.64 4,261.4 45.89Veterinary 33.15 30.03 33.05Supplies 13.37 29.72 8.04Fuel & oil 22.09 36.52 13.00Repairs 42.90 66.04 22.72Operating interest 19.29 27.05 9.61Miscellaneous 44.09 43.25 52.51
Total direct expenses 647.47 862.33 553.18Return over direct expense 154.91 -230.57 438.44
Overhead ExpensesFarm insurance 14.72 24.64 4.96Utilities 14.38 20.98 6.20Interest 34.32 78.82 21.19Mach & bldg depreciation 49.95 108.92 26.49Miscellaneous 33.51 44.89 16.97
Total overhead expenses 146.87 278.24 75.81Total dir & ovhd expenses 794.34 1,140.57 628.99Net return 8.04 -508.81 362.62
Labor & management charge 89.18 140.83 64.28Net return over lbr & mgt -81.14 -649.64 298.34
Cost of Production Per Cwt. ProducedTotal direct expense per unit 136.94 162.79 116.10Total dir& ovhd expense per unit 168.00 215.31 132.01With other revenue adjustments 135.65 217.48 62.25With labor and management 154.51 244.07 75.74
Est. labor hours per unit 8.03 12.40 5.22
Other InformationNumber of cows 83.5 66.3 104.0Pregnancy percentage 93.8 89.2 96.9Pregnancy loss percentage 2.8 6.5 2.6Culling percentage 11.0 11.2 13.6Calving percentage 91.1 83.4 94.3Weaning percentage 85.7 77.5 88.8Calves sold per cow 0.73 0.73 0.70Calf death loss percent 5.2 7.2 3.4Cow death loss percent 3.4 4.9 3.3Cows per FTE 348.9 225.8 535.9Average weaning weight 536 552 571Lb. weaned/exposed female 459 428 507Feed cost per cow 472.59 629.72 414.25Avg wgt/ Beef Calves sold 587 590 658Avg price / cwt. 149.29 136.34 145.28
2020 Annual Report RankEm © University of Minnesota
51

Livestock Enterprise AnalysisMinnesota Farm Business Management Statewide Data
(Farms Sorted By Net Return)
Beef Cow-Calf -- Average Per Cwt. Produced
Avg. OfAll Farms Low 20% High 20%
Number of farms 137 27 28
Quantity Value Quantity Value Quantity ValueBeef Calves sold (lb) 41.64 62.16 43.45 59.24 56.01 81.37Transferred out (lb) 43.42 67.20 36.44 52.62 35.38 57.46Cull sales (lb) 15.39 20.69 13.80 15.67 17.38 26.93Government payments 25.90 20.10 31.51Other income 3.67 4.26 2.74Purchased (lb) -3.76 -14.13 -5.43 -10.75 -3.97 -28.71Transferred in (lb) -5.05 -9.89 -4.49 -9.04 -5.42 -7.35Inventory change (lb) 7.03 14.11 15.32 -12.84 -0.60 44.16Gross margin 169.70 119.26 208.12
Direct ExpensesProtein Vit Minerals (lb.) 42.70 8.14 52.68 9.70 55.10 8.58Corn (bu.) 1.12 3.79 1.12 3.98 0.99 3.22Corn Silage (lb.) 899.24 14.89 904.47 14.87 792.88 12.34Hay, Alfalfa (lb.) 319.63 15.85 668.33 39.59 331.80 9.71Hay, Grass (lb.) 463.65 18.38 543.87 22.40 481.07 20.57Pasture (aum) 0.72 12.37 0.62 14.64 0.65 13.15Hay (lb.) 468.50 16.61 127.61 6.58 265.77 9.75Other feed stuffs (lb) 436.41 9.93 203.71 7.11 894.38 9.63Veterinary 7.01 5.67 6.94Supplies 2.83 5.61 1.69Fuel & oil 4.67 6.89 2.73Repairs 9.07 12.47 4.77Operating interest 4.08 5.11 2.02Miscellaneous 9.33 8.16 11.02
Total direct expenses 136.94 162.79 116.10Return over direct expense 32.76 -43.53 92.02
Overhead ExpensesFarm insurance 3.11 4.65 1.04Utilities 3.04 3.96 1.30Interest 7.26 14.88 4.45Mach & bldg depreciation 10.56 20.56 5.56Miscellaneous 7.09 8.47 3.56
Total overhead expenses 31.06 52.53 15.91Total dir & ovhd expenses 168.00 215.31 132.01Net return 1.70 -96.05 76.11
Labor & management charge 18.86 26.59 13.49Net return over lbr & mgt -17.16 -122.64 62.62
Cost of Production Per Cwt. ProducedTotal direct expense per unit 136.94 162.79 116.10Total dir& ovhd expense per unit 168.00 215.31 132.01With other revenue adjustments 135.65 217.48 62.25With labor and management 154.51 244.07 75.74
Est. labor hours per unit 1.70 2.34 1.10
Other InformationNumber of cows 83.5 66.3 104.0Pregnancy percentage 93.8 89.2 96.9Pregnancy loss percentage 2.8 6.5 2.6Culling percentage 11.0 11.2 13.6Calving percentage 91.1 83.4 94.3Weaning percentage 85.7 77.5 88.8Calves sold per cow 0.73 0.73 0.70Calf death loss percent 5.2 7.2 3.4Cow death loss percent 3.4 4.9 3.3Cows per FTE 348.9 225.8 535.9Average weaning weight 536 552 571Lb. weaned/exposed female 459 428 507Feed cost per cow 472.59 629.72 414.25Avg wgt/ Beef Calves sold 587 590 658Avg price / cwt. 149.29 136.34 145.28
2020 Annual Report RankEm © University of Minnesota
52
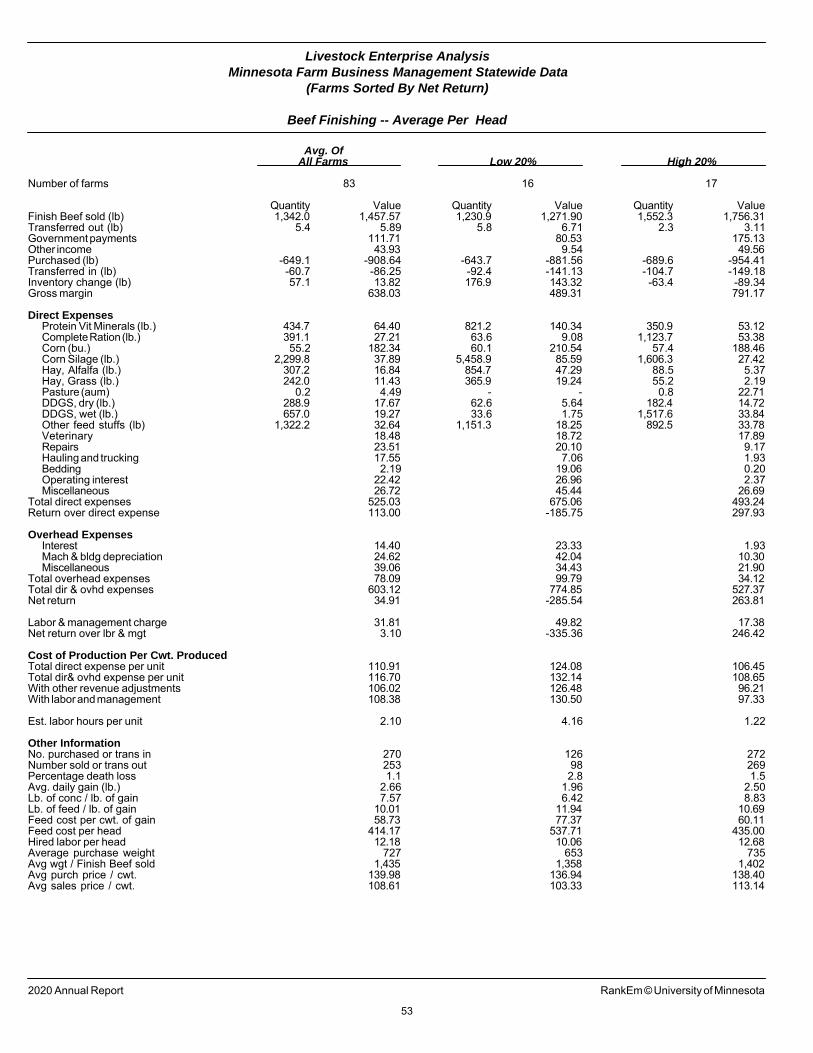
Livestock Enterprise AnalysisMinnesota Farm Business Management Statewide Data
(Farms Sorted By Net Return)
Beef Finishing -- Average Per Head
Avg. OfAll Farms Low 20% High 20%
Number of farms 83 16 17
Quantity Value Quantity Value Quantity ValueFinish Beef sold (lb) 1,342.0 1,457.57 1,230.9 1,271.90 1,552.3 1,756.31Transferred out (lb) 5.4 5.89 5.8 6.71 2.3 3.11Government payments 111.71 80.53 175.13Other income 43.93 9.54 49.56Purchased (lb) -649.1 -908.64 -643.7 -881.56 -689.6 -954.41Transferred in (lb) -60.7 -86.25 -92.4 -141.13 -104.7 -149.18Inventory change (lb) 57.1 13.82 176.9 143.32 -63.4 -89.34Gross margin 638.03 489.31 791.17
Direct ExpensesProtein Vit Minerals (lb.) 434.7 64.40 821.2 140.34 350.9 53.12Complete Ration (lb.) 391.1 27.21 63.6 9.08 1,123.7 53.38Corn (bu.) 55.2 182.34 60.1 210.54 57.4 188.46Corn Silage (lb.) 2,299.8 37.89 5,458.9 85.59 1,606.3 27.42Hay, Alfalfa (lb.) 307.2 16.84 854.7 47.29 88.5 5.37Hay, Grass (lb.) 242.0 11.43 365.9 19.24 55.2 2.19Pasture (aum) 0.2 4.49 - - 0.8 22.71DDGS, dry (lb.) 288.9 17.67 62.6 5.64 182.4 14.72DDGS, wet (lb.) 657.0 19.27 33.6 1.75 1,517.6 33.84Other feed stuffs (lb) 1,322.2 32.64 1,151.3 18.25 892.5 33.78Veterinary 18.48 18.72 17.89Repairs 23.51 20.10 9.17Hauling and trucking 17.55 7.06 1.93Bedding 2.19 19.06 0.20Operating interest 22.42 26.96 2.37Miscellaneous 26.72 45.44 26.69
Total direct expenses 525.03 675.06 493.24Return over direct expense 113.00 -185.75 297.93
Overhead ExpensesInterest 14.40 23.33 1.93Mach & bldg depreciation 24.62 42.04 10.30Miscellaneous 39.06 34.43 21.90
Total overhead expenses 78.09 99.79 34.12Total dir & ovhd expenses 603.12 774.85 527.37Net return 34.91 -285.54 263.81
Labor & management charge 31.81 49.82 17.38Net return over lbr & mgt 3.10 -335.36 246.42
Cost of Production Per Cwt. ProducedTotal direct expense per unit 110.91 124.08 106.45Total dir& ovhd expense per unit 116.70 132.14 108.65With other revenue adjustments 106.02 126.48 96.21With labor and management 108.38 130.50 97.33
Est. labor hours per unit 2.10 4.16 1.22
Other InformationNo. purchased or trans in 270 126 272Number sold or trans out 253 98 269Percentage death loss 1.1 2.8 1.5Avg. daily gain (lb.) 2.66 1.96 2.50Lb. of conc / lb. of gain 7.57 6.42 8.83Lb. of feed / lb. of gain 10.01 11.94 10.69Feed cost per cwt. of gain 58.73 77.37 60.11Feed cost per head 414.17 537.71 435.00Hired labor per head 12.18 10.06 12.68Average purchase weight 727 653 735Avg wgt / Finish Beef sold 1,435 1,358 1,402Avg purch price / cwt. 139.98 136.94 138.40Avg sales price / cwt. 108.61 103.33 113.14
2020 Annual Report RankEm © University of Minnesota
53
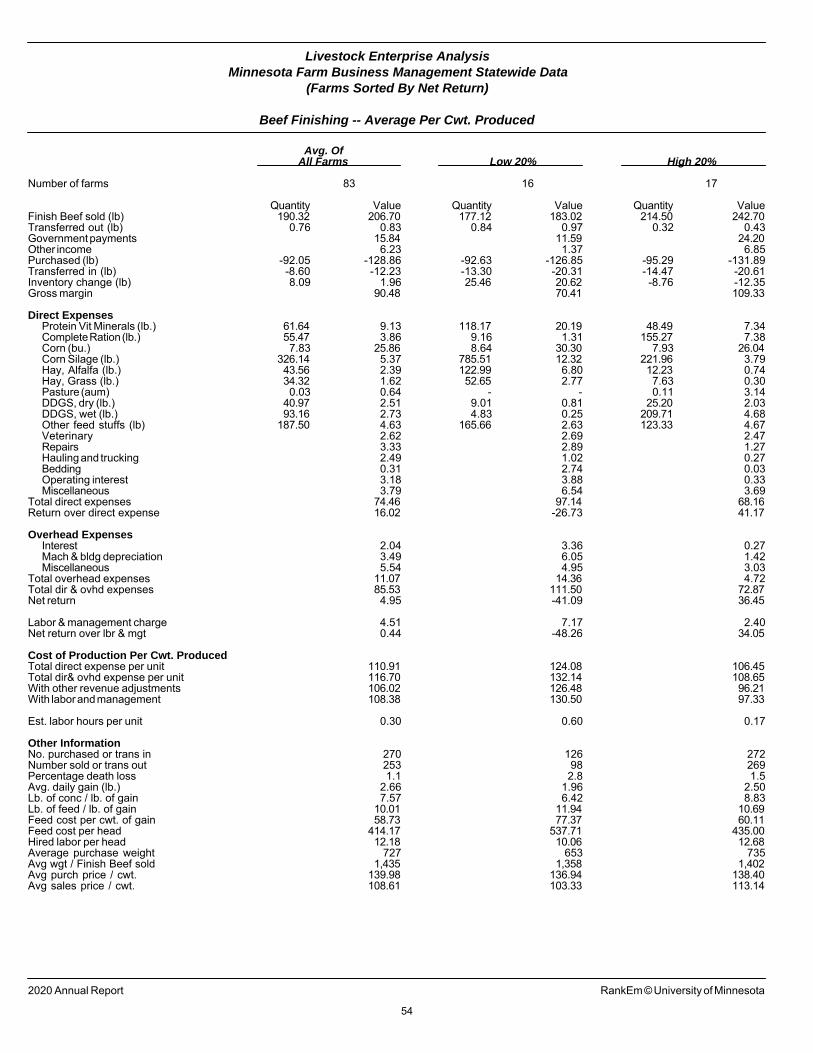
Livestock Enterprise AnalysisMinnesota Farm Business Management Statewide Data
(Farms Sorted By Net Return)
Beef Finishing -- Average Per Cwt. Produced
Avg. OfAll Farms Low 20% High 20%
Number of farms 83 16 17
Quantity Value Quantity Value Quantity ValueFinish Beef sold (lb) 190.32 206.70 177.12 183.02 214.50 242.70Transferred out (lb) 0.76 0.83 0.84 0.97 0.32 0.43Government payments 15.84 11.59 24.20Other income 6.23 1.37 6.85Purchased (lb) -92.05 -128.86 -92.63 -126.85 -95.29 -131.89Transferred in (lb) -8.60 -12.23 -13.30 -20.31 -14.47 -20.61Inventory change (lb) 8.09 1.96 25.46 20.62 -8.76 -12.35Gross margin 90.48 70.41 109.33
Direct ExpensesProtein Vit Minerals (lb.) 61.64 9.13 118.17 20.19 48.49 7.34Complete Ration (lb.) 55.47 3.86 9.16 1.31 155.27 7.38Corn (bu.) 7.83 25.86 8.64 30.30 7.93 26.04Corn Silage (lb.) 326.14 5.37 785.51 12.32 221.96 3.79Hay, Alfalfa (lb.) 43.56 2.39 122.99 6.80 12.23 0.74Hay, Grass (lb.) 34.32 1.62 52.65 2.77 7.63 0.30Pasture (aum) 0.03 0.64 - - 0.11 3.14DDGS, dry (lb.) 40.97 2.51 9.01 0.81 25.20 2.03DDGS, wet (lb.) 93.16 2.73 4.83 0.25 209.71 4.68Other feed stuffs (lb) 187.50 4.63 165.66 2.63 123.33 4.67Veterinary 2.62 2.69 2.47Repairs 3.33 2.89 1.27Hauling and trucking 2.49 1.02 0.27Bedding 0.31 2.74 0.03Operating interest 3.18 3.88 0.33Miscellaneous 3.79 6.54 3.69
Total direct expenses 74.46 97.14 68.16Return over direct expense 16.02 -26.73 41.17
Overhead ExpensesInterest 2.04 3.36 0.27Mach & bldg depreciation 3.49 6.05 1.42Miscellaneous 5.54 4.95 3.03
Total overhead expenses 11.07 14.36 4.72Total dir & ovhd expenses 85.53 111.50 72.87Net return 4.95 -41.09 36.45
Labor & management charge 4.51 7.17 2.40Net return over lbr & mgt 0.44 -48.26 34.05
Cost of Production Per Cwt. ProducedTotal direct expense per unit 110.91 124.08 106.45Total dir& ovhd expense per unit 116.70 132.14 108.65With other revenue adjustments 106.02 126.48 96.21With labor and management 108.38 130.50 97.33
Est. labor hours per unit 0.30 0.60 0.17
Other InformationNo. purchased or trans in 270 126 272Number sold or trans out 253 98 269Percentage death loss 1.1 2.8 1.5Avg. daily gain (lb.) 2.66 1.96 2.50Lb. of conc / lb. of gain 7.57 6.42 8.83Lb. of feed / lb. of gain 10.01 11.94 10.69Feed cost per cwt. of gain 58.73 77.37 60.11Feed cost per head 414.17 537.71 435.00Hired labor per head 12.18 10.06 12.68Average purchase weight 727 653 735Avg wgt / Finish Beef sold 1,435 1,358 1,402Avg purch price / cwt. 139.98 136.94 138.40Avg sales price / cwt. 108.61 103.33 113.14
2020 Annual Report RankEm © University of Minnesota
54
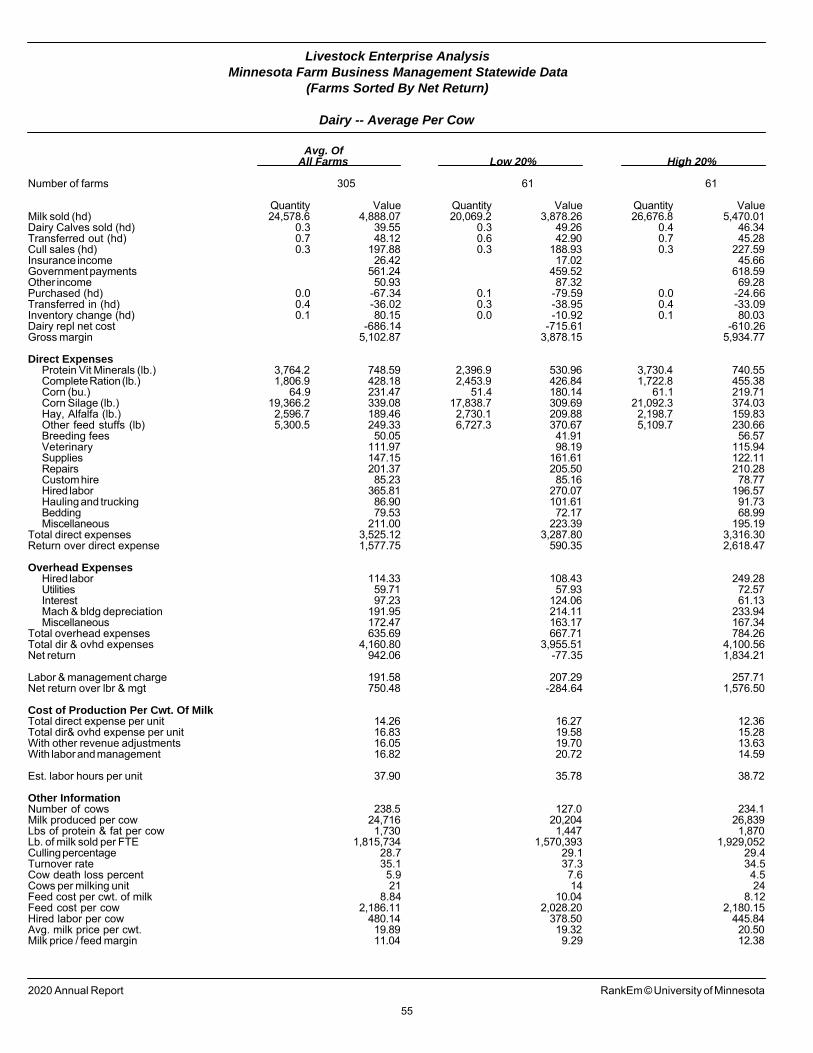
Livestock Enterprise AnalysisMinnesota Farm Business Management Statewide Data
(Farms Sorted By Net Return)
Dairy -- Average Per Cow
Avg. OfAll Farms Low 20% High 20%
Number of farms 305 61 61
Quantity Value Quantity Value Quantity ValueMilk sold (hd) 24,578.6 4,888.07 20,069.2 3,878.26 26,676.8 5,470.01Dairy Calves sold (hd) 0.3 39.55 0.3 49.26 0.4 46.34Transferred out (hd) 0.7 48.12 0.6 42.90 0.7 45.28Cull sales (hd) 0.3 197.88 0.3 188.93 0.3 227.59Insurance income 26.42 17.02 45.66Government payments 561.24 459.52 618.59Other income 50.93 87.32 69.28Purchased (hd) 0.0 -67.34 0.1 -79.59 0.0 -24.66Transferred in (hd) 0.4 -36.02 0.3 -38.95 0.4 -33.09Inventory change (hd) 0.1 80.15 0.0 -10.92 0.1 80.03Dairy repl net cost -686.14 -715.61 -610.26Gross margin 5,102.87 3,878.15 5,934.77
Direct ExpensesProtein Vit Minerals (lb.) 3,764.2 748.59 2,396.9 530.96 3,730.4 740.55Complete Ration (lb.) 1,806.9 428.18 2,453.9 426.84 1,722.8 455.38Corn (bu.) 64.9 231.47 51.4 180.14 61.1 219.71Corn Silage (lb.) 19,366.2 339.08 17,838.7 309.69 21,092.3 374.03Hay, Alfalfa (lb.) 2,596.7 189.46 2,730.1 209.88 2,198.7 159.83Other feed stuffs (lb) 5,300.5 249.33 6,727.3 370.67 5,109.7 230.66Breeding fees 50.05 41.91 56.57Veterinary 111.97 98.19 115.94Supplies 147.15 161.61 122.11Repairs 201.37 205.50 210.28Custom hire 85.23 85.16 78.77Hired labor 365.81 270.07 196.57Hauling and trucking 86.90 101.61 91.73Bedding 79.53 72.17 68.99Miscellaneous 211.00 223.39 195.19
Total direct expenses 3,525.12 3,287.80 3,316.30Return over direct expense 1,577.75 590.35 2,618.47
Overhead ExpensesHired labor 114.33 108.43 249.28Utilities 59.71 57.93 72.57Interest 97.23 124.06 61.13Mach & bldg depreciation 191.95 214.11 233.94Miscellaneous 172.47 163.17 167.34
Total overhead expenses 635.69 667.71 784.26Total dir & ovhd expenses 4,160.80 3,955.51 4,100.56Net return 942.06 -77.35 1,834.21
Labor & management charge 191.58 207.29 257.71Net return over lbr & mgt 750.48 -284.64 1,576.50
Cost of Production Per Cwt. Of MilkTotal direct expense per unit 14.26 16.27 12.36Total dir& ovhd expense per unit 16.83 19.58 15.28With other revenue adjustments 16.05 19.70 13.63With labor and management 16.82 20.72 14.59
Est. labor hours per unit 37.90 35.78 38.72
Other InformationNumber of cows 238.5 127.0 234.1Milk produced per cow 24,716 20,204 26,839Lbs of protein & fat per cow 1,730 1,447 1,870Lb. of milk sold per FTE 1,815,734 1,570,393 1,929,052Culling percentage 28.7 29.1 29.4Turnover rate 35.1 37.3 34.5Cow death loss percent 5.9 7.6 4.5Cows per milking unit 21 14 24Feed cost per cwt. of milk 8.84 10.04 8.12Feed cost per cow 2,186.11 2,028.20 2,180.15Hired labor per cow 480.14 378.50 445.84Avg. milk price per cwt. 19.89 19.32 20.50Milk price / feed margin 11.04 9.29 12.38
2020 Annual Report RankEm © University of Minnesota
55

Livestock Enterprise AnalysisMinnesota Farm Business Management Statewide Data
(Farms Sorted By Net Return)
Dairy -- Average Per Cwt. Of Milk
Avg. OfAll Farms Low 20% High 20%
Number of farms 305 61 61
Quantity Value Quantity Value Quantity ValueMilk sold (hd) 99.44 19.78 99.33 19.20 99.40 20.38Dairy Calves sold (hd) 0.00 0.16 0.00 0.24 0.00 0.17Transferred out (hd) 0.00 0.19 0.00 0.21 0.00 0.17Cull sales (hd) 0.00 0.80 0.00 0.94 0.00 0.85Insurance income 0.11 0.08 0.17Government payments 2.27 2.27 2.30Other income 0.21 0.43 0.26Purchased (hd) 0.00 -0.27 0.00 -0.39 0.00 -0.09Transferred in (hd) 0.00 -0.15 0.00 -0.19 0.00 -0.12Inventory change (hd) 0.00 0.32 0.00 -0.05 0.00 0.30Dairy repl net cost -2.78 -3.54 -2.27Gross margin 20.65 19.20 22.11
Direct ExpensesProtein Vit Minerals (lb.) 15.23 3.03 11.86 2.63 13.90 2.76Complete Ration (lb.) 7.31 1.73 12.15 2.11 6.42 1.70Corn (bu.) 0.26 0.94 0.25 0.89 0.23 0.82Corn Silage (lb.) 78.35 1.37 88.29 1.53 78.59 1.39Hay, Alfalfa (lb.) 10.51 0.77 13.51 1.04 8.19 0.60Other feed stuffs (lb) 21.45 1.01 33.30 1.83 19.04 0.86Breeding fees 0.20 0.21 0.21Veterinary 0.45 0.49 0.43Supplies 0.60 0.80 0.45Fuel & oil 0.27 0.33 0.25Repairs 0.81 1.02 0.78Custom hire 0.34 0.42 0.29Hired labor 1.48 1.34 0.73Hauling and trucking 0.35 0.50 0.34Bedding 0.32 0.36 0.26Miscellaneous 0.58 0.78 0.48
Total direct expenses 14.26 16.27 12.36Return over direct expense 6.38 2.92 9.76
Overhead ExpensesHired labor 0.46 0.54 0.93Interest 0.39 0.61 0.23Mach & bldg depreciation 0.78 1.06 0.87Miscellaneous 0.94 1.09 0.89
Total overhead expenses 2.57 3.30 2.92Total dir & ovhd expenses 16.83 19.58 15.28Net return 3.81 -0.38 6.83
Labor & management charge 0.78 1.03 0.96Net return over lbr & mgt 3.04 -1.41 5.87
Cost of Production Per Cwt. Of MilkTotal direct expense per unit 14.26 16.27 12.36Total dir& ovhd expense per unit 16.83 19.58 15.28With other revenue adjustments 16.05 19.70 13.63With labor and management 16.82 20.72 14.59
Est. labor hours per unit 0.15 0.18 0.14
Other InformationNumber of cows 238.5 127.0 234.1Milk produced per cow 24,716 20,204 26,839Lbs of protein & fat per cow 1,730 1,447 1,870Lb. of milk sold per FTE 1,815,734 1,570,393 1,929,052Culling percentage 28.7 29.1 29.4Turnover rate 35.1 37.3 34.5Cow death loss percent 5.9 7.6 4.5Cows per milking unit 21 14 24Feed cost per cwt. of milk 8.84 10.04 8.12Feed cost per cow 2,186.11 2,028.20 2,180.15Hired labor per cow 480.14 378.50 445.84Avg. milk price per cwt. 19.89 19.32 20.50Milk price / feed margin 11.04 9.29 12.38
2020 Annual Report RankEm © University of Minnesota
56
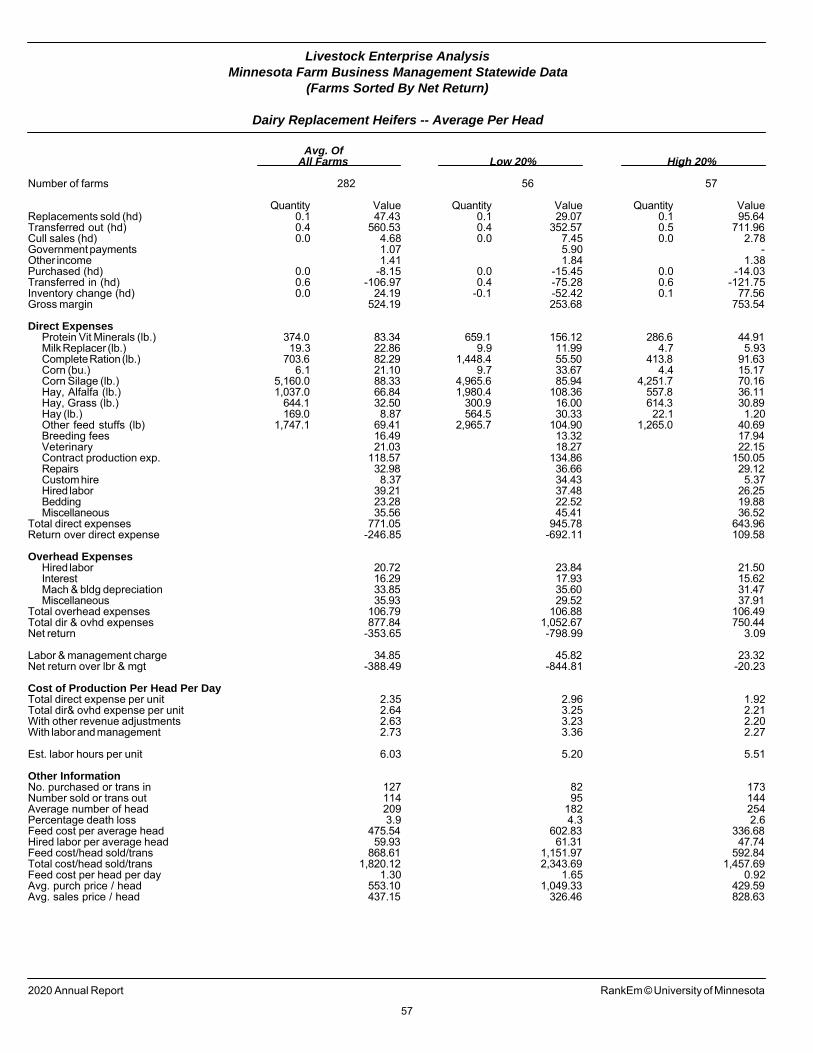
Livestock Enterprise AnalysisMinnesota Farm Business Management Statewide Data
(Farms Sorted By Net Return)
Dairy Replacement Heifers -- Average Per Head
Avg. OfAll Farms Low 20% High 20%
Number of farms 282 56 57
Quantity Value Quantity Value Quantity ValueReplacements sold (hd) 0.1 47.43 0.1 29.07 0.1 95.64Transferred out (hd) 0.4 560.53 0.4 352.57 0.5 711.96Cull sales (hd) 0.0 4.68 0.0 7.45 0.0 2.78Government payments 1.07 5.90 -Other income 1.41 1.84 1.38Purchased (hd) 0.0 -8.15 0.0 -15.45 0.0 -14.03Transferred in (hd) 0.6 -106.97 0.4 -75.28 0.6 -121.75Inventory change (hd) 0.0 24.19 -0.1 -52.42 0.1 77.56Gross margin 524.19 253.68 753.54
Direct ExpensesProtein Vit Minerals (lb.) 374.0 83.34 659.1 156.12 286.6 44.91Milk Replacer (lb.) 19.3 22.86 9.9 11.99 4.7 5.93Complete Ration (lb.) 703.6 82.29 1,448.4 55.50 413.8 91.63Corn (bu.) 6.1 21.10 9.7 33.67 4.4 15.17Corn Silage (lb.) 5,160.0 88.33 4,965.6 85.94 4,251.7 70.16Hay, Alfalfa (lb.) 1,037.0 66.84 1,980.4 108.36 557.8 36.11Hay, Grass (lb.) 644.1 32.50 300.9 16.00 614.3 30.89Hay (lb.) 169.0 8.87 564.5 30.33 22.1 1.20Other feed stuffs (lb) 1,747.1 69.41 2,965.7 104.90 1,265.0 40.69Breeding fees 16.49 13.32 17.94Veterinary 21.03 18.27 22.15Contract production exp. 118.57 134.86 150.05Repairs 32.98 36.66 29.12Custom hire 8.37 34.43 5.37Hired labor 39.21 37.48 26.25Bedding 23.28 22.52 19.88Miscellaneous 35.56 45.41 36.52
Total direct expenses 771.05 945.78 643.96Return over direct expense -246.85 -692.11 109.58
Overhead ExpensesHired labor 20.72 23.84 21.50Interest 16.29 17.93 15.62Mach & bldg depreciation 33.85 35.60 31.47Miscellaneous 35.93 29.52 37.91
Total overhead expenses 106.79 106.88 106.49Total dir & ovhd expenses 877.84 1,052.67 750.44Net return -353.65 -798.99 3.09
Labor & management charge 34.85 45.82 23.32Net return over lbr & mgt -388.49 -844.81 -20.23
Cost of Production Per Head Per DayTotal direct expense per unit 2.35 2.96 1.92Total dir& ovhd expense per unit 2.64 3.25 2.21With other revenue adjustments 2.63 3.23 2.20With labor and management 2.73 3.36 2.27
Est. labor hours per unit 6.03 5.20 5.51
Other InformationNo. purchased or trans in 127 82 173Number sold or trans out 114 95 144Average number of head 209 182 254Percentage death loss 3.9 4.3 2.6Feed cost per average head 475.54 602.83 336.68Hired labor per average head 59.93 61.31 47.74Feed cost/head sold/trans 868.61 1,151.97 592.84Total cost/head sold/trans 1,820.12 2,343.69 1,457.69Feed cost per head per day 1.30 1.65 0.92Avg. purch price / head 553.10 1,049.33 429.59Avg. sales price / head 437.15 326.46 828.63
2020 Annual Report RankEm © University of Minnesota
57
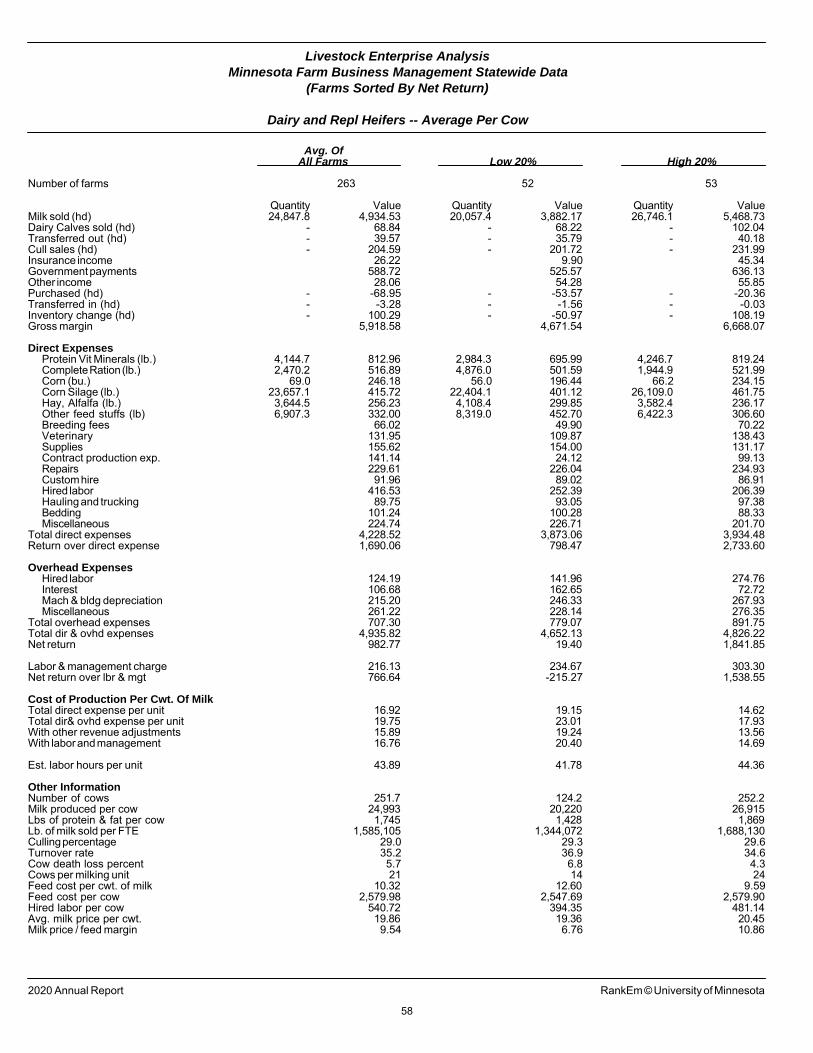
Livestock Enterprise AnalysisMinnesota Farm Business Management Statewide Data
(Farms Sorted By Net Return)
Dairy and Repl Heifers -- Average Per Cow
Avg. OfAll Farms Low 20% High 20%
Number of farms 263 52 53
Quantity Value Quantity Value Quantity ValueMilk sold (hd) 24,847.8 4,934.53 20,057.4 3,882.17 26,746.1 5,468.73Dairy Calves sold (hd) - 68.84 - 68.22 - 102.04Transferred out (hd) - 39.57 - 35.79 - 40.18Cull sales (hd) - 204.59 - 201.72 - 231.99Insurance income 26.22 9.90 45.34Government payments 588.72 525.57 636.13Other income 28.06 54.28 55.85Purchased (hd) - -68.95 - -53.57 - -20.36Transferred in (hd) - -3.28 - -1.56 - -0.03Inventory change (hd) - 100.29 - -50.97 - 108.19Gross margin 5,918.58 4,671.54 6,668.07
Direct ExpensesProtein Vit Minerals (lb.) 4,144.7 812.96 2,984.3 695.99 4,246.7 819.24Complete Ration (lb.) 2,470.2 516.89 4,876.0 501.59 1,944.9 521.99Corn (bu.) 69.0 246.18 56.0 196.44 66.2 234.15Corn Silage (lb.) 23,657.1 415.72 22,404.1 401.12 26,109.0 461.75Hay, Alfalfa (lb.) 3,644.5 256.23 4,108.4 299.85 3,582.4 236.17Other feed stuffs (lb) 6,907.3 332.00 8,319.0 452.70 6,422.3 306.60Breeding fees 66.02 49.90 70.22Veterinary 131.95 109.87 138.43Supplies 155.62 154.00 131.17Contract production exp. 141.14 24.12 99.13Repairs 229.61 226.04 234.93Custom hire 91.96 89.02 86.91Hired labor 416.53 252.39 206.39Hauling and trucking 89.75 93.05 97.38Bedding 101.24 100.28 88.33Miscellaneous 224.74 226.71 201.70
Total direct expenses 4,228.52 3,873.06 3,934.48Return over direct expense 1,690.06 798.47 2,733.60
Overhead ExpensesHired labor 124.19 141.96 274.76Interest 106.68 162.65 72.72Mach & bldg depreciation 215.20 246.33 267.93Miscellaneous 261.22 228.14 276.35
Total overhead expenses 707.30 779.07 891.75Total dir & ovhd expenses 4,935.82 4,652.13 4,826.22Net return 982.77 19.40 1,841.85
Labor & management charge 216.13 234.67 303.30Net return over lbr & mgt 766.64 -215.27 1,538.55
Cost of Production Per Cwt. Of MilkTotal direct expense per unit 16.92 19.15 14.62Total dir& ovhd expense per unit 19.75 23.01 17.93With other revenue adjustments 15.89 19.24 13.56With labor and management 16.76 20.40 14.69
Est. labor hours per unit 43.89 41.78 44.36
Other InformationNumber of cows 251.7 124.2 252.2Milk produced per cow 24,993 20,220 26,915Lbs of protein & fat per cow 1,745 1,428 1,869Lb. of milk sold per FTE 1,585,105 1,344,072 1,688,130Culling percentage 29.0 29.3 29.6Turnover rate 35.2 36.9 34.6Cow death loss percent 5.7 6.8 4.3Cows per milking unit 21 14 24Feed cost per cwt. of milk 10.32 12.60 9.59Feed cost per cow 2,579.98 2,547.69 2,579.90Hired labor per cow 540.72 394.35 481.14Avg. milk price per cwt. 19.86 19.36 20.45Milk price / feed margin 9.54 6.76 10.86
2020 Annual Report RankEm © University of Minnesota
58
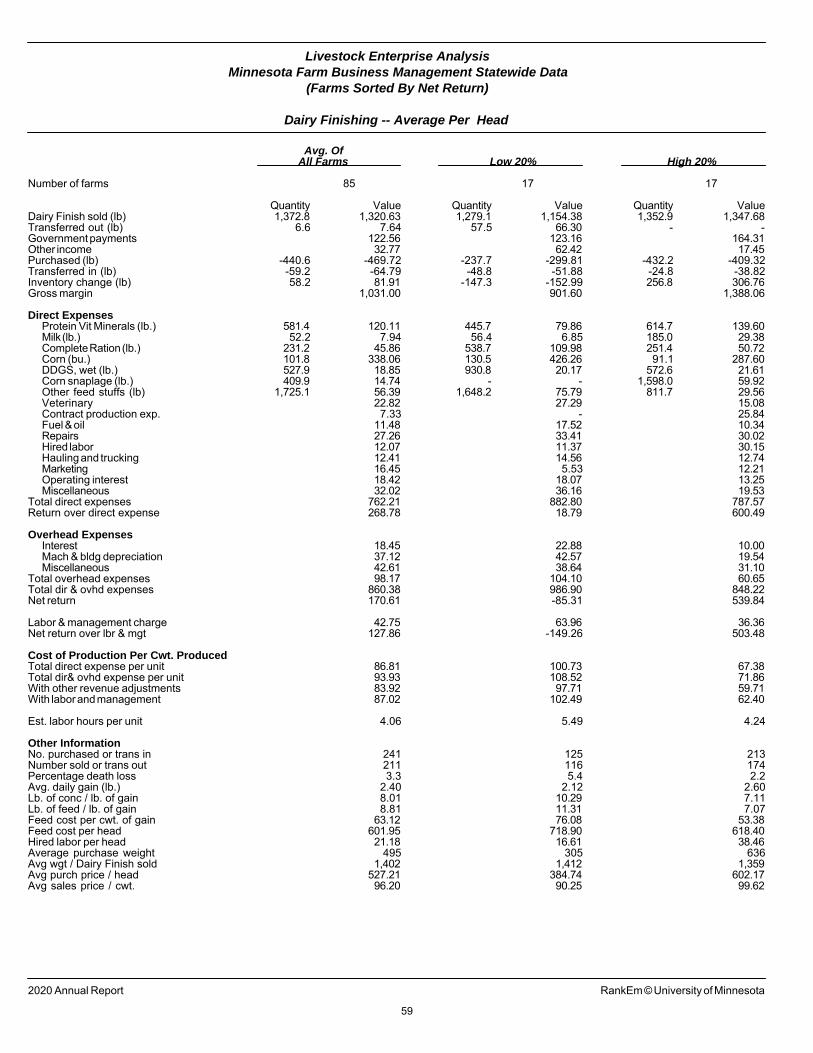
Livestock Enterprise AnalysisMinnesota Farm Business Management Statewide Data
(Farms Sorted By Net Return)
Dairy Finishing -- Average Per Head
Avg. OfAll Farms Low 20% High 20%
Number of farms 85 17 17
Quantity Value Quantity Value Quantity ValueDairy Finish sold (lb) 1,372.8 1,320.63 1,279.1 1,154.38 1,352.9 1,347.68Transferred out (lb) 6.6 7.64 57.5 66.30 - -Government payments 122.56 123.16 164.31Other income 32.77 62.42 17.45Purchased (lb) -440.6 -469.72 -237.7 -299.81 -432.2 -409.32Transferred in (lb) -59.2 -64.79 -48.8 -51.88 -24.8 -38.82Inventory change (lb) 58.2 81.91 -147.3 -152.99 256.8 306.76Gross margin 1,031.00 901.60 1,388.06
Direct ExpensesProtein Vit Minerals (lb.) 581.4 120.11 445.7 79.86 614.7 139.60Milk (lb.) 52.2 7.94 56.4 6.85 185.0 29.38Complete Ration (lb.) 231.2 45.86 538.7 109.98 251.4 50.72Corn (bu.) 101.8 338.06 130.5 426.26 91.1 287.60DDGS, wet (lb.) 527.9 18.85 930.8 20.17 572.6 21.61Corn snaplage (lb.) 409.9 14.74 - - 1,598.0 59.92Other feed stuffs (lb) 1,725.1 56.39 1,648.2 75.79 811.7 29.56Veterinary 22.82 27.29 15.08Contract production exp. 7.33 - 25.84Fuel & oil 11.48 17.52 10.34Repairs 27.26 33.41 30.02Hired labor 12.07 11.37 30.15Hauling and trucking 12.41 14.56 12.74Marketing 16.45 5.53 12.21Operating interest 18.42 18.07 13.25Miscellaneous 32.02 36.16 19.53
Total direct expenses 762.21 882.80 787.57Return over direct expense 268.78 18.79 600.49
Overhead ExpensesInterest 18.45 22.88 10.00Mach & bldg depreciation 37.12 42.57 19.54Miscellaneous 42.61 38.64 31.10
Total overhead expenses 98.17 104.10 60.65Total dir & ovhd expenses 860.38 986.90 848.22Net return 170.61 -85.31 539.84
Labor & management charge 42.75 63.96 36.36Net return over lbr & mgt 127.86 -149.26 503.48
Cost of Production Per Cwt. ProducedTotal direct expense per unit 86.81 100.73 67.38Total dir& ovhd expense per unit 93.93 108.52 71.86With other revenue adjustments 83.92 97.71 59.71With labor and management 87.02 102.49 62.40
Est. labor hours per unit 4.06 5.49 4.24
Other InformationNo. purchased or trans in 241 125 213Number sold or trans out 211 116 174Percentage death loss 3.3 5.4 2.2Avg. daily gain (lb.) 2.40 2.12 2.60Lb. of conc / lb. of gain 8.01 10.29 7.11Lb. of feed / lb. of gain 8.81 11.31 7.07Feed cost per cwt. of gain 63.12 76.08 53.38Feed cost per head 601.95 718.90 618.40Hired labor per head 21.18 16.61 38.46Average purchase weight 495 305 636Avg wgt / Dairy Finish sold 1,402 1,412 1,359Avg purch price / head 527.21 384.74 602.17Avg sales price / cwt. 96.20 90.25 99.62
2020 Annual Report RankEm © University of Minnesota
59
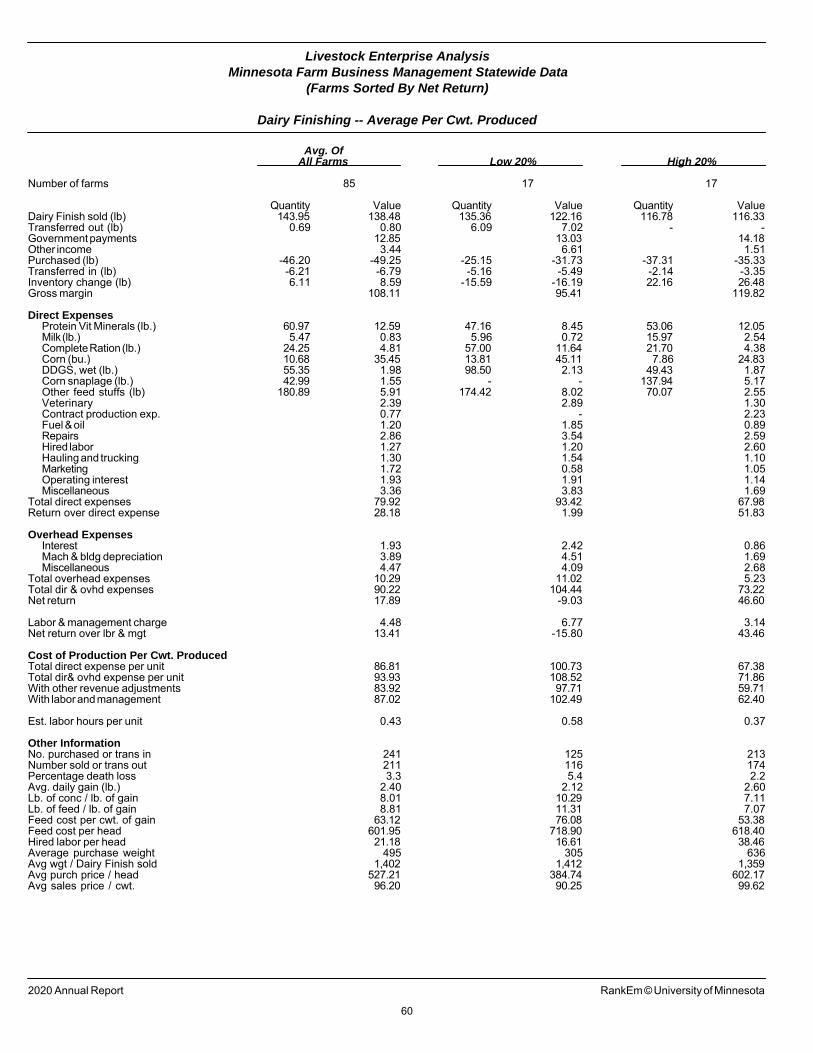
Livestock Enterprise AnalysisMinnesota Farm Business Management Statewide Data
(Farms Sorted By Net Return)
Dairy Finishing -- Average Per Cwt. Produced
Avg. OfAll Farms Low 20% High 20%
Number of farms 85 17 17
Quantity Value Quantity Value Quantity ValueDairy Finish sold (lb) 143.95 138.48 135.36 122.16 116.78 116.33Transferred out (lb) 0.69 0.80 6.09 7.02 - -Government payments 12.85 13.03 14.18Other income 3.44 6.61 1.51Purchased (lb) -46.20 -49.25 -25.15 -31.73 -37.31 -35.33Transferred in (lb) -6.21 -6.79 -5.16 -5.49 -2.14 -3.35Inventory change (lb) 6.11 8.59 -15.59 -16.19 22.16 26.48Gross margin 108.11 95.41 119.82
Direct ExpensesProtein Vit Minerals (lb.) 60.97 12.59 47.16 8.45 53.06 12.05Milk (lb.) 5.47 0.83 5.96 0.72 15.97 2.54Complete Ration (lb.) 24.25 4.81 57.00 11.64 21.70 4.38Corn (bu.) 10.68 35.45 13.81 45.11 7.86 24.83DDGS, wet (lb.) 55.35 1.98 98.50 2.13 49.43 1.87Corn snaplage (lb.) 42.99 1.55 - - 137.94 5.17Other feed stuffs (lb) 180.89 5.91 174.42 8.02 70.07 2.55Veterinary 2.39 2.89 1.30Contract production exp. 0.77 - 2.23Fuel & oil 1.20 1.85 0.89Repairs 2.86 3.54 2.59Hired labor 1.27 1.20 2.60Hauling and trucking 1.30 1.54 1.10Marketing 1.72 0.58 1.05Operating interest 1.93 1.91 1.14Miscellaneous 3.36 3.83 1.69
Total direct expenses 79.92 93.42 67.98Return over direct expense 28.18 1.99 51.83
Overhead ExpensesInterest 1.93 2.42 0.86Mach & bldg depreciation 3.89 4.51 1.69Miscellaneous 4.47 4.09 2.68
Total overhead expenses 10.29 11.02 5.23Total dir & ovhd expenses 90.22 104.44 73.22Net return 17.89 -9.03 46.60
Labor & management charge 4.48 6.77 3.14Net return over lbr & mgt 13.41 -15.80 43.46
Cost of Production Per Cwt. ProducedTotal direct expense per unit 86.81 100.73 67.38Total dir& ovhd expense per unit 93.93 108.52 71.86With other revenue adjustments 83.92 97.71 59.71With labor and management 87.02 102.49 62.40
Est. labor hours per unit 0.43 0.58 0.37
Other InformationNo. purchased or trans in 241 125 213Number sold or trans out 211 116 174Percentage death loss 3.3 5.4 2.2Avg. daily gain (lb.) 2.40 2.12 2.60Lb. of conc / lb. of gain 8.01 10.29 7.11Lb. of feed / lb. of gain 8.81 11.31 7.07Feed cost per cwt. of gain 63.12 76.08 53.38Feed cost per head 601.95 718.90 618.40Hired labor per head 21.18 16.61 38.46Average purchase weight 495 305 636Avg wgt / Dairy Finish sold 1,402 1,412 1,359Avg purch price / head 527.21 384.74 602.17Avg sales price / cwt. 96.20 90.25 99.62
2020 Annual Report RankEm © University of Minnesota
60
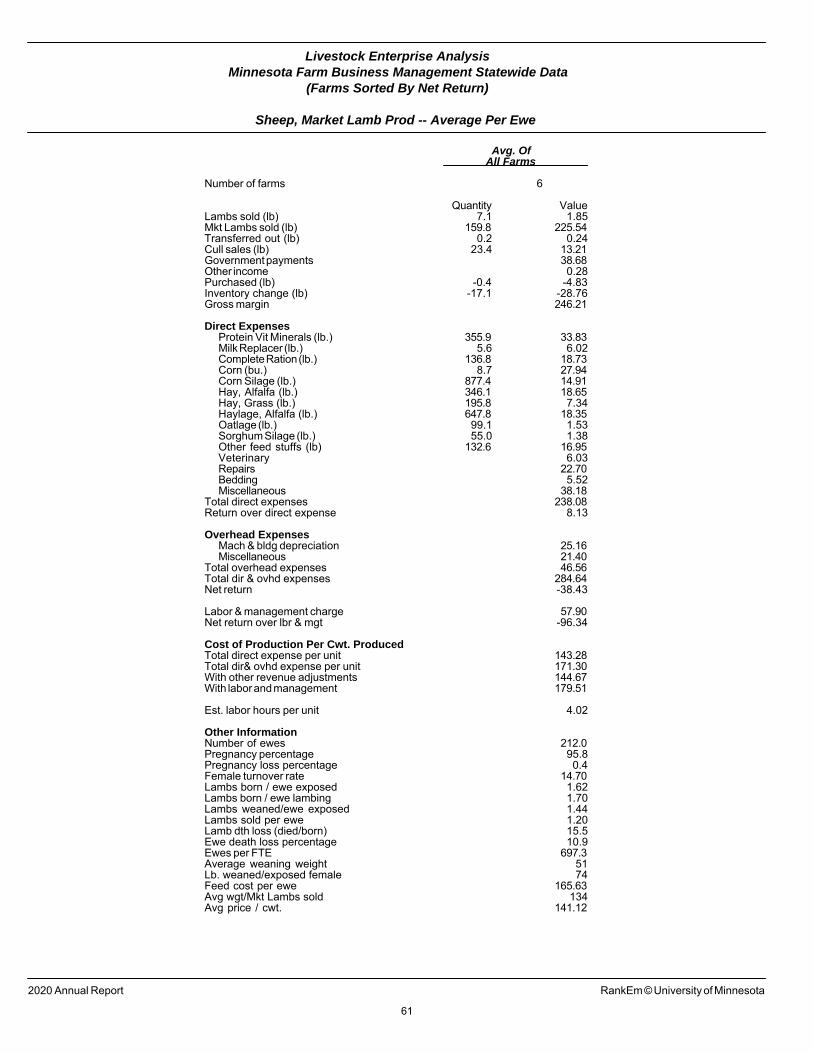
Livestock Enterprise AnalysisMinnesota Farm Business Management Statewide Data
(Farms Sorted By Net Return)
Sheep, Market Lamb Prod -- Average Per Ewe
Avg. OfAll Farms
Number of farms 6
Quantity ValueLambs sold (lb) 7.1 1.85Mkt Lambs sold (lb) 159.8 225.54Transferred out (lb) 0.2 0.24Cull sales (lb) 23.4 13.21Government payments 38.68Other income 0.28Purchased (lb) -0.4 -4.83Inventory change (lb) -17.1 -28.76Gross margin 246.21
Direct ExpensesProtein Vit Minerals (lb.) 355.9 33.83Milk Replacer (lb.) 5.6 6.02Complete Ration (lb.) 136.8 18.73Corn (bu.) 8.7 27.94Corn Silage (lb.) 877.4 14.91Hay, Alfalfa (lb.) 346.1 18.65Hay, Grass (lb.) 195.8 7.34Haylage, Alfalfa (lb.) 647.8 18.35Oatlage (lb.) 99.1 1.53Sorghum Silage (lb.) 55.0 1.38Other feed stuffs (lb) 132.6 16.95Veterinary 6.03Repairs 22.70Bedding 5.52Miscellaneous 38.18
Total direct expenses 238.08Return over direct expense 8.13
Overhead ExpensesMach & bldg depreciation 25.16Miscellaneous 21.40
Total overhead expenses 46.56Total dir & ovhd expenses 284.64Net return -38.43
Labor & management charge 57.90Net return over lbr & mgt -96.34
Cost of Production Per Cwt. ProducedTotal direct expense per unit 143.28Total dir& ovhd expense per unit 171.30With other revenue adjustments 144.67With labor and management 179.51
Est. labor hours per unit 4.02
Other InformationNumber of ewes 212.0Pregnancy percentage 95.8Pregnancy loss percentage 0.4Female turnover rate 14.70Lambs born / ewe exposed 1.62Lambs born / ewe lambing 1.70Lambs weaned/ewe exposed 1.44Lambs sold per ewe 1.20Lamb dth loss (died/born) 15.5Ewe death loss percentage 10.9Ewes per FTE 697.3Average weaning weight 51Lb. weaned/exposed female 74Feed cost per ewe 165.63Avg wgt/Mkt Lambs sold 134Avg price / cwt. 141.12
2020 Annual Report RankEm © University of Minnesota
61
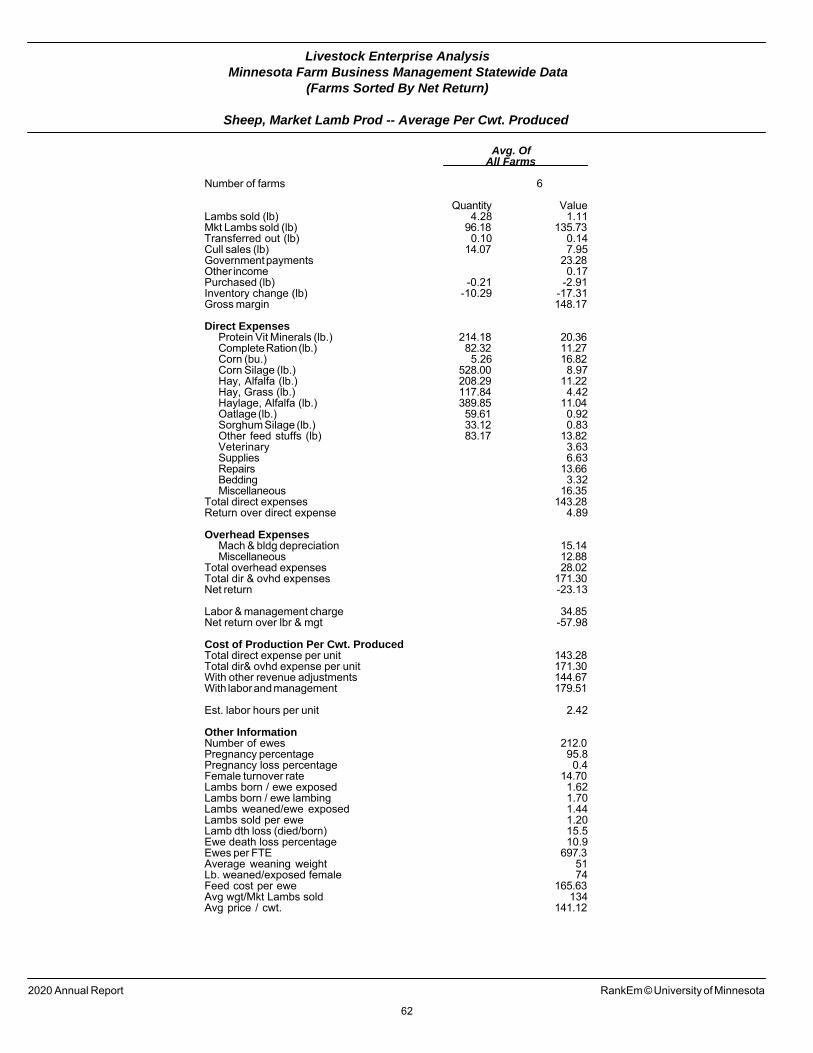
Livestock Enterprise AnalysisMinnesota Farm Business Management Statewide Data
(Farms Sorted By Net Return)
Sheep, Market Lamb Prod -- Average Per Cwt. Produced
Avg. OfAll Farms
Number of farms 6
Quantity ValueLambs sold (lb) 4.28 1.11Mkt Lambs sold (lb) 96.18 135.73Transferred out (lb) 0.10 0.14Cull sales (lb) 14.07 7.95Government payments 23.28Other income 0.17Purchased (lb) -0.21 -2.91Inventory change (lb) -10.29 -17.31Gross margin 148.17
Direct ExpensesProtein Vit Minerals (lb.) 214.18 20.36Complete Ration (lb.) 82.32 11.27Corn (bu.) 5.26 16.82Corn Silage (lb.) 528.00 8.97Hay, Alfalfa (lb.) 208.29 11.22Hay, Grass (lb.) 117.84 4.42Haylage, Alfalfa (lb.) 389.85 11.04Oatlage (lb.) 59.61 0.92Sorghum Silage (lb.) 33.12 0.83Other feed stuffs (lb) 83.17 13.82Veterinary 3.63Supplies 6.63Repairs 13.66Bedding 3.32Miscellaneous 16.35
Total direct expenses 143.28Return over direct expense 4.89
Overhead ExpensesMach & bldg depreciation 15.14Miscellaneous 12.88
Total overhead expenses 28.02Total dir & ovhd expenses 171.30Net return -23.13
Labor & management charge 34.85Net return over lbr & mgt -57.98
Cost of Production Per Cwt. ProducedTotal direct expense per unit 143.28Total dir& ovhd expense per unit 171.30With other revenue adjustments 144.67With labor and management 179.51
Est. labor hours per unit 2.42
Other InformationNumber of ewes 212.0Pregnancy percentage 95.8Pregnancy loss percentage 0.4Female turnover rate 14.70Lambs born / ewe exposed 1.62Lambs born / ewe lambing 1.70Lambs weaned/ewe exposed 1.44Lambs sold per ewe 1.20Lamb dth loss (died/born) 15.5Ewe death loss percentage 10.9Ewes per FTE 697.3Average weaning weight 51Lb. weaned/exposed female 74Feed cost per ewe 165.63Avg wgt/Mkt Lambs sold 134Avg price / cwt. 141.12
2020 Annual Report RankEm © University of Minnesota
62
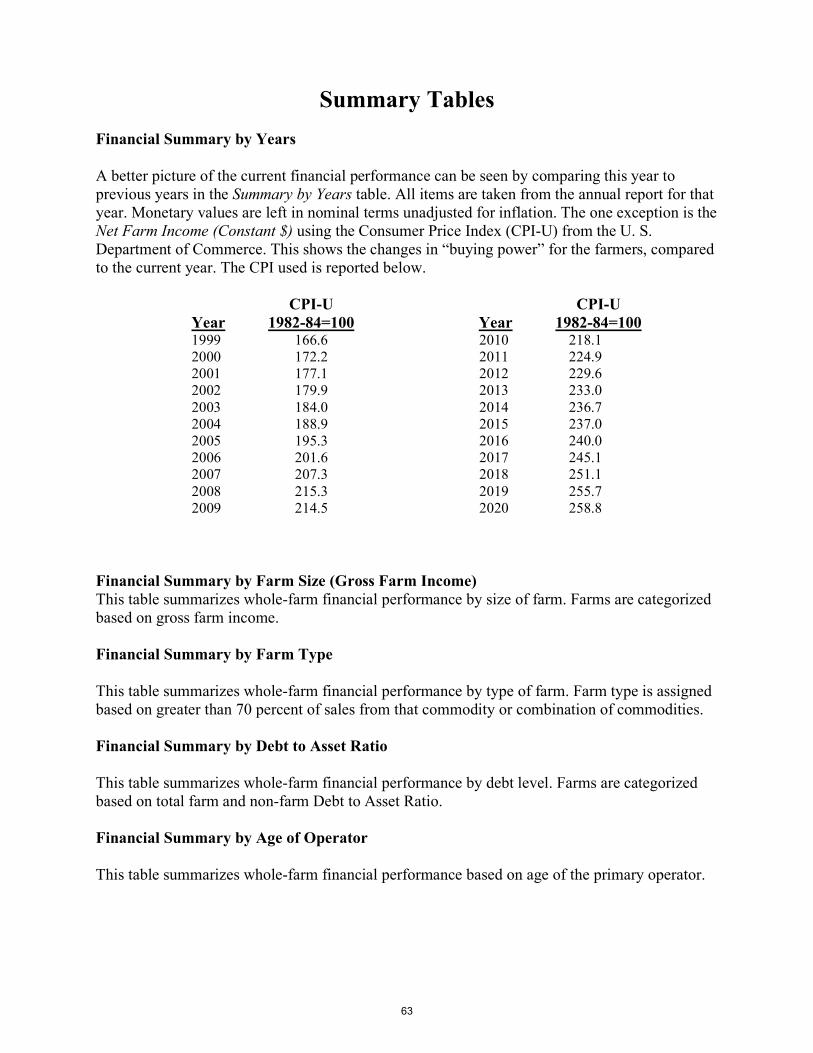
Summary Tables
Financial Summary by Years A better picture of the current financial performance can be seen by comparing this year to previous years in the Summary by Years table. All items are taken from the annual report for that year. Monetary values are left in nominal terms unadjusted for inflation. The one exception is the Net Farm Income (Constant $) using the Consumer Price Index (CPI-U) from the U. S. Department of Commerce. This shows the changes in “buying power” for the farmers, compared to the current year. The CPI used is reported below.
CPI-U CPI-U Year 1982-84=100 Year 1982-84=100 1999 166.6 2000 172.2 2001 177.1 2002 179.9 2003 184.0 2004 188.9 2005 195.3 2006 201.6 2007 207.3 2008 215.3 2009 214.5
2010 218.1 2011 224.9 2012 229.6 2013 233.0 2014 236.7 2015 237.0 2016 240.0 2017 245.1 2018 251.1 2019 255.7 2020 258.8
Financial Summary by Farm Size (Gross Farm Income) This table summarizes whole-farm financial performance by size of farm. Farms are categorized based on gross farm income. Financial Summary by Farm Type This table summarizes whole-farm financial performance by type of farm. Farm type is assigned based on greater than 70 percent of sales from that commodity or combination of commodities. Financial Summary by Debt to Asset Ratio This table summarizes whole-farm financial performance by debt level. Farms are categorized based on total farm and non-farm Debt to Asset Ratio. Financial Summary by Age of Operator This table summarizes whole-farm financial performance based on age of the primary operator.
63
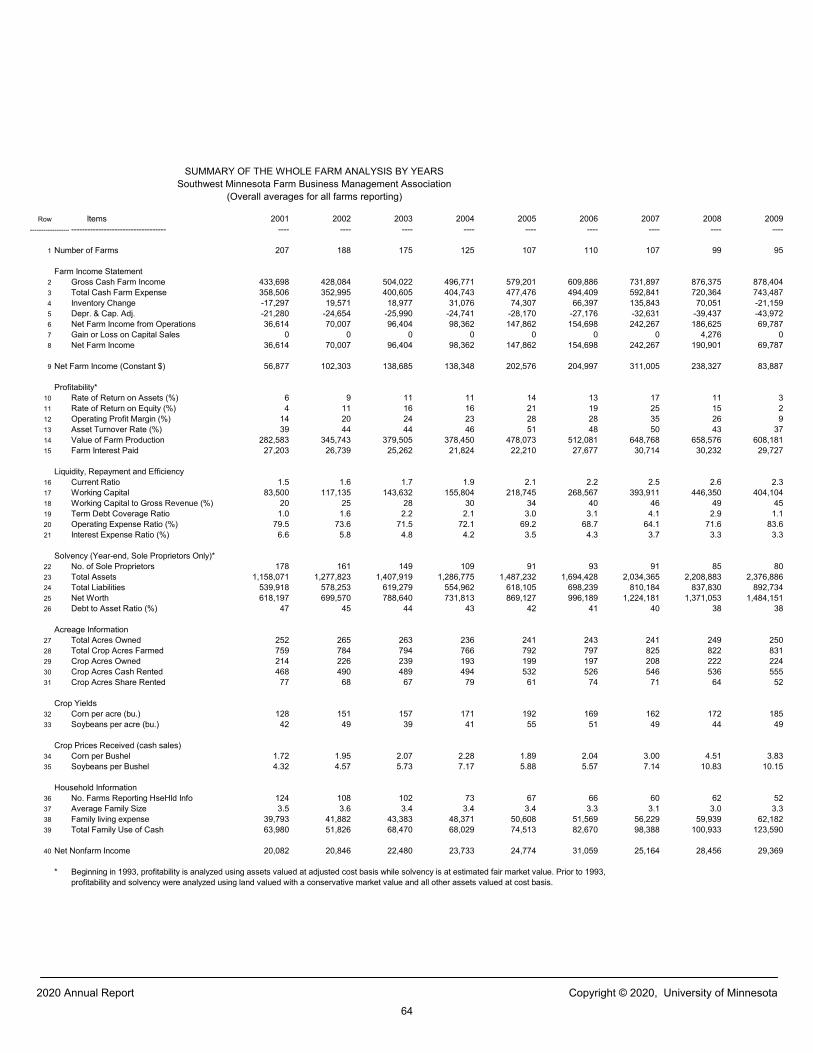
Row Items 2001 2002 2003 2004 2005 2006 2007 2008 2009------------------ ----------------------------------- ---- ---- ---- ---- ---- ---- ---- ---- ----
1 Number of Farms 207 188 175 125 107 110 107 99 95
Farm Income Statement2 Gross Cash Farm Income 433,698 428,084 504,022 496,771 579,201 609,886 731,897 876,375 878,4043 Total Cash Farm Expense 358,506 352,995 400,605 404,743 477,476 494,409 592,841 720,364 743,4874 Inventory Change -17,297 19,571 18,977 31,076 74,307 66,397 135,843 70,051 -21,1595 Depr. & Cap. Adj. -21,280 -24,654 -25,990 -24,741 -28,170 -27,176 -32,631 -39,437 -43,9726 Net Farm Income from Operations 36,614 70,007 96,404 98,362 147,862 154,698 242,267 186,625 69,7877 Gain or Loss on Capital Sales 0 0 0 0 0 0 0 4,276 08 Net Farm Income 36,614 70,007 96,404 98,362 147,862 154,698 242,267 190,901 69,787
9 Net Farm Income (Constant $) 56,877 102,303 138,685 138,348 202,576 204,997 311,005 238,327 83,887
Profitability*10 Rate of Return on Assets (%) 6 9 11 11 14 13 17 11 311 Rate of Return on Equity (%) 4 11 16 16 21 19 25 15 212 Operating Profit Margin (%) 14 20 24 23 28 28 35 26 913 Asset Turnover Rate (%) 39 44 44 46 51 48 50 43 3714 Value of Farm Production 282,583 345,743 379,505 378,450 478,073 512,081 648,768 658,576 608,18115 Farm Interest Paid 27,203 26,739 25,262 21,824 22,210 27,677 30,714 30,232 29,727
Liquidity, Repayment and Efficiency16 Current Ratio 1.5 1.6 1.7 1.9 2.1 2.2 2.5 2.6 2.317 Working Capital 83,500 117,135 143,632 155,804 218,745 268,567 393,911 446,350 404,10418 Working Capital to Gross Revenue (%) 20 25 28 30 34 40 46 49 4519 Term Debt Coverage Ratio 1.0 1.6 2.2 2.1 3.0 3.1 4.1 2.9 1.120 Operating Expense Ratio (%) 79.5 73.6 71.5 72.1 69.2 68.7 64.1 71.6 83.621 Interest Expense Ratio (%) 6.6 5.8 4.8 4.2 3.5 4.3 3.7 3.3 3.3
Solvency (Year-end, Sole Proprietors Only)*22 No. of Sole Proprietors 178 161 149 109 91 93 91 85 8023 Total Assets 1,158,071 1,277,823 1,407,919 1,286,775 1,487,232 1,694,428 2,034,365 2,208,883 2,376,88624 Total Liabilities 539,918 578,253 619,279 554,962 618,105 698,239 810,184 837,830 892,73425 Net Worth 618,197 699,570 788,640 731,813 869,127 996,189 1,224,181 1,371,053 1,484,15126 Debt to Asset Ratio (%) 47 45 44 43 42 41 40 38 38
Acreage Information27 Total Acres Owned 252 265 263 236 241 243 241 249 25028 Total Crop Acres Farmed 759 784 794 766 792 797 825 822 83129 Crop Acres Owned 214 226 239 193 199 197 208 222 22430 Crop Acres Cash Rented 468 490 489 494 532 526 546 536 55531 Crop Acres Share Rented 77 68 67 79 61 74 71 64 52
Crop Yields32 Corn per acre (bu.) 128 151 157 171 192 169 162 172 18533 Soybeans per acre (bu.) 42 49 39 41 55 51 49 44 49
Crop Prices Received (cash sales)34 Corn per Bushel 1.72 1.95 2.07 2.28 1.89 2.04 3.00 4.51 3.8335 Soybeans per Bushel 4.32 4.57 5.73 7.17 5.88 5.57 7.14 10.83 10.15
Household Information36 No. Farms Reporting HseHld Info 124 108 102 73 67 66 60 62 5237 Average Family Size 3.5 3.6 3.4 3.4 3.4 3.3 3.1 3.0 3.338 Family living expense 39,793 41,882 43,383 48,371 50,608 51,569 56,229 59,939 62,18239 Total Family Use of Cash 63,980 51,826 68,470 68,029 74,513 82,670 98,388 100,933 123,590
40 Net Nonfarm Income 20,082 20,846 22,480 23,733 24,774 31,059 25,164 28,456 29,369
* Beginning in 1993, profitability is analyzed using assets valued at adjusted cost basis while solvency is at estimated fair market value. Prior to 1993,profitability and solvency were analyzed using land valued with a conservative market value and all other assets valued at cost basis.
SUMMARY OF THE WHOLE FARM ANALYSIS BY YEARSSouthwest Minnesota Farm Business Management Association
(Overall averages for all farms reporting)
2020 Annual Report Copyright © 2020, University of Minnesota64
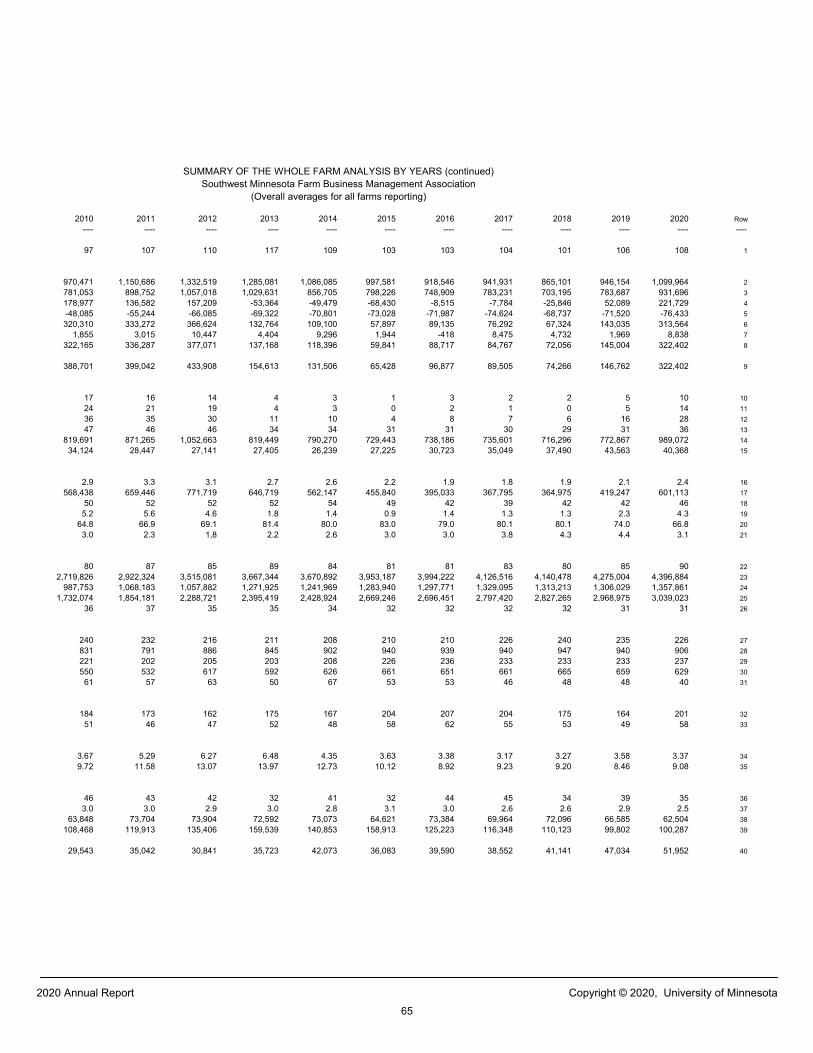
2010 2011 2012 2013 2014 2015 2016 2017 2018 2019 2020 Row ---- ---- ---- ---- ---- ---- ---- ---- ---- ---- ---- ----
97 107 110 117 109 103 103 104 101 106 108 1
970,471 1,150,686 1,332,519 1,285,081 1,086,085 997,581 918,546 941,931 865,101 946,154 1,099,964 2781,053 898,752 1,057,018 1,029,631 856,705 798,226 748,909 783,231 703,195 783,687 931,696 3178,977 136,582 157,209 -53,364 -49,479 -68,430 -8,515 -7,784 -25,846 52,089 221,729 4-48,085 -55,244 -66,085 -69,322 -70,801 -73,028 -71,987 -74,624 -68,737 -71,520 -76,433 5320,310 333,272 366,624 132,764 109,100 57,897 89,135 76,292 67,324 143,035 313,564 6
1,855 3,015 10,447 4,404 9,296 1,944 -418 8,475 4,732 1,969 8,838 7322,165 336,287 377,071 137,168 118,396 59,841 88,717 84,767 72,056 145,004 322,402 8
388,701 399,042 433,908 154,613 131,506 65,428 96,877 89,505 74,266 146,762 322,402 9
17 16 14 4 3 1 3 2 2 5 10 1024 21 19 4 3 0 2 1 0 5 14 1136 35 30 11 10 4 8 7 6 16 28 1247 46 46 34 34 31 31 30 29 31 36 13
819,691 871,265 1,052,663 819,449 790,270 729,443 738,186 735,601 716,296 772,867 989,072 1434,124 28,447 27,141 27,405 26,239 27,225 30,723 35,049 37,490 43,563 40,368 15
2.9 3.3 3.1 2.7 2.6 2.2 1.9 1.8 1.9 2.1 2.4 16568,438 659,446 771,719 646,719 562,147 455,840 395,033 367,795 364,975 419,247 601,113 17
50 52 52 52 54 49 42 39 42 42 46 185.2 5.6 4.6 1.8 1.4 0.9 1.4 1.3 1.3 2.3 4.3 19
64.8 66.9 69.1 81.4 80.0 83.0 79.0 80.1 80.1 74.0 66.8 203.0 2.3 1,8 2.2 2.6 3.0 3.0 3.8 4.3 4.4 3.1 21
80 87 85 89 84 81 81 83 80 85 90 222,719,826 2,922,324 3,515,081 3,667,344 3,670,892 3,953,187 3,994,222 4,126,516 4,140,478 4,275,004 4,396,884 23
987,753 1,068,183 1,057,882 1,271,925 1,241,969 1,283,940 1,297,771 1,329,095 1,313,213 1,306,029 1,357,861 241,732,074 1,854,181 2,288,721 2,395,419 2,428,924 2,669,246 2,696,451 2,797,420 2,827,265 2,968,975 3,039,023 25
36 37 35 35 34 32 32 32 32 31 31 26
240 232 216 211 208 210 210 226 240 235 226 27831 791 886 845 902 940 939 940 947 940 906 28221 202 205 203 208 226 236 233 233 233 237 29550 532 617 592 626 661 651 661 665 659 629 30
61 57 63 50 67 53 53 46 48 48 40 31
184 173 162 175 167 204 207 204 175 164 201 3251 46 47 52 48 58 62 55 53 49 58 33
3.67 5.29 6.27 6.48 4.35 3.63 3.38 3.17 3.27 3.58 3.37 349.72 11.58 13.07 13.97 12.73 10.12 8.92 9.23 9.20 8.46 9.08 35
46 43 42 32 41 32 44 45 34 39 35 363.0 3.0 2.9 3.0 2.8 3.1 3.0 2.6 2.6 2.9 2.5 37
63,848 73,704 73,904 72,592 73,073 64,621 73,384 69,964 72,096 66,585 62,504 38108,468 119,913 135,406 159,539 140,853 158,913 125,223 116,348 110,123 99,802 100,287 39
29,543 35,042 30,841 35,723 42,073 36,083 39,590 38,552 41,141 47,034 51,952 40
SUMMARY OF THE WHOLE FARM ANALYSIS BY YEARS (continued)Southwest Minnesota Farm Business Management Association
(Overall averages for all farms reporting)
2020 Annual Report Copyright © 2020, University of Minnesota65
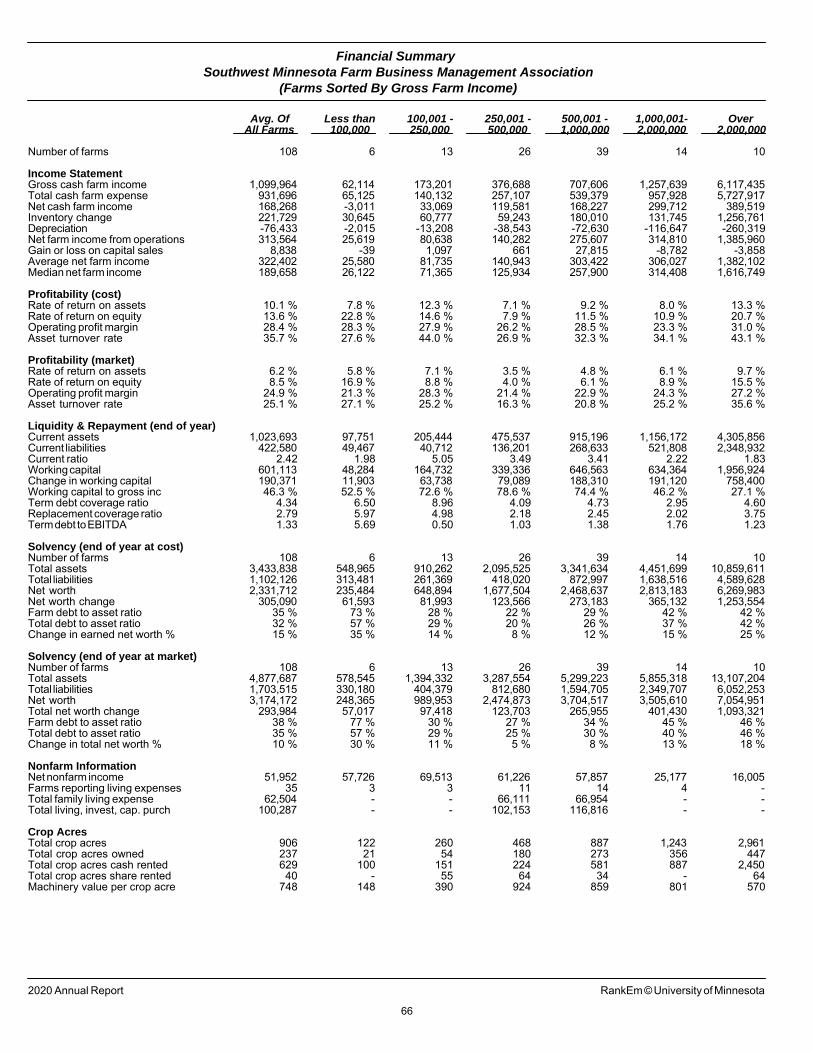
Financial SummarySouthwest Minnesota Farm Business Management Association
(Farms Sorted By Gross Farm Income)
Avg. Of Less than 100,001 - 250,001 - 500,001 - 1,000,001- OverAll Farms 100,000 250,000 500,000 1,000,000 2,000,000 2,000,000
Number of farms 108 6 13 26 39 14 10
Income StatementGross cash farm income 1,099,964 62,114 173,201 376,688 707,606 1,257,639 6,117,435Total cash farm expense 931,696 65,125 140,132 257,107 539,379 957,928 5,727,917Net cash farm income 168,268 -3,011 33,069 119,581 168,227 299,712 389,519Inventory change 221,729 30,645 60,777 59,243 180,010 131,745 1,256,761Depreciation -76,433 -2,015 -13,208 -38,543 -72,630 -116,647 -260,319Net farm income from operations 313,564 25,619 80,638 140,282 275,607 314,810 1,385,960Gain or loss on capital sales 8,838 -39 1,097 661 27,815 -8,782 -3,858Average net farm income 322,402 25,580 81,735 140,943 303,422 306,027 1,382,102Median net farm income 189,658 26,122 71,365 125,934 257,900 314,408 1,616,749
Profitability (cost)Rate of return on assets 10.1 % 7.8 % 12.3 % 7.1 % 9.2 % 8.0 % 13.3 %Rate of return on equity 13.6 % 22.8 % 14.6 % 7.9 % 11.5 % 10.9 % 20.7 %Operating profit margin 28.4 % 28.3 % 27.9 % 26.2 % 28.5 % 23.3 % 31.0 %Asset turnover rate 35.7 % 27.6 % 44.0 % 26.9 % 32.3 % 34.1 % 43.1 %
Profitability (market)Rate of return on assets 6.2 % 5.8 % 7.1 % 3.5 % 4.8 % 6.1 % 9.7 %Rate of return on equity 8.5 % 16.9 % 8.8 % 4.0 % 6.1 % 8.9 % 15.5 %Operating profit margin 24.9 % 21.3 % 28.3 % 21.4 % 22.9 % 24.3 % 27.2 %Asset turnover rate 25.1 % 27.1 % 25.2 % 16.3 % 20.8 % 25.2 % 35.6 %
Liquidity & Repayment (end of year)Current assets 1,023,693 97,751 205,444 475,537 915,196 1,156,172 4,305,856Current liabilities 422,580 49,467 40,712 136,201 268,633 521,808 2,348,932Current ratio 2.42 1.98 5.05 3.49 3.41 2.22 1.83Working capital 601,113 48,284 164,732 339,336 646,563 634,364 1,956,924Change in working capital 190,371 11,903 63,738 79,089 188,310 191,120 758,400Working capital to gross inc 46.3 % 52.5 % 72.6 % 78.6 % 74.4 % 46.2 % 27.1 %Term debt coverage ratio 4.34 6.50 8.96 4.09 4.73 2.95 4.60Replacement coverage ratio 2.79 5.97 4.98 2.18 2.45 2.02 3.75Term debt to EBITDA 1.33 5.69 0.50 1.03 1.38 1.76 1.23
Solvency (end of year at cost)Number of farms 108 6 13 26 39 14 10Total assets 3,433,838 548,965 910,262 2,095,525 3,341,634 4,451,699 10,859,611Total liabilities 1,102,126 313,481 261,369 418,020 872,997 1,638,516 4,589,628Net worth 2,331,712 235,484 648,894 1,677,504 2,468,637 2,813,183 6,269,983Net worth change 305,090 61,593 81,993 123,566 273,183 365,132 1,253,554Farm debt to asset ratio 35 % 73 % 28 % 22 % 29 % 42 % 42 %Total debt to asset ratio 32 % 57 % 29 % 20 % 26 % 37 % 42 %Change in earned net worth % 15 % 35 % 14 % 8 % 12 % 15 % 25 %
Solvency (end of year at market)Number of farms 108 6 13 26 39 14 10Total assets 4,877,687 578,545 1,394,332 3,287,554 5,299,223 5,855,318 13,107,204Total liabilities 1,703,515 330,180 404,379 812,680 1,594,705 2,349,707 6,052,253Net worth 3,174,172 248,365 989,953 2,474,873 3,704,517 3,505,610 7,054,951Total net worth change 293,984 57,017 97,418 123,703 265,955 401,430 1,093,321Farm debt to asset ratio 38 % 77 % 30 % 27 % 34 % 45 % 46 %Total debt to asset ratio 35 % 57 % 29 % 25 % 30 % 40 % 46 %Change in total net worth % 10 % 30 % 11 % 5 % 8 % 13 % 18 %
Nonfarm InformationNet nonfarm income 51,952 57,726 69,513 61,226 57,857 25,177 16,005Farms reporting living expenses 35 3 3 11 14 4 -Total family living expense 62,504 - - 66,111 66,954 - -Total living, invest, cap. purch 100,287 - - 102,153 116,816 - -
Crop AcresTotal crop acres 906 122 260 468 887 1,243 2,961Total crop acres owned 237 21 54 180 273 356 447Total crop acres cash rented 629 100 151 224 581 887 2,450Total crop acres share rented 40 - 55 64 34 - 64Machinery value per crop acre 748 148 390 924 859 801 570
2020 Annual Report RankEm © University of Minnesota
66
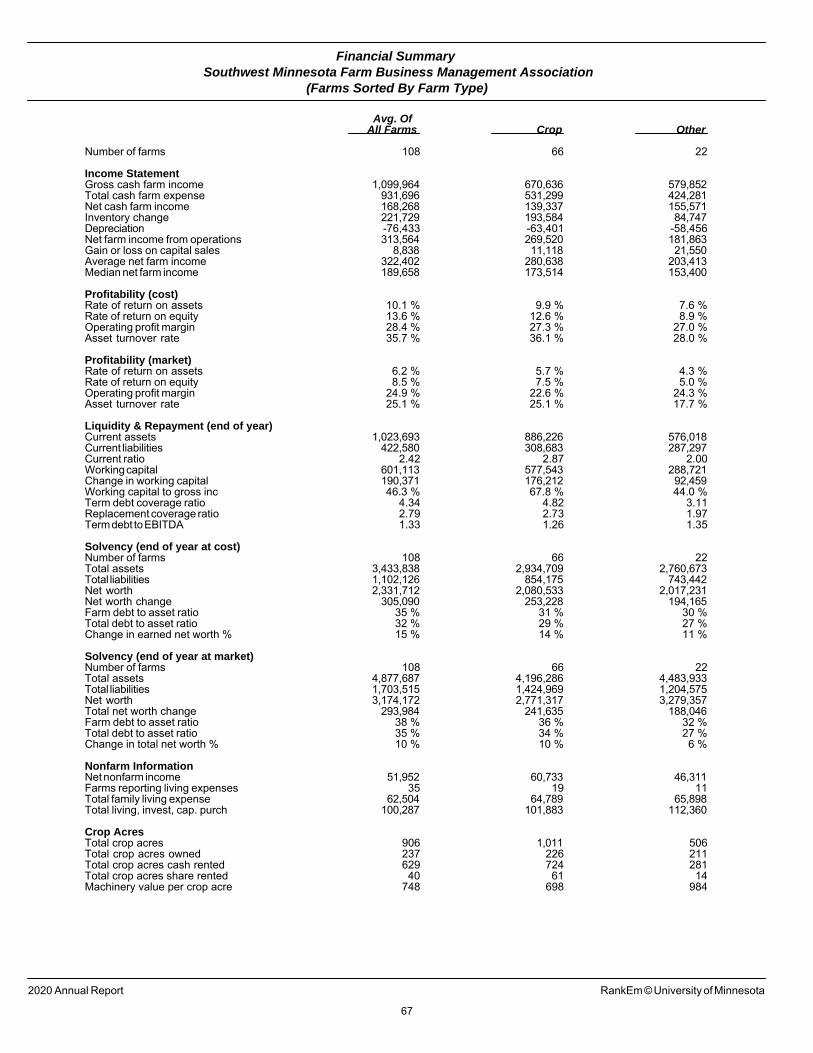
Financial SummarySouthwest Minnesota Farm Business Management Association
(Farms Sorted By Farm Type)
Avg. OfAll Farms Crop Other
Number of farms 108 66 22
Income StatementGross cash farm income 1,099,964 670,636 579,852Total cash farm expense 931,696 531,299 424,281Net cash farm income 168,268 139,337 155,571Inventory change 221,729 193,584 84,747Depreciation -76,433 -63,401 -58,456Net farm income from operations 313,564 269,520 181,863Gain or loss on capital sales 8,838 11,118 21,550Average net farm income 322,402 280,638 203,413Median net farm income 189,658 173,514 153,400
Profitability (cost)Rate of return on assets 10.1 % 9.9 % 7.6 %Rate of return on equity 13.6 % 12.6 % 8.9 %Operating profit margin 28.4 % 27.3 % 27.0 %Asset turnover rate 35.7 % 36.1 % 28.0 %
Profitability (market)Rate of return on assets 6.2 % 5.7 % 4.3 %Rate of return on equity 8.5 % 7.5 % 5.0 %Operating profit margin 24.9 % 22.6 % 24.3 %Asset turnover rate 25.1 % 25.1 % 17.7 %
Liquidity & Repayment (end of year)Current assets 1,023,693 886,226 576,018Current liabilities 422,580 308,683 287,297Current ratio 2.42 2.87 2.00Working capital 601,113 577,543 288,721Change in working capital 190,371 176,212 92,459Working capital to gross inc 46.3 % 67.8 % 44.0 %Term debt coverage ratio 4.34 4.82 3.11Replacement coverage ratio 2.79 2.73 1.97Term debt to EBITDA 1.33 1.26 1.35
Solvency (end of year at cost)Number of farms 108 66 22Total assets 3,433,838 2,934,709 2,760,673Total liabilities 1,102,126 854,175 743,442Net worth 2,331,712 2,080,533 2,017,231Net worth change 305,090 253,228 194,165Farm debt to asset ratio 35 % 31 % 30 %Total debt to asset ratio 32 % 29 % 27 %Change in earned net worth % 15 % 14 % 11 %
Solvency (end of year at market)Number of farms 108 66 22Total assets 4,877,687 4,196,286 4,483,933Total liabilities 1,703,515 1,424,969 1,204,575Net worth 3,174,172 2,771,317 3,279,357Total net worth change 293,984 241,635 188,046Farm debt to asset ratio 38 % 36 % 32 %Total debt to asset ratio 35 % 34 % 27 %Change in total net worth % 10 % 10 % 6 %
Nonfarm InformationNet nonfarm income 51,952 60,733 46,311Farms reporting living expenses 35 19 11Total family living expense 62,504 64,789 65,898Total living, invest, cap. purch 100,287 101,883 112,360
Crop AcresTotal crop acres 906 1,011 506Total crop acres owned 237 226 211Total crop acres cash rented 629 724 281Total crop acres share rented 40 61 14Machinery value per crop acre 748 698 984
2020 Annual Report RankEm © University of Minnesota
67
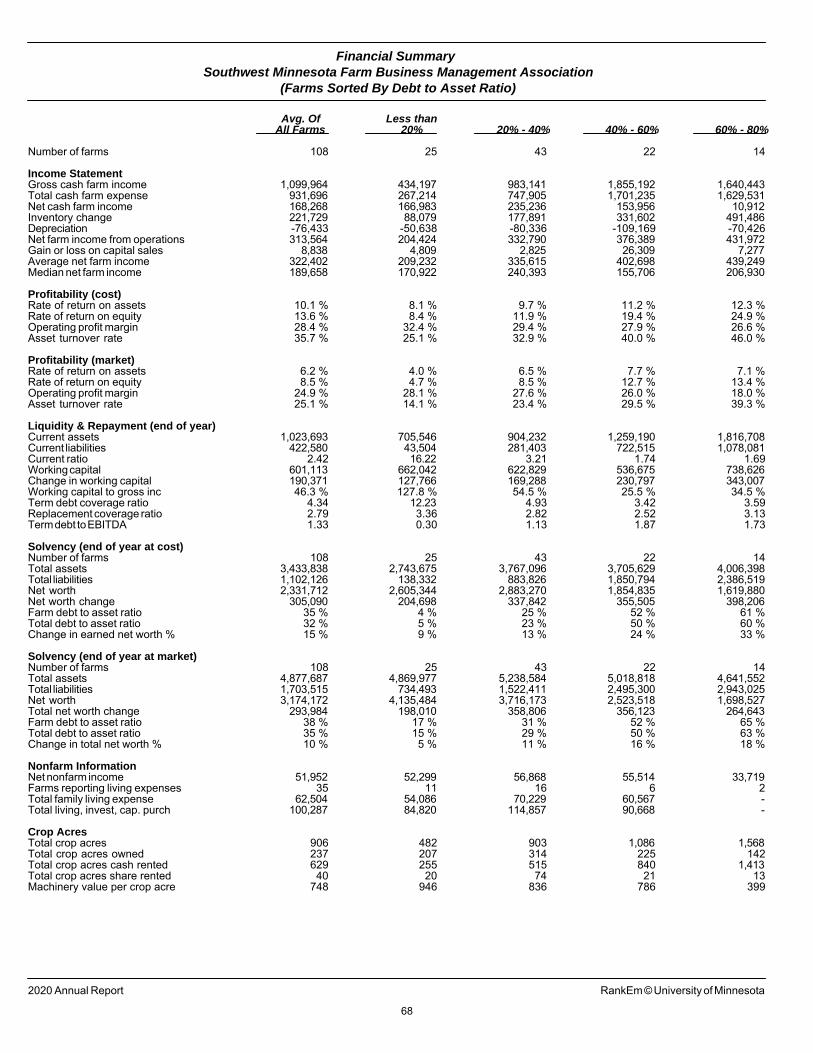
Financial SummarySouthwest Minnesota Farm Business Management Association
(Farms Sorted By Debt to Asset Ratio)
Avg. Of Less thanAll Farms 20% 20% - 40% 40% - 60% 60% - 80%
Number of farms 108 25 43 22 14
Income StatementGross cash farm income 1,099,964 434,197 983,141 1,855,192 1,640,443Total cash farm expense 931,696 267,214 747,905 1,701,235 1,629,531Net cash farm income 168,268 166,983 235,236 153,956 10,912Inventory change 221,729 88,079 177,891 331,602 491,486Depreciation -76,433 -50,638 -80,336 -109,169 -70,426Net farm income from operations 313,564 204,424 332,790 376,389 431,972Gain or loss on capital sales 8,838 4,809 2,825 26,309 7,277Average net farm income 322,402 209,232 335,615 402,698 439,249Median net farm income 189,658 170,922 240,393 155,706 206,930
Profitability (cost)Rate of return on assets 10.1 % 8.1 % 9.7 % 11.2 % 12.3 %Rate of return on equity 13.6 % 8.4 % 11.9 % 19.4 % 24.9 %Operating profit margin 28.4 % 32.4 % 29.4 % 27.9 % 26.6 %Asset turnover rate 35.7 % 25.1 % 32.9 % 40.0 % 46.0 %
Profitability (market)Rate of return on assets 6.2 % 4.0 % 6.5 % 7.7 % 7.1 %Rate of return on equity 8.5 % 4.7 % 8.5 % 12.7 % 13.4 %Operating profit margin 24.9 % 28.1 % 27.6 % 26.0 % 18.0 %Asset turnover rate 25.1 % 14.1 % 23.4 % 29.5 % 39.3 %
Liquidity & Repayment (end of year)Current assets 1,023,693 705,546 904,232 1,259,190 1,816,708Current liabilities 422,580 43,504 281,403 722,515 1,078,081Current ratio 2.42 16.22 3.21 1.74 1.69Working capital 601,113 662,042 622,829 536,675 738,626Change in working capital 190,371 127,766 169,288 230,797 343,007Working capital to gross inc 46.3 % 127.8 % 54.5 % 25.5 % 34.5 %Term debt coverage ratio 4.34 12.23 4.93 3.42 3.59Replacement coverage ratio 2.79 3.36 2.82 2.52 3.13Term debt to EBITDA 1.33 0.30 1.13 1.87 1.73
Solvency (end of year at cost)Number of farms 108 25 43 22 14Total assets 3,433,838 2,743,675 3,767,096 3,705,629 4,006,398Total liabilities 1,102,126 138,332 883,826 1,850,794 2,386,519Net worth 2,331,712 2,605,344 2,883,270 1,854,835 1,619,880Net worth change 305,090 204,698 337,842 355,505 398,206Farm debt to asset ratio 35 % 4 % 25 % 52 % 61 %Total debt to asset ratio 32 % 5 % 23 % 50 % 60 %Change in earned net worth % 15 % 9 % 13 % 24 % 33 %
Solvency (end of year at market)Number of farms 108 25 43 22 14Total assets 4,877,687 4,869,977 5,238,584 5,018,818 4,641,552Total liabilities 1,703,515 734,493 1,522,411 2,495,300 2,943,025Net worth 3,174,172 4,135,484 3,716,173 2,523,518 1,698,527Total net worth change 293,984 198,010 358,806 356,123 264,643Farm debt to asset ratio 38 % 17 % 31 % 52 % 65 %Total debt to asset ratio 35 % 15 % 29 % 50 % 63 %Change in total net worth % 10 % 5 % 11 % 16 % 18 %
Nonfarm InformationNet nonfarm income 51,952 52,299 56,868 55,514 33,719Farms reporting living expenses 35 11 16 6 2Total family living expense 62,504 54,086 70,229 60,567 -Total living, invest, cap. purch 100,287 84,820 114,857 90,668 -
Crop AcresTotal crop acres 906 482 903 1,086 1,568Total crop acres owned 237 207 314 225 142Total crop acres cash rented 629 255 515 840 1,413Total crop acres share rented 40 20 74 21 13Machinery value per crop acre 748 946 836 786 399
2020 Annual Report RankEm © University of Minnesota
68
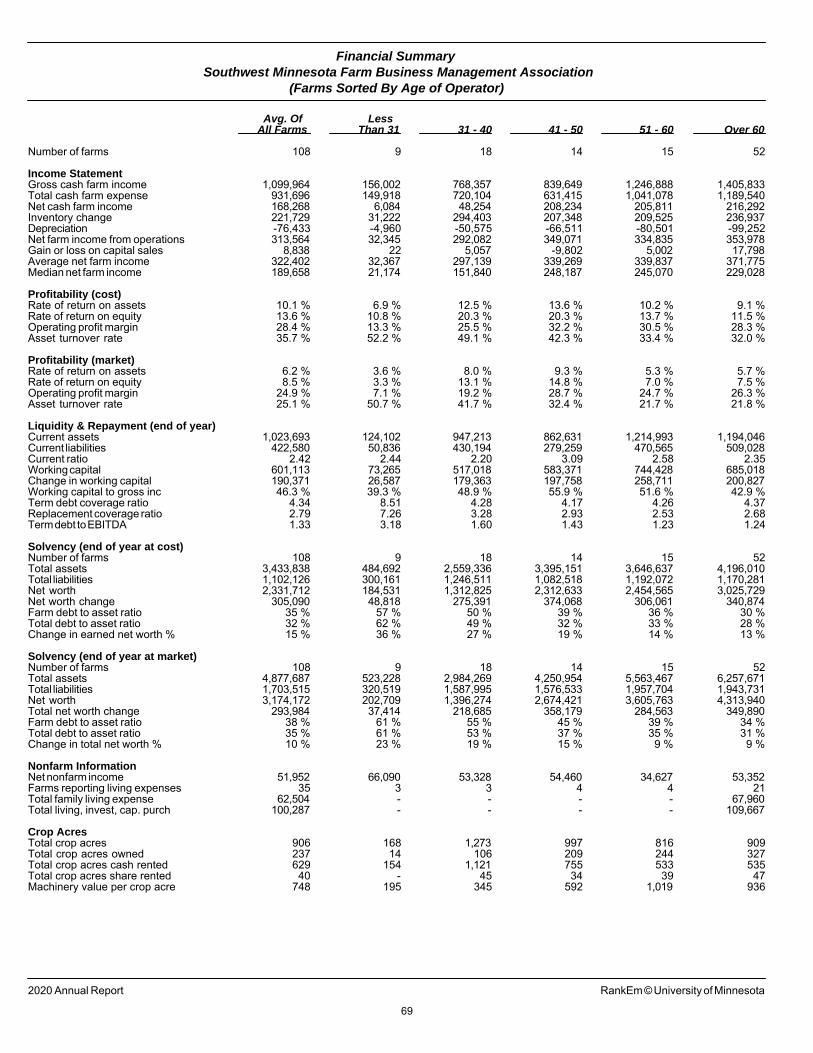
Financial SummarySouthwest Minnesota Farm Business Management Association
(Farms Sorted By Age of Operator)
Avg. Of LessAll Farms Than 31 31 - 40 41 - 50 51 - 60 Over 60
Number of farms 108 9 18 14 15 52
Income StatementGross cash farm income 1,099,964 156,002 768,357 839,649 1,246,888 1,405,833Total cash farm expense 931,696 149,918 720,104 631,415 1,041,078 1,189,540Net cash farm income 168,268 6,084 48,254 208,234 205,811 216,292Inventory change 221,729 31,222 294,403 207,348 209,525 236,937Depreciation -76,433 -4,960 -50,575 -66,511 -80,501 -99,252Net farm income from operations 313,564 32,345 292,082 349,071 334,835 353,978Gain or loss on capital sales 8,838 22 5,057 -9,802 5,002 17,798Average net farm income 322,402 32,367 297,139 339,269 339,837 371,775Median net farm income 189,658 21,174 151,840 248,187 245,070 229,028
Profitability (cost)Rate of return on assets 10.1 % 6.9 % 12.5 % 13.6 % 10.2 % 9.1 %Rate of return on equity 13.6 % 10.8 % 20.3 % 20.3 % 13.7 % 11.5 %Operating profit margin 28.4 % 13.3 % 25.5 % 32.2 % 30.5 % 28.3 %Asset turnover rate 35.7 % 52.2 % 49.1 % 42.3 % 33.4 % 32.0 %
Profitability (market)Rate of return on assets 6.2 % 3.6 % 8.0 % 9.3 % 5.3 % 5.7 %Rate of return on equity 8.5 % 3.3 % 13.1 % 14.8 % 7.0 % 7.5 %Operating profit margin 24.9 % 7.1 % 19.2 % 28.7 % 24.7 % 26.3 %Asset turnover rate 25.1 % 50.7 % 41.7 % 32.4 % 21.7 % 21.8 %
Liquidity & Repayment (end of year)Current assets 1,023,693 124,102 947,213 862,631 1,214,993 1,194,046Current liabilities 422,580 50,836 430,194 279,259 470,565 509,028Current ratio 2.42 2.44 2.20 3.09 2.58 2.35Working capital 601,113 73,265 517,018 583,371 744,428 685,018Change in working capital 190,371 26,587 179,363 197,758 258,711 200,827Working capital to gross inc 46.3 % 39.3 % 48.9 % 55.9 % 51.6 % 42.9 %Term debt coverage ratio 4.34 8.51 4.28 4.17 4.26 4.37Replacement coverage ratio 2.79 7.26 3.28 2.93 2.53 2.68Term debt to EBITDA 1.33 3.18 1.60 1.43 1.23 1.24
Solvency (end of year at cost)Number of farms 108 9 18 14 15 52Total assets 3,433,838 484,692 2,559,336 3,395,151 3,646,637 4,196,010Total liabilities 1,102,126 300,161 1,246,511 1,082,518 1,192,072 1,170,281Net worth 2,331,712 184,531 1,312,825 2,312,633 2,454,565 3,025,729Net worth change 305,090 48,818 275,391 374,068 306,061 340,874Farm debt to asset ratio 35 % 57 % 50 % 39 % 36 % 30 %Total debt to asset ratio 32 % 62 % 49 % 32 % 33 % 28 %Change in earned net worth % 15 % 36 % 27 % 19 % 14 % 13 %
Solvency (end of year at market)Number of farms 108 9 18 14 15 52Total assets 4,877,687 523,228 2,984,269 4,250,954 5,563,467 6,257,671Total liabilities 1,703,515 320,519 1,587,995 1,576,533 1,957,704 1,943,731Net worth 3,174,172 202,709 1,396,274 2,674,421 3,605,763 4,313,940Total net worth change 293,984 37,414 218,685 358,179 284,563 349,890Farm debt to asset ratio 38 % 61 % 55 % 45 % 39 % 34 %Total debt to asset ratio 35 % 61 % 53 % 37 % 35 % 31 %Change in total net worth % 10 % 23 % 19 % 15 % 9 % 9 %
Nonfarm InformationNet nonfarm income 51,952 66,090 53,328 54,460 34,627 53,352Farms reporting living expenses 35 3 3 4 4 21Total family living expense 62,504 - - - - 67,960Total living, invest, cap. purch 100,287 - - - - 109,667
Crop AcresTotal crop acres 906 168 1,273 997 816 909Total crop acres owned 237 14 106 209 244 327Total crop acres cash rented 629 154 1,121 755 533 535Total crop acres share rented 40 - 45 34 39 47Machinery value per crop acre 748 195 345 592 1,019 936
2020 Annual Report RankEm © University of Minnesota
69

70
Appendix I
Whole Farm Analysis Procedures and Measures The whole-farm reports include summary financial statements and measures for all farms included in this report. Rounding of individual items may have caused minor discrepancies between those items and the printed totals which are calculated before rounding. Financial Summary This table summarizes key measures reported in several of the following tables. Income Statement This section summarizes key totals from the Income Statement table. Average Net Farm Income is the mean or average farm earnings of the group calculated on an accrual adjusted basis. Median Net Farm Income is the farm earnings of the median or middle farm in the group. If it is lower than the average, the average earnings are skewed because some farms had much higher earnings than the rest of the group. If it is higher than the average, the average earnings are skewed because some farms had much lower earnings than the rest of the group. Profitability See the Profitability Measures section below for an explanation of these measures. Liquidity and Repayment See the Financial Standards Measures and Liquidity Measures sections below for an explanation of these measures. Solvency This section summarizes key measures from the Balance Sheet reports. Non-farm Information This section summarizes non-farm earnings for all farms and family living withdrawals for those sole proprietors who kept accurate family living records. More detail is included on the Household and Personal Expenses and Non-Farm Summary pages. Crop Acres This section summarizes acres used for cropping from the Crop Production and Marketing table. Financial Standards Measures This table contains the Farm Financial Standards Council’s 21 financial measures for evaluating a farm's financial position and performance.
71
Liquidity Current Ratio is calculated by dividing the total current farm assets by the total current farm liabilities. Working Capital is calculated by subtracting current farm liabilities from current farm assets. Working Capital to Gross Income is Working Capital divided by Gross Revenues (accrual). Solvency Farm Debt to Asset Ratio is calculated by dividing the total farm liabilities by the total farm assets. It measures the proportion of farm assets financed by debt capital. Farm Equity to Asset Ratio is calculated by dividing farm equity or net worth by the total farm assets. It measures the proportion of the farm assets financed by the owner's equity as opposed to debt. This is the opposite of the debt to asset ratio. These two measures always add up to 100% because they describe how total farm assets are financed. Farm Debt to Equity Ratio measures farm debt relative to farm equity. It is calculated by dividing the total farm liabilities by the total farm net worth. The debt to equity ratio measures the amount of borrowed capital being employed for every dollar of equity capital. Profitability Rate of Return on Farm Assets can be thought of as the average interest rate being earned on all investments in the farm or ranch business. If assets are valued at market value, the rate of return on assets can be looked at as the “opportunity cost” of farming versus alternate investments. If assets are valued at cost value, the rate of return on assets more closely represents the actual return on the average dollar invested in the farm. The rate of return on farm assets is calculated as follows: Rate of Return on Assets = Return on Farm Assets ÷ Average Farm Investment, where: Return on Farm Assets = Net Farm Income + Farm Interest - Value of Operator's Labor & Management, and Average Farm Investment = (Beginning Total Farm Assets + Ending Total Farm Assets) ÷ 2. Rate of Return on Farm Equity represents the interest rate being earned on farm net worth. If assets are valued at market value, this return can be compared to returns available if the assets were liquidated and invested in alternate investments. If assets are valued at cost value, this more closely represents the actual return on the funds that have been invested or retained in the business. The rate of return on farm equity is calculated as follows: Rate of Return on Equity = Return on Farm Equity ÷ Average Farm Net Worth, where: Return on Farm Equity = Net Farm Income - Value of Operator's Labor & Management, and Average Farm Net Worth = (Beginning Farm Net Worth + Ending Farm Net Worth) ÷ 2. Operating Profit Margin is a measure of the operating efficiency of the business. It is calculated as follows: Operating Profit Margin = Return to Farm Assets ÷ Value of Farm Production. If expenses are held in line relative to the value of output produced, the farm will have a healthy operating profit margin. A low net profit margin may be caused by low prices, high operating expenses, or inefficient production.
72
Net Farm Income represents the returns to unpaid labor, management, and equity capital invested in the business. EBITDA is Earnings Before Interest, Taxes, Depreciation and Amortization. It is Net Farm Income from Operations from the income statement plus interest expense and depreciation expense. This measure is common in commercial financial analysis but is not commonly used in agriculture. Repayment Capacity Capital Debt Repayment Capacity is Net Farm Income From Operations plus Depreciation, Personal Income, and Interest on Term Debt minus Family Living/Owner Withdrawals, Payments on Personal Debt and Income Taxes Paid. This represents total earnings available for debt repayment and cash capital replacement. Capital Debt Repayment Margin is Capital Debt Repayment Capacity minus Scheduled Term Debt Payments. This is the amount by which earnings available for debt repayment exceeded payments due. Replacement Margin is Capital Debt Repayment Margin minus Cash Replacement Allowance. This is the amount by which earnings available for debt repayment and replacement exceed payments due and cash replacement needs. Term Debt Coverage Ratio measures whether the business generated enough income to cover term debt payments. It is calculated by dividing the funds generated by the business for debt repayment (net cash farm income + non-farm income + interest expense - family living expense - income taxes) by total term debt payments (annual scheduled principal and interest payments on intermediate and long term debt). A ratio less than 1.0 indicates that the business did not generate sufficient cash to meet scheduled payments in the past year. A ratio greater than 1.0 indicates the business generated enough cash to pay all term debt payments. Replacement Coverage Ratio measures whether the business generated enough income to cover scheduled term debt payments plus estimated cash capital replacement needs. A ratio less than 1.0 indicates that the business did not generate sufficient income to meet replacement needs. A ratio greater than 1.0 indicates the business generated enough income to pay all term debt payments and cover an allowance for capital replacement. Efficiency Asset Turnover Rate is a measure of efficiency in using capital. It is calculated as follows: Asset Turnover Rate = Value of Farm Production ÷ Total Farm Assets. The last four ratios reflect the distribution of gross income to cover operating expenses and generate farm income. The sum of the operating expense ratio, the depreciation expense ratio, and the interest expense ratio equals the percent of gross income used to pay business expenses. The amount remaining is net farm income. The gross farm income used to calculate these ratios is the accrual gross farm income. Operating Expense Ratio is calculated as (Total Farm Operating Expense - Farm Interest Expense) ÷ Gross Farm Income. This ratio indicates the percent of the gross farm income that
73
was used to pay operating expenses. Total farm operating expense is the accrual total operating expense. Depreciation Expense Ratio is calculated as Depreciation ÷ Gross Farm Income. This ratio indicates the percent of the gross farm income that was used to cover depreciation and other capital adjustments. Interest Expense Ratio is calculated as Farm Interest Expense ÷ Gross Farm Income. This ratio indicates the percent of the gross farm income used for farm interest expenses. This is the same ratio as the accrual interest as a percent of income from the Liquidity table. Net Farm Income Ratio is calculated as Net Farm Income ÷ Gross Farm Income. This ratio indicates the percent of the gross farm income that remained after all expenses. Farm Income Statement The Farm Income Statement is a summary of income, expenses, and resultant profit or loss from farming operations during the calendar year. The first section lists cash farm income from all sources. The second section lists cash expenses. “Interest” includes only interest actually paid. No opportunity charges on farm equity capital or unpaid labor are included. The difference between Gross Cash Farm Income and Total Cash Expense is the Net Cash Farm Income. This is net farm income on a cash basis. The third and fourth sections deal with noncash changes in the farm business. The Inventory Changes and Depreciation sections are used to convert the cash income statement (Net Cash Farm Income) derived from the first two sections into an accrual income statement. The resulting “Net Farm Income” represents the return to the operator's and family's unpaid labor, management, and equity capital (net worth). In other words, it represents the return to all of the resources which are owned by the farm family and, hence, not purchased or paid a wage. However, it does not include any asset appreciation, debt forgiveness or asset repossessions. Profitability Measures
Profitability is measured using assets valued first at cost and then at market. The reports include five measures of profit followed by the values used to calculate the measures. Net Farm Income is repeated from the Farm Income Statement report. When assets are valued at market, it includes the change in market valuation of capital for the year. Rate of Return on Assets is the Return to Farm Assets divided by Average Farm Assets. Rate of Return on Equity is the Return to Farm Equity divided by Average Farm Equity. Operating Profit Margin is the Return to Farm Assets divided by Value of Farm Production. Asset Turnover Rate is the Value of Farm Production divided by Average Farm Assets. Farm Interest Expense is the accrued interest cost so it will be different from the cash interest paid shown in the Farm Income Statement.
74
Value of Operator's Labor and Management is its opportunity cost. It is assigned by farm within suggested guidelines.
Return on Farm Assets is calculated by adding Farm Interest Expense and Net Farm Income and then subtracting the Value of Operator's Labor and Management.
Average Farm Assets is the average of beginning and ending total farm assets for all farms, not just those included in the Balance Sheet report.
Return to Farm Equity is calculated by subtracting the Value of Operator's Labor and Management from Net Farm Income.
Average Farm Equity is the average of beginning and ending farm net worth.
Value of Farm Production is gross farm income minus feeder livestock and feed purchased and adjusted for inventory changes in crops, market livestock and breeding livestock.
Liquidity and Repayment Capacity Measures
Current Ratio is total Current Assets divided by total Current Liabilities.
Working Capital is total Current Assets minus total Current Liabilities.
Working Capital to Gross Income is Working Capital divided by Gross Revenues (accrual).
Current Assets are taken from the ending balance sheet and include all assets that will be sold or used up in production within one business year.
Current Liabilities are taken from the ending balance sheet and include all loans and other debt due to be repaid within one business year. Principal due within twelve months on intermediate and long-term loans is included.
Gross Revenues (accrual) is gross cash farm income from the income statement adjusted for inventory changes in crops and feed, market livestock, accounts receivable, hedging accounts, breeding livestock and other income related inventories.
Net Farm Income from Operations is from the Income Statement.
Depreciation is the total depreciation from the Income Statement. It is added as a source of repayment because it is a non-cash expense that was subtracted to arrive at Net Farm Income From Operations.
Personal Income is the average for all farms, not including Gifts and Inheritances.
Family Living/Owner Withdrawals is the amount of owner withdrawals for family living, partnership withdrawals, and corporate dividends. Reported withdrawals are adjusted to include any discrepancy with actual cash disappearance.
75
Payments on personal debt is the total principal payments made during the year on all non-farm loans.
Income Taxes Paid are total federal, state, and social security taxes paid during the year on farm and personal earnings.
Interest on Term Debt is the amount of interest paid on intermediate and long-term loans during the year. Interest is added as a source of repayment because it was previously subtracted to arrive at Net Farm Income from Operations.
Capital Debt Repayment Capacity is Net Farm Income From Operations plus Depreciation, Personal Income, and Interest on Term Debt minus Family Living/Owner Withdrawals, Payments on Personal Debt and Income Taxes Paid. This represents total earnings available for debt repayment and cash capital replacement.
Scheduled Term Debt Payments is the scheduled amount of principal and interest payments due on farm intermediate and long-term loans from the beginning balance sheet.
Capital Debt Repayment Margin is Capital Debt Repayment Capacity minus Scheduled Term Debt Payments. This is the amount by which earnings available for debt repayment exceeded payments due.
Cash Replacement Allowance is the estimated amount of cash needed to cover the portion of capital replacement needs that normally come from cash flow. It is estimated for each operator based on their financial structure.
Replacement Margin is Capital Debt Repayment Margin minus Cash Replacement Allowance. This is the amount by which earnings available for debt repayment and replacement exceed payments due and cash replacement needs.
Term Debt Coverage Ratio is Capital Debt Repayment Capacity divided by Scheduled Term Debt Payments. This is how many times scheduled payments are covered by repayment capacity.
Replacement Coverage Ratio is Capital Debt Repayment Capacity divided by the total of Scheduled Term Debt Payments and the Cash Replacement Allowance. This represents how many times scheduled payments and cash replacement needs are covered by repayment capacity.
Balance Sheets at Cost and Market Values
These tables include all farm and personal assets and liabilities reported by these farms on their beginning and ending balance sheets. Government crop loans are treated consistently as loans on these tables, meaning that the full asset value is included as an asset and total accrued interest and outstanding principal balances are included as liabilities. Capital assets are valued at original purchase price minus economic depreciation on the Cost Value table. Assets are valued at a conservative market value on the Market Value table. Deferred liabilities are included on the Market Value table. Deferred liabilities are an estimate of the taxes that would be due if the business was liquidated on the date of the balance sheet.
76
Statement of Cash Flows This table reports the sources from which cash was available or obtained and where that cash was used or remains at the end of the year. Crop Production and Marketing Summary This table contains three sections. The first section reports average acreage by tenure and general use. The next two sections show average price received from cash sales and average yields for major crops.
Household and Personal Expenses For those farms that kept records, the household and personal expenses are summarized in this table. Since not all farms keep these records, the number of farms may be different for each group. Averages are determined by the number of farms keeping these records. Operator and Labor Information This table has four sections. The first reports the averages for the number of operators per farm, the operator's age, and the number of years farming. The second section reports various measures and results per operator compared to per farm in other reports. The third section reports the amount of labor used and the returns to that labor. Total Unpaid Labor Hours and Total Hired Labor Hours are based on farmers’ estimates of labor use. No labor records are kept for unpaid labor. Value of Farm Production/Hour is the Value of Farm Production divided by Total Labor Hours per Farm. Net Farm Income/Unpaid Hour is Net Farm Income divided by Total Unpaid Labor Hours. The fourth section reports the number of partnerships and withdrawals in each grouping. Non-farm Summary
This table reports the income from non-farm sources which is included in a farmer's total net income. Not all farms have non-farm income, but the figure reported is the average over all farms not just those reporting non-farm income. Also reported are the beginning and ending values for non-farm assets for all farms (not just sole proprietors).
77

78
Appendix II
Crop Enterprise Analysis Procedures and Measures The Crop Enterprise Analysis tables show the profitability of each crop enterprise produced by five or more farms. Gross Return is the average Yield multiplied by the Value Per Unit plus any other production or income related to the crop. Value Per Unit for cash crops is the average sales price for crops sold before the end of the year and the average ending inventory value for crops remaining unsold. For feed crops, it is the estimated harvest-time value. LDP payments and other commodity-specific income are added to estimate the total value received for crop production. Direct Expenses include expenses that are directly related to the production of the specific crop. Most direct expenses are directly assigned to production of the crop and simply divided by acres. Some, such as Fuel and Oil and Repairs, which are difficult to assign directly to specific fields or crops, are determined by allocating the total annual expense across all enterprises using allocation factors entered for each crop. Overhead Expenses are also determined by allocating the total annual expense across all enterprises using allocation factors entered for each crop. Net Return per Acre is the Gross Return per Acre minus Total Direct and Overhead Expenses. Net return with government payments is Net Return per Acre plus Government Payments. Government Payments includes only direct payments and counter-cyclical payments. Payments that are directly attached to production of the crop, such as LDP and disaster payments are included in Gross Return. Because direct government payments have been decoupled from actual production, these payments are generally allocated to all crops excluding vegetables and pasture. This is done for each farm by allocating the direct payments from the whole farm to these crops. Net Return over Labor and Management is calculated by allocating the farmer's charge for unpaid labor and management across all enterprises and subtracting it from Net Return with Government Payments. Cost of Production is calculated by dividing the total expense for each category by the yield per acre. Total Expense Less Government and Other Income is total expense minus government payments, income from secondary products, and other income, divided by yield per acre. Machinery Cost Per Acre is the sum of fuel and oil, repairs, custom hire expense, machinery lease payments, machinery depreciation, and interest on intermediate debt divided by acres. Estimated Labor Hours Per Acre is calculated by allocating the farmer's estimate of total operator and hired labor hours for the year across all enterprises.
79

Rounding of individual items for the report may have caused minor discrepancies with the calculated totals. If fewer than 5 farms have a certain crop enterprise, that information is not reported. If there are fewer than 25 farms, the high and low groups are not reported.
80
Appendix III
Livestock Enterprise Analysis Procedures and Measures
The Livestock Enterprise Analysis tables show the profitability of each livestock enterprise produced by five or more farms. Gross Margin includes product and livestock sales, cull sales, the value of offspring transferred out of the enterprise, the value of inventory change from beginning to end of year, and any other income assigned to the enterprise. Livestock purchases and the value of animals transferred in from other enterprises are subtracted. Direct Expenses include expenses that are directly related to the specific livestock enterprise. Feed and most other direct expenses are directly assigned based on farm records. Some, such as Fuel and Oil and Repairs, which are difficult to assign directly to enterprises, are determined by allocating the total annual expense across all enterprises using allocation factors entered for each farm. Overhead Expenses are also determined by allocating the total annual expense across all enterprises using allocation factors entered for each farm. Net Return is the Gross Return minus Total Direct and Overhead Expenses. Net Return over Labor and Management is calculated by allocating the farmer's charge for unpaid labor and management across all enterprises and subtracting it from Net Return. Estimated Labor Hours is calculated by allocating the farmer's estimate of total operator and hired labor hours for the year across all enterprises. Cost of Production is calculated by dividing the total expense for each category by Total Production. For grow/finish enterprises, the Purchases and Transfers In are included in direct expense. Cull sales, other offspring sales, and any other miscellaneous income are subtracted and replacement purchases and transfers in are added to arrive at the cost with other revenue adjustments. With Labor and Management is the cost with other revenue adjustments plus the producer’s charge for operator’s labor and management. This is the breakeven price for the primary product to provide a return for operator labor and management. The last section of each livestock table contains both economic and technical efficiency measures. Lbs. feed per lb. of gain is the pounds of total feed divided by Total production. For grains, these pounds per bushel are used: corn, 56; oats, 32; barley, 48; grain sorghum, 56; wheat, 60; and millet, 48. For these forages, the units are converted to pounds and then adjusted by these factors: alfalfa haylage, 0.5; corn silage, 0.33; oatlage, 0.5; sorghum silage, 0.33; and small grain silage, 0.33.
81

The calving and weaning percentages are calculated as the number of calves which are calved and weaned, respectively, divided by the number of cows which are supposed to bear young. Rounding of individual items for the report may have caused minor discrepancies with the calculated totals. If fewer than 5 farms have a certain livestock enterprise, that information is not reported. If there are fewer than 25 farms, the high and low groups are not reported.
82
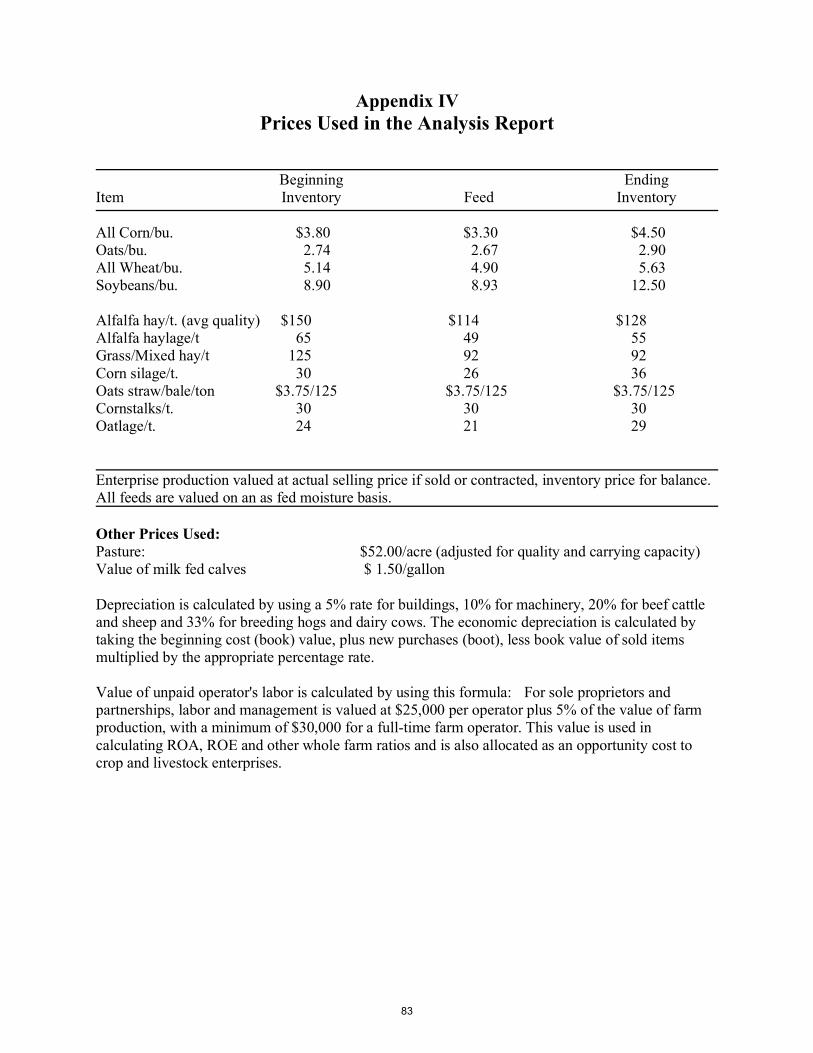
Appendix IV Prices Used in the Analysis Report Beginning Ending Item Inventory Feed Inventory All Corn/bu. $3.80 $3.30 $4.50 Oats/bu. 2.74 2.67 2.90 All Wheat/bu. 5.14 4.90 5.63 Soybeans/bu. 8.90 8.93 12.50 Alfalfa hay/t. (avg quality) $150 $114 $128 Alfalfa haylage/t 65 49 55 Grass/Mixed hay/t 125 92 92 Corn silage/t. 30 26 36 Oats straw/bale/ton $3.75/125 $3.75/125 $3.75/125 Cornstalks/t. 30 30 30 Oatlage/t. 24 21 29 Enterprise production valued at actual selling price if sold or contracted, inventory price for balance. All feeds are valued on an as fed moisture basis. Other Prices Used: Pasture: $52.00/acre (adjusted for quality and carrying capacity) Value of milk fed calves $ 1.50/gallon Depreciation is calculated by using a 5% rate for buildings, 10% for machinery, 20% for beef cattle and sheep and 33% for breeding hogs and dairy cows. The economic depreciation is calculated by taking the beginning cost (book) value, plus new purchases (boot), less book value of sold items multiplied by the appropriate percentage rate. Value of unpaid operator's labor is calculated by using this formula: For sole proprietors and partnerships, labor and management is valued at $25,000 per operator plus 5% of the value of farm production, with a minimum of $30,000 for a full-time farm operator. This value is used in calculating ROA, ROE and other whole farm ratios and is also allocated as an opportunity cost to crop and livestock enterprises.
83

84
The University of Minnesota is committed to the policy that all persons shall have equal access to its programs, facilities, and employment without regard to race, color, creed, religion, national origin, sex, age, marital status, disability, public assistance status, veteran status, or sexual orientation.
Information on other titles in this series may be obtained from Waite Library, University of Minnesota, Department of Applied Economics, 1994 Buford Avenue, 232 Ruttan Hall, St. Paul, MN 55108-6040, U.S.A. The Waite Library e-mail address is: [email protected]. This paper is available electronically from AgEcon Search at http://ageconsearch.umn.edu.
The entire report is available at: z.umn.edu/2020SWReport
This material is based upon work supported by USDA/NIFA under Award Number 2020-38504-32480. This is a National Farm Business Management and Benchmarking Grant from the USDA National Institute of Food and Agriculture.
85