Embed Size (px)
Citation preview

Sovereign spreads in the euro area. Which Prospects for a Eurobond?
Carlo A. Favero, A. Missale
QFIN Colloquia
April 2011
The Relevant Stylized Facts
Assess the degree of integration in the European government bond market by examining the behavior of interest rate differentials.
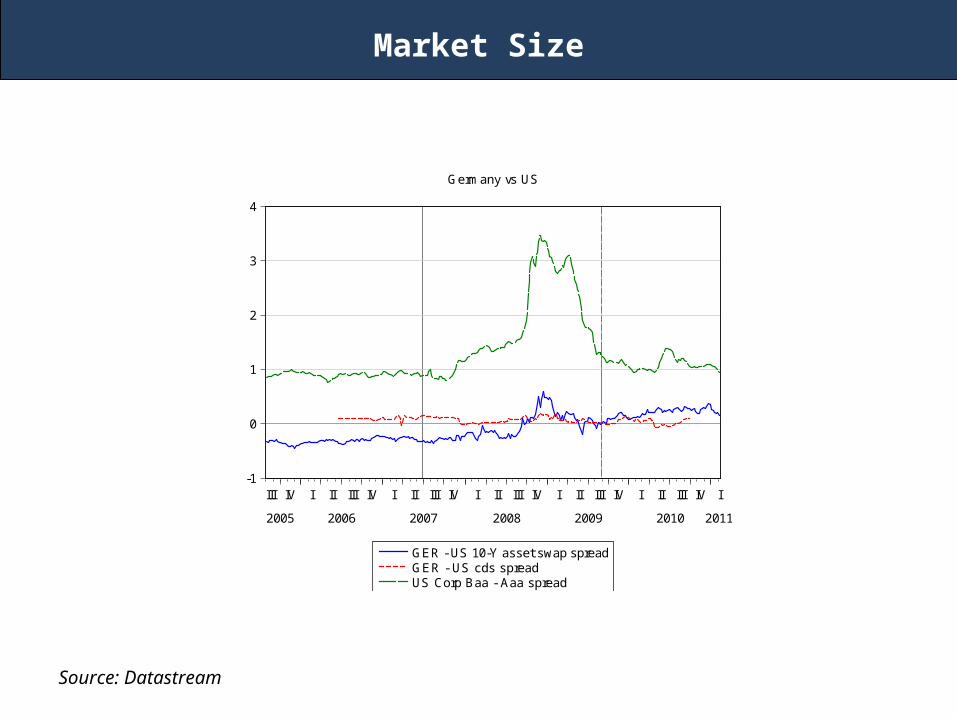
Examine the potential for a larger European market to better compete with the US market, by considering the liquidity premium on German relative to US bonds.
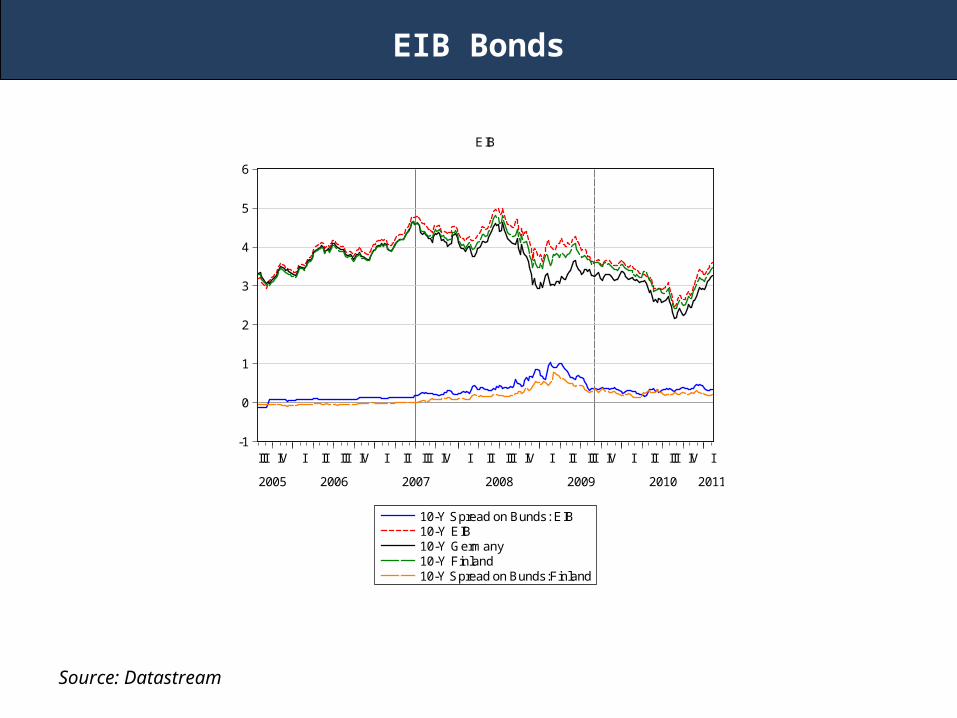
Look at the interest rate on bonds issued by the European Investment Bank (EIB) to evaluate the performance of a bond issued by an EU Institution.
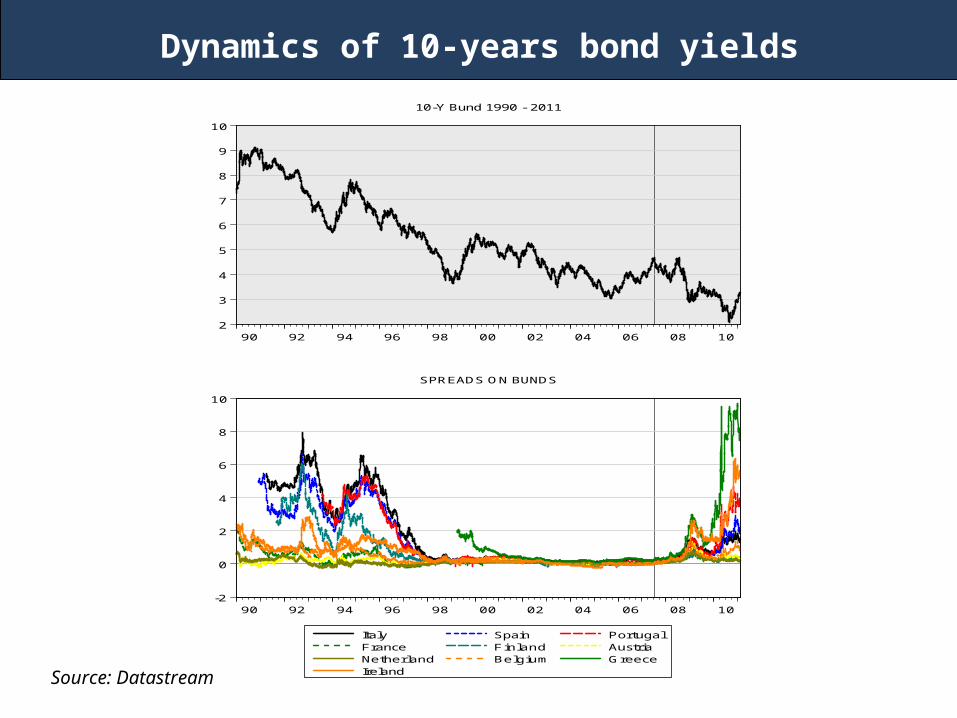
Dynamics of 10-years bond yields
Source: Datastream
2
3
4
5
6
7
8
9
10
90 92 94 96 98 00 02 04 06 08 10
10-Y Bund 1990 - 2011
-2
0
2
4
6
8
10
90 92 94 96 98 00 02 04 06 08 10
Italy Spain PortugalFrance Finland AustriaNetherland Belgium GreeceIreland
SPREADS ON BUNDS
Spread of 10-years government bond yields vs Bund
After only one year from the introduction of the European Monetary Union (EMU) in 1998 the market for fixed-income government securities was taking the form of an almost perfectly integrated market
The spreads between high yield Member States (Portugal, Italy, Spain) moved from the high peak of 300 basis points in the pre-EMU to less than 30 basis points of post-EURO
The differentials among different national bonds remained low, although not negligible, for almost ten years
With the burst of the subprime financial and the euro debt crisis the differential become sizable
Credit and Liquidity Risks and Expectations of Exchange Rate Depreciation
Interest rates of government bonds (same maturity and currency) may differ because of different credit and liquidity risks and expectations of exchange rate depreciation
Credit risk depends on the probability that an issuer may not honour its obligations (default risk premia). This is related to fiscal fundamentals of each country (deficit and debt) and to GDP growth rates, but also to external factors (global risks, “flight to quality” effects)
Liquidity risk depends on the total amount of volumes traded in the market, transaction costs and market efficiency
Expectations of exchange rate depreciation were the main components of spreads in the pre-euro era. They have disappeared in the first decade of the second millenium and they are currently dominated by Credit risk concerns
Spread of 10-years government bond yields vs Bund
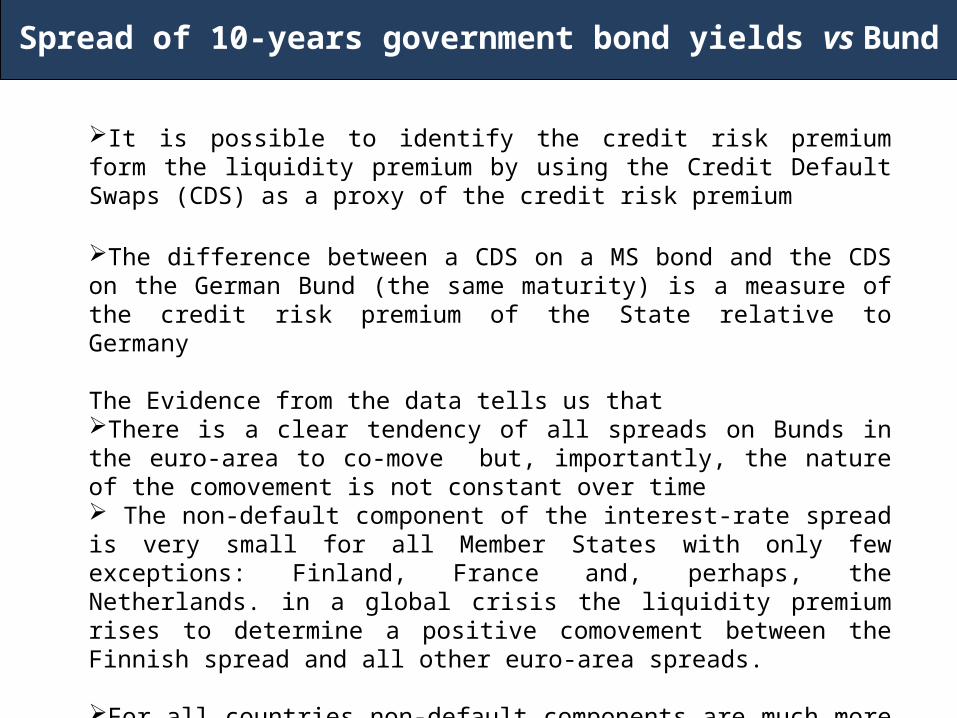
It is possible to identify the credit risk premium form the liquidity premium by using the Credit Default Swaps (CDS) as a proxy of the credit risk premium
The difference between a CDS on a MS bond and the CDS on the German Bund (the same maturity) is a measure of the credit risk premium of the State relative to Germany
The Evidence from the data tells us that There is a clear tendency of all spreads on Bunds in the euro-area to co-move but, importantly, the nature of the comovement is not constant over time The non-default component of the interest-rate spread is very small for all Member States with only few exceptions: Finland, France and, perhaps, the Netherlands. in a global crisis the liquidity premium rises to determine a positive comovement between the Finnish spread and all other euro-area spreads.
For all countries non-default components are much more likely to reflect liquidity risk rather than expectations of depreciation of the exchange rates.
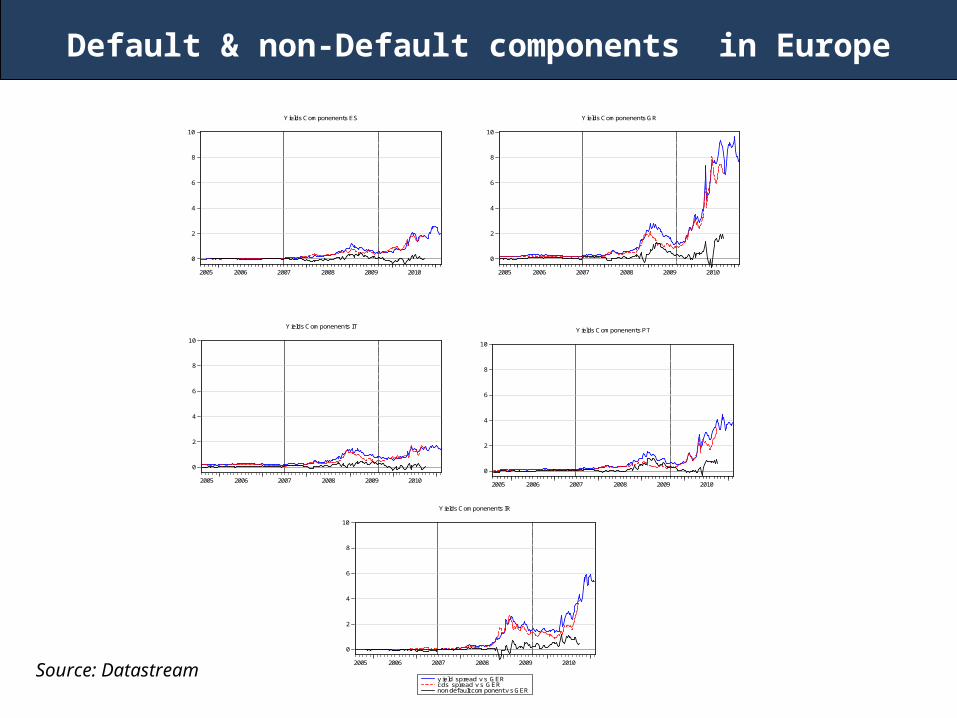
Default & non-Default components in Europe
Source: Datastream
0
2
4
6
8
10
2005 2006 2007 2008 2009 2010
Yields Componenents ES
0
2
4
6
8
10
2005 2006 2007 2008 2009 2010
Yields Componenents GR
0
2
4
6
8
10
2005 2006 2007 2008 2009 2010
y ield spread v s GERcds spread v s GERnon default component v s GER
Yields Componenents IR
0
2
4
6
8
10
2005 2006 2007 2008 2009 2010
Yields Componenents IT
0
2
4
6
8
10
2005 2006 2007 2008 2009 2010
Yields Componenents PT
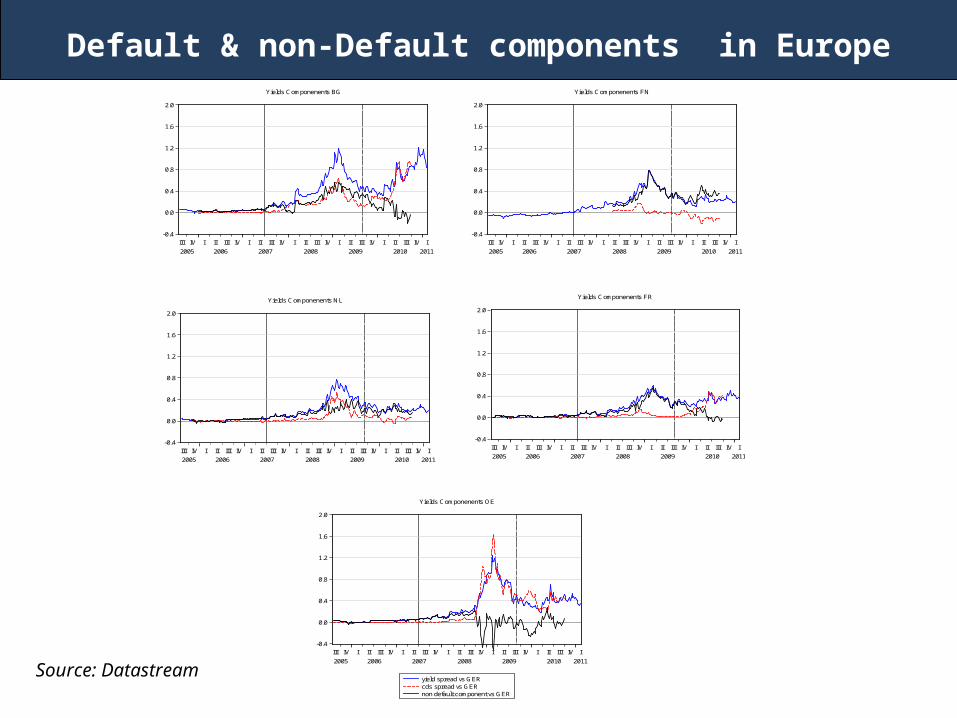
Default & non-Default components in Europe
Source: Datastream
-0.4
0.0
0.4
0.8
1.2
1.6
2.0
III IV I II III IV I II III IV I II III IV I II III IV I II III IV I
2005 2006 2007 2008 2009 2010 2011
Yields Componenents BG
-0.4
0.0
0.4
0.8
1.2
1.6
2.0
III IV I II III IV I II III IV I II III IV I II III IV I II III IV I
2005 2006 2007 2008 2009 2010 2011
Yields Componenents FN
-0.4
0.0
0.4
0.8
1.2
1.6
2.0
III IV I II III IV I II III IV I II III IV I II III IV I II III IV I
2005 2006 2007 2008 2009 2010 2011
Yields Componenents FR
-0.4
0.0
0.4
0.8
1.2
1.6
2.0
III IV I II III IV I II III IV I II III IV I II III IV I II III IV I
2005 2006 2007 2008 2009 2010 2011
Yields Componenents NL
-0.4
0.0
0.4
0.8
1.2
1.6
2.0
III IV I II III IV I II III IV I II III IV I II III IV I II III IV I
2005 2006 2007 2008 2009 2010 2011
yield spread vs GERcds spread vs GERnon default component vs GER
Yields Componenents OE
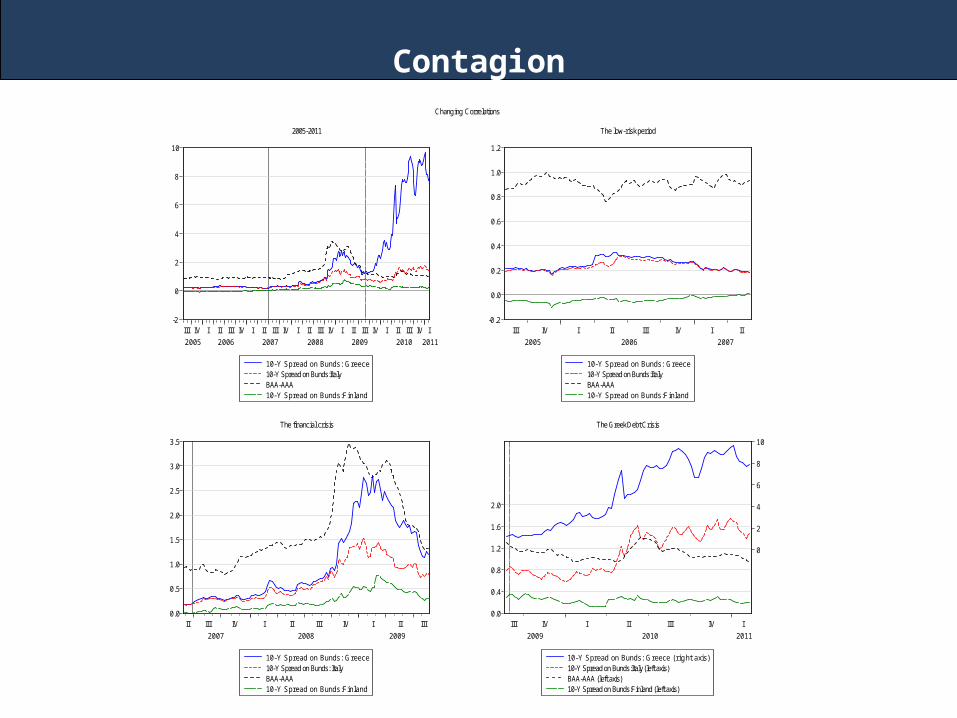
Contagion
-2
0
2
4
6
8
10
III IV I II III IV I II III IV I II III IV I II III IV I II III IV I
2005 2006 2007 2008 2009 2010 2011
10-Y Spread on Bunds: Greece10-Y Spread on Bunds:ItalyBAA-AAA10-Y Spread on Bunds:Finland
2005-2011
-0.2
0.0
0.2
0.4
0.6
0.8
1.0
1.2
III IV I II III IV I II
2005 2006 2007
10-Y Spread on Bunds: Greece10-Y Spread on Bunds:ItalyBAA-AAA10-Y Spread on Bunds:Finland
The low-risk period
0.0
0.5
1.0
1.5
2.0
2.5
3.0
3.5
II III IV I II III IV I II III
2007 2008 2009
10-Y Spread on Bunds: Greece10-Y Spread on Bunds: ItalyBAA-AAA10-Y Spread on Bunds:Finland
The financial crisis
0.0
0.4
0.8
1.2
1.6
2.0
0
2
4
6
8
10
III IV I II III IV I
2009 2010 2011
10-Y Spread on Bunds: Greece ( r ight axis)10-Y Spread on Bunds:Italy (left axis)BAA-AAA (left axis)10-Y Spread on Bunds:Finland (left axis)
The Greek Debt Crisis
Changing Correlations
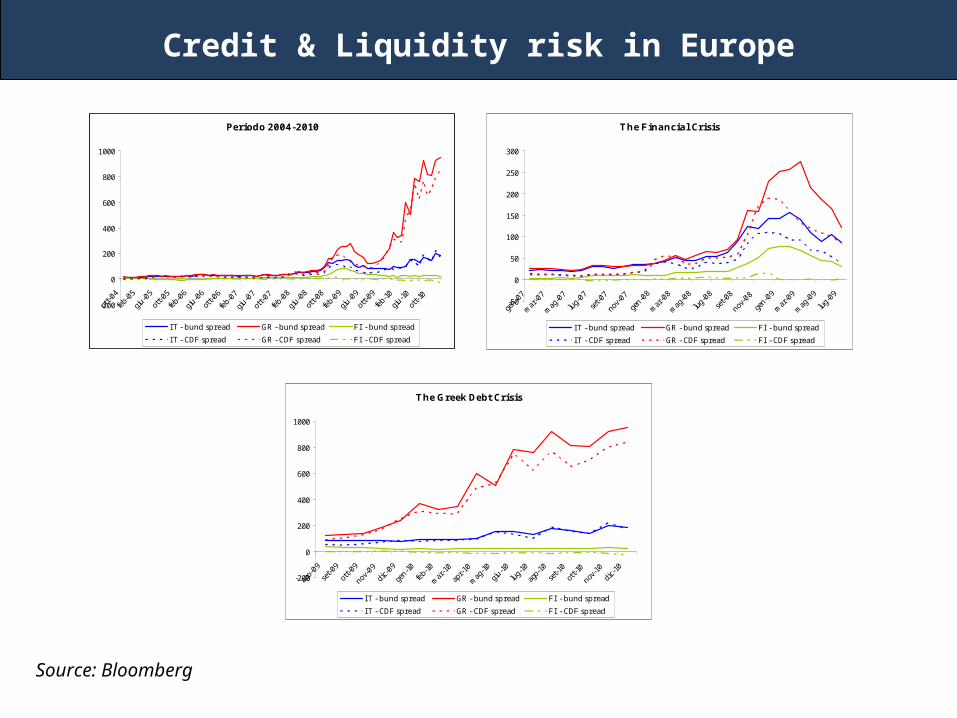
Credit & Liquidity risk in Europe
Periodo 2004-2010
-200
0
200
400
600
800
1000
ott-0
4
feb-
05
giu-0
5
ott-0
5
feb-
06
giu-0
6
ott-0
6
feb-
07
giu-0
7
ott-0
7
feb-
08
giu-0
8
ott-0
8
feb-
09
giu-0
9
ott-0
9
feb-
10
giu-10
ott-1
0
IT - bund spread GR - bund spread FI - bund spread
IT - CDF spread GR - CDF spread FI - CDF spread
Source: Bloomberg
The Financial Crisis
-50
0
50
100
150
200
250
300
gen-
07
mar
-07
mag
-07
lug-
07
set-0
7
nov-07
gen-
08
mar
-08
mag
-08
lug-
08
set-0
8
nov-08
gen-
09
mar
-09
mag
-09
lug-
09
IT - bund spread GR - bund spread FI - bund spread
IT - CDF spread GR - CDF spread FI - CDF spread
The Greek Debt Crisis
-200
0
200
400
600
800
1000
ago-
09
set-0
9
ott-0
9
nov-09
dic-09
gen-
10
feb-
10
mar
-10
apr-1
0
mag
-10
giu-10
lug-
10
ago-
10
set-1
0
ott-1
0
nov-10
dic-10
IT - bund spread GR - bund spread FI - bund spread
IT - CDF spread GR - CDF spread FI - CDF spread
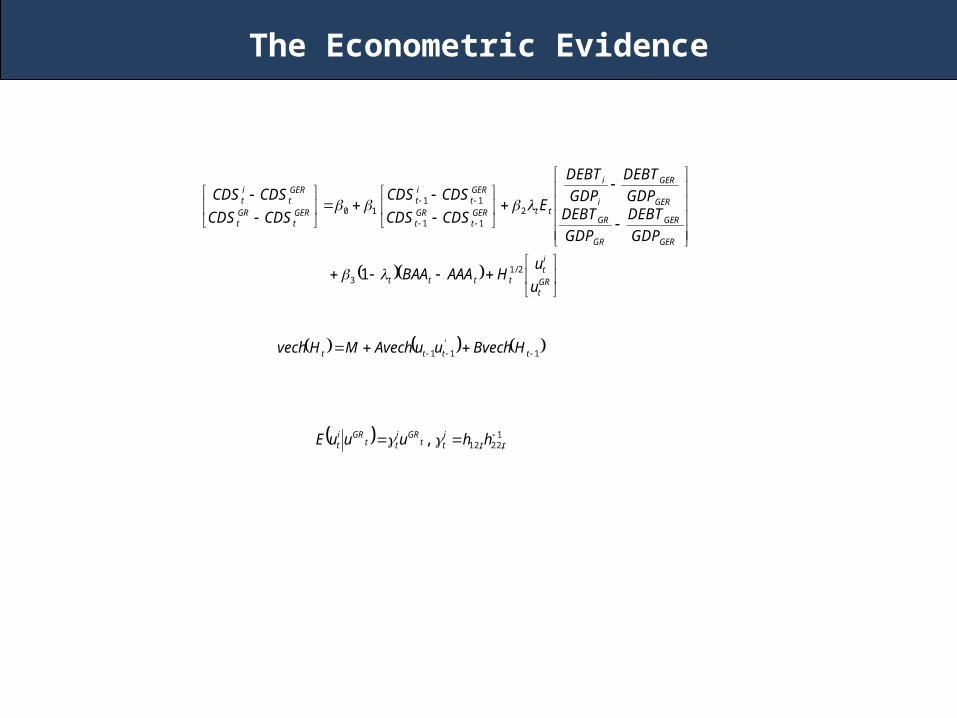
The Econometric Evidence
GRt
it
tttt
GER
GER
GR
GR
GER
GER
i
i
ttGERt
GRt
GERt
it
GERt
GRt
GERt
it
u
uHAAABAA
GDP
DEBT
GDP
DEBTGDP
DEBT
GDP
DEBT
ECDSCDS
CDSCDS
CDSCDS
CDSCDS
2/13
2
11
1110
1
1'
11 tttt HBvechuuAvechMHvech
1,22,12, tt
itt
GRitt
GRit hhuuuE
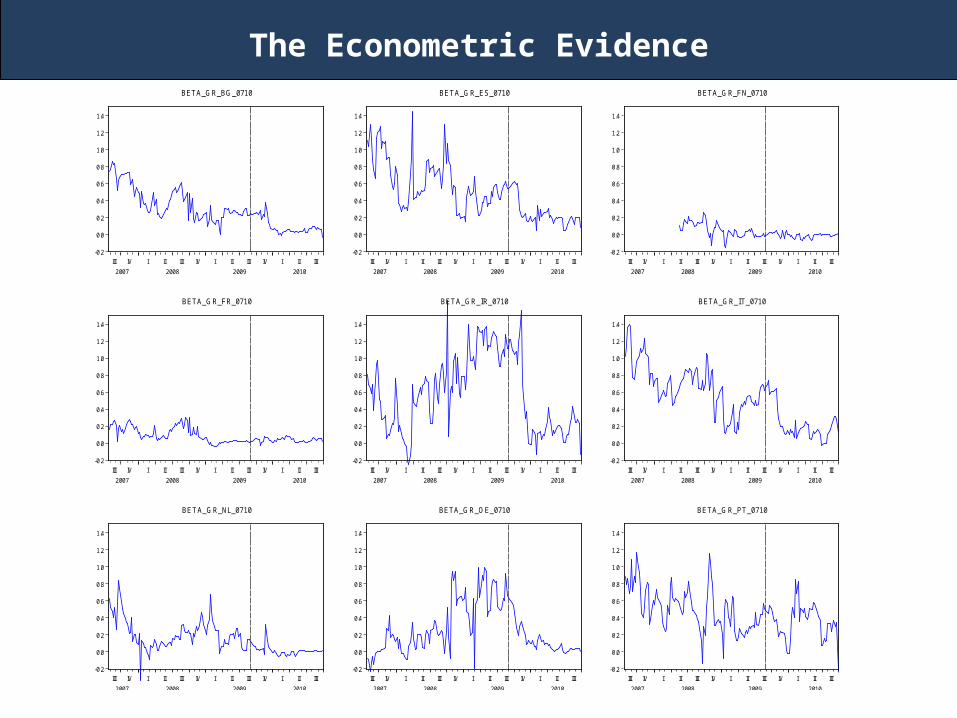
The Econometric Evidence
-0.2
0.0
0.2
0.4
0.6
0.8
1.0
1.2
1.4
III IV I II III IV I II III IV I II III
2007 2008 2009 2010
BETA_GR_BG_0710
-0.2
0.0
0.2
0.4
0.6
0.8
1.0
1.2
1.4
III IV I II III IV I II III IV I II III
2007 2008 2009 2010
BETA_GR_ES_0710
-0.2
0.0
0.2
0.4
0.6
0.8
1.0
1.2
1.4
III IV I II III IV I II III IV I II III
2007 2008 2009 2010
BETA_GR_FN_0710
-0.2
0.0
0.2
0.4
0.6
0.8
1.0
1.2
1.4
III IV I II III IV I II III IV I II III
2007 2008 2009 2010
BETA_GR_FR_0710
-0.2
0.0
0.2
0.4
0.6
0.8
1.0
1.2
1.4
III IV I II III IV I II III IV I II III
2007 2008 2009 2010
BETA_GR_IR_0710
-0.2
0.0
0.2
0.4
0.6
0.8
1.0
1.2
1.4
III IV I II III IV I II III IV I II III
2007 2008 2009 2010
BETA_GR_IT_0710
-0.2
0.0
0.2
0.4
0.6
0.8
1.0
1.2
1.4
III IV I II III IV I II III IV I II III
2007 2008 2009 2010
BETA_GR_NL_0710
-0.2
0.0
0.2
0.4
0.6
0.8
1.0
1.2
1.4
III IV I II III IV I II III IV I II III
2007 2008 2009 2010
BETA_GR_OE_0710
-0.2
0.0
0.2
0.4
0.6
0.8
1.0
1.2
1.4
III IV I II III IV I II III IV I II III
2007 2008 2009 2010
BETA_GR_PT_0710
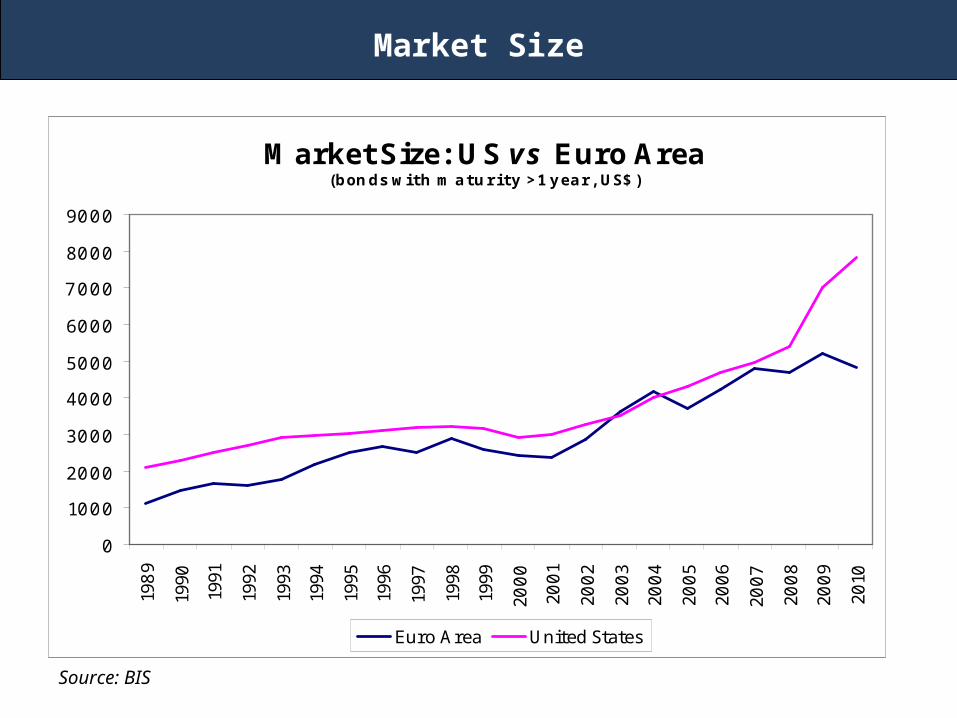
Market Size
Market Size: US vs Euro Area (bonds with maturity >1 year, US$)
0
1000
2000
3000
4000
5000
6000
7000
8000
9000
1989
1990
1991
1992
1993
1994
1995
1996
1997
1998
1999
2000
2001
2002
2003
2004
2005
2006
2007
2008
2009
2010
Euro Area United States
Source: BIS
Market Size
Source: Datastream
-1
0
1
2
3
4
III IV I II III IV I II III IV I II III IV I II III IV I II III IV I
2005 2006 2007 2008 2009 2010 2011
GER - US 10-Y asset swap spreadGER - US cds spreadUS Corp Baa - Aaa spread
Germany vs US
EIB Bonds
Source: Datastream
-1
0
1
2
3
4
5
6
III IV I II III IV I II III IV I II III IV I II III IV I II III IV I
2005 2006 2007 2008 2009 2010 2011
10-Y Spread on Bunds: EIB10-Y EIB10-Y Germany10-Y Finland10-Y Spread on Bunds:Finland
EIB
The different proposals for a eurobond
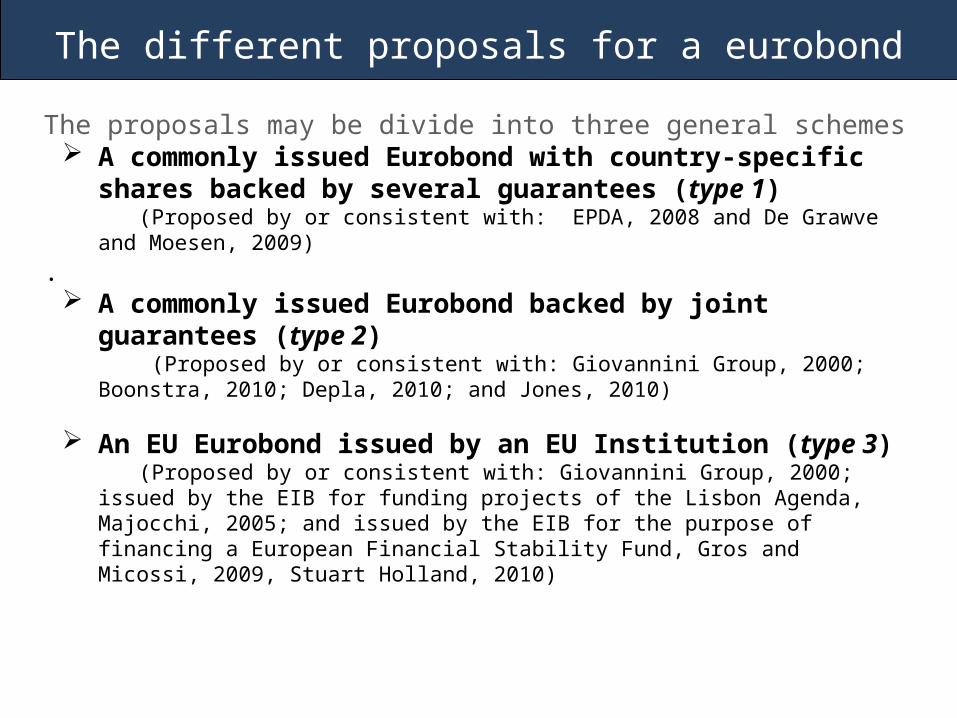
The proposals may be divide into three general schemes A commonly issued Eurobond with country-specific
shares backed by several guarantees (type 1) (Proposed by or consistent with: EPDA, 2008 and De Grawve and
Moesen, 2009). A commonly issued Eurobond backed by joint
guarantees (type 2) (Proposed by or consistent with: Giovannini Group, 2000; Boonstra,
2010; Depla, 2010; and Jones, 2010)
An EU Eurobond issued by an EU Institution (type 3) (Proposed by or consistent with: Giovannini Group, 2000; issued by the
EIB for funding projects of the Lisbon Agenda, Majocchi, 2005; and issued by the EIB for the purpose of financing a European Financial Stability Fund, Gros and Micossi, 2009, Stuart Holland, 2010)
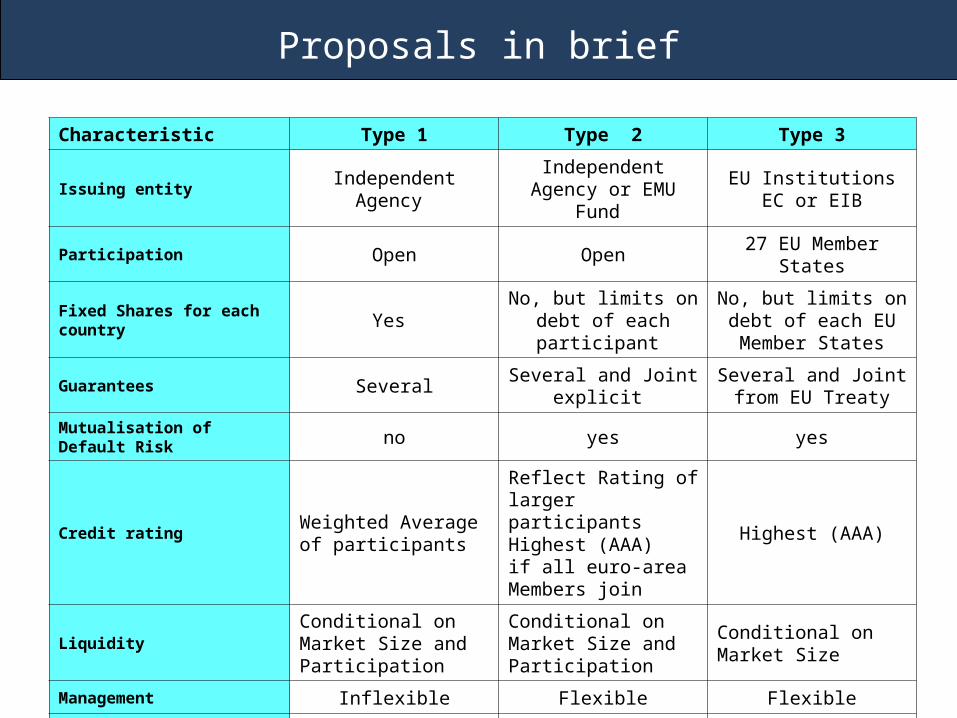
Proposals in brief
Characteristic Type 1 Type 2 Type 3
Issuing entity Independent Agency Independent Agency or
EMU Fund EU Institutions EC or
EIB
Participation Open Open 27 EU Member States
Fixed Shares for each country Yes No, but limits on debt of
each participant No, but limits on debt of each EU Member States
Guarantees SeveralSeveral and Joint
explicit Several and Joint from
EU Treaty
Mutualisation of Default Risk no yes yes
Credit rating Weighted Average of participants
Reflect Rating oflarger participantsHighest (AAA)if all euro-areaMembers join
Highest (AAA)
LiquidityConditional onMarket Size andParticipation
Conditional onMarket Size andParticipation
Conditional onMarket Size
Management Inflexible Flexible Flexible
Legal obstacles NoneChange in TFEUArt.125 No-Bailout
Change in TFEU
Pros
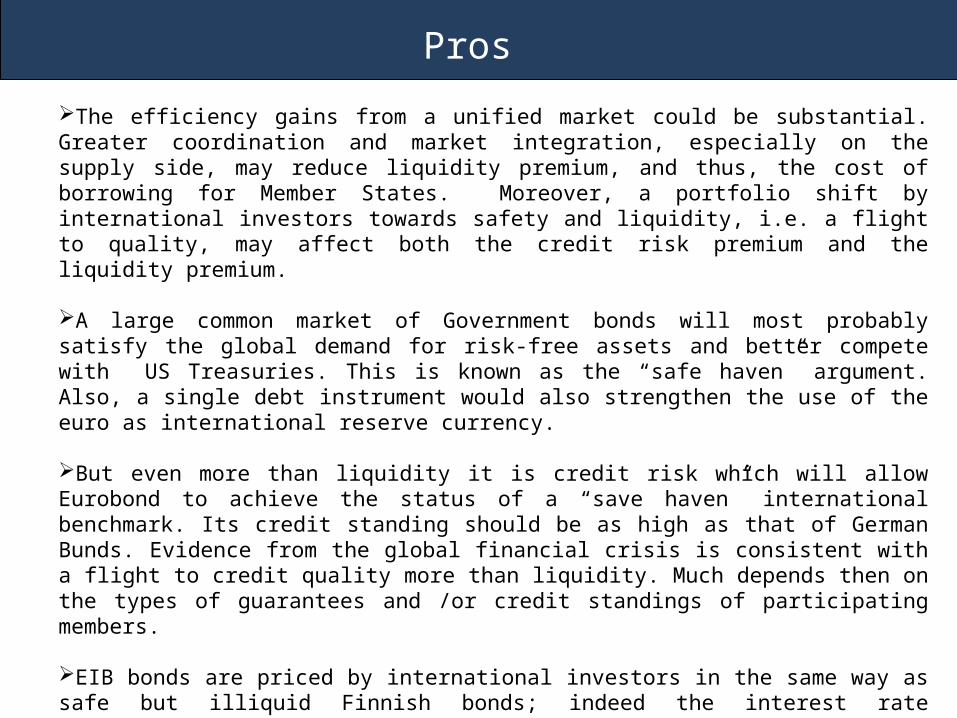
The efficiency gains from a unified market could be substantial. Greater coordination and market integration, especially on the supply side, may reduce liquidity premium, and thus, the cost of borrowing for Member States. Moreover, a portfolio shift by international investors towards safety and liquidity, i.e. a flight to quality, may affect both the credit risk premium and the liquidity premium.
A large common market of Government bonds will most probably satisfy the global demand for risk-free assets and better compete with US Treasuries. This is known as the “safe haven” argument. Also, a single debt instrument would also strengthen the use of the euro as international reserve currency.
But even more than liquidity it is credit risk which will allow Eurobond to achieve the status of a “save haven” international benchmark. Its credit standing should be as high as that of German Bunds. Evidence from the global financial crisis is consistent with a flight to credit quality more than liquidity. Much depends then on the types of guarantees and /or credit standings of participating members.
EIB bonds are priced by international investors in the same way as safe but illiquid Finnish bonds; indeed the interest rate differential between the two bonds is practically zero. This suggests that a Eurobond issued by an EU institution (and probably all euro-area MS) would be perceived as the highest credit quality and could reach the “safe haven” status if its market size approached that of US Treasuries.
Cons
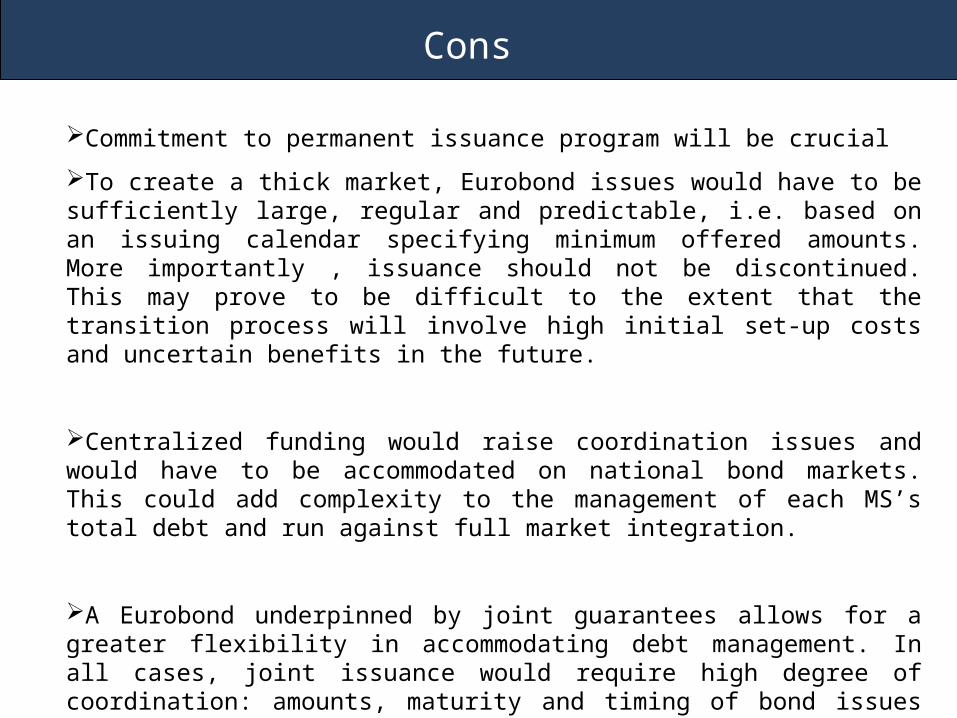
Commitment to permanent issuance program will be crucial
To create a thick market, Eurobond issues would have to be sufficiently large, regular and predictable, i.e. based on an issuing calendar specifying minimum offered amounts. More importantly , issuance should not be discontinued. This may prove to be difficult to the extent that the transition process will involve high initial set-up costs and uncertain benefits in the future.
Centralized funding would raise coordination issues and would have to be accommodated on national bond markets. This could add complexity to the management of each MS’s total debt and run against full market integration.
A Eurobond underpinned by joint guarantees allows for a greater flexibility in accommodating debt management. In all cases, joint issuance would require high degree of coordination: amounts, maturity and timing of bond issues would have to be decided by the issuing entity in close operation with MS.
Cons
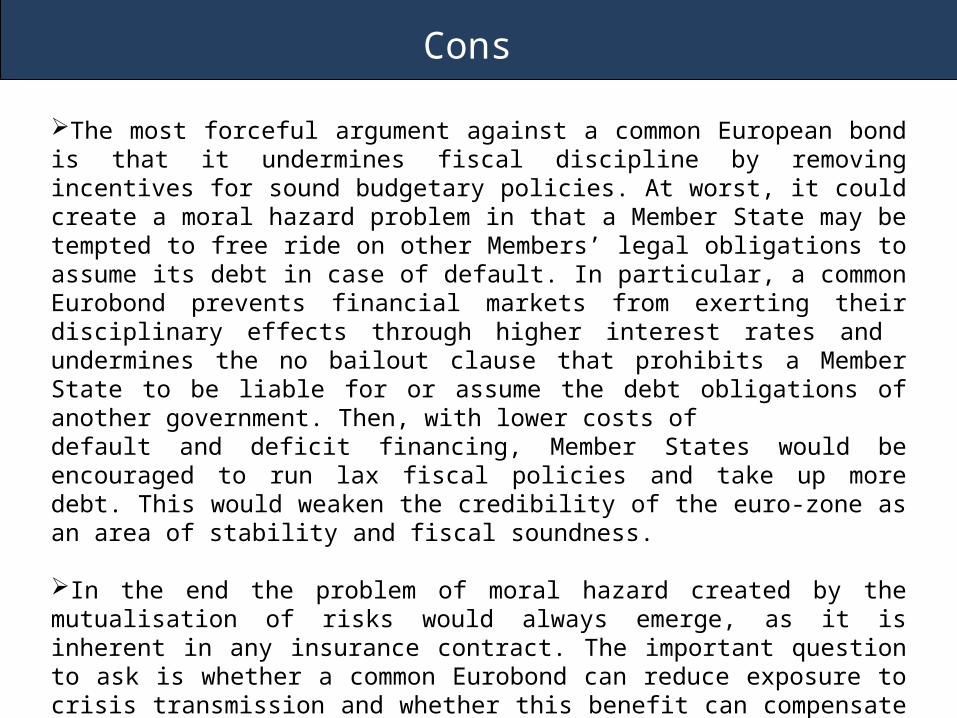
The most forceful argument against a common European bond is that it undermines fiscal discipline by removing incentives for sound budgetary policies. At worst, it could create a moral hazard problem in that a Member State may be tempted to free ride on other Members’ legal obligations to assume its debt in case of default. In particular, a common Eurobond prevents financial markets from exerting their disciplinary effects through higher interest rates and undermines the no bailout clause that prohibits a Member State to be liable for or assume the debt obligations of another government. Then, with lower costs ofdefault and deficit financing, Member States would be encouraged to run lax fiscal policies and take up more debt. This would weaken the credibility of the euro-zone as an area of stability and fiscal soundness.
In the end the problem of moral hazard created by the mutualisation of risks would always emerge, as it is inherent in any insurance contract. The important question to ask is whether a common Eurobond can reduce exposure to crisis transmission and whether this benefit can compensate for the risk of moral hazard.