Embed Size (px)
Citation preview
Space Weather: what does it cost and how bad can it get?
Karel SchrijverLockheed Martin Advanced Technology Center
[email protected]; (+1650) 424 2907
III
III
III
III
1
Tuesday, February 28, 2012
Solar-flare induced disturbances in the U.S.electric grid and their economic impact
Karel Schrijver and Sarah Mitchell
Estimating the frequency of extremely energetic solar events, based on solar, stellar, lunar, and terrestrial records
Karel Schrijver, Juerg Beer, Urs Baltensperger, Ed Cliver,Manuel Guedel, Hugh Hudson, Ken McCracken,
Rachel Osten, Thomas Peter, David Soderblom, Ilya Usoskin, and Eric Wolff
II:
I:
2
Tuesday, February 28, 2012
Solar-flare induced disturbances in the U.S.electric grid and their economic impact
Karel Schrijver and Sarah Mitchell
I:
3
Tuesday, February 28, 2012
Space-weather impact studies
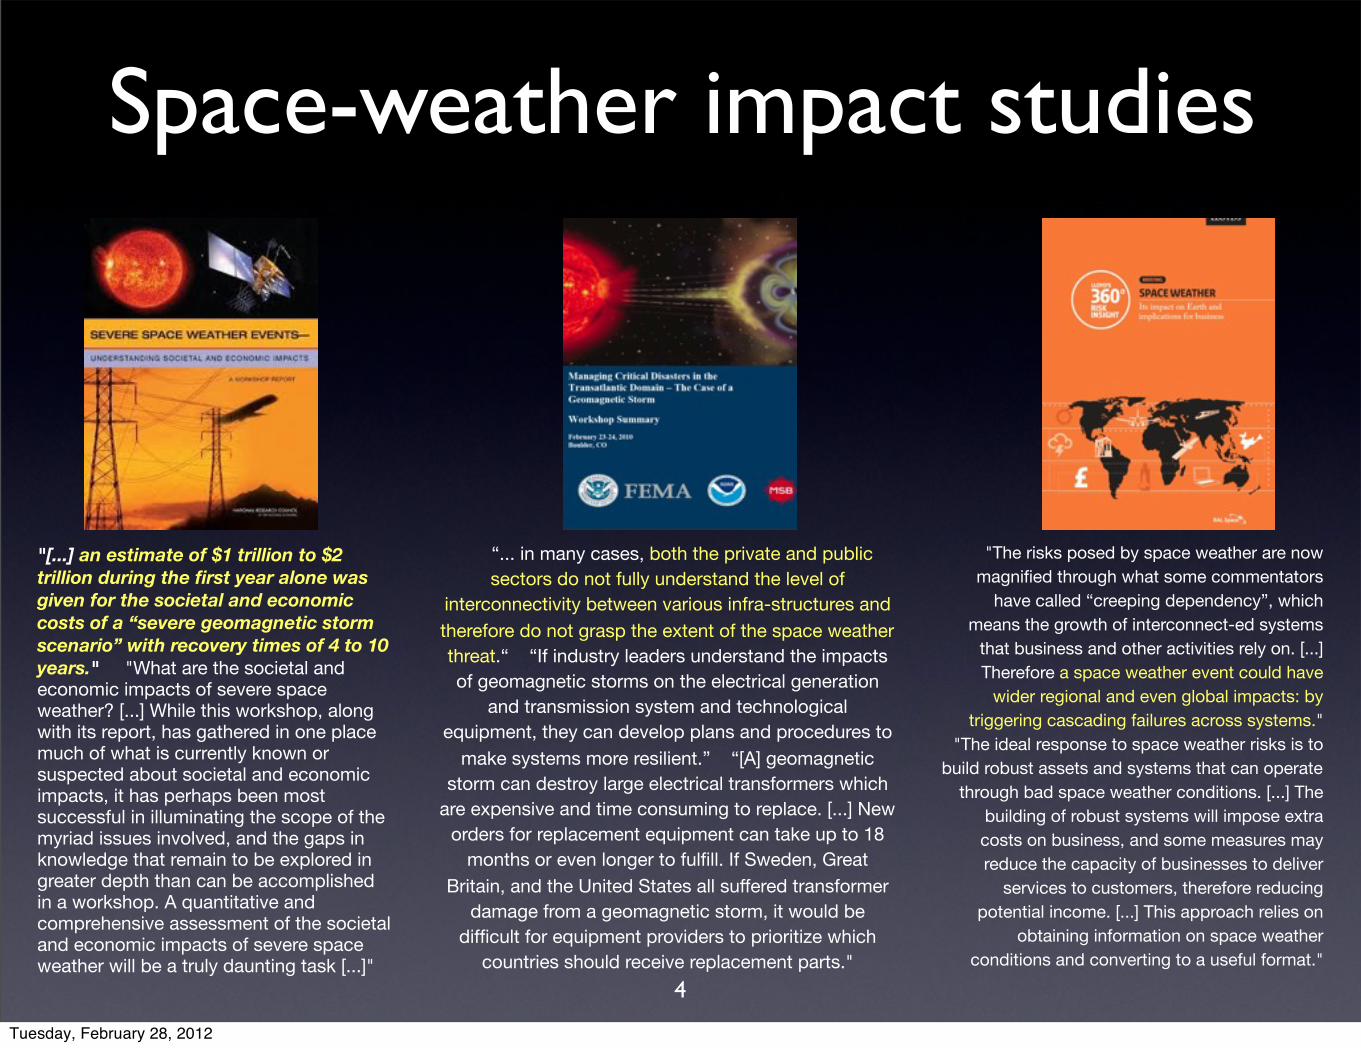
"[...] an estimate of $1 trillion to $2 trillion during the first year alone was given for the societal and economic costs of a “severe geomagnetic storm scenario” with recovery times of 4 to 10 years." "What are the societal and economic impacts of severe space weather? [...] While this workshop, along with its report, has gathered in one place much of what is currently known or suspected about societal and economic impacts, it has perhaps been most successful in illuminating the scope of the myriad issues involved, and the gaps in knowledge that remain to be explored in greater depth than can be accomplished in a workshop. A quantitative and comprehensive assessment of the societal and economic impacts of severe space weather will be a truly daunting task [...]"
“... in many cases, both the private and public sectors do not fully understand the level of
interconnectivity between various infra-structures and therefore do not grasp the extent of the space weather threat.“ “If industry leaders understand the impacts of geomagnetic storms on the electrical generation
and transmission system and technological equipment, they can develop plans and procedures to
make systems more resilient.” “[A] geomagnetic storm can destroy large electrical transformers which
are expensive and time consuming to replace. [...] New orders for replacement equipment can take up to 18
months or even longer to fulfill. If Sweden, Great Britain, and the United States all suffered transformer
damage from a geomagnetic storm, it would be difficult for equipment providers to prioritize which
countries should receive replacement parts."
"The risks posed by space weather are now magnified through what some commentators
have called “creeping dependency”, which means the growth of interconnect-ed systems
that business and other activities rely on. [...] Therefore a space weather event could have
wider regional and even global impacts: by triggering cascading failures across systems."
"The ideal response to space weather risks is to build robust assets and systems that can operate
through bad space weather conditions. [...] The building of robust systems will impose extra costs on business, and some measures may reduce the capacity of businesses to deliver
services to customers, therefore reducing potential income. [...] This approach relies on
obtaining information on space weather conditions and converting to a useful format."
4
Tuesday, February 28, 2012
Emphasis on worst case
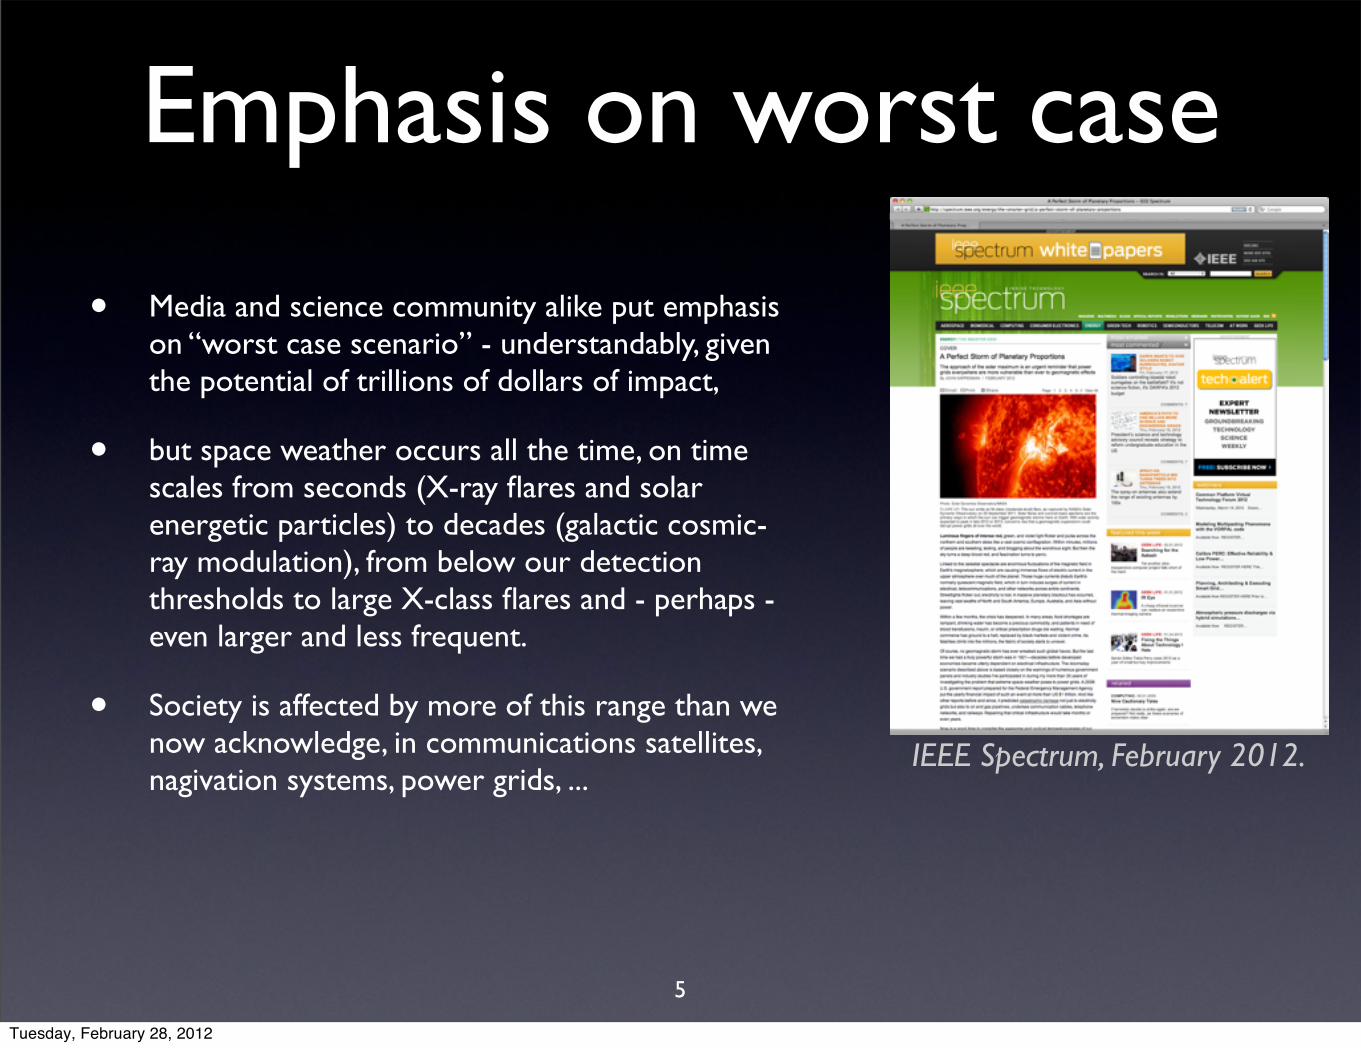
• Media and science community alike put emphasis on “worst case scenario” - understandably, given the potential of trillions of dollars of impact,
• but space weather occurs all the time, on time scales from seconds (X-ray flares and solar energetic particles) to decades (galactic cosmic-ray modulation), from below our detection thresholds to large X-class flares and - perhaps - even larger and less frequent.
• Society is affected by more of this range than we now acknowledge, in communications satellites, nagivation systems, power grids, ...
IEEE Spectrum, February 2012.
5
Tuesday, February 28, 2012
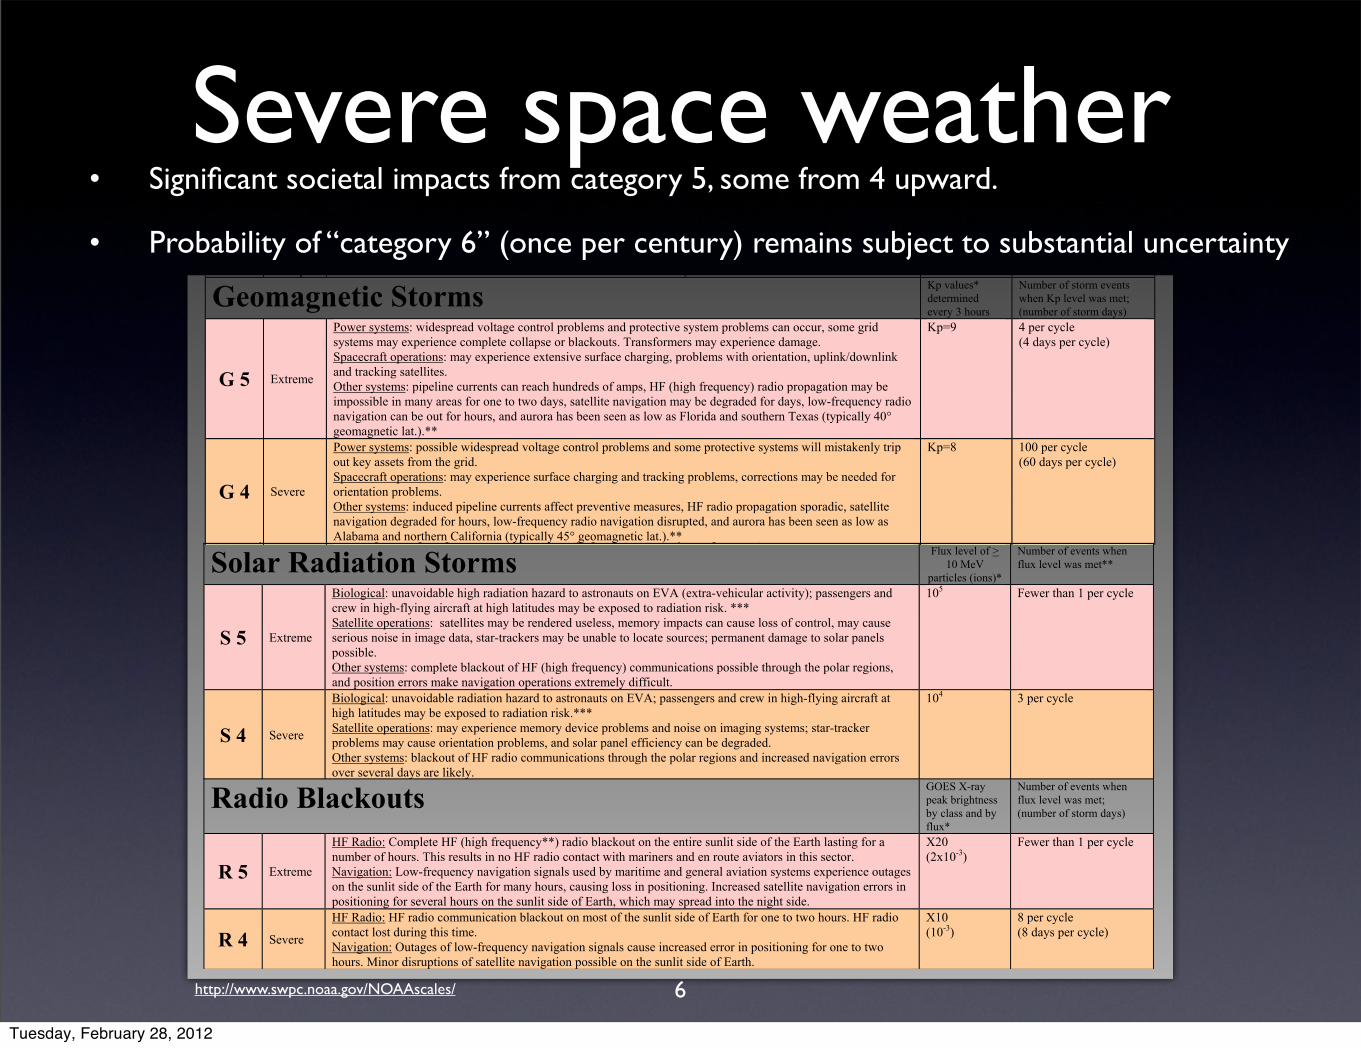
• Significant societal impacts from category 5, some from 4 upward.
• Probability of “category 6” (once per century) remains subject to substantial uncertainty
Severe space weather
URL: www.swpc.noaa.gov/NOAAscales April 7, 2011
NOAA Space Weather Scales
Category Effect Physical measure
Average Frequency (1 cycle = 11 years)
Scale Descriptor Duration of event will influence severity of effects
Geomagnetic Storms Kp values* determined every 3 hours
Number of storm events when Kp level was met; (number of storm days)
G 5 Extreme
Power systems: widespread voltage control problems and protective system problems can occur, some grid systems may experience complete collapse or blackouts. Transformers may experience damage. Spacecraft operations: may experience extensive surface charging, problems with orientation, uplink/downlink and tracking satellites. Other systems: pipeline currents can reach hundreds of amps, HF (high frequency) radio propagation may be impossible in many areas for one to two days, satellite navigation may be degraded for days, low-frequency radio navigation can be out for hours, and aurora has been seen as low as Florida and southern Texas (typically 40° geomagnetic lat.).**
Kp=9 4 per cycle (4 days per cycle)
G 4 Severe
Power systems: possible widespread voltage control problems and some protective systems will mistakenly trip out key assets from the grid. Spacecraft operations: may experience surface charging and tracking problems, corrections may be needed for orientation problems. Other systems: induced pipeline currents affect preventive measures, HF radio propagation sporadic, satellite navigation degraded for hours, low-frequency radio navigation disrupted, and aurora has been seen as low as Alabama and northern California (typically 45° geomagnetic lat.).**
Kp=8 100 per cycle (60 days per cycle)
G 3 Strong
Power systems: voltage corrections may be required, false alarms triggered on some protection devices. Spacecraft operations: surface charging may occur on satellite components, drag may increase on low-Earth-orbit satellites, and corrections may be needed for orientation problems. Other systems: intermittent satellite navigation and low-frequency radio navigation problems may occur, HF radio may be intermittent, and aurora has been seen as low as Illinois and Oregon (typically 50° geomagnetic lat.).**
Kp=7 200 per cycle (130 days per cycle)
G 2 Moderate
Power systems: high-latitude power systems may experience voltage alarms, long-duration storms may cause transformer damage. Spacecraft operations: corrective actions to orientation may be required by ground control; possible changes in drag affect orbit predictions. Other systems: HF radio propagation can fade at higher latitudes, and aurora has been seen as low as New York and Idaho (typically 55° geomagnetic lat.).**
Kp=6 600 per cycle (360 days per cycle)
G 1 Minor
Power systems: weak power grid fluctuations can occur. Spacecraft operations: minor impact on satellite operations possible. Other systems: migratory animals are affected at this and higher levels; aurora is commonly visible at high latitudes (northern Michigan and Maine).**
Kp=5 1700 per cycle (900 days per cycle)
* Based on this measure, but other physical measures are also considered. ** For specific locations around the globe, use geomagnetic latitude to determine likely sightings (see www.swpc.noaa.gov/Aurora)
Solar Radiation Storms Flux level of > 10 MeV
particles (ions)*
Number of events when flux level was met**
S 5 Extreme
Biological: unavoidable high radiation hazard to astronauts on EVA (extra-vehicular activity); passengers and crew in high-flying aircraft at high latitudes may be exposed to radiation risk. *** Satellite operations: satellites may be rendered useless, memory impacts can cause loss of control, may cause serious noise in image data, star-trackers may be unable to locate sources; permanent damage to solar panels possible. Other systems: complete blackout of HF (high frequency) communications possible through the polar regions, and position errors make navigation operations extremely difficult.
105 Fewer than 1 per cycle
S 4 Severe
Biological: unavoidable radiation hazard to astronauts on EVA; passengers and crew in high-flying aircraft at high latitudes may be exposed to radiation risk.*** Satellite operations: may experience memory device problems and noise on imaging systems; star-tracker problems may cause orientation problems, and solar panel efficiency can be degraded. Other systems: blackout of HF radio communications through the polar regions and increased navigation errors over several days are likely.
104 3 per cycle
S 3 Strong
Biological: radiation hazard avoidance recommended for astronauts on EVA; passengers and crew in high-flying aircraft at high latitudes may be exposed to radiation risk.*** Satellite operations: single-event upsets, noise in imaging systems, and slight reduction of efficiency in solar panel are likely. Other systems: degraded HF radio propagation through the polar regions and navigation position errors likely.
103 10 per cycle
S 2 Moderate
Biological: passengers and crew in high-flying aircraft at high latitudes may be exposed to elevated radiation risk.*** Satellite operations: infrequent single-event upsets possible. Other systems: effects on HF propagation through the polar regions, and navigation at polar cap locations possibly affected.
102 25 per cycle
S1 Minor Biological: none. Satellite operations: none. Other systems: minor impacts on HF radio in the polar regions.
10 50 per cycle
* Flux levels are 5 minute averages. Flux in particles·s-1·ster-1·cm-2 Based on this measure, but other physical measures are also considered. ** These events can last more than one day. *** High energy particle (>100 MeV) are a better indicator of radiation risk to passenger and crews. Pregnant women are particularly susceptible.
Radio Blackouts GOES X-ray peak brightness by class and by flux*
Number of events when flux level was met; (number of storm days)
R 5 Extreme
HF Radio: Complete HF (high frequency**) radio blackout on the entire sunlit side of the Earth lasting for a number of hours. This results in no HF radio contact with mariners and en route aviators in this sector. Navigation: Low-frequency navigation signals used by maritime and general aviation systems experience outages on the sunlit side of the Earth for many hours, causing loss in positioning. Increased satellite navigation errors in positioning for several hours on the sunlit side of Earth, which may spread into the night side.
X20 (2x10⁻³)
Fewer than 1 per cycle
R 4 Severe
HF Radio: HF radio communication blackout on most of the sunlit side of Earth for one to two hours. HF radio contact lost during this time. Navigation: Outages of low-frequency navigation signals cause increased error in positioning for one to two hours. Minor disruptions of satellite navigation possible on the sunlit side of Earth.
X10 (10-3)
8 per cycle (8 days per cycle)
R 3 Strong HF Radio: Wide area blackout of HF radio communication, loss of radio contact for about an hour on sunlit side of Earth. Navigation: Low-frequency navigation signals degraded for about an hour.
X1 (10-4)
175 per cycle (140 days per cycle)
R 2 Moderate HF Radio: Limited blackout of HF radio communication on sunlit side of the Earth, loss of radio contact for tens of minutes. Navigation: Degradation of low-frequency navigation signals for tens of minutes.
M5 (5x10⁻⁵)
350 per cycle (300 days per cycle)
R 1 Minor HF Radio: Weak or minor degradation of HF radio communication on sunlit side of the Earth, occasional loss of radio contact. Navigation: Low-frequency navigation signals degraded for brief intervals.
M1 (10-5)
2000 per cycle (950 days per cycle)
* Flux, measured in the 0.1-0.8 nm range, in W·m-2. Based on this measure, but other physical measures are also considered. ** Other frequencies may also be affected by these conditions.
6http://www.swpc.noaa.gov/NOAAscales/
Tuesday, February 28, 2012
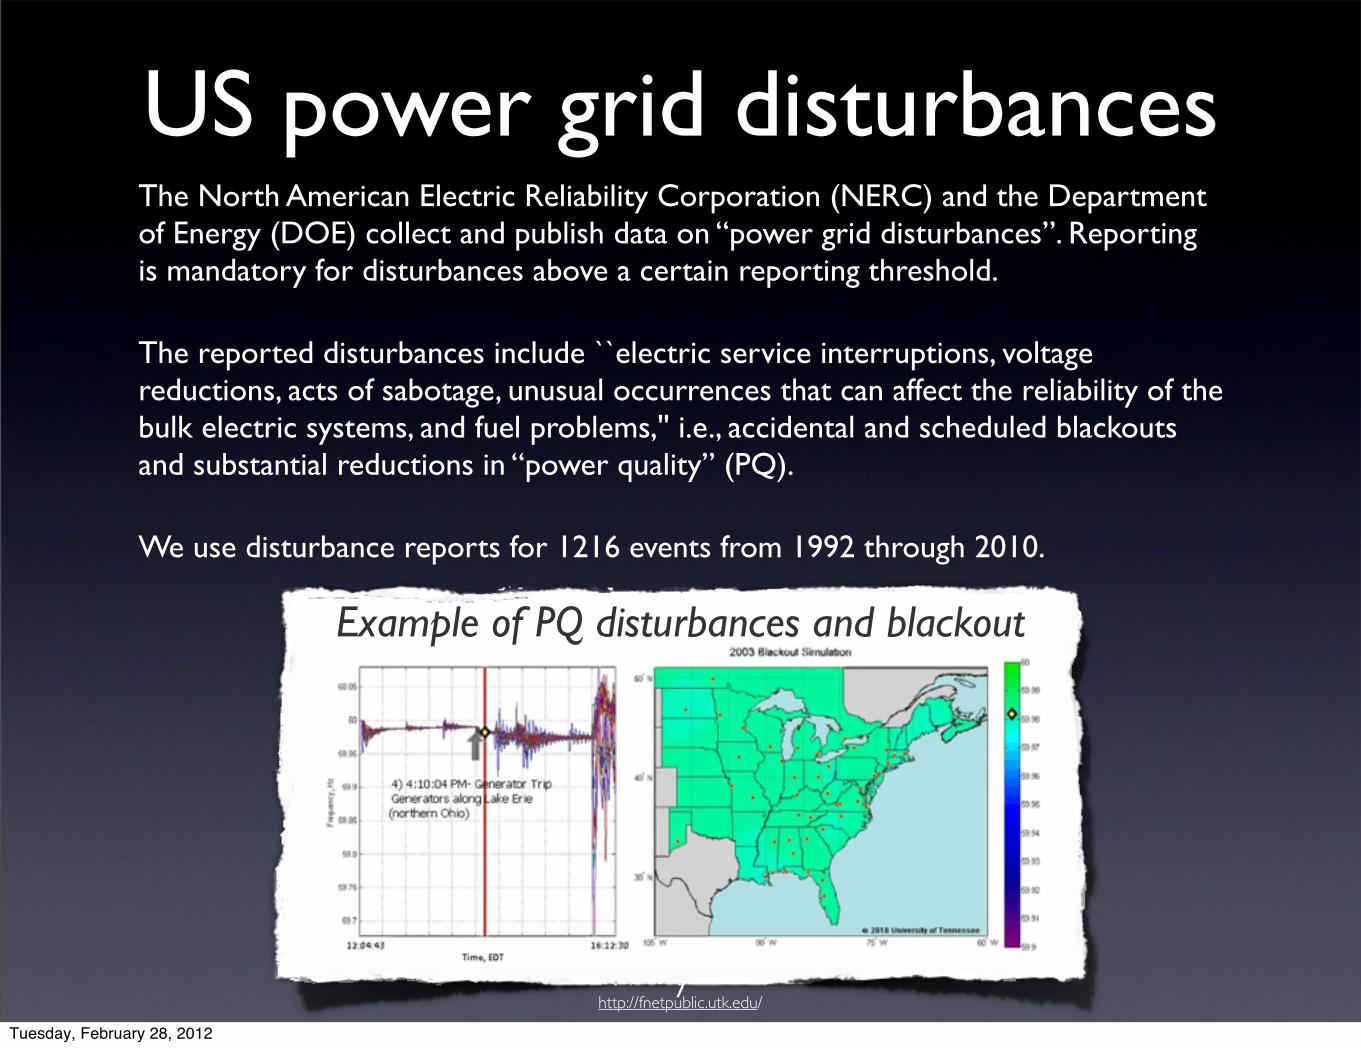
US power grid disturbancesThe North American Electric Reliability Corporation (NERC) and the Department of Energy (DOE) collect and publish data on “power grid disturbances”. Reporting is mandatory for disturbances above a certain reporting threshold.
The reported disturbances include ``electric service interruptions, voltage reductions, acts of sabotage, unusual occurrences that can affect the reliability of the bulk electric systems, and fuel problems,'' i.e., accidental and scheduled blackouts and substantial reductions in “power quality” (PQ). We use disturbance reports for 1216 events from 1992 through 2010.
http://fnetpublic.utk.edu/
Example of PQ disturbances and blackout
7
Tuesday, February 28, 2012
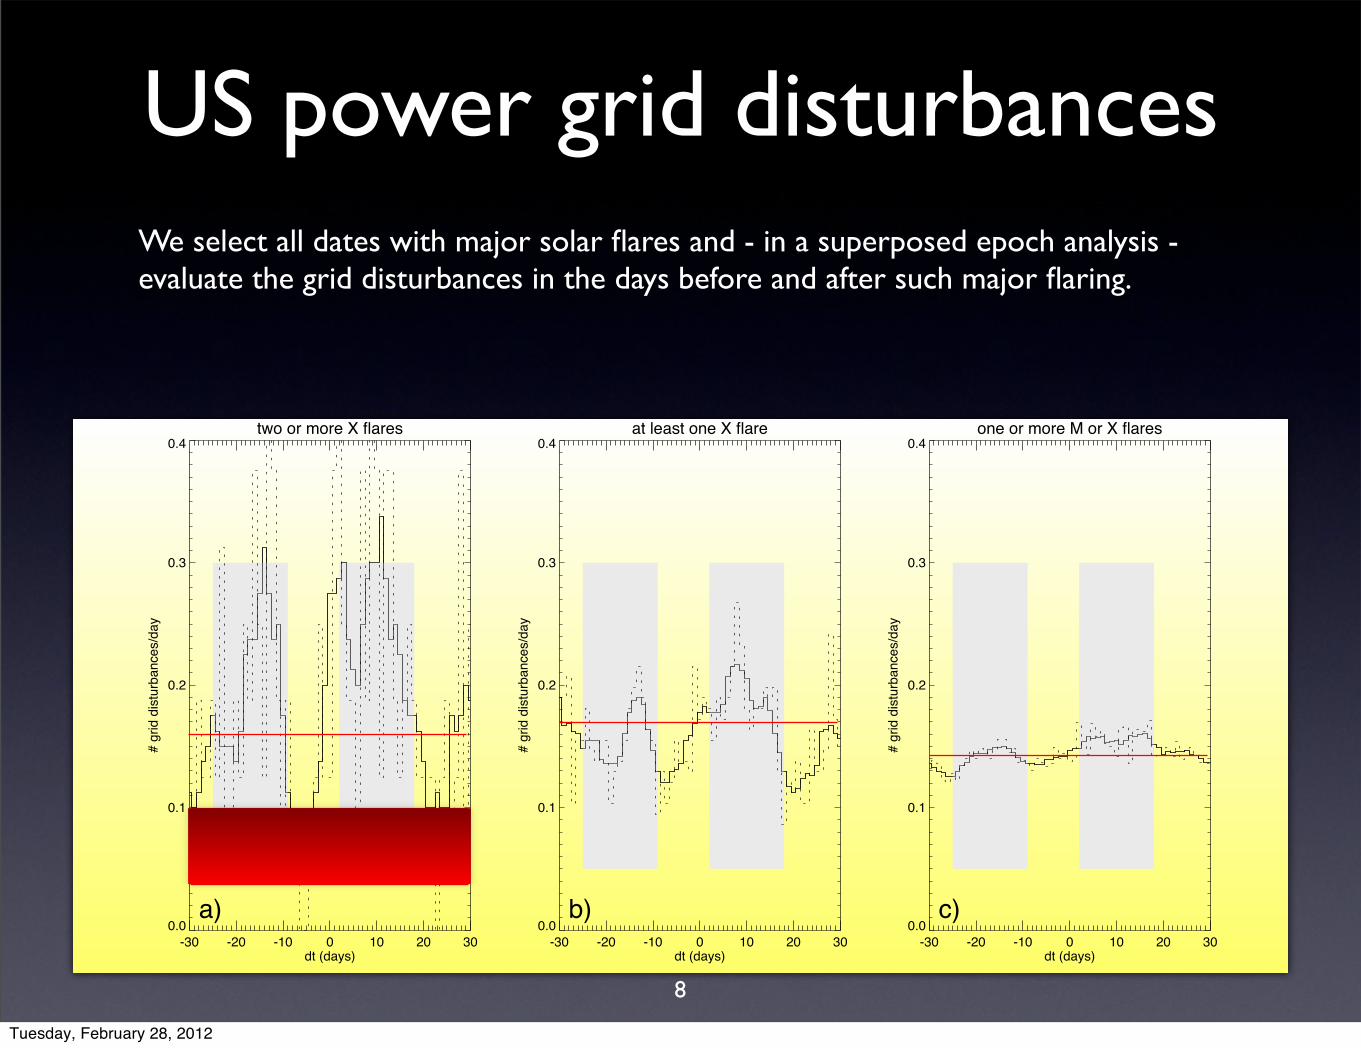
US power grid disturbancesWe select all dates with major solar flares and - in a superposed epoch analysis - evaluate the grid disturbances in the days before and after such major flaring.
two or more X flares
-30 -20 -10 0 10 20 30dt (days)
0.0
0.1
0.2
0.3
0.4
# gr
id d
istu
rban
ces/
day
a)
at least one X flare
-30 -20 -10 0 10 20 30dt (days)
0.0
0.1
0.2
0.3
0.4
# gr
id d
istu
rban
ces/
day
b)
one or more M or X flares
-30 -20 -10 0 10 20 30dt (days)
0.0
0.1
0.2
0.3
0.4
# gr
id d
istu
rban
ces/
day
c)
8
Tuesday, February 28, 2012
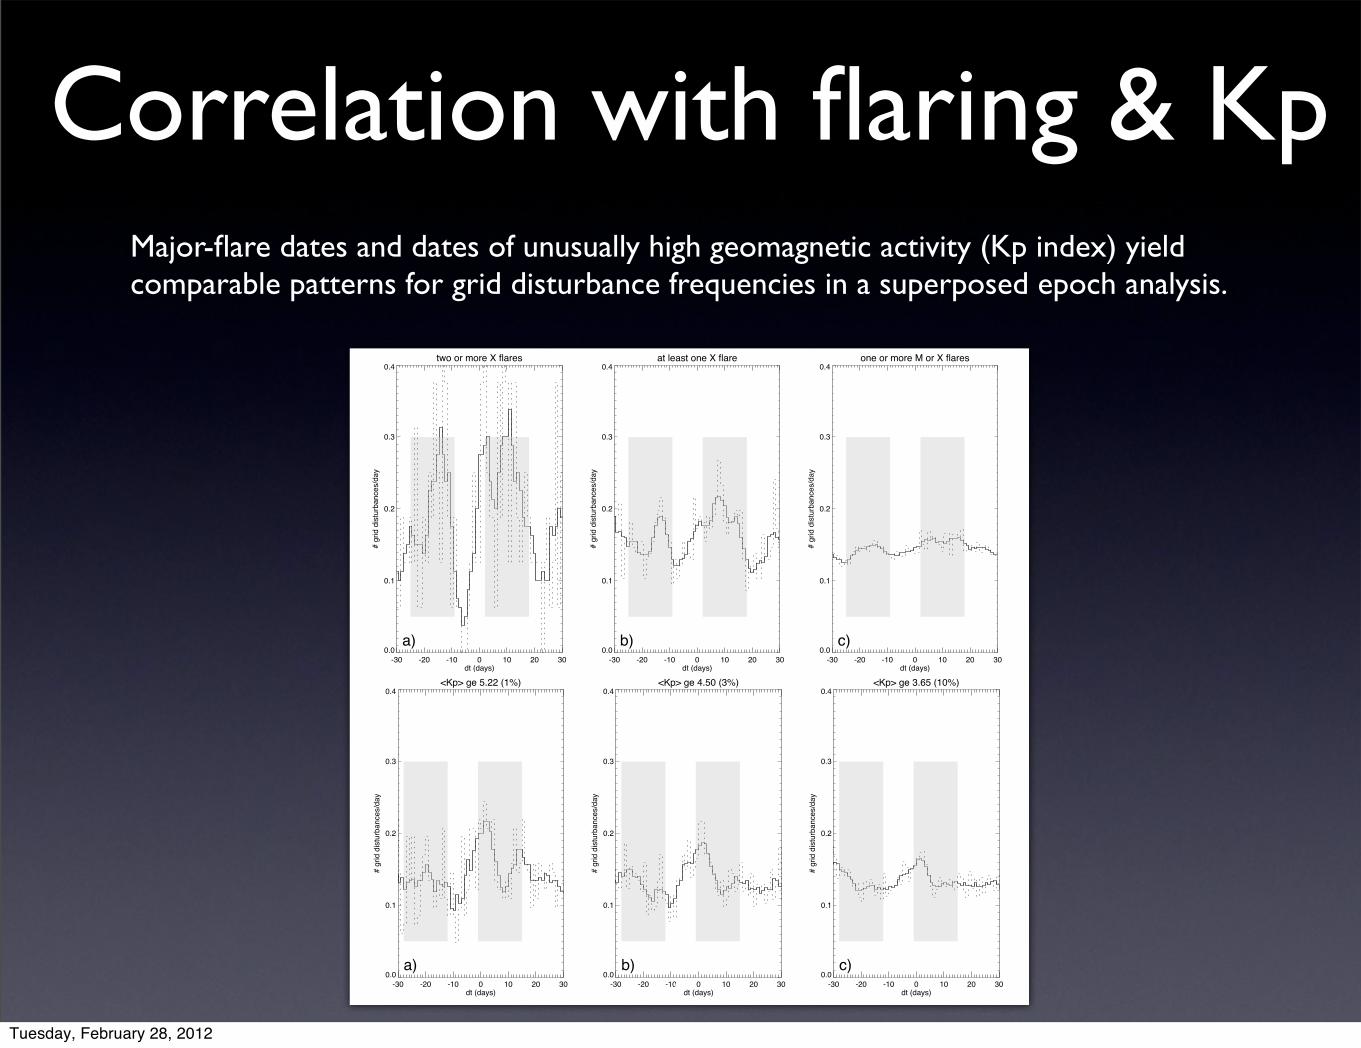
Correlation with flaring & Kp
<Kp> ge 5.22 (1%)
-30 -20 -10 0 10 20 30dt (days)
0.0
0.1
0.2
0.3
0.4
# gr
id d
istu
rban
ces/
day
a)
<Kp> ge 4.50 (3%)
-30 -20 -10 0 10 20 30dt (days)
0.0
0.1
0.2
0.3
0.4
# gr
id d
istu
rban
ces/
day
b)
<Kp> ge 3.65 (10%)
-30 -20 -10 0 10 20 30dt (days)
0.0
0.1
0.2
0.3
0.4
# gr
id d
istu
rban
ces/
day
c)
two or more X flares
-30 -20 -10 0 10 20 30dt (days)
0.0
0.1
0.2
0.3
0.4#
grid
dis
turb
ance
s/da
y
a)
at least one X flare
-30 -20 -10 0 10 20 30dt (days)
0.0
0.1
0.2
0.3
0.4
# gr
id d
istu
rban
ces/
day
b)
one or more M or X flares
-30 -20 -10 0 10 20 30dt (days)
0.0
0.1
0.2
0.3
0.4
# gr
id d
istu
rban
ces/
day
c)
Major-flare dates and dates of unusually high geomagnetic activity (Kp index) yield comparable patterns for grid disturbance frequencies in a superposed epoch analysis.
9
Tuesday, February 28, 2012
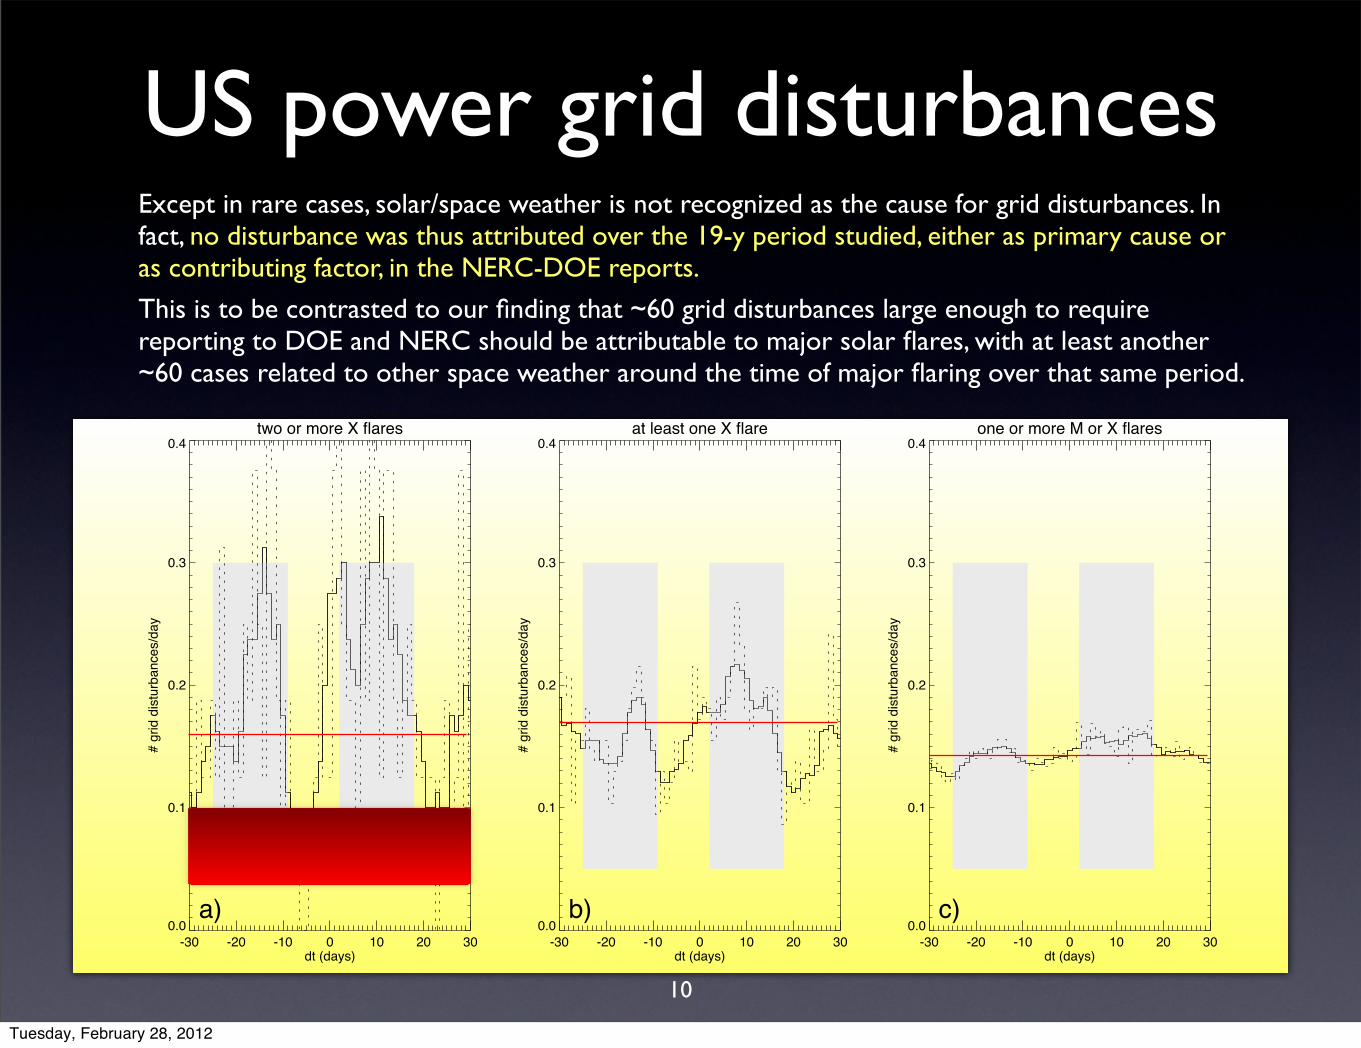
US power grid disturbancesExcept in rare cases, solar/space weather is not recognized as the cause for grid disturbances. In fact, no disturbance was thus attributed over the 19-y period studied, either as primary cause or as contributing factor, in the NERC-DOE reports.
This is to be contrasted to our finding that ~60 grid disturbances large enough to require reporting to DOE and NERC should be attributable to major solar flares, with at least another ~60 cases related to other space weather around the time of major flaring over that same period.
two or more X flares
-30 -20 -10 0 10 20 30dt (days)
0.0
0.1
0.2
0.3
0.4
# gr
id d
istu
rban
ces/
day
a)
at least one X flare
-30 -20 -10 0 10 20 30dt (days)
0.0
0.1
0.2
0.3
0.4
# gr
id d
istu
rban
ces/
day
b)
one or more M or X flares
-30 -20 -10 0 10 20 30dt (days)
0.0
0.1
0.2
0.3
0.4
# gr
id d
istu
rban
ces/
day
c)
10
Tuesday, February 28, 2012
US power grid disturbances
The average energy lost in the grid disturbances we studied amounts to 11-19 GWh per event.
For a total electric power production for the U.S. in 2010, the grid disturbances attributable to major solar flaring add up to a fraction of fdist=(2.0-3.5)10-6 of the total of about 4,000 TWh.
A plausible lower limit to the economic impact can be obtained by making the simplest assumption, namely that the economic impact equals a fraction fdist of the U.S. GDP (~$14.6 1012 in 2010). With that assumption, we find an impact cost estimate between $160M and $280M/yr from 4.3 grid disturbances per year. The full space weather impact needs to be at least doubled to include effects from solar activity other than directly associated with M and X class flaring, which brings the range up to $300M to $500M/yr.
That simple estimate is likely substantially lower than the full economic impact. A DOE report puts the costs of ``power outages and power quality disturbances'' to the overall economy between $25 billion and $180 billion annually. A survey of the impacted sectors of industry by EPRI resulted in an annual impact of approximately $100 B/y. If we assume that space-weather induced grid disturbances are comparable to the typical other disturbance, then the full economic impact could be as large as $4 billion per year.
11
Tuesday, February 28, 2012
US power grid disturbances
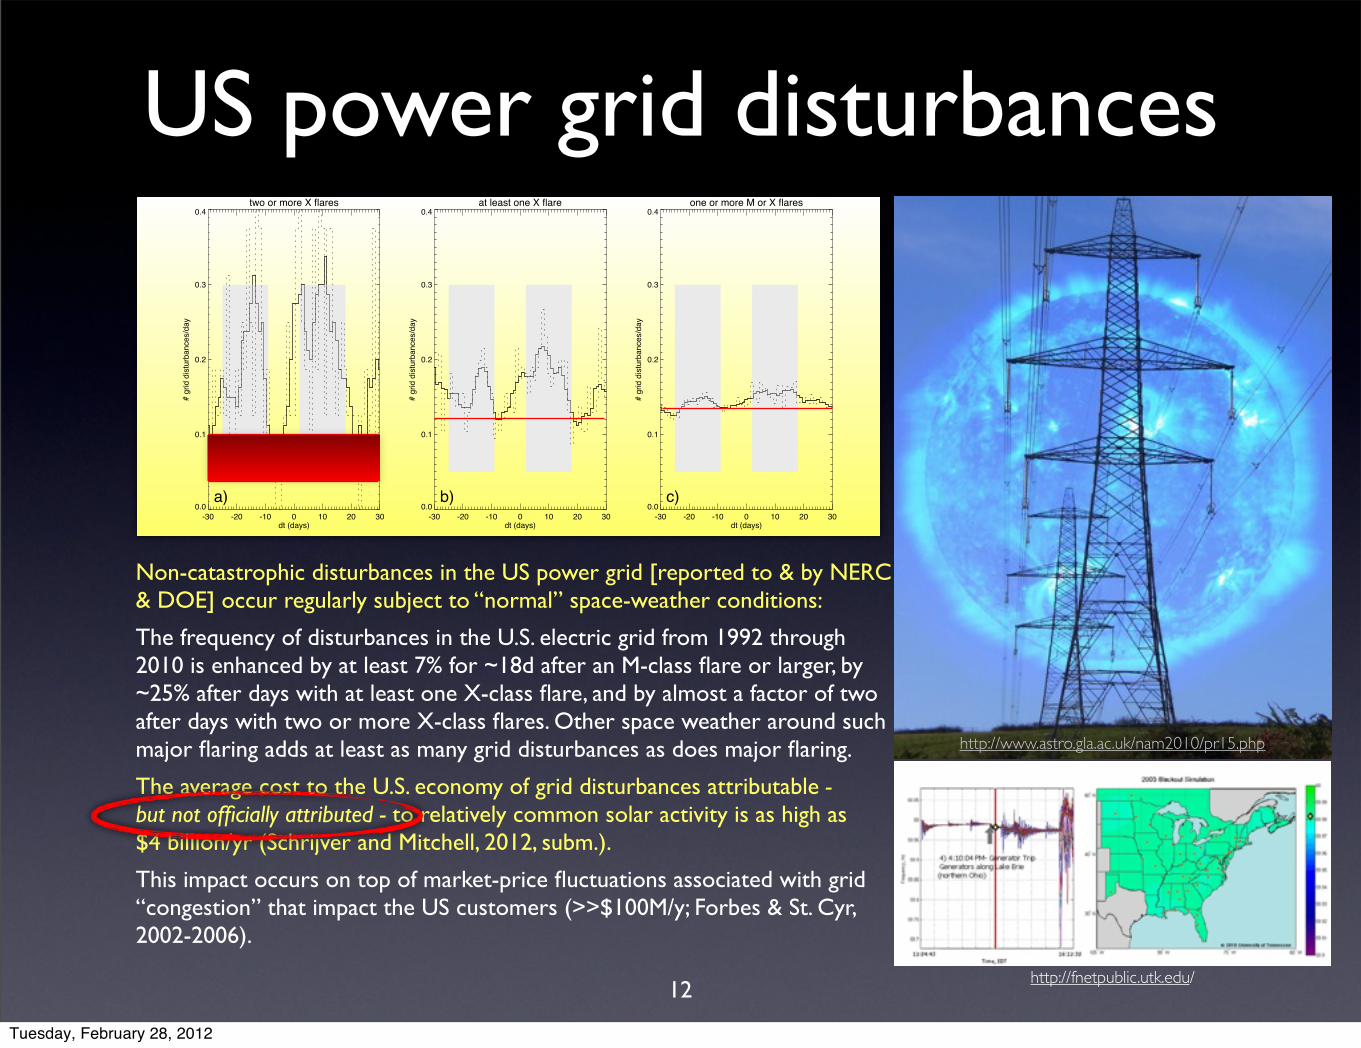
Non-catastrophic disturbances in the US power grid [reported to & by NERC & DOE] occur regularly subject to “normal” space-weather conditions:
The frequency of disturbances in the U.S. electric grid from 1992 through 2010 is enhanced by at least 7% for ~18d after an M-class flare or larger, by ~25% after days with at least one X-class flare, and by almost a factor of two after days with two or more X-class flares. Other space weather around such major flaring adds at least as many grid disturbances as does major flaring.
The average cost to the U.S. economy of grid disturbances attributable - but not officially attributed - to relatively common solar activity is as high as $4 billion/yr (Schrijver and Mitchell, 2012, subm.).
This impact occurs on top of market-price fluctuations associated with grid “congestion” that impact the US customers (>>$100M/y; Forbes & St. Cyr, 2002-2006).
http://www.astro.gla.ac.uk/nam2010/pr15.php
two or more X flares
-30 -20 -10 0 10 20 30dt (days)
0.0
0.1
0.2
0.3
0.4
# gr
id d
istu
rban
ces/
day
a)
at least one X flare
-30 -20 -10 0 10 20 30dt (days)
0.0
0.1
0.2
0.3
0.4
# gr
id d
istu
rban
ces/
day
b)
one or more M or X flares
-30 -20 -10 0 10 20 30dt (days)
0.0
0.1
0.2
0.3
0.4
# gr
id d
istu
rban
ces/
day
c)
http://fnetpublic.utk.edu/12
Tuesday, February 28, 2012
Conclusion: US grid disturbances•The power grid disturbances studied by Schrijver and Mitchell (2012) are generally
not “catastrophic” and occur subject to non-extreme space weather conditions.
•The economic impact of grid disturbances alone is ten times the amount spent by NASA Heliophyics and NSF to study the phenomena from solar storms to geospace.
•The correlation of grid disturbances with major solar flaring reveals a weakness in the US power grid not recognized to date.
•The cost of grid disturbances over the past two decades may be as high as $40-80 billion dollars, much larger than the oft-cited Hydro-Quebec blackout in March, 1989, with an estimated impact of $2 billion.
•Other phenomena associated with ‘every-day space weather’, i.e. not the extreme scenarios often quoted, add significantly to the economic impact. These include price variations in the electricity market, satellite anomalies and losses, and impacts on communications systems.
•All of these other impacts are yet to be quantified:
13
Tuesday, February 28, 2012
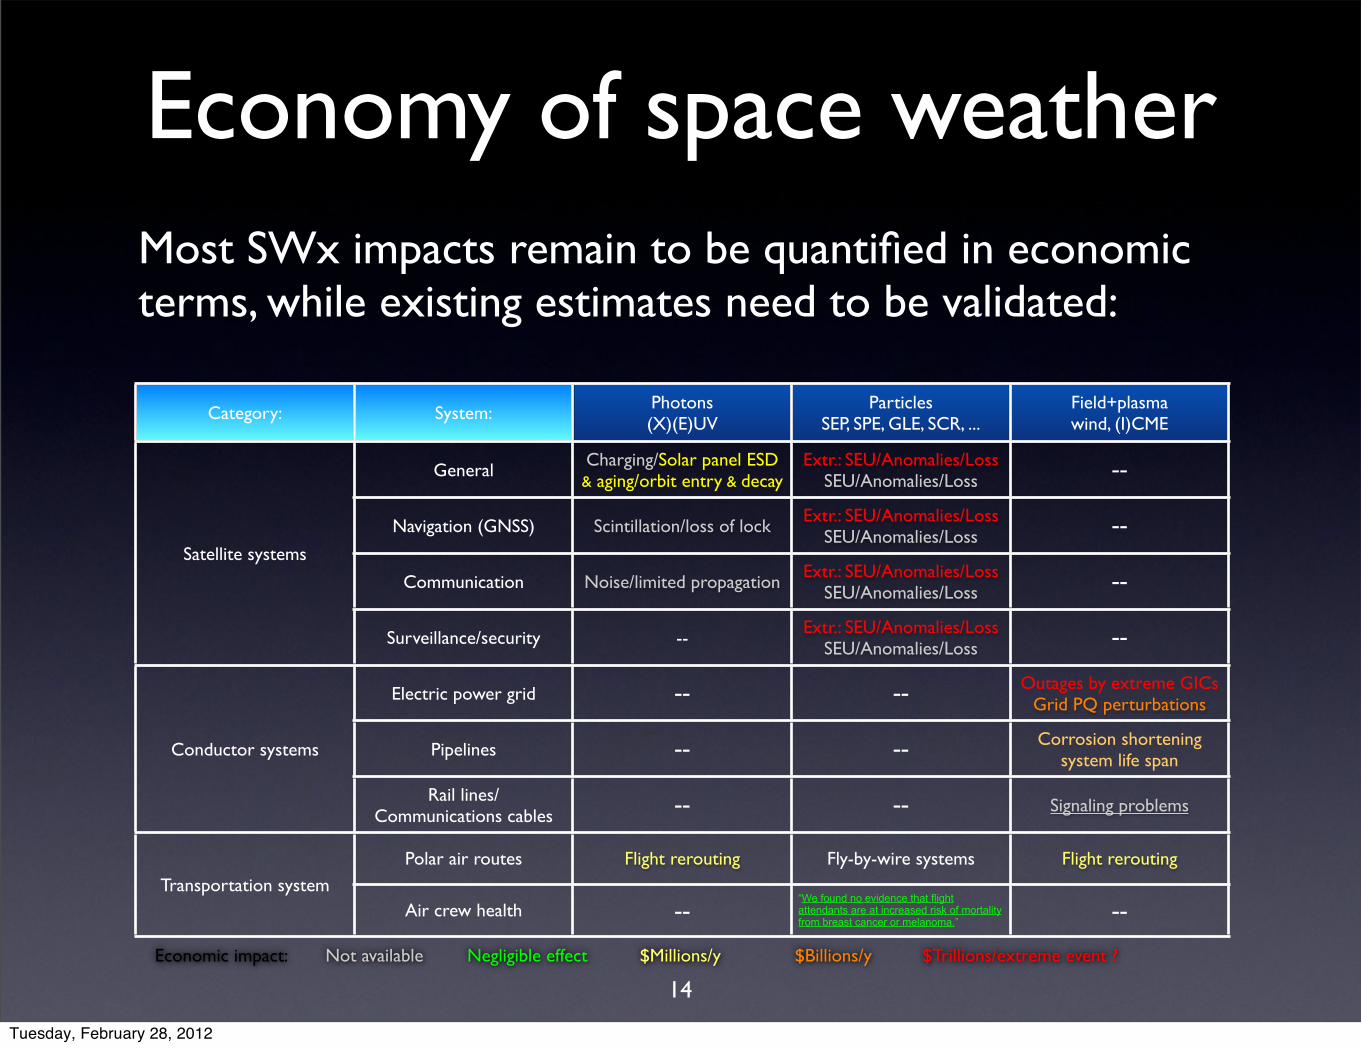
Economy of space weatherMost SWx impacts remain to be quantified in economic terms, while existing estimates need to be validated:
Category: System: Photons(X)(E)UV
ParticlesSEP, SPE, GLE, SCR, ...
Field+plasmawind, (I)CME
Satellite systems
General Charging/Solar panel ESD & aging/orbit entry & decay
Extr.: SEU/Anomalies/Loss SEU/Anomalies/Loss --
Satellite systems
Navigation (GNSS) Scintillation/loss of lock Extr.: SEU/Anomalies/LossSEU/Anomalies/Loss --
Satellite systems
Communication Noise/limited propagation Extr.: SEU/Anomalies/Loss SEU/Anomalies/Loss --
Satellite systems
Surveillance/security -- Extr.: SEU/Anomalies/Loss SEU/Anomalies/Loss --
Conductor systems
Electric power grid -- -- Outages by extreme GICsGrid PQ perturbations
Conductor systems Pipelines -- -- Corrosion shortening system life spanConductor systems
Rail lines/ Communications cables -- -- Signaling problems
Transportation systemPolar air routes Flight rerouting Fly-by-wire systems Flight rerouting
Transportation systemAir crew health --
“We found no evidence that flight attendants are at increased risk of mortality from breast cancer or melanoma.” --
Not available $Millions/y $Billions/y $Trillions/extreme event ?Negligible effectEconomic impact:
14
Tuesday, February 28, 2012

Solar-flare induced disturbances in the U.S.electric grid and their economic impact
Karel Schrijver and Sarah Mitchell
Estimating the frequency of extremely energetic solar events, based on solar, stellar, lunar, and terrestrial records
Karel Schrijver, Juerg Beer, Urs Baltensperger, Ed Cliver,Manuel Guedel, Hugh Hudson, Ken McCracken,
Rachel Osten, Thomas Peter, David Soderblom, Ilya Usoskin, and Eric Wolff
II:
I:
15
Tuesday, February 28, 2012
Or: how to determine statistics of rare solar events based on existing or obtainable records or models?
Estimating the frequency of extremely energetic solar events, based on solar, stellar, lunar, and terrestrial records
Karel Schrijver, Juerg Beer, Urs Baltensperger, Ed Cliver,Manuel Guedel, Hugh Hudson, Ken McCracken,
Rachel Osten, Thomas Peter, David Soderblom, Ilya Usoskin, and Eric Wolff
16
Tuesday, February 28, 2012
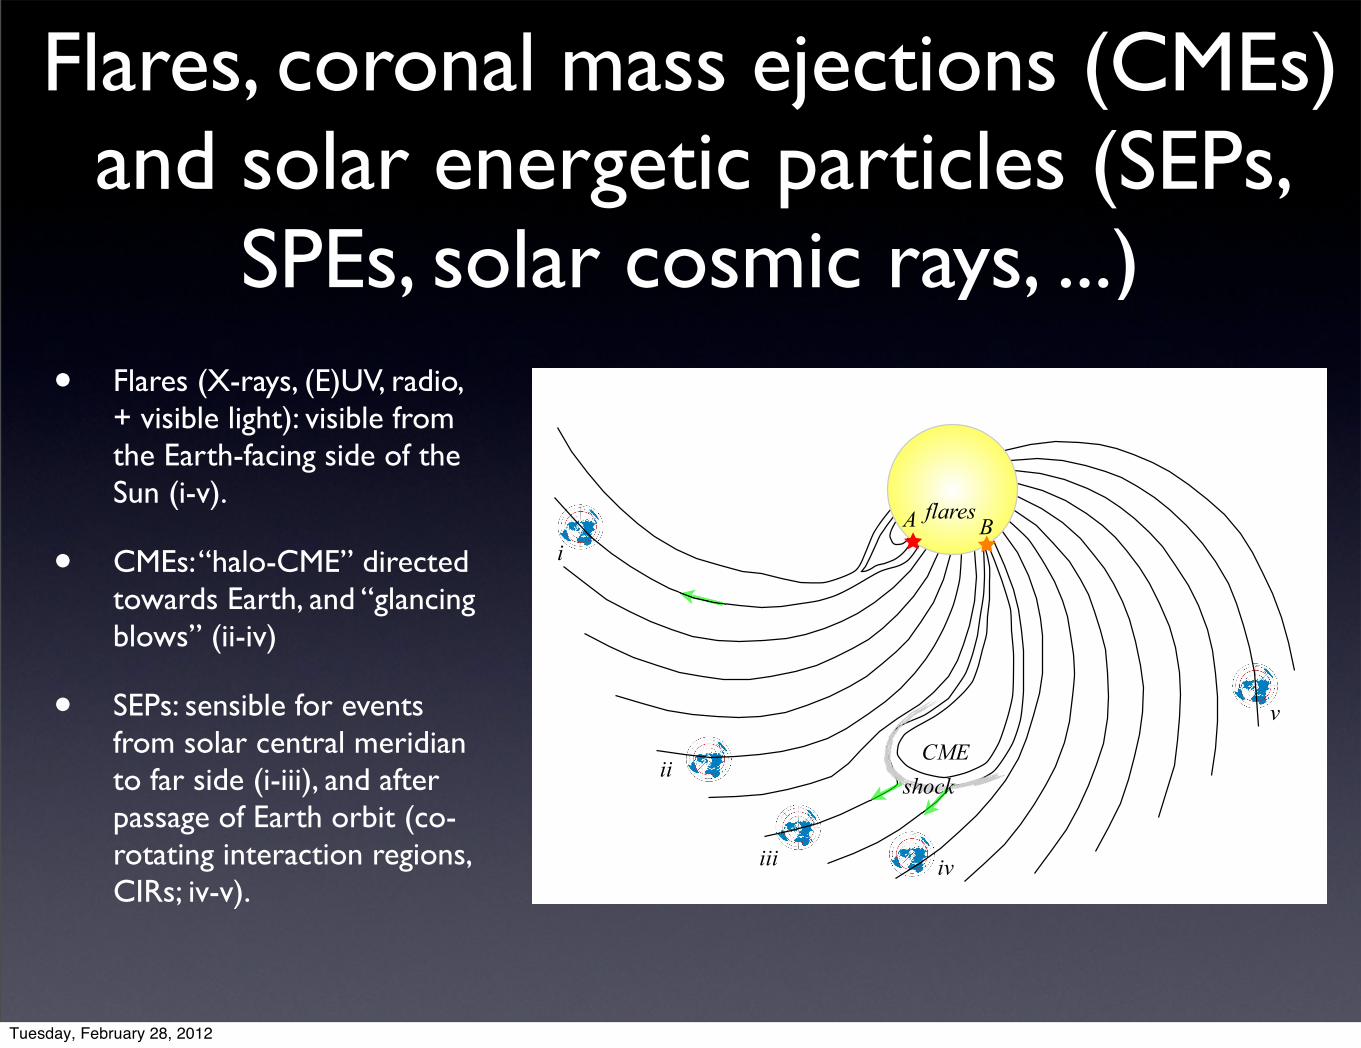
Flares, coronal mass ejections (CMEs) and solar energetic particles (SEPs,
SPEs, solar cosmic rays, ...)• Flares (X-rays, (E)UV, radio,
+ visible light): visible from the Earth-facing side of the Sun (i-v).
• CMEs: “halo-CME” directed towards Earth, and “glancing blows” (ii-iv)
• SEPs: sensible for events from solar central meridian to far side (i-iii), and after passage of Earth orbit (co-rotating interaction regions, CIRs; iv-v).
A Bi
ii
iii iv
v
CME
flares
shock
Tuesday, February 28, 2012
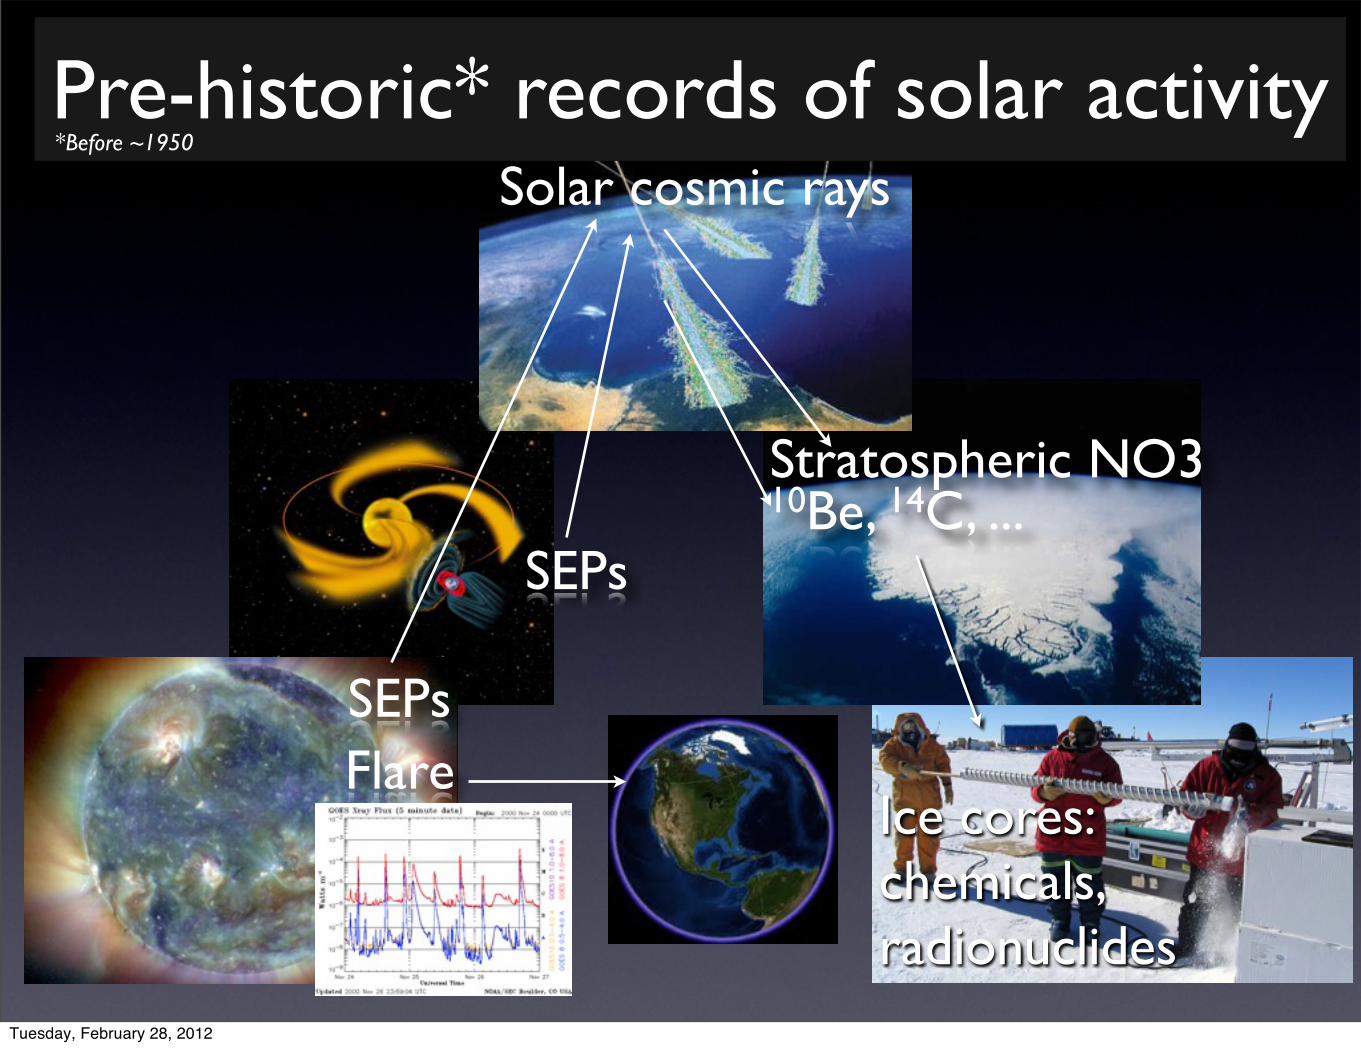
Pre-historic* records of solar activity*Before ~1950
Solar cosmic rays
SEPs
FlareSEPs
Stratospheric NO3
Ice cores:chemicals, radionuclides
10Be, 14C, ...
Tuesday, February 28, 2012
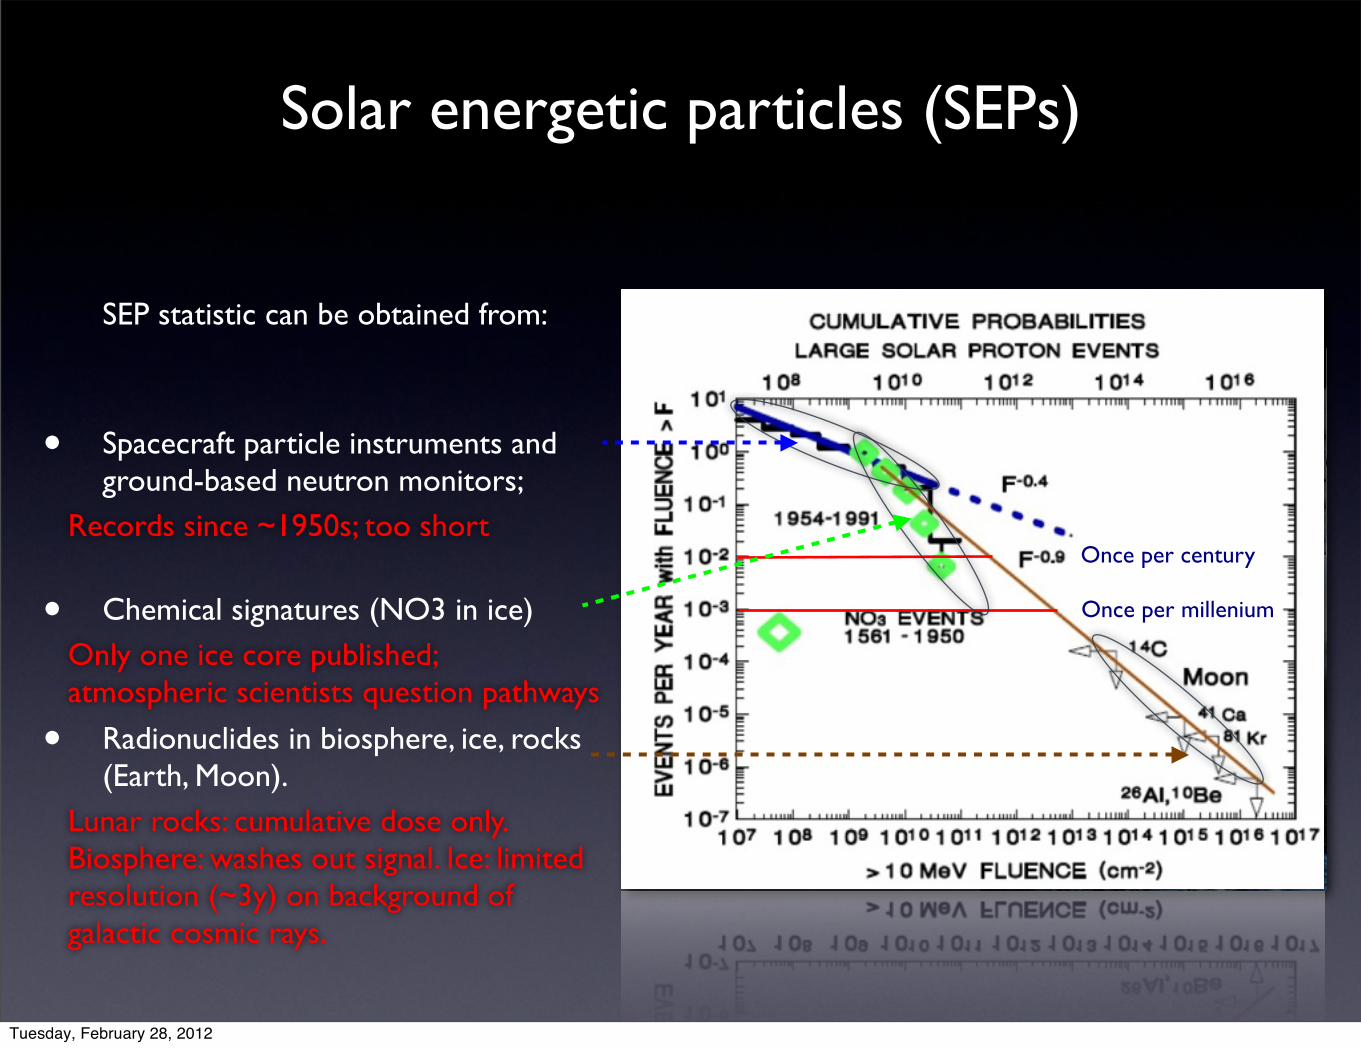
Solar energetic particles (SEPs)
SEP statistic can be obtained from:
• Spacecraft particle instruments and ground-based neutron monitors;
• Chemical signatures (NO3 in ice)
• Radionuclides in biosphere, ice, rocks (Earth, Moon).
Once per millenium
Once per centuryRecords since ~1950s; too short
Only one ice core published; atmospheric scientists question pathways
Lunar rocks: cumulative dose only. Biosphere: washes out signal. Ice: limited resolution (~3y) on background of galactic cosmic rays.
Tuesday, February 28, 2012
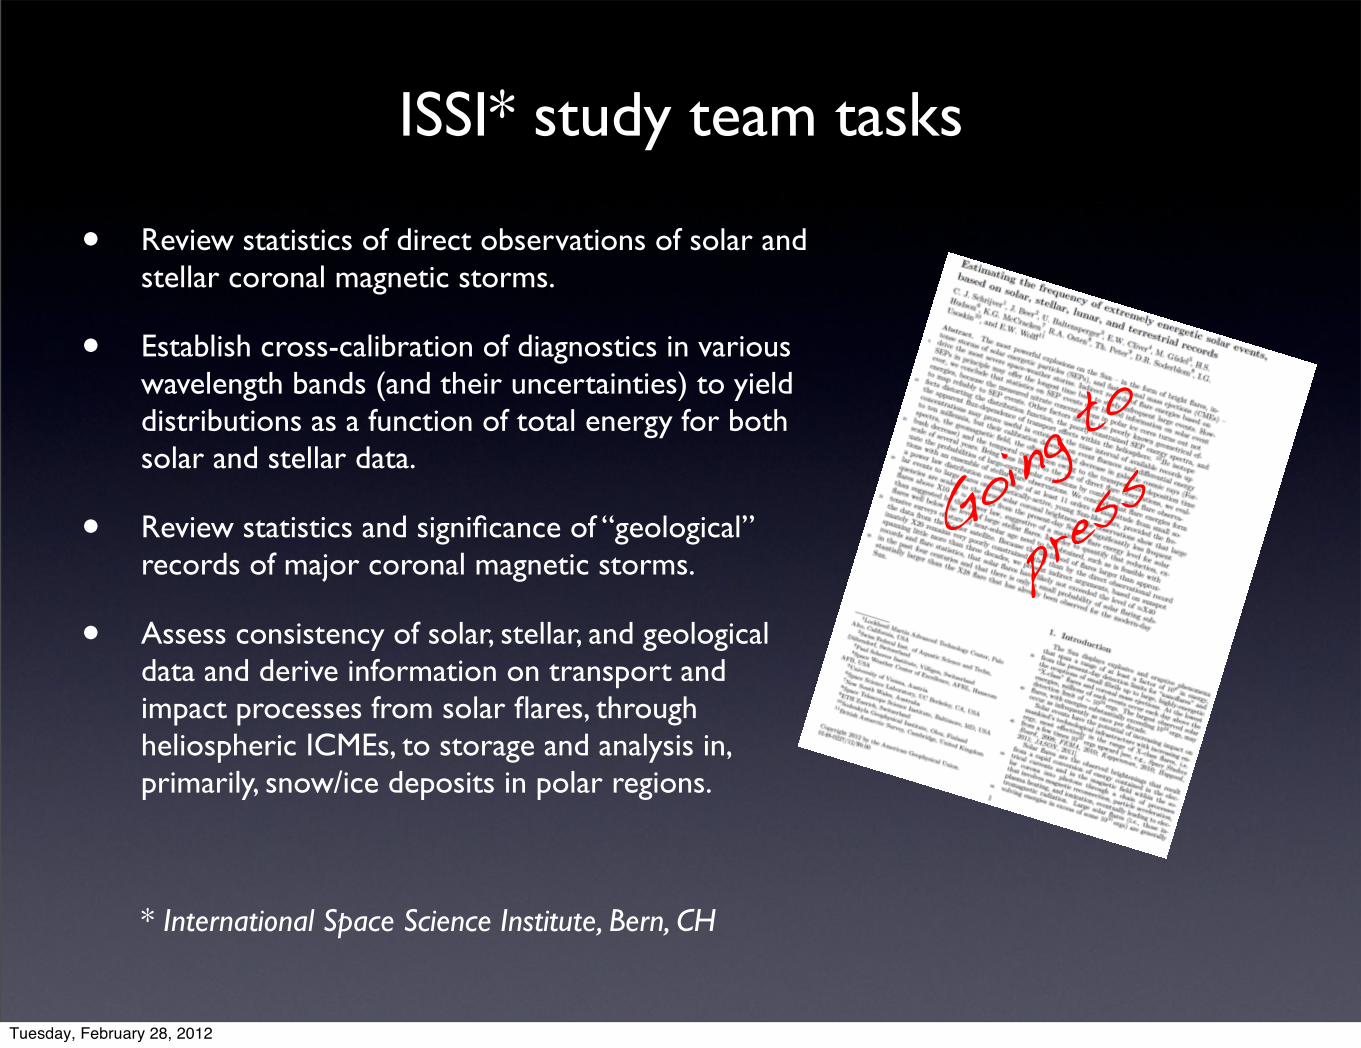
ISSI* study team tasks
• Review statistics of direct observations of solar and stellar coronal magnetic storms.
• Establish cross-calibration of diagnostics in various wavelength bands (and their uncertainties) to yield distributions as a function of total energy for both solar and stellar data.
• Review statistics and significance of “geological” records of major coronal magnetic storms.
• Assess consistency of solar, stellar, and geological data and derive information on transport and impact processes from solar flares, through heliospheric ICMEs, to storage and analysis in, primarily, snow/ice deposits in polar regions.
* International Space Science Institute, Bern, CH
Going to
press
Tuesday, February 28, 2012
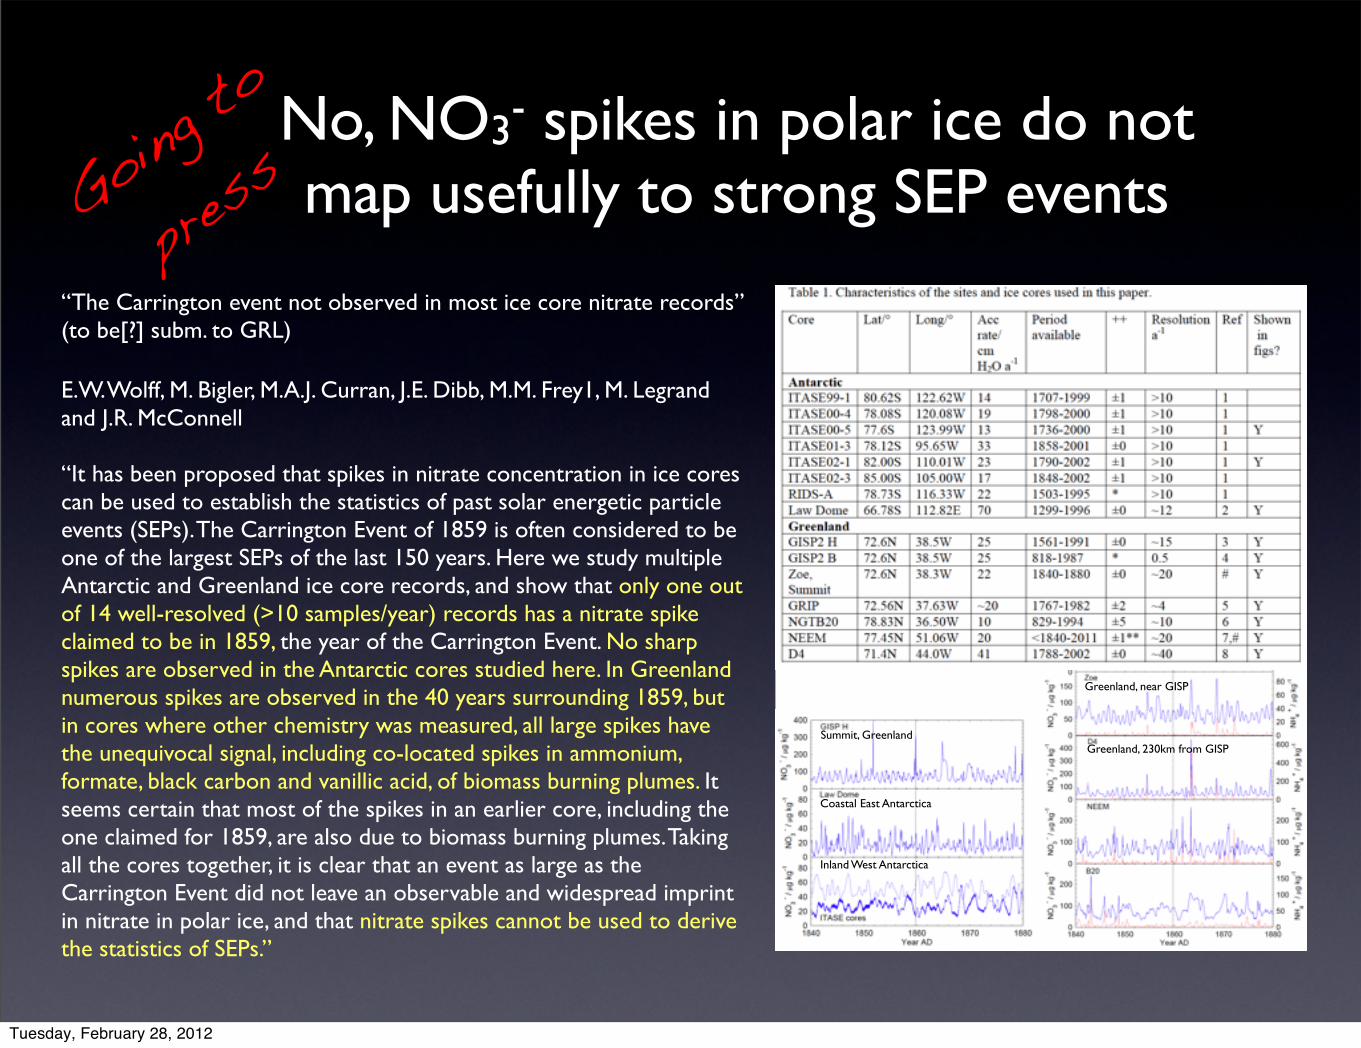
No, NO3- spikes in polar ice do not map usefully to strong SEP events
“The Carrington event not observed in most ice core nitrate records” (to be[?] subm. to GRL)
E.W. Wolff, M. Bigler, M.A.J. Curran, J.E. Dibb, M.M. Frey1, M. Legrand and J.R. McConnell
“It has been proposed that spikes in nitrate concentration in ice cores can be used to establish the statistics of past solar energetic particle events (SEPs). The Carrington Event of 1859 is often considered to be one of the largest SEPs of the last 150 years. Here we study multiple Antarctic and Greenland ice core records, and show that only one out of 14 well-resolved (>10 samples/year) records has a nitrate spike claimed to be in 1859, the year of the Carrington Event. No sharp spikes are observed in the Antarctic cores studied here. In Greenland numerous spikes are observed in the 40 years surrounding 1859, but in cores where other chemistry was measured, all large spikes have the unequivocal signal, including co-located spikes in ammonium, formate, black carbon and vanillic acid, of biomass burning plumes. It seems certain that most of the spikes in an earlier core, including the one claimed for 1859, are also due to biomass burning plumes. Taking all the cores together, it is clear that an event as large as the Carrington Event did not leave an observable and widespread imprint in nitrate in polar ice, and that nitrate spikes cannot be used to derive the statistics of SEPs.”
Summit, Greenland
Coastal East Antarctica
Inland West Antarctica
Greenland, near GISP
Greenland, 230km from GISP
Going to
press
Tuesday, February 28, 2012
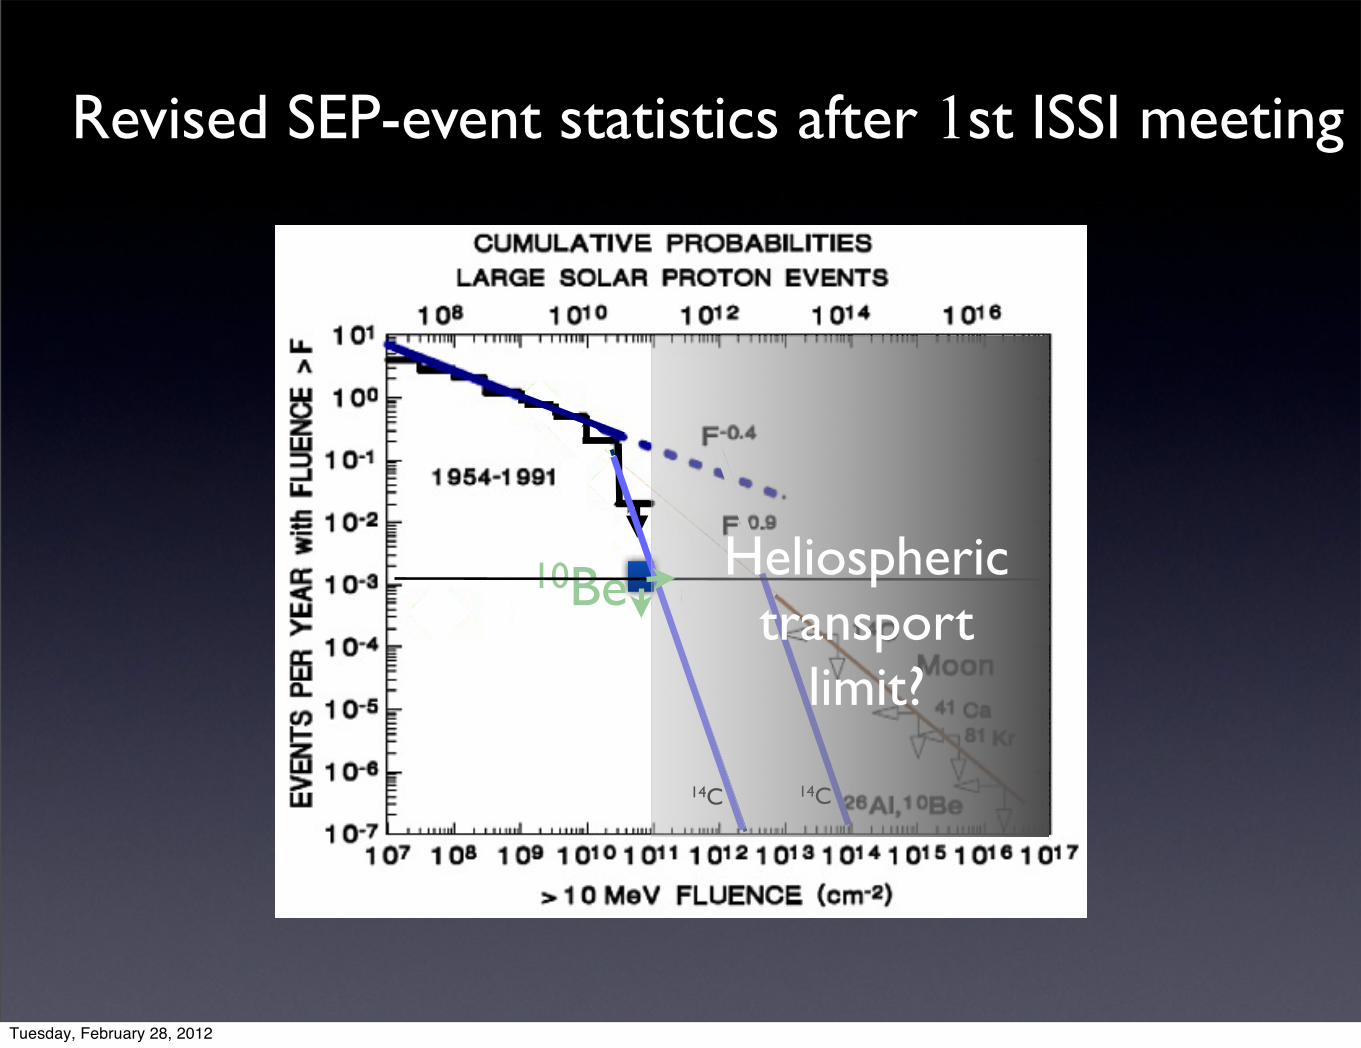
Revised SEP-event statistics after 1st ISSI meeting
14C
10Be
14C
Heliospheric transport
limit?
Tuesday, February 28, 2012
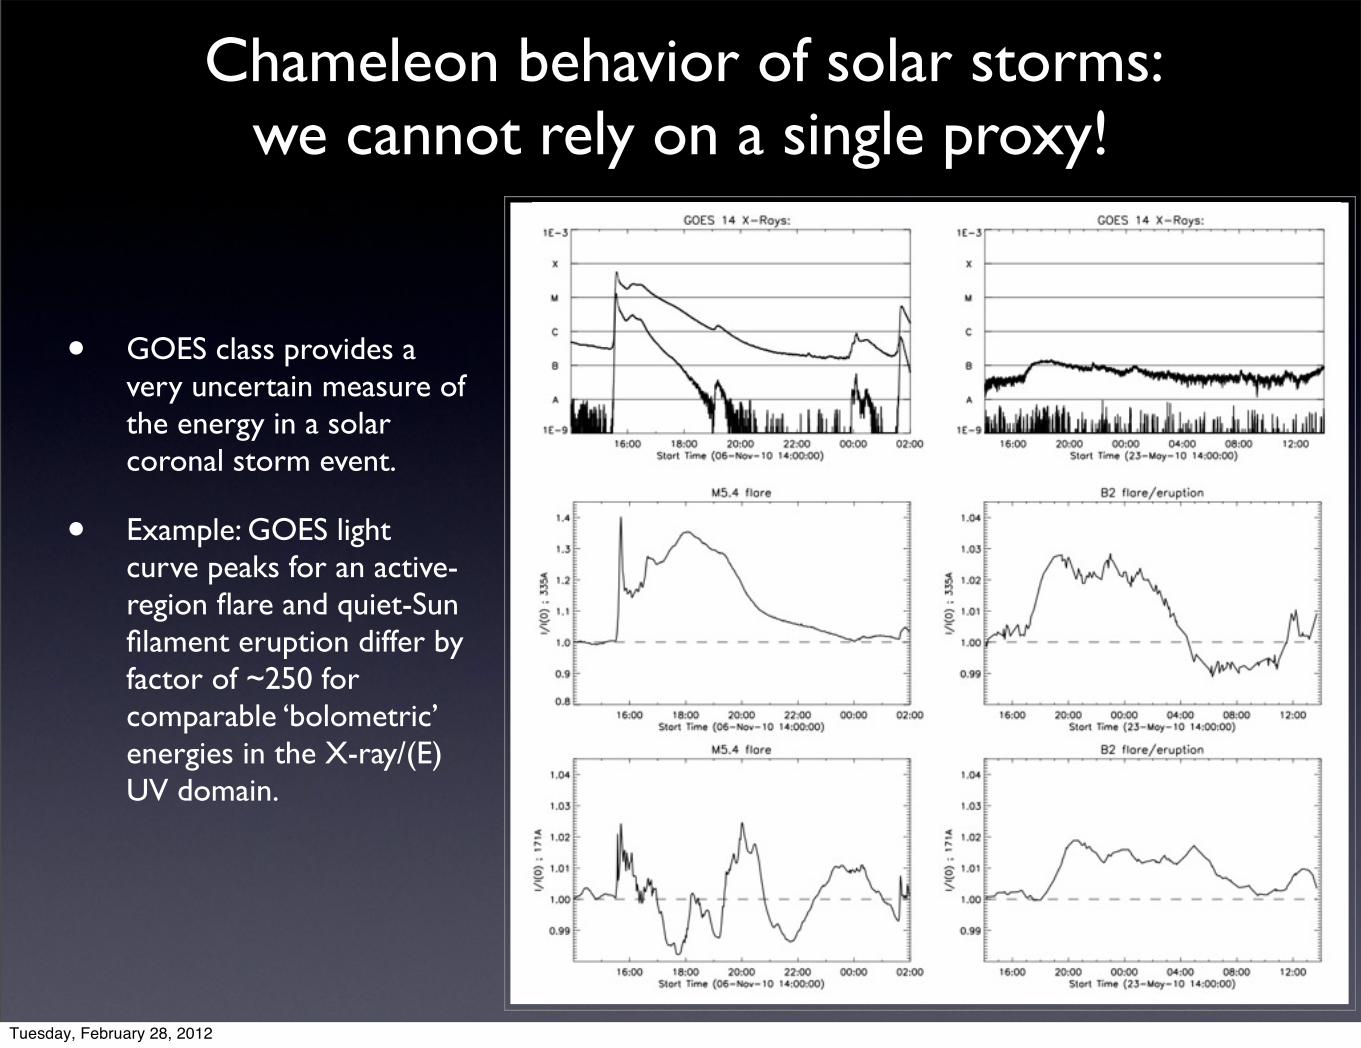
Chameleon behavior of solar storms: we cannot rely on a single proxy!
• GOES class provides a very uncertain measure of the energy in a solar coronal storm event.
• Example: GOES light curve peaks for an active-region flare and quiet-Sun filament eruption differ by factor of ~250 for comparable ‘bolometric’ energies in the X-ray/(E)UV domain.
Tuesday, February 28, 2012
!"#$%&'()*+,&-%().+!#/&()0+&-%()1+&-!/
" % ," ,% 2" 2% &"
!,"
!%
"
%
,"
3456)789:0;)<=>
" % ," ,% 2" 2% &"
!#?,"#
!!?,"#
!2?,"#
"
2?,"#
!?,"#
#?,"#
2:@)@;*AB9CAB;
"-" "-, "-2 "-&D9EF
"
2
!
#
$
,"
7GH!IJ)+)"-""%
!)D;K9E)CAL;)+),-!##)8*F())CMC94);:;*0E)+),-,2;N&/);*0F();OO;KCAB;)PA@C8)+)"-,%/8*F
!)*;@)4A:;F);:B;4MQ;),")FA0L9)9P9E)O*ML)L;@A9:!)@A9LM:@)A:@AK9C;F)C8;)OA*FC)QMA:C)MO)9)O49*;)QAKR;@)5Q)SE)940M*AC8L
!)S45;)@9F8;@)4A:;T)OACC;@)S9KR0*M5:@)U59@*9CAK!)S49KR)@9F8;@)4A:;T)MB;*944)OACC;@)K5*B;
!)S49KR)SM6T)OACC;@)@9C9)QMA:C!)*;@)OA44;@)KA*K4;T)M*A0A:94)@9C9)QMA:C
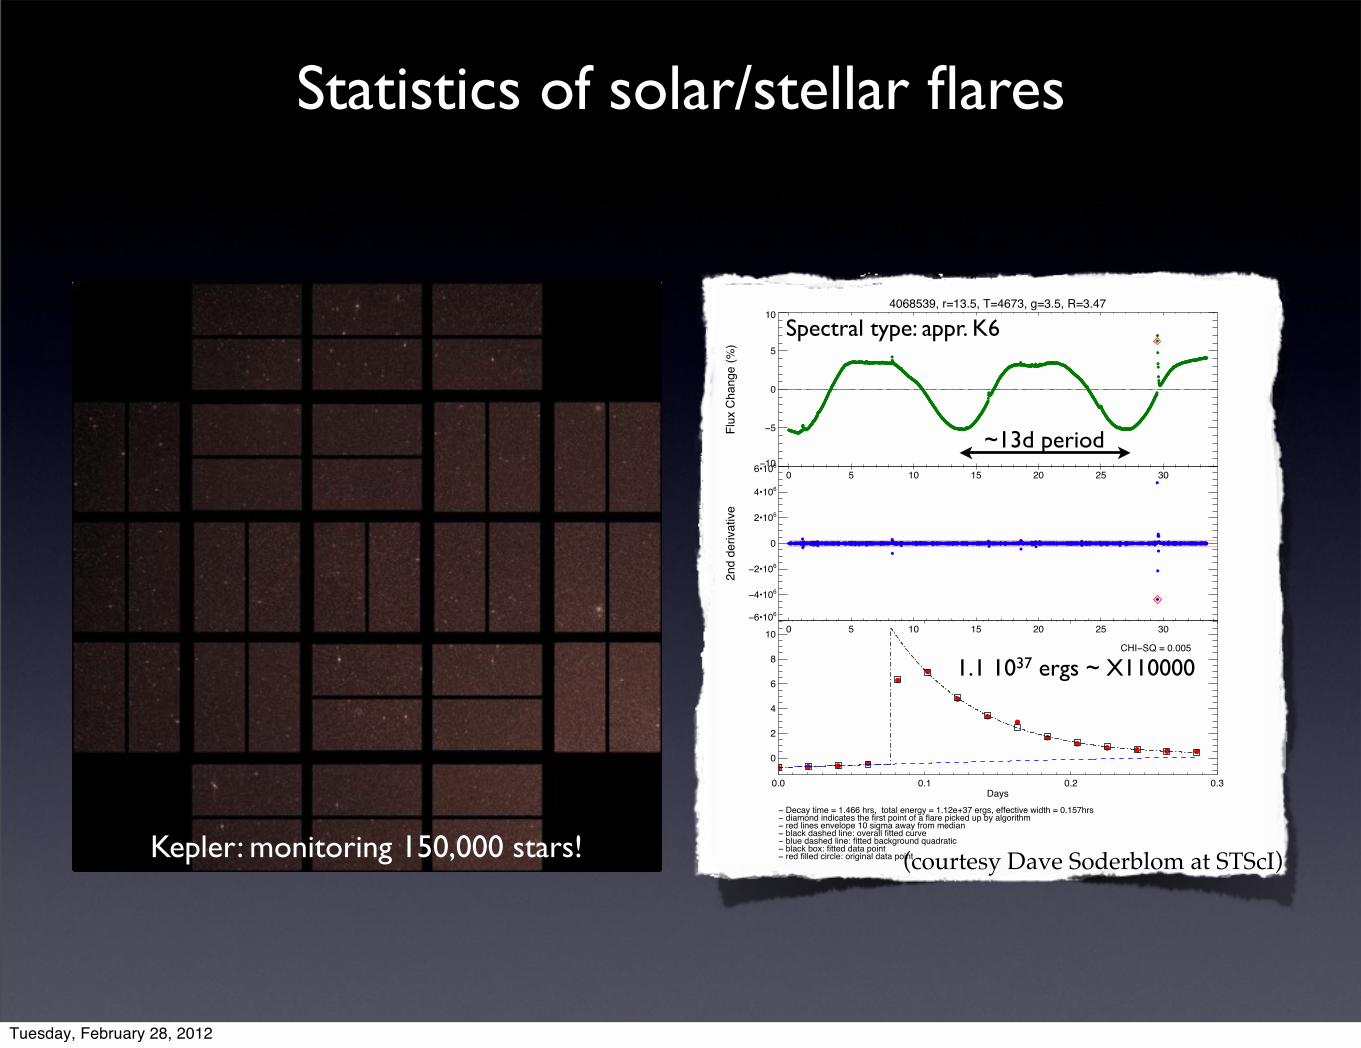
1.1 1037 ergs ~ X110000
Spectral type: appr. K6
~13d period
(courtesy Dave Soderblom at STScI)Kepler: monitoring 150,000 stars!
Statistics of solar/stellar flares
Tuesday, February 28, 2012
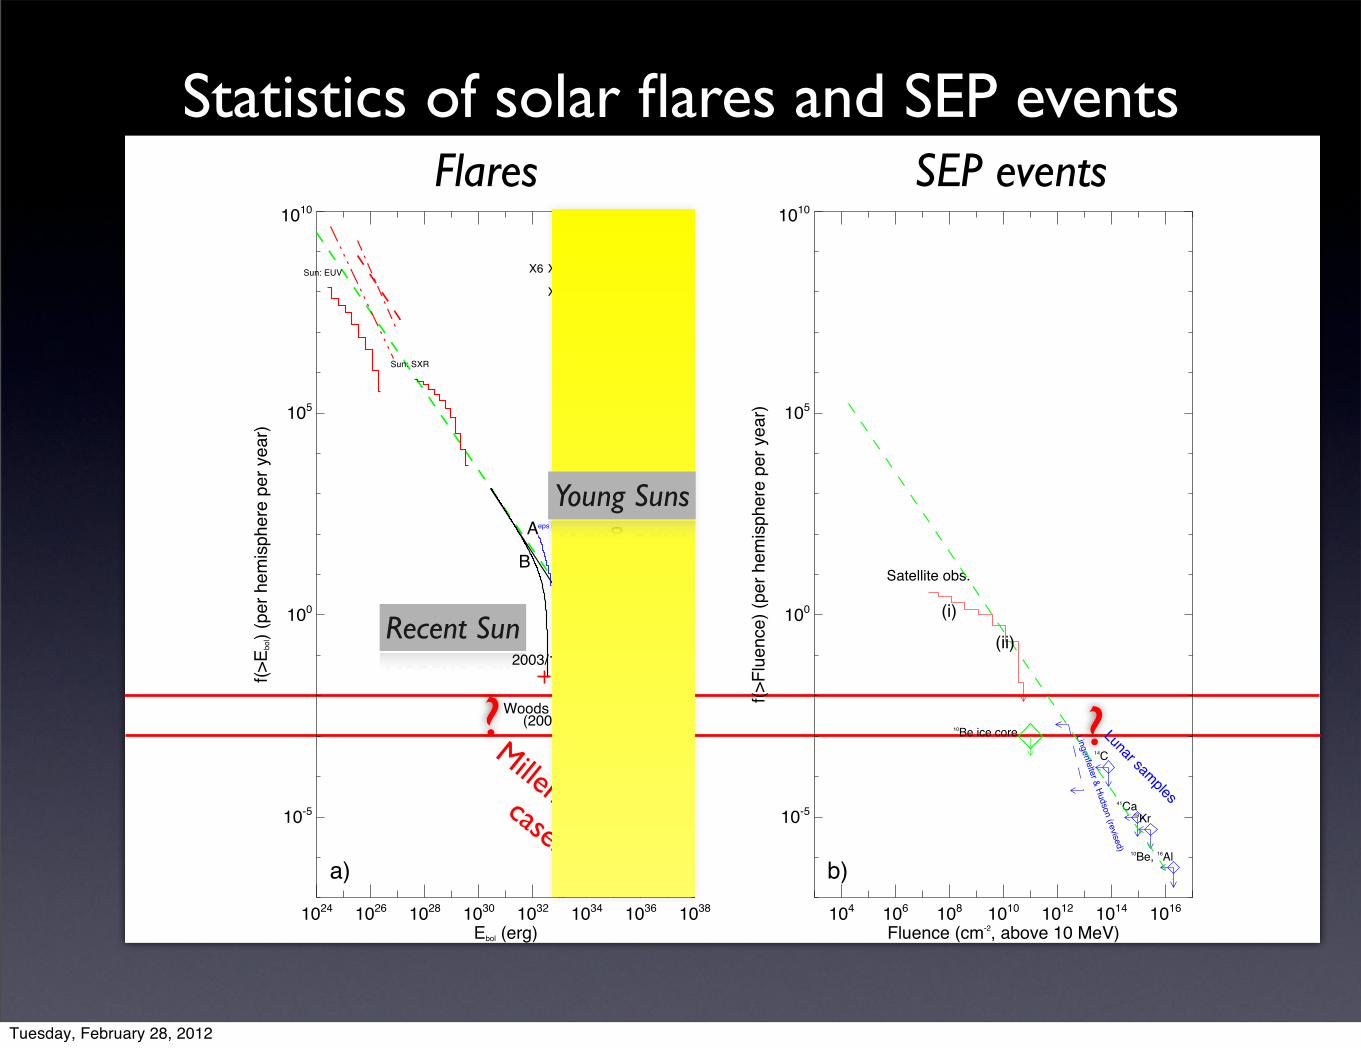
Statistics of solar flares and SEP events
? ?Millennium worst
case: X40?
Recent Sun
1024 1026 1028 1030 1032 1034 1036 1038
Ebol (erg)
10-5
100
105
1010
f(>E b
ol) (
per h
emis
pher
e pe
r yea
r)Sun: EUV
Sun: SXR
A
B47 Cas (G0-5 V)-2.68EK Dra (G1.5 V)-2.46
kap Cet, 1994 (G5 V)-1.41kap Cet, 1995 (G5 V)-1.53
AB Dor (K1 V)-2.58
eps Eri (K2 V)-1.17
X6 X2
X5
2003/11/04 X28+Kane et al.
(2005)Woods et al.
(2005)
Stellarmaximum
a)104 106 108 1010 1012 1014 1016
Fluence (cm-2, above 10 MeV)
10-5
100
105
1010
f(>Fl
uenc
e) (p
er h
emis
pher
e pe
r yea
r)
Satellite obs.
Lunar samples
14C
41Ca18Kr
10Be, 16Al
Lingenfelter & Hudson (revised)
10Be ice core
(i)(ii)
b)
Flares SEP events
Young Suns
Tuesday, February 28, 2012
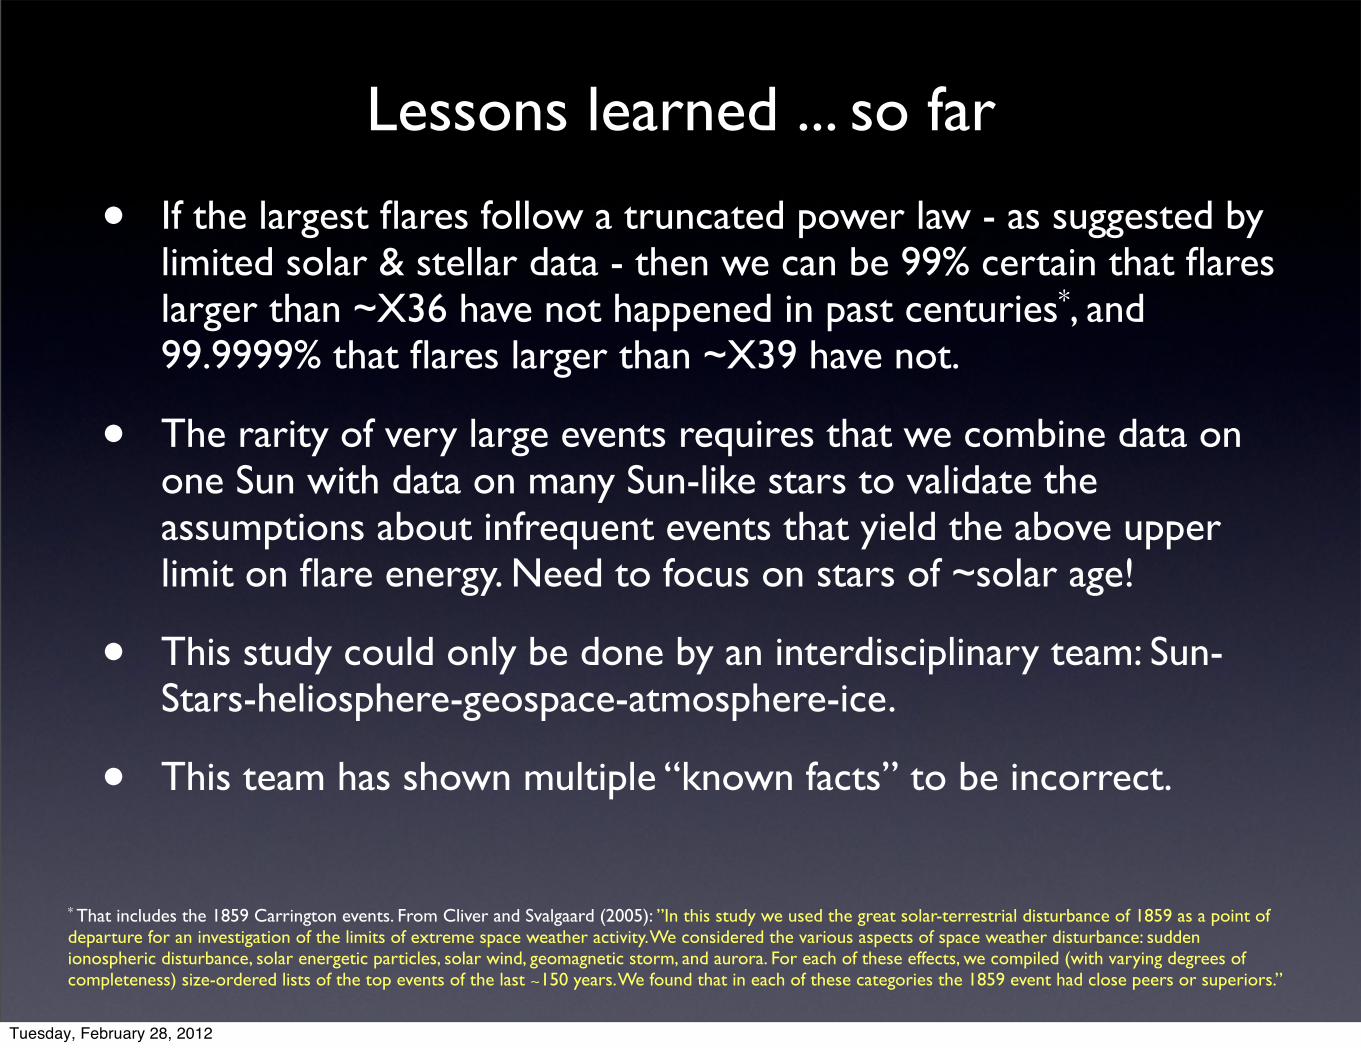
Lessons learned ... so far
• If the largest flares follow a truncated power law - as suggested by limited solar & stellar data - then we can be 99% certain that flares larger than ~X36 have not happened in past centuries*, and 99.9999% that flares larger than ~X39 have not.
• The rarity of very large events requires that we combine data on one Sun with data on many Sun-like stars to validate the assumptions about infrequent events that yield the above upper limit on flare energy. Need to focus on stars of ~solar age!
• This study could only be done by an interdisciplinary team: Sun-Stars-heliosphere-geospace-atmosphere-ice.
• This team has shown multiple “known facts” to be incorrect.
* That includes the 1859 Carrington events. From Cliver and Svalgaard (2005): ”In this study we used the great solar-terrestrial disturbance of 1859 as a point of departure for an investigation of the limits of extreme space weather activity. We considered the various aspects of space weather disturbance: sudden ionospheric disturbance, solar energetic particles, solar wind, geomagnetic storm, and aurora. For each of these effects, we compiled (with varying degrees of completeness) size-ordered lists of the top events of the last ∼150 years. We found that in each of these categories the 1859 event had close peers or superiors.”
Tuesday, February 28, 2012

27
Tuesday, February 28, 2012
http://science.nasa.gov/media/medialibrary/2010/06/04/SpWeatherPoster1.jpg
Karel SchrijverLockheed Martin Advanced Technology Center
[email protected] ; (+1 650) 424 2907
Society and Space Weather
28
Tuesday, February 28, 2012
http://science.nasa.gov/media/medialibrary/2010/06/04/SpWeatherPoster1.jpg
Karel SchrijverLockheed Martin Advanced Technology Center
[email protected] ; (+1 650) 424 2907
Society and Space Weather
29
Tuesday, February 28, 2012

Space-weather impact studies
"[...] an estimate of $1 trillion to $2 trillion during the first year alone was given for the societal and economic costs of a “severe geomagnetic storm scenario” with recovery times of 4 to 10 years." "What are the societal and economic impacts of severe space weather? [...] While this workshop, along with its report, has gathered in one place much of what is currently known or suspected about societal and economic impacts, it has perhaps been most successful in illuminating the scope of the myriad issues involved, and the gaps in knowledge that remain to be explored in greater depth than can be accomplished in a workshop. A quantitative and comprehensive assessment of the societal and economic impacts of severe space weather will be a truly daunting task [...]"
“... in many cases, both the private and public sectors do not fully understand the level of
interconnectivity between various infra-structures and therefore do not grasp the extent of the space weather threat.“ “If industry leaders understand the impacts of geomagnetic storms on the electrical generation
and transmission system and technological equipment, they can develop plans and procedures to
make systems more resilient.” “[A] geomagnetic storm can destroy large electrical transformers which
are expensive and time consuming to replace. [...] New orders for replacement equipment can take up to 18
months or even longer to fulfill. If Sweden, Great Britain, and the United States all suffered transformer
damage from a geomagnetic storm, it would be difficult for equipment providers to prioritize which
countries should receive replacement parts."
"The risks posed by space weather are now magnified through what some commentators
have called “creeping dependency”, which means the growth of interconnect-ed systems
that business and other activities rely on. [...] Therefore a space weather event could have
wider regional and even global impacts: by triggering cascading failures across systems."
"The ideal response to space weather risks is to build robust assets and systems that can operate
through bad space weather conditions. [...] The building of robust systems will impose extra costs on business, and some measures may reduce the capacity of businesses to deliver
services to customers, therefore reducing potential income. [...] This approach relies on
obtaining information on space weather conditions and converting to a useful format."
30
Tuesday, February 28, 2012
... one year ago:• In media and in studies, the emphasis was on
“extreme events” and “Doomsday scenarios”
• We could not find the expertise to assess the validity of these scenarios.
• So, we* invited experts ...
* Alan Title and Karel Schrijver @ LM, Mike Hapgood & Richard Harrison @ UK/STFC, Pete Worden and Stephanie Langhoff @ NASA/Ames, Tom Bogdan @ NOAA/SWPC
31
Tuesday, February 28, 2012
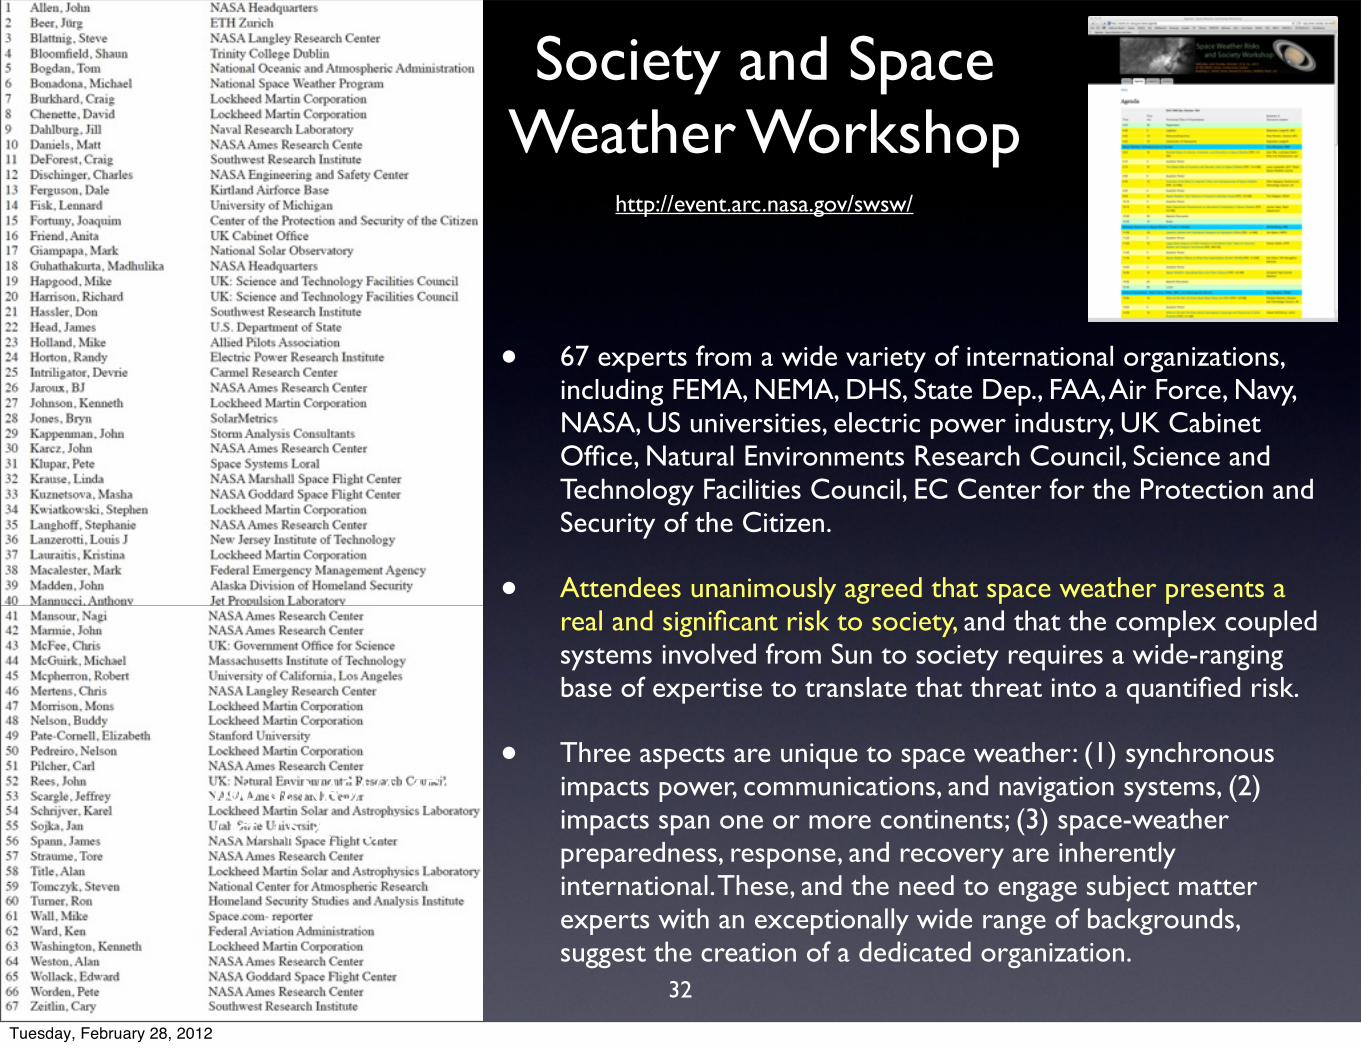
• 67 experts from a wide variety of international organizations, including FEMA, NEMA, DHS, State Dep., FAA, Air Force, Navy, NASA, US universities, electric power industry, UK Cabinet Office, Natural Environments Research Council, Science and Technology Facilities Council, EC Center for the Protection and Security of the Citizen.
• Attendees unanimously agreed that space weather presents a real and significant risk to society, and that the complex coupled systems involved from Sun to society requires a wide-ranging base of expertise to translate that threat into a quantified risk.
• Three aspects are unique to space weather: (1) synchronous impacts power, communications, and navigation systems, (2) impacts span one or more continents; (3) space-weather preparedness, response, and recovery are inherently international. These, and the need to engage subject matter experts with an exceptionally wide range of backgrounds, suggest the creation of a dedicated organization.
Society and Space Weather Workshop
Workshop at NASA/AMESOct. 15 & 16, 2011
32
http://event.arc.nasa.gov/swsw/
Tuesday, February 28, 2012
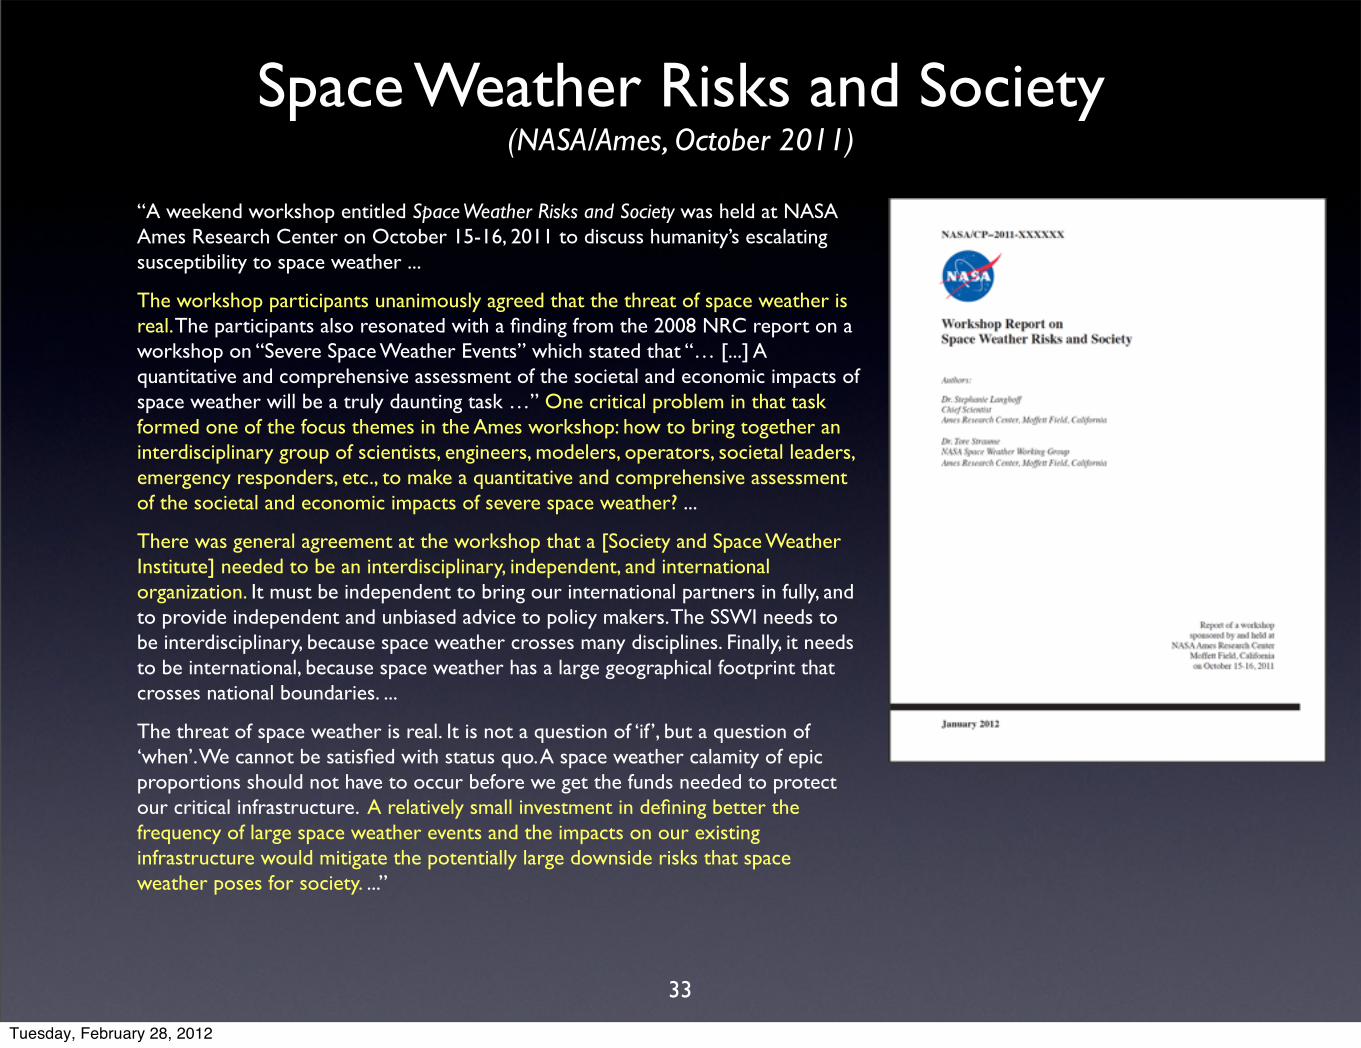
Space Weather Risks and Society(NASA/Ames, October 2011)
“A weekend workshop entitled Space Weather Risks and Society was held at NASA Ames Research Center on October 15-16, 2011 to discuss humanity’s escalating susceptibility to space weather ...
The workshop participants unanimously agreed that the threat of space weather is real. The participants also resonated with a finding from the 2008 NRC report on a workshop on “Severe Space Weather Events” which stated that “… [...] A quantitative and comprehensive assessment of the societal and economic impacts of space weather will be a truly daunting task …” One critical problem in that task formed one of the focus themes in the Ames workshop: how to bring together an interdisciplinary group of scientists, engineers, modelers, operators, societal leaders, emergency responders, etc., to make a quantitative and comprehensive assessment of the societal and economic impacts of severe space weather? ...
There was general agreement at the workshop that a [Society and Space Weather Institute] needed to be an interdisciplinary, independent, and international organization. It must be independent to bring our international partners in fully, and to provide independent and unbiased advice to policy makers. The SSWI needs to be interdisciplinary, because space weather crosses many disciplines. Finally, it needs to be international, because space weather has a large geographical footprint that crosses national boundaries. ...
The threat of space weather is real. It is not a question of ‘if ’, but a question of ‘when’. We cannot be satisfied with status quo. A space weather calamity of epic proportions should not have to occur before we get the funds needed to protect our critical infrastructure. A relatively small investment in defining better the frequency of large space weather events and the impacts on our existing infrastructure would mitigate the potentially large downside risks that space weather poses for society. ...”
33
Tuesday, February 28, 2012
Space-Weather Awareness Dialogue(EC/JRC Brussels; October 2011)
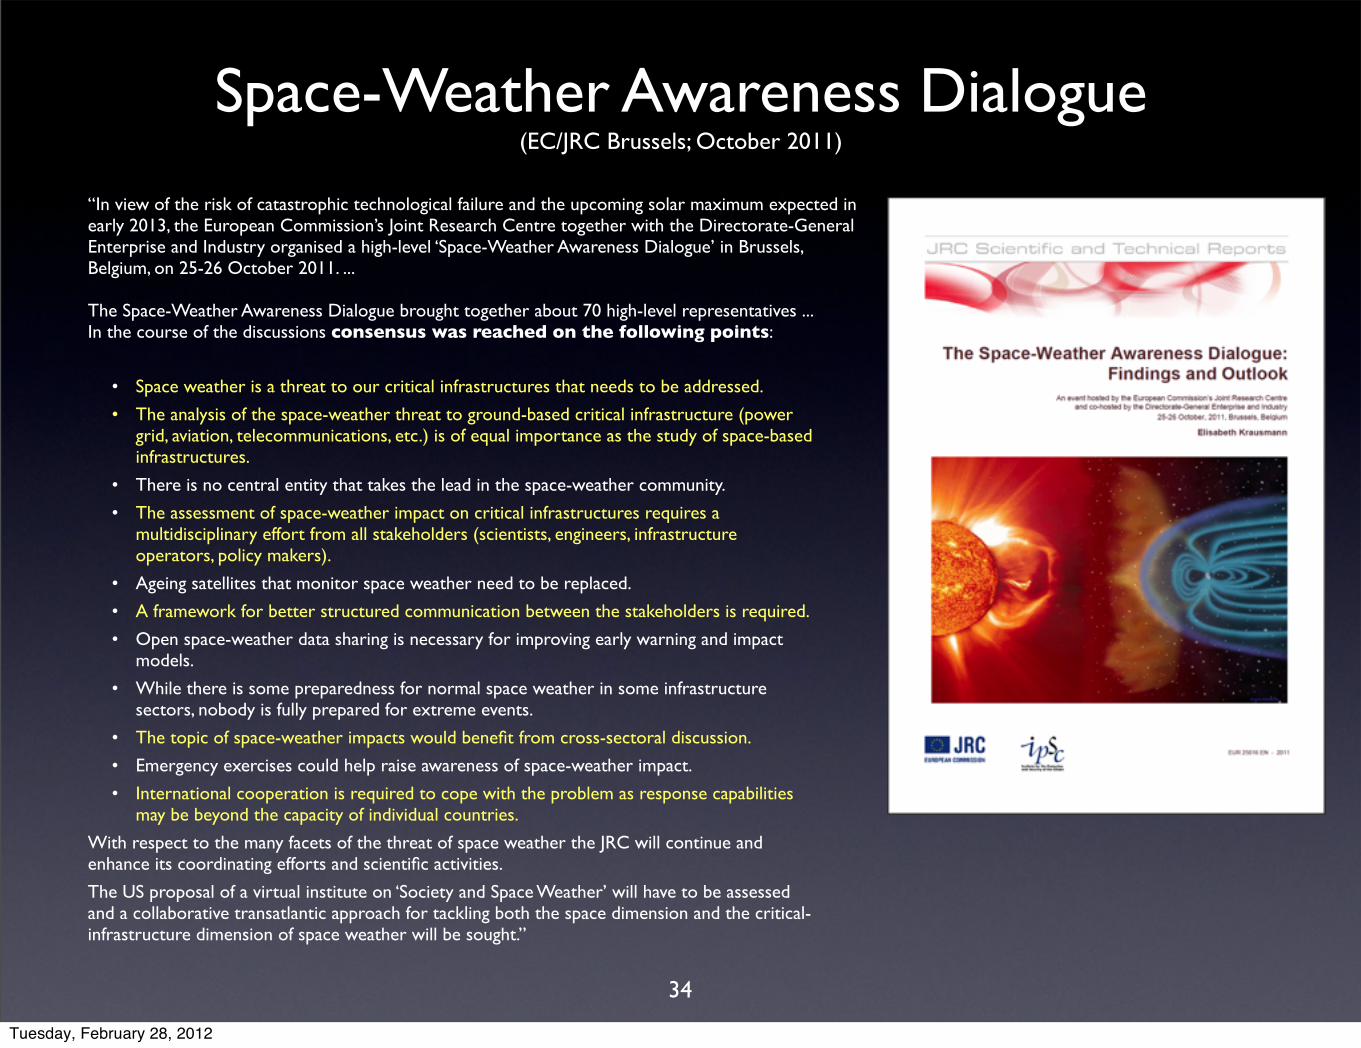
“In view of the risk of catastrophic technological failure and the upcoming solar maximum expected in early 2013, the European Commission’s Joint Research Centre together with the Directorate-General Enterprise and Industry organised a high-level ‘Space-Weather Awareness Dialogue’ in Brussels, Belgium, on 25-26 October 2011. ...
The Space-Weather Awareness Dialogue brought together about 70 high-level representatives ... In the course of the discussions consensus was reached on the following points:
• Space weather is a threat to our critical infrastructures that needs to be addressed.
• The analysis of the space-weather threat to ground-based critical infrastructure (power grid, aviation, telecommunications, etc.) is of equal importance as the study of space-based infrastructures.
• There is no central entity that takes the lead in the space-weather community.
• The assessment of space-weather impact on critical infrastructures requires a multidisciplinary effort from all stakeholders (scientists, engineers, infrastructure operators, policy makers).
• Ageing satellites that monitor space weather need to be replaced.
• A framework for better structured communication between the stakeholders is required.
• Open space-weather data sharing is necessary for improving early warning and impact models.
• While there is some preparedness for normal space weather in some infrastructure sectors, nobody is fully prepared for extreme events.
• The topic of space-weather impacts would benefit from cross-sectoral discussion.
• Emergency exercises could help raise awareness of space-weather impact.
• International cooperation is required to cope with the problem as response capabilities may be beyond the capacity of individual countries.
With respect to the many facets of the threat of space weather the JRC will continue and enhance its coordinating efforts and scientific activities.
The US proposal of a virtual institute on ‘Society and Space Weather’ will have to be assessed and a collaborative transatlantic approach for tackling both the space dimension and the critical-infrastructure dimension of space weather will be sought.”
34
Tuesday, February 28, 2012
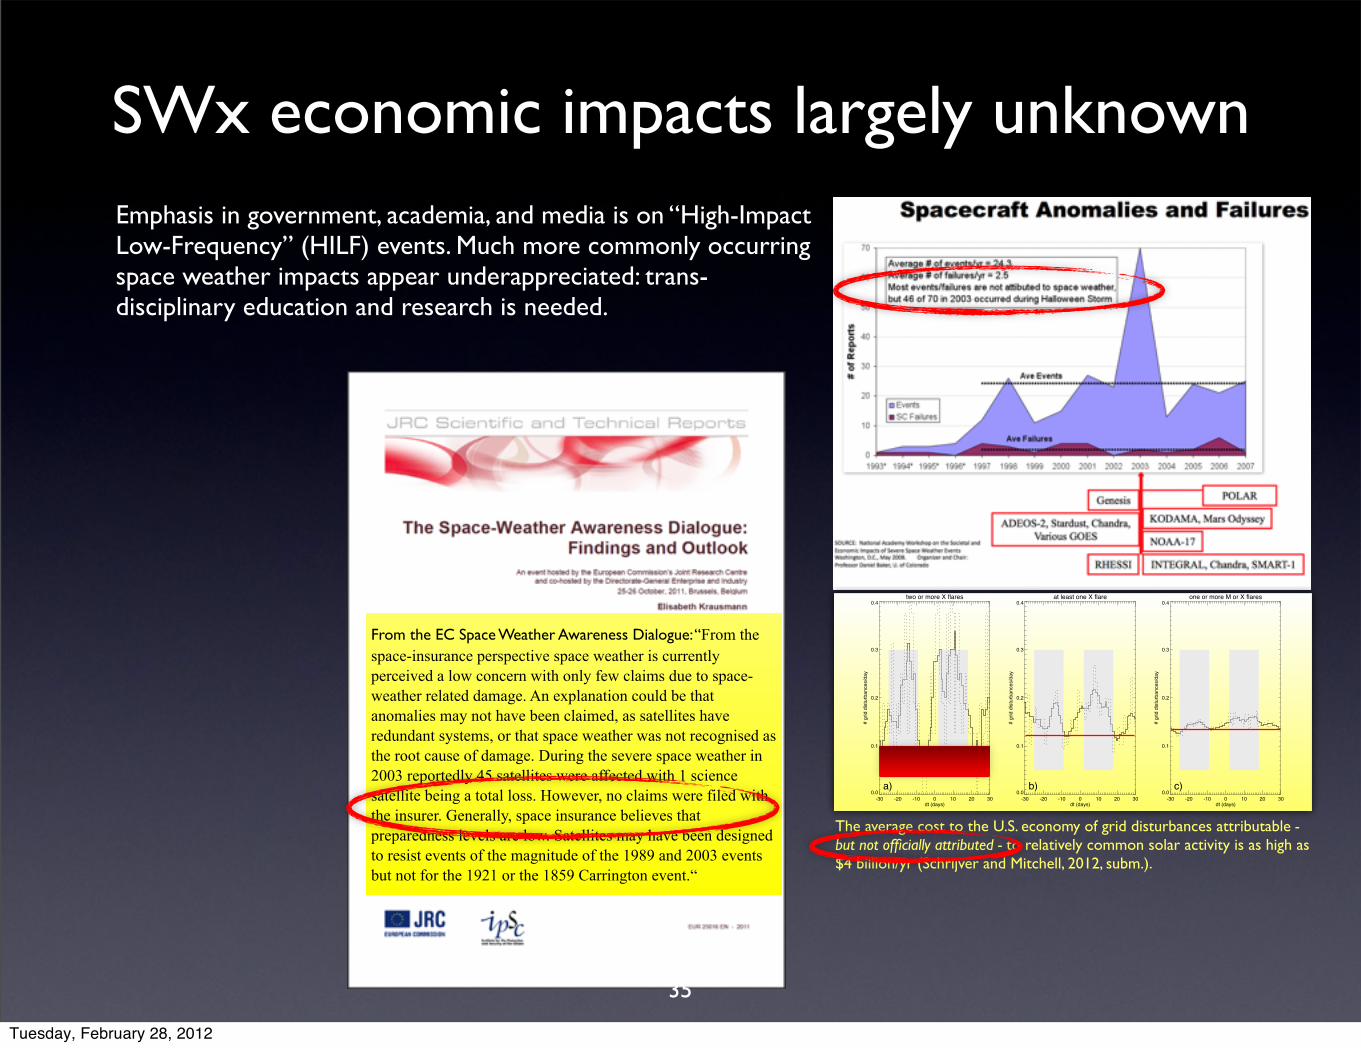
SWx economic impacts largely unknownEmphasis in government, academia, and media is on “High-Impact Low-Frequency” (HILF) events. Much more commonly occurring space weather impacts appear underappreciated: trans-disciplinary education and research is needed.
The average cost to the U.S. economy of grid disturbances attributable - but not officially attributed - to relatively common solar activity is as high as $4 billion/yr (Schrijver and Mitchell, 2012, subm.).
two or more X flares
-30 -20 -10 0 10 20 30dt (days)
0.0
0.1
0.2
0.3
0.4
# gr
id d
istu
rban
ces/
day
a)
at least one X flare
-30 -20 -10 0 10 20 30dt (days)
0.0
0.1
0.2
0.3
0.4
# gr
id d
istu
rban
ces/
day
b)
one or more M or X flares
-30 -20 -10 0 10 20 30dt (days)
0.0
0.1
0.2
0.3
0.4
# gr
id d
istu
rban
ces/
day
c)
From the EC Space Weather Awareness Dialogue: “From the space-insurance perspective space weather is currently perceived a low concern with only few claims due to space-weather related damage. An explanation could be that anomalies may not have been claimed, as satellites have redundant systems, or that space weather was not recognised as the root cause of damage. During the severe space weather in 2003 reportedly 45 satellites were affected with 1 science satellite being a total loss. However, no claims were filed with the insurer. Generally, space insurance believes that preparedness levels are low. Satellites may have been designed to resist events of the magnitude of the 1989 and 2003 events but not for the 1921 or the 1859 Carrington event.“
35
Tuesday, February 28, 2012

Economy of space weatherMost SWx impacts remain to be quantified in economic terms, while existing estimates need to be validated:
Category: System: Photons(X)(E)UV
ParticlesSEP, SPE, GLE, SCR, ...
Field+plasmawind, (I)CME
Satellite systems
General Charging/Solar panel ESD & aging/orbit entry & decay
Extr.: SEU/Anomalies/Loss SEU/Anomalies/Loss --
Satellite systems
Navigation (GNSS) Scintillation/loss of lock Extr.: SEU/Anomalies/LossSEU/Anomalies/Loss --
Satellite systems
Communication Noise/limited propagation Extr.: SEU/Anomalies/Loss SEU/Anomalies/Loss --
Satellite systems
Surveillance/security -- Extr.: SEU/Anomalies/Loss SEU/Anomalies/Loss --
Conductor systems
Electric power grid -- -- Outages by extreme GICsGrid PQ perturbations
Conductor systems Pipelines -- -- Corrosion shortening system life spanConductor systems
Rail lines/ Communications cables -- -- Signaling problems
Transportation systemPolar air routes Flight rerouting Fly-by-wire systems Flight rerouting
Transportation systemAir crew health --
“We found no evidence that flight attendants are at increased risk of mortality from breast cancer or melanoma.” --
Not available $Millions/y $Billions/y $Trillions/extreme event ?Negligible effectEconomic impact:
36
Tuesday, February 28, 2012
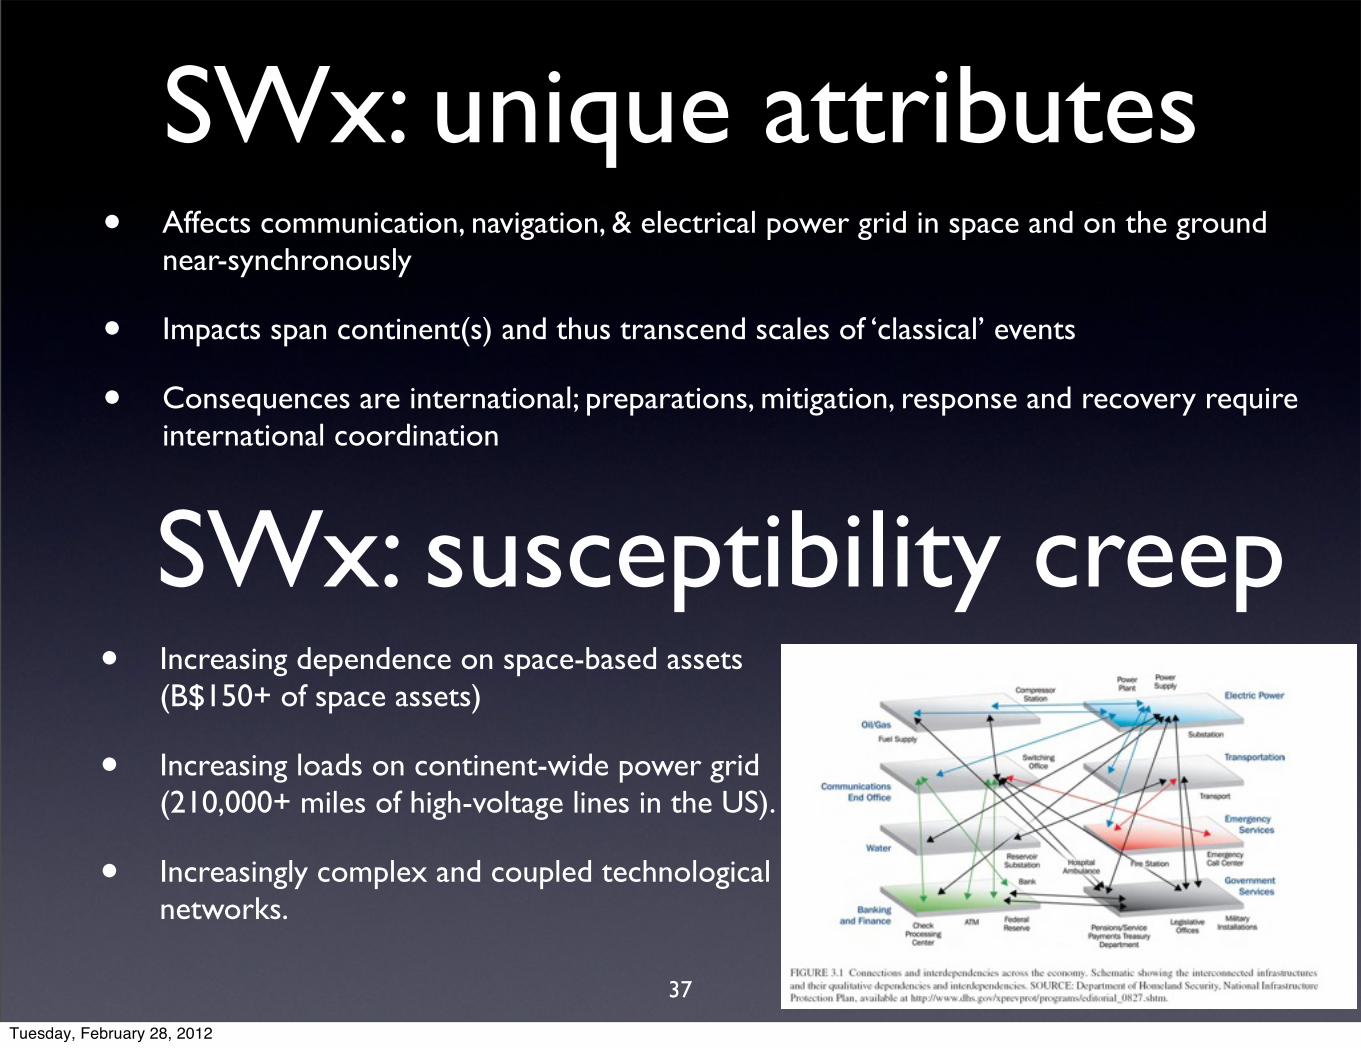
SWx: susceptibility creep• Increasing dependence on space-based assets
(B$150+ of space assets)
• Increasing loads on continent-wide power grid (210,000+ miles of high-voltage lines in the US).
• Increasingly complex and coupled technological networks.
• Affects communication, navigation, & electrical power grid in space and on the ground near-synchronously
• Impacts span continent(s) and thus transcend scales of ‘classical’ events
• Consequences are international; preparations, mitigation, response and recovery require international coordination
SWx: unique attributes
37
Tuesday, February 28, 2012
... now, one year later:• We may have evidence that extreme solar events are no
more extreme that what we have already experienced.
• We know that the susceptibility of our technological infrastructure is MUCH larger than we realized, with costs of billions each year in grid disturbances alone.
• We need to understand how to protect ourselves from the common as well as from the extreme, even as our technological infrastructure grows more susceptible and coupled.
• The investment needed to follow the path from space weather into society is expected to quickly pay for itself.
38
Tuesday, February 28, 2012

Tuesday, February 28, 2012