Embed Size (px)
Citation preview
SPAC
ES T
O TH
INK:
IN
NOVA
TION
DIS
TRIC
TS
AND
THE
CHAN
GING
GE
OGRA
PHY
OF L
ONDO
N’S
KNOW
LEDG
E EC
ONOM
YKat Hanna

SPACES TO THINK: INNOVATION DISTRICTS AND THE CHANGING GEOGRAPHY OF LONDON’S KNOWLEDGE ECONOMYKat Hanna
Published by Centre for London, April 2016

Open Access. Some rights reserved.
As the publisher of this work, Centre for London wants to encourage the circulation of our work as widely as possible while retaining the copyright. We therefore have an open access policy which enables anyone to access our content online without charge. Anyone can download, save, perform or distribute this work in any format, including translation, without written permission. This is subject to the terms of the Centre for London licence.
Its main conditions are:
· Centre for London and the author(s) are credited · This summary and the address www.centreforlondon.org are displayed · The text is not altered and is used in full · The work is not resold · A copy of the work or link to its use online is sent to Centre for London.
You are welcome to ask for permission to use this work for purposes other than those covered by the licence. Centre for London gratefully acknowledges the work of Creative Commons in inspiring our approach to copyright.
To find out more go to www.creativecommons.org
Published by: Centre for London 2016© Centre for London.Some rights reserved.1 Plough PlaceLondon EC4A 1DET: 020 3757 [email protected] Number: 8414909 Charity Number: 1151435
Typeset by Soapbox, www.soapbox.co.uk

3
Centre for London is a politically independent, not‑for‑profit think tank focused on the big challenges facing London. Through its research and events, the Centre acts as a critical friend to London’s leaders and policymakers, promotes a wider understanding of the challenges facing London, and develops long‑term, rigorous and radical policy solutions for the capital. It looks for support from a mixture of private, voluntary and public sector funders and works collaboratively with its supporters, drawing on their experience and expertise. Launched in 2011, the Centre is quickly developing relationships with sister organisations across the globe. Find out more about our work at www.centreforlondon.org.
Centre for London is a registered charity and a company limited by guarantee. Company Number: 8414909. Charity Number: 1151435.


5
ABOUT THE AUTHOR
Kat Hanna is research manager at Centre for London, where she works on housing, innovation, and London politics. She has worked on London policy issues since 2011, as a parliamentary researcher in the office of a London MP and as public affairs manager at London Chamber of Commerce. Kat has a Theology and Religious Studies degree from Cambridge University and an MSc from the School of Oriental and African Studies.

7
ACKNOWLEDGEMENTS
I would like to thank all the individuals who gave their time to help with this research. Thanks are due to the advisory panel: David Altabev (Senior Programme Manager, Government Innovation, Nesta); Tim Barnes (Enterprise Partnerships Manager, Loughborough in London, and Founder, The Rain Gods Ltd); Paul Brickell (Executive Director of Regeneration and Community Partnerships, London Legacy Development Corporation); Darryl Chen (Partner, Hawkins\Brown); James Collier (Regeneration Manager, London Borough of Croydon); Jodie Eastwood (Project Manager, Knowledge Quarter); Nick Humfrey (Higher Apprenticeship Programme Manager, Camden); Mark Kleinman (Director, Economic and Business Policy, Greater London Authority); Stafford Lancaster (Investment Director, Delancey); Jessica Crowe (Executive Head ‑ Customers Commissioning & Governance, London Borough of Sutton); Gavin Poole (CEO, Here East); Michael Riebel (Researcher, Hawkins\Brown); Henry Rummins (Communications Manager, Birkbeck University); Martyn Saunders (Associate, Bilfinger GVA); Jon Steinberg (Public Policy Manager, Google); and Daniel Stevens (Advocacy and Communications Manager, Knowledge Quarter).
My thanks also go to my colleagues at Centre for London: particularly Richard Brown, for chairing the advisory group and seeing this project through, and Brell Wilson, for his support in preparing case studies. I would also like to thank Bruce Katz and Julie Wagner of the Brookings Institution for their intellectual support and enthusiasm throughout the drafting of this report.
This project would not have been possible without the generous support of the project’s sponsors. I would like to thank Bilfinger GVA, Delancey, Future Cities Catapult, Here East, the Knowledge Quarter and the London Boroughs of Camden, Croydon, Islington and Sutton.
Additional thanks are due to Darryl Chen, Tom Fox, and Michael Riebel of Hawkins\Brown for quantitative data analysis and map design, and for their input into the conceptual framework of this report. Their spirit of investigation and collaboration has been hugely valued throughout the research process.

9
FOREWORD
London has never been starved for innovation. From world‑class universities to global corporations, research institutes and start‑ups, this city has long had the ingredients needed for a successful knowledge economy.
Across Europe and the United States, however, other places are starting to catch up. Changing global dynamics – from demographic preferences of workers to the industry shift towards open innovation – are bringing more innovative activity back into cities. Smart leaders in mid‑sized cities are maximising their assets through intentional collocation and improved collaboration. Even here in the United Kingdom, places such as Manchester and Sheffield are growing specialised innovation districts to build on their distinct competitive advantages.
This rise of innovation districts, then, is an opportunity and an imperative to think more strategically about the innovation assets this city has – how to better connect them to the broader city and how to bring more of its residents into the knowledge economy that is growing within these districts.
As these strategies become more sophisticated, so too must our understanding of the existing districts and innovation hubs. In The Rise of Innovation Districts we identified three major types of asset that matter to successful districts: economic assets, such as universities and research‑intensive companies; physical assets – everything from public transport to broadband connectivity to public spaces; and networking assets, which represent the amount of interaction and collaboration there is between both workers in the same discipline and across disparate industries.
What follows in this report is an extensive application of this audit model to London’s multiple innovation hubs. It is precisely the type of self‑examination that cities across the United States are beginning to pursue. It is through this process that London can design strategies to enhance its competitive edge globally. And it is through this greater understanding of the nature of the knowledge economy – where it is, how it functions – that London can grow more intelligently, and in a way that is ultimately more inclusive and sustainable.
Bruce Katz, Brookings Institution inaugural centennial scholarJulie Wagner, Brookings nonresident senior fellow and co‑director, Anne T. and Robert M. Bass, Initiative on Innovation and PlacemakingAuthors, The Rise of Innovation Districts, The Brookings Institution
EXECUTIVE SUMMARY 12
INTRODUCTION – UNDERSTANDING LONDON’S KNOWLEDGE ECONOMY 20
1. INNOVATION AND THE KNOWLEDGE ECONOMY 28
2. HOW DOES LONDON MEASURE UP? 34
3. SPACES TO THINK – THE THEORY OF INNOVATION DISTRICTS 42
4. WHAT DO INNOVATION DISTRICTS OFFER LONDON? 51
5. INCLUSIVE GROWTH AND THE DEMOCRATISATION OF INNOVATION 59
6. THE URBAN FORM OF LONDON’S UNIVERSITIES, CLUSTERS AND INNOVATION DISTRICTS 67
7. THE ASSETS OF LONDON’S UNIVERSITIES, CLUSTERS AND INNOVATION DISTRICTS 78
RECOMMENDATIONS AND CONCLUSION 82
REFERENCES AND NOTES 91

EXECUTIVE SUMMARY
13
Universities and other research institutions have long been central in fostering innovation and driving growth in cities, and London is no exception. Against a global trend of growth in knowledge‑intensive sectors of modern urban economies, this is truer today than ever before. Knowledge‑intensive sectors are becoming more important to city economies, both in terms of economic output and employment numbers. At a time when employment space is at a premium, and when universities and innovation clusters are located in some of London’s most deprived boroughs, innovation districts have the potential to provide space for London’s knowledge economy while promoting inclusive economic growth.
London’s urban fabric has been consistently shaped by the city’s economic development. Traditional manufacturing required warehouses, quays, and industrial land. The growth in financial services was embodied in the large towers and trading floors of Canary Wharf. As we enter the age of the knowledge economy, we can expect to see London’s spatial form change once more. The breadth of the knowledge economy, with its emphasis on high‑skill jobs, often at the intersection of technology and creativity, means that the city is no longer shaped by the needs of a single sector. Rather, it is increasingly shaped by ways of working rather than outcomes of production, with an emphasis on open innovation, co‑working and collaboration.
In an age of knowledge‑led production, companies and institutions are revaluing proximity, authenticity and flexibility. They want dense urban spaces, a mixed urban fabric and buildings that can evolve, not the rigid typologies of traditional offices. Innovative businesses are increasingly establishing their presence in urban centres accordingly, rather than suburban business and science parks. Large institutions, including universities, must make difficult decisions about where they locate, balancing the demands of a younger and more footloose workforce with high land values and pressure for space.
One response to these pressures for land, demographic changes and trends in working is the development of innovation districts – a term used by Bruce Katz and Julie Wagner of the Brookings Institution to describe the rise of geographic areas where leading-edge anchor institutions and companies cluster and connect with start-ups, business incubators and accelerators.1 Katz and Wagner argue that successful innovation districts emerge in areas with the right mix of economic assets (universities and research institutes), physical assets (including public realm, transport and a diverse mix of buildings), and networking assets (formal and informal arrangements for knowledge exchange and collaboration).
14
Against the background of a growing knowledge economy and a hot real estate market, universities, research institutes and innovative businesses in London are undergoing a spatial transformation. With central London offering limited options for building up or out, a number of universities are expanding beyond the sector’s traditional central London heartland, often to areas where land is cheaper (or at least more readily available) thanks to industrial restructuring, land assembly, and public intervention. Rather than relocating or expanding to the suburbs, many universities and businesses are looking to post‑industrial districts and outer London employment centres, often enabled by improved transport infrastructure.
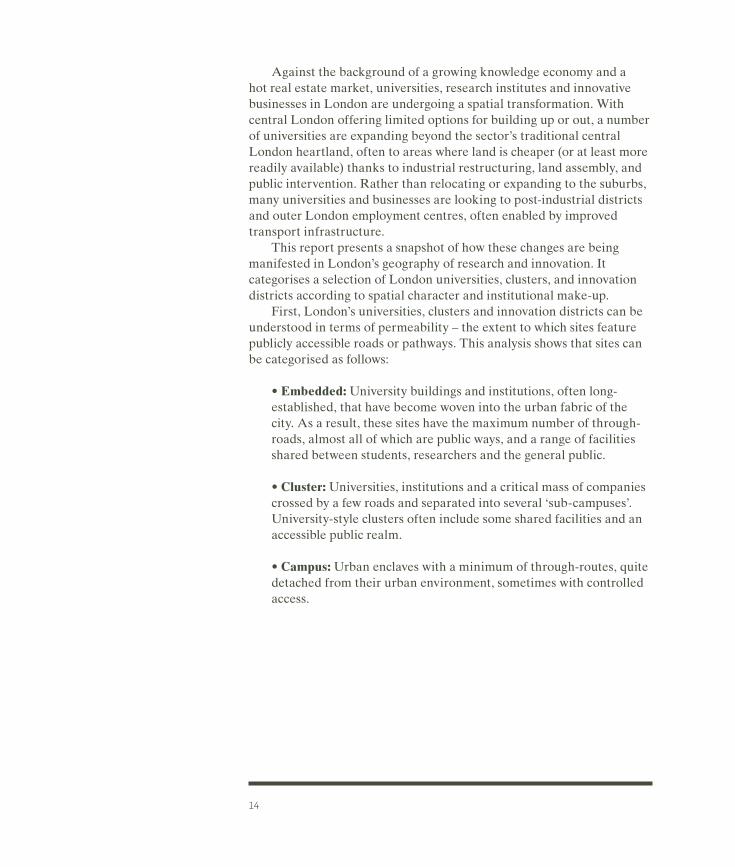
This report presents a snapshot of how these changes are being manifested in London’s geography of research and innovation. It categorises a selection of London universities, clusters, and innovation districts according to spatial character and institutional make‑up.
First, London’s universities, clusters and innovation districts can be understood in terms of permeability – the extent to which sites feature publicly accessible roads or pathways. This analysis shows that sites can be categorised as follows:
• Embedded: University buildings and institutions, often long‑established, that have become woven into the urban fabric of the city. As a result, these sites have the maximum number of through‑roads, almost all of which are public ways, and a range of facilities shared between students, researchers and the general public.
• Cluster: Universities, institutions and a critical mass of companies crossed by a few roads and separated into several ‘sub‑campuses’. University‑style clusters often include some shared facilities and an accessible public realm.
• Campus: Urban enclaves with a minimum of through‑routes, quite detached from their urban environment, sometimes with controlled access.

15
Second, London’s universities, clusters and innovation districts display a range of institutional models. These include:
• University-led: Sites which are exclusively or almost exclusively university facilities
• University Plus: University development in partnership with a private sector partner, research institute or teaching hospital
• Radical Mixed use: Sites with no predominant tenant or asset class, but a mixture (often changeable) of residential space, alongside private offices, university space, incubators and accelerators
• Enterprise-led: Areas with no identifiable university or major institutional presence – instead dominated by either a single private sector firm, or an ecosystem comprised of multiple smaller companies
The report finds that ‘university plus’ or ‘radical mixed use’ models are the predominant trend in recent university expansion and district formation in London. Spatial forms are more varied, reflecting both land availability – campus sites are more common in outer London – and the age of institutions, as some of the more established clusters are pioneers that have seen the city grow around them.
Higher‑education‑led regeneration projects and innovation districts have shown an ability to leverage significant investment, through institutional investment or joint ventures. The scale, tenure mix and long‑term returns of innovation districts make them particularly appealing to investors such as clients of the real estate investment and advisory company Delancey, who are behind developments at both Elephant and Castle and Here East in Queen Elizabeth Olympic Park. If London is to make the most of this capital, policymakers, institutions and developers need to understand the appeal of the innovation district model and how it can become an attractive asset class for long‑term institutional investment, especially where London is in competition with other global cities.
16
Innovation districts founded on open innovation can also be engines of economic inclusion. Partnerships of private, public and civic institutions not only open up new types of public space, but can also open up innovation ecosystems themselves. Due to their location in what are often more deprived boroughs of London, and the opportunity to design‑in community engagement and benefits from scratch, these developments can play an important role in democratising innovation and promoting inclusive economic growth, through:2
1—The creation of employment opportunities: including construction work during the development of districts, and in end‑user jobs.
2—The upskilling of local residents: while job creation is important, it is equally important that local people have the required skills to apply for these jobs.
3—Economic growth: by attracting large anchor tenants, whether corporates or cultural institutions, innovation districts provide a strong boost to London’s economy. The large amount of activity in R&D and the highly productive tech and creative sectors means that the spaces provided by innovation districts are critical to London’s (and the UK’s) economic growth.
4—Shared assets and a sense of place: where governance structures are well‑defined, innovation districts can define and implement a vision for inclusive growth, including the provision of public space and the upskilling of local people.
Understanding the component parts of innovation districts is critical to harnessing their potential to supercharge nascent economies, and to democratise innovation in existing districts. Building on the framework developed by the Brookings Institution paper, this report proposes a framework which can be used to understand the primary assets of innovation districts – economic, physical, and social.
Although the temptation to create an easily replicable model is strong, creating or sustaining innovation districts must go beyond the mere duplication of a template. So rather than providing this, the asset audit in this report is best seen as a means of understanding the components that make up an innovation district, and how these spaces differ from traditional innovation and research spaces.
As a leading global city, London has the skills base, the financial environment, and much of the physical infrastructure to support and

17
sustain its success as a knowledge economy hub. However, increasing pressure for land and an uneven distribution of economic growth and employment runs the risk of constraining London’s potential. If London is to continue to create, attract and retain the talented people, businesses and institutions upon whom its knowledge economy depends, it must deliver as a city that offers the work/life balance that millennials desire. This means getting the spatial balance of London right – creating places for innovation, collaboration and wealth creation.
This report recommends that:
Local authorities should:
• Work with the Greater London Authority (GLA) to understand their local assets. Audits of economic and physical assets should inform local economic development strategies and related planning policies and discussions.
• Develop local skills in the long-term. In addition to focusing on jobs for local people in the development phase of innovation districts, local authorities should focus on the full range of longer‑term end‑use jobs that will be created, and work with innovation district institutions to ensure that the necessary training for local people is in place.
The Mayor of London should:
• Adapt the London Plan. The London Plan should recognise the role played by innovation districts, especially in secondary centres, and incorporate the innovation district model. This will ensure that universities and knowledge economy institutions are included in London’s spatial strategy, both as valuable assets in themselves and as catalysts for economic vitality in the places that they are located. Where suitable, the innovation district model should be incorporated into Opportunity Areas and Mayoral Development Corporations.
• Encourage spatially focused inward investment strategies as well as sector-focused strategies. This would encourage long‑term investment in real estate as well as shorter term VC investment in start‑ups.
18
The government should:
• Allow universities and innovation districts to sponsor Tier 2 visas, on the basis that the innovation district should take on an apprentice for each visa sponsored. This would make it easier for SMEs to access international talent, and would create a pipeline of talent that allows businesses to tackle demand for skills in the short and long term.
Universities and knowledge economy institutions should:
• Develop their civic role at a local level. Universities should work across the institution to embed and encourage engagement with businesses and partner institutions at a local level. This report recommends that the Higher Education Funding Council for England further incorporates place‑based impact into their assessment frameworks, assessing the physical, economic and social contribution made by the institution at a local level. Examples of this engagement include universities acting not just as employers, but as part of the local education system through linking with colleges and apprenticeship providers to create opportunities for higher‑level apprentices.
Property developers should:
• Take an active approach to place-shaping. This should include working with institutions and local communities to create a clear vision for the mix of uses and tenants within emerging innovation districts. Many of the examples of existing innovation districts show the benefits of new governance systems and models of asset management. This model of asset management gives developers the potential to curate and grow their own client base, offering spaces at a range of price points, and shaping an innovation ecosystem.
The success of the innovation district model comes from the power of relationships between individuals, companies and institutions to create a place that is greater than the sum of its parts. Writ large, London’s future success as a leading global city for innovation rests both on an understanding of its potential, and the willingness and ability of individuals and institutions to champion the city’s existing and nascent innovation districts.


INTRODUCTION
21
As large scale manufacturing diminishes, knowledge‑intensive sectors – those reliant on information and skill levels – are becoming more important to city economies than ever, both in terms of economic output and employment numbers. They are also changing the spatial structure of cities. Despite techevangelists previously heralding the end of the commute and the advent of home working, both the economies of today and future growth sectors thrive on urban intensity and strong links to higher education and research facilities, requiring ready access to highly skilled workers.
Why does the geography of London’s knowledge economy matter?The GLA’s 2050 Infrastructure Plan projects net growth in job numbers from 4.9 million to 6.3 million by 2050. Growth is forecast to be concentrated in knowledge‑intensive sectors: professional, real estate, scientific and technology sectors, information and communications technology, and the arts are forecast to add a million jobs between them. When it comes to training, attracting, and retaining these highly skilled workers, London is starting from a strong position.
London’s higher education sector is growing in size and in global renown. Together, London’s higher education institutions educate nearly 400,000 students, employ nearly 100,000 staff and generate £17 billion each year in goods and services, including £2.5 billion in exports.3 US universities still dominate the international league tables, but London’s are gaining ground: some league tables now place Imperial College and University College London in the top ten global universities, equalling or surpassing the older institutions of Oxford and Cambridge.
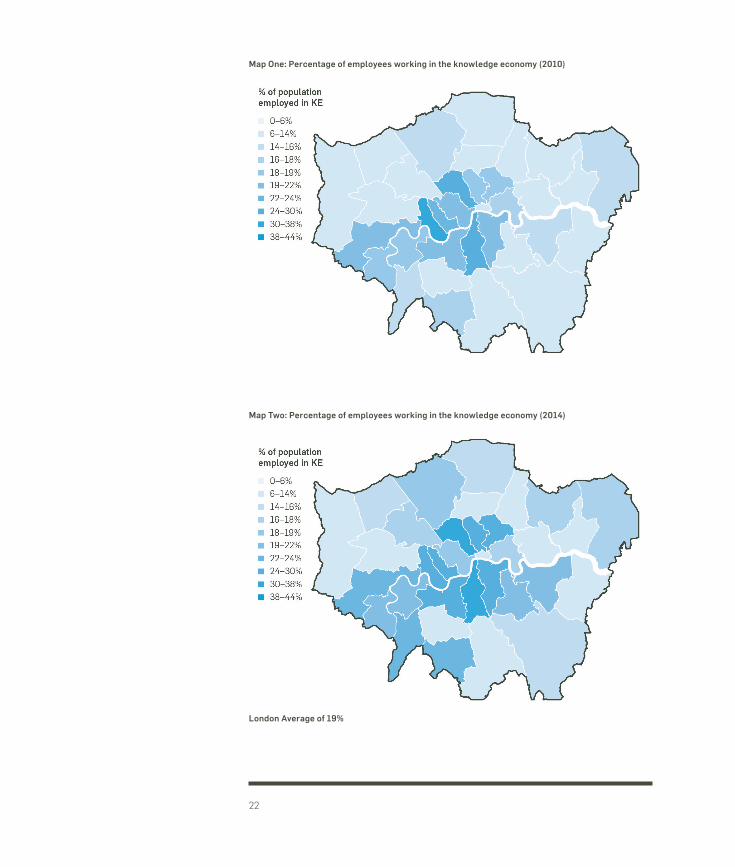
The growth of London’s knowledge economy impacts not only the city’s economic and employment profiles, but also its spatial development and urban form (See Maps 1 and 2). Yet the growth of the knowledge economy is not the only factor shaping London’s development. The city is in the midst of a housing crisis that has gone from chronic to acute in the past decade. Land commands ever‑higher prices, and universities, start‑ups and companies find themselves competing for land use, most often against residential development.
Against the background of a growing knowledge economy and a hot real estate market, universities, research institutes and innovative businesses in London are undergoing a spatial transformation. This is particularly apparent when looking at London’s higher education sector. This report looks at two aspects of higher education transformation – where universities are locating, and what their new developments look like and aim to achieve. With central London offering limited options for building up or out, a number of universities are expanding beyond
22
Map One: Percentage of employees working in the knowledge economy (2010)
London Average of 19%
London Average of 17%
Map Two: Percentage of employees working in the knowledge economy (2014)
23
the sector’s traditional central London heartland, often to areas where land is cheaper (or at least more readily available) thanks to industrial restructuring, land assembly, and public intervention. Imperial College London’s new Imperial West campus at White City is planned as a centre for research, innovation and translation (of research to practical application). The Francis Crick Institute is creating a new focal point for medical and life sciences research in the growing King’s Cross Knowledge Quarter. And UCL and University of the Arts London are joining Loughborough University in opening new facilities in Queen Elizabeth Olympic Park as part of the Mayor of London’s ‘Olympicopolis’ vision for a new cultural and educational quarter in Stratford.
London’s knowledge economy – the policy context
National government The impact of the knowledge economy in increasing GVA and employment growth is strongly linked to increased national productivity. Indeed, much of London’s growth in real GVA has not only come from population and employment growth, but also from an increase in productivity. GVA per worker increased from 1984 to 2008, reflecting a move towards higher‑skilled labour.4 And while the 2008 recession did not see the white‑collar industries collapse as some anticipated, it did lead to a decline in productivity, prompting politicians and policymakers to refocus their aim of reducing the productivity gap between the UK and other advanced economies. At a national level this strategy, as set out in the 2015 Productivity Plan, is underpinned by investment in a skilled workforce, higher education and science and innovation, alongside regulatory changes to encourage ‘a dynamic economy’.5 A further plan, focusing in more detail on innovation, is due to be published by government later this year.6
The Chancellor’s long‑term economic plan for London recognises the role of the knowledge economy in increasing productivity to outpace the growth of New York.
We want London to outpace the growth of New York. If London’s productivity was to grow at even the same pace as that predicted for New York, the size of the capital’s economy would be £6.4 billion larger in real terms by 2030. That’s equivalent to an increase of £600 per person. To achieve this we have to attract more investment to London, raise the skills of Londoners, and improve transport and digital connectivity in our capital.7
George Osborne, February 2015
24
City HallThe role of the knowledge economy in securing London’s future job creation and economic growth is identified by the London Enterprise Panel (LEP) as a strategic policy goal in the London 2036 report, specifically in improving the diversity and resilience of the London economy.8
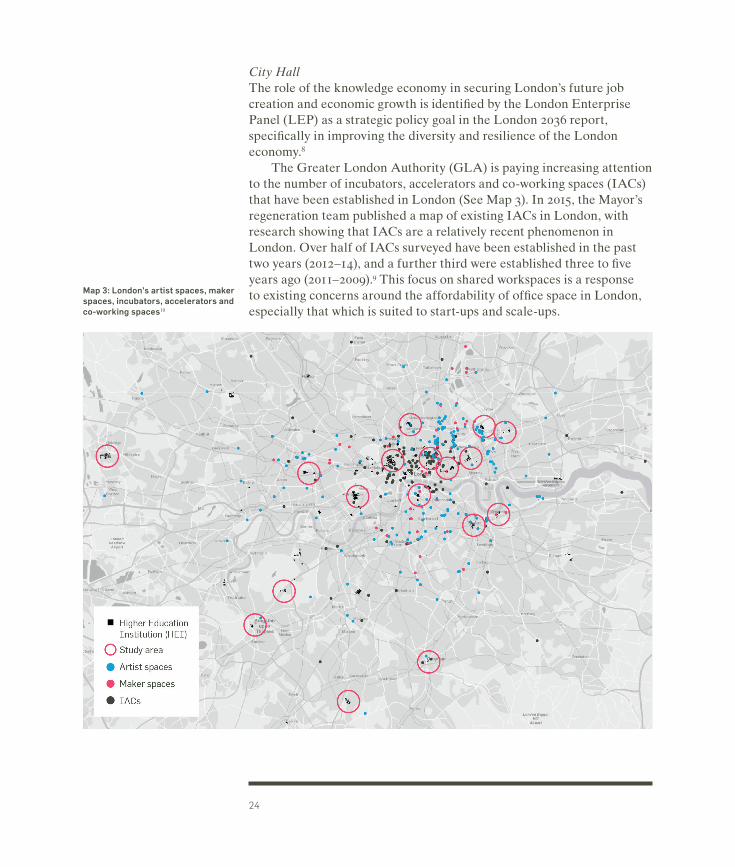
The Greater London Authority (GLA) is paying increasing attention to the number of incubators, accelerators and co‑working spaces (IACs) that have been established in London (See Map 3). In 2015, the Mayor’s regeneration team published a map of existing IACs in London, with research showing that IACs are a relatively recent phenomenon in London. Over half of IACs surveyed have been established in the past two years (2012–14), and a further third were established three to five years ago (2011–2009).9 This focus on shared workspaces is a response to existing concerns around the affordability of office space in London, especially that which is suited to start‑ups and scale‑ups.
Map 3: London’s artist spaces, maker spaces, incubators, accelerators and co-working spaces10
25
The GLA is currently in the process of mapping lab space in London to provide information for businesses in search of space and to inform proposals for further life sciences developments. MedCity is currently in the process of researching the provision of space dedicated to commercial R&D activity and suitable for those involved with healthcare product and service development. Initial research shows that demand is exceeding supply, and work is required to bolster the offerings of the three innovation centres/incubators that provide wet laboratory space for the sector. Findings also show that most businesses want to be in highly accessible yet affordable locations.
The Mayor’s London Plan, which sets out the overall spatial plan for London, identifies knowledge‑based industries as a key driver for boosting employment growth in outer London boroughs, supported by the creation of business support hubs and larger innovation parks.11 The development of employment hubs in outer London aims at the creation of a polycentric urban economy, reducing the current concentration of employment activity in inner London, and the resulting pressure on London’s commuter networks.12
Why now?Now is a good time to look at how London’s changing economy is shaping its geography. The London Plan forecasts an additional 861,000 jobs in London by 2036 – the equivalent of more than eight Canary Wharfs.13 With London’s resident population set to reach 10 million people by the early 2030s, London needs to find both residential and employment space. As the knowledge economy in London grows, the supply of suitable office and light industrial space that can be adapted for use by knowledge economy enterprises is dwindling. This has been aggravated by the introduction of Permitted Development Rights by central government, which allows offices to be converted into residential properties without the need for planning permission. Over one million sq ft of wholly occupied office floor space was granted permission for conversion to residential use between May 2013 and April 2015.14 The creation of new innovation districts, with flexible design and mixed tenure, could help meet demand for new employment space in London. The next Mayor will start preparing the new London Plan soon after the May 2016 election, so now is the time to make the case for the innovation district model, as a means of delivering thriving employment spaces.
The ability of innovation districts to incorporate private, public and civic institutions not only opens up physical space, but innovation ecosystems themselves. Due to their location in central urban areas which are often in more deprived boroughs of London, and the
26
opportunity to design‑in from scratch, these developments can play an important role in democratising innovation and promoting inclusive economic growth.15 This may involve providing training opportunities to local people, providing shared facilities, and creating a high‑quality public realm. However, making the most of this opportunity requires co‑ordination between developers, tenants, institutions and local authorities. Our research suggests that policymakers at regional and local level lack clarity over what innovation districts can offer both local areas and London. Equally important is identifying the role that universities and planning authorities can play in funding, planning and sustaining innovation districts. Of course, as our study sites show, not all of London’s nascent innovation districts are higher‑education‑led, though almost all have some type of higher education component, often as a tenant.
Level39 and the Cognicity ChallengeLaunched in 2013 by the Canary Wharf Group, Level39 is a technology accelerator located in One Canada Square. Located at the heart of Ca‑nary Wharf, the accelerator has a strong focus on fintech and cyber secu‑rity technology, bringing together start‑ups alongside some of the world’s most well‑established banks. It is currently home to more than 200 mem‑ber companies across three floors and provides weekly ‘curriculum’ ses‑sions for members to gain access to investors and advice.
With the Canary Wharf estate now set to double in size, with over 3000 residential properties, Level39 decided to focus on smart‑cities tech‑nology. They subsequently established the Cognicity Hub, a space for companies developing smart‑cities technology, with the opportunity to pilot technologies in and around the incubator.
Examples of success stories emerging from Level39 and the Cognicity Hub include Pie Mapping, who offer real time freight‑mapping data and are currently partnering with Canary Wharf Group to develop a service specifically for construction vehicles, and Strawberry Energy, whose solar‑ powered smart benches generate electricity for powering devices and can be found across the estate.
From Autumn 2016, the floor below Level39 will be home to UCL’s School of Management postgraduate programme. This will offer physical proximity to academic expertise located in the same building. Level39 and its various initiatives exemplify both the importance of proximity in the development of knowledge economy services and products, and the opportunities provided for ‘living lab’ projects through collaboration
27
between real estate developers, entrepreneurs and academics. The physical presence of incubator space and the number of potentially disruptive start‑ups within Canary Wharf shows the potential of the innovation district model in mainstreaming technological change within existing clusters.
In examining the drivers, geography and policy implications of London’s knowledge economy, this report is structured as follows.
Chapter One sets out definitions of the knowledge economy, and reviews the literature on the relationship between innovation, cities and the knowledge economy. The second chapter looks at how London’s knowledge economy is performing, and reviews how the city performs as a centre of innovation. In the third chapter, the innovation district model is described, as well as its applicability to the London context. The fourth chapter then sets out the regenerative and real estate potential of innovation districts for London, with the fifth chapter looking at the role of innovation districts in promoting inclusive economic growth. The sixth chapter uses case studies of clusters, universities and innovation districts in London to develop a picture of how the geography of London’s higher education sector and knowledge economy is changing. This includes mapping London’s knowledge economy and universities, and assessing the urban form of clusters, universities and innovation districts. The seventh chapter includes an audit of our featured case studies, comparing economic, physical and networking assets. The final chapter provides recommendations for the creation of successful innovation districts.
1 INNOVATION AND THE KNOWLEDGE ECONOMY
29
This chapter defines some key terms, and sets out the importance of the knowledge economy in the context of London’s economic growth.
The knowledge economy is defined as the trend in advanced economies towards greater dependence on knowledge, information and high skill levels.16 Our working definition of the knowledge economy covers both sectors such as biotechnology, and the processes which sectors have in common. In the words of Charlie Leadbeater, “the knowledge-driven economy is about a set of new sources of competitive advantage, particularly the ability to innovate, create new products and exploit new markets, which apply to all industries, high-tech and low-tech, manufacturing and services, retailing and agriculture.”17
The term ‘knowledge economy’ extends beyond the recent focus on the tech or digital economy. While it would be hard to find a sector within the knowledge economy that has not been significantly impacted by the application of technology, it is not technology itself that is driving this growth. Rather, it is the concentration of high skill levels in these sectors, and the capability of the knowledge economy to drive innovation in the tech sector. While the knowledge economy may lie at the foundation of the burgeoning tech sector, it should be emphasised that the development of the tech sector has had mutually reinforcing benefits on the knowledge economy.
The recent increase in the relative importance of the digital and creative sectors is part of the long‑term growth of the knowledge economy. This growth has been mirrored by the decline of traditional sectors including large‑scale manufacturing and agriculture in the UK. The relative importance of these sectors has been in decline for almost half a century, aggravated further by the most recent recession, which hit manufacturing and construction particularly hard. It should be noted, however, that while employment in manufacturing of consumer goods has declined, the output of high‑value manufacturing has remained relatively stable since the crash, as is shown below. This high‑value (and often highly specialised) manufacturing activity is an important element of the knowledge economy.
The primary feature that distinguishes the knowledge economy from established economies such as traditional manufacturing is the role of knowledge in creating competitive advantage. This competitive advantage comes from the ability to innovate – both in terms of creating new products and new services and management systems. Moreover, the resources required to create this advantage – knowledge, skills and innovative potential – are not finite in the sense that tangible resources such as labour and material are.
30
Throughout this report, we include information on the number of knowl‑edge economy jobs in London, and within our specific study sites of uni‑versities, clusters and innovation districts in London. This information has been collected by combining two sets of Standard Industrial Clas‑sification Codes: the science and technology definition, and the creative industries definition.
The Science and Technology Codes are based on a categorisation developed by ONS London Statisticians and the GLA. It comprises five sub‑categories: Digital technologies; Life sciences and healthcare; Pub‑lishing and broadcasting; Other scientific/technological manufacture; and Other scientific/technological services. The Creative Industry codes are taken from the Department of Culture, Media and Sport categorisation. Once combined, these two lists were then reviewed and any irrelevant or non‑applicable classifications were removed. A full list of the SIC codes used can be found in the appendix to this report.
The Mysteries of Trade: Knowledge Economies and CitiesKnowledge economies and cities go hand in hand. This is because in contrast to traditional sectors such as manufacturing, mining or constructing, physical (and often finite) resources are of less importance than human resources. The most important assets of the Knowledge Economy are skilled people, and the interactions that take place between them – a concentration of human capital. Cities are the ideal place in which this transfer of knowledge, and the innovation that ensues, can take place. In short, the agglomerative benefits that make firms more productive apply to knowledge economies as they do to other economies.
As far back as 1890, the economist Alfred Marshall recognised that cities’ concentration of people led to economic benefits, commonly called ‘agglomeration’. This applied not only to tangible efficiencies such as reduced distance for transporting goods, but also to the flow of people, skills and ideas. His most famous phrase, that “The mysteries of the trade become no mystery, but are, as it were, in the air”, anticipated more recent thinking on clusters: industrial specialisation, he argued, enables knowledge created by one firm to spill over into another nearby firm.18
While Marshall’s argument related to the role played by specialisation in creating competitive urban economies, there are a number of economists who emphasise the role that diversification has to play in innovation. In The Economy of Cities, Jane Jacobs highlights
31
the role of knowledge‑exchange between complementary (rather than similar) firms in driving innovation.19
But the knowledge economy does not just require people working and living in proximity. It requires skilled people. There is a body of research that supports the relationship between skills, or human capital, and the growth of cities. Other things being equal, educated cities have grown at a faster rate than comparable cities with a lower‑skilled population. Not only do higher‑skilled cities grow more quickly, they are also more productive. A reserve of skilled people sees cities succeed due to their ability to adapt to change and respond to negative shocks. The physical impact of such reinvention is evident in a number of innovation districts, in which industrial land has been repurposed for use as knowledge‑intensive employment space. This is particularly visible in the mid‑sized US cities analysed by Katz and Wagner, with examples including South Lake Union in Seattle and the South Boston Waterfront.
A further body of literature analyses the relationship between geographic proximity and the formation of networks between skilled individuals. In the context of the knowledge economy, which relies heavily on competitive and collaborative relationships, it is not just the agglomeration of skilled workers that is important, but the interactions and ties between them. Institutions (including universities, public and civic institutions) play an important role in shaping these networks, and forging links between individuals and businesses.20 Again, in the context of the knowledge economy, these networks are important not just in the sharing of ideas and collaboration between firms, but also in generating networks of social capital. This may be through formal networks, including research and design partnerships between universities and private firms, but can also include informal networks, in which financial capital may follow social capital.21 A study of hi‑tech firms in Cambridge, UK analysed the role of individuals in clusters, rather than looking at firms or institutions, and emphasised the importance of informal social capital between entrepreneurs. Similar conclusions have been made following analysis of hi‑tech and biotech firms in US clusters.22
This report identifies three drivers behind a successful knowledge economy; skills (human capital), space (physical capital), and investment (financial capital). While these drivers are important for all businesses, the focus of this report is on the types of space in which knowledge economy activity takes place.
Skills: Fundamental to the very definition of the knowledge economy is a dependence on skilled workers as an essential resource. This human resource is the driver of the technological and organisation change that is equated with the rise of the knowledge economy, with this change then affecting how human resources are used.

32
Space: Knowledge, skills and innovative potential are not formed in a vacuum. The development of the resources that the knowledge economy thrives on requires spaces in which these skills can be fostered, and where ideas can be shared and developed. For knowledge economies to thrive, spaces are needed where these talented individuals not only share ideas, but also have the facilities and resources to develop them into products and services. The role of space in the growth of the knowledge economy takes place at a range of scales, from office cafeteria to purpose‑built co‑working spaces, from hi‑tech labs in universities and science parks to innovation districts and Silicon Valleys.
Financial Capital: A growing knowing economy equally requires substantial investment in human and physical resources, whether this be in higher education, infrastructure, R&D or direct investment in businesses. This investment can come from both the private and public sector. The balance of public‑private investment in innovation is a hotly contested topic, both in terms of which is more likely to lead to economic success, and how the risks and rewards of such investment should be distributed.23 This is particularly important as alternatives to the standard supply‑chain models of production emerge. Networked manufacturing, for example, uses data flows to custom‑build products, often from a range of geographically distant but digitally connected locations.24
This section covered the definition of the knowledge economy, and reviewed the literature on the relationship between skills and economic growth in cities. The next section will look at how London performs as a knowledge economy hub, and the main drivers behind its current performance.

2 HOW DOES LONDON MEASURE UP?
35
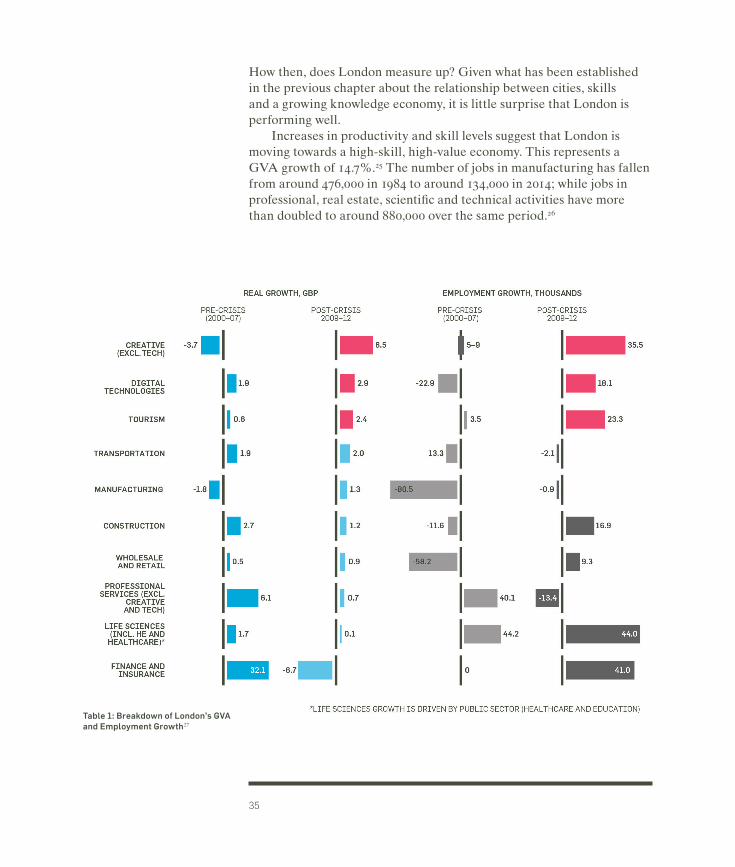
How then, does London measure up? Given what has been established in the previous chapter about the relationship between cities, skills and a growing knowledge economy, it is little surprise that London is performing well.
Increases in productivity and skill levels suggest that London is moving towards a high‑skill, high‑value economy. This represents a GVA growth of 14.7%.25 The number of jobs in manufacturing has fallen from around 476,000 in 1984 to around 134,000 in 2014; while jobs in professional, real estate, scientific and technical activities have more than doubled to around 880,000 over the same period.26
Table 1: Breakdown of London’s GVA and Employment Growth27
36
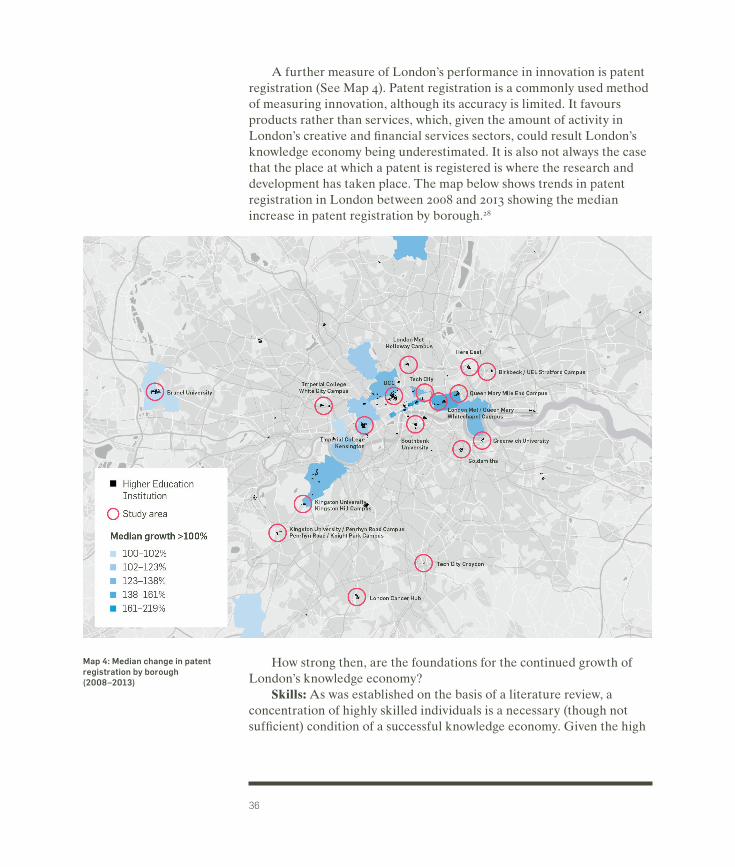
A further measure of London’s performance in innovation is patent registration (See Map 4). Patent registration is a commonly used method of measuring innovation, although its accuracy is limited. It favours products rather than services, which, given the amount of activity in London’s creative and financial services sectors, could result London’s knowledge economy being underestimated. It is also not always the case that the place at which a patent is registered is where the research and development has taken place. The map below shows trends in patent registration in London between 2008 and 2013 showing the median increase in patent registration by borough.28
How strong then, are the foundations for the continued growth of London’s knowledge economy?
Skills: As was established on the basis of a literature review, a concentration of highly skilled individuals is a necessary (though not sufficient) condition of a successful knowledge economy. Given the high
Map 4: Median change in patent registration by borough (2008–2013)
37
concentration of skilled individuals in London (54% of Londoners aged 25–64 have qualification at NVQ level 4 or above) and the number of higher education institutions located in the capital, it is little surprise that the knowledge economy makes such a strong contribution to the city’s employment and economic output.29
Higher education plays an important role in shaping this workforce, and ensuring a pipeline of graduates that will be able to keep up with the growing demand for graduate skills. There is a body of evidence supporting the positive effect of universities being located in proximity to companies for this reason, and also in encouraging spin‑out companies from universities.30
Today, London is home to four of the world’s top 30 universities – the only city in the world that is able to make such a claim. Based on the Times Higher Education World University Rankings, each of these universities scores amongst the best in the world for teaching, research, knowledge transfer and international outlook.31 The capital dominates the national HE sector, home to over a third of all universities in the UK. The city’s international performance is equally strong: 7 out of the 25 most global universities in the world – those with the highest proportion of international students – are located in London.32 London, in the words of Boris Johnson, is the Athens or Rhodes of the global economy ‑ the modern world’s favourite university town.33
No other city in the world can match London’s cluster of ideas, talent and capital. If we can bring together the city’s inventors, entrepreneurs, investors, academics and creatives on a grander scale, our enterprise and technology capabilities could soon surpass San Francisco’s. Imperial’s White City Campus takes this ambition a step closer to reality. As scientific change accelerates, we cannot predict where discoveries over the next 10 years will take us. Imperial’s White City Campus will help us to adapt to and drive these changes. The emergence of fields such as synthetic biology and data science have become central to our mission, leading to innovation at Imperial College London. A generation ago such pioneering fields, which have unravelled the human genome and made micro-payments a normal part of life, seemed like science fiction. These require multidisciplinary approaches and cannot be effectively tackled unless universities have the flexibility to cope with them – and the new opportunities that we are yet to imagine.Professor David Gann CBE, Vice President (Development & Innovation), Imperial College London
38
The success of London’s universities is a boon not just to the HE sector, but London’s economy as a whole. London’s HE sector employs close to 100,000 academic and non‑academic staff, generating £17 billion each year in goods and services. Much has been made of the capacity of London’s HE sector to attract international students, who make up almost 30% of the total London student population. One in two students at LSE is from overseas, one in three at UCL. The contribution that these students make to London goes beyond tuition fees. The global diaspora of London‑educated students is an important channel of London’s soft power, with the city having a formative impact on a cadre of individuals, and indeed the social ties between them, likely to be destined for high‑powered jobs across the world.34 It should be noted, however, that a number of businesses, universities and policymakers have expressed concern regarding access to international talent, especially given the highly skilled and highly specialised nature of many knowledge economy jobs. Particular concern has been raised by proposals to restrict Tier 2 visas ( the main immigration route for non‑European Economic Area nationals ), and a number of calls have been made to make Third Party Sponsorship easier, together with the reinstatement of Post‑Study Work Visas.35 The Home Office and the Greater London Authority are currently piloting a help desk specifically to address questions and concerns raised by SMEs about securing a sponsorship license. While this acknowledgement of the difficulties faces by SMEs in securing licences is welcome, it remains time‑intensive, with the potential sponsor required to ensure no suitably qualified worker can be recruited from the UK or EU.
There are four main ways in which London’s universities contribute to the city’s knowledge economy:
1—Through educating a pipeline of skilled workers, from London, the rest of the UK and beyond.
2—Through businesses starting directly as a result of research. To take an example from the US, companies started by MIT graduates and faculty generate $2 trillion in sales each year.
3—Through academic research leading to knowledge spillovers in local innovation sectors.
4—Through medical schools and associated hospitals – London is home to five teaching hospitals.
39
Space: Land in London is at a premium, with increasing competition between residential and all other land uses.36 At the same time, London’s need for workspace is growing, and the appetite of media and technology firms shows little sign of slowing as businesses continue to scale. This demand is increased by the out‑migration of West End occupiers to east London, causing the cost of workspace to rise.37 Prime rents in Shoreditch increased by 24 per cent between Q4 2014 and Q4 2015.38 An estimated additional two million square feet of space will be needed to absorb growth in London’s media and technology sector by 2017.39 This shortage of space poses a challenge for businesses of all sizes, and risks undermining the growth of London’s knowledge economy. This is particularly the case for activity that requires specialised space, ranging from laboratories to space for artists and makers. There is a case, therefore, for exploiting the opportunity of university expansions and relocations to provide not only teaching space, but also space for research and incubation. More ambitious developments combine this teaching and employment space with residential space, creating spaces for a range of use classes.
Case Study: Tech CityTech City, the digital industries cluster located in inner east London, is an example of an innovation ecosystem that has grown organically, and with‑out the direct role of a higher education institution. Such is the success of tech city that the term has come to cover a range of geographies and sec‑tors, not least driven by London’s real estate sector seeking to capitalise on the area’s buzz and authenticity.
A combination of factors clinched the success of tech city, though there is little doubt that the early adoption of technology by creatives who had originally been drawn to the area by cheap rents played a formative role. In 2010, the Coalition Government launched the Tech City initia‑tive a collection of tax relief policies, targeted activity to attract foreign direct investment and events, and the establishment of Tech City UK, an organisation aimed at nurturing and promoting the inner east London Cluster. Tech City UK later expanded to cover the whole country, playing an important role in highlighting and developing tech clusters in towns and cities across the UK.
As with many government initiatives aimed at supporting specific sec‑tors or clusters, the success of the Tech City initiative is debated. There is, however, strong evidence for rapid growth in London’s tech sector, includ‑
40
ing an increase in firms and jobs, and the strong bounce‑back of the east London area from the recession in comparison to the rest of the capital.
The discussion about the success of the Tech City initiative raises questions not just about the role of government policy in shaping clusters and innovation districts, but also about how we define the success of inno‑vation districts. Tech City has shown itself more than capable of sustain‑ing employment and attracting employers, who may be large in terms of employee numbers, or significant in terms of reputation, investment and incubation of new start‑ups. As tech has been mainstreamed into the Lon‑don economy over the past decade, so too have the types of firms attracted to inner east London, driven by proximity both to the Tech City talent pool, and the opportunity to share in buzz of the east London cluster.
The success of Tech City in attracting businesses brings its own set of challenges, familiar to any cluster – how to expand without dispers‑ing, and how to maintain proximity and authenticity at scale. As numbers grow, so too does competition for capital, skills and space. Unlike com‑parable clusters and innovation districts, Tech City has neither an iden‑tifiable anchor tenant, nor a higher education establishment, but rather a critical mass of smaller digital firms. However, anchor tenants, as well as institutions such as City University have played a role in Tech City’s development, as the scale and strength of the cluster means it draws on a talent pool that extends not only beyond east London, but the entire capital and beyond.
Investment: Given London’s established reputation as a world leader for financial services and as a place to do business, the city is currently performing strongly in terms of private sector investment. London is frequently lauded as the best‑performing city for private equity and venture capital investment in Europe.40 In 2015, digital firms in London raised a total of $2.28bn, a 69% increase on 2014. Of the £1,558 million in research funding, higher education providers in London have been allocated 31% of total research funding, compared to the South East receiving 17% and the East 10%.41 This rises to some £3.7 billion when R&D from higher education, government, business and private non‑profit are combined, representing 13% of total UK R&D expenditure.42
Measuring London – How do the UK and London measure up?There are a number of publications ranking the performance of countries and cities in fostering innovation.
The CITIE report ranked London as one of the best‑performing cities as a centre for innovation, highlighting access to talent and capital,

41
availability of urban data and promotion of business as strengths.43 Weaknesses included broadband speed and free wifi provision.
Recent research by Deloitte ranks London as the city with the largest growth in knowledge economy employees, boasting a 16% increase between 2013 and 2016, according to their definitions of the knowledge economy.44 Sydney, the second‑ranked city, saw a growth of just 6.6%. New York, often portrayed as London’s competitor for top globally‑ranked city, saw its number of knowledge economy employees drop by 0.4% over the same period. London also boasts the largest share of knowledge‑based employment as a percentage of all employment: 31% compared to New York’s 27%.
The 2014 Allas report provides a six‑part framework for comparing competitive advantage in innovation to form the basis of an international benchmarking report.45 This framework covers six main themes: money, talent, knowledge assets, structures and incentives, the broader environment, and innovation outputs. Again, London performs highly in terms of talent and knowledge assets.
The next chapter will set out recent theory on how the growth of the knowledge economy is reflected in real estate trends, and the development of spaces for research and enterprise. This will be followed by consideration of the role that urban districts can play in providing the mixed‑use, flexible spaces that are so important to the growth of London’s knowledge economy.
3 SPACES TO THINK – THE THEORY OF INNOVATION DISTRICTS
43
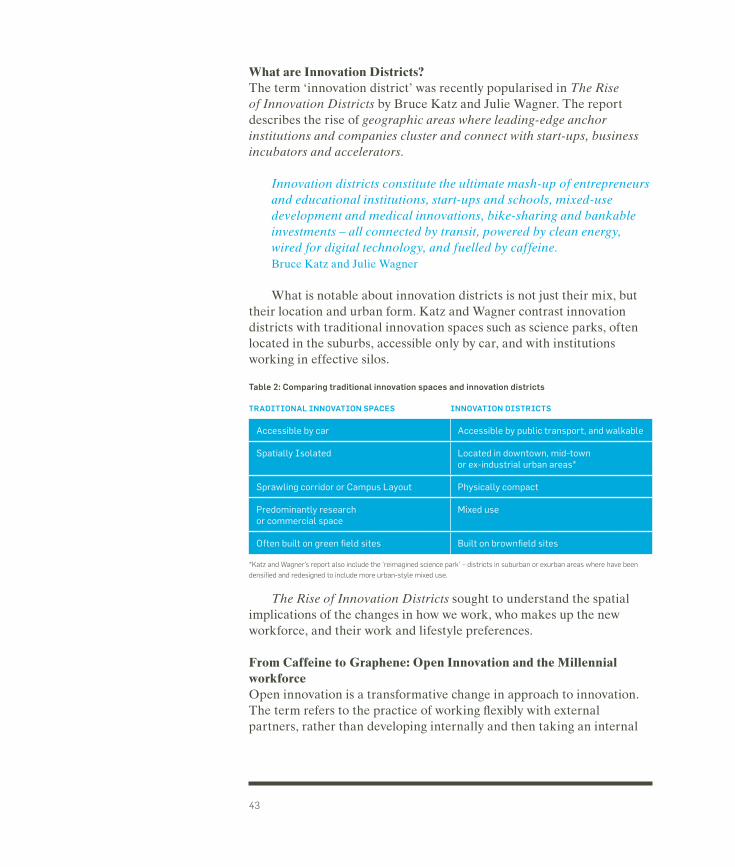
What are Innovation Districts?The term ‘innovation district’ was recently popularised in The Rise of Innovation Districts by Bruce Katz and Julie Wagner. The report describes the rise of geographic areas where leading-edge anchor institutions and companies cluster and connect with start-ups, business incubators and accelerators.
Innovation districts constitute the ultimate mash-up of entrepreneurs and educational institutions, start-ups and schools, mixed-use development and medical innovations, bike-sharing and bankable investments – all connected by transit, powered by clean energy, wired for digital technology, and fuelled by caffeine. Bruce Katz and Julie Wagner
What is notable about innovation districts is not just their mix, but their location and urban form. Katz and Wagner contrast innovation districts with traditional innovation spaces such as science parks, often located in the suburbs, accessible only by car, and with institutions working in effective silos.
Table 2: Comparing traditional innovation spaces and innovation districts
TRADITIONAL INNOVATION SPACES INNOVATION DISTRICTS
Accessible by car Accessible by public transport, and walkable
Spatially Isolated Located in downtown, mid-town or ex-industrial urban areas*
Sprawling corridor or Campus Layout Physically compact
Predominantly research or commercial space
Mixed use
Often built on green field sites Built on brownfield sites
*Katz and Wagner’s report also include the ‘reimagined science park’ – districts in suburban or exurban areas where have been
densified and redesigned to include more urban-style mixed use.
The Rise of Innovation Districts sought to understand the spatial implications of the changes in how we work, who makes up the new workforce, and their work and lifestyle preferences.
From Caffeine to Graphene: Open Innovation and the Millennial workforceOpen innovation is a transformative change in approach to innovation. The term refers to the practice of working flexibly with external partners, rather than developing internally and then taking an internal

44
path to market. The term was first used by Henry Chesborough in 2003, and is used to describe both relationships between firms, and a way of thinking.47 The factors behind the transition from closed to open innovation can be summarised as follows:
1—Growth in the pool of knowledge sector workers, and the mobility of these workers.
2—Growth in the availability of private venture capital, increasing the options for paths to market.
The transition to open innovation brings with it a new legal and commercial architecture of licencing agreements and joint ventures. These changes to business practice are also reflected in demand for new types of workspace, such as co‑working spaces.
We find that life sciences firms are increasingly drawn to spaces that enhance opportunity to pursue product development through the open innovation model. Whilst businesses will typically want a unit that they can shut the door on, there are others who will find touchdown, hot-desk space helpful, and there is increasing interest in co-location with other businesses and researchers that might have interesting activities to share. This gives them access to networks of people who can offer advice and problem-solving skills. The ultimate location means being in a dynamic community where productivity can be enhanced.Sarah Haywood, CEO, MedCity
It is not just the open innovation trend that has seen the rise of downtown innovation districts over science parks. These trends also reflect the growth and characteristics of the millennial workforce, who now make up a quarter of the US workforce.48 Analysis shows that millennials value proximity – the ability to walk or cycle to work – and a sense of place, complete with coffee shops and art galleries, more than generations before them. Work/life balance, and a workplace location that encourages transitions between work and play, are equally important.49 These trends – open innovation and the rise of the millennial workforce – mean that we are revaluing density, vibrancy and authenticity in cities.
As is emphasised in the initial Brookings report, an important feature of innovation districts is their live/work/play offer. This can exist in the form of public realm, shared facilities, and amenities including
45
coffee shops, bars, restaurants and clubs. These amenities offer two main benefits. The first, as outlined above, is that they can attract and retain millennials, like the successful cities identified by Richard Florida in his influential book The Creative Class. The second is that they provide spaces for quick and efficient knowledge transfer, and collaboration between organisations. By providing live/work/play spaces, innovation districts offer companies and institutions access to a rich network of social capital, whether this is advice on investment and recruitment, the sharing and solving of problems, or a platform from which to test products.
University-business collaboration goes beyond R&D and spin-outs. What we are creating at Here East is a concentration of young, intelligent, and footloose individuals, who can think about ideas and creating businesses. There are two main things you need to get right for this to happen – the right mix of tenants, and a site that encourages encounters between individuals and organisations. It’s all designing in serendipity, and developing spaces which can create a sense of community.Gavin Poole, CEO, Here East
There are signs that these new ways of working are squeezing conventional research parks. Research Triangle Park in North Carolina is reshaping itself as fast as it can, remodelling its 7,000‑acre site to reflect “how drastically the environment in which research parks and innovative economies operate has transformed over the past few years.”50 The Research Triangle Park will become, in the terminology of Katz and Wagner, a reimagined science park, with an emphasis on improved public transport links and enriched land use. Similar remodelling is evident in the current masterplanning of a new Residential Quarter at Harwell Campus in rural Oxfordshire, providing homes and amenities to create a work‑play‑live community that builds on the existing research facilities.
The concurrent trends of open innovation and the rise of the millennial workforce provides the context for why many businesses and institutions are rethinking the science park model in favour of the innovation district model. Katz and Wagner identify three urban forms that these innovation districts can take: ‘anchor plus’, a large‑scale, mixed‑use development centred around a major anchor institution; ‘re-imagined urban area’, i.e. areas previously used for industrial purposes; and ‘urbanised science park’ – the reconfiguration of traditional, single‑use suburban research districts into mixed‑use spaces with retail and even residential space.
46
While the innovation districts model provides a useful framework through which to understand the changing geography of London’s knowledge economy, it is important to be aware of the limitations of comparison. First, there are a number of structural and cultural differences between US and UK innovation cultures that should be borne in mind when considering the applicability of the US innovation districts model to London.51 A number of these differences are often attributed to the passing of the Bayh‑Dole Act (the name commonly given to the 1980 Patent and Trademark Law Amendments Act), which saw universities take on ownership of patents rather than government agencies in a bid to boost the translation of patents into commercial products. Of course, in addition to differences in culture and structure, there is a difference in the sheer scale of research done in the US compared to the UK. US spending on R&D accounts for 2.6% of Gross Domestic Product, compared to 1.3% in the UK. In short, US performance in innovation “reflects more research being done in more institutions.”52
The second is the location of innovation districts – the Brookings report looks only at US‑based innovation districts, the majority of which are located in mid‑sized cities, such as Chattanooga, Tennessee, and Philadelphia. Innovation districts in mid‑tier cities are focused on driving growth, often through securing an anchor tenant. Sought‑after anchor tenants create links to top‑level research or medical universities. Echoing the ability of skilled cities to ‘pivot’ from one type of industry to another, analysis of mid‑sized cities in the US indicates that innovation districts can play an important role in urban revival.53 At a UK level, the success of Sheffield in transitioning from heavy steel manufacturing to high‑skilled advanced manufacturing highlights the role that an innovation district model can play in facilitating a transition to a high‑skilled, high‑value economy.54
Case Study: Advanced Manufacturing in SheffieldThe city of Sheffield has a long history in manufacturing, and a global reputation thanks to the founding of stainless steel in the city in the early 1900s. Employment in heavy manufacturing in Sheffield declined in the 1960s, though the city now has a global reputation thanks to specialisa‑tion and industry‑led innovation in high‑tech sectors, including robotics and advanced manufacturing. In addition to the presence of major com‑panies including Boeing and Tata, the University of Sheffield has been instrumental in spearheading this focus on innovation. The Advanced
47
Manufacturing Research Centre (AMRC) developed out of the univer‑sity, with university staff taking a proactive approach to engaging with business. As a result, Sheffield is now home to an advanced manufactur‑ing cluster, thanks to an appetite for co‑location from firms, a network of business and financial services, and spaces suitable for high‑tech testing and manufacturing. The AMRC also includes a training centre, offering STEM‑focused academic training and apprenticeships in major firms and SMEs. This centre plays an important role in creating a talent pipeline for the cluster.
What then, are the components of an innovation district? Katz and Wagner identity three sets of assets: economic, physical, and networking.
1—Economic assets: This describes the firms, institutions and organisations that drive, cultivate or support an innovation‑rich environment. Katz and Wagner identify three types of economic assets:
i) Innovation drivers: firms, research institutions, start‑ups and entrepreneurs who are driving the economic growth of a district.
ii) Innovation cultivators: The companies, organisations or groups that support the growth of individuals, firms and their ideas. This includes incubators, accelerators, co‑working spaces and institutions involved in training individuals, including colleges and universities.
iii) Neighbourhood amenities: These are the spaces and services that support workers in innovation districts, including bars, coffee shops and cultural spaces.
2—Physical Assets: These are the publicly and privately owned spaces which make up innovation districts. Again, these can be divided into three subgroups:
i) Physical spaces in the public realm: Digitally and physically connected spaces that encourage encounters. These spaces are often flexible, and able to be used as ‘living labs’ in which innovations can be tested at a district level. Cultural spaces, including both large institutions (such as the British Library in the Knowledge Quarter, or Sadler’s Wells in Queen Elizabeth Olympic Park) and smaller galleries and theatres, are an important subtype of such spaces. The
48
strength of London’s creative sector sees cultural institutions and performance spaces play an important role in emerging innovation districts, often as anchor tenants, but also in creating a sense of place, vibrancy and authenticity of the type not found in out‑of‑town science parks.
ii) Physical spaces in the private realm: This includes both offices and residential space. A number of US innovation districts, for example, include microhousing, offering compact and often (relatively) affordable housing for innovation district workers.
iii) Assets that join spaces together: These are spaces critical to the ‘open’ nature of innovation districts, very much setting them apart from the more traditional science park model. This may include footpaths and cycle lanes, and the infrastructure that knits the district into the broader urban network. As well as spaces that allow for flow between institutions these may be spaces that encourage collaboration and recreation, such as parks and piazzas.
3— Networking Assets: These are relationships and social ties that connect employees and institutions within innovation districts. As noted above, the interaction between employees at both formal and informal levels, particularly between firms and sectors, is a distinctive feature of innovation districts. These relationships can be defined as strong ties, including collaboration and networking within specific sectors, and weak ties, which include networking across sectors, in the form of dedicated networking events, hackdays or meetups. It is these activities, and the relationships built between institutions and their users, that make innovation districts greater than the sum of their constituent parts.
Case Study – Here East and OlympicopolisLocated in the former media hub of Queen Elizabeth Olympic Park, Here East is a 1.2 million square foot mixed‑use campus, offering space for start‑ups, universities and businesses. This mixed‑use offer is premised on three factors. As a result of its former use as the press and broadcast cen‑tre during the London 2012 Olympic and Paralympic Games, the premise has inherited world‑class connectivity. Here East is also a stone’s throw from Hackney Wick, home to one of Europe’s largest creative communi‑ties, many of its members already working at the inter‑section between

49
design, manufacturing and technology. Here East is working closely with local partners in the area, who are creating a new cultural and educational district in Queen Elizabeth Olympic Park, dubbed “Olympicopolis” by Mayor Boris Johnson.
While the space itself is comprised of three separate buildings, the Here East vision is that these buildings and their occupiers will form a cohesive innovation ecosystem, combining entrepreneurs with students. To this end, space for Here East users (and indeed the local community) to meet, socialise and collaborate is a central feature of the development. This includes a courtyard (The Yard) modelled on the dominant urban form of neighbouring Hackney Wick, retail space (Canalside), and a 950‑ seat auditorium for a wide range of uses including community events.
Equally important to the internal innovation ecosystem of Here East is its relationship to the rest of QEOP. The creative and digital focus of Here East makes it a natural fit with the park’s flagship tenants, among them the V&A, Sadler’s Wells, London College of Fashion, UCL East, and the Smithsonian.
In addition to 251,000 sq ft of Grade A flexible offices, with anchor tenants including new cable broadcaster BT Sport, Here East will be home to two higher education institutions. Loughborough University London, renowned for its expertise in sport and media, will accommodate some 1000 postgraduate students at Here East. Two UCL faculties – the Bartlett School and UCL Engineering Faculty – will take a total of 40,000 sq ft.
Here East is being developed by iCity, a company owned by clients of Delancey, a specialist real estate investment, development and advisory company. Delancey is also developing rented housing in a new neighbour‑hood at East Village, on the doorstep of QEOP, which emphasises their hands‑on role in both designing the space and curating its mix of tenants, through offering a range of flexible floor plates, tenures and price points.
Connectivity, both physical and digital, is an important feature of East Village and Here East’s success. Stratford, Here East’s nearest major sta‑tion, recently benefited from a rezoning, moving from Zone 3 to 2/3, with Crossrail set to open in 2018, and Hackney Wick station is due to undergo a major upgrade. Here East hosts a data centre operated by Infinity SDC, on a carrier‑neutral basis. This means that the centre, one of Europe’s largest, will act as a regional hub to local businesses, as well as providing high‑quality connectivity to the many tech‑led tenants at Here East.

4 WHAT DO INNOVATION DISTRICTS OFFER LONDON?
52
A cool head in a hot real estate market When it comes to the drivers of a successful knowledge economy, London performs exceptionally well on two out of three counts. As chapter two established, London has skills in abundance, and performs well in attracting investment in R&D, at both a private and public level – both of which are greater challenges for many mid‑sized cities.
What London lacks, however, is land, for both residential and commercial use. In turn, this squeeze on land threatens the city’s affordability for young professionals, and limits the attractiveness of the city as a place to start a business. In hot markets such as London, therefore, innovation districts need a much sharper focus on optimising land use, through rethinking low‑density development in locations such as waterfronts and former industrial areas.
Moreover, innovation districts are not only about revaluing density, but also encouraging mixed‑use development, alleviating pressure on land both for housing and for commercial/industrial use. With land in London at a premium, and residential use increasingly prioritised over commercial and industrial, innovation districts encourage mixed‑use development, and enable rebalancing between land‑use priorities at borough and London levels.
Yet the concentration of mixed‑use buildings does more than just provide space for employment and research in London. Rather, these districts can create the spaces where these skilled individuals can interact, collaborate, and generate growth. Given their role in attracting skilled individuals, London’s universities can play an important role in the formation of these districts. The presence of universities alone is not enough to create a successful foundation for innovation. Rather, “universities are most effective at shaping a local economy when they are part of a larger eco‑system of innovative activity, one that includes a thick market for specialised labor and specialized intermediate services.”56 Universities are attractive, low‑risk, financially robust tenants, so are effective in attracting investment to new developments. They also provide a sense of brand and place, helping developments to differentiate themselves and attract further tenants. Therefore, while university and research space may create a ‘viability drag’ in offering less return per square foot than residential or other commercial use, the appetite for cultural and educational institutions to feature in new developments highlights the role innovation districts can play in driving placemaking.57
53
Case Study: Kings Cross The redevelopment of King’s Cross is one of London’s most successful regeneration projects. The current site features a range of mixed uses, including 26ha of public realm (equivalent to 42 football pitches), cultural and education institutions, 3.4 m sq ft of office space, almost 2000 residen‑tial units, and 650 student homes.
Kings Cross represents the first major use of pension fund investment in securing development funding. Majority landholders London and Con‑tinental Railways preferred a long‑term role in the development vehicle, suiting the timelines of BT pension fund Hermes, who provided the equi‑ty to lead developers Argent. It was this backing that saw Argent weather the financial crash, at a time when a number of developers went bankrupt. Argent subsequently reordered their delivery plans, building affordable housing ahead of housing for market sale, and Central St Martins, which was not part of the initial planning proposal. The decision to add Central St Martins as a first phase meant that the institution played a role in bring‑ing life to the Kings Cross development as a whole, with a critical mass of some 5000 skilled and creative young people proving a draw to major corporates such as Google. This strategy exemplified the symbiotic rela‑tionship between developers craving authenticity and a university with a desire to bring multiple departments under one roof.
A further pioneering feature of the Kings Cross development is the use of flexible planning permission. The permission granted allowed 20 per cent flexibility to vary the mix of uses within the total floor space, meaning that uses could be adapted to reflect demand. It is the focus on flexibility, an investment structure that suited long‑term interests, public realm, and a creative base that have led to King’s Cross’s reputation as a leading example of placemaking and designing mixed‑use at a large scale.
The Space Race – Universities and Real Estate In addition to the benefits from the creation and support of successful innovation districts in London, there is an equal benefit to be gained from universities.
UK research and innovation policy has been subject to a number of reviews and interventions, with no fewer than a dozen reports published in the past decade. Recent contributions include the Whitty Review (2013), which set out how universities can play a greater role in generating economic growth as part of an “enhanced third mission”,58 and the Dowling Review (2015), which looked more specifically at university‑business research collaboration. The latter includes a meta‑analysis of the many reports into HE‑business collaboration and
54
their recommendations, finding that change tends to be promoted in behaviour and organisation, rather than in more measurable areas such as infrastructure and finance.59
Universities have greater control over student numbers than previously before. Since 2015, universities are no longer subject to a government cap on numbers. The result of this has been greater focus from universities on recruitment objectives, and greater competition between institutions for students. An increase in tuition fees allowing universities to charge students up to £9000 has increased the expectations of prospective students, including expectations of facilities on offer.
HEFCE funding is increasingly allocated on the basis of competition, rather than by formula. By 2011–2014, 50% of HEFCE funding was allocated on a competitive basis.60 One suggested impact of this change has been a sharper focus on strategic projects. Competitive funding from HEFCE is often matched by other sources of funding, encouraging universities to form partnerships with corporations and/or other institutions.
Low interest rate ratios mean that debt is relatively affordable for universities. An increasing number of universities are beginning to raise bonds, helped by the fact that the HE sector is highly regulated, and has a degree of government backing, making it particularly attractive to institutional investors.61
Despite substantial cuts to university funding, institutions are continuing to invest in their estates.62 Investment from the higher education sector is predominantly directed towards buildings and infrastructure – of the £20bn invested by the sector since 2004–05, two‑thirds has been spent on buildings.63 This tends to be focused on new buildings rather than refurbishment.
A huge benefit of UCL East is that we can use new space to do new things – an option that simply is not available to use in Bloomsbury. And what this move also gives to us is space, not just for facilities, but space that we can use flexibly, where we can experiment with how we innovate, how we teach, and how we work with those around us. What is important is that the lessons learnt in this space can be brought back to Bloomsbury, and that we can build a relationship of learning between the two campuses.Celia Caulcott, Vice‑Provost (Enterprise), University College London
Yet the role of universities in regeneration projects is a relatively new phenomenon. While universities like UCL and Imperial spearheaded
55
urban change in the 19th and early‑20th centuries, London universities have been relatively detached from their urban surroundings, taking a built form of isolated campus or inside‑looking sets of buildings. The majority of university buildings in London have long been ‘hidden in plain sight’. This will be shown in more detail in chapter six, which includes an analysis of the publicly accessible space in London’s universities, clusters and innovation districts.
Case Study: London College of Communication at Elephant and CastleThe redevelopment of London College of Communication (part of Uni‑versity of the Arts London) is part of a wider regeneration project in central London. UAL initially considered moving the London College of Communication to Stratford, until it was proposed by Delancey that a new, purpose‑built development could be incorporated into the Elephant and Castle town‑centre scheme.
The success of the regeneration is closely linked to significant in‑vestment in infrastructure improvements. Despite Elephant and Castle’s Zone 1 location, its transport facilities are notoriously poor. Upgrading the underground station at Elephant and Castle is seen as a priority for the development’s success. The tube upgrade is funded by Transport for London, and supported with pooled community infrastructure levy con‑tributions from the various developers operating in Elephant Castle.
In addition to housing the London College of Communication, the site will house university services, currently located in Holborn, and space for collections, including the Stanley Kubrick film archive. The rehousing of these collections within new archives, represents a concerted attempt to make university assets more accessible to the general public and local community. There are also plans to open up the site by opening the new buildings over the first and second floors for community uses and events, which has always been difficult in LCC’s current building.
Reconfiguration of the London College of Communication is in‑formed by the existing strengths of institutions and students. The College has a strong spirit of entrepreneurship, although graduates often leave the area to set up business elsewhere. By providing appropriate space and functions within the redevelopment for start‑ups, Delancey hope to en‑courage graduates to stay in the area.
56
This offer will be further enhanced by the development of new retail space, and approximately 1000 build to rent flats. As well as getting the right use class mix, Delancey is investing in stitching together the spaces between these institution and developments.
Thinking about placemaking and their location in an urban setting does not come naturally to universities. Staff are more likely to be focused on what is going on inside the buildings or in the context of international research networks, rather than in the spaces between them. From a university perspective, there is a strong feeling that collaboration between universities and business is improving, though this is not necessarily reflected on a local level, and may be confined to specific departments or initiatives.
When we started working on this development, we instantly became aware of the opportunity presented by UAL working in conjunction with Southwark, and the potential for mutual benefits. We’ve found that the space has prompted a lot of enthusiasm amongst senior leadership at UAL. We would like to play a role in connecting the institution with the council, in emphasising the symbiosis that can take place between the university and the local area, ultimately securing another major anchor to the Elephant and Castle town centre.Richard Chambers, Project Director, Delancey
London universities are increasingly looking at the role they can play in regeneration, and in shaping districts across the capital. As this report shows, universities in London are devoting increasing amounts of money, resources and planning to building new or redesigned facilities. What is more, these developments are increasingly pitched as part of the framework of a wider area regeneration strategy, or the creation of an innovation district.
Many of the reasons for increased investment in their estate are the same as those outlined above – increased competition between universities, pickier students, deregulated student numbers, and an amenable financial environment. But the way in which universities are developing these spaces is changing. Universities are increasingly aware of the quest for authenticity, for proximity, and for engagement between businesses, entrepreneurs and civic organisations. Furthermore, if London universities want to stay in London, where there is strong competition for land in all use classes, integrating their estate expansion
57
plans into a bigger regeneration project can be the best way to secure financial viability and planning permission.
Imperial College White City CampusImperial College’s original South Kensington Campus forms part of what can be considered London’s first innovation district – Albertopolis, a cluster of educational and cultural institutions along Exhibition Road in South Kensington, built as a ‘legacy’ of the 1851 Great Exhibition.
Located 3.5km from the South Kensington Campus, the White City Campus is situated on a c.25 acre site in west London. The site is part of an Opportunity Area – a planning framework designated by the Greater London Authority, aimed at kickstarting undeveloped sites which have stalled due to land contamination, multiple landowners and poor infra‑structure.
Rather than forming part of a long‑term bid, the White City Campus is the result of a spontaneous land acquisition. The university bought the former BBC Woodlands site for £28m in 2009, though it did not announce its vision for an innovation district at White City until 2013. The site will be a mixed development, centred around a core of academic buildings plus commercial and residential accommodation, including 600 units for postgrad students. The mixed development approach allows for a varied cash flow, with specific hubs receiving funding from different sources. Imperial received £35m in funding from the Higher Education Funding Council for England for the Translation and Innovation Hub (Incubation, Accelerator and Co‑location space open to Imperial and non‑Imperial tenants) through the UKRPIF programme, and a further £90m comes from Voreda, a London‑based property developer and investor.64
Imperial’s White City Campus is an interesting example of a high‑er‑education‑led development which began as a land acquisition, and later transformed into a planned innovation district. Imperial’s own business school provided a feasibility study for the realisation of such a goal, tak‑ing into account trends in innovation, case studies of cluster and districts, and an evaluation of Imperial’s existing strength and assets. The latter in‑cludes Imperial College’s strength in scientific research, and the potential for the university’s reputation to attract the attention of both corporates and start‑ups. By understanding this asset base, the university is able to introduce plans to make the most of it: for example, by recruiting aca‑demics open to scientific translation, and creating an incubator space that offers flexible rents and space.

58
It is no coincidence that a university with an ambition to create an innovation district, rather than simply a satellite campus, has invested in the people who will drive this vision and deliver it in the long term. The university has appointed a dedicated Development Director for the White City scheme with a high‑level advisory board that provides a balance of executive and non‑executive support with a strong grounding in innova‑tion and business‑university collaboration.
5 INCLUSIVE GROWTH AND THE DEMOCRATISATION OF INNOVATION
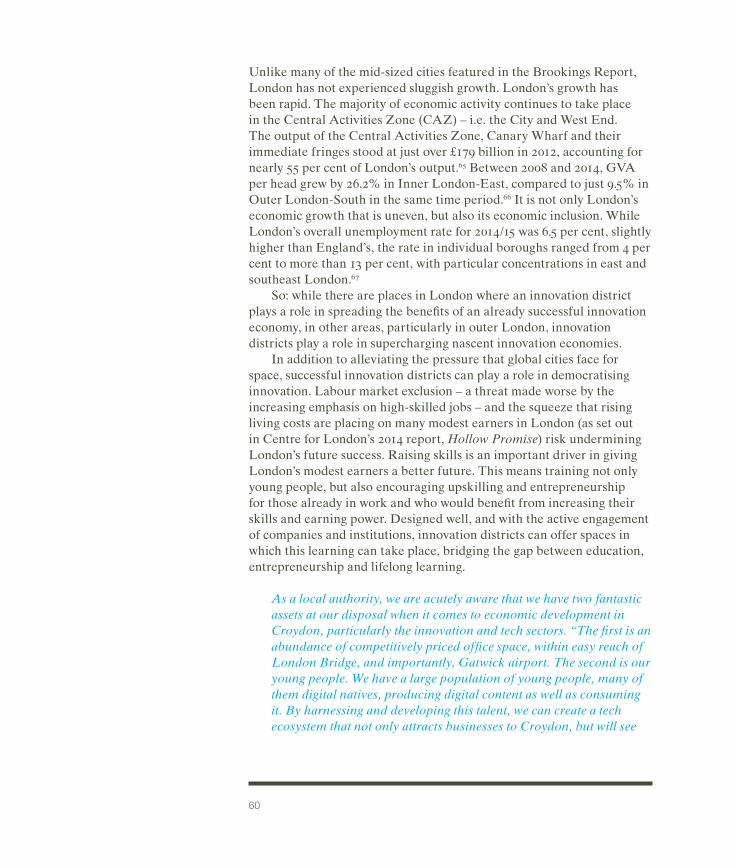
60
Unlike many of the mid‑sized cities featured in the Brookings Report, London has not experienced sluggish growth. London’s growth has been rapid. The majority of economic activity continues to take place in the Central Activities Zone (CAZ) – i.e. the City and West End. The output of the Central Activities Zone, Canary Wharf and their immediate fringes stood at just over £179 billion in 2012, accounting for nearly 55 per cent of London’s output.65 Between 2008 and 2014, GVA per head grew by 26.2% in Inner London‑East, compared to just 9.5% in Outer London‑South in the same time period.66 It is not only London’s economic growth that is uneven, but also its economic inclusion. While London’s overall unemployment rate for 2014/15 was 6.5 per cent, slightly higher than England’s, the rate in individual boroughs ranged from 4 per cent to more than 13 per cent, with particular concentrations in east and southeast London.67
So: while there are places in London where an innovation district plays a role in spreading the benefits of an already successful innovation economy, in other areas, particularly in outer London, innovation districts play a role in supercharging nascent innovation economies.
In addition to alleviating the pressure that global cities face for space, successful innovation districts can play a role in democratising innovation. Labour market exclusion – a threat made worse by the increasing emphasis on high‑skilled jobs – and the squeeze that rising living costs are placing on many modest earners in London (as set out in Centre for London’s 2014 report, Hollow Promise) risk undermining London’s future success. Raising skills is an important driver in giving London’s modest earners a better future. This means training not only young people, but also encouraging upskilling and entrepreneurship for those already in work and who would benefit from increasing their skills and earning power. Designed well, and with the active engagement of companies and institutions, innovation districts can offer spaces in which this learning can take place, bridging the gap between education, entrepreneurship and lifelong learning.
As a local authority, we are acutely aware that we have two fantastic assets at our disposal when it comes to economic development in Croydon, particularly the innovation and tech sectors. “The first is an abundance of competitively priced office space, within easy reach of London Bridge, and importantly, Gatwick airport. The second is our young people. We have a large population of young people, many of them digital natives, producing digital content as well as consuming it. By harnessing and developing this talent, we can create a tech ecosystem that not only attracts businesses to Croydon, but will see

61
Croydon residents fully participate in all that the tech sector and its incumbent jobs have to offer.Jo Negrini, Director of Place, London Borough of Croydon
Many of London’s most successful clusters and innovation districts are located in areas with relatively high levels of deprivation, and low levels of skills and employment. Tech City, for example, is located in inner east London, an area historically having a high proportion of newly arrived, poor immigrant communities, with a labour market characterised by low‑skilled, low‑paid work. While poverty rates have declined significantly in recent years in the east London boroughs which house the Tech City cluster, inner east boroughs still have the highest proportion nationally of children and old people living in poverty.68 This suggests that the reduction in poverty is at least partly explained by an influx of wealthier, more professional households into the boroughs, rather than existing residents becoming wealthier.69
Case Study: Developing Skills in the Knowledge Quarter (KQ)In partnership with a local primary school, the KQ are delivering a one‑day conference in April 2016 to showcase the variety of industries and career opportunities available from Knowledge Quarter partners and friends. The conference will target students in year 5 (age 9–10) and in particular young people from vulnerable groups. The participants will come from 30 schools within Camden and Islington. After the conference each child will be appointed as a careers champion and provided with a toolkit which they can use to arrange their own school‑specific careers event, reaching even more children.
The KQ is also developing its own apprenticeship scheme for young people from the boroughs of Camden. Developed with a group of em‑ployers in the Knowledge Quarter including the Francis Crick Institute, London BioScience Innovation Centre and Health Science Laboratories, the scheme will launch later this year, training young people as laboratory technicians. As well as being paid, they will be fully funded for a founda‑tion or bachelors’ degree in biomedical sciences from the University of Westminster.
The KQ Apprenticeships allow the local authority to exploit the crit‑ical mass of leading life sciences firms and institutions to offer high‑level apprenticeship opportunities to the borough’s young people. At the same time, the Knowledge Quarter institutions benefit from the creation of a pipeline of talented and motivated individuals.

62
Rather than allowing the development of so‑called ‘tech‑ghettoes’, innovation districts offer an opportunity to democratise innovation and to energise local communities. As such, innovation districts are not just about maintaining London’s knowledge economy, and ensuring the city has the space, skills, and capital required: there must be equal focus on expanding access to skills and employment opportunities across London’s innovation districts, as well as ensuring that the right mechanisms are in place to capture the spillover benefits of innovation districts.70 There are four main ways in which innovation districts can promote this form of inclusive growth:
1—The creation of employment opportunities, including construction work during the development of districts, and in end-user jobs. A number of innovation districts have made specific attempts to promote these opportunities within the local community. In addition to direct employment in innovation district firms and institutions, districts can promote inclusive growth by boosting supply chains in local areas.
2—The upskilling of local residents. While job creation is important, it is equally important that local people have the required skills to apply for these jobs. In many respects, innovation districts offer an ideal geography for developing vocational and technical skills: firms are often located alongside universities and colleges. This enables both the design of formal education programmes that see young people receive training in the classroom and workplace, but also increases the scope for more informal engagement between young people, educational institutions and employers. This may include attending exhibitions, hackdays, and a range of other events.
3—Economic Spillovers: While many local authorities see benefits from the development of innovation districts in the form of shared facilities or employment opportunities, current value‑capture mechanisms mean that they do not necessarily see the economic benefits of high‑skill, high‑value institutions and businesses locating in their neighbourhood. It is too early to tell whether business rate reform – which will see local authorities retain 100% of business rates – may change the disposition of local authorities towards such development.
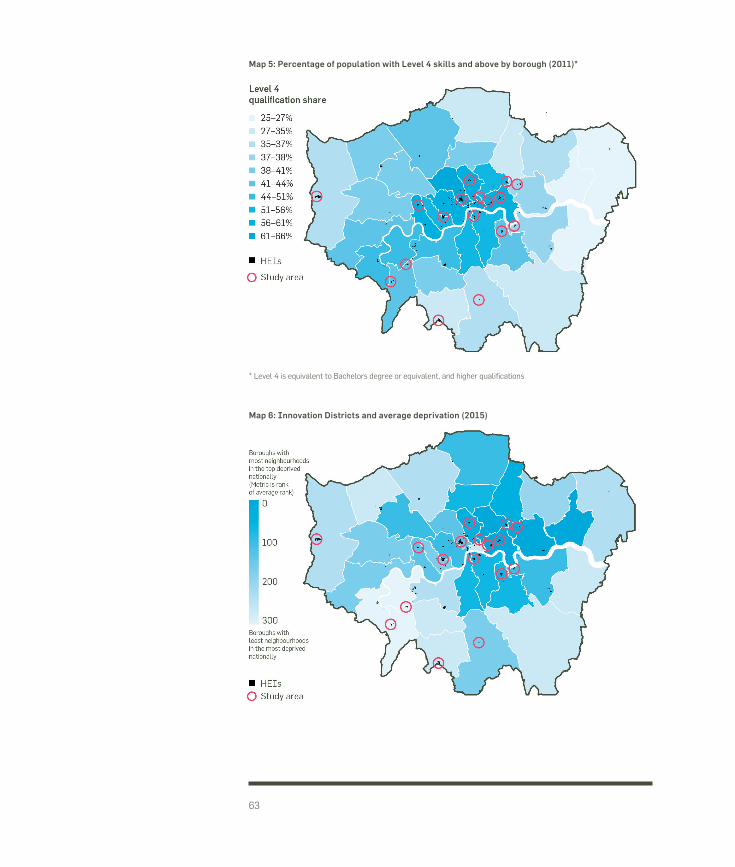
63
Map 5: Percentage of population with Level 4 skills and above by borough (2011)*
Map 6: Innovation Districts and average deprivation (2015)
* Level 4 is equivalent to Bachelors degree or equivalent, and higher qualifications

64
4—Shared assets and a sense of place: Innovation districts can play a strong role in promoting inclusive economic growth where districts combine physical regeneration with a coherent governance structure. Where governance structures are well defined and individuals in respective organisations are well networked, innovation districts can define and implement a vision for inclusive growth. This may include the provision of shared facilities and public realm, and the possibility of co‑ordinating between training providers and employers to deliver skills training. On a larger scale, Corridors of Hope (an initiative between the twin cities of Minneapolis and St Paul) saw state, regional and local government work alongside third‑ and private‑sector organisations to set economic development targets, which covered indices including percentages of foreign‑born population aged 16–64 who are working and the employment gap between whites and people of colour.
Recommendations as to how national, regional and local government can leverage the opportunity of innovation districts for growth are set out in chapter eight of this report.
At a time of rising social inequality, they (Innovation Districts) offer the prospect of expanding employment and educational opportunities for disadvantaged populations given that many districts are close to low- and moderate-income neighborhoods.Bruce Katz and Julie Wagner71
The above benefits of innovation districts for inclusive growth do not, however, appear by default. They require good governance and good design. Good governance is crucial in building constructive, long‑term relationships between firms, institutions and local authorities. Leveraging innovation districts to boost local skill levels requires a proactive approach. Proximity alone is not enough to guarantee investment in and engagement with the local community. This is where formal governance networks and informal social networks can prove particularly useful.
Case Study Three: The Knowledge QuarterThe Knowledge Quarter (KQ) was launched in December 2014 with the aim of bringing together established and new institutions within a one‑mile radius of King’s Cross. Currently comprising more than 59 partners,
65
the KQ represents a unique diversity of knowledge and research sectors and disciplines, with a number of existing and emerging micro‑clusters – including a creative cluster in Kings Cross, the biomedical research clus‑ter along the Euston Road, and a higher education cluster in Bloomsbury. Partners range from large institutions such as UCL, the British Museum, Springer Nature, the Wellcome Trust and the British Library, to smaller institutions such as the Design Council and the Arts Catalyst.
The KQ model is unique in that it represents a governance structure that has been retrofitted onto a mature innovation district with a criti‑cal mass of large anchor institutions. While a number of important in‑stitutions have established themselves in the area over the last couple of decades, the area has recently seen an accelerated arrival of high‑profile organisations including King’s Place, Central Saint Martins, Google, the Digital Catapult, and both The Francis Crick and Alan Turing Institutes, as well as a number of new co‑working spaces, incubators and acceler‑ators. In addition to new institutions, the KQ has benefited from major infrastructure projects on its doorstep, including the High Speed 1 service to continental Europe, and the potential development of Crossrail 2 and High Speed 2.
There is clear capacity for the KQ to help develop a sense of place and brand that spans the many institutions and activities within its reach. The KQ currently hosts a number of international delegations, for whom the KQ is an excellent gateway through which to connect with member organ‑isations, showing the possibility of innovation districts to act as attractions for inward investment in their own right and a potent form of soft power.
One of the strengths of KQ as an organisation is the ability to create and convene networks. The result of this is not only the strength that comes from speaking with one voice, but the forming of partnerships between institutions who would not normally collaborate. An example of this is the Royal College of GPs working with students from University of the Arts London to design ways of showcasing the information needed for audits in the health sector. The next challenge is boosting the scale and frequency of these interactions.Daniel Stevens, Knowledge Quarter
The KQ provides a vehicle for bringing institutions and highly skilled workers within an innovation district together, and to attract further in‑vestment. The ambition is for the KQ brand to be recognised internation‑ally as an ambassador for London’s knowledge economy, with a profile similar to Silicon Valley’s abroad, or Tech City’s Silicon Roundabout closer to home.

66
It is not just the proximity and shared governance of innovation districts that can encourage the democratisation of innovation through increasing access to skills and employment. The ability to plan, design, and curate on a large scale creates the opportunity to develop areas of economic activity that are as accessible as they are productive. This means designing buildings and a public realm that encourage curiosity and engagement, rather than glass‑fronted buildings with no through way routes. Of course, certain research facilities cannot be fully open to the public, but they can be designed in a way that engages rather than intimidates.
Access to innovation needs to be inclusive so that all potential users, regardless of age, gender or disability, can make use of facilities. As architects we seek to eliminate barriers which may be physical, attitudinal or procedural, which may inhibit the involvement of the whole community. It means that all organisations need to consider their approach, including employment policies, programming and marketing equipment as well as buildings.Roger Hawkins, Partner, Hawkins\Brown
Good governance and good relations between institutions, when combined with good design and placemaking, are at the heart of what makes innovation districts tick. Together, these two aims can play an important role in boosting both economic growth and economic inclusion. The challenge (and also the opportunity) for London is to develop innovation districts in a way that can do both – supercharging economies where needed, and spreading the benefits of this economic development. Maximising inclusive growth requires the GLA and local authorities not only to understand the economic potential of what is on their doorstep, but also to identify individuals and institutions who can drive aspirations for boosting future growth and commitments to improving the inclusivity of existing growth. Different strategies for innovation districts will apply to different locations and boroughs. Chapter 7 of this report will set out a framework for auditing the assets of university sites, clusters and innovation districts, which we hope will help local authorities and the GLA better understand their competitive advantage.
6 THE URBAN FORM OF LONDON’S UNIVERSITIES, CLUSTERS AND INNOVATION DISTRICTS
68
This chapter will present an overview of some of London’s established and nascent innovation districts, identifying similarities in terms of urban form, governance structure and relation to the local knowledge economy. This analysis forms the basis of a typology of London’s innovation districts, thereby helping us to understand how the development of the knowledge economy is changing London’s urban geography, and the role that universities play in these new urban districts.
For the purpose of developing this typology, a range of case study areas in London were selected, covering universities, clusters and nascent innovation districts, with a range of timeframes/age, geographic spread, and development and funding models.
Study sites are as follows:
Birkbeck/UEL University (Stratford) Brunel University Goldsmiths College Greenwich UniversityHere East Kingston University (Penrhyn Road and Kingston Hill Campus)Imperial College South Kensington Imperial White City CampusLondon Cancer HubLondon Met Holloway CampusLondon Met/Queen Mary WhitechapelLondon South Bank University72
Queen Mary University of London, Mile End CampusTech CityTech City CroydonUniversity College London, Bloomsbury
By mapping the built form of these case study locations, we have identified three distinct categories of innovation districts, based on the permeability of sites (i.e. the proportion of publicly accessible roads). The reason behind doing this is to understand what these districts look like at the ground level, and how they are stitched into the fabric of the locality around them. It should be noted, however, that permeability does not necessarily mean accessibility in terms of public transport, or engagement with the local area. As Figure 2 shows, some of the study sites with the largest proportion of publicly accessible roads have poor connectivity. Similarly, some of the study sites which appear to have low levels of permeability do in fact offer a range of programmes and events for those who are not members of the institutions in question.
69
Embedded: University buildings and institutions, often long‑established, and which have become woven in to the urban fabric of the city. As a result, these sites have the maximum number of through‑roads, almost all of which are public ways, and a range of facilities shared between students, researchers and the general public. University/research institution/firm traffic mix with general traffic flow to a high degree.
Cluster: Universities, institutions and a critical mass of firms crossed by a few roads and separated into several ‘sub‑campuses’. University‑style clusters often include some shared facilities and accessible public realm. There is some mixing of general traffic and university/research institution/firm traffic.
Campus: Defensible urban enclave with a minimum of through‑routes, quite detached from its urban environment, sometimes with controlled access. There is little mixing of general traffic and university/research institution/firm traffic.
Understanding the urban form of London’s universities, clusters and innovation districtsThese forms are best understood as responses to location and land availability, and the period in which universities, clusters and districts developed. When it was first developed, UCL’s Bloomsbury campus was located in what was essentially marshland on the edge of London. Today, as London’s centre of gravity moves east, sites that are now considered outer London may well be considered central in years to come. Equally, while it is London’s older universities that tend to display embedded characteristics (that is, other buildings and urban forms have developed around them), sites that are currently campus‑like in form may later find themselves at the heart of clusters, as they extend out into and open up to the surrounding urban fabric. There is an extent to which these characteristics should be considered to be fluid rather than fixed, and subject to changes made both by institutions and to the area in which they are located.
A review of study sites shows that more recently developed sites are likely to take a campus form. This is often linked to their location in less‑developed areas of London, with the institutions in question acting as an anchor for wider development, building at scale or undertaking a wholesale recycling of existing buildings. For example, Here East’s campus form can be attributed to the scale of the buildings that it occupies and their location in one of the Olympic Park’s future development zones, while the London Cancer Hub’s campus form results from a programme of integrated land assembly in a suburban
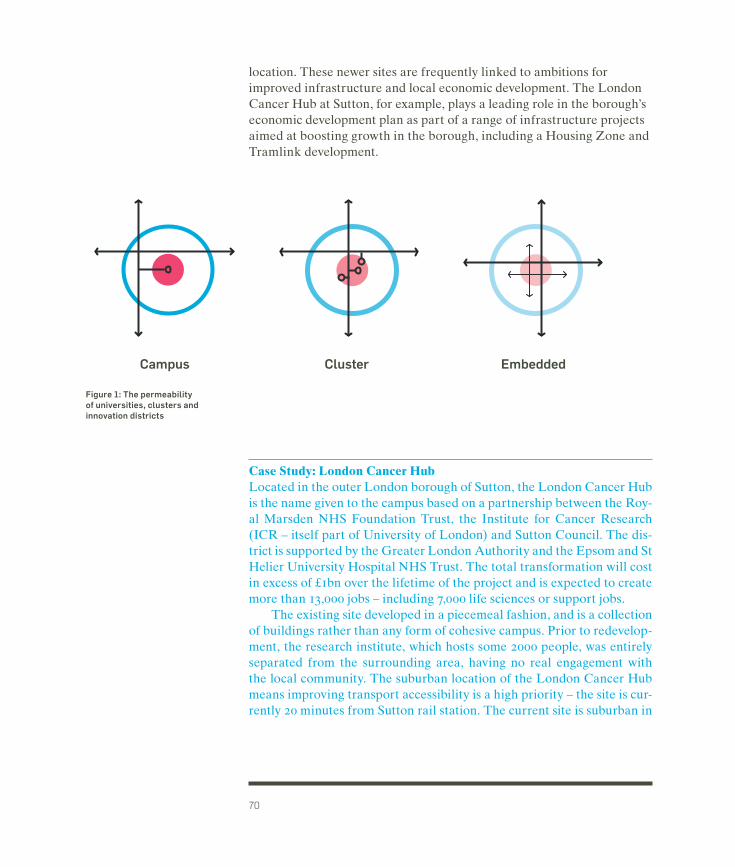
70
location. These newer sites are frequently linked to ambitions for improved infrastructure and local economic development. The London Cancer Hub at Sutton, for example, plays a leading role in the borough’s economic development plan as part of a range of infrastructure projects aimed at boosting growth in the borough, including a Housing Zone and Tramlink development.
Case Study: London Cancer HubLocated in the outer London borough of Sutton, the London Cancer Hub is the name given to the campus based on a partnership between the Roy‑al Marsden NHS Foundation Trust, the Institute for Cancer Research (ICR – itself part of University of London) and Sutton Council. The dis‑trict is supported by the Greater London Authority and the Epsom and St Helier University Hospital NHS Trust. The total transformation will cost in excess of £1bn over the lifetime of the project and is expected to create more than 13,000 jobs – including 7,000 life sciences or support jobs.
The existing site developed in a piecemeal fashion, and is a collection of buildings rather than any form of cohesive campus. Prior to redevelop‑ment, the research institute, which hosts some 2000 people, was entirely separated from the surrounding area, having no real engagement with the local community. The suburban location of the London Cancer Hub means improving transport accessibility is a high priority – the site is cur‑rently 20 minutes from Sutton rail station. The current site is suburban in
Campus Cluster Embedded
Figure 1: The permeability of universities, clusters and innovation districts

71
character – almost a third of the site is given to roads and parking space, and just 13% of site is built on.
The masterplan proposes a flexible approach to each institution’s de‑sign. The proposed framework not only includes capacity for institutions to grow, but for a degree of commercial space that can be adjusted subject to market viability. Design also encourages vertical integration of institu‑tions to encourage collaboration and contact with new businesses. Work is also being planned to re‑integrate the site with surrounding places, new routes connecting neighbourhoods, and four public squares. The success of the plan also assumes a transformation in public transport accessibility, including the extension of the Tramlink to the site, a bus loop and dedi‑cated cycle storage, with an overall aim of reducing car use on site by half.
The innovation district concept is exciting but needs all levels of government to collaborate to turn it into practical reality. We need central government to incorporate it into the UK’s approach to urban policy and to enable innovative financing instruments to be used to support the development of innovation districts in the way the US government has done. Sutton has had some support from the GLA at regional level as part of the MedCity initiative but most of the planning resource is coming from council commissioned work. The potential is huge and it won’t be delivered by a single tier of government acting in isolation. Niall Bolger, Chief Executive of Sutton Council
The masterplan of the London Cancer Hub identifies the formation of an innovation district as an explicit priority – attracting the most talent‑ed researchers, bringing experts from different scientific fields under one roof, and delivering a public realm development that features retail and a new school. The centrepiece of this is a Knowledge Centre, combining laboratories, business space, an auditorium and leisure facilities.
By contrast, sites with cluster characteristics are more likely to form in areas where low office rents have allowed a critical mass of knowledge economy activity to coalesce. This is one of the factors behind the initial growth of Tech City as a cluster, and is also evident in the increasing number of start‑ups locating in Croydon.
This report does not advocate the development of one urban form over another. Rather, this typology is a means of understanding the response of universities, firms, and local authorities to the changing demands on the affordability and type of space required for growth,
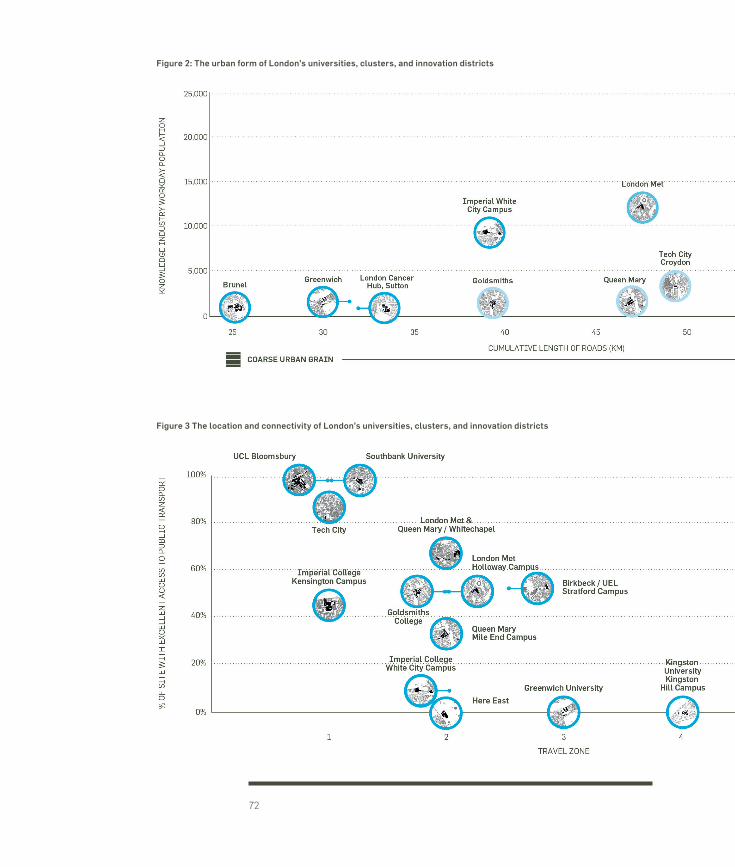
72
Figure 3 The location and connectivity of London’s universities, clusters, and innovation districts
Figure 2: The urban form of London’s universities, clusters, and innovation districts
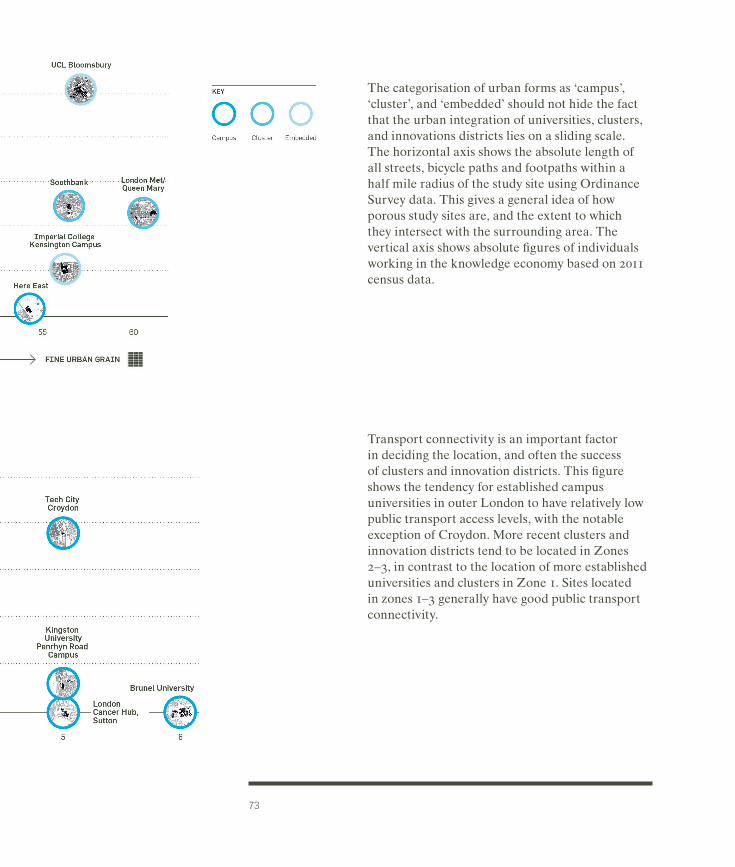
73
The categorisation of urban forms as ‘campus’, ‘cluster’, and ‘embedded’ should not hide the fact that the urban integration of universities, clusters, and innovations districts lies on a sliding scale. The horizontal axis shows the absolute length of all streets, bicycle paths and footpaths within a half mile radius of the study site using Ordinance Survey data. This gives a general idea of how porous study sites are, and the extent to which they intersect with the surrounding area. The vertical axis shows absolute figures of individuals working in the knowledge economy based on 2011 census data.
Transport connectivity is an important factor in deciding the location, and often the success of clusters and innovation districts. This figure shows the tendency for established campus universities in outer London to have relatively low public transport access levels, with the notable exception of Croydon. More recent clusters and innovation districts tend to be located in Zones 2–3, in contrast to the location of more established universities and clusters in Zone 1. Sites located in zones 1–3 generally have good public transport connectivity.
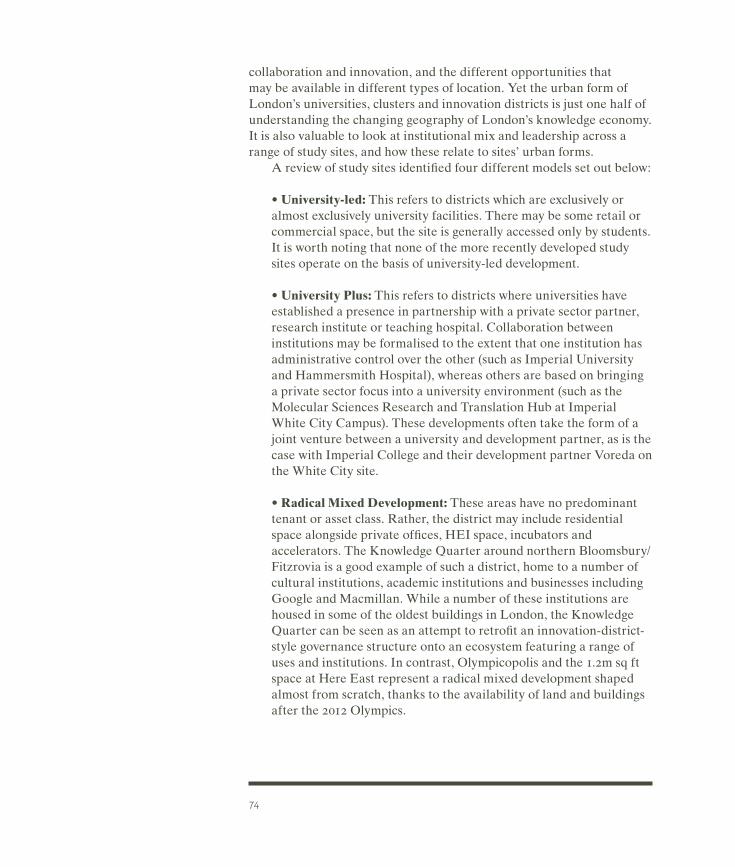
74
collaboration and innovation, and the different opportunities that may be available in different types of location. Yet the urban form of London’s universities, clusters and innovation districts is just one half of understanding the changing geography of London’s knowledge economy. It is also valuable to look at institutional mix and leadership across a range of study sites, and how these relate to sites’ urban forms.
A review of study sites identified four different models set out below:
• University-led: This refers to districts which are exclusively or almost exclusively university facilities. There may be some retail or commercial space, but the site is generally accessed only by students. It is worth noting that none of the more recently developed study sites operate on the basis of university‑led development.
• University Plus: This refers to districts where universities have established a presence in partnership with a private sector partner, research institute or teaching hospital. Collaboration between institutions may be formalised to the extent that one institution has administrative control over the other (such as Imperial University and Hammersmith Hospital), whereas others are based on bringing a private sector focus into a university environment (such as the Molecular Sciences Research and Translation Hub at Imperial White City Campus). These developments often take the form of a joint venture between a university and development partner, as is the case with Imperial College and their development partner Voreda on the White City site.
• Radical Mixed Development: These areas have no predominant tenant or asset class. Rather, the district may include residential space alongside private offices, HEI space, incubators and accelerators. The Knowledge Quarter around northern Bloomsbury/Fitzrovia is a good example of such a district, home to a number of cultural institutions, academic institutions and businesses including Google and Macmillan. While a number of these institutions are housed in some of the oldest buildings in London, the Knowledge Quarter can be seen as an attempt to retrofit an innovation‑district‑style governance structure onto an ecosystem featuring a range of uses and institutions. In contrast, Olympicopolis and the 1.2m sq ft space at Here East represent a radical mixed development shaped almost from scratch, thanks to the availability of land and buildings after the 2012 Olympics.
75
• Enterprise-led: These innovation districts have no identifiable university presence, and are instead dominated by either a single private sector firm, or an ecosystem comprised of multiple smaller firms. Tech City is a good example of the latter, identified as a cluster due to its critical mass of digital firms, which eventually attracted the attention of policymakers and a subsequent government initiative.
Case Study: Tech City CroydonLocated in Outer London, Croydon’s transport connections made it an obvious hub for business development as the capital’s commercial occu‑piers looked to relocate from the capitals constrained core office areas in the decades after the Second World War. Between the 1960s and 1990s Croydon became a beacon of tall buildings and a byword for modernist architecture. Much of this office stock fell out of favour as it aged, and in recent years swathes were lost as it was converted into residential use under permitted development rights. However, as tech giants have arrived in central London hubs around Old Street and Farringdon, some of these office buildings have found a new lease of life as smaller firms have found themselves increasingly priced out of central London and a steady stream of start‑ups has begun to trickle out towards Croydon.
With its supply of office space and development land, and strong trans‑port links into central London, what has been Inner East London’s loss is now Croydon’s gain. Between 2011 and 2013, Croydon was the fastest growing tech hub in the UK, and the town centre is home to over 250 tech businesses with around 1,400 employees. While the young start‑ups grow, there is also a more mature group of tech companies, such as Intuitive, and DotMailer – which IPO’d on the London Stock Exchange in 2011.
This mixture of firms is seeing the emergence of strong innovation ecosystem in Croydon, which includes Croydon Tech City, a not‑for‑profit organisation responsible for growing, managing and sustaining Croydon’s tech cluster and community. More recently the Sussex Innovation Centre has also located in the borough. A subsidiary of the University of Sussex, it offers workspace, seed funding and business support to start‑ups, en‑trepreneurs, growing businesses and corporate innovation projects. Croy‑don’s tech‑focused growth is taking place in parallel to the rejuvenated educational and cultural offer in the borough, the cornerstone of which is the College Green redevelopment. The first phase of this project will see the iconic Fairfield Halls receive a £30m refurbishment to re‑establish it as one of the capital’s premier live music and entertainment venues, next door to which Croydon College will be provided with a new start of the
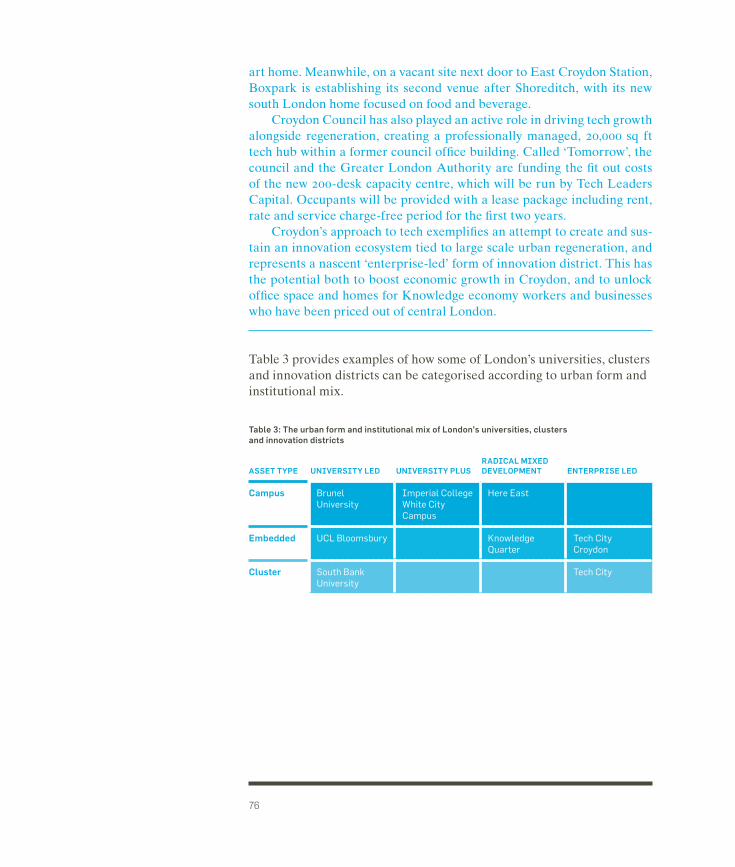
76
art home. Meanwhile, on a vacant site next door to East Croydon Station, Boxpark is establishing its second venue after Shoreditch, with its new south London home focused on food and beverage.
Croydon Council has also played an active role in driving tech growth alongside regeneration, creating a professionally managed, 20,000 sq ft tech hub within a former council office building. Called ‘Tomorrow’, the council and the Greater London Authority are funding the fit out costs of the new 200‑desk capacity centre, which will be run by Tech Leaders Capital. Occupants will be provided with a lease package including rent, rate and service charge‑free period for the first two years.
Croydon’s approach to tech exemplifies an attempt to create and sus‑tain an innovation ecosystem tied to large scale urban regeneration, and represents a nascent ‘enterprise‑led’ form of innovation district. This has the potential both to boost economic growth in Croydon, and to unlock office space and homes for Knowledge economy workers and businesses who have been priced out of central London.
Table 3 provides examples of how some of London’s universities, clusters and innovation districts can be categorised according to urban form and institutional mix.
ASSET TYPE UNIVERSITY LED UNIVERSITY PLUSRADICAL MIXED DEVELOPMENT ENTERPRISE LED
Campus Brunel University
Imperial College White City Campus
Here East
Embedded UCL Bloomsbury Knowledge Quarter
Tech City Croydon
Cluster South Bank University
Tech City
Table 3: The urban form and institutional mix of London’s universities, clusters and innovation districts

7 THE ASSETS OF LONDON’S UNIVERSITIES, CLUSTERS AND INNOVATION DISTRICTS
79
Find out who you are, and do it on purposeDolly Parton, via Bruce Katz.
Previous chapters of this report have set out the benefits that well‑governed and well‑designed innovation districts can bring both to local areas and to London’s economy as a whole, through maintaining the city’s ability to attract global talent and increase its competitive advantage in higher education and innovation. This report does not, however, recommend that boroughs and universities should begin developing identikit innovation districts in the hope of regenerating local areas, attracting new investment and upskilling residents. Rather, the innovation districts model should be seen as means of thinking about the interaction between human capital, physical space and financial capital in the context of the rise of the knowledge economy. That is, given the increasing premium on skills, and on space for innovation and interaction between companies, institutions and individuals, how can stakeholders plan accordingly? This planning also requires making the best use of existing assets, whether this be a large base of knowledge economy companies, a world‑class research institute, or a critical mass of start‑ups and small businesses. It involves considering how these actors can form the type of innovation ecosystem seen in innovation districts.
This chapter sets out a framework for understanding the assets of established and nascent universities, clusters and innovation districts in London. It adopts and adapts the Brookings typology of innovation district assets – economic, physical and networking – for London’s higher education and innovation ecosystem. The aims of doing this are as follows:
• To identify trends in the changing geography of innovation in London.
• To understand competitive advantage, and the challenges and opportunities for both supporting existing districts and nurturing nascent districts in the capital.
• To allow for comparison between study areas, and to give politicians, policymakers and developers a means of understanding the asset base from which they are starting.
This report does not advocate a ‘cookie cutter’ approach to forming innovation districts. Nor should this table be considered exhaustive. It is hoped that this table will form the basis of a dashboard which can be updated on a regular database to reflect the most recently available data.
80
The AssetsTo recap, innovation districts depend on three types of assets. In many respects, these assets correspond to the three types of capital identified as being essential to the growth and establishment of the knowledge economy.
Physical Assets: The space and infrastructure required for innovation to take place. This includes what is often described as ‘hard’ infrastructure, including transport facilities, research labs and office space; and ‘soft’ infrastructure, which includes shared areas for networking and the public realm.
Economic Assets: These are firms, institutions and organisations that drive innovation, including incubators, accelerators, colleges and universities, as well as the start‑up firms and entrepreneurs who drive the growth of a district.73
Networking: The relationships and social ties connecting employees and institution districts, at both formal and informal levels.
This report assesses the audits of a selection of London’s universities, clusters and innovation districts using the following indicators:
Table Four: Creating an asset audit of London’s universities, clusters and innovation districts
ASSET TYPE WHAT ARE WE MEASURING SOURCE
Economic Assets Jobs in the Knowledge sector (absolute numbers and percentage of working population)
Interdepartmental Business Register 2014, using defined set of SIC codes. W
Firms in the Knowledge Sector (absolute numbers and percentage of working populations)
Companies House 2015
Incubators, Accelerators and Co-working spaces HEIs: Quality and Quantity
GLA regeneration team database (last updated Nov 2015)
Physical Assets Digital Infrastructure – Broadband capacity
London Connectivity Map (initial data from Ofcom)
Physical Connectivity Public Transport Access Level
Available or planned office space
Data provided by Bilfinger GVA
Permeability (publicly accessible routes)
Ordinance Survey Maps
Networking Assets Places for Networking – a coffee shop and restaurant count
Open Street Map
81
Table Five: Asset audit of a selection of London’s universities, clusters and innovation districts
ECONOMIC ASSETS
PHYSICAL ASSETS
NET-WORKING ASSETS
Jobs in knowledge sector
Firms in knowledge sector
Artists spaces /makers spaces and IACs
Permeability of site - length of publicly accessible routes
Percent of site with excellent public transport
Percent with superfast broadband
Average office rent
Available or planned office space
Cafe / restaurant
Count % Count Count Length M % % £ per Ft2 Ft2 Count
London Cancer Hub, Sutton
846 11 48 0 31,919 0.0 89.7 £15.50 3,651 1
Kingston University Penrhyn Road Campus
2,034 9 166 0 38,198 12.5 82.9 £20 80,512 17
Kingston University Kingston Hill Campus
296 9 21 0 23,334 0.0 71.6 £18 0 0
Imperial College Kensington Campus
5,286 14 238 3 56,312 46.1 52.7 £50 173,583 72
UCL Bloomsbury 25,625 21 2,245 9 57,104 99.4 34.5 £55 3,420,811 164
Southbank University 12,397 22 661 4 56,466 99.3 74.2 £47 2,373,985 73
London Met & Queen Mary / Whitechapel
12,177 15 741 6 60,565 69.7 38.9 £45 9,199,642 97
Queen Mary Mile End Campus
1,752 11 129 3 46,972 32.9 66.5 £20 25,761 19
Birkbeck / UEL Stratford Campus
1,300 7 205 2 60,093 52.2 85.6 £40 3,267,982 24
Imperial College White City Campus
9,431 37 76 0 39,104 9.3 74.1 £40 625,150 3
Goldsmiths College 1,529 13 144 7 39,293 51.5 94.3 £17 87,144 30
Greenwich University 1,697 14 179 2 31,419 0.5 54.3 £18 122,803 9
Brunel University 957 11 24 0 25,173 0.0 80.5 £27 369,656 2
Tech City Croydon 3,338 20 357 3 49,364 76.9 75.1 £25 2,485,962 39
Tech City 24,851 20 2,950 40 59,179 83.8 59.2 £51 11,915,738 96
London Met Holloway Campus
2,622 14 263 4 47,562 50.2 79.8 £35 208,942 40

RECOMMENDATIONS AND CONCLUSION
83
The alignment of two trends – the growth of London’s knowledge economy and the expansion of London’s universities – presents London with a unique opportunity to cement its reputation as a leading hub for higher education, research and innovation. As this report has established, London has the skills base, the financial environment, and much of the physical infrastructure to support and sustain this success. However, increasing pressure for land – and an uneven distribution of employment and economic growth – risks constraining London’s potential as a leading global city for innovation. If London is to continue to attract and retain the talented people on whom its knowledge economy thrives, it must deliver as a city that offers the work/life balance that millennials desire. This means getting the spatial balance of London right, by creating places for innovation, collaboration and wealth creation.
This report has described how London’s economic geography is being reshaped by the continuing transition to a more knowledge‑based economy. We have set out the value of the innovation district model in understanding its impact on the urban form. We have presented an initial audit of the key economic actors, including London’s universities, which are creating an adapted version of the clusters of knowledge‑based activity that can usefully be termed innovation districts. In the light of this analysis, we will present a set of recommendations aimed at national government, the GLA, local authorities, universities and the private sector.
There are of course a number of wider changes to national and local policy that would support the development of innovation districts in London and boost the city’s knowledge economy more generally. Examples of such policies include the need to ensure London has housing that is affordable to knowledge economy employees, and a review of permitted development rights in order to limit the amount of employment space that is converted into residential use. Indeed, a number of the problems faced by innovation districts and their users are by no means unique to them. Their problems are everybody’s problems, and vice versa: housing, transport and access to skills. This report focuses on the specific changes that need to be made to unlock the capacity for innovation districts to provide an answer to some of the challenges facing London’s knowledge economy.
While the innovation district model is based on an understanding of what is going on at a local level, national and regional policy can have both positive and negative effects on the shaping of innovation districts. And while much of the literature on innovation districts emphasises the role that private and civic actors are playing in developing and shaping them – in contrast to the weakening planning and development roles of the public sector – the successful development of innovation districts
84
requires understanding and commitment from both the public and private sectors, as well as from London’s civic sector. The following section of this report outlines recommendations to national, regional and local government, to universities, and to the private sector.
Recommendations to National Government: National government plays an important role in supporting the wider climate of innovation that is vital to the success of London’s districts. Supporting innovation in both the private and public sectors means implementing policies that support the growth of the knowledge economy, through ensuring the development of human, physical and financial capital.
The government should allow universities and innovation districts to sponsor Tier 2 visas. The innovation district should take on an apprentice for each visa sponsored. By allowing innovation districts to sponsor visas, the research and development carried out in districts can be retained within the UK, and commercially developed where appropriate. This is by far preferable to the current situation in which international students benefit from London’s excellence in teaching and research, but are forced to leave the capital on completing their studies.
The government should introduce additional measures to support SMEs to access international talent. While large‑anchor tenants in innovation districts may have the resources and expertise to sponsor visas, many SMEs and start‑ups do not. While UK Visas and Immigration has improved the visa application process, it remains time‑intensive, with the potential sponsor required to ensure no suitably qualified worker can be recruited from the UK or EU.
Rather than focusing efforts on proving that no suitable resident worker is available to fill the role in question, these larger sponsoring bodies should focus resources on generating new talent at a domestic level. In exchange for being granted the authority to work as a sponsoring body, organisations such as MedCity should be required to take on an apprentice in areas such as laboratory technology, IT support and administration.
This arrangement benefits the individual employer by reducing the resources spent on applying for sponsor licences, while ensuring that the broader organisation has access to the best global talent. Matching each sponsorship with an apprenticeship ensures new talent enters the pipeline, providing Londoners with the ability to develop their skills in world‑class research facilities. The existing connection between
85
employers and education institutes at sites such as MedCity provides a clear path for developing skills beyond apprenticeship level.
Placing the authority for sponsorship and the responsibility for apprenticeships between smaller and larger businesses in the hands of the larger hub organisation would mean that London’s knowledge sector can attract the international talent to compete at a global level and also play a role in developing the capital’s domestic talent.
Recommendations to the Greater London Authority The London Plan already cites a range of ways in which employment growth in outer London can be boosted through increasing its attractiveness to business, particularly in new and growing sectors. These include co‑ordinating investment by public agencies, adopting partnership‑based approaches, and the promotion of mixed‑use development. But the London Plan, and its accompanying strategies, should go further in recognising the role of innovation districts, both in democratising innovation and boosting growth in secondary areas.
The London Plan should recognise the role played by innovation districts, especially in secondary areas, and incorporate the innovation district model into the London Plan, ensuring that universities and knowledge economy institutions are included in London’s spatial strategy. This recognises the status of innovation districts both as valuable assets in themselves and as catalysts for economic vitality in the places they are located. Using an asset audit tool, the GLA and local authorities can identify existing and nascent innovation districts. Where suitable, identified areas should be designated as districts, comparable to Housing Zones or Opportunity Areas. This would ensure that the appropriate planning regulations are in place to support the growth of innovation districts, including encouraging the development of infrastructure to boost their potential. Local authorities must take ownership of this asset tool, providing an integrated approach to housing, economic development, skills and employment, and planning.
The Mayor should encourage district-based inward investment strategies as well as sector-focused strategies. London and Partners, the Mayor’s Inward Investment organisation, is currently sector‑focused. Examples of recent sector‑specific initiatives include EdTech UK, a new strategic body aimed at accelerating the growth of London and the UK’s education technology sector, and MedCity, which brings together London’s academic Health Science Centres.74 While such initiatives are valuable branding and advocacy exercises, there is a strong case for inward investment strategies to take a more place‑based approach, with
86
a focus on real estate investment. This is particularly pertinent in light of investors and developers taking a more operational approach to office management, including incubators, accelerators and co‑working spaces.
District‑based investment strategies must go beyond branding exercises, and link the promotion of London’s innovation districts to real estate opportunities, both for developers and institutional investors. Innovation districts also provide an opportunity to leverage the global reputations of London’s universities and their specific specialisms to encourage related investment. As such, innovation districts can play an important role in establishing London as a modern centre for innovation, and attracting the requisite global talent. In addition to a place‑based focus, developing London’s innovation districts and knowledge economy requires co‑ordinating investment by different public agencies to complement that of the private sector. This means setting ambitious development strategies, in which investment in land, skills or infrastructure takes place in the context of long‑term returns.
Where London performs less well is in marketing its existing and forthcoming regeneration projects and innovation districts. As well as promoting investment opportunities in London’s businesses, we should be promoting the places in which many of these innovative businesses are locating themselves. This diversification of London’s asset portfolio not only increases investment options, but can also stimulate long‑term, real‑estate‑based investment that relies on patient capital from investors such as pension funds. In contrast to VC investment in business, there is potential for innovation districts as an asset class to deliver return over a longer time period, rather than operating on the seven‑year cycle that is typical in investment into tech properties. This investment cycle is also significantly longer than that of pure residential investment, meaning that investors in innovation districts have a long‑term interest in maintaining the success of a particular district, rather than operating on a sale‑for‑profit model.
Investment in innovation districts is comparable to the increased appetite for institutional investment in the Private Rented Sector, which can be particularly appealing to investors when supplied at scale. There is a mass market for PRS and it can be appealing to investors when done at scale. East Village, the large PRS development on the Queen Elizabeth Olympic Park, is a joint venture between clients of Delancey and Qatari Diar. While investment in PRS does carry risk of churn or void properties, development at scale and the use of minimum‑length contracts can minimise this risk. A similar approach can be applied to investment in innovation districts, especially those with a diverse tenure mix, since offering tenancies at a range of price points can spread the
87
risk of voids and properties. Moreover, this investment model makes for an engaged investor. The financial success of investment in innovation districts lies in maximum occupancy, but also in creating an ecosystem that is authentic, dynamic and flexible. In shaping this system, rather than simply delivering a mixed‑use development, a well‑designed and well‑managed innovation district becomes more than the sum of its parts.
Recommendations to Local Authorities
Local authorities and the Greater London Authority should understand their local assets. Ongoing audits of economic and physical assets should inform local economic development strategies and related planning policies and discussions. A better understanding of assets not only helps nurture nascent districts – for example by using company registration data to monitor firm start‑ups – but also provides a framework for identifying challenges and opportunities. This auditing of assets requires input from both local authorities and the Greater London Authority, especially given the tendency for districts to straddle local authority boundaries.75
While a number of audits of physical assets are taking place at a regional level, such as the BIS Innovation and Science audit, it is important that the findings of these audits are considered at a local authority level.76 Doing so would improve the alignment of economic development strategies and planning approaches at a Mayoral and local authority level. This alignment of skills, development and planning strategies should be bolstered by better engagement between universities and local authorities.
Developing local skills in the long-term: When negotiating S106 agreements, local authorities should place end‑use training on a par with construction skills training. A focus on end‑use training, for example, in the development of lab technicians and support staff, encourages the development of a pipeline of skills, and offers the opportunity for local people to develop careers in the knowledge economy.
Recommendations to Universities and the knowledge economy sector
Carving out a civic role: This report has highlighted the significant but almost invisible role that London’s universities have played in the city’s urban development. Yet the extent of HEI expansion across London, and the capacity of universities to be anchor tenants of innovation districts, provides universities with an opportunity to both
88
develop this civic role and articulate it accordingly. This would be helped by the identification of individuals and teams at institutions responsible for developing the civic role, and an estates strategy that reflects these priorities. London’s universities may be globally renowned, but they are of, and not apart from London. The better this is understood, the stronger London’s reputation as a centre for innovation will be.
The example of the Knowledge Quarter and the engagement of its university members shows that universities do not necessarily need large‑scale real estate projects to develop their civic role in an existing location. This report recommends that the Higher Education Funding Council for England strengthens the role of place‑based impact in their assessment frameworks, assessing the physical, economic and social contribution made by the institution. This would be further boosted by other rankings reappraising the weighting of university‑business collaboration.
Recommendations to the Private Sector While the potential to develop innovation districts is strongly linked to the planning controls held by the Mayor and local authorities, this report recommends that the innovation district model should play an important role in site masterplanning, pricing, and design. This emphasis on the quality of place not only benefits institutions and universities at the heart of innovation districts, but can also increase the value of other land uses including residential and retail uses.
Many of the examples of existing innovation districts show the benefits of new governance systems and models of asset management. This model of asset management gives developers the potential to curate and grow their own client base, offering spaces at a range of price points, and shaping an innovation ecosystem that takes a collection of buildings and occupiers and makes it more than the sum of its parts.
We recognise that not all developers will have the patient capital, expertise and appetite to develop sites that are radically mixed‑use. This does not mean, however, that developers and architects of smaller‑scale, residential‑focused schemes cannot benefit from the innovation districts model, in providing flexible floor plates, public realm that supports an innovation ecosystem, and a design that encourages businesses and institutions to showcase rather than conceal their activity.
The task of maintaining London’s reputation as a global knowledge economy hub cannot and should not fall to the public sector alone. Indeed, many of the world’s most successful innovation districts are those who have harnessed the ambition of government, business

89
and civic society to define and deliver districts that can supercharge economies and promote inclusive growth. The developers, architects, and leaders of London’s innovation districts can make a clear contribution by forging links between London’s innovation districts and those in US and European cities, such as 22@Barcelona and Strijp S at Eindhoven, sharing best practice in terms of investment, design and management.
In describing the changing geography of London’s knowledge economy, this report hopes to give policymakers a framework through which to understand the development of universities, clusters and innovation districts in London. An up‑to‑date and honest appraisal of assets – economic, physical and social – is essential in doing this.
However, the success of the innovation district model is the power of relationships between individuals, firms, and institutions, to create a place that is greater than the sum of its parts. Writ large, London’s future success as a leading global city for innovation rests both on an understanding of its potential, and the willingness and ability of individuals and institutions to champion the city’s existing and nascent innovation districts. I hope that this report can play a leading role in achieving both of these aims.


91
NOTES AND REFERENCES
1. Katz, B., & Wagner, J. (2014). The rise of innovation districts: A new geography of innovation in America. Brookings Institution–Metropolitan Policy Program.
2. Liu, A. (2016) Remaking Economic Development. Brookings Institution – Metropolitan Policy Program3. London Higher Factsheet (2014). London Higher. Retrieved March 28, 2016, from http://www.
londonhigher.ac.uk/fileadmin/documents/Publications_2014/LHigher_HESAStudents_2014.pdf4. London First and London Enterprise Partnership (2015) London 2036: An agenda for jobs and growth
Retrieved from http://londonfirst.co.uk/wp-content/uploads/2015/01/London-First-Report_FINAL_e-version.pdf
5. HM Treasury. (2015). Fixing the foundations: Creating a more prosperous nation. London: HM Treasury. Retrieved March 28, 2016, from https://www.gov.uk/government/uploads/system/uploads/attachment_data/file/443898/Productivity_Plan_web.pdf
6. Speaking after the 2016 World Economic Forum at Davos, which hailed the “Fourth Industrial Revolution”, Business Secretary Sajid David set out the groundwork for an Innovation Plan, aimed at driving high-skilled jobs and increasing productivity.
7. HM Treasury, & The Rt Hon George Osborne. (2015, February 20). Chancellor: Our long term economic plan for London. Retrieved March 28, 2016, from https://www.gov.uk/government/speeches/chancellor-our-long-term-economic-plan-for-london
8. London First and London Enterprise Partnership (2015) London 2036: An agenda for jobs and growth. Retrieved from http://londonfirst.co.uk/wp-content/uploads/2015/01/London-First-Report_FINAL_e-version.pdf
9. URS, Gort Scott, Ramidus Consulting, #1 Seed. (2014). Supporting Places of Work: Incubators, Accelerators and Co-working Spaces. The London Enterprise Panel. Retrieved March 28, 2016, from https://www.london.gov.uk/sites/default/files/supporting_places_of_work_-_iacs.pdf
10. Data kindly provided by GLA regeneration unit – last updated November 2015.11. Mayor of London. (2015). The London Plan: The spatial development strategy for London. Consolidated
with alterations since 2011. Greater London Authority. Retrieved March 28, 2016, from https://www.london.gov.uk/sites/default/files/gla_migrate_files_destination/London%20Plan%20March%202015%20%28FALP%29.pdf
12. ibid13. Cited in Mayor’s Design Advisory Group (2016): Growing London Retrieved March 28, 2016, from
http://newlondonarchitecture.org/docs/mdag_agenda_growing_london.pdf14. London Councils (2015) The Impact of Permitted Development Rights for Office to Residential
Conversions: A London Councils Briefing. London Councils15. Liu, A. (2016) Remaking Economic Development. Brookings Institution – Metropolitan Policy Program16. The term is often used interchangeably with ‘Innovation Economy’ – for example by Moretti in The
New Geography of Jobs (2012).17. Leadbeater C. (1999) New measures for the New Economy. Retrieved March 28, 2016, from http://
www.oecd.org/sti/ind/1947910.pdf18. The theory around industry-specific agglomeration was later formalised by Edward Glaeser in the
Marshall-Arrow-Romer model (Glaeser, E. L., Kallal, H. D., Scheinkman, J. A., & Shleifer, A. (1991). Growth in cities. No. w3787. National Bureau of Economic Research.)
19. Jacobs, J. (1970). The economy of cities. New York: Random House.20. Saxenian, A. (1996). Regional advantage. Harvard University Press. 21. Myint, Y. M., Vyakarnam, S., & New, M. J. (2005). The effect of social capital in new venture creation:
the Cambridge high technology cluster. Strategic Change, 14(3), 165-177.22. Stuart, T., & Sorenson, O. (2003). The geography of opportunity: spatial heterogeneity in founding
rates and the performance of biotechnology firms. Research Policy, 32(2), 229-253.23. Mazzacuto, M. (2013) The Entrepreneurial State. Anthem.24. For more on networked manufacturing, see Economist Intelligence Unit. (2014). Networked
Manufacturing: The Digital Future. Economist Intelligence Unit.25. ONS. (2015). Statistical Bulletin UK Non-Financial Business Economy, 2013 Regional Results (Annual
Business Survey).26. GLA Economics. (2016). Draft Economic Evidence Base 2016. Greater London Authority. Retrieved
March 28, 2016, from https://www.london.gov.uk/sites/default/files/draft-eeb-2016.pdf

92
27. Reproduced with thanks to McKinsey & Company28. Patent registration data kindly provided by Centre for Cities.29. 2014 Nomis Annual Population Survey (2014). London is the third most-qualified city in England,
below Cambridge (61.3%) and Oxford (60.2%). NVQ Level 4 is equivalent to a university degree.30. Abramovsky, L., & Simpson, H. (2011). Geographic proximity and firm–university innovation linkages:
evidence from Great Britain. Journal of Economic Geography, 11(6), 949-977.31. Imperial College London, University College London, London School of Economics, Kings College
London and Queen Mary University London. Bibliography: World university rankings. (2016, February 9). Retrieved March 28, 2016, from https://www.timeshighereducation.com/world-university-rankings/2016/world-ranking#!/page/4/length/25 In-line Citation: (“World university rankings,” 2016)
32. Chris Parr. (2016). The 100 most international universities in the world 2015. Times Higher Education. Retrieved March 28, 2016, from https://www.timeshighereducation.com/news/the-100-most-international-universities-in-the-world-2015/2018125.article
33. Greater London Authority (2013) London Vision 2020. Retrieved March 28, 2016, from https://www.london.gov.uk/file/16207/download?token=FrawHvNb. While London is home to four top universities, this share rises to six if Oxford and Cambridge are included. While this may appear to push the geographic definition of London, it is worth considering that the London-Oxford-Cambridge triangle as roughly the same size as Silicon Valley. The capacity for greater co-ordination between London and Oxbridge will be considered later in this report.
34. For more on the role of higher education in London’s soft power, see Centre for London (2015) London Essays: Soft Power Data. At http://essays.centreforlondon.org/issues/soft-power/soft-power-data/
35. For a summary of issues around skills in the tech sector, see Centre for London, Tech London Advocates, techUk (2015) London’s Digital Future. For more on skills shortages in the Life Sciences sector, see 2016, H. plc. (2016). Action needed on life sciences skill shortages. Retrieved March 28, 2016, from http://www.hays.co.uk/press-releases/action-needed-on-life-sciences-skill-shortages-1152471
36. This competition has been aggravated by the introduction of Permitted Development Rights by central government, which allows offices to be converted into residential properties without the need for planning permission. At least 1,076,400 ft of wholly occupied office floor space between May 2013 and April 2015 was to be converted into residential. London Councils (2015) The Impact of Permitted Development Rights for Office to Residential Conversions: A London Councils Briefing.
37. Just under half of West End occupiers (48%) migrated to one of the City & East London submarkets between 2014-2015. Movers & shakers - autumn 2015 - Cushman & Wakefield. Retrieved March 28, 2016, from http://www.cushmanwakefield.co.uk/en-gb/research-and-insight/2015/movers_shakers-autumn-2015/
38. Prime headline rent figures kindly provided by Bilfinger GVA.39. BNP Paribas (2015) Media Tech London Survey.Retrieved March 28, 2016, from http://www.
realestateforachangingworld.co.uk/wp-content/uploads/2015/03/BNP-PPRE-Media-Tech-Report-Feb-15.pdf
40. Over half of global executives surveyed named London as the most attractive investment destination in Europe. Cited in Centre for London, Tech London Advocates, techUk (2015) London’s Digital Future.
41. London Higher Factsheet (2015). London Higher. Retrieved March 28, 2016, from http://www.londonhigher.ac.uk/fileadmin/documents/Publications_2015/LdnHigher_HEFCEGrants2015.pdf
42. ONS. (2015). Gross Domestic Expenditure on Research and Development, 2013 Release. Release edition reference tables. Retrieved March 28, 2016, from http://webarchive.nationalarchives.gov.uk/20160105160709/http://www.ons.gov.uk/ons/publications/re-reference-tables.html?edition=tcm%3A77-353643
43. Gibson, J. and Robinson, M (2015). City Initiatives for Technology, Innovation and Entrepreneurship. Nesta, Accenture and Future Cities Catapult.
44. Deloitte. (2016). Global Cities, Global Talent: London’s rising soft power45. Allas, T. (2014). Insights from international benchmarking of the UK science and innovation
system. Department for Business Innovation & Skills (BIS) Analysis Paper, 3, 19.46. Katz and Wagner’s report also include the “reimagined science park” – districts in suburban or
exurban areas which have been densified and redesigned to include more urban-style mixed use.47. Chesborough updated his preferred definition in 2007, defining Open Innovation thus: “Open
innovation is the use of purposive inflows and outflows of knowledge to accelerate internal innovation,

93
and expand the markets for external use of innovation, respectively. [This paradigm] assumes that firms can and should use external ideas as well as internal ideas, and internal and external paths to market, as they look to advance their technology.” Open innovation: Open innovation community. (2007, August ). Retrieved March 28, 2016, from http://openinnovation.net/about-2/open-innovation-definition/
48. PriceWaterhouseCoopers. (2011). Millennials at Work: Reshaping the Workspace. Millennials are generally defined as those born between 1980 and 2000.
49. A British Land Survey showed that 98% of London millenials rate communal areas as important. For more on attitudes towards office space. Retrieved March 28, 2016, from http://officeagenda.britishland.com/article/what-office-workers-really-want
50. Bredenberg, A. (2012, August 11). New master plan for north Carolina’s research triangle park will stress sustainable development. Retrieved March 28, 2016, from http://inhabitat.com/new-master-plan-for-north-carolinas-research-triangle-park-will-stress-sustainable-development/
51. For more on the role of culture and national innovation performance, see Ezell, S. and Marxgut, P., (2015). Comparing American and European Innovation Cultures. Retrieved March 28, 2016, from http://www2.itif.org/2015-comparing-american-european-innovation-cultures.pdf
52. Mazzacuto, M. (2013). The Entrepreneurial State. Anthem.53. Moretti gives the example of the Bay Area’s sustained success, rooted in an ever-evolving talent
pool which can adapt to new technologies, as opposed to an economic growth strategy rooted in a narrow range of technologies or products. For more see Moretti, E. (2012). The new geography of jobs. Houghton Mifflin Harcourt.
54. For a detailed analysis of the advanced manufacturing economy in Sheffield and Rotherham, see L, McGough. (2015). Making It. Centre for Cities.
55. Here East is approximately a 20-minute walk from Stratford station. To improve connectivity, Here East have invested in their own shuttle bus service running from the station the site, free of charge to occupiers and visitors.
56. Moretti, E. (2012). The new geography of jobs. Houghton Mifflin Harcourt.57. See, for example, the development of London City Island, a 12-acre site, which secured the English
National Ballet as an anchor tenant. The residential developers, Eco World Ballymore, who are developing the entire City Island site, will provide the shell and core of the ENB building.
58. Witty, A. (2013). Encouraging a British Invention Revolution: Sir Andrew Witty’s Review of Universities and Growth. Retrieved March 30, 2016, from https://www.gov.uk/government/uploads/system/uploads/attachment_data/file/249720/bis-13-1241-encouraging-a-british-invention-revolution-andrew-witty-review-R1.pdf
59. Dowling, A. (2015). The Dowling Review of Business-University Research Collaborations. London: Royal Academy of Engineering.
60. ibid61. As far back as 2006, Cornell University sold $250m worth of bonds. See The Economist. (2006). An
education in finance. The Economist. Retrieved March 30, 2016, from http://www.economist.com/node/6958688
62. Griffith, G. (2015). Higher education estates statistics report 2015. CBRE. Retrieved March 28, 2016, from http://www.aude.ac.uk/documents/higher-education-estates-statistics-report-2015/
63. Frontier Economics Ltd. (2015). A review of HEFCE capital expenditure - higher education funding council for England. HEFCE. Retrieved March 28, 2016, from http://www.hefce.ac.uk/pubs/rereports/Year/2015/capitalreview/Title,104462,en.html
64. UK Research Partnership Investment Fund65. GLA Economics (2016) Draft Economic Evidence Base 2016. Retrieved March 28, 2016, from https://
www.london.gov.uk/sites/default/files/draft-eeb-2016.pdf66. ibid67. ONS. (2016). Annual Population Survey (APS) updated on 20 January 2016 with figures for Oct 2014 –
Sept 2015. Office of National Statistics.68. In just five years, Hackney, Tower Hamlets, Newham and Haringey left the top of the ranking for the
proportion of neighbourhoods in the most deprived 10% nationally.69. This explanation is strengthened by the increase in professional households in these boroughs. In
absolute terms, the number of people employed in skilled occupations doubled in Hackney and Tower Hamlets between 2004 and 2014. For more information, see Bosetti, N. & Hanna, K. (2015). Inside Out: The New Geography of Wealth and Poverty in London. Centre for London.

94
70. For more on planning for the growth of tech and advanced manufacturing sectors, see RTPI (2016). Planning and Tech. Retrieved March 28, 2016, from http://www.rtpi.org.uk/media/1697226/Planning%20and%20tech%20final%20-%2016.2.15.pd
71. Katz, B., & Wagner, J. (2014). The rise of innovation districts: A new geography of innovation in America. Brookings Institution–Metropolitan Policy Program.
72. The size of this site means that London College of Communications at Elephant and Castle is also included.
73. Katz and Wagner also include in this category neighbourhood assets, such as bars, coffee shops and cultural spaces. For the purposes of our asset typology, these neighbourhood assets are considered as networking assets, rather than economic assets.
74. For more on Edtech UK see www.edtechuk.com. 75. It should be noted that the London Enterprise Panel is also well-positioned to support this audit work,
especially given the presence of working groups focused on economic growth and digital, creative, science and technology.
76. A comparison could be made here with the process in which Strategic Housing and Land Assessments and Strategic Housing Market Assessments are made by local authorities in concert with the Greater London Authority.


London’s urban fabric has long been shaped by the city’s economic development. As we enter the age of the Knowledge Economy, we can expect to see London’s spatial form change once more. Companies and institutions are revaluing proximity, authenticity and flexibility – and increasingly want places of dense urban space, a mixed urban fabric and buildings that can evolve. Where employment space is at a premium, and where universities and innovation clusters are located in some of London’s most deprived boroughs, innovation districts have the potential to provide space for London’s knowledge economy, while promoting inclusive economic growth.
With a foreword by Bruce Katz and Julie Wagner of the Brookings Institution, Spaces to Think examines how London’s existing universities, clusters and innovation districts are evolving and sets out recommendations on how they can be encouraged to grow.
This publication has been generously supported by Bilfinger GVA, Delancey, Future Cities Catapult, Here East, the Knowledge Quarter and the London Boroughs of Camden, Croydon, Islington and Sutton, with in-kind support provided by Hawkins\Brown.
ISBN 978-0-9932416-6-6 © Centre for London, 2016