Embed Size (px)
Citation preview
SPARoutputsandreportpage
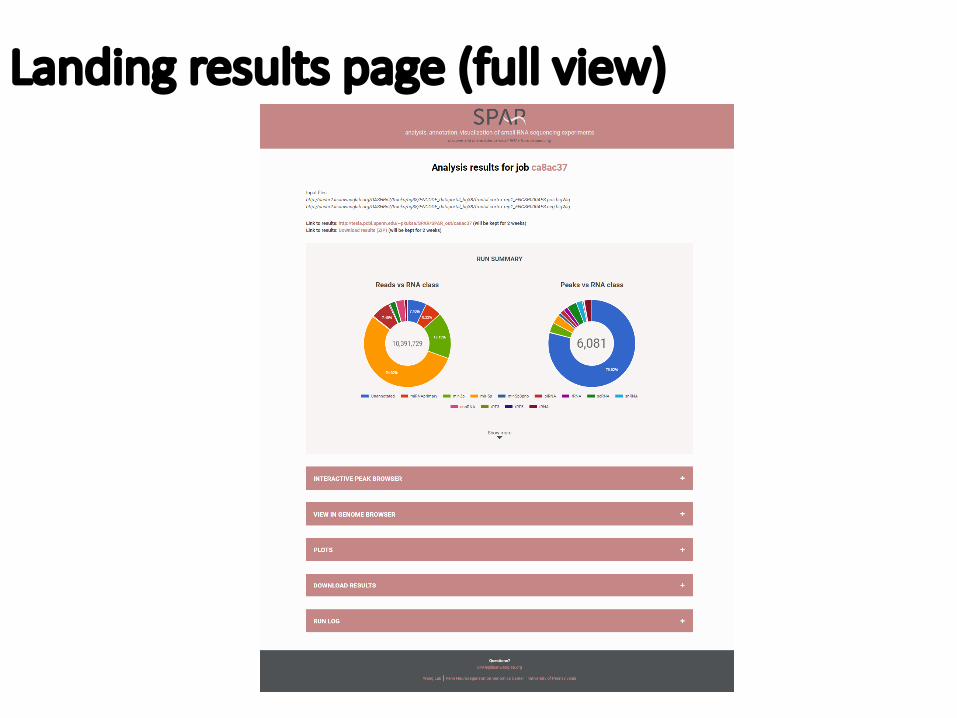
Landingresultspage(fullview)
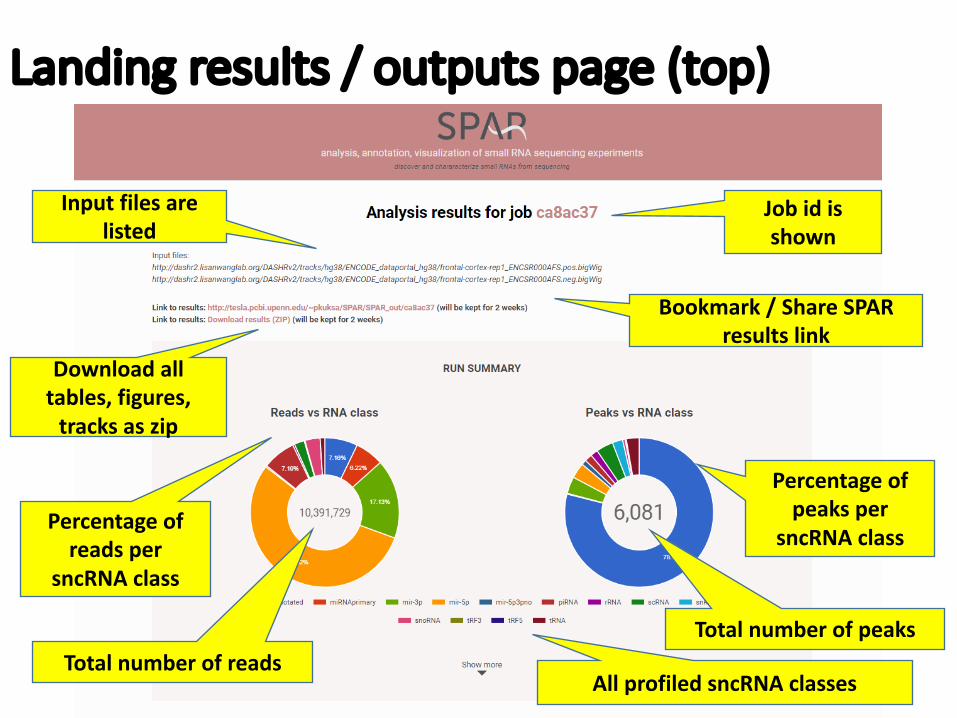
Landingresults/outputspage(top)
Jobidisshown
Inputfilesarelisted
Bookmark/ShareSPARresultslink
Downloadalltables,figures,tracksaszip
Percentageofreadsper
sncRNA class
TotalnumberofreadsAllprofiledsncRNA classes
Percentageofpeaksper
sncRNA class
Totalnumberofpeaks
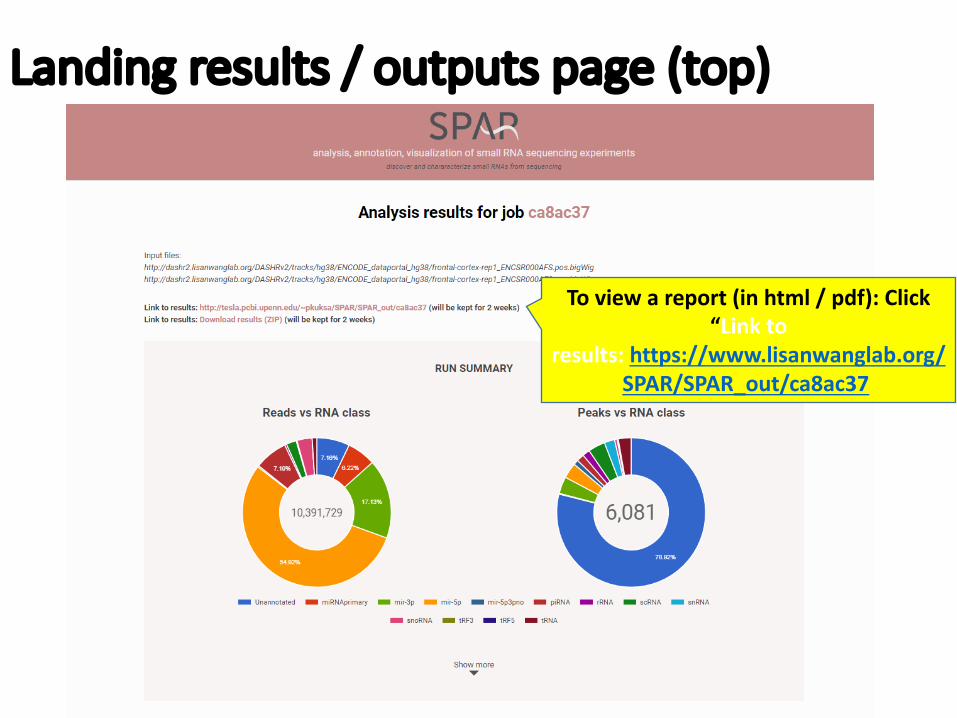
Landingresults/outputspage(top)
Toviewareport(inhtml/pdf):Click“Linkto
results: https://www.lisanwanglab.org/SPAR/SPAR_out/ca8ac37
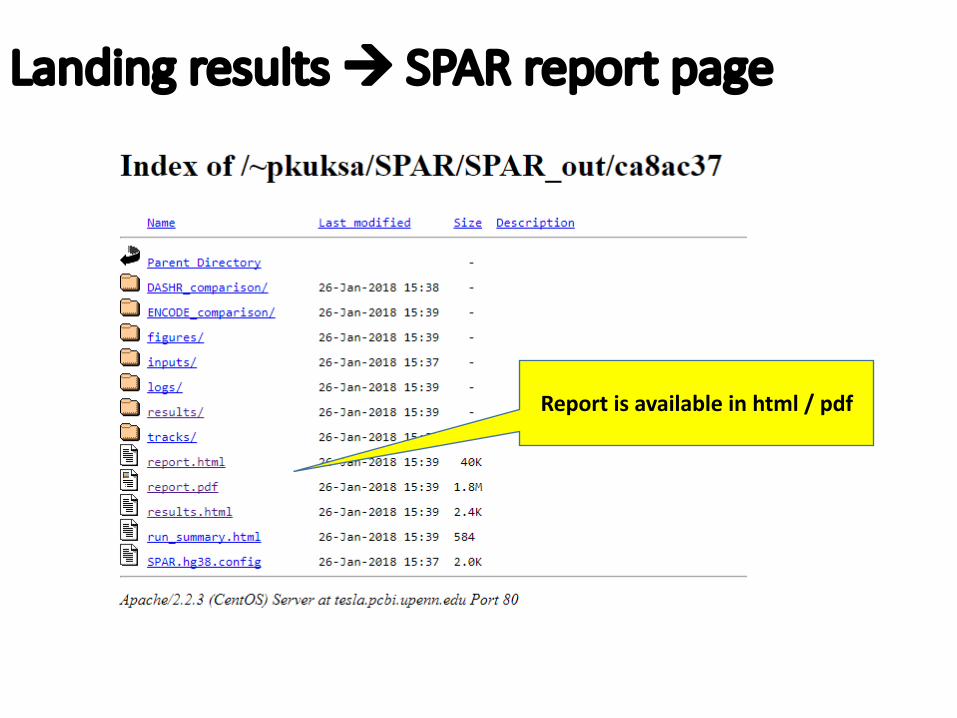
Landingresultsà SPARreportpage
Reportisavailableinhtml/pdf
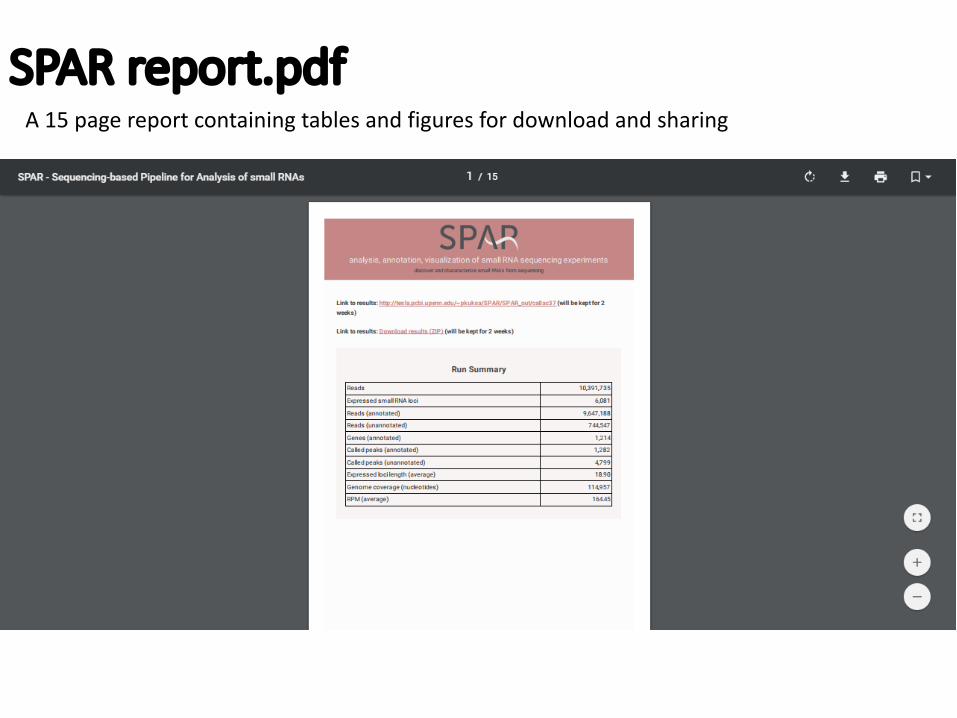
SPARreport.pdfA15pagereportcontainingtablesandfiguresfordownloadandsharing
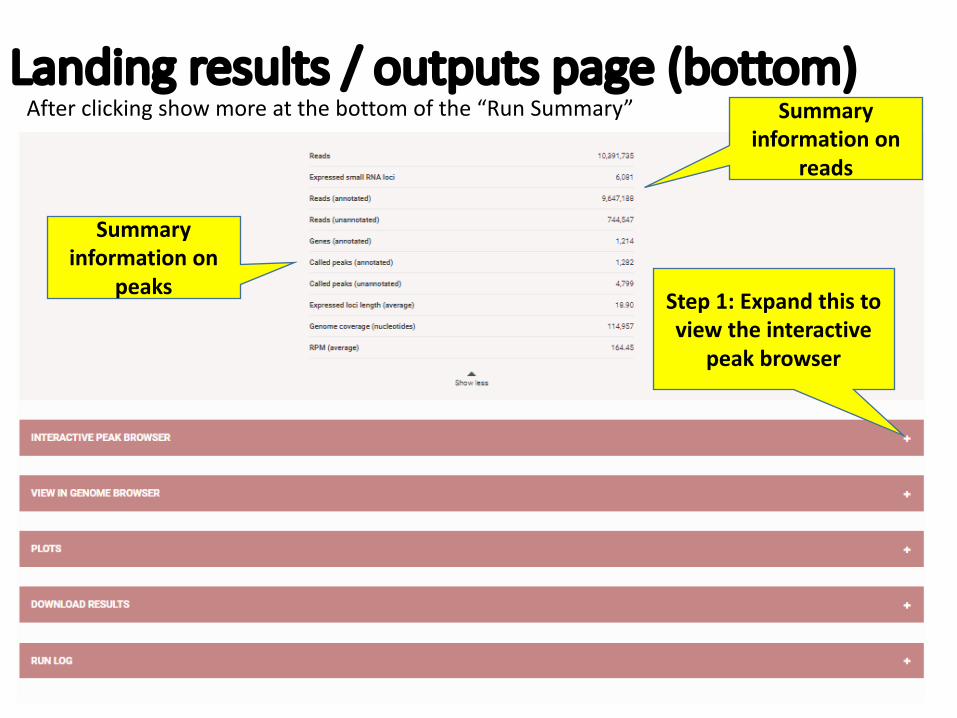
Landingresults/ outputspage(bottom)Summary
informationonreads
Afterclickingshowmoreatthebottomofthe“RunSummary”
Summaryinformationon
peaks Step1:Expandthistoviewtheinteractive
peakbrowser
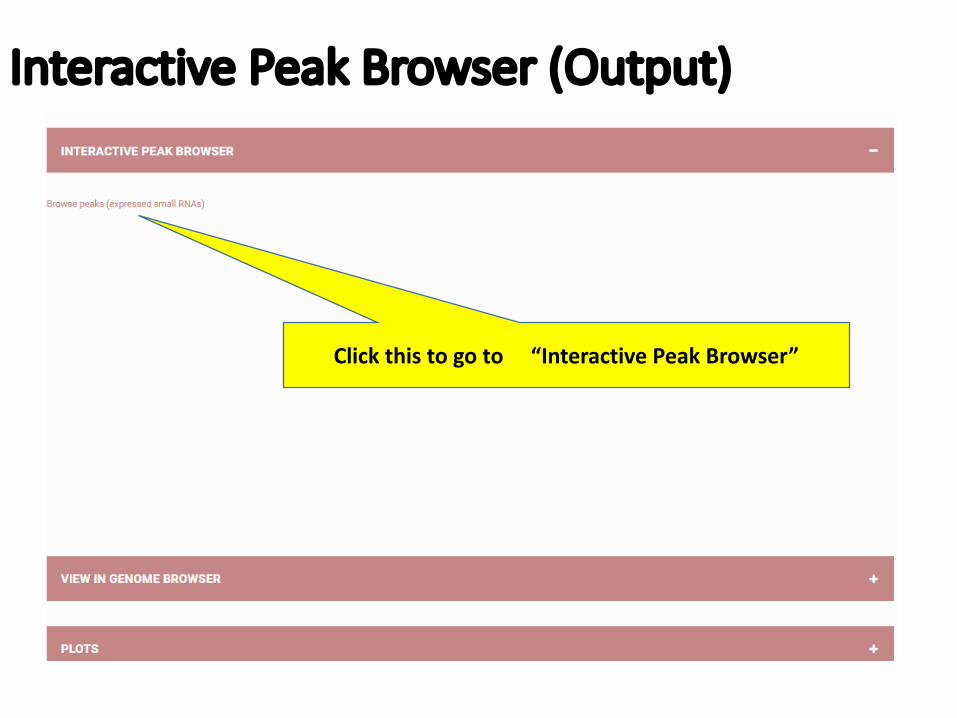
InteractivePeakBrowser(Output)
Clickthistogoto“InteractivePeakBrowser”
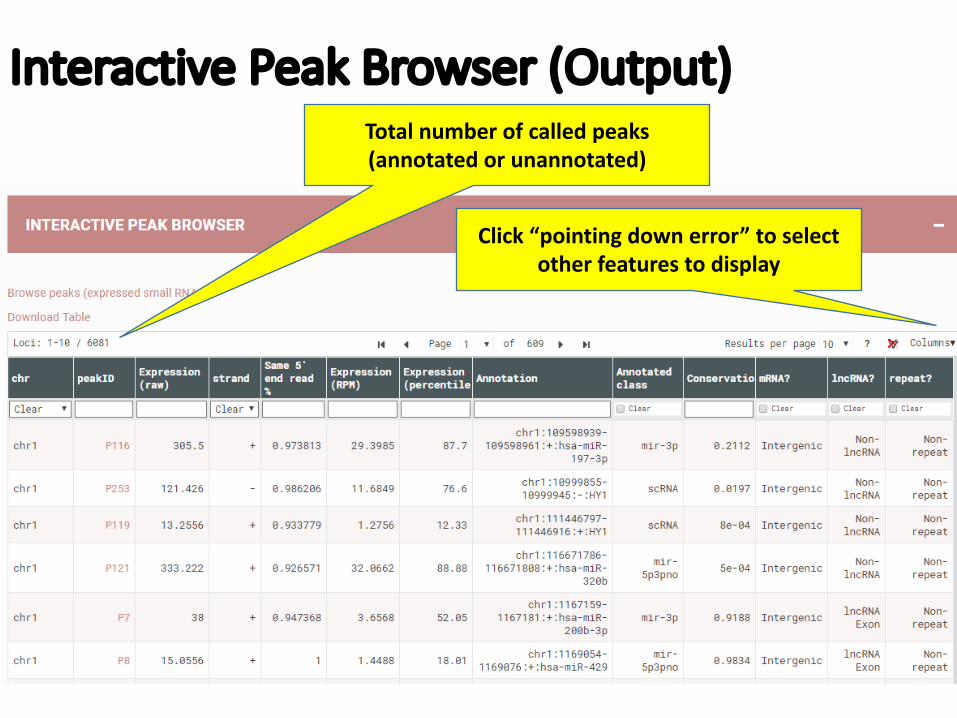
InteractivePeakBrowser(Output)Totalnumberofcalledpeaks(annotatedorunannotated)
Click“pointingdownerror”toselectotherfeaturestodisplay
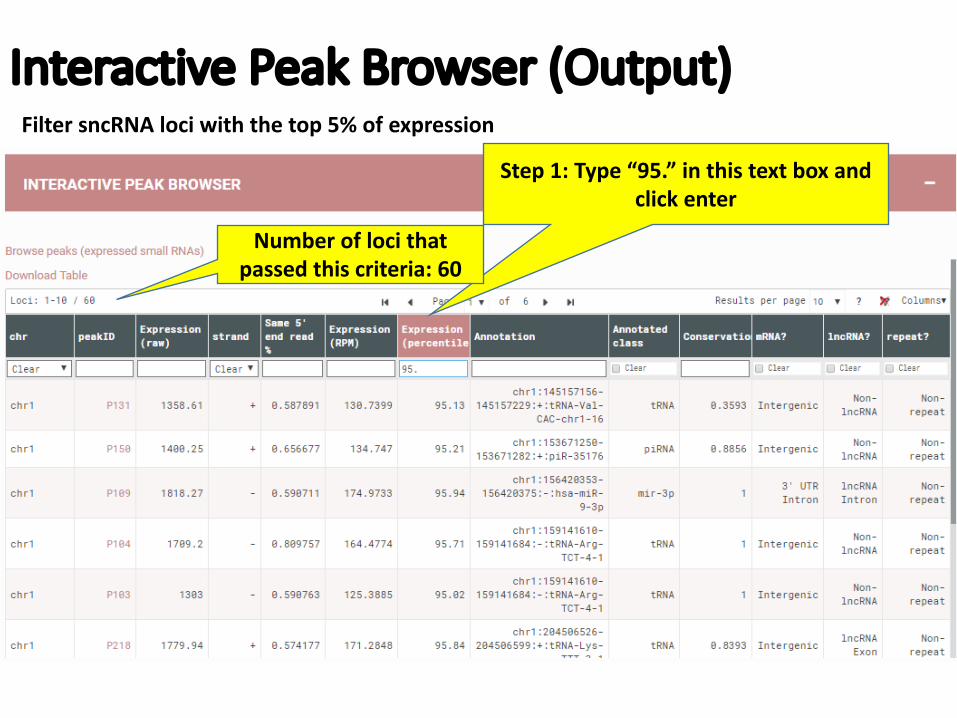
InteractivePeakBrowser(Output)
Step1:Type“95.”inthistextboxandclickenter
FiltersncRNA lociwiththetop5%ofexpression
Numberoflocithatpassedthiscriteria:60
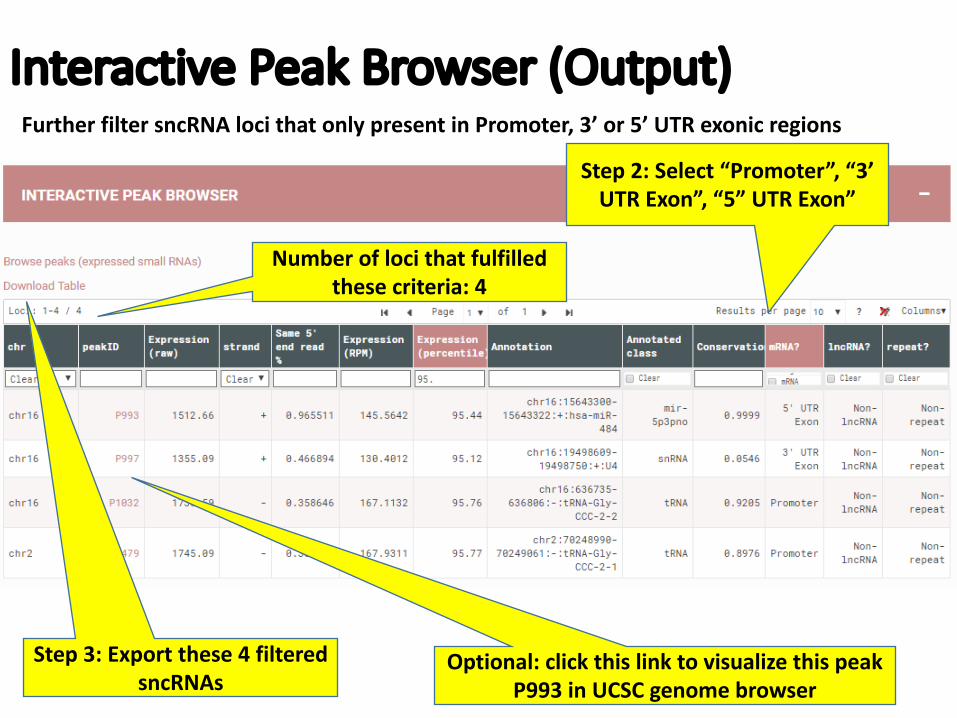
InteractivePeakBrowser(Output)FurtherfiltersncRNA locithatonlypresentinPromoter,3’or5’UTRexonic regions
Step2:Select“Promoter”,“3’UTRExon”,“5”UTRExon”
Numberoflocithatfulfilledthesecriteria:4
Step3:Exportthese4filteredsncRNAs
Optional:clickthislinktovisualizethispeakP993inUCSCgenomebrowser
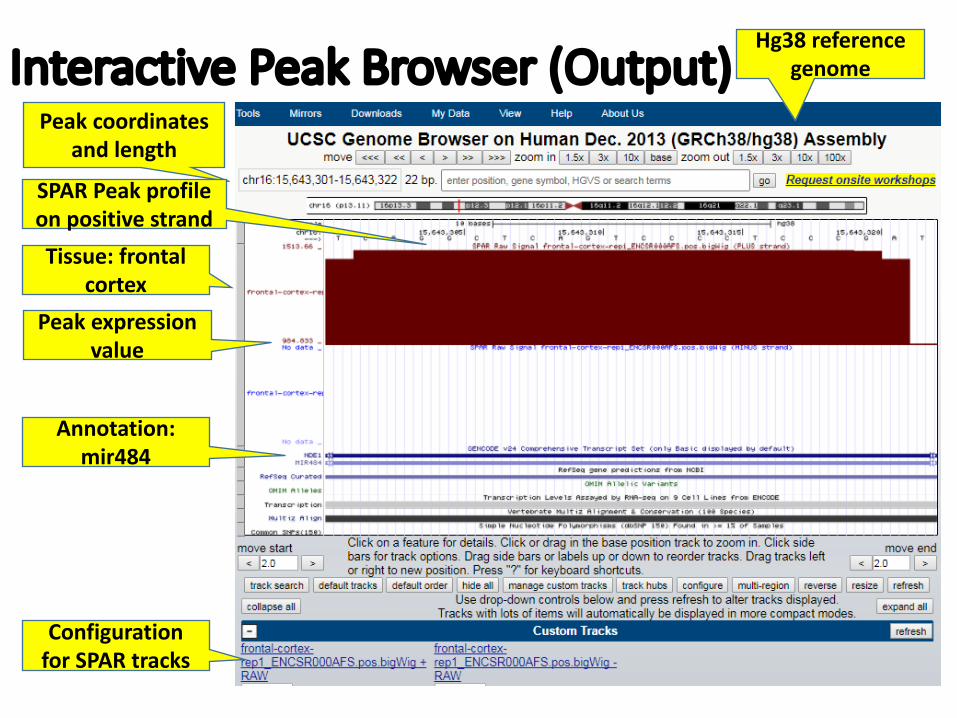
InteractivePeakBrowser(Output)Hg38reference
genome
Peakcoordinatesandlength
SPARPeakprofileonpositivestrandTissue:frontal
cortexPeakexpression
value
Annotation:mir484
ConfigurationforSPARtracks
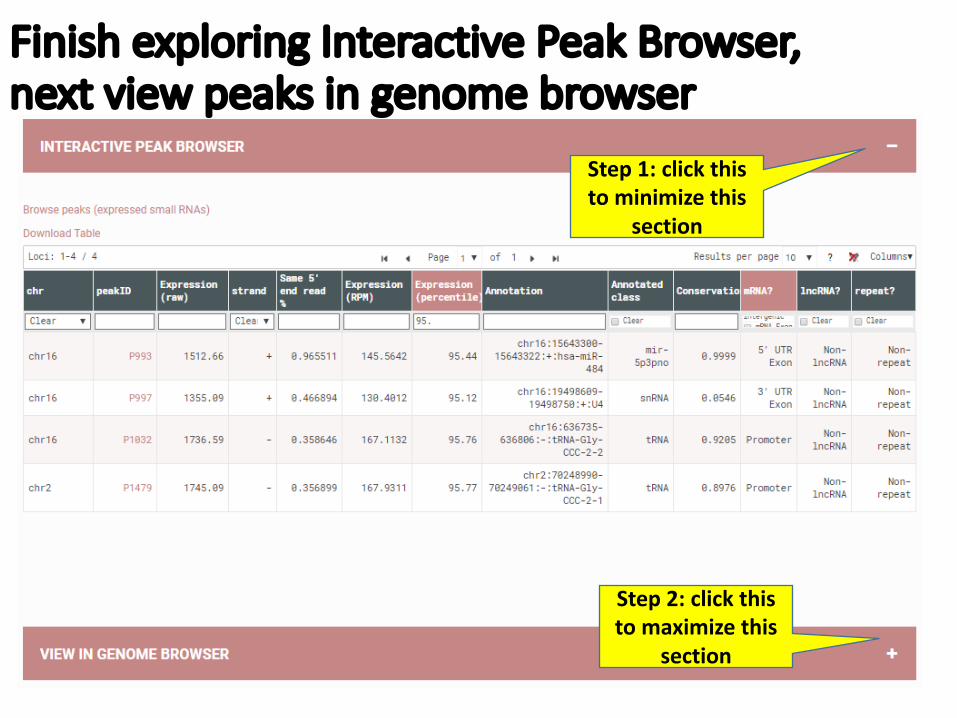
FinishexploringInteractivePeakBrowser,nextviewpeaksingenomebrowser
Step1:clickthistominimizethis
section
Step2:clickthistomaximizethis
section
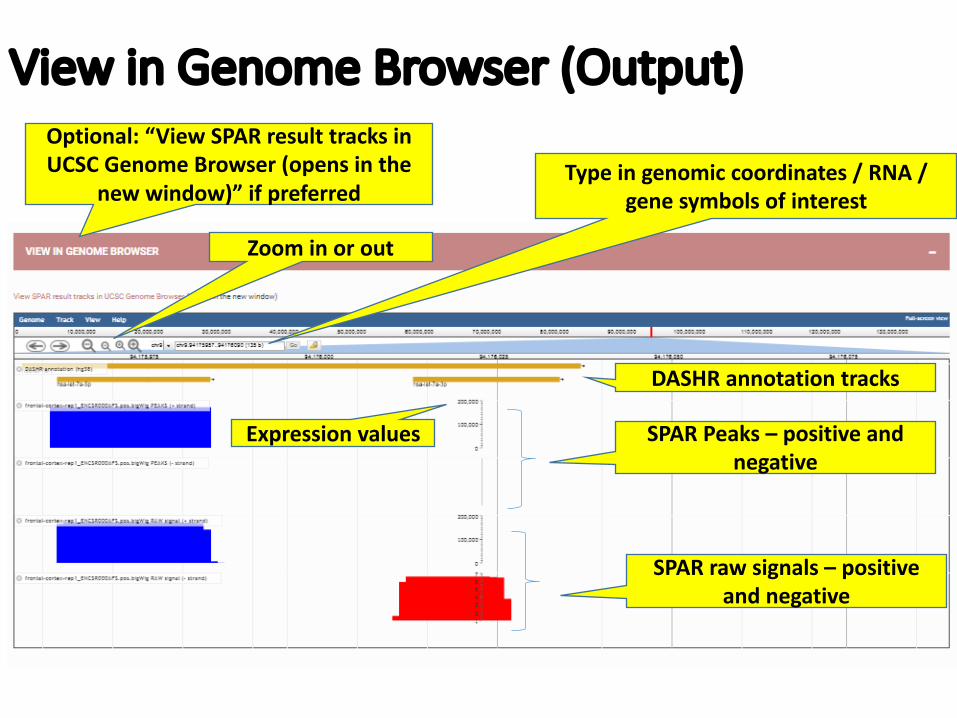
ViewinGenomeBrowser(Output)Optional:“ViewSPARresulttracksinUCSCGenomeBrowser(opensinthe
newwindow)”ifpreferred
DASHRannotationtracks
Typeingenomiccoordinates/RNA/genesymbolsofinterest
Zoominorout
SPARPeaks– positiveandnegative
SPARrawsignals– positiveandnegative
Expressionvalues

FinishexploringGenomebrowser,quicklyunderstandthedatainagenomewide view
Step1:clickthistominimizethis
section
Step2:clickthistomaximizethis
section
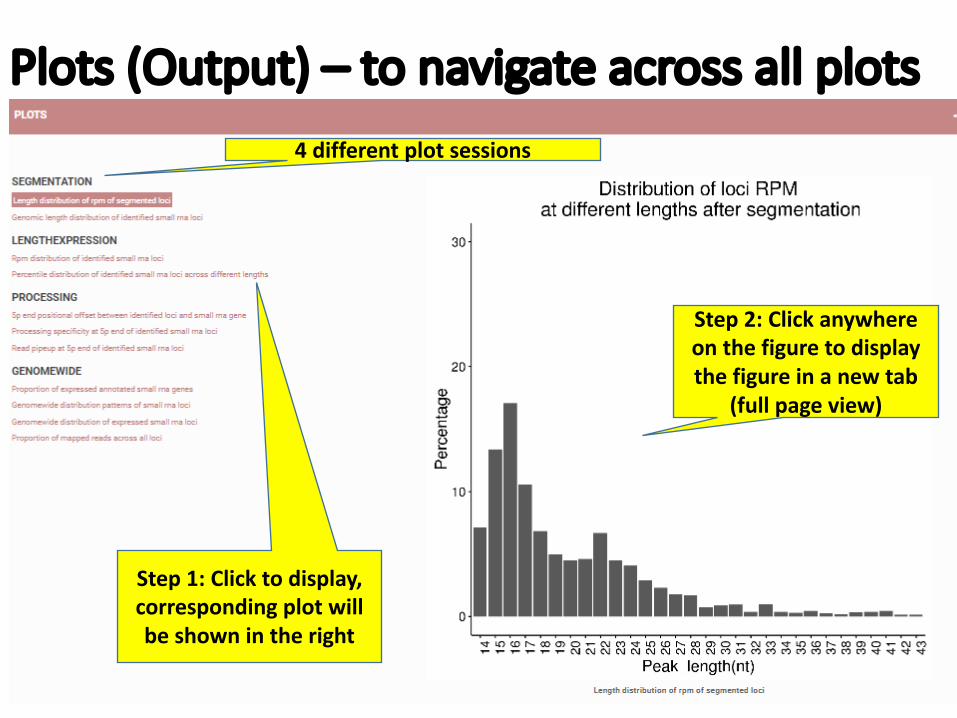
Plots(Output)– tonavigateacrossallplots4differentplotsessions
Step1:Clicktodisplay,correspondingplotwillbeshownintheright
Step2:Clickanywhereonthefiguretodisplaythefigureinanewtab
(fullpageview)
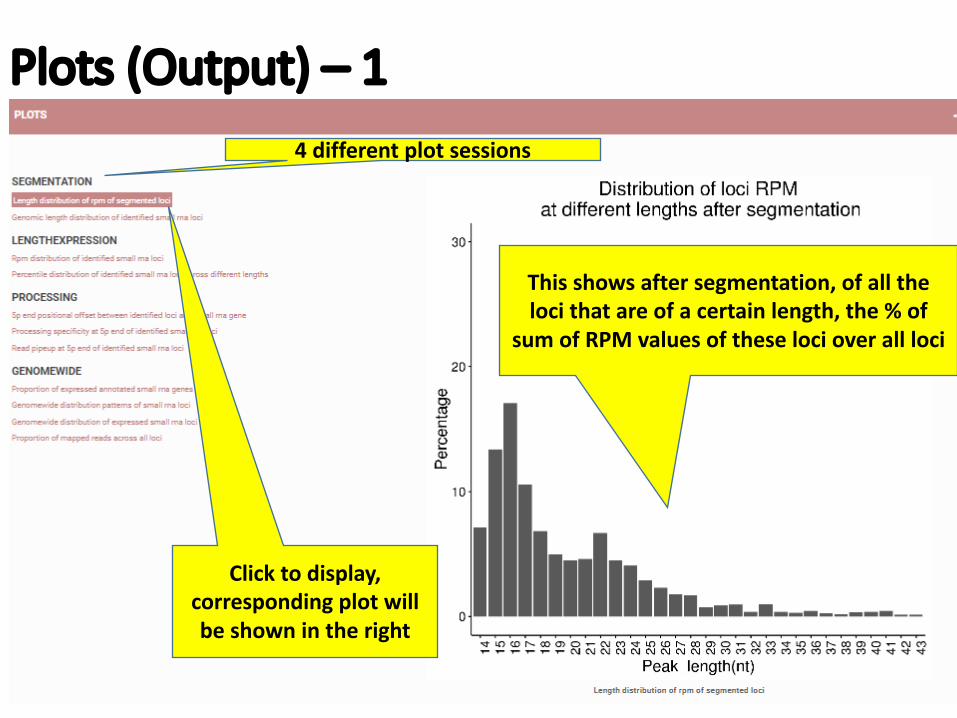
Plots(Output)– 14differentplotsessions
Clicktodisplay,correspondingplotwillbeshownintheright
Thisshowsaftersegmentation,ofallthelocithatareofacertainlength,the%of
sumofRPMvaluesoftheselocioverallloci
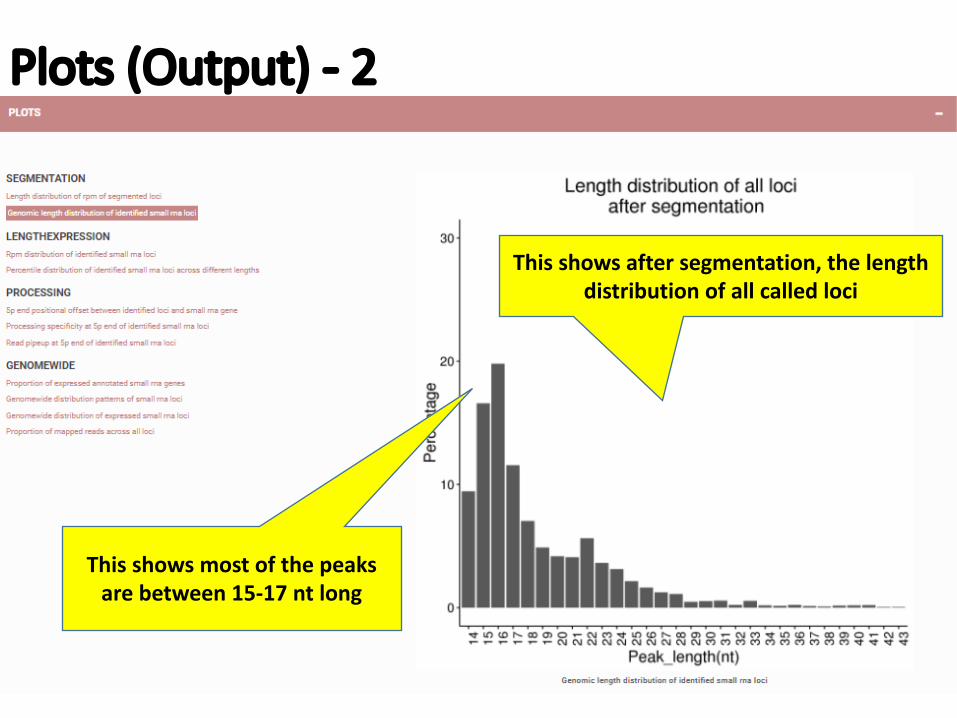
Plots(Output)- 2
Thisshowsaftersegmentation,thelengthdistributionofallcalledloci
Thisshowsmostofthepeaksarebetween15-17nt long
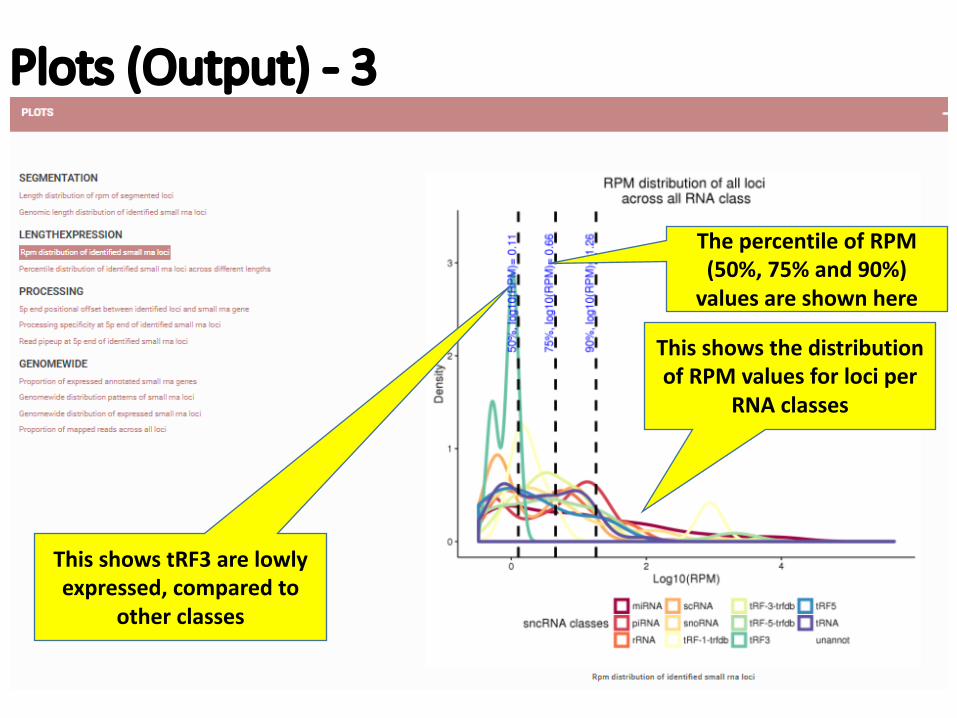
Plots(Output)- 3
ThisshowsthedistributionofRPMvaluesforlociper
RNAclasses
ThepercentileofRPM(50%,75%and90%)valuesareshownhere
ThisshowstRF3arelowlyexpressed,comparedto
otherclasses
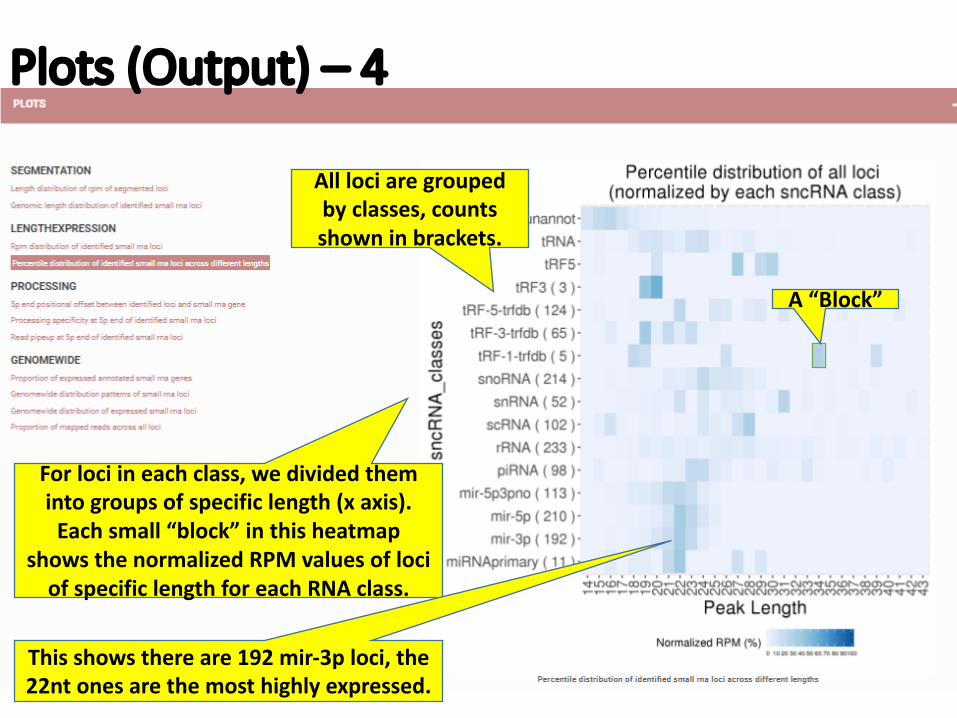
Plots(Output)– 4
Alllociaregroupedbyclasses,countsshowninbrackets.
Forlociineachclass,wedividedthemintogroupsofspecificlength(xaxis).Eachsmall“block”inthisheatmap
showsthenormalizedRPMvaluesoflociofspecificlengthforeachRNAclass.
A“Block”
Thisshowsthereare192mir-3ploci,the22ntonesarethemosthighlyexpressed.
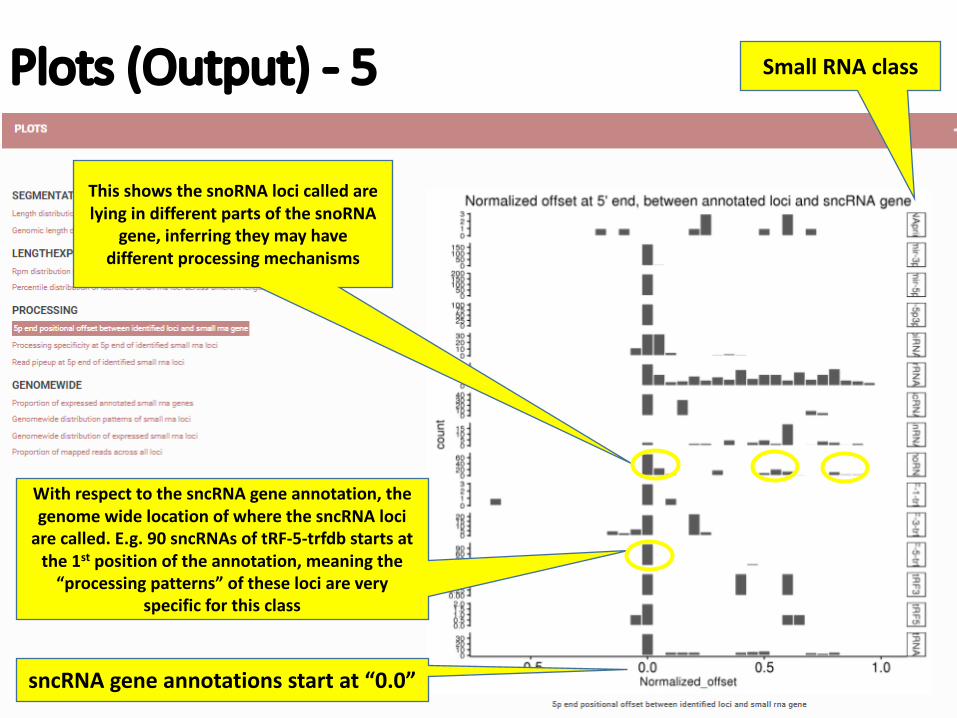
Plots(Output)- 5
sncRNA geneannotationsstartat“0.0”
SmallRNAclass
WithrespecttothesncRNA geneannotation,thegenomewidelocationofwherethesncRNA lociarecalled.E.g.90sncRNAs oftRF-5-trfdbstartsatthe1st positionoftheannotation,meaningthe“processingpatterns”oftheselociarevery
specificforthisclass
ThisshowsthesnoRNA locicalledarelyingindifferentpartsofthesnoRNA
gene,inferringtheymayhavedifferentprocessingmechanisms
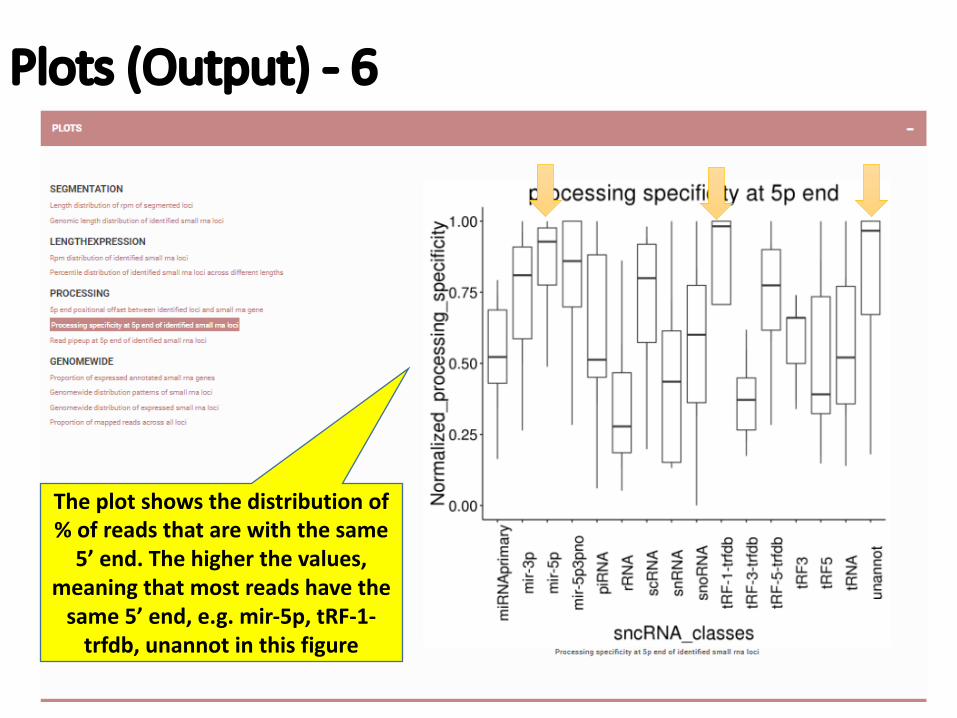
Plots(Output)- 6
Theplotshowsthedistributionof%ofreadsthatarewiththesame5’end.Thehigherthevalues,
meaningthatmostreadshavethesame5’end,e.g.mir-5p,tRF-1-trfdb,unannot inthisfigure
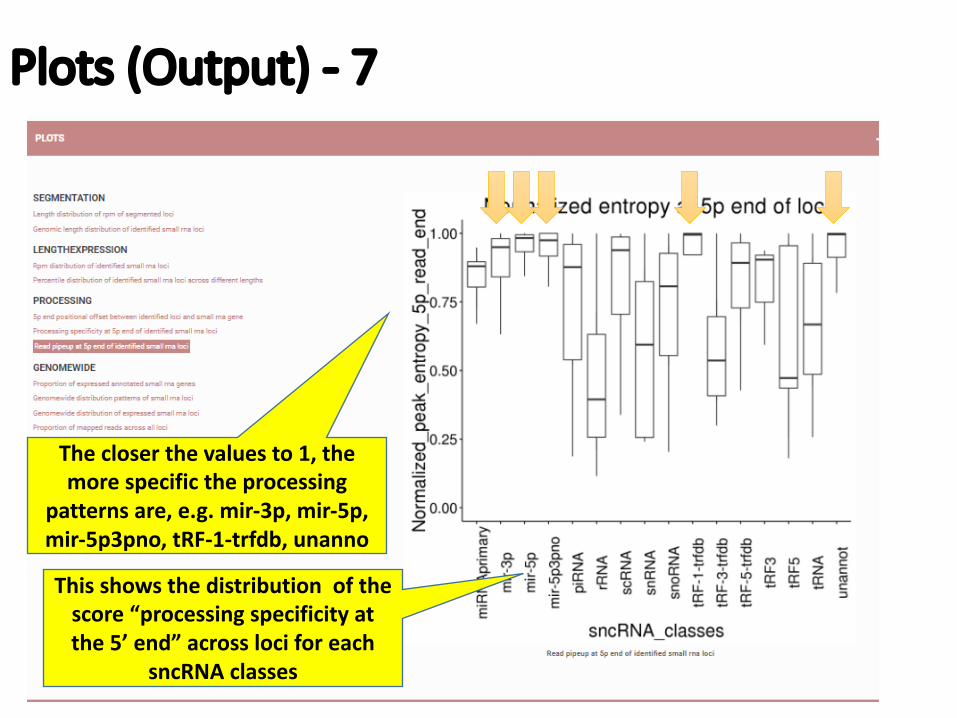
Plots(Output)- 7
Thisshowsthedistributionofthescore“processingspecificityatthe5’end”acrosslociforeach
sncRNA classes
Thecloserthevaluesto1,themorespecifictheprocessing
patternsare,e.g.mir-3p,mir-5p,mir-5p3pno,tRF-1-trfdb,unanno
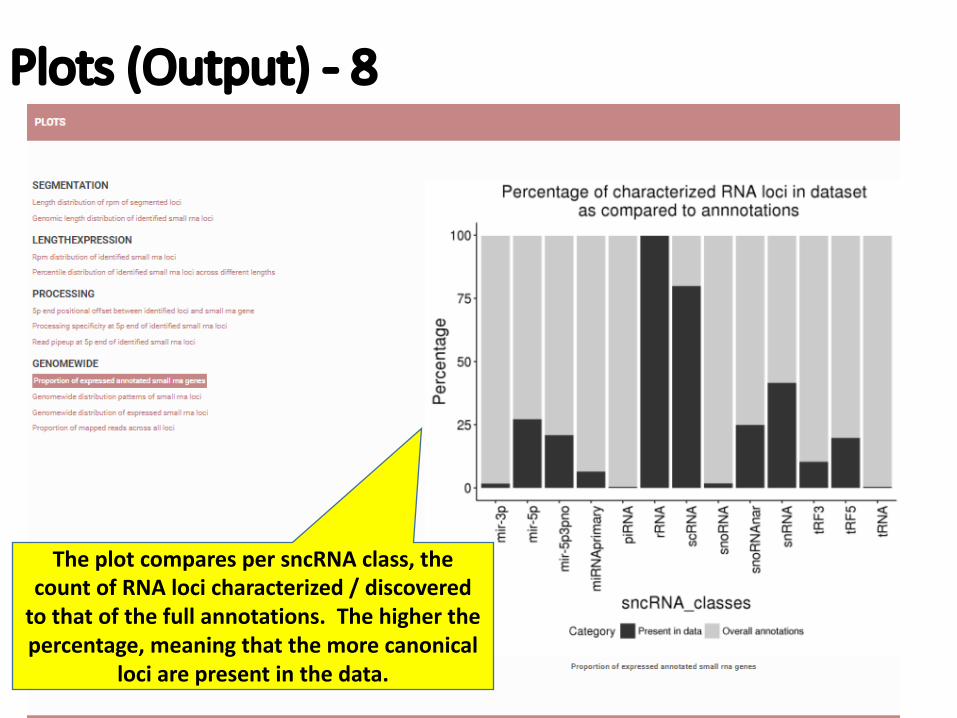
Plots(Output)- 8
TheplotcomparespersncRNA class,thecountofRNAlocicharacterized/discoveredtothatofthefullannotations.Thehigherthepercentage,meaningthatthemorecanonical
lociarepresentinthedata.
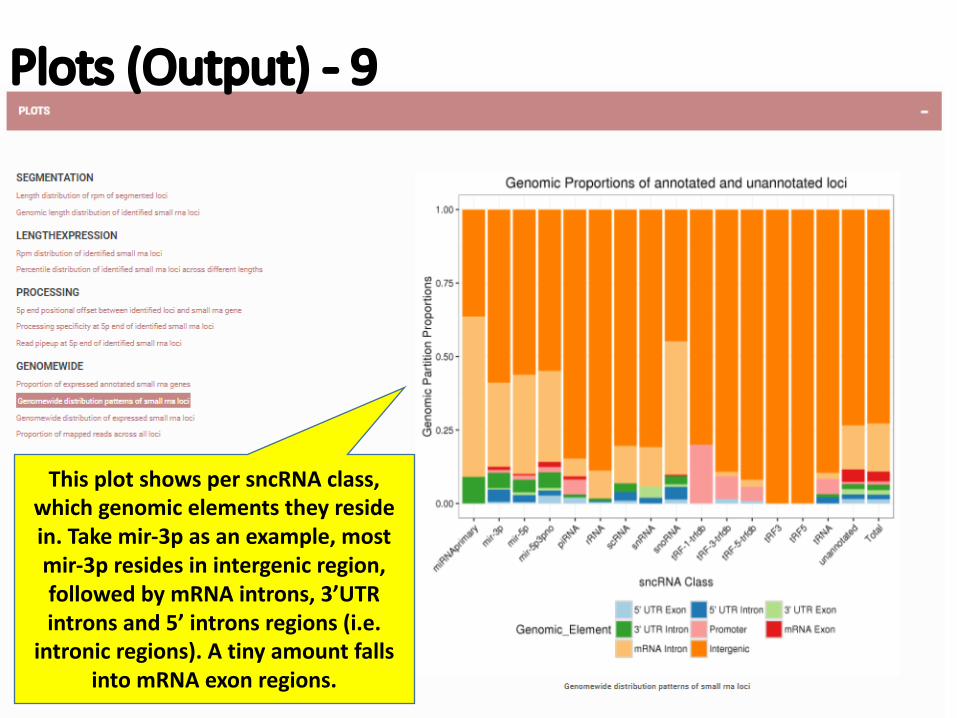
Plots(Output)- 9
ThisplotshowspersncRNA class,whichgenomicelementstheyresidein.Takemir-3pasanexample,mostmir-3presidesinintergenicregion,followedbymRNAintrons,3’UTRintronsand5’intronsregions(i.e.
intronic regions).AtinyamountfallsintomRNAexonregions.
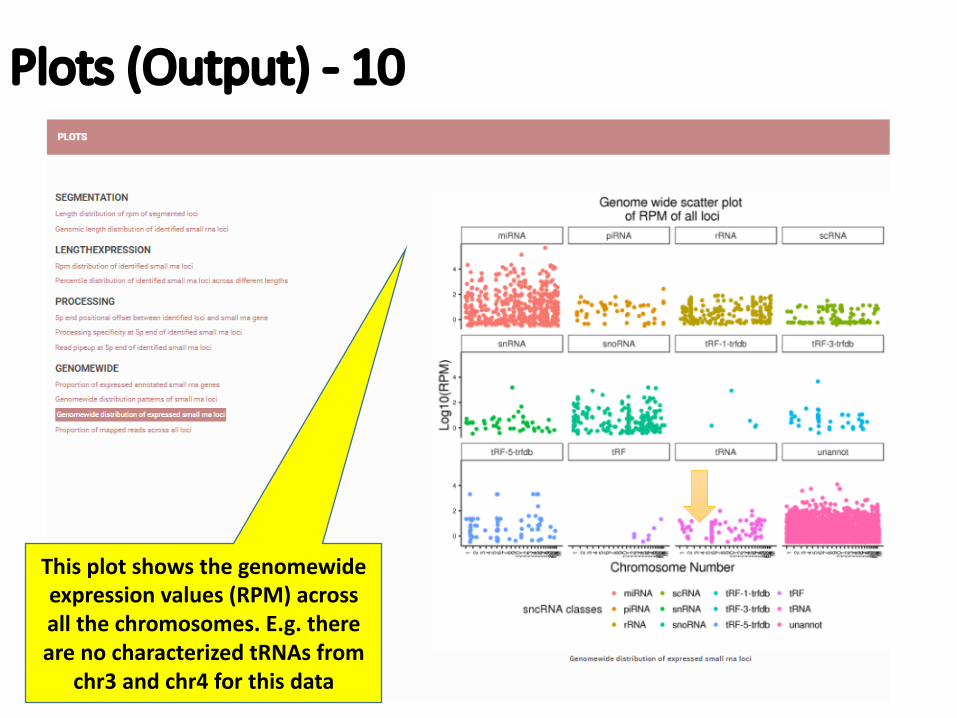
Plots(Output)- 10
Thisplotshowsthegenomewideexpressionvalues(RPM)acrossallthechromosomes.E.g.therearenocharacterizedtRNAs from
chr3andchr4forthisdata
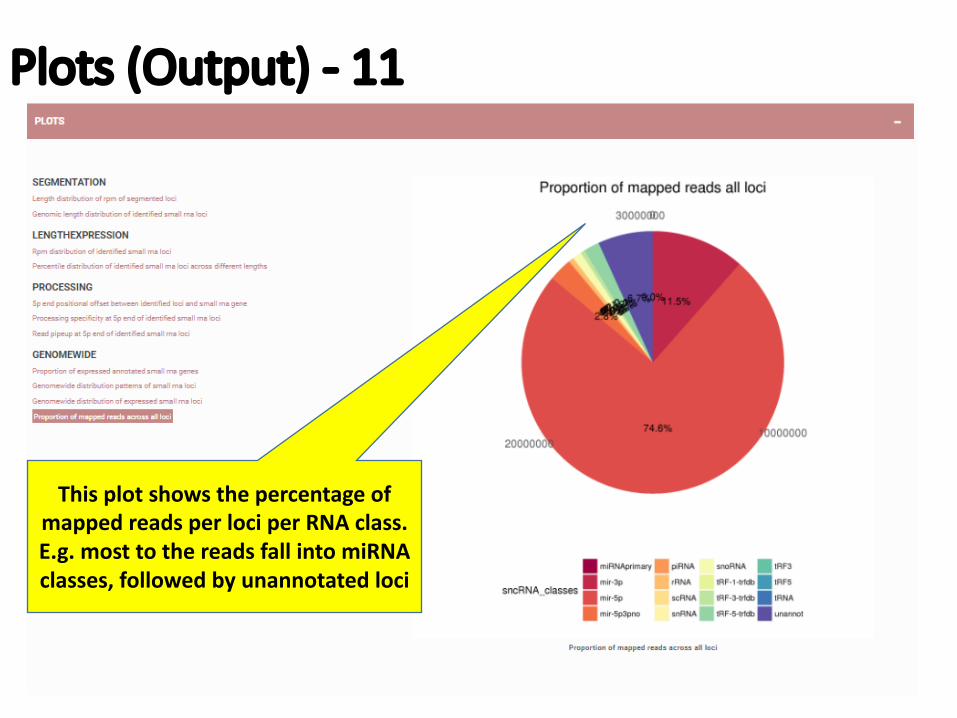
Plots(Output)- 11
ThisplotshowsthepercentageofmappedreadsperlociperRNAclass.E.g.mosttothereadsfallintomiRNAclasses,followedbyunannotatedloci
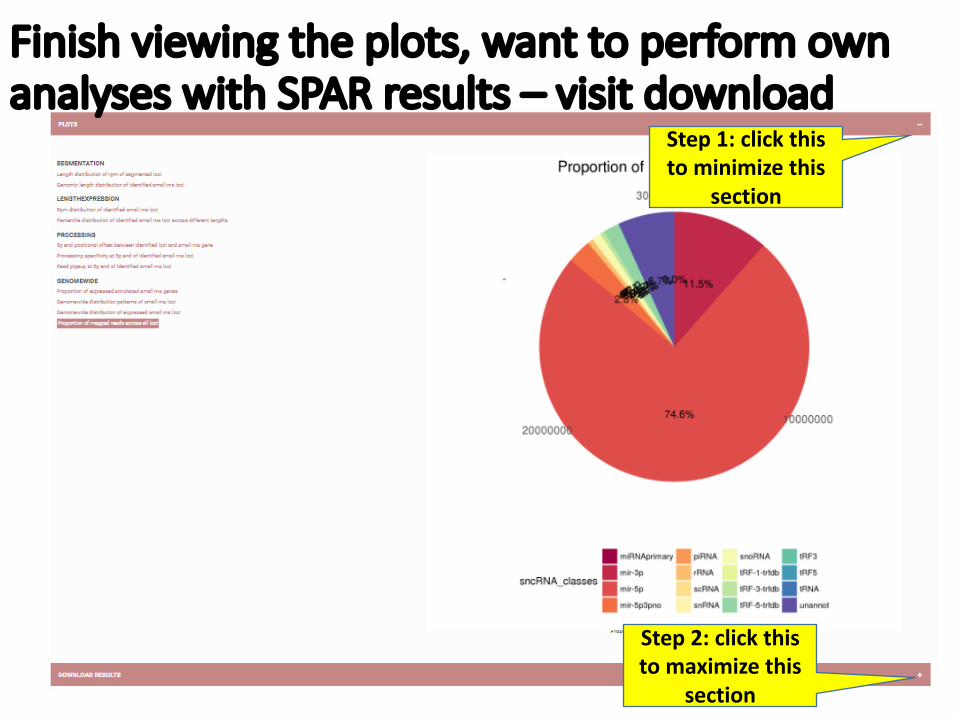
Finishviewingtheplots,wanttoperformownanalyseswithSPARresults– visitdownload
Step1:clickthistominimizethis
section
Step2:clickthistomaximizethis
section
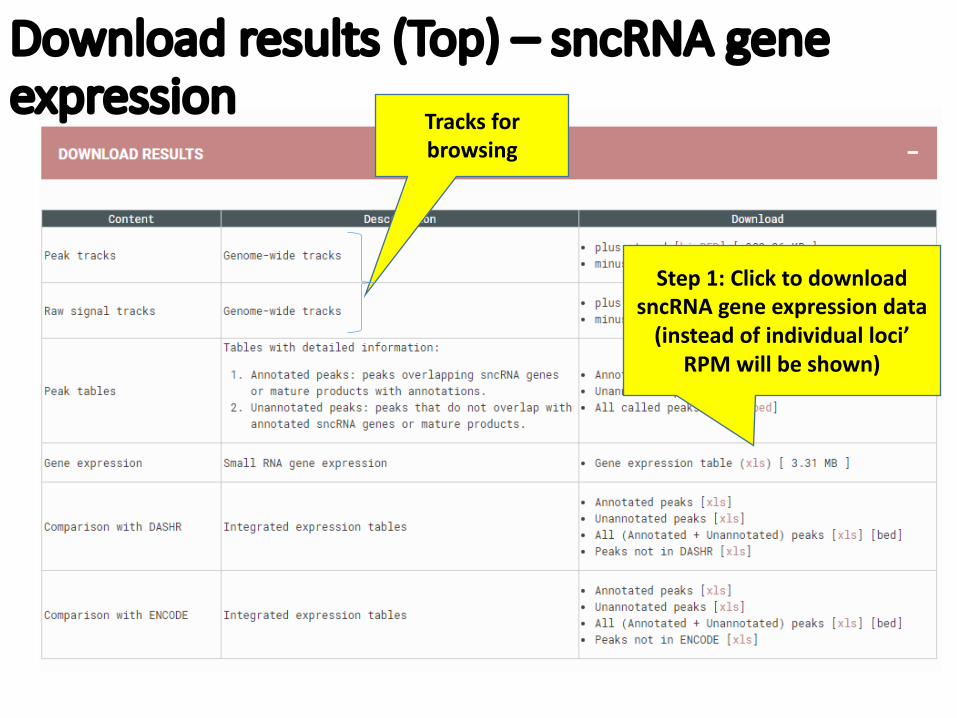
Downloadresults(Top)– sncRNA geneexpression
Step1:ClicktodownloadsncRNA geneexpressiondata(insteadofindividualloci’
RPMwillbeshown)
Tracksforbrowsing
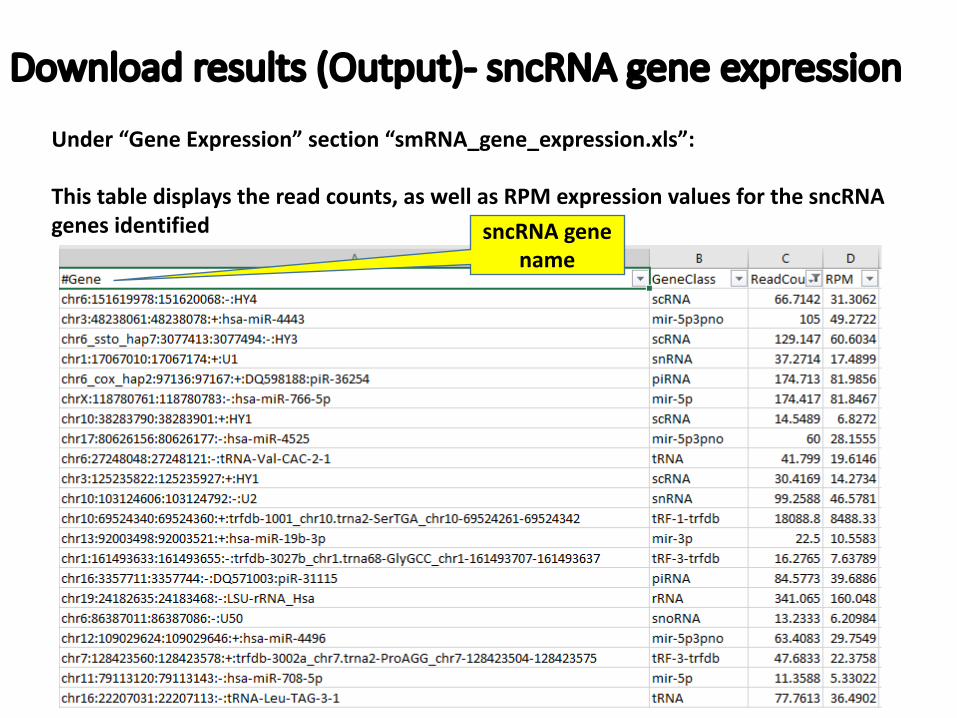
Downloadresults(Output)- sncRNA geneexpression
Under“GeneExpression”section“smRNA_gene_expression.xls”:
Thistabledisplaysthereadcounts,aswellasRPMexpressionvaluesforthesncRNAgenesidentified sncRNA gene
name
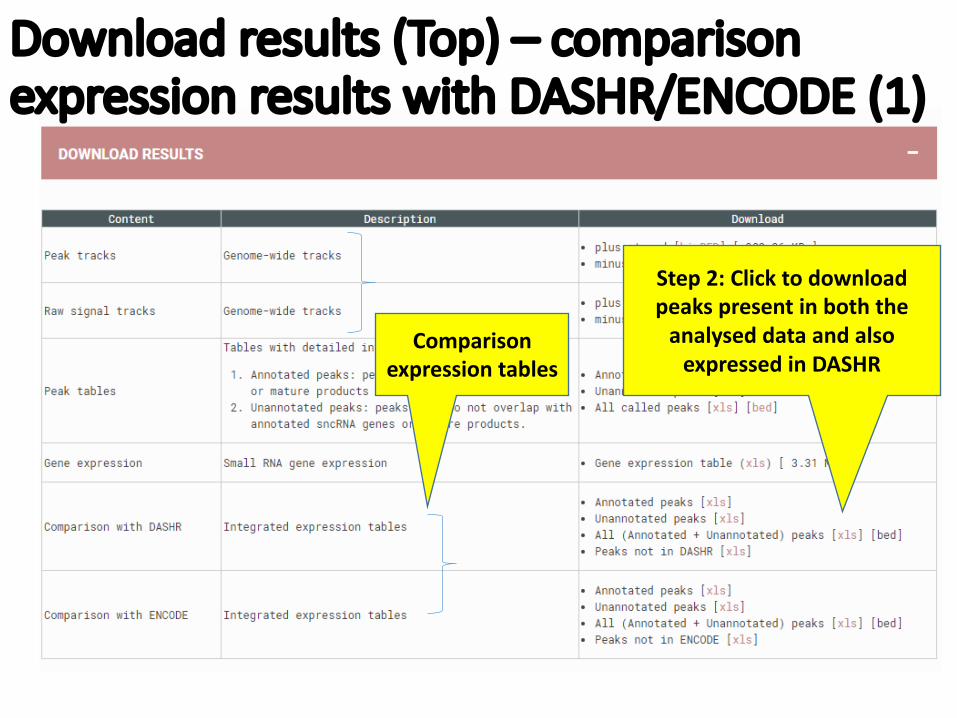
Downloadresults(Top)– comparisonexpressionresultswithDASHR/ENCODE(1)
Step2:Clicktodownloadpeakspresentinboththeanalysed dataandalsoexpressedinDASHR
Comparisonexpressiontables
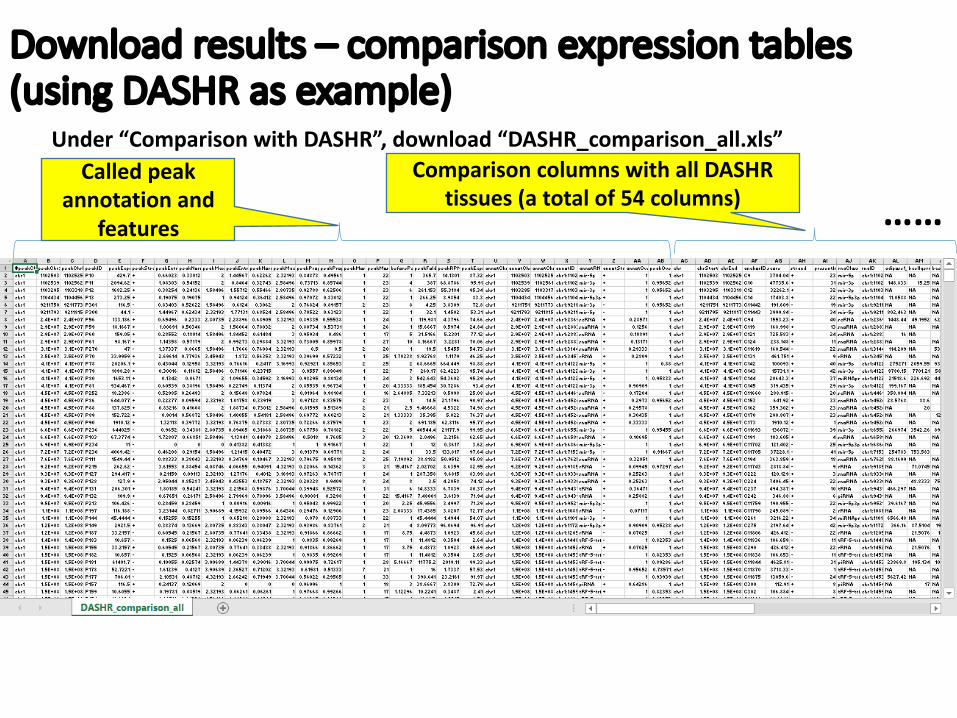
Downloadresults– comparisonexpressiontables(usingDASHRasexample)
Under“ComparisonwithDASHR”,download“DASHR_comparison_all.xls”Calledpeak
annotationandfeatures
ComparisoncolumnswithallDASHRtissues(atotalof54columns) ……
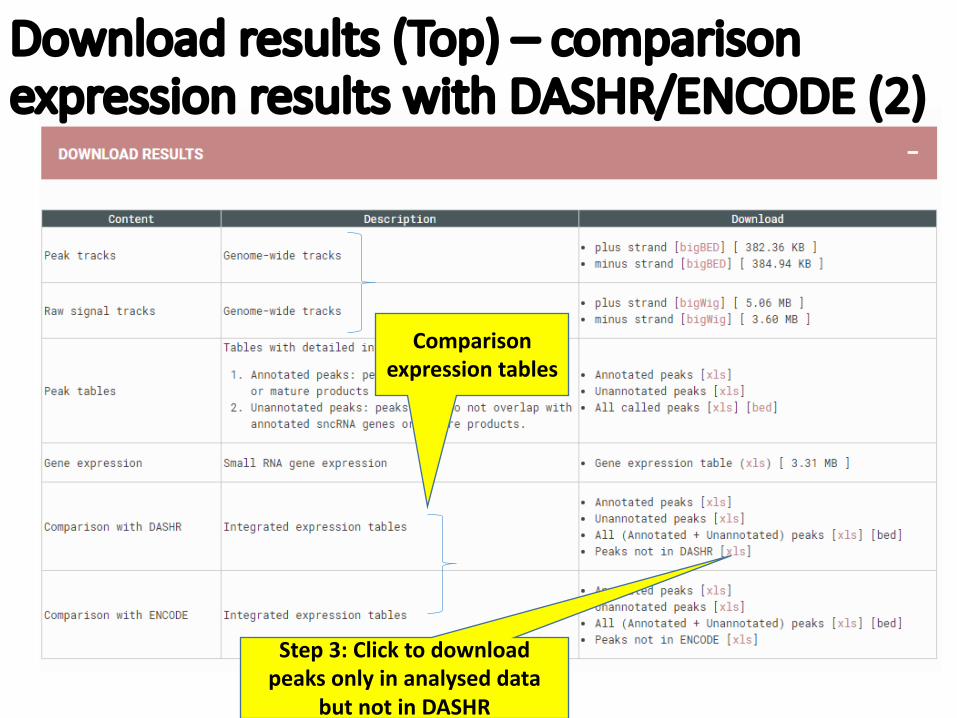
Downloadresults(Top)– comparisonexpressionresultswithDASHR/ENCODE(2)
Comparisonexpressiontables
Step3:Clicktodownloadpeaksonlyinanalysed data
butnotinDASHR
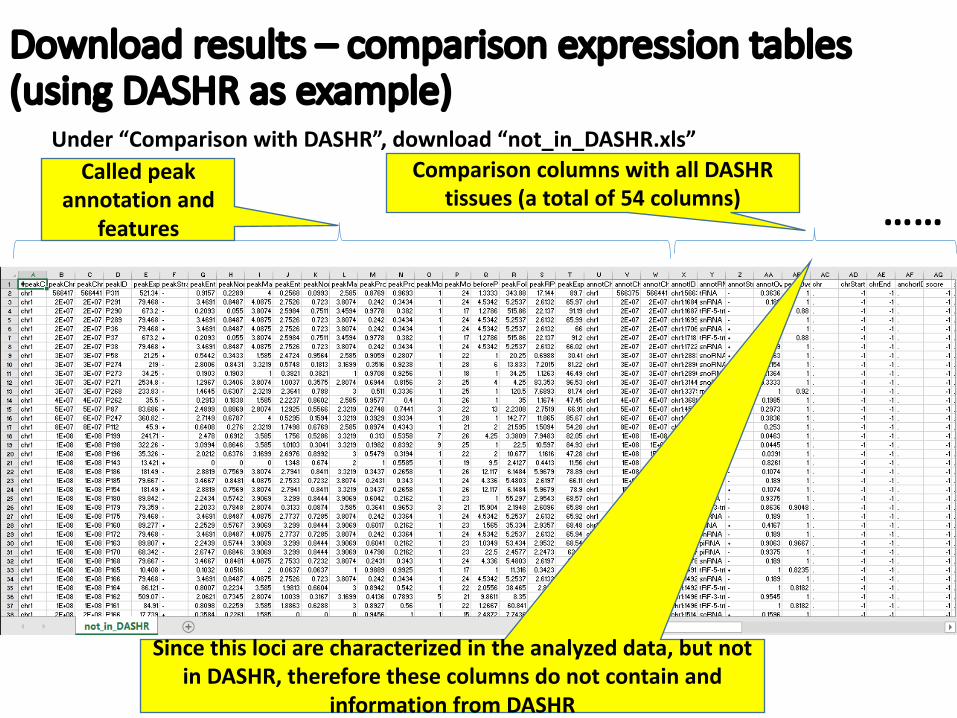
Downloadresults– comparisonexpressiontables(usingDASHRasexample)
Under“ComparisonwithDASHR”,download“not_in_DASHR.xls”Calledpeak
annotationandfeatures
ComparisoncolumnswithallDASHRtissues(atotalof54columns) ……
Sincethislociarecharacterizedintheanalyzeddata,butnotinDASHR,thereforethesecolumnsdonotcontainand
informationfromDASHR
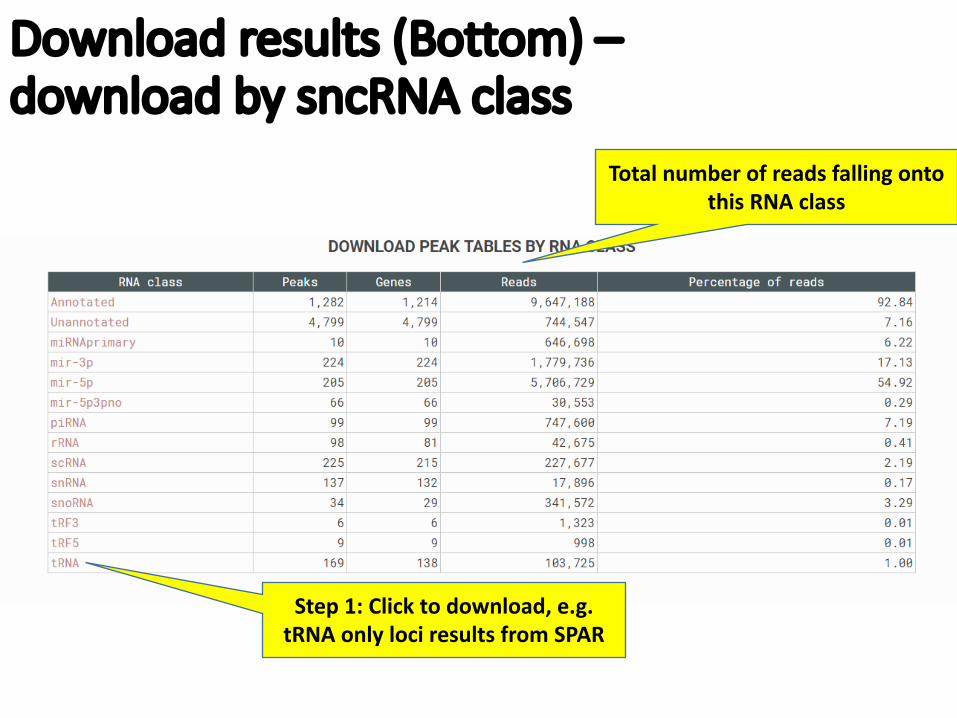
Downloadresults(Bottom)–downloadbysncRNA class
Step1:Clicktodownload,e.g.tRNA onlylociresultsfromSPAR
TotalnumberofreadsfallingontothisRNAclass
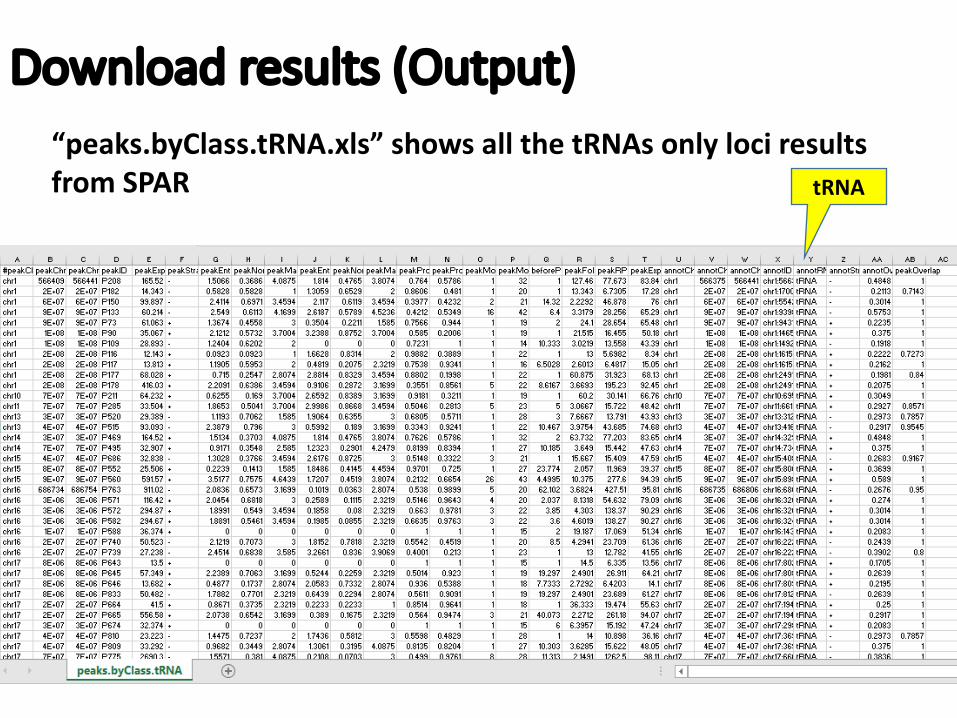
Downloadresults(Output)“peaks.byClass.tRNA.xls”showsallthetRNAs onlylociresultsfromSPAR tRNA
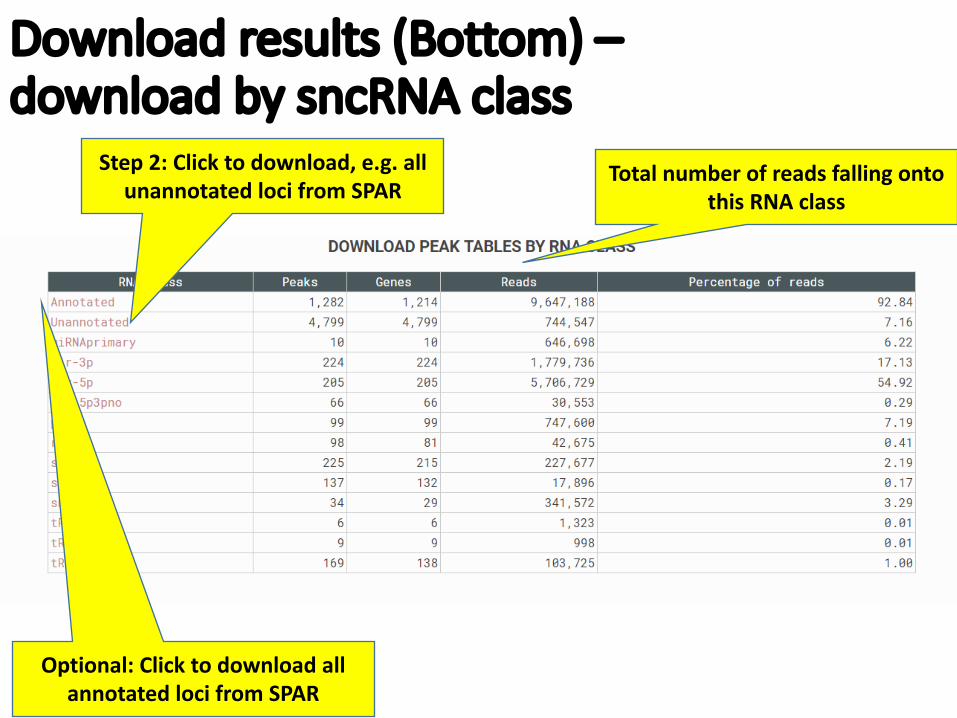
Downloadresults(Bottom)–downloadbysncRNA class
Step2:Clicktodownload,e.g.allunannotatedlocifromSPAR
TotalnumberofreadsfallingontothisRNAclass
Optional:ClicktodownloadallannotatedlocifromSPAR
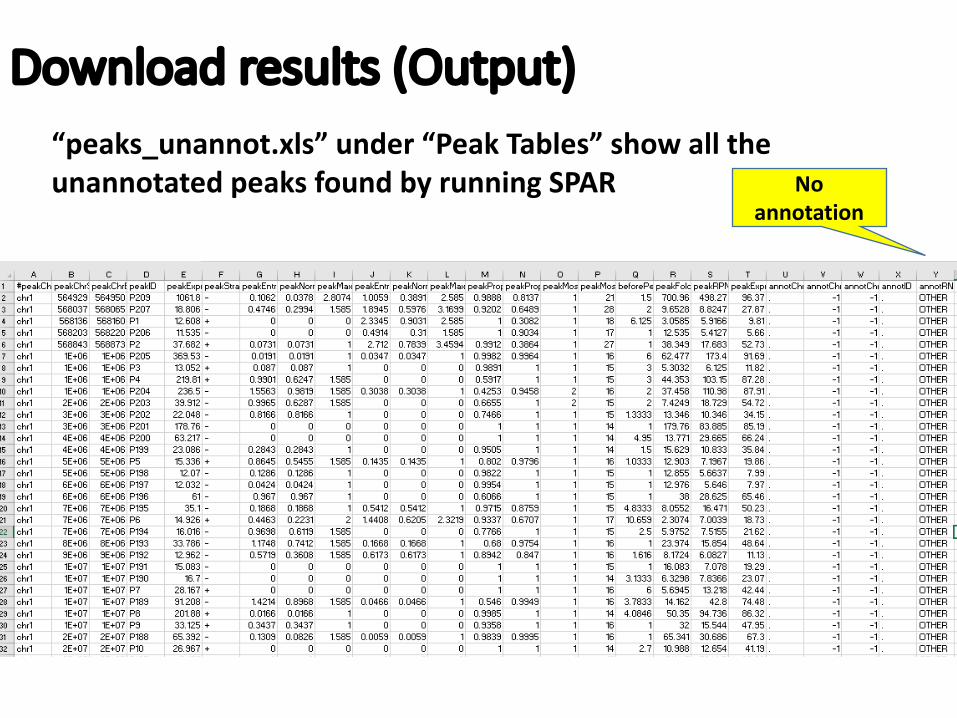
Downloadresults(Output)“peaks_unannot.xls”under“PeakTables”showalltheunannotatedpeaksfoundbyrunningSPAR No
annotation
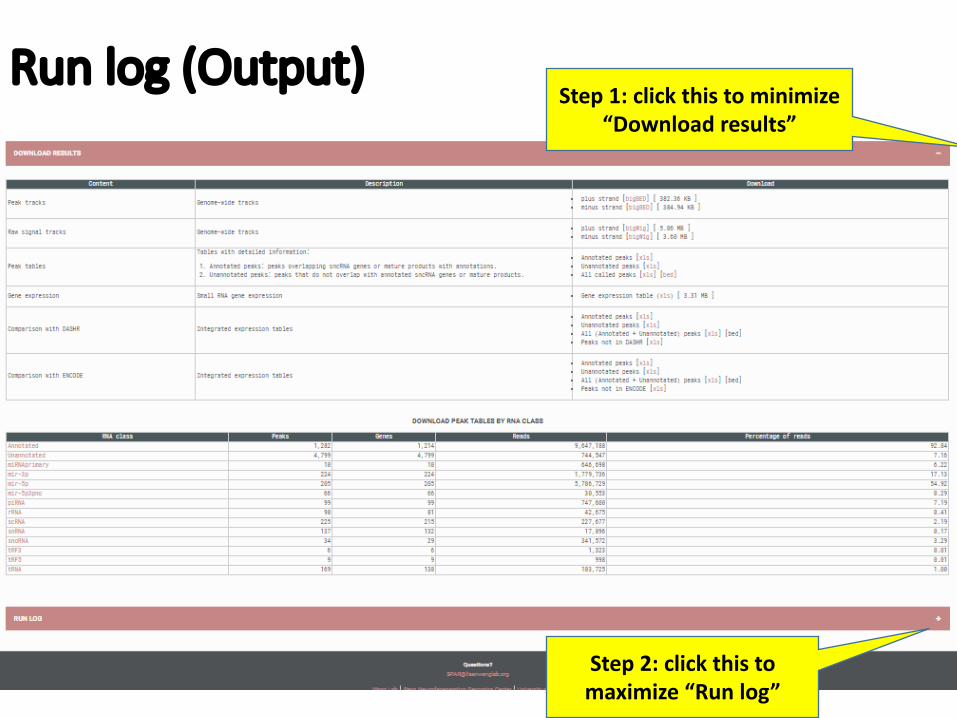
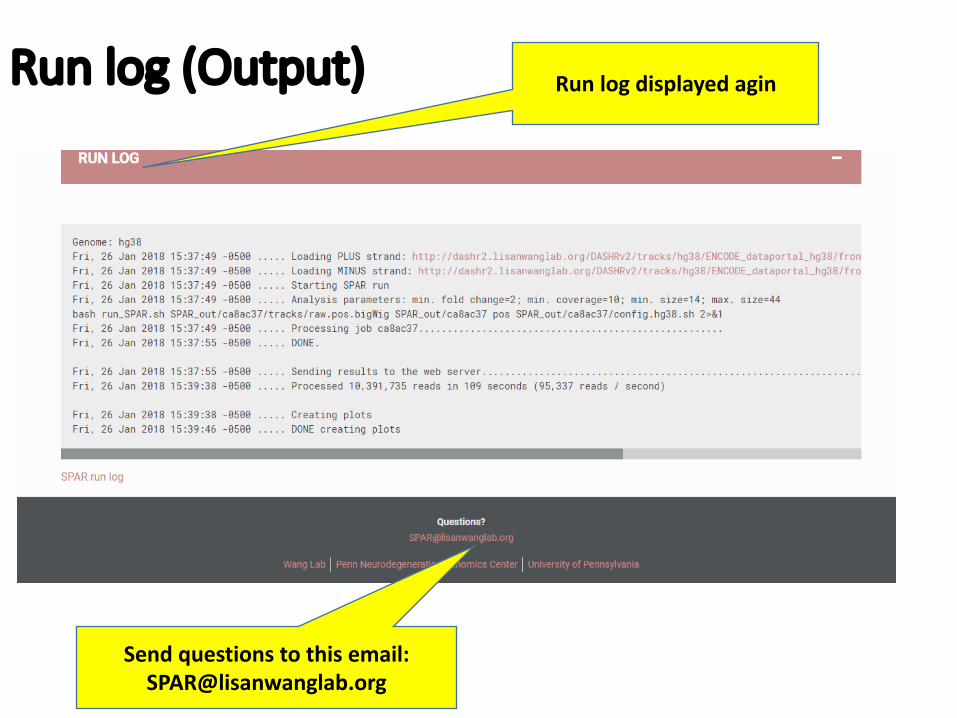
Runlog(Output)Step1:clickthistominimize
“Downloadresults”
Step2:clickthistomaximize“Runlog”

END