Embed Size (px)
Citation preview
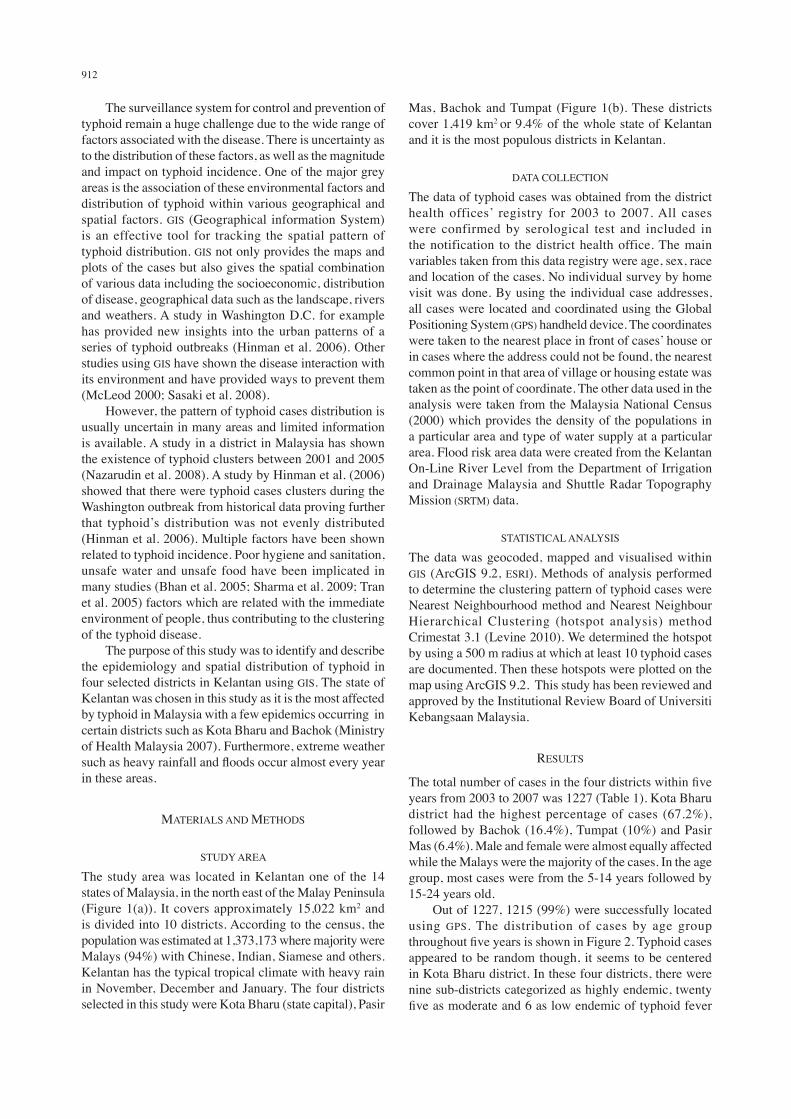
Sains Malaysiana 41(7)(2012): 911–919
Spatial Analysis of Environmental Factors Influencing Typhoid Endemicity in Kelantan, Malaysia
(Analisis Reruang Faktor Persekitaran yang Mempengaruhi Keendemikan Tifoid di Kelantan, Malaysia)
SHAMSUL AZHAR SHAH*, HIROSHI SUZUKI, MOHD ROHAIZAT HASSAN REIKO SAITO, NAZARUDIN SAFIAN & SHAHARUDIN IDRUS
ABSTRACT
The determination of the high-risk area and clusters of typhoid cases is critical in typhoid control. The purpose of this study was to identify and describe the epidemiology and spatial distribution of typhoid in four selected districts in Kelantan using GIS (geographical information system). A total of 1215 (99%) of the cases were coordinated with GPS (global positioning system) and mapping was done using ArcGIS 9.2. Spatial analysis was performed to determine the cluster and high-risk area of typhoid. Results showed that typhoid incidence was not associated with race and sex. Most affected were from the age group of 5-14 followed by 15-24 year olds. Nine sub-districts were categorized as highly endemic. In addition typhoid has shown a significant tendency to cluster and a total of 22 hotspots were found in Kota Bharu, Bachok and Tumpat with a few sub districts identified as high risk for typhoid. No significant relationships between the treated water ratio and flood risk area were found with the cluster of cases. The cluster of typhoid cases in the endemic area did not appear to be related to environmental risk factors. Understanding the characteristics of these clusters would enable the prevention of typhoid disease in the future.
Keywords: Environmental factors; high-risk; typhoid cluster
ABSTRAK
Penentuan kawasan berisiko tinggi dan kelompok kes-kes tifoid adalah penting bagi pengawalannya. Tujuan kajian ini adalah untuk mengenalpasti dan menghuraikan epidemiologi dan taburan reruang tifoid di empat daerah terpilih di Kelantan menggunakan GIS. Sebanyak 1215 (99%) lokasi kes ditentukan dengan GPS dan pemetaan dibuat menggunakan ArcGIS 9.2. Analisis reruang dilakukan untuk penentuan kelompok dan kawasan berisiko tinggi tifoid. Hasil kajian menunjukkan insiden tifoid tiada kaitan dengan bangsa dan seks, Kebanyakan daripada mereka adalah daripada kumpulan umur 5 – 14 tahun diikuti dengan 15 – 24 tahun. Sembilan mukim dikategori sebagai endemik tinggi. Tifoid menunjukkan kecenderungan untuk berkelompok yang signifikan dan 22 kelompok panas ditemui di Kota Bharu, Bachok dan Tumpat dengan beberapa mukim dikenalpasti kawasan berisiko tinggi. Tiada hubungan yang signifikan di antara nisbah air terawat dan kawasan risiko banjir dengan kelompok kes. Kelompok kes tifoid dalam kawasan endemik kelihatan tiada kaitan dengan faktor risiko persekitaran. Pemahaman sifat-sifat kelompok ini boleh membantu dalam pencegahan penyakit tifoid pada masa akan datang.
Kata kunci: Faktor persekitaran; kelompok tifoid; risiko tinggi
INTRODUCTION
Typhoid remains to be a major public health problem around the globe. It is estimated that 16 million cases of typhoid with 600,000 deaths occurs every year (Bhutta 2006). In general, typhoid is endemic among poor and developing countries where the sanitation system and water supply are inadequate. In Asia, typhoid crude incidence is 274 per 100,000 populations per year which is higher than in other continents (Crump et al. 2004). In Malaysia, from 1997 to 2007, the total numbers of cases increased from 701 to 1072 (Ministry of Health Malaysia 2007). Between 2001 and 2007, the incidence rates were around 1.89 to 4.10 per 100,000 populations. There
were some areas of endemic and occasionally epidemics especially in Kelantan and Sabah. Agent, host and environmental factors are very important aspects of the incidence of typhoid. Typhoid, a food and waterborne disease, caused by bacteria Salmonella typhi a gram negative bacteria from the Enterobacteriaceae group, a gastrointestinal bacteria. From the mode of transmission, which is water and food contaminated by typhoid patient or carrier, occasional outbreak or sporadic cases may occur (Stroffolini et al. 1992). Typhoid is mainly prevented by improvements made in hygiene and sanitation. Vaccine for the high risk group and population are recommended as well as during the outbreak control (World Health Organization 2008).
912
The surveillance system for control and prevention of typhoid remain a huge challenge due to the wide range of factors associated with the disease. There is uncertainty as to the distribution of these factors, as well as the magnitude and impact on typhoid incidence. One of the major grey areas is the association of these environmental factors and distribution of typhoid within various geographical and spatial factors. GIS (Geographical information System) is an effective tool for tracking the spatial pattern of typhoid distribution. GIS not only provides the maps and plots of the cases but also gives the spatial combination of various data including the socioeconomic, distribution of disease, geographical data such as the landscape, rivers and weathers. A study in Washington D.C. for example has provided new insights into the urban patterns of a series of typhoid outbreaks (Hinman et al. 2006). Other studies using GIS have shown the disease interaction with its environment and have provided ways to prevent them (McLeod 2000; Sasaki et al. 2008). However, the pattern of typhoid cases distribution is usually uncertain in many areas and limited information is available. A study in a district in Malaysia has shown the existence of typhoid clusters between 2001 and 2005 (Nazarudin et al. 2008). A study by Hinman et al. (2006) showed that there were typhoid cases clusters during the Washington outbreak from historical data proving further that typhoid’s distribution was not evenly distributed (Hinman et al. 2006). Multiple factors have been shown related to typhoid incidence. Poor hygiene and sanitation, unsafe water and unsafe food have been implicated in many studies (Bhan et al. 2005; Sharma et al. 2009; Tran et al. 2005) factors which are related with the immediate environment of people, thus contributing to the clustering of the typhoid disease. The purpose of this study was to identify and describe the epidemiology and spatial distribution of typhoid in four selected districts in Kelantan using GIS. The state of Kelantan was chosen in this study as it is the most affected by typhoid in Malaysia with a few epidemics occurring in certain districts such as Kota Bharu and Bachok (Ministry of Health Malaysia 2007). Furthermore, extreme weather such as heavy rainfall and floods occur almost every year in these areas.
MATERIALS AND METHODS
STUDy AREA
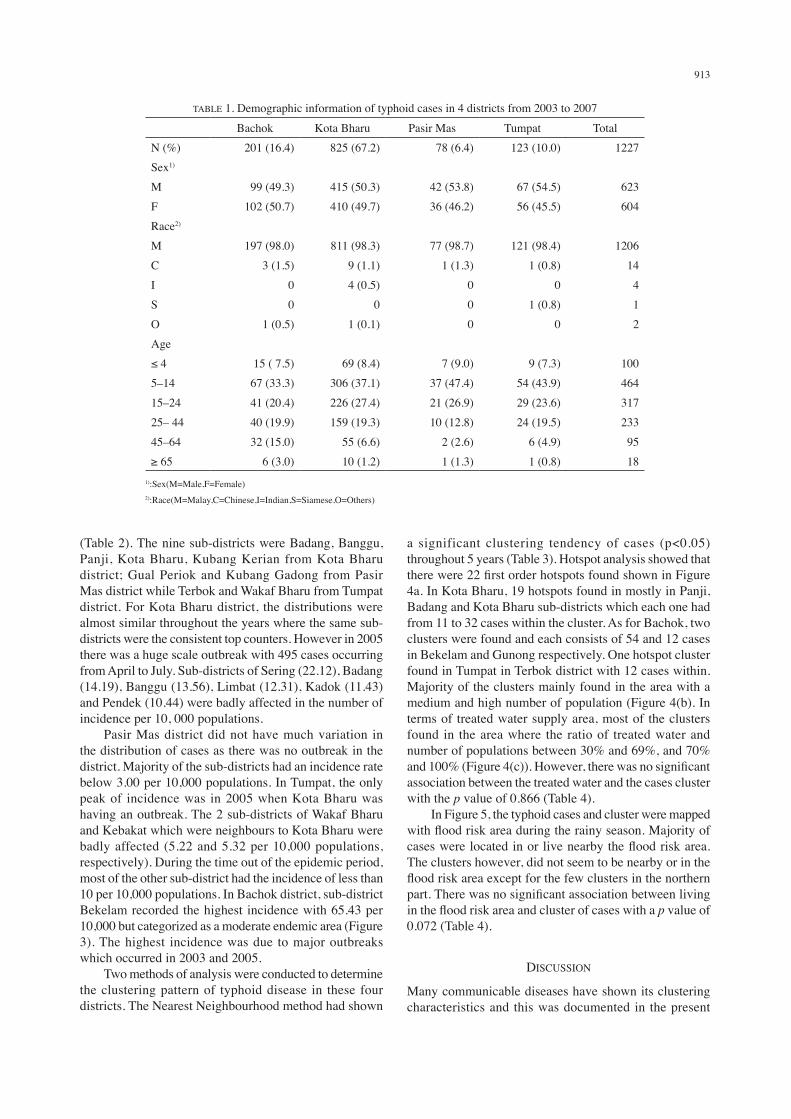
The study area was located in Kelantan one of the 14 states of Malaysia, in the north east of the Malay Peninsula (Figure 1(a)). It covers approximately 15,022 km2 and is divided into 10 districts. According to the census, the population was estimated at 1,373,173 where majority were Malays (94%) with Chinese, Indian, Siamese and others. Kelantan has the typical tropical climate with heavy rain in November, December and January. The four districts selected in this study were Kota Bharu (state capital), Pasir
Mas, Bachok and Tumpat (Figure 1(b). These districts cover 1,419 km2 or 9.4% of the whole state of Kelantan and it is the most populous districts in Kelantan.
DATA COLLECTION
The data of typhoid cases was obtained from the district health offices’ registry for 2003 to 2007. All cases were confirmed by serological test and included in the notification to the district health office. The main variables taken from this data registry were age, sex, race and location of the cases. No individual survey by home visit was done. By using the individual case addresses, all cases were located and coordinated using the Global Positioning System (GPS) handheld device. The coordinates were taken to the nearest place in front of cases’ house or in cases where the address could not be found, the nearest common point in that area of village or housing estate was taken as the point of coordinate. The other data used in the analysis were taken from the Malaysia National Census (2000) which provides the density of the populations in a particular area and type of water supply at a particular area. Flood risk area data were created from the Kelantan On-Line River Level from the Department of Irrigation and Drainage Malaysia and Shuttle Radar Topography Mission (SRTM) data.
STATISTICAL ANALySIS
The data was geocoded, mapped and visualised within GIS (ArcGIS 9.2, ESRI). Methods of analysis performed to determine the clustering pattern of typhoid cases were Nearest Neighbourhood method and Nearest Neighbour Hierarchical Clustering (hotspot analysis) method Crimestat 3.1 (Levine 2010). We determined the hotspot by using a 500 m radius at which at least 10 typhoid cases are documented. Then these hotspots were plotted on the map using ArcGIS 9.2. This study has been reviewed and approved by the Institutional Review Board of Universiti Kebangsaan Malaysia.
RESULTS
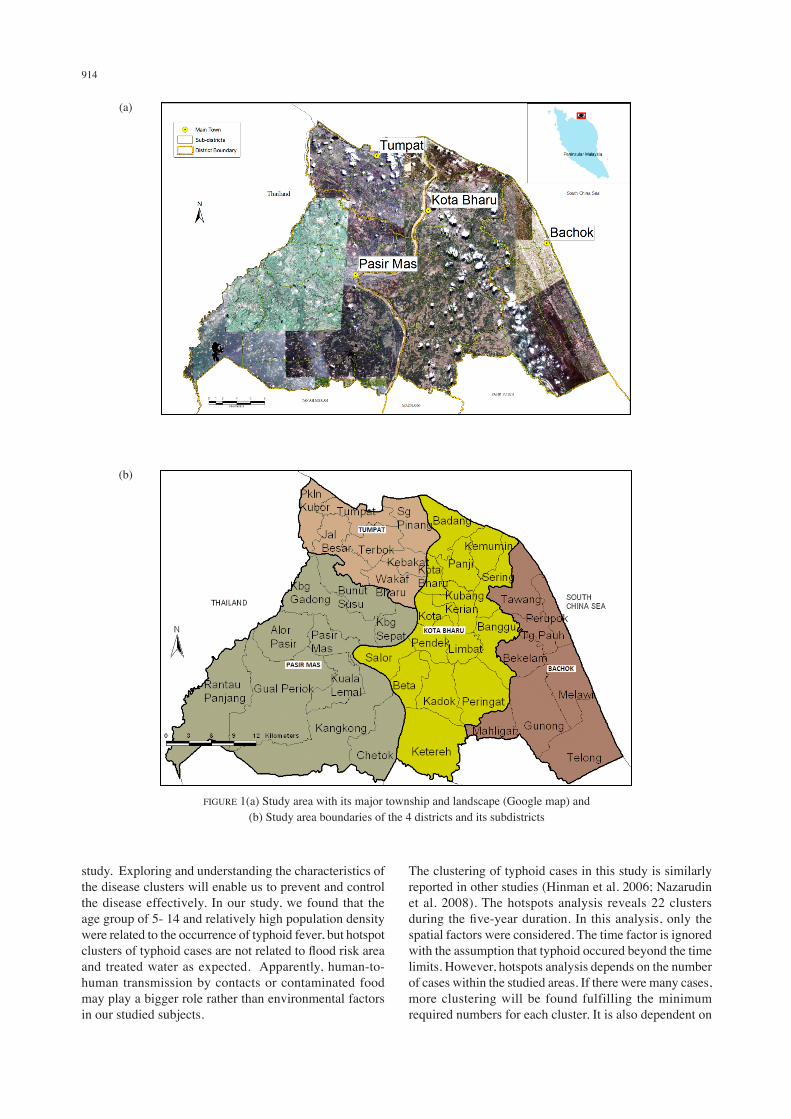
The total number of cases in the four districts within five years from 2003 to 2007 was 1227 (Table 1). Kota Bharu district had the highest percentage of cases (67.2%), followed by Bachok (16.4%), Tumpat (10%) and Pasir Mas (6.4%). Male and female were almost equally affected while the Malays were the majority of the cases. In the age group, most cases were from the 5-14 years followed by 15-24 years old. Out of 1227, 1215 (99%) were successfully located using GPS. The distribution of cases by age group throughout five years is shown in Figure 2. Typhoid cases appeared to be random though, it seems to be centered in Kota Bharu district. In these four districts, there were nine sub-districts categorized as highly endemic, twenty five as moderate and 6 as low endemic of typhoid fever
913
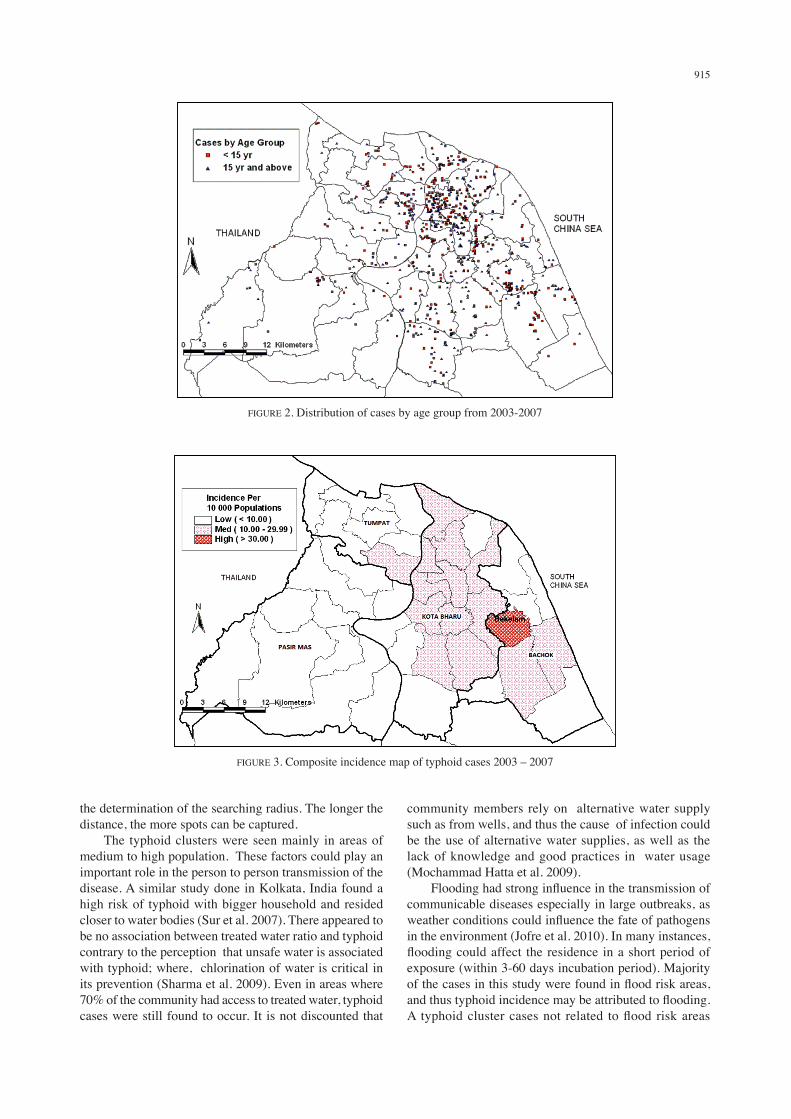
(Table 2). The nine sub-districts were Badang, Banggu, Panji, Kota Bharu, Kubang Kerian from Kota Bharu district; Gual Periok and Kubang Gadong from Pasir Mas district while Terbok and Wakaf Bharu from Tumpat district. For Kota Bharu district, the distributions were almost similar throughout the years where the same sub-districts were the consistent top counters. However in 2005 there was a huge scale outbreak with 495 cases occurring from April to July. Sub-districts of Sering (22.12), Badang (14.19), Banggu (13.56), Limbat (12.31), Kadok (11.43) and Pendek (10.44) were badly affected in the number of incidence per 10, 000 populations. Pasir Mas district did not have much variation in the distribution of cases as there was no outbreak in the district. Majority of the sub-districts had an incidence rate below 3.00 per 10,000 populations. In Tumpat, the only peak of incidence was in 2005 when Kota Bharu was having an outbreak. The 2 sub-districts of Wakaf Bharu and Kebakat which were neighbours to Kota Bharu were badly affected (5.22 and 5.32 per 10,000 populations, respectively). During the time out of the epidemic period, most of the other sub-district had the incidence of less than 10 per 10,000 populations. In Bachok district, sub-district Bekelam recorded the highest incidence with 65.43 per 10,000 but categorized as a moderate endemic area (Figure 3). The highest incidence was due to major outbreaks which occurred in 2003 and 2005. Two methods of analysis were conducted to determine the clustering pattern of typhoid disease in these four districts. The Nearest Neighbourhood method had shown
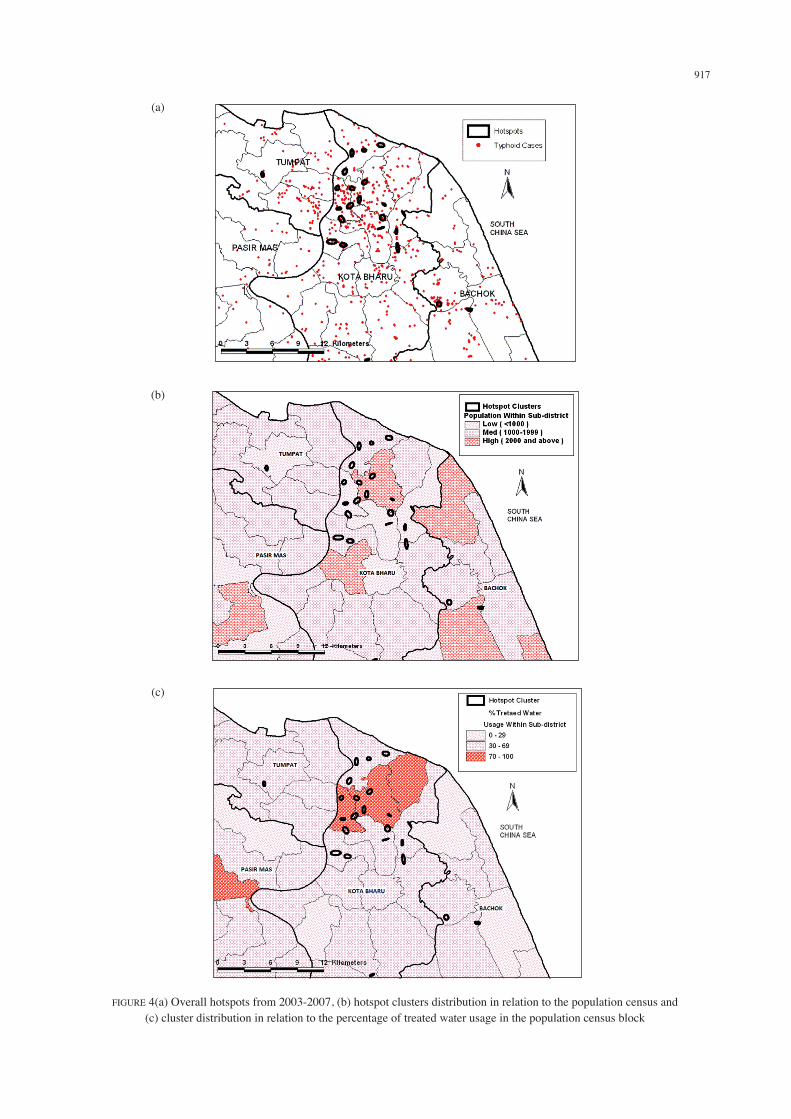
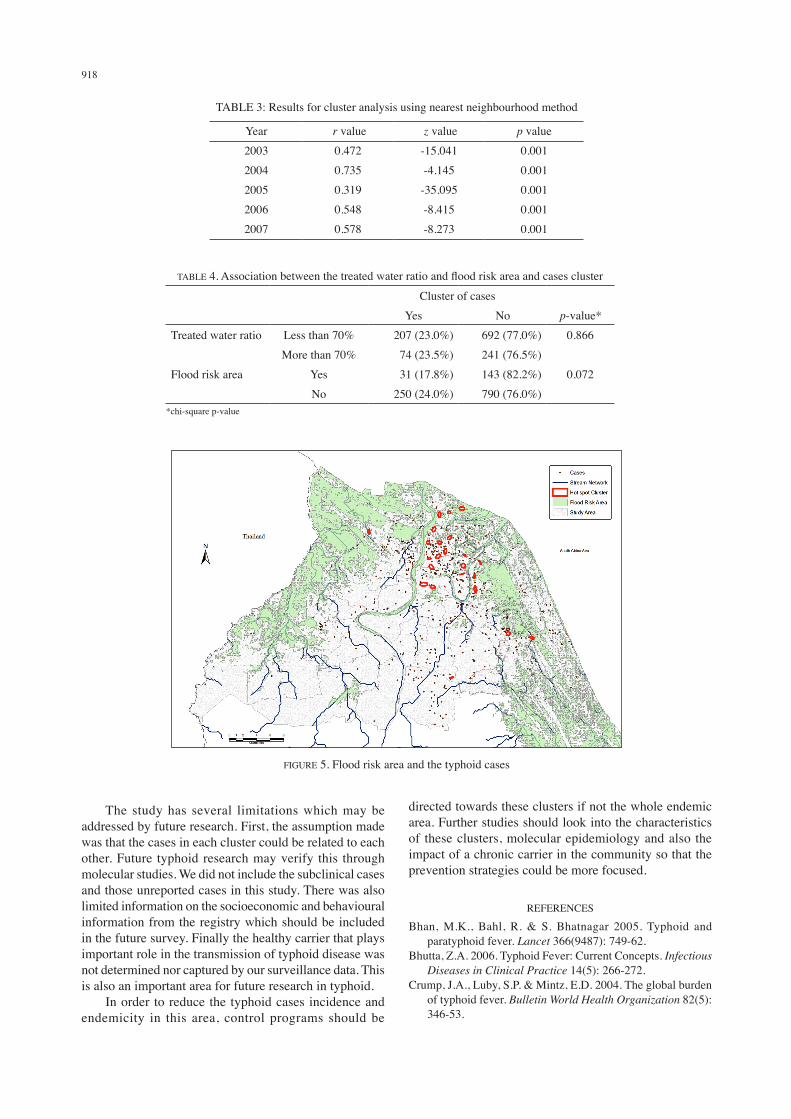
a significant clustering tendency of cases (p<0.05) throughout 5 years (Table 3). Hotspot analysis showed that there were 22 first order hotspots found shown in Figure 4a. In Kota Bharu, 19 hotspots found in mostly in Panji, Badang and Kota Bharu sub-districts which each one had from 11 to 32 cases within the cluster. As for Bachok, two clusters were found and each consists of 54 and 12 cases in Bekelam and Gunong respectively. One hotspot cluster found in Tumpat in Terbok district with 12 cases within. Majority of the clusters mainly found in the area with a medium and high number of population (Figure 4(b). In terms of treated water supply area, most of the clusters found in the area where the ratio of treated water and number of populations between 30% and 69%, and 70% and 100% (Figure 4(c)). However, there was no significant association between the treated water and the cases cluster with the p value of 0.866 (Table 4). In Figure 5, the typhoid cases and cluster were mapped with flood risk area during the rainy season. Majority of cases were located in or live nearby the flood risk area. The clusters however, did not seem to be nearby or in the flood risk area except for the few clusters in the northern part. There was no significant association between living in the flood risk area and cluster of cases with a p value of 0.072 (Table 4).
DISCUSSION
Many communicable diseases have shown its clustering characteristics and this was documented in the present
TABLE 1. Demographic information of typhoid cases in 4 districts from 2003 to 2007
Bachok Kota Bharu Pasir Mas Tumpat TotalN (%) 201 (16.4) 825 (67.2) 78 (6.4) 123 (10.0) 1227Sex1)
M 99 (49.3) 415 (50.3) 42 (53.8) 67 (54.5) 623F 102 (50.7) 410 (49.7) 36 (46.2) 56 (45.5) 604Race2)
M 197 (98.0) 811 (98.3) 77 (98.7) 121 (98.4) 1206C 3 (1.5) 9 (1.1) 1 (1.3) 1 (0.8) 14I 0 4 (0.5) 0 0 4S 0 0 0 1 (0.8) 1O 1 (0.5) 1 (0.1) 0 0 2Age ≤ 4 15 ( 7.5) 69 (8.4) 7 (9.0) 9 (7.3) 1005–14 67 (33.3) 306 (37.1) 37 (47.4) 54 (43.9) 46415–24 41 (20.4) 226 (27.4) 21 (26.9) 29 (23.6) 31725– 44 40 (19.9) 159 (19.3) 10 (12.8) 24 (19.5) 23345–64 32 (15.0) 55 (6.6) 2 (2.6) 6 (4.9) 95≥ 65 6 (3.0) 10 (1.2) 1 (1.3) 1 (0.8) 18
1):Sex(M=Male,F=Female) 2):Race(M=Malay,C=Chinese,I=Indian,S=Siamese,O=Others)
914
study. Exploring and understanding the characteristics of the disease clusters will enable us to prevent and control the disease effectively. In our study, we found that the age group of 5- 14 and relatively high population density were related to the occurrence of typhoid fever, but hotspot clusters of typhoid cases are not related to flood risk area and treated water as expected. Apparently, human-to-human transmission by contacts or contaminated food may play a bigger role rather than environmental factors in our studied subjects.
The clustering of typhoid cases in this study is similarly reported in other studies (Hinman et al. 2006; Nazarudin et al. 2008). The hotspots analysis reveals 22 clusters during the five-year duration. In this analysis, only the spatial factors were considered. The time factor is ignored with the assumption that typhoid occured beyond the time limits. However, hotspots analysis depends on the number of cases within the studied areas. If there were many cases, more clustering will be found fulfilling the minimum required numbers for each cluster. It is also dependent on
FIGURE 1(a) Study area with its major township and landscape (Google map) and (b) Study area boundaries of the 4 districts and its subdistricts
(a)
(b)
915
the determination of the searching radius. The longer the distance, the more spots can be captured. The typhoid clusters were seen mainly in areas of medium to high population. These factors could play an important role in the person to person transmission of the disease. A similar study done in Kolkata, India found a high risk of typhoid with bigger household and resided closer to water bodies (Sur et al. 2007). There appeared to be no association between treated water ratio and typhoid contrary to the perception that unsafe water is associated with typhoid; where, chlorination of water is critical in its prevention (Sharma et al. 2009). Even in areas where 70% of the community had access to treated water, typhoid cases were still found to occur. It is not discounted that
community members rely on alternative water supply such as from wells, and thus the cause of infection could be the use of alternative water supplies, as well as the lack of knowledge and good practices in water usage (Mochammad Hatta et al. 2009). Flooding had strong influence in the transmission of communicable diseases especially in large outbreaks, as weather conditions could influence the fate of pathogens in the environment (Jofre et al. 2010). In many instances, flooding could affect the residence in a short period of exposure (within 3-60 days incubation period). Majority of the cases in this study were found in flood risk areas, and thus typhoid incidence may be attributed to flooding. A typhoid cluster cases not related to flood risk areas
FIGURE 2. Distribution of cases by age group from 2003-2007
FIGURE 3. Composite incidence map of typhoid cases 2003 – 2007

916
may be due to transmission via chronic carrier within the community; a more dangerous mode of transmission because of the difficulty in identifying the carrier. Similar to other studies, no gender nor sex (50.8% male; 49.2% female) differences were found in typhoid incidence in Kelantan (Gasem et al. 2001; Velema et al. 1997). The race composition of Kelantan comprised mainly of Malays. The age group of 5-14 years old, followed by 15-25 years old were at the highest risk of getting typhoid. Previous studies also found that these age groups below 15 were more exposed to the causative agent and environmental factors associated with typhoid (Lin et al. 2000; Mulligan 1971; Ochiai et al. 2008; Velema et al.
1997). This age group is susceptible to clustering because of their limited movement and activities that are bound between school and home. Highly endemic areas were found in more populated areas as the disease can be transmitted easily through water and food. The interactions of individuals infected and non-infected could be within the family members or with others through food intake. These interactions may be observed only during outbreaks, but in sporadic cases, these interactions cannot be observed. Furthermore, besides non-detection, the transmission of the infection through asymptomatic carriers may continue in this community.
TABLE 2. Typhoid incidence (per 10,000) in all subdistricts (4 districts) between 2003 and 2007
DISTRICT SUBDISTRICT 2003 2004 2005 2006 2007 Composite 2003-07 L M H1)
BACHOK Telong 2.74 0.84 0.77 - - 4.01 XMahligai - 1.56 - - - 1.49 XMelawi 4.85 1.48 6.35 - - 12.30 XBeklam 48.83 - 20.91 0.66 - 65.43 XGunong 5.37 - 10.65 0.30 - 16.16 XPerupok 0.92 - 1.17 - 0.33 2.43 XTanjong Pauh 0.90 0.82 2.27 - - 3.94 XTawang 1.34 - 2.26 - - 3.53 X
KOTA BHARU Badang 1.02 0.47 14.19 0.79 0.54 17.71 XKemumin 1.66 - 5.20 0.73 0.51 8.35 XPeringat 4.84 0.68 2.82 - 2.64 11.12 XSering 2.02 0.37 22.12 - 0.29 25.56 XBanggu 2.61 2.80 13.56 6.05 0.31 26.37 XLimbat 1.05 - 12.31 0.40 1.48 16.06 XPanji 2.08 0.48 9.43 0.70 0.55 13.61 XKota Bharu 1.78 0.44 9.38 0.75 0.34 13.05 XKota 1.06 - 9.23 1.09 0.75 12.74 XKubang Kerian 1.11 1.02 3.74 0.73 4.72 12.52 XKetereh 1.57 - 4.91 0.17 1.27 8.27 XKadok 8.60 2.08 11.43 - 0.64 22.25 XBeta 0.83 - 6.98 0.64 0.59 9.47 XPendek 1.98 0.91 10.44 1.91 - 15.67 XSalor - - 3.98 - - 4.15 X
PASIR MAS Rantau Panjang - 0.30 0.55 0.25 0.93 2.31 XGual Periok 0.50 0.91 2.92 2.68 1.05 8.72 XChetok 3.07 0.56 - - - 3.23 XKangkong - 0.43 0.79 0.36 - 1.64 XKuala Lemal 0.72 - 0.60 0.55 1.02 3.15 XAlor Pasir - - 1.39 - 1.45 XKubang Gadong 0.34 0.93 0.57 1.30 0.24 3.55 XKubang Sepat - 0.98 2.24 1.24 0.38 5.15 XBunut Susu 1.03 0.47 1.30 - - 2.71 XPasir Mas 0.36 0.33 0.30 - 0.25 1.25 X
TUMPAT Pengkalan Kubor 0.37 0.34 0.31 - - 0.99 XTumpat 0.39 0.71 1.96 0.60 - 3.75 XSungai Pinang 2.32 - 3.52 0.72 0.33 6.93 XJal Besar - - 2.58 - 0.43 3.23 XTerbok 0.96 2.20 4.04 0.37 0.34 8.00 XKebakat - 1.93 5.32 0.41 0.37 8.32 XWakaf Bharu 1.81 0.71 5.22 2.39 0.18 10.66 X
1):Endemic category: Occurrence of cases in the area for 5 years; 1-2 (L-low), 3-4 (M -moderate) and 5 (H-high).
917
FIGURE 4(a) Overall hotspots from 2003-2007, (b) hotspot clusters distribution in relation to the population census and(c) cluster distribution in relation to the percentage of treated water usage in the population census block
(a)
(b)
(c)
918
The study has several limitations which may be addressed by future research. First, the assumption made was that the cases in each cluster could be related to each other. Future typhoid research may verify this through molecular studies. We did not include the subclinical cases and those unreported cases in this study. There was also limited information on the socioeconomic and behavioural information from the registry which should be included in the future survey. Finally the healthy carrier that plays important role in the transmission of typhoid disease was not determined nor captured by our surveillance data. This is also an important area for future research in typhoid. In order to reduce the typhoid cases incidence and endemicity in this area, control programs should be
directed towards these clusters if not the whole endemic area. Further studies should look into the characteristics of these clusters, molecular epidemiology and also the impact of a chronic carrier in the community so that the prevention strategies could be more focused.
REFERENCES
Bhan, M.K., Bahl, R. & S. Bhatnagar 2005. Typhoid and paratyphoid fever. Lancet 366(9487): 749-62.
Bhutta, Z.A. 2006. Typhoid Fever: Current Concepts. Infectious Diseases in Clinical Practice 14(5): 266-272.
Crump, J.A., Luby, S.P. & Mintz, E.D. 2004. The global burden of typhoid fever. Bulletin World Health Organization 82(5): 346-53.
TABLE 3: Results for cluster analysis using nearest neighbourhood method
year r value z value p value2003 0.472 -15.041 0.0012004 0.735 -4.145 0.0012005 0.319 -35.095 0.0012006 0.548 -8.415 0.0012007 0.578 -8.273 0.001
TABLE 4. Association between the treated water ratio and flood risk area and cases cluster
Cluster of casesyes No p-value*
Treated water ratio Less than 70% 207 (23.0%) 692 (77.0%) 0.866More than 70% 74 (23.5%) 241 (76.5%)
Flood risk area yes 31 (17.8%) 143 (82.2%) 0.072No 250 (24.0%) 790 (76.0%)
*chi-square p-value
FIGURE 5. Flood risk area and the typhoid cases
919
Gasem, M. H., Dolmans, W. M. Keuter, M. M. & Djokomoeljanto, R. R. 2001. Poor food hygiene and housing as risk factors for typhoid fever in Semarang, Indonesia. Trop. Med. Int. Health 6(6): 484-90.
Hinman, S., Blackburn, J. & Curtis, A. 2006. Spatial and temporal structure of typhoid outbreaks in Washington, D.C., 1906-1909: evaluating local clustering with the Gi* statistic. International Journal of Health Geographics 5(1): 13.
Jofre, J., Blanch, A. & Lucena, F. 2010. Water-Borne Infectious Disease Outbreaks Associated with Water Scarcity and Rainfall Events. In Water Scarcity in the Mediterranean 8: 147-159, edited by S. Sabater & D. Barceló Berlin / Heidelberg: Springer.
Levine, N. 2010. CrimeStat III: A Spatial Statistics Program for the Analysis of Crime Incident Locations (version 3.3). Ned Levine & Associates: Houston, TX. National Institute of Justice: Washington, DC.
Lin, F. y., Vo, A. H. Phan, V. B. Nguyen, T. T. Bryla, D. Tran, C. T. Ha, B. K. Dang, D. T. & Robbins, J. B. 2000. The epidemiology of typhoid fever in the Dong Thap Province, Mekong Delta region of Vietnam. Am. J. Trop. Med. Hyg. 62(5): 644-8.
McLeod, K. S. 2000. Our sense of Snow: the myth of John Snow in medical geography. Social Science & Medicine 50(7-8): 923-935.
Minis t ry of Heal th Malaysia . 2007. Incidence of Notifiable Communicable Diseases in Malaysia for 1990-2006. http://www.dph.gov.my/survelans/Statistik/incidenceofnotifiablecdc90-2006.pdf [12 November 2008].
Mochammad Hatta, Mirjam Bakker, Stella van Beers, Theresia H. Abdoel & H. L. Smits 2009. Risk Factors for Clinical Typhoid Fever in Villages in Rural South-Sulawesi, Indonesia. International Journal of Tropical Medicine 4(3): 91 - 99.
Mulligan, T.O. 1971. Typhoid Fever in young Children. British Medical Journal 4(5788): 665-667.
Nazarudin, S., Shamsul, A. S. Shaharudin, I. & Wan Mansor, H. 2008. Cluster analysis of typhoid cases in Kota Bharu, Kelantan, Malaysia Medical Journal of Indonesia 7(3): 175 - 182.
Ochiai, R. L., Acosta, C. J. Danovaro-Holliday, M. C. Baiqing, D. Bhattacharya, S. K. Agtini, M. D. Bhutta, Z. A. Canh do, G. Ali, Shin, M. S. Wain, J. Page, A. L. Albert, M. J. Farrar, Abu-Elyazeed, J. R. Pang, T. Galindo, C. M. von Seidlein, L. & Clemens, J. D. 2008. A study of typhoid fever in five Asian countries: disease burden and implications for controls. Bull. World Health Organ. 86(4): 260-8.
Sasaki, S., Suzuki, H. Igarashi, K. Tambatamba, B. & Mulenga, P. 2008. Spatial Analysis of Risk Factor of Cholera Outbreak for 2003–2004 in a Peri-urban Area of Lusaka, Zambia. The American Journal of Tropical Medicine and Hygiene 79(3): 414-421.
Sharma, P. K., Ramakrishnan, R. Hutin, y. Manickam, P. & Gupte, M. D. 2009. Risk factors for typhoid in Darjeeling, West Bengal, India: evidence for practical action. Trop. Med. Int. Health 14(6): 696-702.
Stroffolini, T., Manzillo, G. De Sena, R. Manzillo, E. Pagliano, P. Zaccarelli, M. Russo, M. Soscia, M. & Giusti, G. 1992. Typhoid fever in the Neapolitan area: a case-control study. Eur. J. Epidemiol. 8(4): 539-42.
Sur, D., Ali, M. von Seidlein, L. Manna, Deen, B. J. Acosta, Clemens, C. J. & Bhattacharya, S. 2007. Comparisons of predictors for typhoid and paratyphoid fever in Kolkata, India. BMC Public Health 7(1): 289.
Tran, H. H., Bjune, G. Nguyen, B.M. Rottingen, J. A. Grais, R. F. & Guerin, P.J. 2005. Risk factors associated with typhoid fever in Son La province, northern Vietnam. Transactions of the Royal Society of Tropical Medicine and Hygiene 99(11): 819-826.
Velema, J. P., van Wijnen, G. Bult, P. van Naerssen, T. & Jota, S. 1997. Typhoid fever in Ujung Pandang, Indonesia--high-risk groups and high-risk behaviours. Trop. Med. Int. Health 2(11): 1088-94.
World Health Organization. 2008. Typhoid vaccines: WHO position paper. Weekly Epidemiological Record. 8 February pp. 49–60.
Shamsul Azhar Shah*, Mohd Rohaizat Hassan & Nazarudin SafianDepartment of Community HealthFaculty of MedicineUniversiti Kebangsaan MalaysiaJalan yaacob LatiffBandar Tun Razak56000 CherasKuala Lumpur Malaysia
Hiroshi SuzukiDepartment of NursingNiigata Seiryo UniversityNiigata, Japan
Reiko SaitoDepartment of Infectious Disease Control and International Medicine Graduate School of Medical and Dental SciencesNiigata University, Niigata, Japan
Shaharudin IdrusInstitute for Environment and Development (LESTARI)Universiti Kebangsaan Malaysia43600 UKM, Bangi, Selangor D. E., Malaysia
*Corresponding author; email: [email protected]
Received: 3 August 2011Accepted: 21 February 2012