Embed Size (px)
Citation preview
AQUACULTURE ENVIRONMENT INTERACTIONSAquacult Environ Interact
Vol. 2: 239–252, 2012doi: 10.3354/aei00042
Published online June 25
INTRODUCTION
The impact of human activities on marine ecosys-tems extends around the world. A recent global studyrevealed that no area is unaffected by human influ-ences and that a considerable proportion (41%) isheavily affected by multiple drivers (Halpern et al.2008). Coastal areas in particular are being impactedby a wide variety of human activities as a conse-quence of the pressures of population growth (Bur-bridge 1999). Aquaculture is an activity that has beenexpanding rapidly in recent years due to the world-
wide demand for seafood. This anthropogenic activ-ity generates new feeding grounds for wild fish pop-ulations in the littoral zone. Several studies haveshown that fish farms attract wild fish in their nearvicinity, thereby altering natural distribution patterns(e.g. Carss 1990, Dempster et al. 2002, Boyra et al.2004). Apart from high food availability, the presenceof an artificial structure and the chemical attractionto farmed fish have been put forward as influencescontributing to this aggregation effect (Tuya et al.2006). The physiological consequences of this newfood source on local fish populations are still unclear
© Inter-Research 2012 · www.int-res.com*Email: [email protected]
Spatial and temporal extension of wild fish aggregations at Sparus aurata and Thunnus thynnus
farms in the north-western Mediterranean
Kathrin Bacher1,*, Ana Gordoa1, Oscar Sagué2
1Centro de Estudios Avanzados de Blanes (CEAB-CSIC), 17300 Blanes, Spain2Federació Catalana d’Activitats Subaquàtiques, 08930 Sant Adrià del Besòs, Spain
ABSTRACT: Fish farms cause wild fish to aggregate nearby and thus act to modify their distribu-tion, but the spatial and temporal extent of the attraction effect around farms is still poorly under-stood. We examined attraction using an integrated approach combining 3 factors: spatial extent,depth and season. We analysed an Atlantic bluefin tuna Thunnus thynnus (ABT) and a giltheadseabream Sparus aurata (SB) farm off the north-eastern coast of Spain which represent differentfish farming models in the Mediterranean. Underwater visual counts were conducted from sum-mer 2010 to spring 2011. We recorded 39 species at the SB farm and 17 species at the ABT farm.The analysis of fish abundance and biomass at 3 stations located along a distance gradient fromthe farm (SB: 0, 30, 200 m; ABT: 0, 100, 200 m) showed significantly higher values next to the cagesthan at more distant stations, revealing that the spatial extent of the attraction effect was mainlyrestricted to the cage rather than following a gradient. The intensity of the cage effect variedaccording to farm, season and depth, reflecting species-specific behaviours. At the SB farm, thecage effect persisted year round, varying with depth, whereas at the ABT farm, the effect was onlydetected in summer and spring. These distinct spatial and temporal aggregation patterns suggestthat implementation of fishery regulatory measures to protect wild fish should be farm-specific.This study emphasizes the importance of using an integrated approach to study wild fish aggre-gations at farms.
KEY WORDS: Sea-cage · Aquaculture · Wild fish · Attraction effect · Sparus aurata · Thunnus thynnus · Mediterranean
Resale or republication not permitted without written consent of the publisher
OPENPEN ACCESSCCESS
Aquacult Environ Interact 2: 239–252, 2012
(Fernandez-Jover et al. 2011). A recent study hasshown that farms do not seem to negatively affectwild fish species like saithe Pollachius virens andAtlantic cod Gadus morhua but rather act to enhancethe body condition of farm-associated fish (Dempsteret al. 2011). In parallel, consumption of lost food bywild fish may buffer the environmental impact on thebenthos underneath farms (e.g. Lupatsch et al. 2003,Vita et al. 2004). Therefore, it has been argued thatfish harvesting should be avoided in the vicinity offarms (Dempster et al. 2006), in order to fully benefitfrom the recycling function of wild fish. However, thespatial extent of fish aggregations around farms hasbeen poorly studied to date. Previous work hasexamined differences between farms and distantcontrol locations (e.g. Dempster et al. 2002, Boyra etal. 2004) and only recently has the distance factorbeen examined in the vicinity of Norwegian salmonfarms (Dempster et al. 2010).
The natural distribution of fish populations in thelittoral zone is influenced by different factors, such asdepth (Bell 1983, García-Charton & Pérez-Ruzafa1998) and habitat structure (Letourneur et al. 2003,Lombarte et al. 2012), which influence the type anddistribution of food and shelter (García-Charton &Pérez-Ruzafa 2001). Depth has also been identifiedas an important factor determining spatial patterns offish aggregations at fish farms (Dempster et al. 2005,Sudirman et al. 2009). In addition, previous studieshave shown that the species composition of fishaggregations at farms changes with the season (Valleet al. 2007, Fernandez-Jover et al. 2008), indicating
species-specific residence times at farms. Althoughthe spatial and temporal variability of farms has beenstudied previously, no systematic approach to assessthe spatial and temporal extent of the attractioneffect has yet been undertaken. An understanding ofwhether this attraction persists across seasons, how itchanges with time, and what spatial distances anddepths are reached is essential. Despite the growingnumber of publications on the variability of wild fishaggregations at fish farms which have taken differ-ent factors into account (Table 1), an integratedanalysis is currently lacking. This study is intended tobegin filling this gap by putting forward a compre-hensive approach that analyses and combines themain factors known to influence wild fish aggrega-tions, namely spatial extent, depth and season.Determining these factors has implications for futureregulatory measures to be implemented for fish farms.The specific objectives of this study were to examinethe horizontal spatial attraction range along a dis-tance gradient away from the farm for each depth,and to investigate temporal variability.
Sampling was carried out at 2 fish farms that repre-sent different fish farming models in the Mediterran-ean Sea: an Atlantic bluefin tuna Thunnus thynnus(ABT) farm and a gilthead seabream Sparus aurata(SB) farm. Gilthead seabream has been culturedextensively for many years throughout the Mediter-ranean (FAO 2008), and ABT capture-based aqua-culture, known as fattening farms, have developedrapidly and today are present in the waters of 9Mediterranean countries (see www.ICCAT.int).
240
Table 1. Summary of studies that have investigated different factors influencing variation in fish aggregations at marine fish farms. Farmtypes: GR/RA = mixed groupers (Epinephelus fuscoguttatus and Cromileptes altivelis) and rabbitfish Siganus spp., SB/ESB = mixed gilt-head seabream Sparus aurata and European seabass Dicentrarchus labrax, WSB = white seabass Atractoscion nobilis, ABT = Atlanticbluefin tuna Thunnus thynnus, AS = Atlantic salmon Salmo salar. Depths: S = surface, M1 = intermediate cage depth, M2 = between the
cage and the sea bottom, AB = above bottom, B = bottom
Study No. Factors Farm Sampling sites Sampling depths Sampling Sourcelocation farms type period
Spain 9 Distance between farms SB/ESB Cage, 200 m Integrated (5−10 m) Sep/Oct Dempster et al. (2002)Spain 5 Depth SB/ESB Cage S, M1, M2, B Oct/Nov Dempster et al. (2005)Norway 9 Depth AS Cage, 1−2 km S, M1, M2, AB, B Summer Dempster et al. (2009)Indonesia 1 Depth, time of day GR/RA Cage 1−3, 3−6, 6−9, >9 m Dec−Apr Sudirman et al. (2009)USA 1 Depth, season WSB Cage, 200 m S, M1, B 1 yr Oakes & Pondella (2009)Spain 1 Season SB/ESB Cage, 200 m Integrated (5−10 m) 1 yr Valle et al. (2007)Spain 3 Season SB/ESB Cage Integrated (5−10 m) 2 yr Fernandez-Jover et al.
(2008)Canary Isl. 2 Season SB/ESB Cage, 500 m − 1 km Integrated 1 yr Boyra et al. (2004)Croatia 2 Season ABT Cage, 200 m Integrated (0−15 m) 1 yr Šegvic Bubic et al. (2011)Norway 9 Spatial extent AS Cage, 25, 50, 200 m Integrated (5 m−B) Jul/Oct Dempster et al. (2010)Spain 1 Extent, depth, season ABT Cage, 100, 200 m S, M1, M2 1 yr Present studySpain 1 Extent, depth, season SB Cage, 30, 200 m S, M1, B 1 yr Present study
Bacher et al.: Spatio-temporal fish aggregation at fish farms
MATERIALS AND METHODS
Study site and farm characteristics
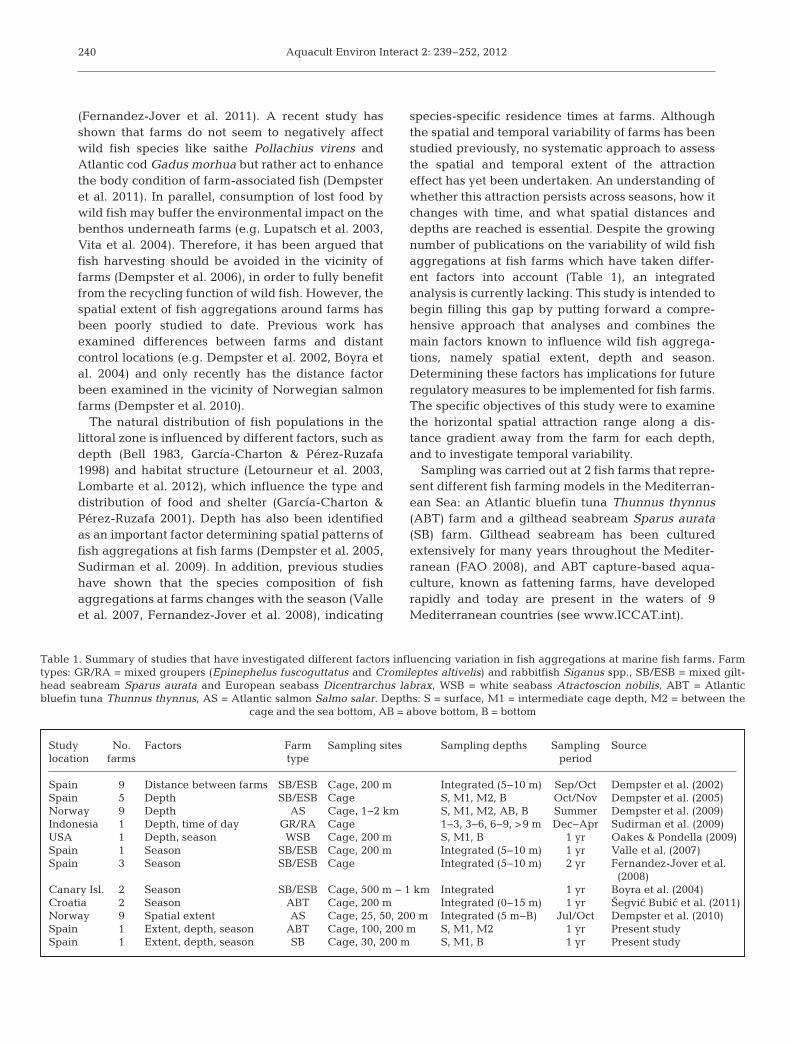
The selected farms are located in the littoral areainfluenced by the Ebro River in the north-westernMediterranean Sea (Fig. 1) off their common homeport of L’Ametlla de Mar (40° 53’ 10’’ N, 0° 48’ 13’’ E).The SB farm is located about 1 km from the coastover a rocky-sandy bottom with a bottom depth of20 m. The farm started operating in 1993, consists of30 circular cages (each 19 m in diameter) with a netdepth of 10 m, and covers a leased area of 400 000 m2.On average, the farm contains 850 t of stocked fishbiomass and produces 800 t of Sparus aurata annu-ally. Farmed fish are fed 2500 t yr−1 of dry food pelletsbased on fish meal and vegetable oil. The ABT farmis located farther offshore (4.5 km) over a mixedgravel-mud-sand bottom with a bottom depth of 45 m.The farm started operating in 2004, and the totalleased area is 300 000 m2. During the study, 2 ovalcages (each 120 × 60 m) and 4 round cages (each50 m in diameter) with a net depth of 30 m were inuse. On average, the farm stocks 700 t of wild adultThunnus thynnus caught in the western Mediterran-ean spawning grounds and reaches an annual pro-duction of about 990 t. The tunas are exclusively fedwith frozen fish (5700 t yr−1) such as Atlantic mack-erel Scomber scombrus, round sardinella Sardinellaaurita, Eu ropean pilchard Sardina pilchardus andAtlantic herring Clupea harengus.
Water temperature and visibility
Temperature and underwater visibility displayedhigh variability during the study period. Water tem-perature at the 2 farms ranged from a minimum of12.3°C in winter to a maximum of 25.5°C in summer.Underwater visi bility varied greatly from one day toanother, and values were often low, which was ex-pected due to the influence of the Ebro River runoff(Cruzado et al. 2002, Gordoa et al. 2008). The minimumand maximum visibility over the year ranged from 5 to20 m, with lowest visibilities near the bottom duringcold months and highest visibilities at the surface andmidwater in summer and spring. Sampling was onlyconducted on days with at least 5 m of visibility.
Sampling design
Wild fish at both fish farms were counted by meansof an underwater visual census (UVC). The spatialhorizontal design at each farm comprised 3 fixedsampling stations located along a distance gradientfrom the farm within each farming concession area.The 3 sampling stations were chosen according to thedifferent spatial dimensions of the cages (Fig. 2). Stations were: (1) cage: right next to one of the cages(distance 0 m), (2) border: off the edge of the cages(distance: SB farm 30 m, ABT farm 100 m) and (3)
241
Fig. 1. Study stations adjacent to the Ebro River Delta off thenorth-eastern coast of Spain. SB: gilthead seabream, ABT:
Atlantic bluefin tuna
Fig. 2. Layout of the (a) gilthead seabream farm and (b) theAtlantic bluefin tuna (ABT) farm with corresponding sam-pling stations. Xs indicate the positions of the 3 types of sam-
pling stations (cage, border, limit)
Aquacult Environ Interact 2: 239–252, 2012
limit: at the boundary of the leasehold area (distance:200 m). The 3 stations at each farm had the same eco-logical features: depth, bottom type and distance tothe shore. Visual surveys at each station were per-formed in 3 distinct depth strata: surface (0−3 m),midwater (8−12 m) and deep/bottom (18−20 m). Bot-tom depths varied greatly between the 2 farms, hencethe deep depth stratum was representative of the bot-tom at the SB farm but not at the ABT farm. Due to lo-gistical constraints associated with no-decompressiondiving limits, we chose 20 m, i.e. the bottom depth atthe SB farm, as the depth limit for the UVC.
Sampling was carried out from summer 2010 tospring 2011 on 3 randomly selected days per season. Ateach station, we performed 1 count d−1 depth−1, result-ing in a total of 108 fish counts at each farm. All surveyswere performed during morning hours (8:30 to 12:00 h).The UVC counts were carried out using a methoddeveloped by Dempster et al. (2005) which is robust forcomparisons of counts at different depth levels and atdifferent visibilities. The method depends on stationarytimed counts during which the diver rotates through360°. To standardize the counts, fish are only countedfrom 1 m above to 1 m below eye level out to a radius of5 m. Bottom counts at the SB farm were conductedkneeling on the seafloor and spanned the zone fromthe substrate to 2 m above. Counts lasted 7 min at eachdepth. All UVCs were performed by 2 divers. While thefirst diver concentrated on estimating the abundance ofthe dominant species, the second diver looked for morecryptic species. During the 7 min, the maximum num-ber of individual fish of each species observed at anyone time was recorded. This made it more unlikely tocount the same fish twice. For schools of up to 20 fish,individual fish were counted; for larger shoals, esti-mates were obtained by subdividing the shoals intoimaginary subgroups of equal size, counting the indi-viduals in one of the subgroups and multiplying thatcount by the number of subgroups. The total length ofindividuals was re corded, and the biomass was calcu-lated based on published length− weight relationshipsfor each species (Morey et al. 2003, www.fishbase.org).Mugilidae species could not be identified visually tospecies level and were therefore recorded at the familylevel. Similarly, Trachurus mediterraneus and T. tra-churus were recorded as Trachurus spp.
Statistical analysis
The assumptions of normality and homogeneity ofvariance can often be difficult to fulfil with biologicaldata. A good alternative is the analysis of variance
based on permutations (PERMANOVA), as it allowsmultivariate data to be analysed in the context ofcomplex experimental designs and provides a robustapproach to deal with skewed data and many zerocounts (Anderson 2001). Therefore, all univariateand multivariate statistical analyses were carriedout using the PRIMER V6.1.13 computer program(Clarke & Gorley 2006) with the PERMANOVA+V1.0.3 add-on package (Anderson et al. 2008).
Univariate analysis
A univariate PERMANOVA with 3 factors (station,depth, season, all fixed) was performed to test differ-ences in total fish abundance and biomass for eachsite. The similarity matrix was computed using theEuclidean distance on square root-transformed data,and post hoc pairwise comparisons were used toinvestigate significant results. In addition, the num-ber of species per station, depth and season was esti-mated. For direct comparison between the SB andABT farms, the deep stratum at the SB farm, whichrepresents the bottom community unreachable at theABT farm, was excluded.
Multivariate analysis
Permutational multivariate analysis of variance wasused to test the differences in wild fish aggregations atthe different stations, depth strata and seasons (PERM-ANOVA, Anderson 2001, Anderson et al. 2008). Priorto analysis, the data were fourth-root transformed inorder to downweight the influence of more abundantspecies, whilst preserving information on relativeabundance (Clarke & Green 1988). Since the Bray-Curtis similarity measure is undefined for 2 emptysamples, we used the zero-adjusted Bray-Curtis forwhich a ‘dummy species’ is added to the originalabundance matrix in order to generate meaningfulnon-metric multidimensional scaling (nMDS) displays(Clarke et al. 2006). nMDS ordinations averaged byseason were produced to depict the multivariate pat-terns of fish aggregations. Statistical significance wastested using 9999 permutations of residuals under areduced model (Freedman & Lane 1983) and Type III(partial) sums of squares (SS; Anderson et al. 2008).Significant terms were further examined by applyingappropriate post hoc pairwise comparisons. We ap-plied the similarity percentage analysis (SIMPER) rou-tine to examine species contributions to within-groupsimilarity for the most important factor at each farm.
242
Bacher et al.: Spatio-temporal fish aggregation at fish farms
RESULTS
Composition of wild fish species
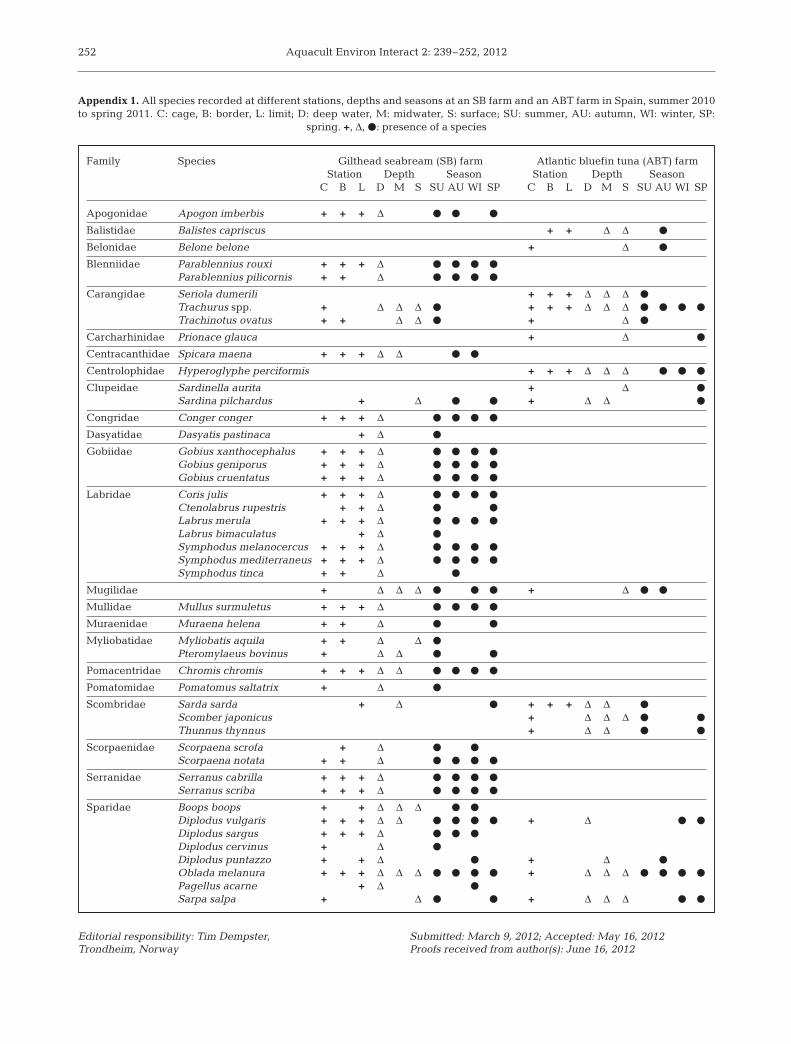
In total, 14 475 individual fish were counted at theSB farm and 5627 at the ABT farm, belonging to47 species and 23 families (Appendix 1). The vastmajority of the species were Osteichthyes, only 4being Chondrichthyes, including 3 species of raysand 1 blue shark Prionace glauca. In all, 39 species(17 families) were recorded at the SB farm andperipheral stations, the most common families beingSparidae (8 species) and Labridae (7 species). At theABT farm and peripheral stations, 17 species belong-ing to 9 different families were observed, the mostcommon being Sparidae (4 species) followed by Clu-peidae (3 species) and Carangidae (3 species). Thecensuses included 2 unusual sightings in the Medi-terranean, the barrelfish/driftfish Hyperoglyphe per-ciformis and the blue shark. Forty of the observedspecies are targeted by local fishermen. The numberof species was higher at the cage than at the borderand limit stations at both farms (Appendix 1).
SB farm
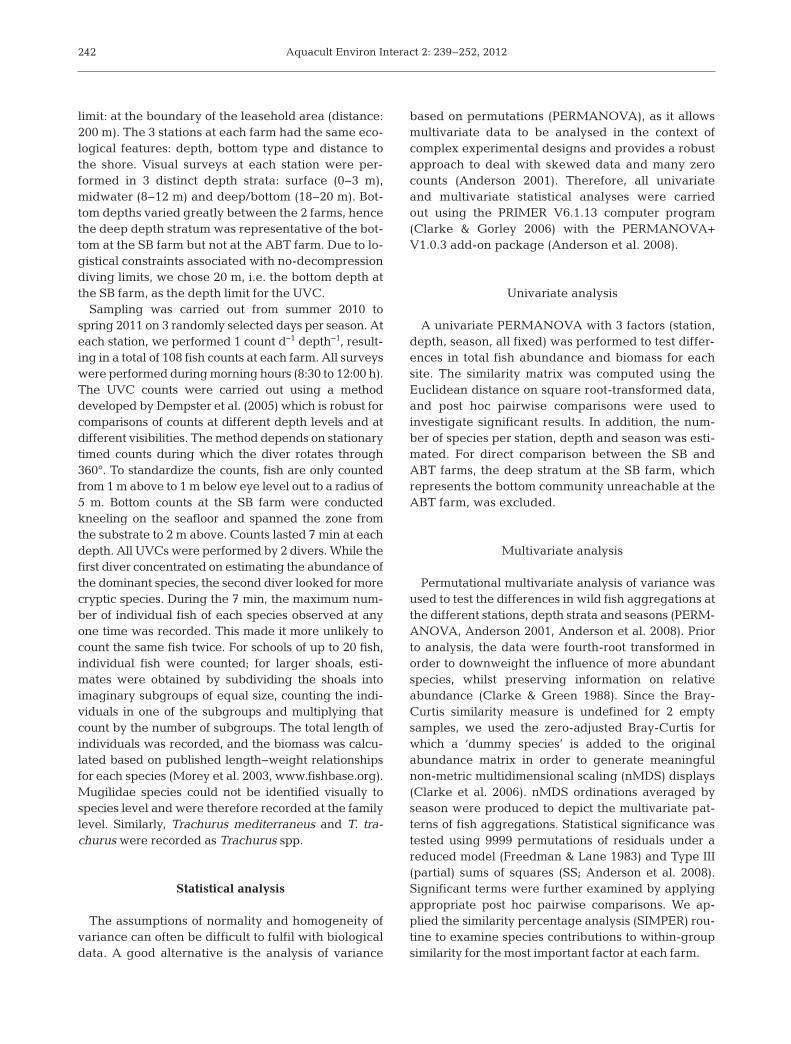
Fish were significantly more abundant at the cagecompared to the border and the limit stations (mean± SE abundance; cage: 240 ± 30,border: 73 ± 20, limit: 97 ± 28;Table 2, Fig. 3a). Similarly, biomassvalues were substantially higher atthe cage compared to the borderand the limit (mean ± SE biomassin kg; cage: 73.4 ± 16.6, border:2.7 ± 1.2, limit: 1.3 ± 0.4; Table 2,Fig. 3b). However, the fish dis -tribution was not homogeneousacross depths. Significant differ-ences in abundance and biomassat the cage compared to the borderand the limit were only observedin the midwater and surface strata.At the bottom, abundance and bio-mass did not vary between thecage and the border but were sig-nificantly higher than at the limit(Fig. 3a,b). Overall, fish were moreabundant at the bottom comparedto the midwater (3 times; p < 0.001)and surface strata (2.4 times; p <0.001; Table 2), although total fish
biomass did not differ among depths (Fig. 3a,b). Fishabundance and biomass at the cage did not vary byseason except in autumn, when small species weremost abundant, resulting in significantly lower bio-mass values at that time of year. The higher abun-dance and biomass observed at the cage was con-stant all year round, except in autumn, when fishabundance at the cage was not significantly higherthan at the limit (Fig. 3c,d, Table 2, triple interaction).Fish abundance at the limit revealed a different sea-sonal pattern compared to the other stations, attain-ing the highest values in summer and autumn andthe lowest values in winter and spring (Fig. 3c).
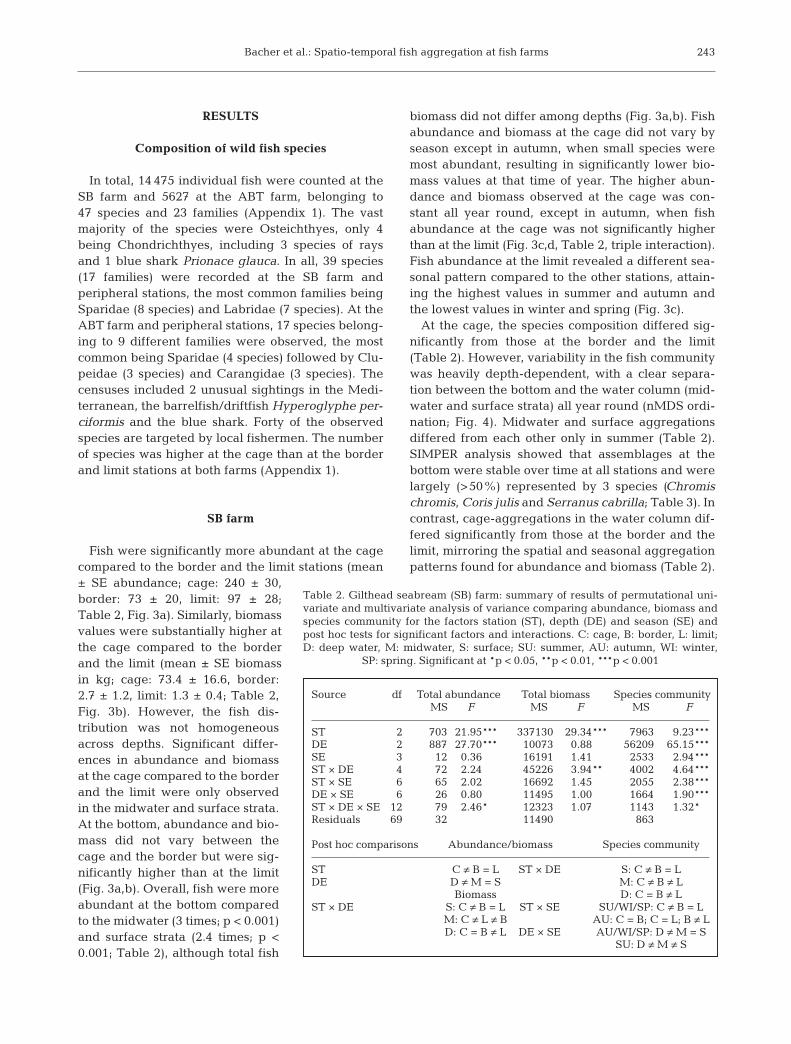
At the cage, the species composition differed sig-nificantly from those at the border and the limit(Table 2). However, variability in the fish communitywas heavily depth-dependent, with a clear separa-tion between the bottom and the water column (mid-water and surface strata) all year round (nMDS ordi-nation; Fig. 4). Midwater and surface aggregationsdiffered from each other only in summer (Table 2).SIMPER analysis showed that assemblages at thebottom were stable over time at all stations and werelargely (>50%) represented by 3 species (Chromischro mis, Coris julis and Serranus cabrilla; Table 3). Incontrast, cage-aggregations in the water column dif-fered significantly from those at the border and thelimit, mirroring the spatial and seasonal aggregationpatterns found for abundance and biomass (Table 2).
243
Source df Total abundance Total biomass Species communityMS F MS F MS F
ST 2 703 21.95*** 337130 29.34*** 7963 9.23***DE 2 887 27.70*** 10073 0.88 56209 65.15***SE 3 12 0.36 16191 1.41 2533 2.94***ST × DE 4 72 2.24 45226 3.94** 4002 4.64***ST × SE 6 65 2.02 16692 1.45 2055 2.38***DE × SE 6 26 0.80 11495 1.00 1664 1.90***ST × DE × SE 12 79 2.46* 12323 1.07 1143 1.32*Residuals 69 32 11490 863
Post hoc comparisons Abundance/biomass Species community
ST C ≠ B = L ST × DE S: C ≠ B = LDE D ≠ M = S M: C ≠ B ≠ L
Biomass D: C = B ≠ LST × DE S: C ≠ B = L ST × SE SU/WI/SP: C ≠ B = L
M: C ≠ L ≠ B AU: C = B; C = L; B ≠ LD: C = B ≠ L DE × SE AU/WI/SP: D ≠ M = S
SU: D ≠ M ≠ S
Table 2. Gilthead seabream (SB) farm: summary of results of permutational uni-variate and multivariate analysis of variance comparing abundance, biomass andspecies community for the factors station (ST), depth (DE) and season (SE) andpost hoc tests for significant factors and interactions. C: cage, B: border, L: limit;D: deep water, M: midwater, S: surface; SU: summer, AU: autumn, WI: winter,
SP: spring. Significant at *p < 0.05, **p < 0.01, ***p < 0.001
Aquacult Environ Interact 2: 239–252, 2012
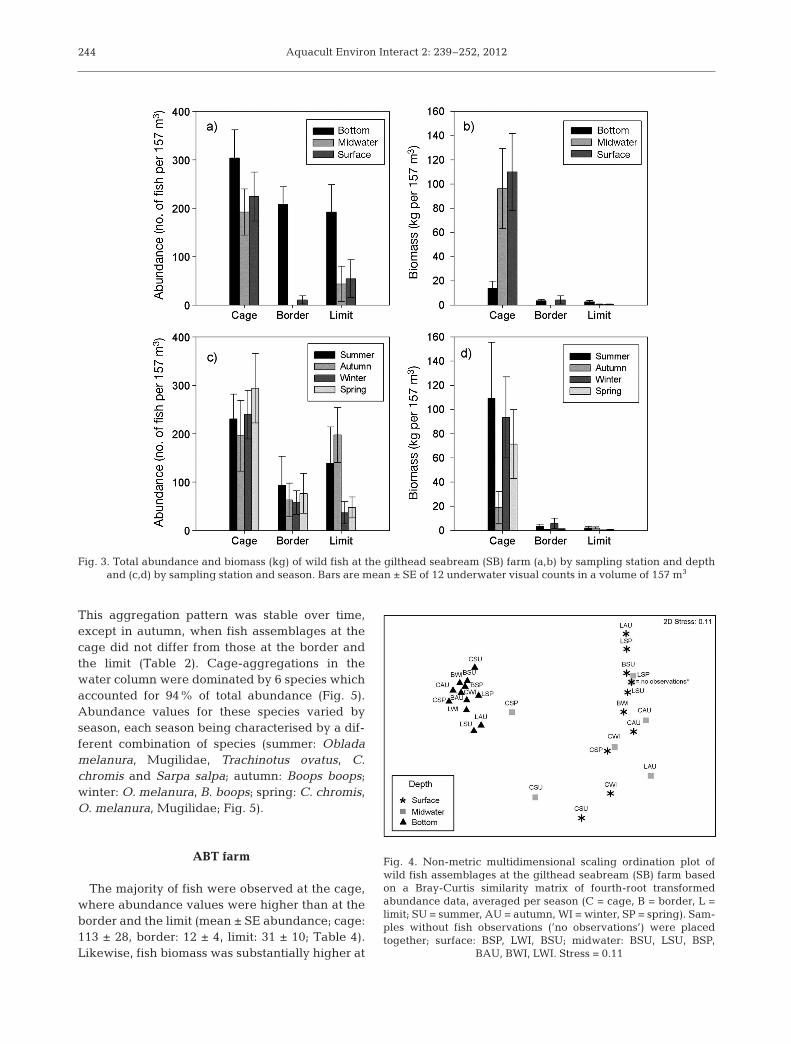
This aggregation pattern was stable over time,except in autumn, when fish assemblages at thecage did not differ from those at the border andthe limit (Table 2). Cage-aggregations in thewater column were dominated by 6 species whichaccounted for 94% of total abundance (Fig. 5).Abundance values for these species varied byseason, each season being characterised by a dif-ferent combination of species (summer: Obladame lanura, Mugilidae, Trachinotus ovatus, C.chro mis and Sarpa salpa; autumn: Boops boops;winter: O. melanura, B. boops; spring: C. chromis,O. melanura, Mugilidae; Fig. 5).
ABT farm
The majority of fish were observed at the cage,where abundance values were higher than at theborder and the limit (mean ± SE abundance; cage:113 ± 28, border: 12 ± 4, limit: 31 ± 10; Table 4).Likewise, fish biomass was substantially higher at
244
Fig. 3. Total abundance and biomass (kg) of wild fish at the gilthead seabream (SB) farm (a,b) by sampling station and depth and (c,d) by sampling station and season. Bars are mean ± SE of 12 underwater visual counts in a volume of 157 m3
Fig. 4. Non-metric multidimensional scaling ordination plot ofwild fish assemblages at the gilthead seabream (SB) farm basedon a Bray-Curtis similarity matrix of fourth-root transformedabundance data, averaged per season (C = cage, B = border, L =limit; SU = summer, AU = autumn, WI = winter, SP = spring). Sam-ples without fish observations (’no observations’) were placed together; surface: BSP, LWI, BSU; midwater: BSU, LSU, BSP,
BAU, BWI, LWI. Stress = 0.11
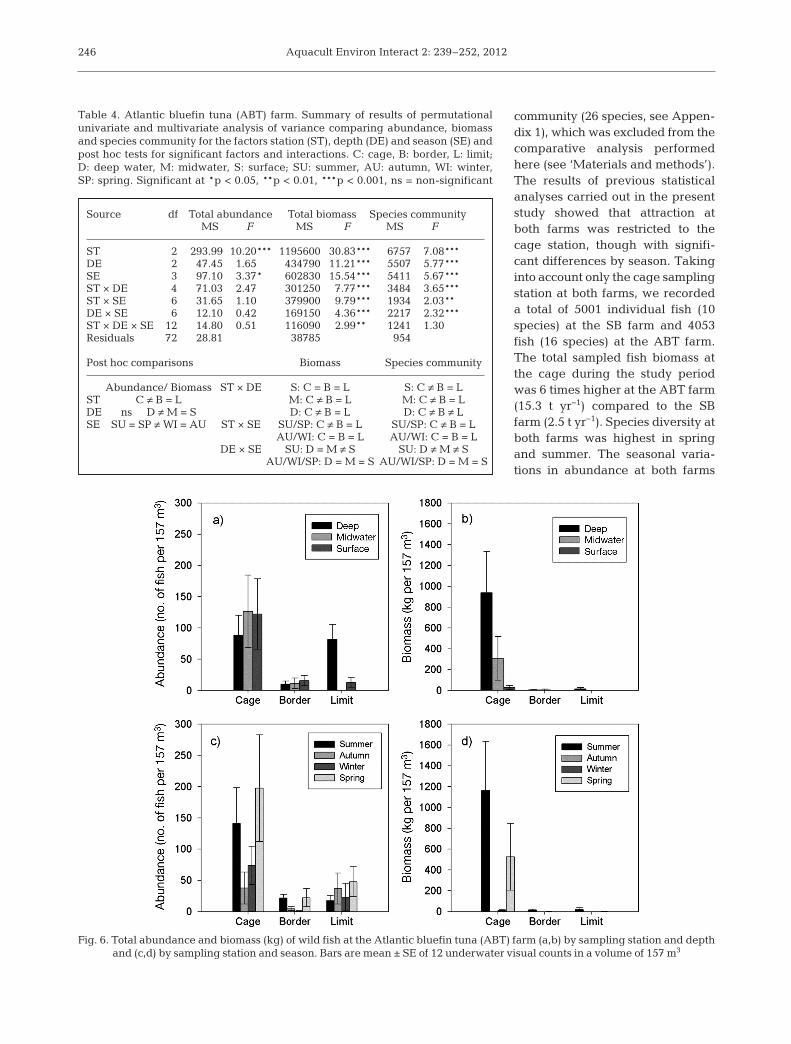
the cage compared to the border and the limit (mean± SE biomass in kg; cage: 424.8 ± 158.4, border: 4.2 ±2.3, limit: 5.1 ± 4.3, p < 0.001; Table 4, Fig. 6a,b).Abundance and biomass at the cage varied signifi-cantly with season (Table 4), with higher values insummer and spring compared to autumn and winter(Fig. 6c,d). Indeed, fish biomass was strongly af -fected by seasonality, and as a consequence higherbiomass values at the cage compared to the borderand the limit were only detectable in summer andspring (Fig. 6d) and were restricted to the deep andmidwater strata (significant interactions, Table 4,Fig. 6b). Overall, the highest fish biomass was re -corded for the deep and midwater strata. However,these high values only occurred in summer, due tothe presence of wild Thunnus thynnus which con-tributed 94.3% to the total fish biomass recorded inthis season. During the rest of the year, no differ-ences were recorded among depths (Table 4).
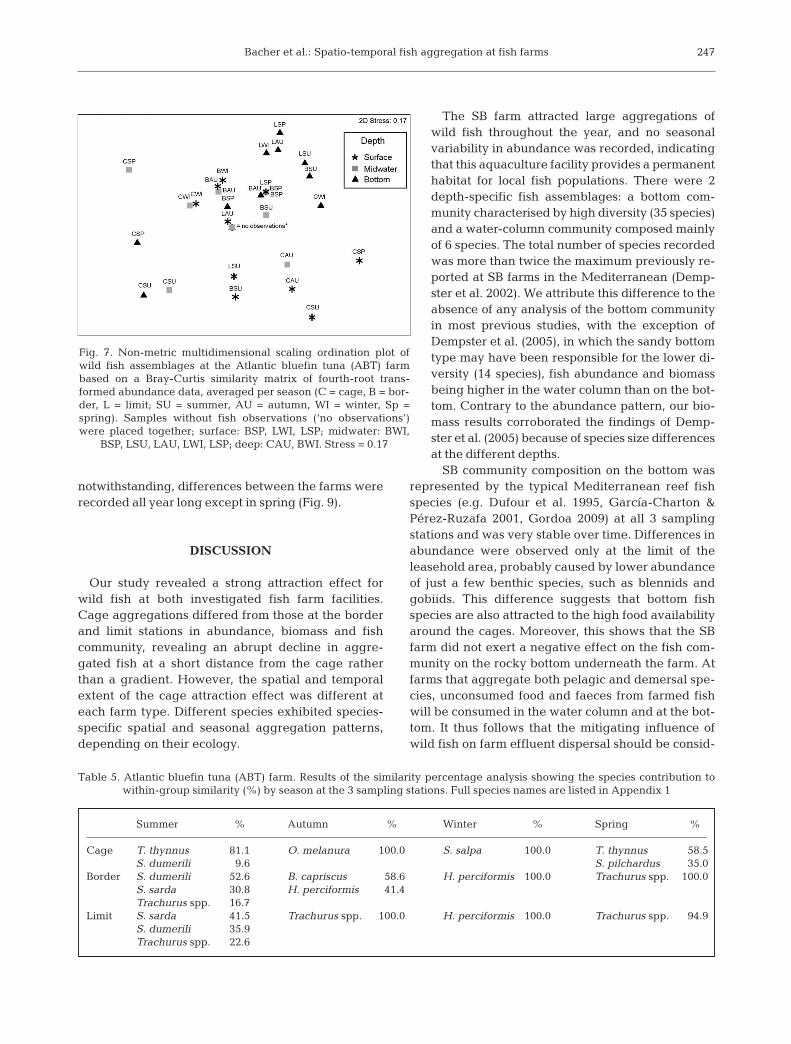
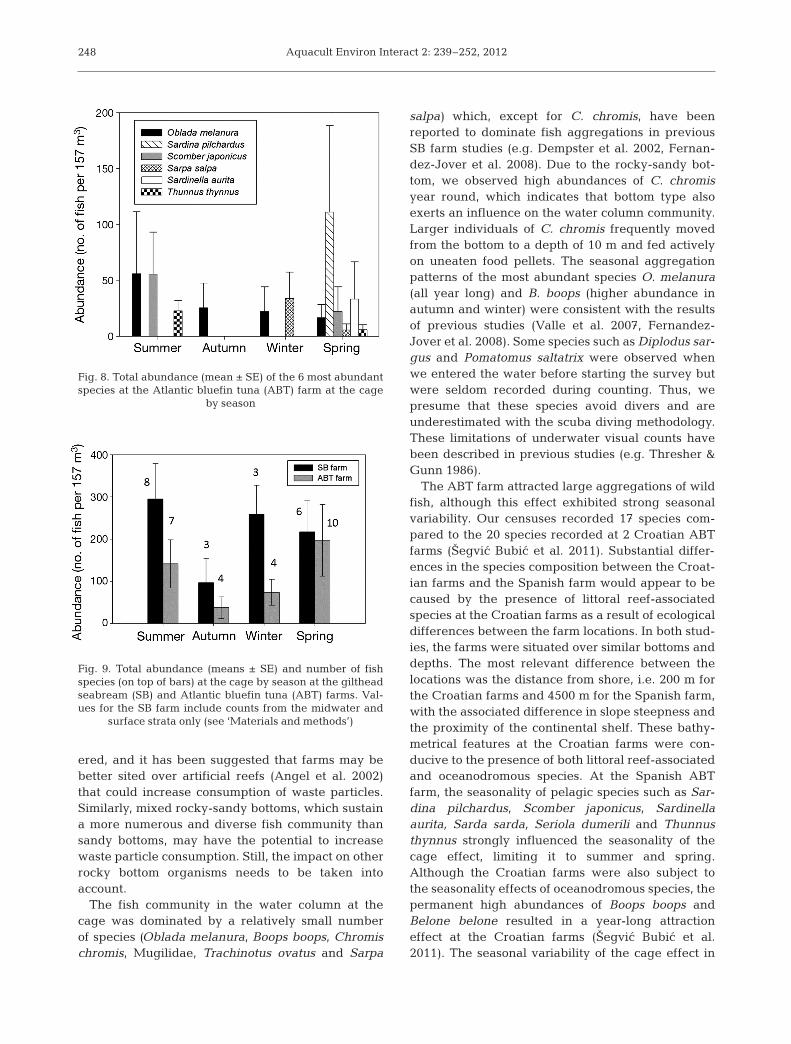
Wild fish communities at the cage differed signifi-cantly from those at the border and the limit in all 3depth strata (Table 4). SIMPER analysis revealedthat cage assemblages consisted mainly of 4 species(Thunnus thynnus, Oblada melanura, Sarpa salpa andSardina pilchardus), which accounted for 91% of thegroup similarity. By contrast, fish aggregations at theborder and the limit were dominated by Trachurusspp. (59%), Hyperoglyphe perciformis (22%) and Seriola dumerili (10%). The separation of the cage aggregations from the border and limit aggregationswas confirmed by the nMDS ordination, but there wasno clear interpretation for samples by depth and sea-son (Fig. 7). Differences in fish aggregation patternswere only observed during summer and spring, whilein autumn and winter, fish assemblages were station-independent (Table 4). Assemblages at the cage insummer and spring were clearly dominated by T.thynnus. Conversely, T. thynnus was never recordedat either the border or limit stations (Table 5). In au-tumn and winter, fish as semblages at the 3 stationswere mainly composed of different s pecies (Table 5).Assemblages at different depths did not differ by sea-son except in summer, when there was a different pre-dominant species at each depth (surface: S. dumerili,midwater: T. thynnus, deep: Sarda sarda). At the cage,each season exhibited a different species prevalence(summer: O. melanura, Scomber japonicus, T. thynnus;autumn: O. melanura; winter: O. melanura, S. salpa;spring: O. melanura, S. pilchardus, S. japonicus, S.salpa, Sardinella aurita, T. thynnus), which togetheraccounted for 91% of total fish abundance (Fig. 8).
Inter-farm differences
The greater species diversity and fish abundancerecorded at the SB farm was ascribable to the bottom
Bacher et al.: Spatio-temporal fish aggregation at fish farms 245
Cage % Border % Limit %
Surface O. melanura 83.0 All similarities are zero S. pilchardus 100.0B. boops 10.1
Midwater C. chromis 39.3 No species observed B. boops 100.0Mugilidae 27.5O. melanura 23.8
Bottom C. chromis 32.0 C. chromis 33.1 C. chromis 34.0S. cabrilla 17.1 C. julis 19.4 C. julis 23.7C. julis 16.9 S. cabrilla 14.0 D. vulgaris 16.1G. xanthocephalus 7.4 S. scriba 12.8 S. cabrilla 12.9P. pilicornis 7.1 D. vulgaris 8.0 O. melanura 3.9S. scriba 5.0 G. xanthocephalus 4.3P. rouxi 4.1D. vulgaris 4.1
Table 3. Gilthead seabream (SB) farm. Results of the similarity percentage analysis showing the species contribution to within-group similarity (%) by sampling station and depth stratum. Full species names are listed in Appendix 1
Fig. 5. Total abundance (mean ± SE) of the 6 most abundantspecies at the gilthead seabream (SB) farm in the midwater
and surface strata at the cage by season
Aquacult Environ Interact 2: 239–252, 2012
community (26 species, see Appen -dix 1), which was excluded from thecomparative analysis performedhere (see ‘Materials and methods’).The results of previous statisticalanalyses carried out in the presentstudy showed that attraction atboth farms was restricted to thecage station, though with signifi-cant differences by season. Takinginto account only the cage samplingstation at both farms, we recordeda total of 5001 individual fish (10species) at the SB farm and 4053fish (16 species) at the ABT farm.The total sampled fish biomass atthe cage during the study periodwas 6 times higher at the ABT farm(15.3 t yr−1) compared to the SBfarm (2.5 t yr−1). Species diversity atboth farms was highest in springand summer. The seasonal varia-tions in abundance at both farms
246
Source df Total abundance Total biomass Species communityMS F MS F MS F
ST 2 293.99 10.20*** 1195600 30.83*** 6757 7.08***DE 2 47.45 1.65 434790 11.21*** 5507 5.77***SE 3 97.10 3.37* 602830 15.54*** 5411 5.67***ST × DE 4 71.03 2.47 301250 7.77*** 3484 3.65***ST × SE 6 31.65 1.10 379900 9.79*** 1934 2.03**DE × SE 6 12.10 0.42 169150 4.36*** 2217 2.32***ST × DE × SE 12 14.80 0.51 116090 2.99** 1241 1.30Residuals 72 28.81 38785 954
Post hoc comparisons Biomass Species community
Abundance/ Biomass ST × DE S: C = B = L S: C ≠ B = LST C ≠ B = L M: C ≠ B = L M: C ≠ B = LDE ns D ≠ M = S D: C ≠ B = L D: C ≠ B ≠ LSE SU = SP ≠ WI = AU ST × SE SU/SP: C ≠ B = L SU/SP: C ≠ B = L
AU/WI: C = B = L AU/WI: C = B = LDE × SE SU: D = M ≠ S SU: D ≠ M ≠ S
AU/WI/SP: D = M = S AU/WI/SP: D = M = S
Table 4. Atlantic bluefin tuna (ABT) farm. Summary of results of permutationalunivariate and multivariate analysis of variance comparing abundance, biomassand species community for the factors station (ST), depth (DE) and season (SE) andpost hoc tests for significant factors and interactions. C: cage, B: border, L: limit;D: deep water, M: midwater, S: surface; SU: summer, AU: autumn, WI: winter,SP: spring. Significant at *p < 0.05, **p < 0.01, ***p < 0.001, ns = non-significant
Fig. 6. Total abundance and biomass (kg) of wild fish at the Atlantic bluefin tuna (ABT) farm (a,b) by sampling station and depth and (c,d) by sampling station and season. Bars are mean ± SE of 12 underwater visual counts in a volume of 157 m3
Bacher et al.: Spatio-temporal fish aggregation at fish farms
notwithstanding, differences between the farms wererecorded all year long except in spring (Fig. 9).
DISCUSSION
Our study revealed a strong attraction effect forwild fish at both investigated fish farm facilities.Cage aggregations differed from those at the borderand limit stations in abundance, biomass and fishcommunity, revealing an abrupt decline in aggre-gated fish at a short distance from the cage ratherthan a gradient. However, the spatial and temporalextent of the cage attraction effect was different ateach farm type. Different species exhibited species-specific spatial and seasonal aggregation patterns,depending on their ecology.
The SB farm attracted large aggregations ofwild fish throughout the year, and no seasonalvariability in abundance was recorded, indicatingthat this aquaculture facility provides a permanenthabitat for local fish populations. There were 2depth-specific fish assemblages: a bottom com-munity characterised by high diversity (35 species)and a water-column community composed mainlyof 6 species. The total number of species recordedwas more than twice the maximum previously re-ported at SB farms in the Mediterranean (Demp-ster et al. 2002). We attribute this difference to theabsence of any analysis of the bottom communityin most previous studies, with the exception ofDempster et al. (2005), in which the sandy bottomtype may have been responsible for the lower di-versity (14 species), fish abundance and biomassbeing higher in the water column than on the bot-tom. Contrary to the abundance pattern, our bio-mass results corroborated the findings of Demp-ster et al. (2005) because of species size differencesat the different depths.
SB community composition on the bottom wasrepresented by the typical Mediterranean reef fishspecies (e.g. Dufour et al. 1995, García-Charton &Pérez-Ruzafa 2001, Gordoa 2009) at all 3 samplingstations and was very stable over time. Differences inabundance were observed only at the limit of theleasehold area, probably caused by lower abundanceof just a few benthic species, such as blennids andgobiids. This difference suggests that bottom fishspecies are also attracted to the high food availabilityaround the cages. Moreover, this shows that the SBfarm did not exert a negative effect on the fish com-munity on the rocky bottom underneath the farm. Atfarms that aggregate both pelagic and demersal spe-cies, unconsumed food and faeces from farmed fishwill be consumed in the water column and at the bot-tom. It thus follows that the mitigating influence ofwild fish on farm effluent dispersal should be consid-
247
Fig. 7. Non-metric multidimensional scaling ordination plot ofwild fish assemblages at the Atlantic bluefin tuna (ABT) farmbased on a Bray-Curtis similarity matrix of fourth-root trans-formed abundance data, averaged per season (C = cage, B = bor-der, L = limit; SU = summer, AU = autumn, WI = winter, Sp =spring). Samples without fish observations (‘no observations’)were placed together; surface: BSP, LWI, LSP; midwater: BWI,
BSP, LSU, LAU, LWI, LSP; deep: CAU, BWI. Stress = 0.17
Summer % Autumn % Winter % Spring %
Cage T. thynnus 81.1 O. melanura 100.0 S. salpa 100.0 T. thynnus 58.5S. dumerili 9.6 S. pilchardus 35.0
Border S. dumerili 52.6 B. capriscus 58.6 H. perciformis 100.0 Trachurus spp. 100.0S. sarda 30.8 H. perciformis 41.4Trachurus spp. 16.7
Limit S. sarda 41.5 Trachurus spp. 100.0 H. perciformis 100.0 Trachurus spp. 94.9S. dumerili 35.9Trachurus spp. 22.6
Table 5. Atlantic bluefin tuna (ABT) farm. Results of the similarity percentage analysis showing the species contribution to within-group similarity (%) by season at the 3 sampling stations. Full species names are listed in Appendix 1
Aquacult Environ Interact 2: 239–252, 2012
ered, and it has been suggested that farms may bebetter sited over artificial reefs (Angel et al. 2002)that could increase consumption of waste particles.Similarly, mixed rocky-sandy bottoms, which sustaina more numerous and diverse fish community thansandy bottoms, may have the potential to increasewaste particle consumption. Still, the impact on otherrocky bottom organisms needs to be taken intoaccount.
The fish community in the water column at thecage was dominated by a relatively small numberof species (Oblada melanura, Boops boops, Chromischromis, Mugilidae, Trachinotus ovatus and Sarpa
salpa) which, except for C. chromis, have beenreported to dominate fish aggregations in previousSB farm studies (e.g. Dempster et al. 2002, Fernan-dez-Jover et al. 2008). Due to the rocky-sandy bot-tom, we observed high abundances of C. chromisyear round, which indicates that bottom type alsoexerts an influence on the water column community.Larger individuals of C. chromis frequently movedfrom the bottom to a depth of 10 m and fed activelyon uneaten food pellets. The seasonal aggregationpatterns of the most abundant species O. melanura(all year long) and B. boops (higher abundance inautumn and winter) were consistent with the resultsof previous studies (Valle et al. 2007, Fernandez-Jover et al. 2008). Some species such as Diplodus sar-gus and Pomatomus saltatrix were observed whenwe entered the water before starting the survey butwere seldom recorded during counting. Thus, wepresume that these species avoid divers and areunderestimated with the scuba diving methodology.These limitations of underwater visual counts havebeen described in previous studies (e.g. Thresher &Gunn 1986).
The ABT farm attracted large aggregations of wildfish, although this effect exhibited strong seasonalvariability. Our censuses recorded 17 species com-pared to the 20 species recorded at 2 Croatian ABTfarms (Šegvic Bubic et al. 2011). Substantial differ-ences in the species composition between the Croat-ian farms and the Spanish farm would appear to becaused by the presence of littoral reef-associatedspecies at the Croatian farms as a result of ecologicaldifferences between the farm locations. In both stud-ies, the farms were situated over similar bottoms anddepths. The most relevant difference between thelocations was the distance from shore, i.e. 200 m forthe Croatian farms and 4500 m for the Spanish farm,with the associated difference in slope steepness andthe proximity of the continental shelf. These bathy-metrical features at the Croatian farms were con-ducive to the presence of both littoral reef-associatedand oceanodromous species. At the Spanish ABTfarm, the seasonality of pelagic species such as Sar-dina pilchardus, Scomber japonicus, Sardinellaaurita, Sarda sarda, Seriola dumerili and Thunnusthynnus strongly influenced the seasonality of thecage effect, limiting it to summer and spring.Although the Croatian farms were also subject tothe seasonality effects of oceanodromous species, thepermanent high abundances of Boops boops andBelone belone resulted in a year-long attractioneffect at the Croatian farms (Šegvic Bubic et al.2011). The seasonal variability of the cage effect in
248
Fig. 8. Total abundance (mean ± SE) of the 6 most abundantspecies at the Atlantic bluefin tuna (ABT) farm at the cage
by season
Fig. 9. Total abundance (means ± SE) and number of fishspecies (on top of bars) at the cage by season at the giltheadseabream (SB) and Atlantic bluefin tuna (ABT) farms. Val-ues for the SB farm include counts from the midwater and
surface strata only (see ‘Materials and methods’)
Bacher et al.: Spatio-temporal fish aggregation at fish farms
the present study was mainly attributable to the sea-sonal occurrence of T. thynnus. The presence of this species during summer-spring and its absence inautumn-winter can be explained by its spawningseason and migratory pattern (Rooker et al. 2007).Nevertheless, the presence of T. thynnus around theABT farm continued at least until December in 2011(pers. com. of the Balfegó Group, L’Ametlla de Mar,Spain, outside the study period). The attraction ofwild T. thynnus to ABT farms is beginning to elicit anew scientific topic, namely, whether farms couldalter T. thynnus migration patterns. At the ABT farminvestigated in the present study, no escapementever occurred, and the closest ABT farm facilities areat a distance of ~550 km (Cartagena, Spain), hence;the possibility that the observed individuals of T.thynnus were feral animals that escaped from a farmwas considered very small. The present study alsoyielded some additional information from the ABTfarm which has not been expressly analysed butwhich we believe is worth mentioning. Specifically,only small individuals of the species Oblada mela-nura, Mugilidae, Sarpa salpa, Seriola dumerili, Tra-chinotus ovatus and Sardina pilchardus were re corded;in total, 65% of cage aggregated fish were <11 cm.Individuals of that size are not likely to feed on wholebaitfish and may feed on very small particles of bait-fish and/or living organisms that cover the cageropes. It is therefore reasonable to assume that thesesmall individuals are attracted not only to the avail-able food but also to the farm structures in search ofshelter, as has been suggested by other authors (Fer-nandez-Jover et al. 2009, Šegvic Bubic et al. 2011). Inaddition, at the beginning of July 2011 during moni-toring of T. thynnus spawning in captivity that ourgroup has been carrying out since 2008 (Gordoa et al.2009), we collected 2 types of eggs inside the ABTcage that could be genetically determined as T. thyn-nus and Trachurus mediterraneus. Thus, ABT farmsmay act as new spawning grounds with unknownviability for larvae, but they at least have the poten-tial to provide eggs as food for aggregated species.
Further, we observed the unexpected presence ofthe barrelfish/driftfish at the ABT farm all yearround, except in summer. This species, which typi-cally has an Atlantic distribution, has only beenobserved once in the Mediterranean (Karrer 1986). Inaddition, we made the first sighting of a blue shark,circling the farm near the surface in spring.
Our results revealed differences and similaritiesbetween the 2 fish farm models considered here. Atboth farms, the attraction effect was mostly con-strained to the cage station. The seasonal occurrence
of pelagic species restricted the attraction effect tosummer and spring at the ABT farm, whereas the SBfarm attracted fish all year long. Nevertheless, thecage attraction effect, compared to border and limitstations, was considerably stronger at the ABT farm.Differences in fish abundance and species composi-tion recorded at the SB and ABT farms may berelated to the type of food used and/or the type ofhabitat at each farm. Whole baitfish differ substan-tially in their nutrient composition, food size and set-tling velocity from the food pellets used at SB farms(Vassallo et al. 2006). Šegvic Bubic et al. (2011) sug-gested that the pellets and their fine particulates mayattract a more diverse fish community and can bemore easily consumed than baitfish. In addition, theABT farm is located 4 times as far from shore overdeeper, muddy bottoms, compared to the shallowermixed rocky-sandy seafloor of the SB farm. The ex -posed situation of the ABT farm compared to the SBfarm attracts more mobile pelagic species, from smallplankton feeders (e.g. Sardina pilchardus and Sar-dinella aurita) to big species such as Thunnus thyn-nus whose diet is mostly based on small pelagics.
Fishing near fish farms is a common practice thathas been reported in Spain (Fernandez-Jover et al.2008, Arechavala-Lopez et al. 2011), Croatia (ŠegvicBubic et al. 2011), Greece (Machias et al. 2006) andNorway (Maurstad et al. 2007), and even withinfarms in Turkey (Akyol & Ertosluk 2010). The farmsstudied here are located in waters within the jurisdic-tion of the local government, which has not imple-mented any fishing restrictions in their vicinity.Nonetheless, the cages are located in the centre ofthe leasehold farm area, and their distance from theperimeter acts as a protective zone for wild fish. Thepotential for farms to protect wild fish highly de -pends on the behaviour of each particular species.The results of the current study show that the major-ity of aggregated fish concentrated in close proximityto the cage and suggest that they are to some extentprotected. The territorial species recorded at the SBfarm all year long reap the greatest protection. Incontrast, pelagic and semipelagic species that con-duct seasonal movements away from the farm (e.g.Thunnus thynnus, Scomber japonicus, Sarda sarda,Sardina pilchardus) are only partly protected by thefarm area. In addition, daily movements could sub-stantially increase fish vulnerability. A study byArechavala-Lopez et al. (2010) recorded rapid andrepeated movements of grey mullets Chelon labrosusand Liza aurata to other farms and to nearby fishingareas. To date, no data on the efficiency of fishingnear farm boundaries exist. The presence of a species
249

Aquacult Environ Interact 2: 239–252, 2012
of such high commercial value as T. thynnus at sucha short distance from the coast could trigger illegalfishing activities from fleets that do not have anyquota allocation (Spanish Mediterranean artisanalfleet) or only a very limited allocation with a shortfishing period (recreational fleet). During the study,large numbers of recreational fishing vessels wereobserved gathering at the concession boundary topresumably target this species. Further, the potentialof farms to attract rare species, such as the blue sharkand the barrelfish/driftfish, requires the implementa-tion of conservation actions.
Our work emphasizes the importance of applyingan integrated approach to study wild fish aggregationsat farms. The spatial extent of fish attraction is a keyitem of information for determining the effective sizeof an appropriate protection zone around farms. Dataon the seasonal aggregation pattern provides knowl-edge of periods when exploited species are es pe ciallyvulnerable at farms. As demonstrated here, differentfarm types exhibit distinct fish aggregation patternswhich may require different regulatory measures.Without such measures, the proliferation of fish farming facilities along the coast might result in thedecline of a number of highly targeted fish species.
Acknowledgements. K.B. was supported by a JAEPre_2010_01276 scholarship from the Spanish National ResearchCouncil (CSIC). We thank M.J. Anderson (Massey Univer-sity, New Zealand) for valuable advice on the statisticalanalysis and J. Viñas (University of Girona, Spain) for thegenetic analysis of fish eggs. We are grateful to the giltheadseabream farm company (Grupo INVERMAR) and theAtlantic bluefin tuna farm Balfegó Grup who granted usaccess to their installations. Special thanks go to the Vice-president O. Ribalta and several members of the Responsi-ble Recreational Fishing Association for providing their timeand their vessels: C. Marti, C. Marti Jr., C. Gomez, C. Garín,L. Roca, R. Roca, J. Labiano, C. Seto and L. Martínez.
LITERATURE CITED
Akyol O, Ertosluk O (2010) Fishing near sea-cage farmsalong the coast of the Turkish Aegean Sea. J ApplIchthyol 26: 11−15
Anderson MJ (2001) A new method for non-parametric multivariate analysis of variance. Austral Ecol 26: 32−46
Anderson MJ, Gorley RN, Clarke KR (2008) PERMANOVA+for PRIMER: guide to software and statistical methods.PRIMER-E, Plymouth
Angel DL, Eden N, Breitstein S, Yurman A, Katz T, SpanierE (2002) In situ biofiltration: a means to limit the dispersalof effluents from marine finfish cage aquaculture. Hydro-biologia 469: 1−10
Arechavala-Lopez P, Uglem I, Sanchez-Jerez P, Fernandez-Jover D, Bayle-Sempere J, Nilsen R (2010) Movements ofgrey mullet Liza aurata and Chelon labrosus associated
with coastal fish farms in the western MediterraneanSea. Aquacult Environ Interact 1: 127−136
Arechavala-Lopez P, Sanchez-Jerez P, Bayle-Sempere J,Fernandez-Jover D, Martinez-Rubio L, Lopez-JimenezJA, Martinez-Lopez FJ (2011) Direct interaction betweenwild fish aggregations at fish farms and fisheries activityat fishing grounds: a case study with Boops boops.Aquacult Res 42: 996−1010
Bell JD (1983) Effects of depth and marine reserve fishingrestrictions on the structure of a rocky reef fish assem-blage in the north-western Mediterranean Sea. J ApplEcol 20: 357−369
Boyra A, Sanchez-Jerez P, Tuya F, Espino F, Haroun R (2004)Attraction of wild coastal fishes to an Atlantic subtropicalcage fish farms, Gran Canaria, Canary Islands. EnvironBiol Fishes 70: 393−401
Burbridge PR (1999) The challenge of demonstrating thesocio-economic benefits of integrated coastal manage-ment. In: Salomons W, Turner RK (eds) Perspectives onintegrated coastal zone management. Springer-Verlag,Heidelberg, p 35−53
Carss DN (1990) Concentrations of wild and escaped fishesimmediately adjacent to fish farm cages. Aquaculture 90: 29−40
Clarke KR, Gorley RN (2006) PRIMER v6: user manual/tutorial. PRIMER-E, Plymouth
Clarke KR, Green RH (1988) Statistical design and analysisfor a ‘biological effects’ study. Mar Ecol Prog Ser 46: 213−226
Clarke KR, Somerfield PJ, Chapman MG (2006) On resem-blance measures for ecological studies, including taxo-nomic dissimilarities and a zero-adjusted Bray-Curtiscoefficient for denuded assemblages. J Exp Mar Biol Ecol330: 55−80
Cruzado A, Velásquez Z, Pérez Mad C, Bahamón N,Grimaldo NS, Ridolfi F (2002) Nutrient fluxes from theEbro River and subsequent across-shelf dispersion. ContShelf Res 22: 349−360
Dempster T, Sanchez-Jerez P, Bayle-Sempere JT, Giménez-Casalduero F, Valle C (2002) Attraction of wild fish tosea-cage fish farms in the south-western MediterraneanSea: spatial and short-term temporal variability. MarEcol Prog Ser 242: 237−252
Dempster T, Fernandez-Jover D, Sanchez-Jerez P, Tuya F,Bayle-Sempere J, Boyra A, Haroun RJ (2005) Verticalvariability of wild fish assemblages around sea-cage fishfarms: implications for management. Mar Ecol Prog Ser304: 15−29
Dempster T, Sanchez-Jerez P, Tuya F, Fernandez-Jover D,Bayle-Sempere J, Boyra A, Haroun R (2006) Coastalaquaculture and conservation can work together. MarEcol Prog Ser 314: 309−310
Dempster T, Uglem I, Sanchez-Jerez P, Fernandez-Jover D,Bayle-Sempere J, Nilsen R, Bjørn PA (2009) Coastalsalmon farms attract large and persistent aggregations ofwild fish: an ecosystem effect. Mar Ecol Prog Ser 385:1–14
Dempster T, Sanchez-Jerez P, Uglem I, Bjørn PA (2010) Spe-cies-specific patterns of aggregation of wild fish aroundfish farms. Estuar Coast Shelf Sci 86: 271−275
Dempster T, Sanchez-Jerez P, Fernandez-Jover D, Bayle-Sempere J, Nilsen R, Bjørn PA, Uglem I (2011) Proxymeasures of fitness suggest coastal fish farms can actas population sources and not ecological traps forwild gadoid fish. PLoS ONE 6: e15646
250
Bacher et al.: Spatio-temporal fish aggregation at fish farms
Dufour V, Jouvenel JY, Galzin R (1995) Study of a Mediter-ranean reef fish assemblage. Comparisons of populationdistributions between depths in protected and unpro-tected areas over one decade. Aquat Living Resour 8: 17−25
FAO (Food and Agriculture Organization of the UnitedNations) (2008) Fishery and aquaculture statistics. FAO,Rome
Fernandez-Jover D, Sanchez-Jerez P, Bayle-Sempere JT,Valle C, Dempster T (2008) Seasonal patterns and dietsof wild fish assemblages associated with Mediterraneancoastal fish farms. ICES J Mar Sci 65: 1153−1160
Fernandez-Jover D, Sanchez-Jerez P, Bayle-Sempere JT,Arechavala-Lopez P, Martinez-Rubio L, Jimenez JAL,Lopez FJM (2009) Coastal fish farms are settlement sitesfor juvenile fish. Mar Environ Res 68: 89−96
Fernandez-Jover D, Martinez-Rubio L, Sanchez-Jerez P,Bayle-Sempere JT and others (2011) Waste feed fromcoastal fish farms: a trophic subsidy with compositionalside-effects for wild gadoids. Estuar Coast Shelf Sci 91: 559−568
Freedman D, Lane D (1983) A nonstochastic interpretationof reported significance levels. J Bus Econ Stat 1: 292−298
García-Charton JA, Pérez-Ruzafa Á (1998) Correlationbetween habitat structure and a rocky reef fish assem-blage in the southwest Mediterranean. PSZN I: Mar Ecol19: 111−128
García-Charton JA, Pérez-Ruzafa Á (2001) Spatial patternand the habitat structure of a Mediterranean rocky reeffish local assemblage. Mar Biol 138: 917−934
Gordoa A (2009) Characterization of the infralittoral systemalong the north-east Spanish coast based on sport shore-based fishing tournament catches. Estuar Coast Shelf Sci82: 41−49
Gordoa A, Illas X, Cruzado A, Velásques Z (2008) Spatio-temporal patterns in the north-western Mediterraneanfrom MERIS derived chlorophyll a concentration. ICES JMar Sci 72: 757−767
Gordoa A, Olivar MP, Arevalo R, Viñas J, Molí B, Illas X(2009) Determination of Atlantic bluefin tuna (Thunnusthynnus) spawning time within a transport cage in thewestern Mediterranean. ICES J Mar Sci 66: 2205−2210
Halpern BS, Walbridge S, Selkoe KA, Kappel CV and others(2008) A global map of human impact on marine eco -systems. Science 319: 948−952
Karrer C (1986) Occurrence of the barrelfish, Hyperoglypheperciformis (Teleostei, Perciformes, Stromateoidei) in theMediterranean Sea and off Portugal. Cybium 10: 77−83
Letourneur Y, Ruitton S, Sartoretto S (2003) Environmentaland benthic habitat factors structuring the spatial distri-bution of a summer infralittoral fish assemblage in thenorth-western Mediterranean Sea. J Mar Biol Assoc UK
83: 193−204Lombarte A, Gordoa A, Whitfield A, James N, Tuset V
(2012) Ecomorphological analysis as a complementarytool to detect changes in fish communities followingmajor perturbations in two South African estuarine sys-tems. Environ Biol Fishes (in press) doi: 10.1007/ s10641-011-9966-0
Lupatsch I, Katz T, Angel DL (2003) Assessment of theremoval efficiency of fish farm effluents by grey mullets: a nutritional approach. Aquacult Res 34: 1367−1377
Machias A, Giannoulaki M, Somarakis S, Maravelias CDand others (2006) Fish farming effects on local fisherieslandings in oligotrophic seas. Aquaculture 261: 809−816
Maurstad A, Dale T, Bjørn P (2007) You wouldn’t spawn in aseptic tank, would you? Hum Ecol 35: 601−610
Morey G, Moranta J, Massutí E, Grau A, Linde M, Riera F,Morales-Nin B (2003) Weight–length relationships of lit-toral to lower slope fishes from the western Mediterran-ean. Fish Res 62:89–96
Oakes CT, Pondella DJ II. (2009) The Value of a net-cage asa fish aggregating device in Southern California. J WorldAquacult Soc 40:1–21
Rooker JR, Alvarado Bremer JR, Block BA, Dewar H andothers (2007) Life history and stock structure of Atlanticbluefin tuna (Thunnus thynnus). Rev Fish Sci 15: 265−310
Šegvic Bubic T, Grubišic L, Ticina V, Katavic I (2011) Tem-poral and spatial variability of pelagic wild fish assem-blages around Atlantic bluefin tuna (Thunnus thynnus)farms in the eastern Adriatic Sea. J Fish Biol 78: 78−97
Sudirman, Halide H, Jompa J, Zulfikar, Iswahyudin, McKin-non AD (2009) Wild fish associated with tropical sea cageaquaculture in South Sulawesi, Indonesia. Aquaculture286: 233−239
Thresher R, Gunn J (1986) Comparative analysis of visualcensus techniques for highly mobile, reef-associated pis-civores (Carangidae). Environ Biol Fishes 17: 93−116
Tuya F, Sanchez-Jerez P, Dempster T, Boyra A, Haroun RJ(2006) Changes in demersal wild fish aggregationsbeneath a sea-cage fish farm after the cessation of farm-ing. J Fish Biol 69: 682−697
Valle C, Bayle-Sempere JT, Dempster T, Sanchez-Jerez P,Giménez-Casalduero F (2007) Temporal variability ofwild fish assemblages associated with a sea-cage fishfarm in the south-western Mediterranean Sea. EstuarCoast Shelf Sci 72: 299−307
Vassallo P, Doglioli AM, Rinaldi F, Beiso I (2006) Determina-tion of physical behaviour of feed pellets in Mediterran-ean water. Aquacult Res 37: 119−126
Vita R, Marin A, Madrid JA, Jiménez-Brinquis B, Cesar A,Marin-Guirao L (2004) Effects of wild fishes on wasteexportation from a Mediterranean fish farm. Mar EcolProg Ser 277: 253−261
251
Aquacult Environ Interact 2: 239–252, 2012252
Family Species Gilthead seabream (SB) farm Atlantic bluefin tuna (ABT) farmStation Depth Season Station Depth Season
C B L D M S SU AU WI SP C B L D M S SU AU WI SP
Apogonidae Apogon imberbis + + + Δ d d d
Balistidae Balistes capriscus + + Δ Δ d
Belonidae Belone belone + Δ d
Blenniidae Parablennius rouxi + + + Δ d d d d Parablennius pilicornis + + Δ d d d d
Carangidae Seriola dumerili + + + Δ Δ Δ d Trachurus spp. + Δ Δ Δ d + + + Δ Δ Δ d d d d Trachinotus ovatus + + Δ Δ d + Δ d
Carcharhinidae Prionace glauca + Δ d
Centracanthidae Spicara maena + + + Δ Δ d d
Centrolophidae Hyperoglyphe perciformis + + + Δ Δ Δ d d d
Clupeidae Sardinella aurita + Δ d Sardina pilchardus + Δ d d + Δ Δ d
Congridae Conger conger + + + Δ d d d d
Dasyatidae Dasyatis pastinaca + Δ d
Gobiidae Gobius xanthocephalus + + + Δ d d d d Gobius geniporus + + + Δ d d d d Gobius cruentatus + + + Δ d d d d
Labridae Coris julis + + + Δ d d d d Ctenolabrus rupestris + + Δ d d Labrus merula + + + Δ d d d d Labrus bimaculatus + Δ d Symphodus melanocercus + + + Δ d d d d Symphodus mediterraneus + + + Δ d d d d Symphodus tinca + + Δ d
Mugilidae + Δ Δ Δ d d d + Δ d d
Mullidae Mullus surmuletus + + + Δ d d d d
Muraenidae Muraena helena + + Δ d d
Myliobatidae Myliobatis aquila + + Δ Δ d Pteromylaeus bovinus + Δ Δ d d
Pomacentridae Chromis chromis + + + Δ Δ d d d d
Pomatomidae Pomatomus saltatrix + Δ d
Scombridae Sarda sarda + Δ d + + + Δ Δ d Scomber japonicus + Δ Δ Δ d d Thunnus thynnus + Δ Δ d d
Scorpaenidae Scorpaena scrofa + Δ d d Scorpaena notata + + Δ d d d d
Serranidae Serranus cabrilla + + + Δ d d d d Serranus scriba + + + Δ d d d d
Sparidae Boops boops + + Δ Δ Δ d d Diplodus vulgaris + + + Δ Δ d d d d + Δ d d Diplodus sargus + + + Δ d d d Diplodus cervinus + Δ d Diplodus puntazzo + + Δ d + Δ d Oblada melanura + + + Δ Δ Δ d d d d + Δ Δ Δ d d d d Pagellus acarne + Δ d Sarpa salpa + Δ d d + Δ Δ Δ d d
Appendix 1. All species recorded at different stations, depths and seasons at an SB farm and an ABT farm in Spain, summer 2010to spring 2011. C: cage, B: border, L: limit; D: deep water, M: midwater, S: surface; SU: summer, AU: autumn, WI: winter, SP:
spring. +, Δ, d: presence of a species
Editorial responsibility: Tim Dempster, Trondheim, Norway
Submitted: March 9, 2012; Accepted: May 16, 2012Proofs received from author(s): June 16, 2012


![Chanson pour faire une bonne bouillabaisse · Photo La daurada [la dawr àdↄ] La dorade Sparus aurata Lo gòbi [lu g`ↄi ] Le gòbi le gobie gobius Lo fiélas [lu fielà s] Le](https://img.pdfslide.net/doc/110x75/5eb92690c5eb9f7991675b95/chanson-pour-faire-une-bonne-photo-la-daurada-la-dawr-da-la-dorade-sparus.jpg)