Embed Size (px)
Citation preview
549 Rev Bras Epidemiol2010; 13(4): 549-60
Spatial distribution of mortality by homicide and social inequalities according to race/skin color in an intra-urban Brazilian space
Distribuição espacial da mortalidade por homicídio e desigualdades sociais segundo a raça/cor em um espaço intra-urbano no Brasil
Edna Maria de AraújoI
Maria da Conceição Nascimento CostaII
Nelson Fernandes de OliveiraI
Francisco dos Santos SantanaIII
Maurício Lima BarretoII
Vijaya HoganIV
Tânia Maria de AraújoI
I Universidade Estadual de Feira de Santana, Feira de Santana. BA, Brazil. II Instituto de Saúde Coletiva da Universidade Federal da Bahia. Salvador, BA, Brazil. III Diretoria de Vigilância Epidemiológica da Secretaria de Saúde do Estado da Bahia – DIVEP/SESAB. Salvador, BA, BrasilIV Department of Maternal and Child Health, Gillings School of Global Public Health University of North Carolina, North Carolina, U.S.A.
Estudo desenvolvido no âmbito do projeto: “Mortalidade por Causas Externas e Raça/cor: uma das expressões da desigualdade social”.*Projeto financiado pelo CNPq - Processo: 409713/2006-6 Correspondência: Edna Maria de Araújo. Universidade Estadual de Feira de Santana. Av. Transnor-destina s/n Km 03 BR 116 - Novo Horizonte CEP: 44036-900 Feira de Santana, BA – Brazil. E- mail: [email protected]
Abstract
Introduction: In Brazil, deaths by external causes rank first in the mortality statistics. Nevertheless, studies which investigate the relationship between mortality by external causes and race/skin color are scarce. Objec-tives: To evaluate the relative contribution of race/skin color to the spatial distribution of mortality by homicide in Salvador, state of Bahia, Brazil, in the period 1998 - 2003. Material and Methods: This is a spatial ag-gregate study including secondary data on 5,250 subjects, using a unit of analysis called the “weighting area” (WA). Annual average death rates by homicide were estimated. The Global and Local Moran Index were used to evaluate the presence of spatial autocorre-lation and the Conditional Auto Regressive (CAR) model was employed to evaluate the referred effect, using the R statistical packa-ge. Results: Global and Local Moran’s I tests were significant. CAR regression showed that the predicted mortality rate increases when there is a growth in the proportion of black males aged between 15 and 49 years. Geometrically weighted regression (GWR) showed a very small variation of the local coefficients for all predictors. Conclusion: We demonstrated that the interrelation between race, violence and space is a phenomenon which results from a long process of social inequality. Understanding these interactions requires interdisciplinary efforts that contribute to advancement of knowledge that leads to more specific Public Health interventions.
Keywords: External causes. Homicide. Race/skin color. Spatial analysis. Social inequalities.
550Rev Bras Epidemiol2010; 13(4): 549-60
Spatial distribution of mortality by homicide and social inequalities according to race/skin colorAraújo, E.M. et al.
Resumo
Introdução: No Brasil, as mortes por cau-sas externas vêm ocupando as primeiras posições nas estatísticas de mortalidade. No entanto, são escassos os estudos que investigam a relação entre mortalidade por causas externas e raça/cor da pele. Objetivos: Avaliar a contribuição relativa da raça/cor da pele na distribuição espacial da mortalidade por homicídio em Salvador, BA, Brasil no período de 1998 a 2003. Material e Métodos: Estudo de agregado espacial cuja unidade de análise é “área de ponderação” (AP) e que teve a inclusão de 5.250 sujei-tos. Foram utilizados dados secundários e taxas médias anuais estimadas de mortes por homicídio. Utilizou-se o Índice Global e Local de Moran para avaliar a presença de autocorrelação espacial e o modelo “Conditional AutoRegressive” (CAR) para avaliar o referido efeito, utilizando-se o pacote estatístico R. Resultados: Os testes I de Moran global e local foram significantes. A regressão CAR mostrou que a taxa predita de mortalidade por homicídio aumenta quando há um aumento na proporção de população masculina negra de 15 a 49 anos de idade. Regressão geograficamente ponderada (GWR) mostrou uma pequena variação dos coeficientes locais para todos os preditores. Conclusão: A interrelação entre raça, violência e espaço faz parte de um longo processo de desigualdade. Portan-to, o seu entendimento requer a junção de esforços interdisciplinares que contribuam para ampliar o conhecimento sobre o tema e conseqüentemente orientar intervenções de Saúde Pública mais especificas.
Palavras-chave: Causas externas. Homi-cídio. Raça/cor da pele. Análise espacial. Desigualdade social.
Introduction
Deaths by external causes or violent deaths have been ranked first in the mortali-ty statistics since the end of the 1980s, espe-cially in large urban areas. The magnitude, frequency and the importance of this group of causes, which is comprised of homicides, accidents, suicides and other unnatural causes, have transformed it into one of the most serious public health problems in the majority of the world’s countries. These deaths predominantly affect black males between the ages of 15 and 49 years, repre-senting the stage of reproductive life and of higher economic production1.
The occurrence of these deaths is corre-lated with social and economic disparities among regions, countries and populations, between rich and poor individuals and also among racial/ethnic groups. Evidence of racial/ethnic inequalities in this type of mortality have been shown by some authors, particularly in the United States. For example, the homicide rate among African-Americans in the year 2000 was 38.6 per 100 thousand; more than twice the rate for Hispanics (17.3 per 100 thousand) and approximately 12 times higher than the rate among non-Hispanic Caucasians in the same year1.
In Brazil, between 1980 and 2000, the external causes were responsible for 2 million deaths. Of this total, 1.7 million oc-curred among males making this the second leading cause of death in the country. It is important to mention here that, from 1991 to 2000, while deaths caused by transport accidents declined by 10.4%, homicides increased by 27.2%, representing 38.3% of total deaths2.
Concerning the racial aspect, “being black, young and male means being the pre-ferred target of lethal violence in Brazil”. This is mentioned by the Human Development Report Brazil 2005 – “Racism, poverty and violence”, authored by the United Nations Development Program3.
Although Brazil has the largest concen-tration of black population outside of Africa

551 Rev Bras Epidemiol2010; 13(4): 549-60
Spatial distribution of mortality by homicide and social inequalities according to race/skin colorAraújo, E.M. et al.
this social group is disproportionately unre-presented in positions of power and, from the economic and social point of view, has lower income and education than the rest of the Brazilian population4. Furthermore, Blacks live in areas which are less equipped with basic infrastructure services, and have more restricted access to health services, or these services have worse quality and are less efficient5-7.
In 2002, the mortality rate due to homi-cide in Brazil, among the population aged between 15 and 24 years, was 74% higher among Black individuals8. A survey conduc-ted in 20 states by UNDP and published in 2005, revealed that Blacks risk of dying due to a homicide is twice as high as for Whites. Mortality due to this cause among Brazilian Blacks surpasses the figures registered by Colombia, a country that is recognized as one of the most violent in the world because of the civil war and narcotics traffic3.
The perception that the higher frequency of violent deaths among Blacks is related to socio-environmental and economic factors resulting from the position occupied by this population in the social space is shared by some national and international authors9-16.
On the other hand, geographical space has been understood as an inseparable set of systems of objects and actions which, when employed as a unit of analysis, reveals the historical production of reality17. Becau-se this concept transcends its physical or natural condition and recovers its sense of historical and social character, it tends to be a theoretical/methodological alternative for guiding the analysis of social inequalities in health18,19. We apply this method to the study of mortality by homicides according to race/skin color.
In view of the paucity of Brazilian studies that investigate the relationship between violent deaths and race/skin color, and because Salvador (State of Bahia) is a capi-tal that has a majority of its population of black race/skin color, that exhibits excess mortality by violent deaths20, this study aims to evaluate the relative contribution of race/skin color to the determination of the
spatial distribution of mortality by homicide in this capital, in the period 1998-2003. To achieve this, the working hypothesis is that areas inhabited by a greater proportion of black male population present higher risks of death due to homicide.
Material and methods
This is a spatial aggregate study whose unit of analysis is the “weighting area” (WA). This area corresponds to a geographical unit composed of a grouping of census tracts, defined according to geographical, socio-economic, physical and urban planning criteria established by Instituto Brasileiro de Geografia e Estatística (IBGE – Brazilian Institute of Geography and Statistics). The WA was selected as a unit of analysis becau-se it is the smallest spatial aggregate about which IBGE has population data on race/skin color.
Salvador, the capital of the state of Bahia, has 88 weighting areas which represent the 2,523 census tracts that compose it. The smallest weighting area is constituted by 400 private households. The population of this study includes the individuals who were living in this city in the period from 1998 to 2003. This city has an area of 709.5 Km2
and a population of 2,520,504 inhabitants. Approximately 774,000 individuals, or 30.7% of the population, live on the poverty line or below it, with household income per capita below half a minimum salary2.
Data on deaths came from Instituto Médico Legal Nina Rodrigues (IML – Nina Rodrigues Forensic Medicine Institute) and were organized by Fórum Comunitário de Combate à Violência (FCCV – Community Forum to Combat Violence). This Forum im-proved the classification of cause of deaths due to homicide because it supplemented the dataset with information from police reports, expert reports and other comple-mentary documents to when it was not spe-cified on the Death Certificate21. IBGE and Superintendência de Estudos Econômicos e Sociais da Bahia (SEI - Superintendence of Social and Economic Studies of Bahia) pro-
552Rev Bras Epidemiol2010; 13(4): 549-60
Spatial distribution of mortality by homicide and social inequalities according to race/skin colorAraújo, E.M. et al.
vided the demographic and socio-economic data of the sample of the Demographic Census of the year 2000, expanded to the total population, in digital format. The geographical data, including digital grids of the weighting areas, were obtained from the cartographic bases of IBGE22 for the munici-pality of Salvador, in shapefile (shp) format, compatible with the software Arcview GIS version 3.2. and Geoda23.
Annual average mortality by homicide rates (X85-Y09) in the period from 1998 to 2003 (Chapter XX of ICD 10) were used as the dependent variable. The decision to investigate mortality by homicide was made because homicide involves “intentionality” and because it is the most frequent type among the external causes. The use of the annual average rate for the period of six years aimed to minimize the effect of areas with small populations and to give more stability to the mortality indicators, as the annual number of deaths due to homicide in some weighting areas contained extremely small or empty cells.
The proportion of black male population aged 15-49 years was the main independent variable. The co-variables were: indicators of income (proportion of male breadwin-ners, female breadwinners and total with income up to 1 minimum salary and up to 2 minimum salaries), education (illiteracy and elementary school), sanitation (water supply and sewage system), agglomeration (number of people per room and bedroom) and inequality (Gini Index – which evalua-ted the pattern of average income distribu-tion – breadwinner, aggregate). This index ranges from a minimum value of 0, situation of perfect equality of income distribution in a society, to a maximum value of 1, situation of extreme inequality, in which only one individual or family is the owner of the entire available income24. The indi-cators were selected based on the specific literature25-27, considering the relevance of the publications and also the existence of data specified by race/skin color.
To minimize possible biases caused by problems of self-reported racial classifica-
tion of skin color and by the small propor-tion of Black population per weighting area, we decided to analyze, in this study, the Black and mixed population together and we referred to it as Black population.
To smooth the fluctuation of rates as-sociated with small areas, the empirical Bayesian estimation technique was used28. However, as no great differences were obser-ved between the values of smooth and gross mortality rates, the latter were employed in the study.
To evaluate the relationship between predictor variables and dependent variable, bivariate and multivariate linear regression models were initially used. In the multi-variate regression model, the “backward” method was used and all the predictor variables in which the value of p was ≤ 0.25 in the bivariate tests were included in the model. The criterion for the inclusion of variables in the multivariate model was a p value ≤ 0.20, as well as empirical knowledge of the variable’s relevance to the outcome.
From the data spreadsheet containing the dependent variable, neighborhood matrix and geographical coordinates, the analysis of spatial dependence was perfor-med by verifying spatial autocorrelation using the Global and Local Moran Index. The global index of spatial association pro-vides a single value as association measure for the data set, and varies from -1 to 129,30. The local index estimates how much of the observed value of an attribute in one region is dependent on the values of this same variable concerning first order neighbors, that is, neighbors with common borders31. Spatial autocorrelation tests, in this study, were conducted by using the program GE-ODA 0.9.5i (Beta).
When the presence of autocorrelation was verified the test of Lagrange multipliers was used to indicate the best model to eva-luate the spatial effect. The “Conditional Auto Regressive” (CAR) was the indica-ted model23. Generalized Geographically Weighted Regression (GGWR) with over-dispersed poisson response was used to describe the variability of the local effect of
553 Rev Bras Epidemiol2010; 13(4): 549-60
Spatial distribution of mortality by homicide and social inequalities according to race/skin colorAraújo, E.M. et al.
the predictors across the weighting areas32. The softwares STATA version 8.0, GEODA
0.9.5i (Beta), ArcView 3.2 and R were used to process, visualize and analyze the data33-36.
The research project was approved by the Research Ethics Committee of the Public Health Institute of Universidade Federal da Bahia (029-04 CEP-ISC/UFBA).
Results
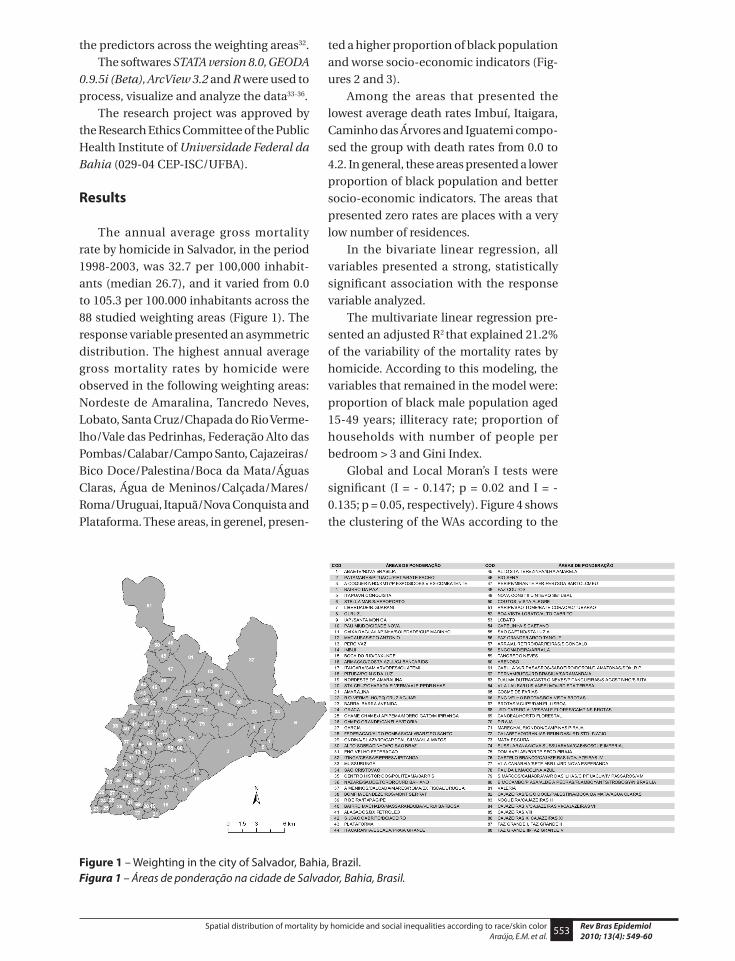
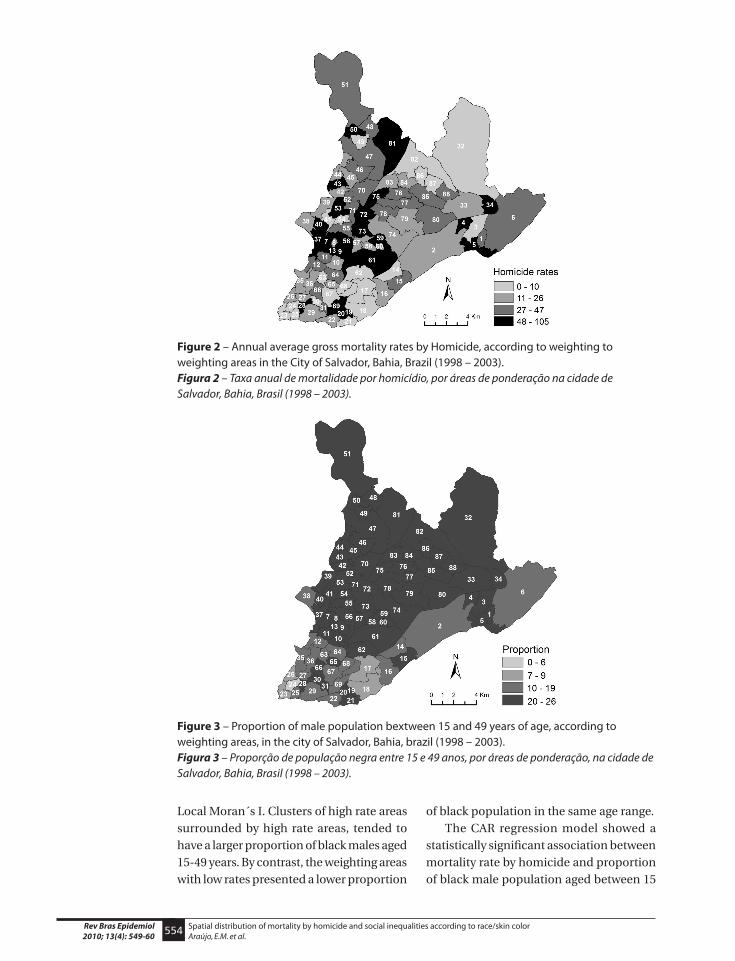
The annual average gross mortality rate by homicide in Salvador, in the period 1998-2003, was 32.7 per 100,000 inhabit-ants (median 26.7), and it varied from 0.0 to 105.3 per 100.000 inhabitants across the 88 studied weighting areas (Figure 1). The response variable presented an asymmetric distribution. The highest annual average gross mortality rates by homicide were observed in the following weighting areas: Nordeste de Amaralina, Tancredo Neves, Lobato, Santa Cruz/Chapada do Rio Verme-lho/Vale das Pedrinhas, Federação Alto das Pombas/Calabar/Campo Santo, Cajazeiras/Bico Doce/Palestina/Boca da Mata/Águas Claras, Água de Meninos/Calçada/Mares/Roma/Uruguai, Itapuã/Nova Conquista and Plataforma. These areas, in gerenel, presen-
ted a higher proportion of black population and worse socio-economic indicators (Fig-ures 2 and 3).
Among the areas that presented the lowest average death rates Imbuí, Itaigara, Caminho das Árvores and Iguatemi compo-sed the group with death rates from 0.0 to 4.2. In general, these areas presented a lower proportion of black population and better socio-economic indicators. The areas that presented zero rates are places with a very low number of residences.
In the bivariate linear regression, all variables presented a strong, statistically significant association with the response variable analyzed.
The multivariate linear regression pre-sented an adjusted R2 that explained 21.2% of the variability of the mortality rates by homicide. According to this modeling, the variables that remained in the model were: proportion of black male population aged 15-49 years; illiteracy rate; proportion of households with number of people per bedroom > 3 and Gini Index.
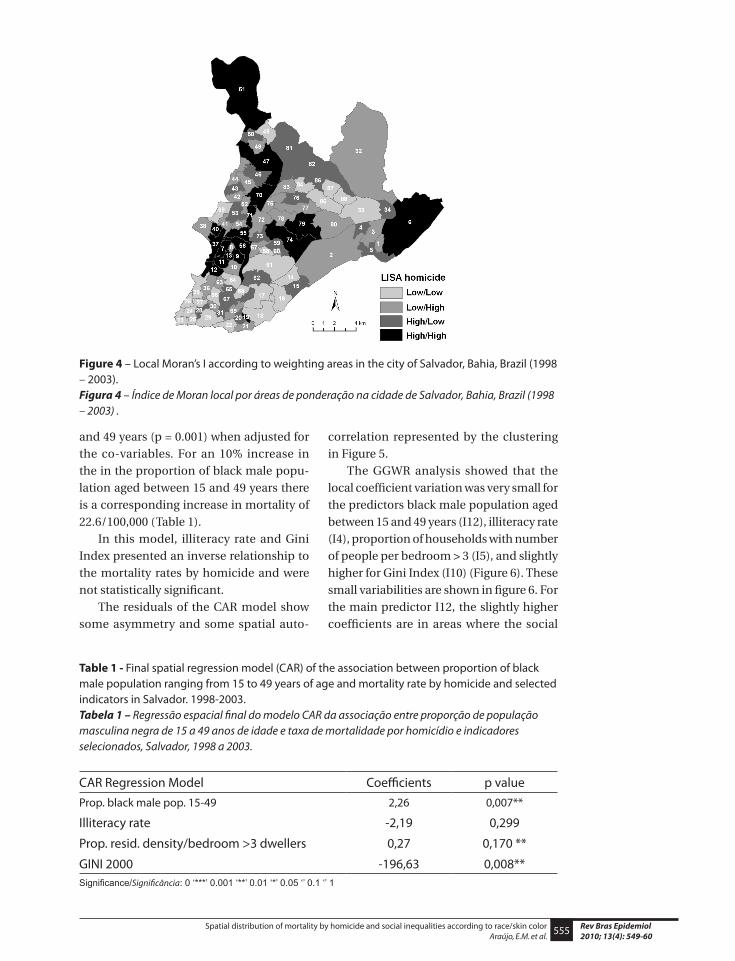
Global and Local Moran’s I tests were significant (I = - 0.147; p = 0.02 and I = - 0.135; p = 0.05, respectively). Figure 4 shows the clustering of the WAs according to the
Figure 1 – Weighting in the city of Salvador, Bahia, Brazil.Figura 1 – Áreas de ponderação na cidade de Salvador, Bahia, Brasil.
554Rev Bras Epidemiol2010; 13(4): 549-60
Spatial distribution of mortality by homicide and social inequalities according to race/skin colorAraújo, E.M. et al.
Figure 2 – Annual average gross mortality rates by Homicide, according to weighting to weighting areas in the City of Salvador, Bahia, Brazil (1998 – 2003).Figura 2 – Taxa anual de mortalidade por homicídio, por áreas de ponderação na cidade de Salvador, Bahia, Brasil (1998 – 2003).
Figure 3 – Proportion of male population bextween 15 and 49 years of age, according to weighting areas, in the city of Salvador, Bahia, brazil (1998 – 2003).Figura 3 – Proporção de população negra entre 15 e 49 anos, por áreas de ponderação, na cidade de Salvador, Bahia, Brasil (1998 – 2003).
Local Moran´s I. Clusters of high rate areas surrounded by high rate areas, tended to have a larger proportion of black males aged 15-49 years. By contrast, the weighting areas with low rates presented a lower proportion
of black population in the same age range.The CAR regression model showed a
statistically significant association between mortality rate by homicide and proportion of black male population aged between 15
555 Rev Bras Epidemiol2010; 13(4): 549-60
Spatial distribution of mortality by homicide and social inequalities according to race/skin colorAraújo, E.M. et al.
Figure 4 – Local Moran’s I according to weighting areas in the city of Salvador, Bahia, Brazil (1998 – 2003).Figura 4 – Índice de Moran local por áreas de ponderação na cidade de Salvador, Bahia, Brazil (1998 – 2003) .
and 49 years (p = 0.001) when adjusted for the co-variables. For an 10% increase in the in the proportion of black male popu-lation aged between 15 and 49 years there is a corresponding increase in mortality of 22.6/100,000 (Table 1).
In this model, illiteracy rate and Gini Index presented an inverse relationship to the mortality rates by homicide and were not statistically significant.
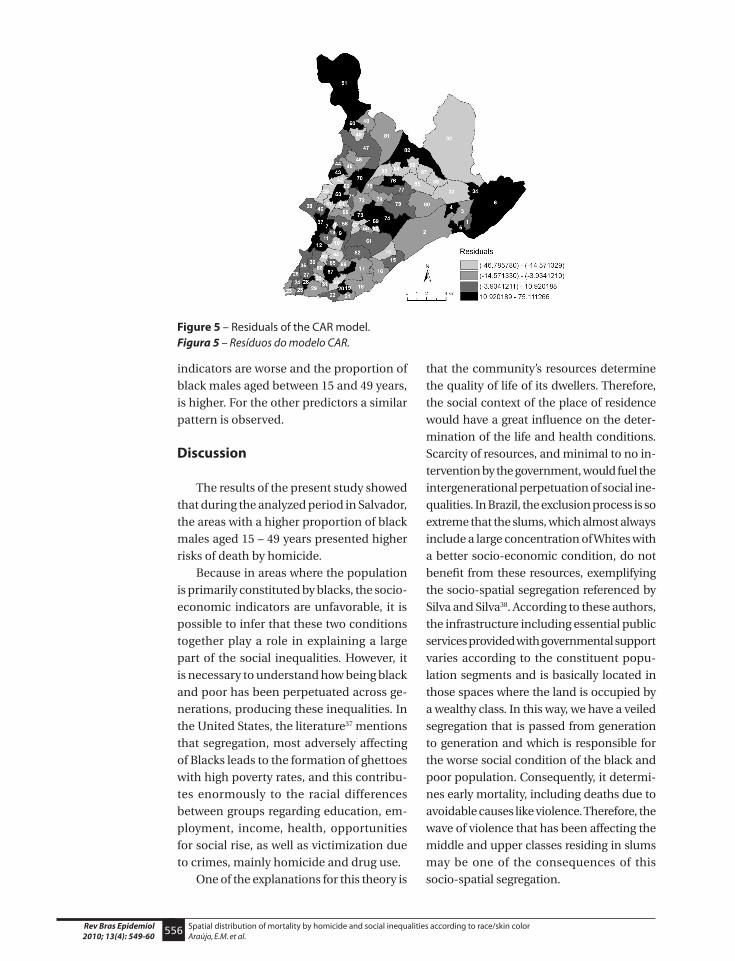
The residuals of the CAR model show some asymmetry and some spatial auto-
Table 1 - Final spatial regression model (CAR) of the association between proportion of black male population ranging from 15 to 49 years of age and mortality rate by homicide and selected indicators in Salvador. 1998-2003.Tabela 1 – Regressão espacial final do modelo CAR da associação entre proporção de população masculina negra de 15 a 49 anos de idade e taxa de mortalidade por homicídio e indicadores selecionados, Salvador, 1998 a 2003.
CAR Regression Model Coefficients p valueProp. black male pop. 15-49 2,26 0,007**
Illiteracy rate -2,19 0,299
Prop. resid. density/bedroom >3 dwellers 0,27 0,170 **
GINI 2000 -196,63 0,008**Significance/Significância: 0 ‘***’ 0.001 ‘**’ 0.01 ‘*’ 0.05 ‘’ 0.1 ‘’ 1
correlation represented by the clustering in Figure 5.
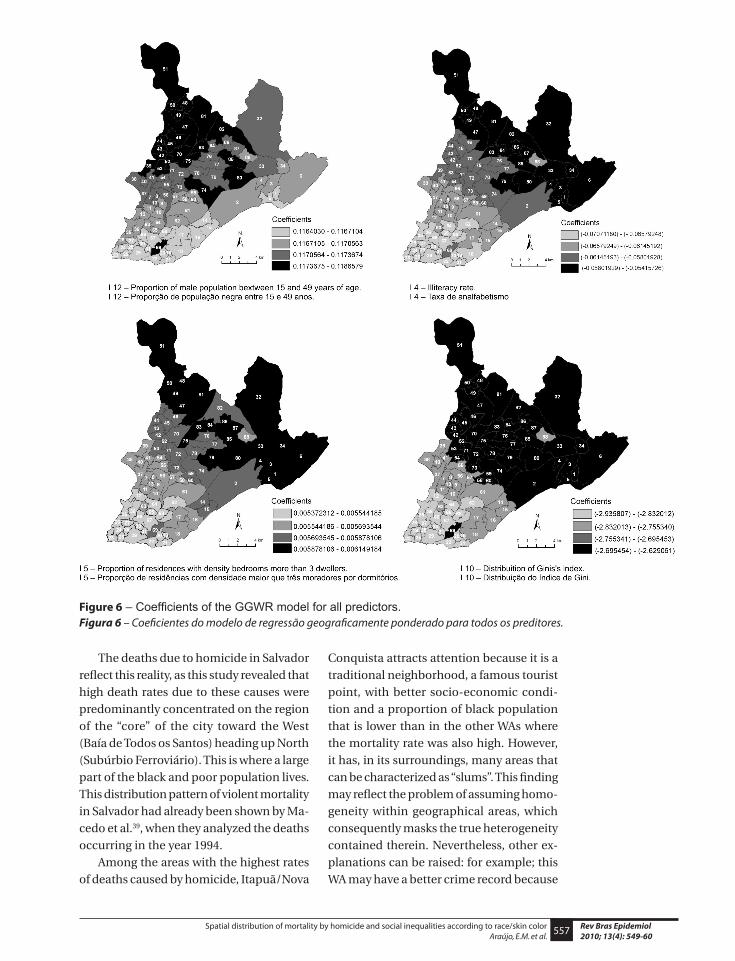
The GGWR analysis showed that the local coefficient variation was very small for the predictors black male population aged between 15 and 49 years (I12), illiteracy rate (I4), proportion of households with number of people per bedroom > 3 (I5), and slightly higher for Gini Index (I10) (Figure 6). These small variabilities are shown in figure 6. For the main predictor I12, the slightly higher coefficients are in areas where the social
556Rev Bras Epidemiol2010; 13(4): 549-60
Spatial distribution of mortality by homicide and social inequalities according to race/skin colorAraújo, E.M. et al.
indicators are worse and the proportion of black males aged between 15 and 49 years, is higher. For the other predictors a similar pattern is observed.
Discussion
The results of the present study showed that during the analyzed period in Salvador, the areas with a higher proportion of black males aged 15 – 49 years presented higher risks of death by homicide.
Because in areas where the population is primarily constituted by blacks, the socio-economic indicators are unfavorable, it is possible to infer that these two conditions together play a role in explaining a large part of the social inequalities. However, it is necessary to understand how being black and poor has been perpetuated across ge-nerations, producing these inequalities. In the United States, the literature37 mentions that segregation, most adversely affecting of Blacks leads to the formation of ghettoes with high poverty rates, and this contribu-tes enormously to the racial differences between groups regarding education, em-ployment, income, health, opportunities for social rise, as well as victimization due to crimes, mainly homicide and drug use.
One of the explanations for this theory is
Figure 5 – Residuals of the CAR model.Figura 5 – Resíduos do modelo CAR.
that the community’s resources determine the quality of life of its dwellers. Therefore, the social context of the place of residence would have a great influence on the deter-mination of the life and health conditions. Scarcity of resources, and minimal to no in-tervention by the government, would fuel the intergenerational perpetuation of social ine-qualities. In Brazil, the exclusion process is so extreme that the slums, which almost always include a large concentration of Whites with a better socio-economic condition, do not benefit from these resources, exemplifying the socio-spatial segregation referenced by Silva and Silva38. According to these authors, the infrastructure including essential public services provided with governmental support varies according to the constituent popu-lation segments and is basically located in those spaces where the land is occupied by a wealthy class. In this way, we have a veiled segregation that is passed from generation to generation and which is responsible for the worse social condition of the black and poor population. Consequently, it determi-nes early mortality, including deaths due to avoidable causes like violence. Therefore, the wave of violence that has been affecting the middle and upper classes residing in slums may be one of the consequences of this socio-spatial segregation.
557 Rev Bras Epidemiol2010; 13(4): 549-60
Spatial distribution of mortality by homicide and social inequalities according to race/skin colorAraújo, E.M. et al.
The deaths due to homicide in Salvador reflect this reality, as this study revealed that high death rates due to these causes were predominantly concentrated on the region of the “core” of the city toward the West (Baía de Todos os Santos) heading up North (Subúrbio Ferroviário). This is where a large part of the black and poor population lives. This distribution pattern of violent mortality in Salvador had already been shown by Ma-cedo et al.39, when they analyzed the deaths occurring in the year 1994.
Among the areas with the highest rates of deaths caused by homicide, Itapuã/Nova
Figure 6 – Coefficients of the GGWR model for all predictors.Figura 6 – Coeficientes do modelo de regressão geograficamente ponderado para todos os preditores.
Conquista attracts attention because it is a traditional neighborhood, a famous tourist point, with better socio-economic condi-tion and a proportion of black population that is lower than in the other WAs where the mortality rate was also high. However, it has, in its surroundings, many areas that can be characterized as “slums”. This finding may reflect the problem of assuming homo-geneity within geographical areas, which consequently masks the true heterogeneity contained therein. Nevertheless, other ex-planations can be raised: for example; this WA may have a better crime record because
558Rev Bras Epidemiol2010; 13(4): 549-60
Spatial distribution of mortality by homicide and social inequalities according to race/skin colorAraújo, E.M. et al.
it is a tourist area; another possibility is that, as it is a tourist area, it may be attracting a greater action of the drug traffic; conse-quently, it has a higher number of deaths due to homicide.
The weighting areas Nordeste de Ama-ralina and Chapada do Rio Vermelho are located near the seafront, where the popu-lation’s socio-economic characterization varies from middle to upper class and the proportion of blacks is small. However, they were also characterized as areas of high rates of deaths caused by violence. These two areas are typical examples of exclusion, because they are marked by the process of subnormal agglomeration/slum* and, possibly, the resources of the neighboring communities are not available to them. Coincidently, Nordeste de Amaralina cor-responds to the weighting area that has the highest proportion of black and poor population of Salvador.
By contrast, the areas with predomi-nance of low violence rates are located in the part of the seafront that is turned toward Baía de Todos os Santos, extending along the seafront turned toward the Atlantic Ocean, that is, these areas begin in the Southwest region of the city (Vitória, Porto da Barra) and head East until Itapuã. This part of the seafront presents a low proportion of black population and its inhabitants have a high economic condition. In fact, one of these areas corresponds to “Graça”, a neighbor-hood where there is the lowest proportion of black dwellers of Salvador.
Some areas with low mortality rates by external causes (Curuzu, Alagados and Fazenda Grande I, II, III e V) that have great concentration of black population and poverty were also surrounded by areas with high death rates due to homicide. Curuzu seems to have some social cohesion among its dwellers because it is not an area that originated from a subnormal agglomera-tion (slum), where the formation process is disorganized and its inhabitants generally
come from distinct places. Besides, this area has a cultural association connected with the Carnival (Ilê Ayê) that is internationally known due to its projects, which show the importance of the black culture and iden-tity. The possible existence of social cohe-sion and the presence of the organization mentioned above might explain the low mortality rates due to homicide of Curuzu, a community whose population is majority Black and poor.
According to Williams & Collins30, social cohesion is a factor of protection against violence. The argument is that areas, whose inhabitants are socially and culturally close to each other, and where this closeness lasts throughout their lives, tend to form a protective network against drug traffic and homicide.
The lack of linearity between socio-economic indicators and violence, the strong interrelation between race/skin color and socio-economic condition, as well as the inverse relationship between illiteracy, Gini Index and death due to homicide observed in the present study were also mentioned by Lima et al.40. These authors argue that these elements corroborate the already reported complexity involved in violence. But, above all, these findings show the importance of investigating other factors already described in the literature as possible risk predictors for violence, such as: factors related to racism and discrimination among groups, loss of neighborhood bonds, competition among individuals and social groups, drug traffic, lack of trust in the institutions, the creation of extermination groups for “the maintenance of law and order” and police violence, pre-domination of nuclear families where only one adult is responsible for family support, among others41-43. Therefore, it is necessary to conduct research that aims to understand what other factors contribute to form this scenario: areas with a larger proportion of black population have higher risks of occur-rence of deaths due to homicide.
“Subnormal agglomeration” is an expression used by FIBGE to refer to one of the types of households, which is the house or apartment located in slum areas.
559 Rev Bras Epidemiol2010; 13(4): 549-60
Spatial distribution of mortality by homicide and social inequalities according to race/skin colorAraújo, E.M. et al.
Despite the important findings revea-led by this investigation, it is important to mention some of its limitations. The first one concerns the quality of the data, as it is an ecological study conducted with secondary data deriving from different sources, which can lead to biases. The case of the variable “race/skin color” should be emphasized. The mortality data referred to classifications made by third parties (coro-ners, other employees of the Forensic Me-dicine Institutions or the victims’ relatives), while the population data that were used to calculate the rates came from IBGE, which employs the criterion of race/skin color self-classification. This implies that there may be divergences between them. In addition, there are the possible biases deriving from the value judgment adopted by third parties in the race/skin color classification.
It should also be mentioned that the spa-tial analysis in this study used as reference only the victims’ place of residence. There-fore, the information surveyed here is not related to the areas that present higher risks of occurrence of death due to homicide.
Also, the fact that the indicators used here reflected a level of average exposure
that predicts a degree of homogeneity in the risk distribution constitutes another limitation of the study because it masks, in
part, the specificities that should be taken into account in a study on inequality44. Moreover, we worked only with secondary data deriving from the Census. It is known that, in Salvador, there are many institutions that have social data available and joint efforts to search for these data may provide better quality and understanding of the real situation of inequality in this city.
Final remarks
Although our hypothesis was confirmed through these analyses the use of spatial regression models that are able to analyze non-normal data present challenges that must be overcome in future investigations. In addition, multilevel research should be conducted, taking into account not only issues related to the context of population groups, but also those inherent in indivi-duals, in order to produce more nuanced knowledge about health inequalities.
Acknowledgements: We would like to thank Delsuc Evangelista Filho for his collaboration in the databases linkage and Cristiano Uzeda Teixeira and Daiane Castro Bittencourt, geographers, for their collabo-ration in the creation of the maps.
References
1. World Health Organization. World report on violence and health. Geneva; 2002. (WHO - Technical Report Series).
2. FIBGE. Fundação Instituto Brasileiro de Geografia e Estatística. Síntese de indicadores sociais - 2003. Disponível em http://www.ibge.gov.br. [Acessado em 20 de abril de 2004]
3. PNUD. Programa das Nações Unidas para o Desenvolvimento. Relatório de desenvolvimento humano: racismo, pobreza e violência - 2005. Disponível em http://www.pnud.org.br/rdh/ [Acessado em 13 de maio de 2005]
4. Silva NV. Cor e mobilidade ocupacional. In: Silva NV, Pastore J. Mobilidade social no Brasil. São Paulo: Makron Books; 2000. p. 40-49.
5. DIEESE. Síntese de indicadores sociais - 2000. Disponível em http://www.sindieletromg. org/dienegro.htm. [Acessado em 17 de agosto de 2004].
6. Paixão M. Novos marcos para as relações sociais. Rio de Janeiro: Fase; 2000.
7. IPEA. Instituto de Pesquisas Econômicas Aplicadas - 2003. Boletim de Conjuntura, no 62, setembro de 2003. Disponível em http://www.ipea.gov.br/default.jsp. [Acessado em 12 de novembro de 2004]
8. Waiselfisz JJ. Mapa da violência IV: os jovens do Brasil. Rio de Janeiro: UNESCO; 2004.
9. Cooper RA. Note on the biologic concept of race and its application in epidemiologic research. Am Heart J 1984; 108(3): part 2.
10. James AS, Strogatz DS, Wing SB, Ramsey DL. Socioeconomic status, John Henryism, and hypertension in blacks and whites. Am J Epidemiol 1987; 126: 664-73.
560Rev Bras Epidemiol2010; 13(4): 549-60
Spatial distribution of mortality by homicide and social inequalities according to race/skin colorAraújo, E.M. et al.
11. Osborne NG. The use of race in medical research. JAMA 1992; 267: 275-9.
12. Barbosa MIS. Racismo e saúde [tese de doutorado]. São Paulo: Faculdade de Saúde Pública da Universidade de São Paulo; 1998.
13. Krieger N. Discrimination and health. In: Berkman LF, Kawachi I. Social epidemiology. New York: Oxford University Press; 2000. p. 36-75.
14. Williams DR. Understanding and addressing racial disparities in health care. Health Care Financ 2000; 21(4): 75-90.
15. Lopes F. Raça, saúde e vulnerabilidades. In: Raça, etnia e saúde. Boletim do Instituto de Saúde, no 31. São Paulo: Imprensa Oficial do Estado; dezembro de 2003. p. 7-13.
16. Pearce N et al. Genetics, race, ethnicity and health. BMJ 2004; 328: 1.
17. Santos M. A natureza do espaço. Rio de Janeiro: Hucitec; 1997.
18. Paim JS. Abordagens teórico-conceituais em estudos de condições de vida e saúde: notas para reflexão e ação. In: Barata RB (org). Condições de vida e situação de saúde. Rio de Janeiro: ABRASCO; 1997. p. 7-29.
19. Santos M. O espaço do cidadão. São Paulo: Nobel; 1998.
20. Noronha CV, Machado EP, Tapparelli G, Cordeiro TRF, Laranjeiral DHP, Santos CAT. Violência, etnia e cor: um estudo dos diferenciais na região metropolitana de Salvador, Bahia, Brasil. Panam Salud Publica 1999; 5(4-5): 268-77.
21. FCCV. Fórum Comunitário de Combate de Violência. Rastro da violência em Salvador: mortes violentas de residentes em Salvador: FCCV/UFBA/UNICEF; 1998. p. 1-3.
22. Instituto Brasileiro de Geografia e Estatística - IBGE. Dados digitais de área de ponderação, 2003. Disponível em: www.ibge.org. [Acesso em 03 de fevereiro de 2006].
23. Anselin L. An introduction to spatial regression analysis. In: R University of Illinois, Urbana-Champaign, 2003. Disponível em http://sal.agecon.uiuc.edu. [Acessado em 18 de dezembro de 2005]
24. Jannuzzi PM. Principais indicadores sociais: significados e usos para política social. In: Indicadores Sociais no Brasil. Alínea; 2003. p. 65-126.
25. Minayo MCS. Souza ER. Violência para todos. Cad Saúde Publica 1993; 9(1): 65-78.
26. Rosenberg ML, O’Carroll PW, Powell KE. Let’s be clear: violence is a public health problem. JAMA 1992; 267(22): 3071-2.
27. Whitman S. Benbow N. Good G. The epidemiology of homicide in Chicago. J National Medical Association 1996; 88(12): 781-7.
28. Marshall RJ. Mapping disease and mortality rates using empirical Bayes estimators. Applied Statistics 1991; 40: 283-94.
29. Bailey, TC. Interactive spatial data analysis in medical geography. Soc Sci Med 1996; 42(6): 843-55.
30. Williams DR, Collins C. Racial residential segregation: a fundamental cause of racial disparities in health. Public Health Rep 2001; 116(5): 404-16.
31. Anselin, L. Local indicators of spatial association – LISA. Geographic Analytical 1995; 27: 93-115.
32. Fotheringham AS, Brunsdon C, Charlton M. Geographically weighted regression. West Sussex: John Wiley & Sons; 2002.
33. Stata Corporation. Stata Statistical Software Intercooled Stata 8.0. College Station TX: USA; 2003.
34. GeoDa 0.9.5.i5 (beta) (Spatial Analysis Laboratory, University of Illinois, Urbana-Chanpaign), USA.
35. ESRI Inc. ARC VIEW version 3.2. Environmental Systems Research Institute Inc.: New York; 1998.
36. R Development Core Team (2009). R: A language and environment for statistical computing. R Foundation for Statistical Computing, Vienna, Austria. ISBN 3-900051-07-0, URL. Disponível em http://www.R-project.org. [Acesso em 14 de janeiro de 2009].
37. Orfield G. Consequences of a Decade of Resegregation. Cambridge, MA: The Civil Rights Project, Harvard University; 2001.
38. Silva AF, Silva VP. Nos limites do viver: moradia e segregação socioespacial nas áreas metropolitanas do Nordeste brasileiro. Scripta Nova. Revista Electrónica Geografia Y Ciencias Sociales 2003; 7(146): 129.
39. Macedo AC, Paim JS, Silva LMV, Costa MCN. Violência e desigualdade social: mortalidade por homicídios e condições de vida em Salvador, Brasil. Rev Saúde Pública 2001; 35(6): 515-22.
40. Lima MLC et al. Análise espacial dos determinantes socioeconômicos dos homicídios no Estado de Pernambuco. Rev Saúde Pública 2005; 39(2): 176-82.
41. Souza ER. Violência velada e revelada: estudo epidemiológico da mortalidade por causas externas em Duque de Caxias, RJ. Cad Saúde Pública 1993; 9: 48-64.
42. Mello Jorge MHP. Análise dos dados de mortalidade. Rev Saúde Pública 1997; 31: 5-25.
43. Barata RB, Ribeiro MCS. A relação entre homicídios e indicadores econômicos em São Paulo, Brasil, 1996. Rev Panam Salud Publica 2000; 17(2): 118-24.
44. Medronho RA. Estudos ecológicos. In: Medronho et al. Epidemiologia. Rio de Janeiro: Atheneu; 2002. p. 191-8.
Recebido em: 05/06/09Versão final reapresentada em: 15/04/10
Aprovado em: 22/05/10


![Spatial analysis between particulate matter and emergency ... · 2.5 concentration and mortality using spatial analysis [14]. Other studies have investigated the relationship be-tween](https://img.pdfslide.net/doc/110x75/5cca292088c993e4268e0858/spatial-analysis-between-particulate-matter-and-emergency-25-concentration.jpg)