Embed Size (px)
Citation preview
Spatial ecological and economic subsidies of the monarch butterfly (Danaus plexippus) in eastern
North America
Darius J. Semmens1, Kenneth J. Bagstad1, Ruscena Wiederholt2, Joshua Goldstein3, John Loomis4, James E. Diffendorfer1, Karen Oberhauser5, Leslie Ries6, Wayne E. Thogmartin7, Brady J. Mattsson8, Brice X. Semmens9,and Laura Lopez-Hoffman10 1Geosciences & Environmental Change Science Center, U.S. Geological Survey, Denver, CO 80225, [email protected], [email protected], [email protected]; 2Everglades Foundation, Palmetto Bay, [email protected]; 3Office of the Chief Scientist, The Nature Conservancy, Fort Collins, [email protected];4DepartmentofAgricultural&ResourceEconomics,ColoradoStateUniversity,FortCollins,[email protected];5DepartmentofFisheries,WildlifeandConservationBiology,UniversityofMinnesota,St. Paul, MN [email protected]; 6Department of Biology, Georgetown University, Washington [email protected]; 7UpperMidwestEnvironmentalSciencesCenter,U.S.GeologicalSurvey,LaCrosse,WI [email protected]; 8Institute of Silviculture, University of Natural Resources and Life Sciences, Vienna,Austria [email protected]; 9Scripps Institution of Oceanography, University of California, La Jolla, [email protected];10SchoolofNaturalResourcesandEnvironment,UniversityofArizona,andUdallCenterforStudiesinPublicPolicy,Tucson,[email protected]
Environmental Policy Working Paper
Udall Center for Studies in Public Policy
The University of Arizona
September 2017
1
Spatial ecological and economic subsidies of the monarch butterfly (Danaus plexippus) in eastern North America
Darius J. Semmens1, Kenneth J. Bagstad1, Ruscena Wiederholt2, Joshua Goldstein3, John Loomis4, James E. Diffendorfer1, Karen Oberhauser5, Leslie Ries6, Wayne E. Thogmartin7, Brady J. Mattsson8, Brice X. Semmens9, and Laura Lopez-Hoffman10
1Geosciences & Environmental Change Science Center, U.S. Geological Survey, Denver, CO 80225, [email protected], [email protected], [email protected]; 2Everglades Foundation, Palmetto Bay, [email protected]; 3Office of the Chief Scientist, The Nature Conservancy, Fort Collins, [email protected];4DepartmentofAgricultural&ResourceEconomics,ColoradoStateUniversity,FortCollins,[email protected];5DepartmentofFisheries,WildlifeandConservationBiology,UniversityofMinnesota,St. Paul, MN [email protected]; 6Department of Biology, Georgetown University, Washington [email protected]; 7UpperMidwestEnvironmentalSciencesCenter,U.S.GeologicalSurvey,LaCrosse,WI [email protected]; 8Institute of Silviculture, University of Natural Resources and Life Sciences, Vienna,Austria [email protected]; 9Scripps Institution of Oceanography, University of California, La Jolla, [email protected];10SchoolofNaturalResourcesandEnvironment,UniversityofArizona,andUdallCenterforStudiesinPublicPolicy,Tucson,[email protected]
ABSTRACT The monarch butterfly migration of eastern North America has declined substantially over the last two decades. As the three nations spanned by their migration embark upon a tri-national conservation effort aimed at reversing this decline, numerous quantitative ecological analyses have been conducted to inform conservation planning. In addition to this ecological information, it is also important to consider socioeconomic factors that can provide an indication of societal benefit from the monarch butterfly and willingness to engage in conservation activities throughout the migratory range. To this end, we quantified the spatial subsidies—a measure of the mismatch between where people receive economic benefits from a migratory species and where the migratory species receives ecological benefits from ecosystems—generated by the annual monarch migration across eastern North America. Spatial subsidies explicitly link human beneficiaries of ecosystem services derived from migratory species with the ecosystems upon which those benefits depend. Despite the ecological importance of the monarch’s breeding range, we found that social benefits provided by monarchs in the U.S. and Canada are being subsidized at a regional level by migration and overwintering habitat in Mexico. This subsidy results primarily from the much larger number of people living in the northern portion of the monarch range who benefit from the cultural ecosystem services provided by monarchs. At a sub-regional level, results from a hypothetical example suggest that rural landowners are subsidizing urban residents throughout the monarch range, linking rural conservation investment to urban benefits.
2
INTRODUCTION
Animal migration is a widespread phenomenon that poses particular challenges for conservation (Martin et al. 2007; Kirby et al. 2008; Wilcove and Wekelski 2008; Robinson et al. 2009). In contrast to non-migratory species, for which conservation actions can focus on the preservation and restoration of habitat in one ecosystem, migratory species can utilize habitat in many different ecosystems over the course of their migratory cycle. Further, they must traverse increasingly human-dominated landscapes and, often, multiple jurisdictional and political boundaries. As a result, migratory species are particularly vulnerable to anthropogenic landscape change. Indeed, many of the world’s most spectacular migrations have either disappeared due to human activities or are in steep decline (Wilcove and Wekelski 2008; Harris et al. 2009).
The regularity of wildlife migration connects distant landscapes and people in a predictable way. Because of this regular movement, the presence of a migratory species in any one portion of its range is dependent, at least in part, upon the continued existence of favorable conditions in all other portions of its range. Benefits people receive from the species at any given location are therefore sourced from the entirety of its migratory range rather than just local habitat. Given these observations, the spatial subsidy at a location is defined as the difference between the socioeconomic benefits supported by the location but received elsewhere and the socioeconomic benefits received at the locationbut supported by other areas (Semmens et al. 2011; Lopez-Hoffman et al. 2013). It measures the degree to which the provision of benefits (ecosystem services) by a species in one location is subsidized by ecological conditions and processes that support the species in other locations. As such, spatial subsidies are a specific example of the more broadly defined concept of telecoupling, which refers to socioeconomic and environmental interactions over distances (Liu et al. 2013).
Although ecosystem services, the benefits provided by nature (MEA, 2005), are most commonly associated with whole ecosystems, a growing body of work describes the ecosystem services provided by migratory species (e.g. Wenny et al. 2011; Bauer and Hoye 2014; Diffendorfer et al. 2014; Green and Elmberg 2014; Lopez-Hoffman et al. 2014). The monetary and non-monetary value of these services have been suggested as a means to address the adverse effects of socio-political borders on conservation (Lopez-Hoffman et al. 2010; Semmens et al. 2011; Dallimer and Strange 2015), the spatial mismatches that can occur between service providers and beneficiaries (Kremen et al. 2007; Semmens et al. 2011; Lopez-Hoffman et al. 2013; Rubio-Cisneros et al. 2014), and the need for specific rationales for including species conservation in land-use and development decisions (Wenny et al. 2011, Green and Elmberg 2014).
Estimating the extent to which migratory species and the services they provide depend on different parts of the migratory range is a key requirement of the spatial subsidy approach. Understanding the relative contribution of discrete habitat areas to the population dynamics of a migratory species is important for developing conservation strategies; it can aid in decision analyses, reserve design, and conservation spending decisions. A variety of model-based approaches have been used to make comparisons of different sites in terms of their contribution to overall population growth or viability. In particular, sensitivity analyses on multisite demographic and metapopulation models can reveal the relative importance of different sites (e.g. Greene and Beechie 2004; Touloumis and Stamou 2009). Quantifying the relative importance of sites is particularly important for addressing the ecosystem services provided by
3
wildlife because it provides a means of linking human value derived from a species to the specific habitat responsible for supporting this value.
Monarch butterfly case study We calculate spatial subsidies for the monarch butterfly (Danaus plexippus) migratory population in eastern North America. The monarch butterfly is an iconic North American insect characterized by a spectacular and highly visible annual migration across the continent, from overwintering grounds in central Mexico to summer breeding habitat that extends well into southeastern Canada. The annual migration can take as many as five generations to complete and directly exposes millions of people to the monarch life cycle where they work and play. Numerous studies have documented the importance of monarchs to people, which is reflected in their willingness to donate to and engage in monarch conservation efforts (Diffendorfer et al. 2014), volunteer for monarch citizen science (Ries and Oberhauser 2015), visit overwintering sites (Brenner and Job 2006), and organize diverse partnerships across social boundaries for monarch conservation (Gustafsson et al. 2015).
Despite their importance to people, the monarch population has undergone a precipitous decline over the last two decades (Vidal and Rendón-Salinas, 2014). This decline was initially attributed to logging activities and the associated degradation of macro- and micro-climatic conditions at the overwintering (OW) sites within the Monarch Butterfly Biosphere Reserve (MBBR; Brower et al. 2002). Official designation of the MBBR in 1986 did not address the socioeconomic conditions in the region, for which wood products were an important source of income, and logging continued to degrade monarch OW habitat (Missrie and Nelson 2005; Brenner and Job 2006). To address this problem, a capital fund, the Monarch Butterfly Conservation Fund (MBCF), was established in 2000 with US$6.5 million in grants from the Packard Foundation, the Mexican federal government, and the States of México and Michoacán to provide direct payments to rural landowners in exchange for relinquishing logging permits and performing conservation activities. Interest from the capital fund was used to pay communities with logging permits in the MBBR US$18.00/m3 of wood relinquished per year, and $8.00/ha of land they owned for conservation activities each year. Communities with no logging permits received $12.00/ha of land they owned for conservation activities each year. Once all of the 10-year logging permits had expired, the MBCF transitioned to paying all landowners $12/ha/year for conservation activities. After its first 10 years of operation, the MBCF had disbursed US$3.3 million to participating forest communities.
Conservation payment amounts in the MBBR were based on a cost analysis of forest resources in the region and also considered the amount available in the capital fund, the number of communities to be paid, and the willingness of communities to accept the amount (Missrie and Nelson 2005). At US$18/m3, the final conservation payments were substantially lower than the market value of the timber, which ranged from $35 to $60, and thus reflected substantial willingness to conserve the forest on behalf of the local communities (Missire and Nelson 2005). Although dire regional social and economic problems remain, this arrangement has succeeded in greatly reducing deforestation within the MBBR, where conditions have now been largely stabilized since 2009 (Vidal et al. 2014; Shahani et al. 2015).
4
More recently, evidence has suggested that the continuing decline of the monarch population is likely a result of habitat loss to agriculture in the U.S. (Pleasants and Oberhauser, 2012; Flockhart et al. 2014; Oberhauser et al. 2017). Monarchs lay eggs on many species of milkweed (Asclepias spp.) that developing larvae require for food. Declines in milkweed abundance are well documented and highly correlated with increases in herbicide use as farmers adopted herbicide-tolerant genetically modified corn and soybeans (Pleasants and Oberhauser 2012), which now constitute 92% and 94% of these crops, respectively, in the U.S. (Fernandez-Cornejo 2015). Blanket application of herbicides has largely eliminated milkweed from agricultural fields, which were formerly the most productive milkweed on the landscape (Oberhauser et al. 2001). An analysis of restoration potential in the U.S. further indicates that achieving the goal of restoring the monarch population to 6 ha of overwintering colonies (Vilsack and McCarthy 2015) will be difficult to accomplish without getting milkweed back into agricultural land (Thogmartin et al. 2017).
The monarch population decline and correspondingly elevated risk of losing the Eastern monarch migration (Semmens et al. 2016) have galvanized support for conservation across the continent. In 2014, the Presidents of Mexico and the U.S. and the Prime Minister of Canada agreed to set up a task force to devise a plan for saving the continent’s migration of monarch butterflies (Baker and Malkin 2014). This type of multi-national conservation effort for a migratory species brings up questions about the equitable division of funding and investment by the various countries involved. Should all countries involved be contributing equally? Does it matter who values monarchs and where they live? What if the ecosystem(s) in one country are disproportionately important to the overall viability of the migratory population? The concept of spatial subsidies (Semmens et al. 2011) was developed to address these questions by balancing biological and socioeconomic factors across the full range of a migratory species. We use the approach to quantify the link between habitat supporting the monarch migration and human beneficiaries of ecosystem services provided by monarchs.
METHODS
Quantifying the spatial subsidies for monarchs involved estimating two key parameters across their migratory range: the value the species provides, directly and indirectly, to humans at each location, VSA, and the extent to which their overall population viability is dependent upon each of the same locations, DSA. The spatial subsidy at each location, YA, was then calculated using the following equation (Semmens et al. 2011):
𝑌! = 𝑉!𝐷!" − 𝑉!" (1) Where VS is the total value provided by the species S to humans across all locations, A… n. The locations, or regions in our monarch example, can be defined in any way that is appropriate for the species (e.g. life history) or its management (e.g. political boundaries), so long as they encompass the full migratory range and are consistent for both the ecological and socioeconomic components of the analysis. Estimating the value provided in and proportional dependence on each part of their range, VSA and DSA, respectively, represented the bulk of the effort needed to quantify spatial subsidies for monarchs. The process we followed to quantify each of these parameters is described in more detail below.
Estimating Proportional Dependence
5
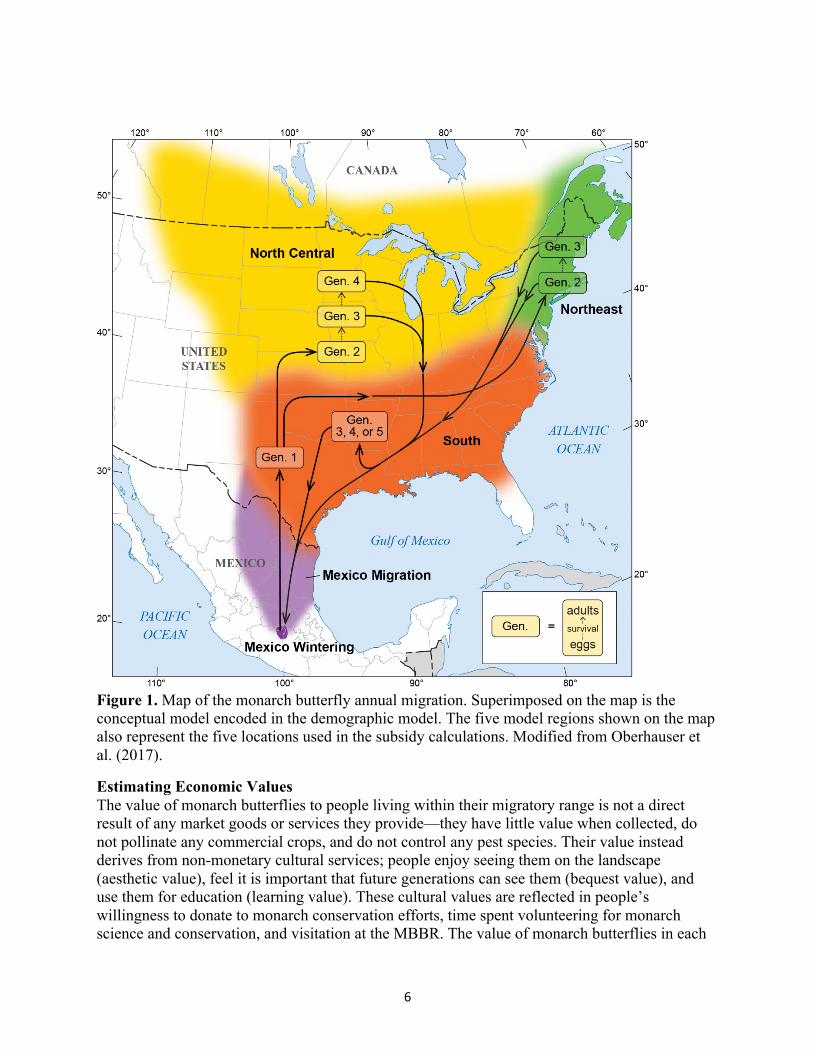
Our DSA calculations were derived from a spatially explicit Bayesian demographic matrix model (Oberhauser et al. 2017) that included adults overwintering in Mexico, the migration of overwintered adults to breeding grounds in the southern U.S., reproduction by these adults leading to the first generation of the year, movement of this first generation into the north-central and northeastern breeding grounds (modeled separately), multiple cycles of reproduction in these two northern regions, and late summer/fall migration back to Mexico (Figure 1). To correctly tune demographic parameters to reasonable values, we fitted the model to overwintering population trends from 1993 to 2015. Because it is difficult to estimate accurately the number of monarchs during any stage of their migratory cycle, the combined area occupied by overwintering monarch colonies in central Mexico, where the vast majority of the population coalesces, was used as a proxy for population size (Brower et al. 2012). Overwintering colony areas 1993-2015 were corrected to estimate “true” population size via a Bayesian multivariate auto-regressive state-space model (Semmens et al. 2016).
We evaluated the relative importance of the different model regions by running seven different simulations, one for each region and time period: Mexican overwintering grounds, Mexican migration, Southern Spring, North Central, Northeast, and Southern Fall (Figure 1). For each region, we simultaneously increased fecundity and survival for that region by 5% and recorded the new mean population growth rate. We then calculated the percent change in mean population growth rate relative to the baseline value. DS was calculated by normalizing the percent change values such that they summed to one across all regions, a requirement of the DS parameter (Semmens et al. 2011).
6
Figure 1. Map of the monarch butterfly annual migration. Superimposed on the map is the conceptual model encoded in the demographic model. The five model regions shown on the map also represent the five locations used in the subsidy calculations. Modified from Oberhauser et al. (2017).
Estimating Economic Values The value of monarch butterflies to people living within their migratory range is not a direct result of any market goods or services they provide—they have little value when collected, do not pollinate any commercial crops, and do not control any pest species. Their value instead derives from non-monetary cultural services; people enjoy seeing them on the landscape (aesthetic value), feel it is important that future generations can see them (bequest value), and use them for education (learning value). These cultural values are reflected in people’s willingness to donate to monarch conservation efforts, time spent volunteering for monarch science and conservation, and visitation at the MBBR. The value of monarch butterflies in each
7
model region was estimated to be the sum of the value of volunteer time devoted to monarchs, willingness to donate for monarch conservation, and for the overwintering region, income generated from visitation at the MBBR. The methods used for each value type are described separately below.
Volunteer time. Volunteer hours for monarch-centric citizen science were recently compiled by Ries and Oberhauser (2015). They estimated the total number of hours invested by volunteers in 2011 for various different activities across 11 different monitoring programs in North America. To assign a value to this time, we obtained data on the value of a volunteer hour from Independent Sector, an organization that tracks and publishes information about volunteerism and its value in the United States, for all U.S. states (Independent Sector, 2015) for the year 2010. We converted all values to 2012 U.S. dollars using the Bureau of Labor Statistics’ CPI Inflation Calculator (BLS 2015), for direct comparability with a monarch willingness to pay survey (see below) conducted in 2012 (Diffendorfer et al. 2014).
We obtained values for volunteer time in Canada from Statistics Canada for 2011 (Statistics Canada 2015). In the U.S., Independent Sector uses the average hourly wage estimates for all production and non-supervisory workers on private non-farm payrolls. Statistics Canada does not report wage rates separately for these groups, so we used their raw mean hourly wage data for each province. We then inflated values by 12% to account for fringe benefits, following Independent Sector’s U.S.-based approach, for consistency, and converted Canadian to U.S. dollars using the Penn World Table (Feenstra et al. 2013).
Lacking hourly wage rate data for Mexico, particularly at the state level, we obtained 2008 per capita state-level GDP data from the Instituto Nacional de Estadística y Geografía (INEGI), converted per capita GDP to U.S. dollars using the Penn World Tables, and divided per capita GDP by 2080 hours (40 hours/week × 52 weeks/yr) to obtain a coarse estimate of hourly wage rates. Although this is an admittedly rough proxy value for wage rates, volunteer time in Mexico accounts for only 0.2% of the total volunteer hours spent across the monarchs’ range, so these estimates have a relatively small impact on the overall subsidy calculation.
Using a 1-degree point GIS layer summarizing volunteer hours across Canada, the U.S., and Mexico, we assigned each point to (1) its appropriate province or state, and (2) its appropriate monarch migratory region corresponding to results from the monarch migratory model. We multiplied the total volunteer hours for each point by the appropriate state or provincial volunteer wage rate. For points located on the border of two or more states, we averaged the volunteer wage rate value across the appropriate states. This yielded a total value of volunteer labor for each point. We then summed the values for each of the six monarch regions—Mexico Overwintering, Mexico Migration, South, Northeast, and North Central.
Willingness to Donate. Willingness to pay (WTP) or donate to monarch conservation was analyzed via a national survey of U.S. households in 2012 (Diffendorfer et al. 2014). The online survey of ~2000 randomly selected households was designed to provide a stratified random sample that was demographically and economically representative of all U.S. households. It asked questions about willingness to donate to conserve monarch habitat. We intersected the model regions map with a map of survey responses to get the average WTP for households in each U.S. region (Figure 1). We used spatially explicit human population density data for the year 2011 from LandScan High-Resolution Global Population Data Set (UT-Battelle, LLC,
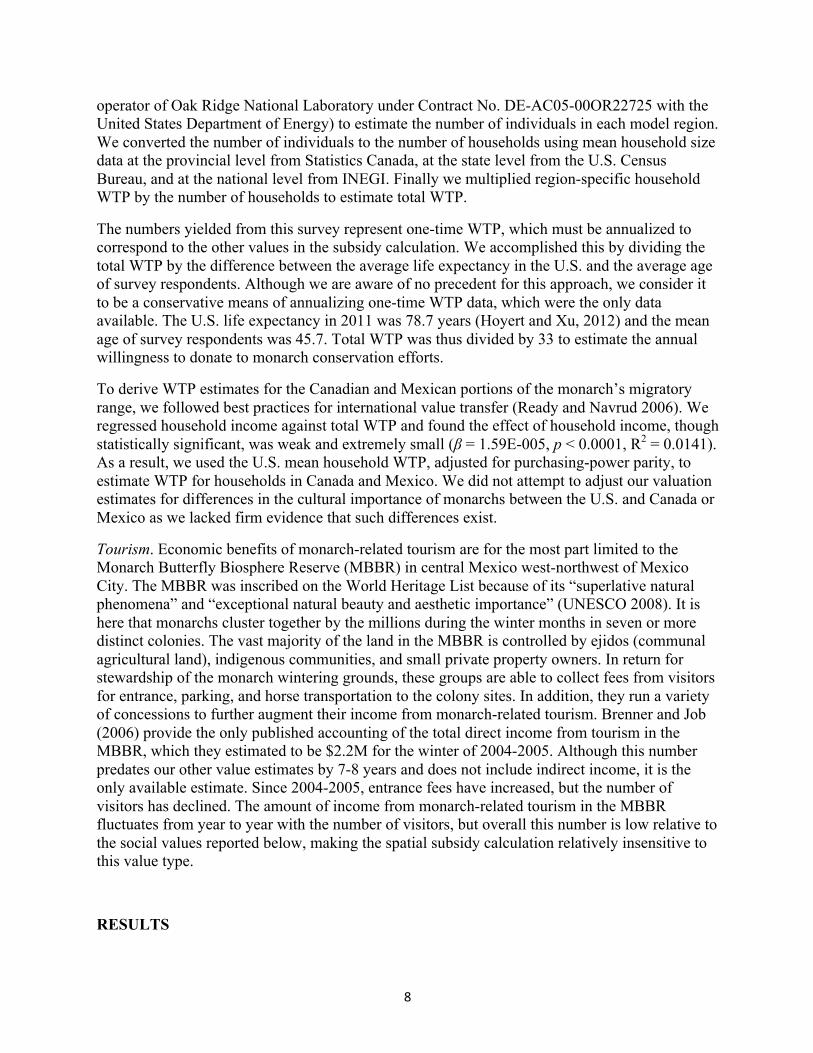
8
operator of Oak Ridge National Laboratory under Contract No. DE-AC05-00OR22725 with the United States Department of Energy) to estimate the number of individuals in each model region. We converted the number of individuals to the number of households using mean household size data at the provincial level from Statistics Canada, at the state level from the U.S. Census Bureau, and at the national level from INEGI. Finally we multiplied region-specific household WTP by the number of households to estimate total WTP.
The numbers yielded from this survey represent one-time WTP, which must be annualized to correspond to the other values in the subsidy calculation. We accomplished this by dividing the total WTP by the difference between the average life expectancy in the U.S. and the average age of survey respondents. Although we are aware of no precedent for this approach, we consider it to be a conservative means of annualizing one-time WTP data, which were the only data available. The U.S. life expectancy in 2011 was 78.7 years (Hoyert and Xu, 2012) and the mean age of survey respondents was 45.7. Total WTP was thus divided by 33 to estimate the annual willingness to donate to monarch conservation efforts.
To derive WTP estimates for the Canadian and Mexican portions of the monarch’s migratory range, we followed best practices for international value transfer (Ready and Navrud 2006). We regressed household income against total WTP and found the effect of household income, though statistically significant, was weak and extremely small (β = 1.59E-005, p < 0.0001, R2 = 0.0141). As a result, we used the U.S. mean household WTP, adjusted for purchasing-power parity, to estimate WTP for households in Canada and Mexico. We did not attempt to adjust our valuation estimates for differences in the cultural importance of monarchs between the U.S. and Canada or Mexico as we lacked firm evidence that such differences exist.
Tourism. Economic benefits of monarch-related tourism are for the most part limited to the Monarch Butterfly Biosphere Reserve (MBBR) in central Mexico west-northwest of Mexico City. The MBBR was inscribed on the World Heritage List because of its “superlative natural phenomena” and “exceptional natural beauty and aesthetic importance” (UNESCO 2008). It is here that monarchs cluster together by the millions during the winter months in seven or more distinct colonies. The vast majority of the land in the MBBR is controlled by ejidos (communal agricultural land), indigenous communities, and small private property owners. In return for stewardship of the monarch wintering grounds, these groups are able to collect fees from visitors for entrance, parking, and horse transportation to the colony sites. In addition, they run a variety of concessions to further augment their income from monarch-related tourism. Brenner and Job (2006) provide the only published accounting of the total direct income from tourism in the MBBR, which they estimated to be $2.2M for the winter of 2004-2005. Although this number predates our other value estimates by 7-8 years and does not include indirect income, it is the only available estimate. Since 2004-2005, entrance fees have increased, but the number of visitors has declined. The amount of income from monarch-related tourism in the MBBR fluctuates from year to year with the number of visitors, but overall this number is low relative to the social values reported below, making the spatial subsidy calculation relatively insensitive to this value type.
RESULTS
9
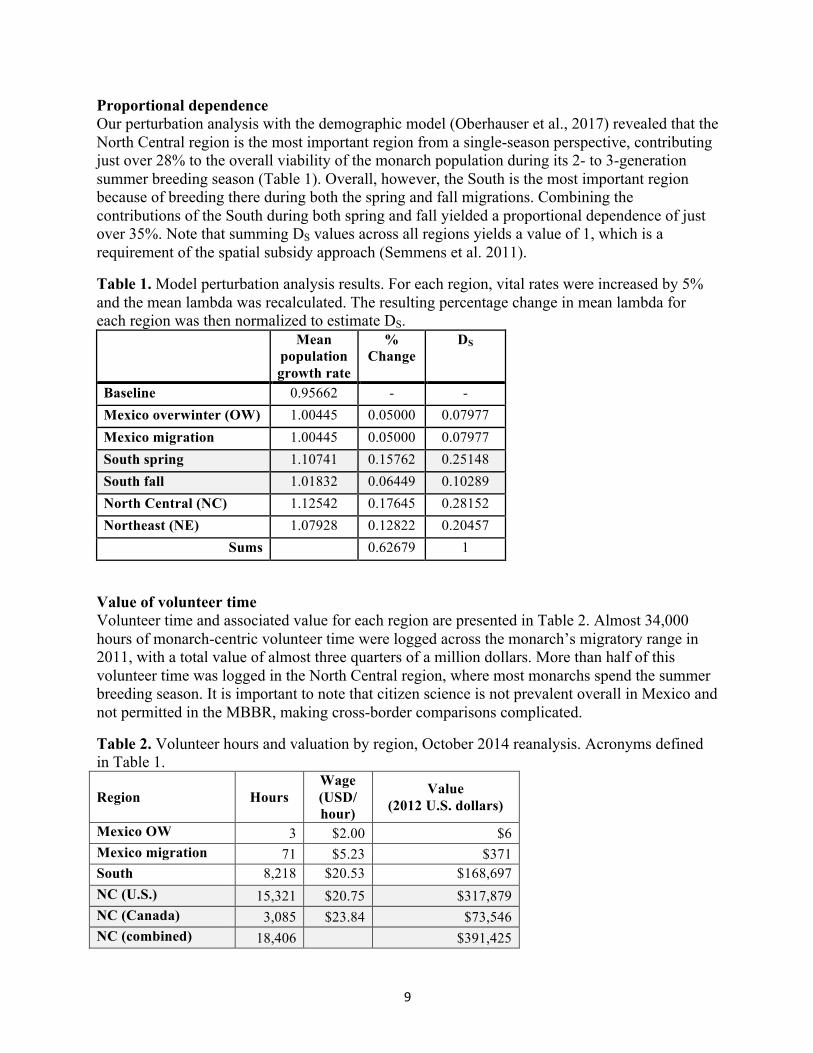
Proportional dependence Our perturbation analysis with the demographic model (Oberhauser et al., 2017) revealed that the North Central region is the most important region from a single-season perspective, contributing just over 28% to the overall viability of the monarch population during its 2- to 3-generation summer breeding season (Table 1). Overall, however, the South is the most important region because of breeding there during both the spring and fall migrations. Combining the contributions of the South during both spring and fall yielded a proportional dependence of just over 35%. Note that summing DS values across all regions yields a value of 1, which is a requirement of the spatial subsidy approach (Semmens et al. 2011).
Table 1. Model perturbation analysis results. For each region, vital rates were increased by 5% and the mean lambda was recalculated. The resulting percentage change in mean lambda for each region was then normalized to estimate DS.
Mean population growth rate
% Change
DS
Baseline 0.95662 - - Mexico overwinter (OW) 1.00445 0.05000 0.07977 Mexico migration 1.00445 0.05000 0.07977 South spring 1.10741 0.15762 0.25148 South fall 1.01832 0.06449 0.10289 North Central (NC) 1.12542 0.17645 0.28152 Northeast (NE) 1.07928 0.12822 0.20457
Sums 0.62679 1
Value of volunteer time Volunteer time and associated value for each region are presented in Table 2. Almost 34,000 hours of monarch-centric volunteer time were logged across the monarch’s migratory range in 2011, with a total value of almost three quarters of a million dollars. More than half of this volunteer time was logged in the North Central region, where most monarchs spend the summer breeding season. It is important to note that citizen science is not prevalent overall in Mexico and not permitted in the MBBR, making cross-border comparisons complicated.
Table 2. Volunteer hours and valuation by region, October 2014 reanalysis. Acronyms defined in Table 1.
Region Hours Wage (USD/ hour)
Value (2012 U.S. dollars)
Mexico OW 3 $2.00 $6 Mexico migration 71 $5.23 $371 South 8,218 $20.53 $168,697 NC (U.S.) 15,321 $20.75 $317,879 NC (Canada) 3,085 $23.84 $73,546 NC (combined) 18,406 $391,425
10
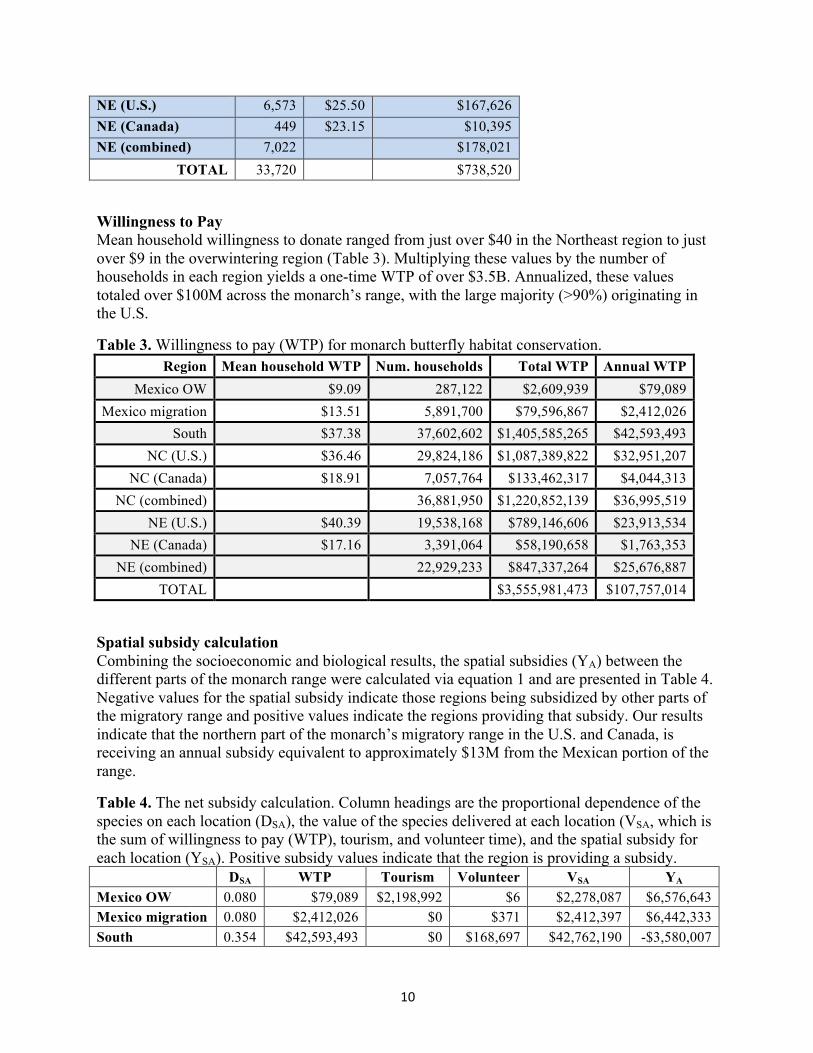
NE (U.S.) 6,573 $25.50 $167,626 NE (Canada) 449 $23.15 $10,395 NE (combined) 7,022 $178,021
TOTAL 33,720 $738,520
Willingness to Pay Mean household willingness to donate ranged from just over $40 in the Northeast region to just over $9 in the overwintering region (Table 3). Multiplying these values by the number of households in each region yields a one-time WTP of over $3.5B. Annualized, these values totaled over $100M across the monarch’s range, with the large majority (>90%) originating in the U.S.
Table 3. Willingness to pay (WTP) for monarch butterfly habitat conservation. Region Mean household WTP Num. households Total WTP Annual WTP
Mexico OW $9.09 287,122 $2,609,939 $79,089 Mexico migration $13.51 5,891,700 $79,596,867 $2,412,026
South $37.38 37,602,602 $1,405,585,265 $42,593,493 NC (U.S.) $36.46 29,824,186 $1,087,389,822 $32,951,207
NC (Canada) $18.91 7,057,764 $133,462,317 $4,044,313 NC (combined) 36,881,950 $1,220,852,139 $36,995,519
NE (U.S.) $40.39 19,538,168 $789,146,606 $23,913,534 NE (Canada) $17.16 3,391,064 $58,190,658 $1,763,353
NE (combined) 22,929,233 $847,337,264 $25,676,887 TOTAL $3,555,981,473 $107,757,014
Spatial subsidy calculation Combining the socioeconomic and biological results, the spatial subsidies (YA) between the different parts of the monarch range were calculated via equation 1 and are presented in Table 4. Negative values for the spatial subsidy indicate those regions being subsidized by other parts of the migratory range and positive values indicate the regions providing that subsidy. Our results indicate that the northern part of the monarch’s migratory range in the U.S. and Canada, is receiving an annual subsidy equivalent to approximately $13M from the Mexican portion of the range.
Table 4. The net subsidy calculation. Column headings are the proportional dependence of the species on each location (DSA), the value of the species delivered at each location (VSA, which is the sum of willingness to pay (WTP), tourism, and volunteer time), and the spatial subsidy for each location (YSA). Positive subsidy values indicate that the region is providing a subsidy. DSA WTP Tourism Volunteer VSA YA Mexico OW 0.080 $79,089 $2,198,992 $6 $2,278,087 $6,576,643 Mexico migration 0.080 $2,412,026 $0 $371 $2,412,397 $6,442,333 South 0.354 $42,593,493 $0 $168,697 $42,762,190 -$3,580,007
11
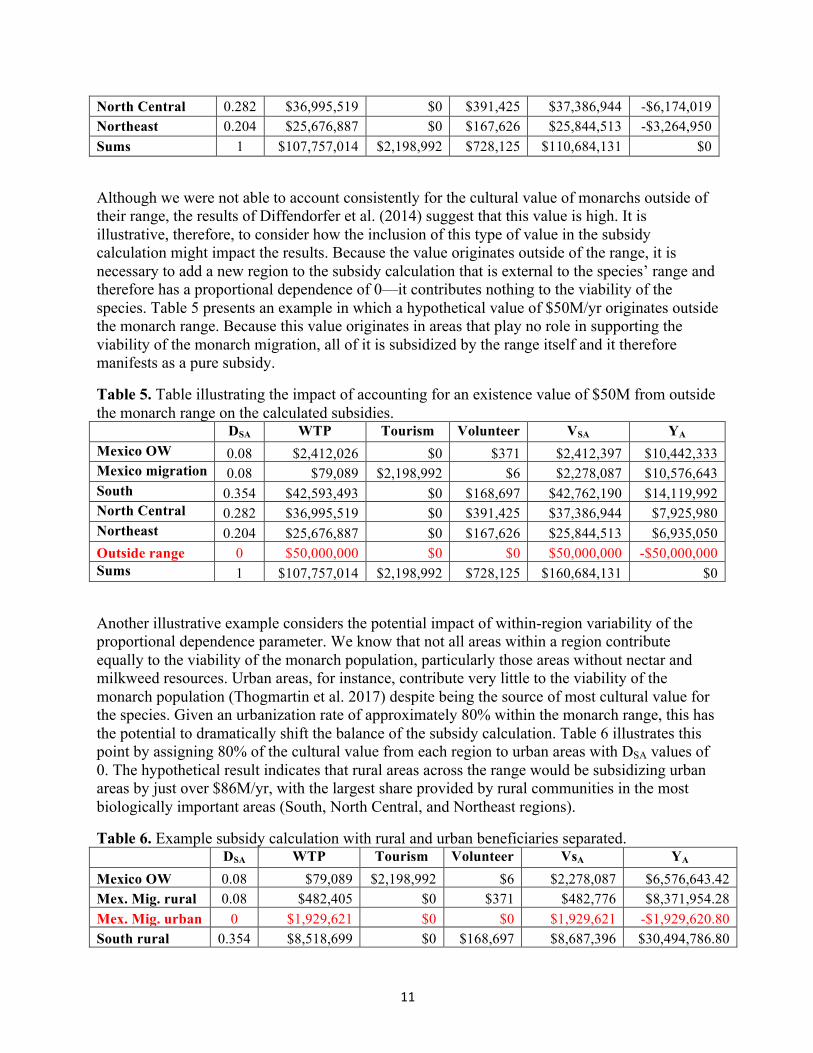
North Central 0.282 $36,995,519 $0 $391,425 $37,386,944 -$6,174,019 Northeast 0.204 $25,676,887 $0 $167,626 $25,844,513 -$3,264,950 Sums 1 $107,757,014 $2,198,992 $728,125 $110,684,131 $0
Although we were not able to account consistently for the cultural value of monarchs outside of their range, the results of Diffendorfer et al. (2014) suggest that this value is high. It is illustrative, therefore, to consider how the inclusion of this type of value in the subsidy calculation might impact the results. Because the value originates outside of the range, it is necessary to add a new region to the subsidy calculation that is external to the species’ range and therefore has a proportional dependence of 0—it contributes nothing to the viability of the species. Table 5 presents an example in which a hypothetical value of $50M/yr originates outside the monarch range. Because this value originates in areas that play no role in supporting the viability of the monarch migration, all of it is subsidized by the range itself and it therefore manifests as a pure subsidy.
Table 5. Table illustrating the impact of accounting for an existence value of $50M from outside the monarch range on the calculated subsidies.
DSA WTP Tourism Volunteer VSA YA Mexico OW 0.08 $2,412,026 $0 $371 $2,412,397 $10,442,333 Mexico migration 0.08 $79,089 $2,198,992 $6 $2,278,087 $10,576,643 South 0.354 $42,593,493 $0 $168,697 $42,762,190 $14,119,992 North Central 0.282 $36,995,519 $0 $391,425 $37,386,944 $7,925,980 Northeast 0.204 $25,676,887 $0 $167,626 $25,844,513 $6,935,050 Outside range 0 $50,000,000 $0 $0 $50,000,000 -$50,000,000 Sums 1 $107,757,014 $2,198,992 $728,125 $160,684,131 $0
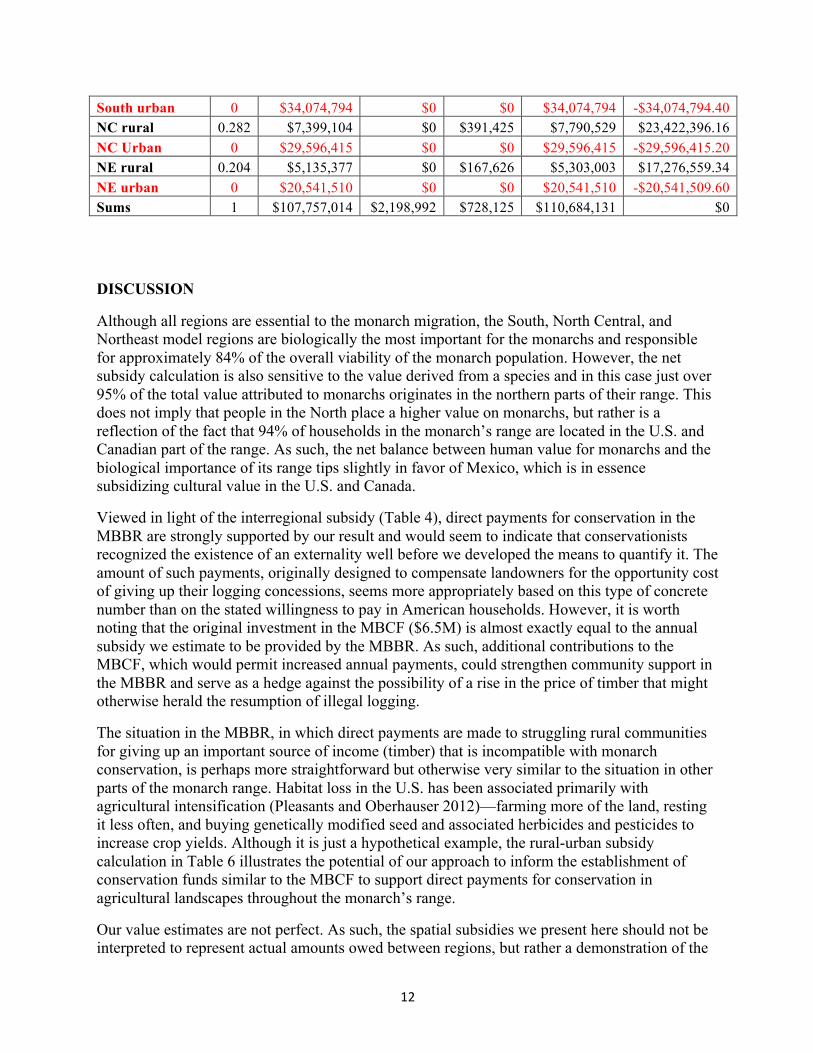
Another illustrative example considers the potential impact of within-region variability of the proportional dependence parameter. We know that not all areas within a region contribute equally to the viability of the monarch population, particularly those areas without nectar and milkweed resources. Urban areas, for instance, contribute very little to the viability of the monarch population (Thogmartin et al. 2017) despite being the source of most cultural value for the species. Given an urbanization rate of approximately 80% within the monarch range, this has the potential to dramatically shift the balance of the subsidy calculation. Table 6 illustrates this point by assigning 80% of the cultural value from each region to urban areas with DSA values of 0. The hypothetical result indicates that rural areas across the range would be subsidizing urban areas by just over $86M/yr, with the largest share provided by rural communities in the most biologically important areas (South, North Central, and Northeast regions).
Table 6. Example subsidy calculation with rural and urban beneficiaries separated. DSA WTP Tourism Volunteer VsA YA
Mexico OW 0.08 $79,089 $2,198,992 $6 $2,278,087 $6,576,643.42 Mex. Mig. rural 0.08 $482,405 $0 $371 $482,776 $8,371,954.28 Mex. Mig. urban 0 $1,929,621 $0 $0 $1,929,621 -$1,929,620.80 South rural 0.354 $8,518,699 $0 $168,697 $8,687,396 $30,494,786.80
12
South urban 0 $34,074,794 $0 $0 $34,074,794 -$34,074,794.40 NC rural 0.282 $7,399,104 $0 $391,425 $7,790,529 $23,422,396.16 NC Urban 0 $29,596,415 $0 $0 $29,596,415 -$29,596,415.20 NE rural 0.204 $5,135,377 $0 $167,626 $5,303,003 $17,276,559.34 NE urban 0 $20,541,510 $0 $0 $20,541,510 -$20,541,509.60 Sums 1 $107,757,014 $2,198,992 $728,125 $110,684,131 $0
DISCUSSION
Although all regions are essential to the monarch migration, the South, North Central, and Northeast model regions are biologically the most important for the monarchs and responsible for approximately 84% of the overall viability of the monarch population. However, the net subsidy calculation is also sensitive to the value derived from a species and in this case just over 95% of the total value attributed to monarchs originates in the northern parts of their range. This does not imply that people in the North place a higher value on monarchs, but rather is a reflection of the fact that 94% of households in the monarch’s range are located in the U.S. and Canadian part of the range. As such, the net balance between human value for monarchs and the biological importance of its range tips slightly in favor of Mexico, which is in essence subsidizing cultural value in the U.S. and Canada.
Viewed in light of the interregional subsidy (Table 4), direct payments for conservation in the MBBR are strongly supported by our result and would seem to indicate that conservationists recognized the existence of an externality well before we developed the means to quantify it. The amount of such payments, originally designed to compensate landowners for the opportunity cost of giving up their logging concessions, seems more appropriately based on this type of concrete number than on the stated willingness to pay in American households. However, it is worth noting that the original investment in the MBCF ($6.5M) is almost exactly equal to the annual subsidy we estimate to be provided by the MBBR. As such, additional contributions to the MBCF, which would permit increased annual payments, could strengthen community support in the MBBR and serve as a hedge against the possibility of a rise in the price of timber that might otherwise herald the resumption of illegal logging.
The situation in the MBBR, in which direct payments are made to struggling rural communities for giving up an important source of income (timber) that is incompatible with monarch conservation, is perhaps more straightforward but otherwise very similar to the situation in other parts of the monarch range. Habitat loss in the U.S. has been associated primarily with agricultural intensification (Pleasants and Oberhauser 2012)—farming more of the land, resting it less often, and buying genetically modified seed and associated herbicides and pesticides to increase crop yields. Although it is just a hypothetical example, the rural-urban subsidy calculation in Table 6 illustrates the potential of our approach to inform the establishment of conservation funds similar to the MBCF to support direct payments for conservation in agricultural landscapes throughout the monarch’s range.
Our value estimates are not perfect. As such, the spatial subsidies we present here should not be interpreted to represent actual amounts owed between regions, but rather a demonstration of the
13
potential of the approach. As noted above, we have extrapolated U.S. WTP data to Canada and Mexico based on income (ability to pay) alone. This approach assumes that cultural value for monarchs in all three countries is equivalent and cannot account for regionally higher or lower cultural importance. Further, participation in citizen science in Mexico is uncommon and does not account for volunteer time invested in monarch conservation activities within the MBBR or elsewhere, which are not tracked. Our values for volunteer time are thus likely a substantial underestimate for Mexico, which means we have overestimated the subsidy provided by Mexico. However, volunteer time in total makes up less than 1% of the annual value estimate (VS) for monarchs, so any overestimate of the subsidy would be small. Lastly, we have only included tourism revenues for the MBBR, which misses a few scattered locations where monarch tourism occurs in the eastern and southern U.S. The number of visitors at these locations, however, is small compared to the MBBR. The fact that MBBR visitation and associated revenues originate from outside of the monarch range does not pose a problem for the subsidy calculation because the revenues are received within the monarch range and are a direct result of monarchs. They are a local benefit, regardless of source, similar to hunting revenues for other species.
Monarchs were selected as a species with which to demonstrate the spatial subsidy approach partly because the value they provide to people is almost exclusively in the form of non-monetary cultural services (e.g. aesthetic, spiritual, learning, and bequest). Considering the spatial subsidies associated with a species that provides cultural rather than economic benefits necessitated addressing the implications of social value held for a species outside of its range. Including cultural value from outside the range of a species is logically consistent with the precepts of the spatial subsidy approach, but it changes the results substantially by cancelling out negative subsidies within the range and shifting the apparent responsibility for conservation investment to people who live outside of the range (Table 5). An understanding of the value originating outside of the range of a species may thus be useful for gauging the potential of a conservation market, or the level of support for government funding, but it raises important questions about how far from the range it is necessary to obtain social value information, particularly for non-use values. The spatial subsidy approach was designed inform the balance of social and ecological benefits within the range of the species where people own and manage the habitat and receive direct economic benefits from the species. We therefore feel that existence value originating outside the range of a species should be considered separately from the within-range subsidy calculation.
The subsidies we report in Table 4 for monarchs provide an important piece of information to decision makers, but not the only piece. For instance, the results suggest that income from monarch-related tourism in the MBBR is presently low relative to the importance people in North America place on protecting the monarchs. If funding were available, for example, from some form of conservation market, the subsidy calculation indicates that some of it could be used to further incentivize conservation in the Mexican portions of the range. However, the subsidy calculation does not give a complete picture of how to prioritize the allocation of conservation funding. The values used to estimate subsidies are overwhelmingly non-market values and not representative of the funding available for monarch conservation. The subsidies further represent a snapshot in time rather than a dynamic analysis of the system and therefore give no indication of the current population trend, drivers of that trend, or the effectiveness of conservation investments in different locations. The model we used to estimate proportional dependence values for this study was also used to explore and prioritize regional habitat restoration scenarios,
14
concluding that restoration throughout the monarch’s range is the most effective strategy for achieving a population growth rate greater than replacement (Oberhauser et al. 2017). However, previous work suggests that habitat loss in the northern breeding range has been the primary driver of the declining population (Pleasants and Oberhauser, 2012; Flockhart et al. 2015) and habitat restoration therefore has been an early focus of conservation efforts.
MANAGEMENT IMPLICATIONS
An imbalance exists between the locations of people who benefit from monarchs and the locations of habitat upon which monarchs depend. Our approach provides a new means of linking socioeconomic value for migratory wildlife with the habitat/ecosystems supporting that wildlife. The information it generates can inform the establishment of direct payments for conservation and facilitate cross-jurisdictional cooperative management of migratory species.
ACKNOWLEDGMENTS
This work was conducted as part of the “Animal Migration and Spatial Subsidies: Establishing a Framework for Conservation Markets” working group supported by the John Wesley Powell Center for Analysis and Synthesis, funded by the U.S. Geological Survey. Any use of trade, product, or firm names are for descriptive purposes only and do not imply endorsement by the U.S. Government. L. Ries was supported by National Science Foundation grants no. DBI-1147049 and no. DBI-1052875 awarded to National Socio-Environmental Synthesis Center.
LITERATURE CITED
Baker, P. & Malkin E. (2014) In Mexico meeting, a show of friendship with few results on immigration and trade. New York Times. New York. Available from http://www.nytimes.com/2014/02/20/world/americas/in-obama-trip-to-mexico-a-show-of-friendship-with-little-results-on-issues.html?_r=0. Accessed 9 July 2015.
Bauer, S., & Hoye, B. J. (2014). Migratory animals couple biodiversity and ecosystem functioning worldwide. Science, 344(6179), 1242552.
BLS, 2015. Bureau of Labor Statistics, CPI Inflation Calculator. http://www.bls.gov/data/inflation_calculator.htm Accessed 9/14/15.
Brenner, L., and Job, H., 2006. Actor-oriented management of protected areas and ecotourism in Mexico. Journal of Latin American Geography, 5:2, 7-27.
Brower, L. P., Castilleja, G., Peralta, A., Lopez-Garcia, J., Bojorquez-Tapia, L., Diaz, S., Melgarejo, D. and Missrie, M. (2002), Quantitative Changes in Forest Quality in a Principal Overwintering Area of the Monarch Butterfly in Mexico, 1971–1999. Conservation Biology, 16: 346–359.
Brower L.P., Taylor O.R., Williams E.H., Slayback D.A., Zubieta R.R., Ramirez M.I. (2012) Decline of monarch butterflies overwintering in Mexico: is the migratory phenomenon at risk? Insect Conservation and Diversity 5, 95-100.
Dallimer, M., & Strange, N. (2015). Why socio-political borders and boundaries matter in conservation. Trends in ecology & evolution, 30(3), 132-139.
15
Diffendorfer, J. E., Loomis, J. B., Ries, L., Oberhauser, K., Lopez-Hoffman, L., Semmens, D., Semmens, B., Butterfield, B., Bagstad, K., Goldstein, J., Wiederholt, R., Mattsson, B. and Thogmartin, W. E. (2014), National Valuation of Monarch Butterflies Indicates an Untapped Potential for Incentive-Based Conservation. Conservation Letters, 7: 253–262.
Feenstra, R.C., Inklaar, R., and Timmer, M., 2013. The next generation of the Penn World Table. No. w19255. National Bureau of Economic Research. Available at http://www.nber.org/papers/w19255.
Fernandez-Cornejo, J., 2015. Adoption of genetically engineered crops in the US. Retrieved Novemb. 3, 2015. http://www.ers.usda.gov/data-products/adoption-of-genetically-engineered-crops-in-the-us.aspx
Flockhart, D. T. T., Pichancourt, J., Norris, D. R. & Martin, T. G. Unravelling the annual cycle in a migratory animal: breeding-season habitat loss drives population declines of monarch butterflies. J. Anim. Ecol. 84, 155-165 (2015).
Green, A. J. and Elmberg, J. (2014), Ecosystem services provided by waterbirds. Biological Reviews, 89: 105–122.
Greene, C.M., Beechie, T.J., 2004. Consequences of potential density-dependent mechanisms on recovery of ocean-type chinook salmon (Oncorhynchus tsha- wytscha). Canadian Journal of Fisheries and Aquatic Sciences 61, 590–602.
Gustafsson, K. M., Agrawal, A. A., Lewenstein, B. V., & Wolf, S. A. (2015). The Monarch Butterfly through Time and Space: The Social Construction of an Icon. BioScience, biv045.
Harris, G., Thirgood, S., Hopcraft, J. G. C., Cromsigt, J. P. G. M., & Berger, J. (2009). Global decline in aggregated migrations of large terrestrial mammals. Endangered Species Research, 7(1), 55-76.
Hoyert, D.L., and Xu, J., 2012. National Vital Statistics Report, 61:6. U.S. Department of Health and Human Services. Available on-line at http://www.cdc.gov/nchs/data/nvsr/nvsr61/nvsr61_06.pdf.
Independent Sector, 2015. Value of volunteer time by state 2001-2014. http://independentsector.org/uploads/resources/Value-of-Volunteer-Time-by-State-2001-2014.pdf, Accessed 8/21/15.
Kirby, J. S., Stattersfield, A. J., Butchart, S. H., Evans, M. I., Grimmett, R. F., Jones, V. R., ... & Newton, I. (2008). Key conservation issues for migratory land-and waterbird species on the world's major flyways. Bird Conservation International, 18(1), S49.
Kremen, C., Williams, N. M., Aizen, M. A., Gemmill-Herren, B., LeBuhn, G., Minckley, R., ... & Ricketts, T. H. (2007). Pollination and other ecosystem services produced by mobile organisms: a conceptual framework for the effects of land-use change. Ecology Letters, 10(4), 299-314.
Liu, J., Hull, V., Batistella, M., DeFries, R., Dietz, T., Fu, F., ... & Zhu, C. (2013). Framing sustainability in a telecoupled world. Ecology and Society, 18(2).
16
López-Hoffman L, RG Varady, KW Flessa & P Balvanera. 2010. Ecosystem services across borders: A framework for transboundary conservation. Frontiers in Ecology and the Environment, 8(2): 84–91.
López-Hoffman, L, D Semmens, and J Diffendorfer, 2013. How do migratory species add ecosystem service value to wilderness? Calculating the spatial subsidies provided by protected areas. International Journal of Wilderness, 19(1): 14–19.
López-Hoffman, L., Wiederholt, R., Sansone, C., Bagstad, K. J., Cryan, P., Diffendorfer, J. E., ... & Semmens, D. (2014). Market forces and technological substitutes cause fluctuations in the value of bat pest-control services for cotton.
Martin TG, Chade`s I, Arcese P, Marra PP, Possingham HP, et al (2007) Optimal Conservation of Migratory Species. PLoS ONE 2(8): e751.
MEA (Millennium Ecosystem Assessment), 2005. Ecosystems and Human Well-Being: Synthesis. Island Press, Washington DC.
Missrie, M., and Nelson K., 2005. Direct payments for conservation: lessons from the monarch butterfly conservation fund. St Paul, MN: University of Minnesota. Available at https://www.forestry.umn.edu/sites/forestry.umn.edu/files/cfans_asset_183624.pdf
Oberhauser, K.S., Prysby, M.D., Mattila, H.R., Stanley-Horn, D.E., Sears, M.K., Dively, G., Olson, E., Pleasants, J.M., Lam, W.F., and Hellmich, R.L., 2001. Temporal and spatial overlap between monarch larvae and corn pollen. Proceedings of the National Academy of Sciences, 98(21), 11913-11918.
Oberhauser, K., Wiederholt, R., Diffendorfer, J.E., Semmens, D., Ries, L., Thogmartin, W.E., Lopez-Hoffman, L., and Semmens, B., 2017. A trans-national monarch butterfly population model for identifying regional conservation priorities. Ecological Entomology, 42:51-60.
Pleasants, J. M. & Oberhauser, K. S. Milkweed loss in agricultural fields because of herbicide use: effect on the monarch butterfly population. Insect Conserv. Diver. 6, 135-144 (2013).
Ready, R., & Navrud, S. (2006). International benefit transfer: Methods and validity tests. Ecological Economics, 60(2):429-434.
Richardson, L., & Loomis, J. (2009). The total economic value of threatened, endangered and rare species: an updated meta-analysis. Ecological Economics, 68(5), 1535-1548.
Ries, L., & Oberhauser, K. (2015). A Citizen Army for Science: Quantifying the Contributions of Citizen Scientists to our Understanding of Monarch Butterfly Biology. BioScience, 65(4), 419-430.
Robinson, R. A., Crick, H. Q., Learmonth, J. A., Maclean, I., Thomas, C. D., Bairlein, F., ... & Visser, M. E. (2009). Travelling through a warming world: climate change and migratory species. Endangered Species Research, 7(2), 87-99.
Rubio-Cisneros, N. T., Aburto-Oropeza, O., Murray, J., Gonzalez-Abraham, C. E., Jackson, J., & Ezcurra, E. (2014). Transnational Ecosystem Services: The Potential of Habitat Conservation for
17
Waterfowl Through Recreational Hunting Activities. Human Dimensions of Wildlife, 19(1), 1-16.
Semmens, B.X., Semmens, D.J., Thogmartin, W.E., Wiederholt, R., López-Hoffman, L., Diffendorfer, J.E., Pleasants, J.M., Oberhauser, K.S., and Taylor, O.R., 2016. Population viability analysis for the Eastern, migratory population of monarch butterflies (Danaus plexippus). Scientific Reports, 6:23265.
Semmens, D. J., Diffendorfer, J. E., López-Hoffman, L., & Shapiro, C. D. (2011). Accounting for the ecosystem services of migratory species: quantifying migration support and spatial subsidies. Ecological Economics, 70(12), 2236-2242.
Shahani, P.C., Pesado, G.R., Schappert, P., and Serrano, E.G., 2015. Monarch habitat conservation across North America: Past progress and future Needs. Chapeter 3 in Oberhauser, K.S., Nail, K.R., and Altizer, S. (eds.) Monarchs in a Changing World: Biology and Conservation of an Iconic Butterfly. Cornell University Press, Ithaca, N.Y., 248 p.
Statistics Canada, 2015. Earnings, average hourly for hourly paid employees, by province and territory. http://www.statcan.gc.ca/tables-tableaux/sum-som/l01/cst01/labr80-eng.htm Accessed 9/14/15.
Thogmartin, W.E., Lopze-Hoffman, L., Rohweder, J., Diffendorfer, J., Drum, R., Semmens, D.J., Black, S., Caldwell, I., Cotter, D., Drobney, P., Jackson, L.L., Gale, M., Helmers, D., Hilburger, S., Howard, E., Oberhauser, K., Pleasants, J., Semmens, B., Taylor, O., Ward, P., Weltzin, J.F., and Wiederholt, R., 2017. Restoring monarch butterfly habitat in the Midwestern U.S.: “All hands on deck.” Environmental Research Letters, 12:7.
Touloumis, K., and Stamou, G.P., 2009. A metapopulation approach of the dynamics of arthropods from Mediterranean-type ecosystems. Ecological Modelling, 220(8), 1105-1112.
United Nations Educational, Scientific, and Cultural Organization (UNESCO). 2008. Examination of nomination of natural, mixed and cultural proprerties to the World Heritage List - Monarch Butterfly Biosphere Reserve (MEXICO), 32 COM 8B.17. http://whc.unesco.org/en/decisions/1476
Vidal, O., and Rendón-Salina, E., 2014. Dynamics and trends of overwintering colonies of the monarch butterfly in Mexico. Biological Conservation, 180:165-175.
Vilsack, T. & McCarthy, G., 2015. National strategy to promote the health of honey bees and other pollinators. Available at: <https://www.whitehouse.gov/sites/default/files/microsites/ostp/Pollinator%20Health%20Strategy%202015.pdf>
Wenny, D. G., Devault, T. L., Johnson, M. D., Kelly, D., Sekercioglu, C. H., Tomback, D. F., & Whelan, C. J. (2011). The need to quantify ecosystem services provided by birds. The Auk, 128(1), 1-14.
Wilcove DS, Wikelski M (2008) Going, going, gone: Is animal migration disappearing? PLoS Biol, 6(7): e188.


![Monarch Programmer’s Guide - Product Documentationdocs.datawatch.com/monarch/programmers_guide/Data... · Monarch 14 Programmer's Guide 3 [2] Monarch Properties and Methods This](https://img.pdfslide.net/doc/110x75/5ae7d2b47f8b9acc268f2fe4/monarch-programmers-guide-product-14-programmers-guide-3-2-monarch-properties.jpg)