Embed Size (px)
Citation preview
International Journal of Statistical Distributions and Applications 2020; 6(2): 36-41
http://www.sciencepublishinggroup.com/j/ijsda
doi: 10.11648/j.ijsd.20200602.12
ISSN: 2472-3487 (Print); ISSN: 2472-3509 (Online)
Spatial Modelling of Lead (Pb) Concentration for the Soil in Sokoto Rima Basin, Using Co-Kriging
Umar Usman1, *
, Muddassiru Abubakar2
1Department of Mathematics, Usmanu Danfodiyo University, Sokoto, Nigeria 2Department of Mathematics, Federal University Birnin Kebbi, Kebbi, Nigeria
Email address:
*Corresponding author
To cite this article: Umar Usman, Muddassiru Abubakar. Spatial Modelling of Lead (Pb) Concentration for the Soil in Sokoto Rima Basin, Using Co-Kriging.
International Journal of Statistical Distributions and Applications. Vol. 6, No. 2, 2020, pp. 36-41. doi: 10.11648/j.ijsd.20200602.12
Received: March 17, 2020; Accepted: April 7, 2020; Published: August 25, 2020
Abstract: This study used Geostatistics techniques to find the variability in the concentration of lead (Pb) in Sokoto Rima
Basin Region. The concentrations Lead (Pb) were measured and analyzed in one hundred and three (103) different sample
points in Sokoto Rima Basin region of Nigeria. The region is characterized as one of the center for agricultural activities in
Nigeria. The soil samples were collected from agricultural, industrial and residential areas. The concentrations of heavy Lead
(Pb) were measured using Atomic Absorption Spectrometer. The technique of Co-Kriging was used to develop empirical
semivariogram model to predict the concentrations of Lead (Pb) in the soil. The result shows that concentrations of Lead (Pb)
have exceeded the standard level in the study area. The study revealed that there are extreme concentrations of heavy metals in
the central region of the study area.
Keywords: Heavy Metal, Concentrations, Variogram, Co-Kriging
1. Introduction
Soil is a mixture of organic matter, minerals, gases, liquids
and other organisms that together support life. It is the
product of several factors; it is classified into different types.
It is critical to many ecosystem functions, and soil
degradation and pollution have gained great deal of attention
worldwide [1] Contaminated soil soils can pose serious threat
to human health through the variety of different pathways
including diet, inhalation and dermal contact [1]. Soil
pollution has become a serious problem in Nigeria as a result
of rapid industrial and agricultural activities that occur in the
last several decades. Several factors that can contaminated
soil are the heavy metals that are present in the soil. The
metals are classified as “heavy metals” if they have a specific
gravity of more than 5 g/cm3 [2]. Heavy metals gets
accumulated in soils and plants causing negative influence on
photosynthesis, gaseous exchange and nutrient absorption of
plants resulting in the reduction of plant growth, dry matter
accumulation and yield [3]. Heavy metals contamination of
soil result mainly due to mining, smelting and agriculture as
well as natural activities [2]. There has been a rapid increase
in the agricultural activities in Sokoto Rima basin, which in
one way or the other has caused the soil to be toxic, which in
turn can cause the soil contamination. Heavy metals in the
soil continue to contaminate as a result of such agricultural
activities that increases the concentration of these heavy
metals. Apart from agricultural activities, residential and
industrial wastewater are discharged randomly on the soil,
into canals, rivers, along roadside or in the vicinity of
industries operation without treatment. They pollute the
productive soil, natural water system as well as ground water.
These residential and industrials wastewater contain medium
amount of heavy metals such as chromium (Cr), lead (Pb)
and iron (Fe) [2]. Emission of gases from vehicles,
residential and industrial activities could cause higher
concentration of heavy metals in the soil; these gases when
emitted would increase the concentrations of those metals
and to soil contamination [4]. Metals such as cadmium,
chromium, copper, lead and zinc contaminate soil as a result
of cement production [5]. These heavy metals are deposited
into soil at various distance [6] depending on wind velocity
and particles size [7] through the cement dust and stack
International Journal of Statistical Distributions and Applications 2020; 6(2): 36-41 37
fumes. Majority of heavy metals in the cement dust
originated from raw material [8, 9]. Reported that typical
cement raw material contains 25 mg/kg of chromium (Cr), 21
mg/kg of copper (Cu), 20 mg/kg of lead (Pb) and about 50%
of the total cadmium (Cd), copper (Cu) and zinc (Zn) load in
the cement are introduce through raw materials. Majority of
emitted heavy metals are known to be toxic to humans and
plants, even at low concentrations [10] with very large set of
health consequences. To adopt any type of remedial measures,
it is necessary to determine heavy metals’ load in the
contaminated soil. Against these background information, it
is necessary to analyze heavy metals concentration in and
around this region in order to find proper remedy to the
problem. Concentration of heavy metals pollution generally a
non-stationary variable [2]. Due to the different type of heavy
metals in the soil and high spatial variation in their
concentration, more accuracy is needed in the application of
method to analyze their concentrations. In view of capability
of these methods to be used in conjunction with GIS and the
expansion of the application of GIS, the importance of
selecting the Kriging technique as suitable method of
interpolation arises.
Kriging is named after the South African engineer, D. G.
Krige, who first developed the method. The technique was
first published by Krige [11] later the mathematical equations
and concepts related to Kriging were formulized by
Matheron [12] and basically established the whole field of
linear geostatistics [13]. Kriging is a statistical method based
on the theory of regionalized variables and variogram model.
It is considered to be the best linear unbiased predictor
(BLUP) that satisfies a certain optimality criterion. It is a
spatial prediction method which predicts at any point based
on the average values at sampled points the weights given to
each sample points are optimal. Kriging is a technique of
making optimal, unbiased estimates of regionalized variable
at un-sampled locations using the structural properties of the
semivariogram and initial set of data values [14]. Kriging
takes into consideration about the spatial structures of the
parameter and hence it is having definite advantage over the
other methods like arithmetic mean method, nearest neighbor
method, distance weighted method and polynomial
interpolation [2]. In addition, Kriging provide the estimation
variance at every estimated point, which is an indicator of
accuracy of the estimated value and was considered as the
major advantage of Kriging over some interpolation
techniques. Spatial variation in soil has been recognized for
many years [15]. Geostatistics has been applied in soil
science for more than 20 years, has provided modern
techniques to quantify the spatial soil parameters, and
performed spatial interpolation [16. 17]. The spatial
distribution of Soil is generally consistent with elevation and
precipitation [18. 16] were the first to use kriging and its
practical application, in soil survey, later many other
pedologists and environmental scientists have followed it in
their literature. Many authors [19. 20] have written excellent
accounts of geostatistics and its underlying concepts for soil
scientists. Geostatistical methods which consider
environmental correlation in prediction include Co-kriging,
kriging within strata, kriging with external drift, and
regression kriging [21, 22].
To quantify the distribution of spatial patterns and
changes in heavy metals concentrations, geostatistics has
been applied. [23] studied the spatial distribution of heavy
metals in the middle Nile Delta of Egypt. They found that
all heavy metals in the study area exceeded crustal mean
value specified by [24]. The concentration of Ni and Cr
exceeded recommended values in the soil profile horizon,
while “Cu” had a variable distribution and “Zn”
concentration are under recommended concentration limit
in the most soil sample. They recommended that heavy
metal contamination should be investigated within the
entire soil profile and not just top-soils, because of the high
mobility of these metals, which could affect soil and crop
quality and Cause underground water pollution. [8] studied
contamination and spatial distribution of heavy metals in
top-soil surrounding the cement factory in Sagamu,
southwest of Nigeria. The study revealed that there was
extreme concentration of Cd in the region and severe
contamination by Pb and Cu. They concluded that the
enrichment of the soil by Cd was due to cement production
activities. [25] studied spatial prediction of heavy metals
pollution for soils in Coinbotore, India based on ANN and
Kriging model. They found that the residential areas are
contaminated with Cr and moderately with Pb. They
concluded that the highest concentration of heavy metals in
those industrial polluted areas are not only problem with
respect to plant nutrient and food chain contamination but
also caused a direct health hazard to human and animals,
which needed effective and affordable technological
solutions. [2] studied spatial prediction of heavy metals
pollution for soils in Coinbatore, India based on Universal
Kriging. They found that the reason for maximum Pb at
Ukkadam Lake was due to discharging of sewage water into
the lake. Cr concentration ranged between 0 - 3.6 ppm.
Maximum concentration was in Ganapathy because of the
concentration of foundry industry. Fe ranged between 0 –
5.29. Maximum at Sidco Industrial Estate and Singanallur
because of the concentration of electroplating industry.
They observed that maximum heavy metal pollution near
the industrial, traffic junction where traffic jams and the
legendary 'go-slow' of automobiles was the order of the day
and in localities of large population concentration and
relatively small areas under poor conditions of sanitation.
They used Kriging model to predict the heavy metal at the
unknown point. From the model of heavy metals, they
conclude that the residential areas are uncontaminated with
Cr and moderately contaminated with Pb and Fe. [4]
studied spatial distribution of heavy metals and
environmental quality of soil in the northern plateau of
Spain. They found that among several metals components
in the soil, the coefficient of variation of Pb and Hg were
0.80 and 0.76 respectively were the highest, implying that
these two metals had greater variability throughout the area
studied compared to other metals also present in the soil.
38 Umar Usman and Muddassiru Abubakar: Spatial Modelling of Lead (Pb) Concentration for the Soil in
Sokoto Rima Basin, Using Co-Kriging
They concluded that agricultural activities could continue,
but there should be some improvement measures to protect
the security of agriculture. [26] studied how climate change
can affect the vegetation in the northern part of Nigeria.
They found that it is possible to apply Co-Kriging to
determine how climatic variation can change the vegetation
in the northern part of Nigeria. [27] identified that
geostatistical techniques are methods appropriate to assed
the vegetation productivity in the northern part of Nigeria.
They used modelling techniques to determine how changes
in climate could affect vegetation productivity in the
northern part of Nigeria. [28] studied spatial variability of
heavy metals in the soil of Ahwaz using the geostatistical
method; they found that Lead (Pb) contamination is about
33 percent of the study area is more than the standard level,
they conclude that Lead concentration is control by
anthropogenic activities connected with traffic and
industries. [29] used Co-Kriging to study spatial
distribution and mobility assessment of carcinogenic heavy
metals in the soil profile, they reveals that Pb and Cr have
spatial variability regarding subsoil horizons. [1] studied
spatial modelling of Cr, Pb, Cd, As and Ni in soil based on
portable X-ray fluorescence and Geostatistics in east China.
The study reveals that Cd is the primary pollutant element
in Fuyang, followed by As and Pb. They also revealed that
heavy metals pollutions were mainly as a result of mining,
industrial and traffic activities, and irrigation with polluted
water. They concluded that PXRF and Co-Kriging as the
efficient and reliable method for soil heavy metals
assessment and mapping. The aim of this research is to
investigate Lead (Pb) Concentration for the Soil in Sokoto
Rima Basin, Using Co-Kriging.
2. The Study Area
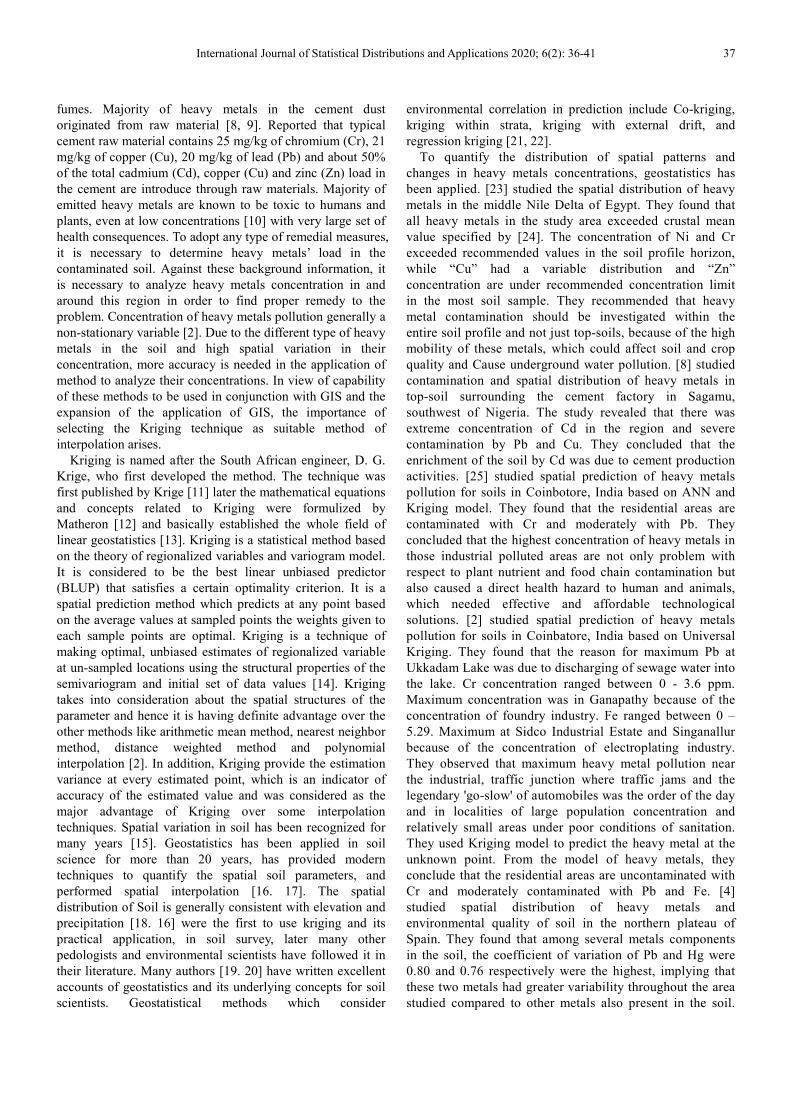
The study area comprises of one hundred and three (103)
sample points located in Sokoto Rima basin of northern
Nigeria. The study area falls between latitude 10.9° to 14° N
and longitude 3.5° to 7.1° E. The area is characterized as one
of the centers of agriculture in the country. The map of the
study is shown in figure1 below.
Figure 1. The study area showing one hundred and three (103) sample points in Sokoto Rima basin.
International Journal of Statistical Distributions and Applications 2020; 6(2): 36-41 39
2.1. Data and Methods
In this research, a data recorded in one hundred and three
(103) sample points located in Sokoto Rima Basin of
northern Nigeria were analyzed. The data set contains Lead
(Pb) as input variable for the analysis. Other datasets utilized
in this study are Elevation and Geo-coordinates location.
2.2. Co-Kriging Modelling
In pure geostatistical approach, predictions are commonly
made by calculating some weighted average of the
observations [13]:
�̂���� = ∑ �� . ���� (1)
Where �̂���� is the predicted value of the target variable at
an unvisited location �� gives its map coordinates, the sample
data �� �, �����,…, ����� and their coordinates. The weights
are chosen such that the prediction error variance is
maximized, yielding weights that depend on the spatial
autocorrelation structure of variable. This interpolation
procedure is popularly known as Ordinary Kriging (OK), for
� = 1, 2, . . . �
The first step in Kriging is the calculation of the
experimental semivariogram using the following equation.
�∗�ℎ� = ����� ∑ ����� − �������� ����
� (2)
Where �∗�ℎ� is estimated value of the semi variance for
lag ℎ, �ℎ� is the number of experimental pairs separated by
vector ℎ, ���� and ������ are the value of the variable � at
� and ��� respectively, � and ��� is the position in two
dimension.
An extension of ordinary kriging is Co-Kriging approach
in case of two or more spatial or spatiotemporal variables. In
Co-Kriging, the explanatory variables are spatial, temporal or
spatiotemporal with expected values and variogram as
compared to ordinary Kriging in which explanatory variable
are fixed [30].
A Co-Kriging estimate is a linear combination of both
primary and secondary data value as shown by [31] in given
equation:
�̂���� = ∑ � +�� ∑ "#$#%#� (3)
Where �̂���� is the estimated of z at location 0;
� , ��, … , �� are the primary data at n nearby locations;
$ , $�, … , $% are secondary data at m nearby locations;
, �, … , � and " , "�, … , "% are Co-Kriging weights to be
estimated.
The development of Co-Kriging system is identical to the
development of ordinary Kriging system.
The definition of estimation error is stated as:
' = �̂���� − ����� = ∑ � +�� ∑ "#$#%#� − ����� (4)
Where � , ��, … , �� are random variables representing X
at the n locations and $ , $�, … , $% are random variable
representing Y at the m locations.
An expression for the variance of the estimations error in
terms of Co-Kriging weight and the covariance between the
random variables are:
()*�'� = + + #,-.{��#
%
#� }
�
� + + + ""#,-.{$$#}
%
#�
�
�
+2 ∑ ∑ "#,-.1�$#2%#� �� −2 ∑ ,-.{���} −�� 2 ∑ " ,-. 1$#$�2 + ,-.{����}%#� (5)
Where ,-.���#� is auto-covariance between � and �# ,
,-.�$$#� is auto-covariance between $ and $# and
,-.��$#� is the cross-covariance between � and $#.
The set of Co-Kriging weights thus, must satisfy two
conditions. First, the weight must to be such that the estimate
in equation (3) is unbiased. Second, the weight must be such
that the error variances given in equation (5) are the smallest
possible. One way of guaranteeing unbiasedness is to ensure
that the weights in the first term sum to 1 while in the second
term sum to 0 [32, 33]
∑ �� = 1 )�3 ∑ "#%#� = 0 (6)
The Lagrange multiplier method may be used to minimize
the error variance with two constrains. To implement the
method, we simply equate each nonbiased condition to 0,
multiply by a Lagrange multiplier and add to the result to
each equation (5). This give the following expression.
()*�'� = 56785 + 29 �∑ �� − 1� + 29��∑ "#%#� � (7)
Where 9 and 9� are Lagrange multiplier. The minimized
error variance can be calculated using (5) or it can be
simplified by making substitutions using the Lagrange
multipliers. The simplified version is
()*�'� = ,-.{��$�} + 9 − ∑ ,-.{���} −�� ∑ " ,-. 1$#$�2%#� (8)
It exploits more fully auxiliary information by directly
incorporating the value of auxiliary variable and measuring
the degree of spatial association with primary variable
through the cross-semivariogram. The technique of Co-
Kriging improves the estimation and reduces the variance of
the estimation error, but at the same time is much more
demanding than Ordinary Kriging. The calculation of the
cross-semivariogram and the fitting of a theoretical model
become very difficult, particularly when the two variables are
not strongly correlated [34].
3. Result and Discussion
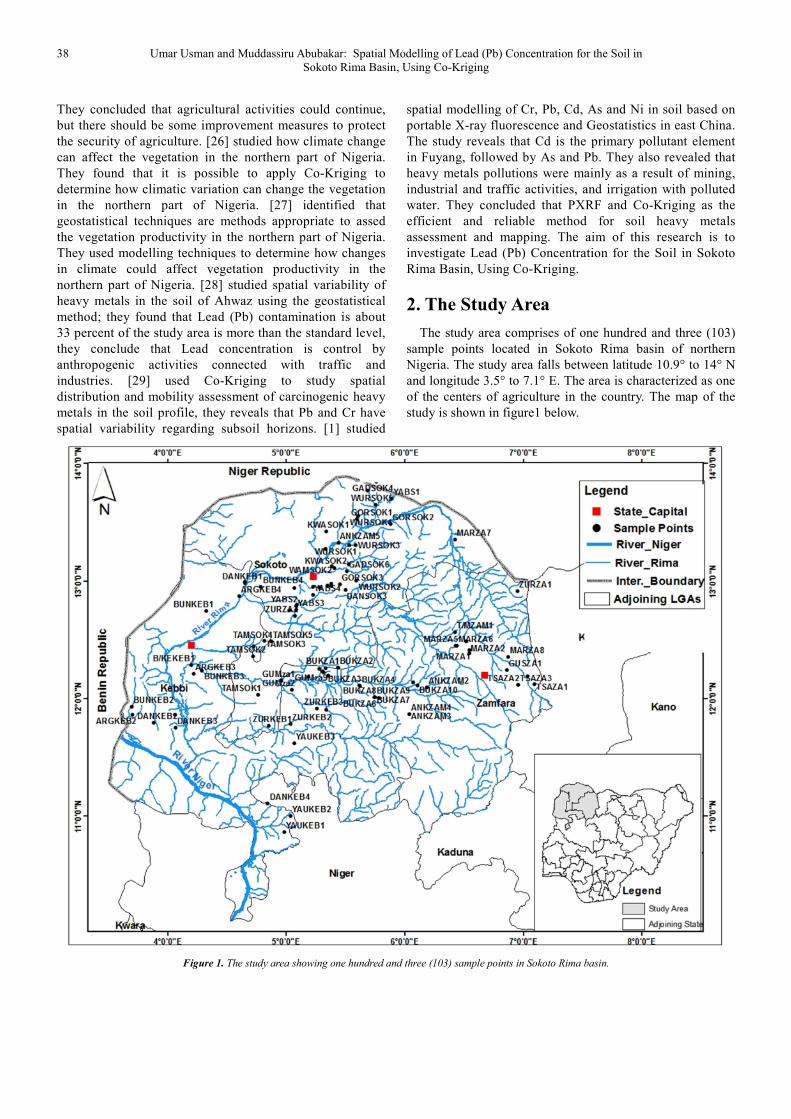
The experimental variogram of Lead (Pb) is shown in
Figure 2. The variogram model indicated that there is a
spatial autocorrelation in the model. However, the prediction
variability in the concentration of Lead (Pb) indicated that
the concentration of Lead (Pb) is increasing from north to
southern part of the study area around Kware, Gada, Dange,
40 Umar Usman and Muddassiru Abubakar: Spatial Modelling of Lead (Pb) Concentration for the Soil in
Sokoto Rima Basin, Using Co-Kriging
Wurno and Bukuyum. The Kriging elevation map for the
Lead (Pb) indicated that the highest variability in the
concentration of Lead (Pb) is in the middle part of the study
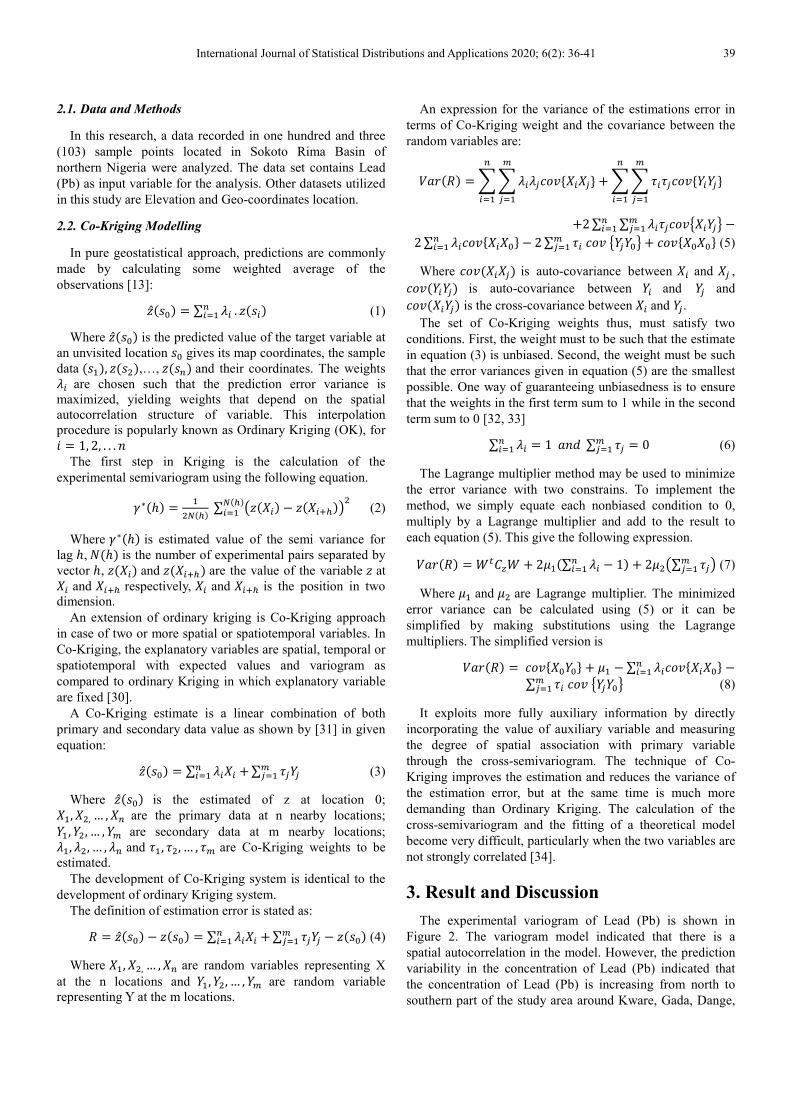
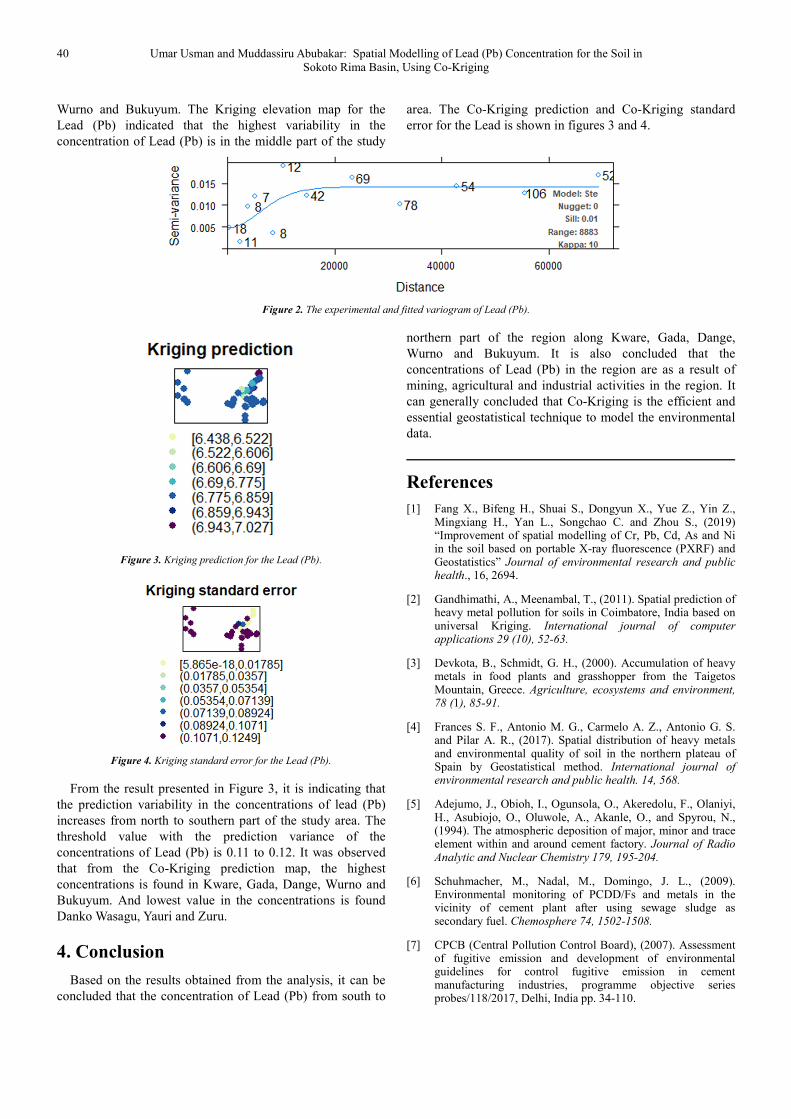
area. The Co-Kriging prediction and Co-Kriging standard
error for the Lead is shown in figures 3 and 4.
Figure 2. The experimental and fitted variogram of Lead (Pb).
Figure 3. Kriging prediction for the Lead (Pb).
Figure 4. Kriging standard error for the Lead (Pb).
From the result presented in Figure 3, it is indicating that
the prediction variability in the concentrations of lead (Pb)
increases from north to southern part of the study area. The
threshold value with the prediction variance of the
concentrations of Lead (Pb) is 0.11 to 0.12. It was observed
that from the Co-Kriging prediction map, the highest
concentrations is found in Kware, Gada, Dange, Wurno and
Bukuyum. And lowest value in the concentrations is found
Danko Wasagu, Yauri and Zuru.
4. Conclusion
Based on the results obtained from the analysis, it can be
concluded that the concentration of Lead (Pb) from south to
northern part of the region along Kware, Gada, Dange,
Wurno and Bukuyum. It is also concluded that the
concentrations of Lead (Pb) in the region are as a result of
mining, agricultural and industrial activities in the region. It
can generally concluded that Co-Kriging is the efficient and
essential geostatistical technique to model the environmental
data.
References
[1] Fang X., Bifeng H., Shuai S., Dongyun X., Yue Z., Yin Z., Mingxiang H., Yan L., Songchao C. and Zhou S., (2019) “Improvement of spatial modelling of Cr, Pb, Cd, As and Ni in the soil based on portable X-ray fluorescence (PXRF) and Geostatistics” Journal of environmental research and public health., 16, 2694.
[2] Gandhimathi, A., Meenambal, T., (2011). Spatial prediction of heavy metal pollution for soils in Coimbatore, India based on universal Kriging. International journal of computer applications 29 (10), 52-63.
[3] Devkota, B., Schmidt, G. H., (2000). Accumulation of heavy metals in food plants and grasshopper from the Taigetos Mountain, Greece. Agriculture, ecosystems and environment, 78 (1), 85-91.
[4] Frances S. F., Antonio M. G., Carmelo A. Z., Antonio G. S. and Pilar A. R., (2017). Spatial distribution of heavy metals and environmental quality of soil in the northern plateau of Spain by Geostatistical method. International journal of environmental research and public health. 14, 568.
[5] Adejumo, J., Obioh, I., Ogunsola, O., Akeredolu, F., Olaniyi, H., Asubiojo, O., Oluwole, A., Akanle, O., and Spyrou, N., (1994). The atmospheric deposition of major, minor and trace element within and around cement factory. Journal of Radio Analytic and Nuclear Chemistry 179, 195-204.
[6] Schuhmacher, M., Nadal, M., Domingo, J. L., (2009). Environmental monitoring of PCDD/Fs and metals in the vicinity of cement plant after using sewage sludge as secondary fuel. Chemosphere 74, 1502-1508.
[7] CPCB (Central Pollution Control Board), (2007). Assessment of fugitive emission and development of environmental guidelines for control fugitive emission in cement manufacturing industries, programme objective series probes/118/2017, Delhi, India pp. 34-110.
International Journal of Statistical Distributions and Applications 2020; 6(2): 36-41 41
[8] Ogunkunle, C. O., Fatoba, P. O., (2014). Contamination and spatial distribution of heavy metals in topsoil surrounding a mega cement factory. Journal of atmospheric pollution research 5, 270-282.
[9] Achternbosch, M., Brautigam, K. R., Herlieb, N., Kupsch, R., Richers, U., Stemmermann, P., (2003). Heavy metals in cement and concrete resulting from Co-incineration of waste in cement kilns with regard to the legitimacy of waste utilization, Mitglied der Hermann vonn Helmholtz-Gemeinschaft Deutscher Forschungszentren, ISSN 0947-8620, pp. 22-23.
[10] Kataba P., A. Mukherjee, A. B., (2007). Trace element from soil to human, Springer verlag, Berlin, pp. 1-48.
[11] Krige, D. G., (1951). A statistical approach to some basic mine valuation on the Witwatersrand. Journal of the Chemical, Metallurgical and Mining Society, 52: 119-139.
[12] Matheron, G., (1963). Le Krigeage universal. Vol. 1. Cahiers du Centre de Morphologie Mathematique, Ecole des Mines de Paris, Fontainebleau, p. NA.
[13] Webster, R., Oliver, M., (2001). Geostatistics for Environmental Scientists Statistics in Practice. Wiley, Chichester, 271pp.
[14] David, M. (1977). Geostatistical Ore reserve estimation. Amsterdam: Elsevier.
[15] Burrough, P., (1993). Soil Variability: a late 20th century view. Soils and Fertilizers, 56: 529 562.
[16] Burgess, T. M., and Webster, R., (1980). Optimal interpolation and isarithmic mapping of soil properties: The semi-variogram and punctual kriging. Journal Soil Science., 31: 315-331.
[17] Webster, R., (1994). The development of Pedometrics. Geoderma, 62: 1-15.
[18] McGrath, D. and Zhang, C., (2003). Spatial distribution of soil organic carbon Concentrations in Grassland of Ireland. Applied Geochemistry, 18: 1629 1639.
[19] Goovaerts, P., (1999). Geostatistics in soil science: state-of-the-art and perspectives. Geoderma, 89 (1-2): 1-45.
[20] Webster, R. and Oliver, M. A., (2001). Geostatistics for Environmental Scientists. John Wiley and Sons Ltd, Chichester.
[21] Goovaerts, P., (1997). Geostatistics for Natural Resource Evaluation, Oxford Univ. Press, New York.
[22] Odeh, I. O. A., McBratney A. B. and Chittleborough, D. J.,
(1995). Further results on prediction of soil properties from terrain attributes: heterotopic cokriging and regression-kriging. Geoderma.
[23] Mohamed S. S., Ahmed A. E., Michael A., Fullen, Talaat R. E., Ali R. R., A. Abd E., Antonio J. T. Guerra, Maria C. O. Jorge, (2016). Spatial distribution of heavy metals in the nile delta of Egypt. International soil and water conservation research 4, 293-303.
[24] Wedepohl, K. H., (1995). The composition of the continental crust. Geochimica et Cosmochimica Acta, 59, 1217–1239. http://dx.doi.org/10.1016/0016-7037(95)00038-2.
[25] Gandhimathi, A., Meenambal, T., (2012). Spatial prediction of heavy metal pollution for soils in Coimbatore, India based ANN and Kriging model. European scientific journal. June edition 8 (14), 79-91.
[26] Usman U., S. A. Yelwa, S. U. Gulumbe, and A. Danbaba., (2013). “An Assessment of the Changing Climate in Northern Nigeria Using Cokriging.” American Journal of Applied Mathematics and Statistics 1, no. 5: 90-98. doi: 10.12691/ajams-1-5-3.
[27] Yelwa, S. A. and, U. Usman, (2017). Integration of Spatial Prediction in the Assessment of Vegetation Productivity in the Northern Part of Nigeria. American Journal of Climate Change, 6, 360-373. https://doi.org/10.4236/ajcc.2017.62018.
[28] Abbas H., Norges S. and Ali G. (2014) “Spatial variability of heavy metals in the soil of Ahwaz using geostatistics method” International Journal of Environmental Science and Development, 5 (3), 294-298.
[29] Asma, S. and Javel, I. (2018). “Spatial distribution and mobility assessment of carcinogenic heavy metals in the soil profile using geostatistics and random forest, Boruta algorithm” Sustainability, 10, 799.
[30] Myers, D. E. (1982). Matrix Formulation of Cokriging, Mathematical Geology, (14) 3, pp. 249–257.
[31] Isaaks, E. H. and Srivastava, R. M (1989). Applied Geostatistics, Oxford University Press, New York, 561 pp.
[32] Wackernagel, H. Multivariate Geostatistics, Springer-Verlag, Berlin. (1995). 255 pp.
[33] Wellmer, F. W (1998). Statistical Evaluations in Exploration for Mineral deposits, Springer-Verlag, Berlin. 379 pp.
[34] Kalivas D. P., Triantakonstantis D. P. and Kollias V. J. (2002). "Spatial prediction of two soil properties using topographic information". Global Nest: The Int. Journal, 4 (1) 41-49.


![Spatial analysis between particulate matter and emergency ... · 2.5 concentration and mortality using spatial analysis [14]. Other studies have investigated the relationship be-tween](https://img.pdfslide.net/doc/110x75/5cca292088c993e4268e0858/spatial-analysis-between-particulate-matter-and-emergency-25-concentration.jpg)