Embed Size (px)
Citation preview
Spatial Patterns of Rare Species in Yosemite Forest Dynamics Plot as a Result of Seed Dispersal
Andrea Blin
A thesis submitted in partial fulfillment of the requirements for the degree of Bachelor’s of
Science
University of Washington
2011
Environmental Science and Resource Management
School of Forest Resources
i
University of Washington
Abstract
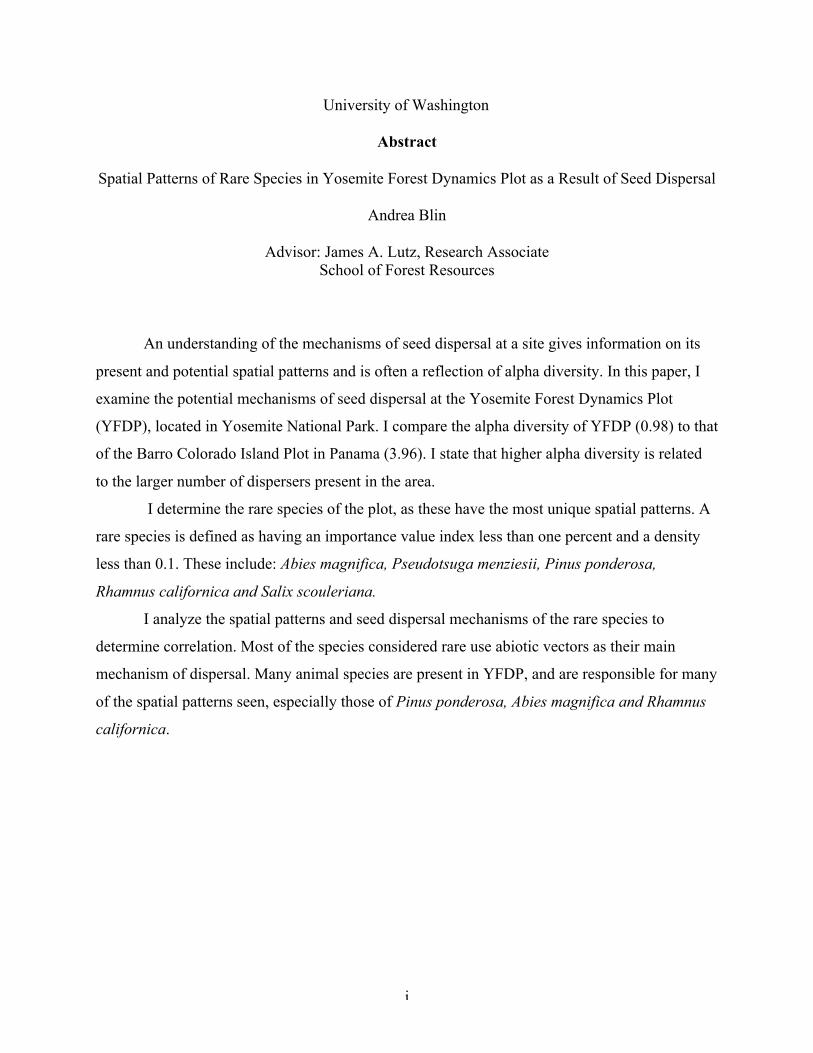
Spatial Patterns of Rare Species in Yosemite Forest Dynamics Plot as a Result of Seed Dispersal
Andrea Blin
Advisor: James A. Lutz, Research Associate School of Forest Resources
An understanding of the mechanisms of seed dispersal at a site gives information on its
present and potential spatial patterns and is often a reflection of alpha diversity. In this paper, I
examine the potential mechanisms of seed dispersal at the Yosemite Forest Dynamics Plot
(YFDP), located in Yosemite National Park. I compare the alpha diversity of YFDP (0.98) to that
of the Barro Colorado Island Plot in Panama (3.96). I state that higher alpha diversity is related
to the larger number of dispersers present in the area.
I determine the rare species of the plot, as these have the most unique spatial patterns. A
rare species is defined as having an importance value index less than one percent and a density
less than 0.1. These include: Abies magnifica, Pseudotsuga menziesii, Pinus ponderosa,
Rhamnus californica and Salix scouleriana.
I analyze the spatial patterns and seed dispersal mechanisms of the rare species to
determine correlation. Most of the species considered rare use abiotic vectors as their main
mechanism of dispersal. Many animal species are present in YFDP, and are responsible for many
of the spatial patterns seen, especially those of Pinus ponderosa, Abies magnifica and Rhamnus
californica.

ii
ACKNOWLEDGEMENTS
I would like to thank my advisor, James A. Lutz, for his countless hours of guidance,
supply of wisdom, and high expectations that helped to motivate me to stride for my best. I value
the opportunity to do work at Yosemite Forest Dynamics Plot and appreciate the experience.
For this study, I would also like to acknowledge Richard Condit for the data on the Barro
Colorado Island Plot and Susan Roberts for the information on the bird and rodent species
present in the Yosemite Forest Dynamics Plot.
I am also grateful for the support of my family and friends, whose love and
encouragement over the years has made it possible to continue through my academic career at
the University.

1
1. INTRODUCTION
Plants are sessile organisms that rely on seed dispersal as one of their only forms of
movement in attempts to increase the fitness of their offspring (Nathan and Muller-Landau
2000). An increase in distance between parent and offspring reduces the chance of predation by
density-responsive predators and gives the offspring access to resources that they need not share
with their parent plant (Janzen 1970). The mechanisms of seed dispersal vary from abiotic to
biotic vectors and are often a combination of both (Clark et al. 2003). The mechanisms by which
trees disperse seeds are influenced by the alpha diversity of the area, and reflect the spatial
patterns of a forest (Fuentes 2000; Russo et al. 2006).
The alpha diversity of a forest is often correlated to the types of seed dispersal
mechanisms available in that forest (Howe and Smallwood 1982). Alpha diversity is relative to
location. Ecosystems at low latitudes often display a greater alpha diversity than those at higher
latitudes (Pianka 1966; Rohde 1992; Wright 2002). Tropical forests are most concentrated at low
latitudes, and have a vast array of angiosperm species that show a great diversity in morphology
and strategy in dispersing their seeds (Prance 1977; Muller-Landau and Hardesty 2005; Muller-
Landau et al. 2006). The high alpha diversity at low latitudes also equates to a higher diversity of
biotic vectors that have co-evolved with many of the flora species to enhance dispersal rates
(Howe and Smallwood 1982). Temperate forests that are dominated by gymnosperms most
commonly rely on abiotic factors, such as wind, for dispersal (Lanner 1982). Biotic seed
dispersal in these temperate forests is limited, due to the presence of fewer biotic vectors than
found in tropical forests (Howe and Smallwood 1982).
The mechanisms of seed dispersal also contribute to the spatial patterns of a forest.
Larger animals eat larger fruits and are capable of traveling longer distances (Janson 1980; Kelt
and Van Vuren 2001). Trees dispersed by large animals are spatially spread out greater distances
from their parent plant (Seidler and Plotkin 2006). Seeds dispersed by animals are also
commonly aggregated near roosting and nesting sites (Stebbbins 1971). The distance of wind
dispersed seeds depends greatly on the mass of the seed, and small, lighter seeds travel furthest
(Stebbins 1971). Location of offspring is also relevant to the direction of wind (Greene and
Johnson 1989). Wind and gravity create spatial patterns where the highest densities of offspring
are closest to the parent plant (Janzen 1970, Connell 1971).

2
Spatial patterns are often modeled to predict future trends. There have been many
attempts to model seed dispersal in order to predict spatial patterns (Chave el al. 2002; Wright
2002), but this task proves difficult when many field components are not depicted. Dispersal
models often only consider one vector of dispersal and fail to recognize the potential of multiple
vectors (Clark et al. 2003). Many factors affect the success of seed dispersal, including: the
vegetation cover, soil resources and microclimate of the site (Wright 2002), and are often not
included in models. Models are most effective when variables are measurable (Russo et al.
2006). Factors affecting wind dispersal, including: height of release, wind velocity, and seed
mass are quantifiable (Greene and Johnson 1996). Factors affecting animal dispersal include
more variable components that are harder to quantify, such as food availability, distribution of
resources, weather and social dynamics (Nathan and Muller-Landau 2000; Russo et al. 2006).
Long distance and rare dispersal events are difficult to model, since data on such events is hard
to collect (Clark et al. 1998; Ouborg et al. 1999).
My objective of this study is to examine the data collected at Yosemite Forest Dynamic
Plot (YFDP) to (1) determine how alpha diversity affects seed dispersal methods, (2) distinguish
which species are rare, and (3) hypothesize how seed dispersal mechanisms contribute to the
spatial patterns present at YFDP. I hypothesize the following: (a) the dominance of a few species
will equate to a low alpha diversity at YFDP (b) species determined to be rare will exhibit the
most unique spatial patterns when compared to the more dominant species that will have a more
even distribution, and (c) a biotic vector of either a bird or mammal contributed to many of the
spatial patterns present in YFDP.

3
2. METHODS
2.1. Study Site
The data originated from the Yosemite Forest Dynamics Plot (Figure 1), which is a 25.6
ha plot located near Crane Flat in Yosemite National Park (latitude 37.7 N, longitude 119.7
W). The elevation of YFDP varies from 1774 m in the north portion of the plot to 1911 m in the
south (Figure 2). YFDP has a Mediterranean climate, consisting of cool, moist winters and hot,
dry summers (Graber and White 1980). At the elevation of YFDP, most precipitation falls
between November and April as snow (Graber and White 1980). Average temperatures at 1560
m in elevation range from 2C in January to 18C in July (Scholl and Taylor 2010). Soils at
YFDP consist of the Craneflat Series of sandy-skeletal, isotic, frigid Humic Dystroxerepts that
formed from granitoid rock (Soil Survey 2006).
YFDP was surveyed in 2009/2010 using total stations to establish a grid system with 400
m2 squares. A number (1-40) and letter (A-P) were assigned to all points in the grid. All live
trees and snags with DBH greater than one centimeter were tagged and mapped. There are 34468
live trees and 2717 snags in the plot consisting of the tree species: Abies concolor (ABCO),
Abies magnifica (ABMA), Cornus nuttallii (CONU), Calocedrus decurens (CADE), Pinus
lambertiana (PILA), Pinus ponderosa (PIPO), Prunus emarginata (PRUNUS), Pseudotsuga
menziesii (PSME), Quercus kelloggii (QUKE), Rhamnus californica (RHCA), and Salix
scouleriana (SALIX) (Table 1). Salix and Prunus individuals were consolidated at genus level.
TABLE 1. Quantity and basal area of tree species present at YFDP.
Stems Basal Area (m2)
Alive Snags Alive Snags
ABCO 24494 1994 749.8311 231.0055
AMBA 11 0 1.5641 0
CADE 1591 48 122.4198 11.1516
CONU 2370 1 6.6010 0.0113
PILA 4745 542 735.3544 242.4618
PIPO 2 0 0.3100 0
PRUNUS 128 0 0.0508 0
PSME 6 1 0.8986 1.2272
QUKE 1109 131 28.7906 4.0156
RHCA 1 0 0.0001 0
SASC 11 0 0.0038 0
Total: 34468 2717 1645.8243 489.873

4
Ü
0 175,000 350,000 525,00087,500Meters
Legend
Yosemite Forest Dynamic Plot
Yosemite National Park
`
```````````````````````````````````````````````````````````````2.2 Alpha diversity
FIGURE 2. Tree species and their corresponding elevation in YFDP.
FIGURE 1. Map of Yosemite Forest Dynamics Plot in Yosemite National Park, CA.

5
2.2 Alpha Diversity
I compared the alpha diversity of a temperate and tropical forest. I used YFDP as the
temperate forest and the Barro Colorado Island Plot (BCI; 9.15° N, 79.51° W) in Panama as the
tropical forest. BCI is a 50 ha plot with 208341 live trees with DBH greater than 1 cm. Average
rainfall is 260 cm/yr, falling over the wet (May to November) and dry seasons (December to
April) (Leigh Jr and de Alba 1992).
The Alpha diversity of these forests was determined by the Shannon-Wiener Index
(Shannon 1948):
s
H’ = Σ (pi ln pi) [1] i=1
where H’ is the measure of diversity, S is the number of species and pi is the relative abundance
of each species. The evenness (E) of the species (Shannon 1948), which is on a scale from zero
to one, is determined by:
E = H’/ Hmax [2]
Hmax = ln S [3]
where Hmax is the highest number of H’ possible given the number of species. This information
will be correlated to mechanisms of dispersal, and the effects they may have on spatial patterns.
2.3 Rare Species Index
I determined the rare species of the plot, as these presented the most unique spatial
patterns. I classified as rare those with a density less than 0.1 and an importance value index less
than 1 percent using the importance value index (Curtis and McIntosh 1950):
Importance=relative density + relative dominance + relative frequency [4]

6
I also used the density as a parameter of rarity, because the importance value index takes
into consideration the basal area of the species. Species that are characterized by small diameter
at breast height are thus compared to species that have large diameters at breast height. Relying
solely on the importance value index gives an inaccurate depiction of the rare species.
2.4 Seed Dispersal
I tested the relevance of a model to describe spatial patterns. I used the Cremer model
(1971):
D= V * H / Vf [5]
where D is the dispersal distance in meters, V is the wind velocity in meters per second, H is the
height of the presumed parent tree in meters, and Vf is the falling seed velocity of the species in
meters per second, to determine potential patterns of wind dispersal. This model simplifies the
wind data, since the downwind, crosswind, and velocities at different heights are not taken into
consideration (Greene and Johnson 1989). I used wind data from the weather station on Crane
Flat that is at latitude 37.75° N and longitude 119.82° W. Crane Flat is located south of YFDP at
an elevation 2022 m above sea level, making it 111 m higher than YFDP (Weather conditions
2011). Pinus pondersa, Abies magnifica and Pseudotsuga menziesii disperse their seeds in the
fall (Table 2), so the data for the first day of September, October, November and December were
used over three years (2008, 2009, 2010). Salix scouleriana disperse their seeds from May to
June (Table 3), so the wind data for the first day of these two months were used for four years
(2008, 2009, 2010, 2011). Two measurements were considered. The first was the average wind
gust measured over the time period. The second measurement was maximum wind gust of the
time period, and represented a rare dispersal event caused by a rare wind event. Data from
LIDAR was used for the height (H) of the tree (Figure 3).

7
TABLE 2. Wind gust data at Crane Flat (m/s) TABLE 3. Wind gust data for Crane Flat (m/s)
I assumed the potential parent tree of an individual to be the nearest tree whose age,
inferred by DBH, is of seed bearing capabilities. The difference in diameters of the parent tree
and offspring need also be correlated to the abilities of the parent tree to produce the offspring. A
potential parent tree may be located outside the perimeter of YFDP, so distance to nearest edge
was considered. Coarse woody debris (CWD) was inventoried for YFDP, and was considered as
potential parent trees. ArcGIS was used to measure distances between trees, and horizontal and
transect distances were used to measure distances to the plot boundaries.
2011 2010
2009 2008
1-May 7 6 8 8.4
1-June 8 6.7 8 13.4
Average: 8.1
Maximum: 13.4
2010 2009 2008
1-September 6.3 6.8 13.5
1-October 7.2 8.1 9.5
1-November 8.1 4.1 23.4
1-Decemeber 6.3 6.8 5.0
Average: 8.7
Maximum: 23.4
FIGURE 3. LiDAR data on heights of the rare species in YFDP.

8
Seed characteristics vary between individual trees of the same species dependant upon
most notably site conditions (Sharpe and Fields 1982). I assumed that seed characteristics at
YFDP matched those available for the species. All data used is averaged (Table 4).
TABLE 4. Seed characteristics of rare species in YFDP.
Species
Weight
(mg)
Decent Velocity
(m/s)
Reproductive
Age(Years)
ABMA 70.87 1.92 35 to 45
PIPO 46.82 1.30 7
PSME 20.47 1.31 10
RHCA 93.00 N/A 2 to 3
SASC 0.07 0.39 10
*All sources cited in text below.
2.41 Pseudotsuga menseizii
Pseudotsuga menziesii have seeds with a single wing and are primarily dispersed by wind
and gravity (Siggins 1933). Pseudotsuga menziesii reach a minimum seed bearing age of fifteen
years old, and disperse their seed from September to early winter depending on the surrounding
environmental conditions (Allen 1942). Allen concluded that trees at 15 years in age have an
average DBH of 10.30 cm. Dick (1955) found that the majority of Pseudotsuga menziesii seeds
fall within 100 m of the parent tree, but noted reports that indicate dispersal from 1000 m to 2000
m away from the parent tree in the state of Washington. The amount of seed that is produced is
variable, but Hermann and Lavender (1990) indicate that average amounts are 2.2 kg/ha, of
which less than half are viable. They also indicate that the average Pseudotsuga menziesii seed in
California has a weight of 19.61 mg. Vander Wall et al. (2006) collected 140 seeds of
Pseudotsuga menziesii along Hwy 89, between Graeagle and Quincy, in northern California.
They found average seed weight to be 24.80 mg, descent velocity to be 1.28 m/s, wing area to be
52 mm2 and wind loading 0.52 mg/mm2. A study done by Siggins (1933), in which he dropped
seeds from designated heights, found that the Pseudotsuga menziesii seeds from California fell at
a velocity of 1.34 m/s, and had an average mass of 17.00 mg. In the Sierra Nevada, Pseudotsuga
menziesii have an elevation range of 610 m to 1830 m (Herman and Lavender 1990). Mean
elevation of the species in Yosemite National Park is 1564 m (Lutz et al. 2010).

9
2.42 Abies Magnifica
Abies magnifica are most frequently dispersed by wind, which occurs from September to
October (Gordon 1970). The seed being age of Abies magnifica in California is 35 to 45 years
old, and the average weight is 70.87 mg (Schopmeyer 1974). At 30 years old, Abies magnicifca
are noted to have a DBH of 30 cm in the Sierra region (Hill 1920). Cones are concentrated in the
uppermost potion of the crown (Laacke 1990). The seeds generally fall within a radius equal to
1.5 to 2 times the height of the parent tree (Furniss and Carolin 1977). Siggins (1933) noted
Abies magnifica to fall at an average velocity of 1.92 m/s. Elevation of Abies magnifica ranges
from 2130 m to 2740 m in the Sierra Nevada (Laacke 1990). Mean elevation of Abies magnifica
in Yosemite National Park is 2426 meters (Lutz et al. 2010).
2.43 Pinus ponderosa
Pinus ponderosa begin to bear seed when they are seven years old, and seeds are
dispersed from September to November (Oliver and Ryker 1990; Krugman and Jenkinson 2008).
Krugman and Jenkinson (2008) indicate the average weight of a seed to be 37.74 mg and they
recorded seed bearing age to be 6 to 20 years old. Vander Wall (2008) found that of the
California Pinus ponderosa trees he used in his study, seeds had an average weight of 55.9 mg,
wing mass of 9.6 mg, wing loading of 0.029 g/cm2, and decent velocity of 1.07 m/s. Siggins
found average velocity to be 1.52 m/s. Seedlings are able to grow an average of 22cm per 10
years (Oliver and Ryker 1990). Vankat (1970) reported Pinus ponderosa stands to have basal
areas ranging from 26 to 172 m2
ha-1
. The average basal area being 46.49 m2ha
-1. The elevation
range of Pinus pondersa in the Sierra Nevada is 1200 m - 2100 m (Rundel et al. 1977). Mean
elevation in Yosemite National Park is 1680 m (Lutz et al. 2010)
2.44 Rhamnus californica
The fruit of Rhamnus californica is a berrylike drupe that is 7-9 mm in diameter and
contains two nutlike seeds (Hubbard 1974). Many animals consume Rhamnus californica
berries, including many birds (especially band-tailed pigeons), black bears and woodrats (Dayton
1931; Conrad 1987). Rhamnus californica has a long lifespan of 100 to 200 years (Keeley 1981).
Seed production occurs at 2 to 3 years in age (Everett 1957), and seeds are dispersed in the fall

10
(Keeley 1987). Seed weight is 93 mg (Keeley 1991). Rhamnus californica is present in Califonia
at elevations less than 2300 m (Sawyer 1993).
2.45 Salix scouleriana
Salix scouleriana disperse their seed by wind miles away from the parent tree between
May and June (Sasada et al 2008). Seeds have an average weight of .07 mg (Anderson 2001).
The seeds have plumage that increase the time they are airborne (Hickman 2003). This species
starts producing seed around ten years of age (Anderson 2001). Seed decent velocity of Populus
tremuloides will be used, since there has been no study on the decent velocity of Salix
scouleriana. Both trees are in the family Salicaceae. Populus tremuloides has a seed weight of
0.13 mg, making it .06 mg bigger than Salix scouleriana (Perala 1990). The decent velocity of
Populus tremuloides is 0.39 m/s (Leadem et al. 1997). Salix scouleriana commonly reproduce
vegetatively (Voires 1981, Argus 1986). General elevation of Salix scouleriana ranges from sea
level to 3000 m (Densmore and Zasada 1983).
2.46 Animal Dispersal
While no data was collected on animals present at YFDP, many species of animals are
presumed present on the site and are listed in Appendix B. I assumed that general characteristics
of animal seed dispersal at YFDP matched those available at other sites. The results will be
incorporate into the discussion of the spatial patterns of the rare species.

11
3. RESULTS
3.1 Alpha Diversity
The alpha diversity of YFDP is 0.98. Species evenness is 0.09. Alpha diversity data for
YFDP is shown in Table 5. The alpha diversity of BCI is 3.96. Species evenness is 0.32. Data for
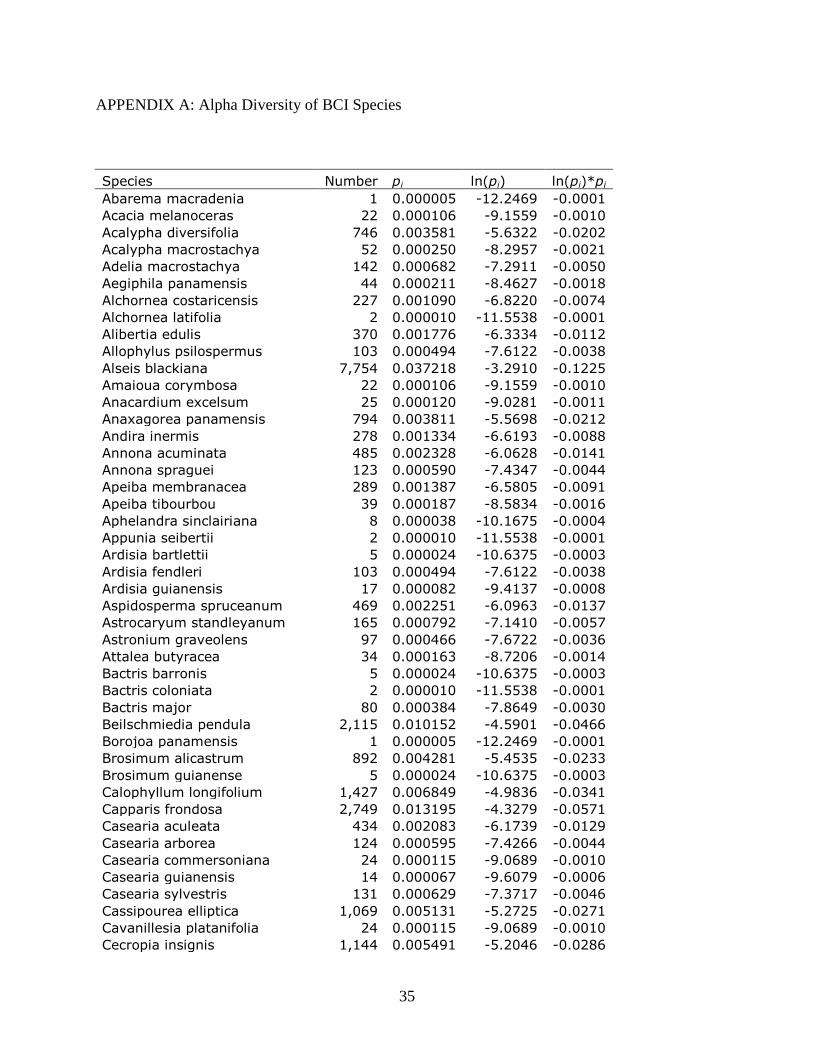
the alpha diversity of BCI is shown in Appendix A.
TABLE 5. Alpha Diversity of YFDP
Number pi ln(pi) ln(pi)*pi
ABCO 24494 0.71063 -0.34160 -0.24275
AMBA 11 0.00032 -8.04989 -0.00257
CADE 1591 0.04616 -3.07567 -0.14197
CONU 2370 0.06876 -2.67714 -0.18408
PILA 4745 0.13766 -1.98294 -0.27298
PIPO 2 0.00006 -9.75464 -0.00057
PREM/PRVI 128 0.00371 -5.59576 -0.02078
PSME 6 0.00017 -8.65603 -0.00151
QUKE 1109 0.03217 -3.43657 -0.11057
RHCA 1 0.00003 -10.44779 -0.00030
SASC 11 0.00032 -8.04989 -0.00257
Total: 34468.0 H’= 0.98065
3.2 Rare Species Index
The species determined rare at YFDP, which have a density less than 0.1 and importance
value index of less than 1 percent, are: Abies magnifica, Pinus ponderosa, Pseudotsuga
menziesii, Rhamnus californica, and Salix scouleriana (Table 6).

12
TABLE 6: Importance Value Index
Number
Relative
Density
Relative
Frequency
Relative
Dominance
Importance
ABCO 24494 65.826 65.830 34.910670 166.567
AMBA 11 0.030 0.030 0.072822 0.132
CADE 1591 4.276 4.276 5.699625 14.251
CONU 2370 6.369 6.369 0.307329 13.046
PILA 4745 12.752 12.752 34.236661 59.741
PIPO 2 0.005 0.005 0.014434 0.025
PREM/PRVI 128 0.344 0.344 0.002365 0.690
PSME 6 0.016 0.016 0.041835 0.074
QUKE 1109 2.980 2.980 1.340432 7.301
RHCA 1 0.003 0.003 0.000004 0.005
SASC 11 0.030 0.030 0.000177 0.059
Total: 34468 Note: Relative density and relative frequency are equal because only one plot was analyzed. Relative domiance was
calculated from dominance, which is the total basal area of a species divided by the area of YFDP (25.6 ha).
3.3 Seed Dispersal
TABLE 7. Potential Distances of Seed Dispersal Using the Cremer Model.
Species Tag Height* Seed
Velocity
Distance
Average¥
Distance
MaximumĦ
PSME 38-0698 5 1.31 33 89
PSME 38-0763 10 1.31 66 179
PSME 38-0735 39 1.31 259 697
PSME 36-0367 16** 1.31 73 196
ABMA 18-0073 24 1.92 109 293
ABMA 22-0143 26 1.92 118 317
ABMA 25-0616 27 1.92 122 329
ABMA 25-0783 50 1.92 227 609
ABMA 37-0553 19 1.92 86 232
PIPO 18-0888 3 1.3 20 54
SALIX 07-0447 6 0.39 125 206
SALIX 11-1061 6 0.39 134 360
SALIX 11-1062 3 0.39 67 180
SALIX 14-0646 3 0.39 67 180
SALIX 14-0648 4 0.39 89 240
SALIX 15-0647 4 0.39 89 240
SALIX 15-0648 4 0.39 89 240
SALIX 15-0665 26 0.39 580 1560
SALIX 15-0692 2 0.39 45 120 * Height of tree using the LiDAR data.
** 36-0367 is a snag, height was measure using a laser and is used in equation
¥ Distance inputing average wind gust (Table 3 and Table 4) into Cremer equation.
Ħ Distance inputinn maximum wind gust (Table 3 and Table 4) into Cremer equation.

13
3.31 Pseudotsuga menziesii
There are seven Pseudotsuga menziesii individuals present in the plot (Figure 4). All are
located in the eastern portion of YFDP between the elevations of 1805 m and 1850 m.
The seed dispersal distance of potential parent trees using the Cremer model is listed in
Table 7. Potential seed bearing trees are those with DBH above 10 cm and include: 38-0698, 38-
0763, 38-0735, 36-0367 and potential trees outside the perimeter of YFDP.
Distances between these individuals and the four boundaries of the plot are listed in Table
8. Potential parent trees are listed on the horizontal axis of the table and offspring are located on
the vertical axis of the table. The parent tree for 40-0590, 38-0367 and 38-0735 is presumed to
be outside the east perimeter of YFDP. The parent tree for 36-0373 is presumed to be 36-0367.
The parent tree of 36-0763 is presumed to be 38-0735. The parent tree for 38-0797 is presumed
to be 38-0735. The parent tree for 38-0698 is presumed to be 38-0698.
Of the rare species determined, only Pseudotsuga menziesii was identified in the CWD
inventoried (Figure 5).
FIGURE 4. Location of Pseudotsuga menziesii in YFDP.
40-0590
38-079738-0763
38-0735 38-0698
36-037336-0367
Ü0 80 160 240 32040
Meters

14
38-0698* 38-0763* 38-0735* 36-0367* North
¥ South
¥ East
¥ West
¥
DBH 10 30 102 125 - - - -
40-0590 7 57 58 61 168 65 255 2 798
36-0373 5 115 128 117 1 206 113 93 707
38-0763 30 20 0 11 128 84 236 43 743
38-0797 8 11 13 11 126 91 229 46 754
38-0698 10 0 20 11 116 101 219 46 754
36-0367 125 - - - - 207 113 94 706
38-0735 102 - - - - 101 219 46 754
* Denotes potential parent tree
¥ Denotes potential parent tree on directional perimeter of plot
Ü0 80 160 240 32040
Meters
Species
ABCO CADE PILA PSME QUKE
FIGURE 5. CWD of species in YFDP.
TABLE 8. Distances (in m) between potential parent Pseudotsuga menziesii trees and offspring.

15
3.32 Abies magnifica
There are eleven Abies magnifica individuals present at YFDP (Figure 6). The Abies
magnifica are spatially spread out, but the majority of the trees are present in the southeastern
portion of YFDP. All are located between the elevations of 1818 m and 1900 m.
The seed dispersal distance of potential parent trees using the Cremer model is listed in
Table 7. Potential seed bearing trees are those with DBH above 30 cm and include: 18-0073, 22-
0134, 25-0616, 25-0783, 37-0553 and potential trees outside the perimeter of YFDP.
Distances between these individuals and the four boundaries of the plot are listed in Table
9. Potential parent trees are listed on the horizontal axis of the table and offspring are located on
the vertical axis of the table. The parent tree for 11-1139 and 25-0783 is presumed to reside
beyond the north perimeter of YFDP. The parent tree of 18-0073, 29-0206, 30-0354, 30-0365,
30-0355, 30-0353 and 22-0134 is presumed to reside beyond the south perimeter of YFDP. The
parent tree for 25-0616 is presumes to be 25-0783. The parent tree of 37-0553 is presumed to
reside beyond the east perimeter of the plot.
37-055330-0365
30-035530-035430-0353
29-0206
25-0783
25-0616
22-013418-0073
11-1139
Ü0 80 160 240 32040
Meters
FIGURE 6. Location of Abies magnifica in YFDP

16
TABLE 9. Distances (in m) between potential parent Abies magnifica trees and offspring.
18-0073* 22-0134* 25-0616* 25-0783* 37-0553* N orth¥
South¥ East
¥ West
¥
DBH 40 57.6 40.8 109.8 34.7
11-1139 3.5 292 325 288 268 549 39 281 607 193
18-0073 39.9 0 77 240 307 400 282 38 454 347
22-0134 57.6 77 0 192 271 324 271 49 378 422
25-0616 40.8 240 192 0 87 262 91 229 307 493
37-0553 34.7 400 324 262 314 0 183 137 64 736
29-0206 4.8 229 153 204 288 183 278 42 224 576
30-0353 4.1 253 179 141 219 150 198 122 214 586
30-0354 3.8 256 181 141 218 149 196 124 213 587
30-0355 3.3 254 179 138 216 151 195 125 215 585
30-0365 1.7 255 182 128 204 154 182 138 218 582
25-0783 5 315 320 480
* Denotes potential parent tree
¥ Denotes potential parent tree on directional perimeter of plot
3.3 Pinus Ponerosa
There are two Pinus ponderosa in the plot (Figure 7). Both are present in the northwestern
portion of YFDP between the elevations of 1840 m and 1850 m.
The seed dispersal distance of potential parent trees using the Cremer model is listed in
Table 7. The potential seed bearing trees include: 18-0888 and potential trees outside the perimeter
of YFDP.
Distances between these individuals and the four boundaries of the plot are listed in Table
10. Potential parent trees are listed on the horizontal axis of the table and offspring are located on
the vertical axis of the table. The parent tree of both 08-0841and 18-0888 is presumed to be
located beyond the north perimeter of the plot.

17
* Denotes potential parent tree
¥ Denotes potential parent tree on directional perimeter of plot
18-0888
08-0841
Ü0 80 160 240 32040
Meters
3.34 Rhamnus californica
There is one individual of Rhamnus californica in the plot (Figure 9). The tree is located
at an elevation of approximately 1866 m. The distances between this tree and the plot boundaries
are shown in Table 11. The parent tree of 12-0398 is presumed to reside beyond the south
perimeter of YFDP. The Cremer model is not applicable in this situation, because Rhamnus
californica is dispersed by animals.
DBH 18-0888* North¥
South¥
East¥
West¥
08-0841 1.9 206 30 350 657 143
18-0888 62.8 48 272 456 344
FIGURE 7. Locations of Pinus Ponderosa in YFDP.
TABLE 10. Distances (in m) between potential parent Pinus ponderosa trees and offspring.

18
¥ Denotes potential parent tree on directional perimeter of plot
12-0398
Ü0 80 160 240 32040
Meters
.
TABLE 11. Distances of Rhamnus californica.
DBH North¥ South¥ East¥ West¥
12-0398 1.1 195 125 564 236
3.23 Salix scouleriana
There are eleven Salix scouleriana individuals present in the plot (Figure 9). All are
present in the northwestern portion of YFDP between the elevations of 1814 m and 1844 m.
The seed dispersal distance of potential parent trees using the Cremer model is listed in
Table 7. Potential seed bearing trees include: 07-0447, 11-1061, 11-1062, 14-0646, 14-0648, 14-
FIGURE 8. Location of Rhamnus californica in YFDP.

19
0647, 15-0647, 15-0646, 15-0648, 15-0665, 15-0692 and potential trees outside the perimeter of
YFDP.
Distances between these individuals and the four boundaries of the plot are listed in Table
12. Potential parent trees are listed on the horizontal axis of the table and offspring are located on
the vertical axis of the table. The parent tree of 07-0447 is presumed to be either 11-1061 or 11-
1062. The parent tree of 11-1061 and 11-1062 is presumed to reside beyond the north perimeter
of YFDP. The parent tree of 14-0646, 14-0647, 14-0648, 15-0665 and 15-0692 is presumed to be
either 15-0646, 15-0647 or 15-0648. The parent tree of 15-0646, 15-0647 and 15-0648 is
presumed to be either 14-0648, 14-0647, 14-0646 or 15-0648.
.
FIGURE 9. Locations of Salix scouleriana in YFDP
15-0647
15-069215-0665
15-064814-0648
14-0647
11-1062
11-106107-0447
Ü0 80 160 240 32040
Meters
14-0646 15-0646

20
* Denotes potential parent tree
¥ Denotes potential parent tree on directional perimeter of plot
TABLE 12. Distances (in m) between potential parent Salix scouleriana trees and offspring.
3.24 Animal Dispersal
Animals are capable of transferring a seed by direct contact with a seed through
consumption and indirect contact with a seed when a seed adheres to the body of the animal. It is
from this that all species that reside within the elevation range of YFDP are considered potential
dispersers.
Birds are capable of dispersing seeds a greater mean and maximum distance than wind
dispersion (Clark et al. 2005). Surrounding conditions, including: proximity to nest sites, other
foraging sources within the forest, and breeding grounds have a large effect on the species of
seeds birds choose to consume (Wenny and Levey 1998; Clark et al. 2004). Birds often disperse
seeds directly by the parent tree as foraging and defecation can occur in the same area (Clark et
al. 2005).
A study done by Hutchins and Lanner (1982) on animal dispersal in Whitebark pine
forests found that the most common seed consumers at that site were Clark’s Nutcracker, Stellars
Jay, Pine Grosbeak and chipmunks. The Clarks Nutcracker was the most frequent consumer and
many seeds were cached in various locations in the soil. Steller’s Jays were also frequent
07-0447*
11-1061*
11-1062*
14-0646*
14-0647*
14-0648* 15-0648*
15-0646*
15-0647* 15-0648* 15-0665* 15-0692* North¥ South¥ East¥ West¥
DBH 1.6 1.7 3 2.3 2.5 1 1.5 1.1
07-0447 0 76 140 140 152 153 165 153 88 232 159 641
11-1061 76 0 71 71 83 83 95 80 48 272 203 597
11-1062 76 0 71 71 83 83 95 80 48 272 203 597
14-0646 140 71 0 0 12 12 25 22 51 269 274 526
14-0647 140 71 0 0 12 12 25 22 51 269 274 526
14-0648 140 71 0 0 12 12 25 22 51 269 274 526
15-0646 152 83 12 12 0 0 13 17 46 274 286 514
15-0647 152 83 12 12 0 0 13 17 46 274 286 514
15-0648 153 83 12 12 0 0 13 17 46 274 286 514
15-0665 165 95 25 25 13 13 0 22 43 277 298 502
15-0692 153 80 22 22 17 17 22 0 50 270 281 519
21
visitors, but often tore the seeds apart to eat them, making germination unlikely. Catches made
by Stellar’s Jay were not in the soil. Many of the other bird species also tore apart the seeds such
as Mountain Chickadee, and Pine Grosbeak.
The effectiveness of rodents in seed dispersal is debatable. Hutchins and Lanner found
that red squirrels were responsible of much of the seed caching in their study, but that squirrels
place the seeds too deep to germinate. They also found that chipmunks buried their seeds too
deep as well. Bradbrooks (1958) found that caches made by chipmunks averaged 28 cm in depth.
However, many have proven that rodents are effective in acting as seed dispersers (Gordon 1943;
Tevis 1953; MacClintock 1970). A study conducted by West (1968) concluded a patch of Pinus
ponderosa seedlings originated forma a rodent cache.

22
4. DISCUSSION
4.1 Alpha Diversity
Alpha diversity at YFDP (0.98) is low compared to BCI (3.96). This is a result of YFDP
having only 11 species and BCI having 283 species. This follows the trend of a greater alpha
diversity at lower latitudes than at higher latitudes. Tropical forests usually exhibit a greater
amount of species diversity (Glenn-Lewin 1977). A hectare of Amazonian forest can contain 20-
300 species (Gentry 1988). Species evenness of YFDP is 0.09, indicating that YFDP is not very
even. It is heavily dominated by Abies concolor and Pinus lambertiana. Species evenness of BCI
is 0.32, indicating that it is not very even, but more so than YFDP. Table 5 shows that the most
dominant species in YFDP, Abies concolor, constitutes 71 percent of the total number of live
trees. Appendix A show the most dominant species in BCI, Hybanthus prunifolius, counts for 14
percent of the total number of live trees. BCI reflects the more even distribution of individuals
between the species as well as there being a greater number of species.
The high amount of alpha diversity in tropical forests also reflects the large number of
animals present (Howe and Smallwood 1982). Together, the high diversity of flora and fauna in
tropical forests contribute to a wide range of seed dispersal techniques (Muller-Landau et al.
2006). Producing a fruit that attracts many animal species increases the chances of it being
consumed (Howe and Smallwood 1982).
General fruit characteristics differ between tropical and temperate forests. Fruit in
temperate forests are often smaller and have less nutritional value than tropical fruit that have
more pulp and larger seeds (Herrera 1981). Sautu et al. (2006) characterized the seed biology of
100 native species of tress in the Panama Canal Watershed, an area of tropical forest in Panama.
The study concluded that the average seed weight of the 100 species is 1960 mg. The maximum
weight is 58,820 mg and the minimum weight is .1 mg. The average seed weight of the rare
species in YFDP is 46.25 mg. The maximum weight is 93 mg, and the minimum weight is 0.07
mg, stating that the seeds are much smaller than in the Panama Canal Watershed.
The vector by which plants disperse their seeds also can influence the success of the seed
being dispersed (Wills et al. 1997). There are some advantages to animal dispersal compared to
wind dispersal. Birds and mammals often migrate to or are in the area during the time of seed
dispersal, whereas strong winds may occur when seeds are not ready for dispersal (Stebbins
1971). Animals tend to move from the parent plant to areas that are similar or where conditions

23
are adventitious to the animal, increasing the chance of a seeds being deposited on a microsite
that is favorable to germination (Howe and Smallwood 182). The direction of wind is more
variable and has a higher probability of transferring seeds to unfavorable conditions (Stebbins
1971).
4.2 Rare Species
The definition of rarity has no set standard. The criteria for the importance value index
and density parameters in determining rarity were arbitrarily chosen, and as such are biased. The
standards chosen for YFDP fit the specific location, but may not apply to other sites. Many of the
rare species did display the most unique spatial patterns of the site in that their distribution was
less even.
4.3 Seed Dispersal
The Cremer model presented tenuous results given important parameters were not
included in the equation, some including: wind velocities from various heights of a tree, percent
slope on which the tree is anchored, climate of the site, and potential for multiple vectors.
Heights originated from LiDAR data, and were not specific to the tree. This method indicated the
tallest tree in the area of the tag number and did not give exact measurements.
Seed morphology is a good indicator of the potential movements of the seed. It is found
that small seeds with a smaller wind velocity are best transported by wind (Vander Wall 2003),
and that larger seeds are more prone to animal dispersal (Vander Wall 2008). These parameters
will be considered in the discussion of the rare species noted in YFDP.
4.32 Pseudotsuga menziesii
The Pseudotsuga menziesii present in YFDP are located in the upper extent of their
elevation range, and extend out of the ranges indicated by Herman and Lavender. The presence
of Pseudotsuga menziesii is still feasible given it is only 20 m above the indicated ranges.
Results of the Cremer equation are highly variable depending on the data inputs. As
indicated in Table 7, 36-0367 is capable of dispersing seeds a distance of 73 m under average
wind gust conditions. Tree 36-0373, the presumed offspring of the tree, is within this distance.
Tree 38-0735 is capable of dispersing seeds 259 m. The presumed offspring: 38-0763, 38-0797
24
and 38-0698 are all within this distance. All trees are within 259 m of 38-0735, indicating that it
could be the potential parent to all the trees, with the exception of 36-0367 whose DBH is greater
than 38-0735. All offspring are within 100 meters of their presumed parent plant and are in
accordance to the results of Dick.
Figure 5 shows Pseudotsuga menziesii CWD in the plot at close proximity to the standing
trees. All diameters of the CWD place them at seed bearing age when they were alive, thus
indicating that any of the CWD has the potential to be parent tree to any of the other
Pseudotsuga menziesii trees. Uncertainty on how long ago the trees were alive and capable of
producing seed makes correlations tenuous.
The close proximity of the Pseudotsuga menziesii trees to each other and to the plot
boundaries makes wind dispersal the most likely vector of dispersal. Trees 38-0797, 38-0797 and
38-0698 are all located 11 m away in a semicircular fashion east of presumed parent tree 38-
0735. The symmetry and similar direction in placement are characteristic of wind dispersal
(Seidler and Plotkin 2006). Psuedotsuga menziesii have a large wing length to seed weight ratio
when compared to other species, such as Pseudotsuga macrocarpa, making dispersal by wind
more effective (Vander Wall et al. 2006). The animals listed in Appendix B could also be
responsible for movement of seeds small distances, or for the placement of parent trees 36-0367
and 38-0735.
4.33 Abies magnifica
The Abies magnifica in the plot are well below their elevation ranges cited by Laacke and
Lutz et al. The Abies magnifica at the highest elevation point is 230 m below 2130 m, the
minimum elevation range. This makes the presence of this species in the plot of rarity. Most
likely a rare event or long distance dispersal occurred.
All Abies magnifica, except 25-0616, have closest potential parent trees beyond the
perimeter of YFDP. Trees are placed in a random spatial pattern, and offspring are not located
closest to trees of seed bearing age. The Cremer model gives 25-0783 a dispersal distance of 227
when average wind gust is considered. Tree 25-0616 falls within this range, and it can be
inferred that 25-0783 is the parent tree. Using maximum wind gust, 25-0783 is capable of a
dispersal distance of 609 m. This distance means that if a wind gust of 23.4 m/s were to have
originated from the north, all individuals present could have originated from 25-0783.

25
However, this is highly unlikely given the spatial patterns of Abies magnifica present at
YFDP. It is more probable that animals or a combination of animals and wind are responsible for
the spatial patterns present. Abies magnifica have a large seed weight of 70.87 mg, which is often
favorable to animals given the high nutrient content (Vander Wall 2008). The large weight also
equates to a fast decent velocity that is unable to transport seeds far distances. The characteristics
of seed dispersing animals, described in 3.24, indicates that most of the Abies magnifica in
YFDP were probably dispersed by birds. Squirrels are unlikely the disperser due to the depth of
burial (Hutchins and Lanner 1982).
4.34 Pinus ponderosa
Pinus ponderosa are present within the upper limits of their elevation range cited by
Rundel et al. At YFDP, the Pinus ponderosa at the lowest elevation range is 160 m above the
mean elevation cited by Lutz et al.
The closest parent tree of both Pinus ponderosa trees is presumed to be beyond the north
perimeter of YFDP. The Cremer model gives 18-0888 a dispersal distance of 54 m when
maximum wind gusts are considered. This model predicts that 18-0888 is not the parent tree to
08-0841, since the distance between them is greater than 54 m.
The average weight of the Pinus ponderosa seed indicated in Table 4 is 46.82 mg,
making it 26.35 mg larger than Pseudotsuga menziesii. The decent velocity of Pinus ponderosa
is 1.30 m/s, while the decent velocity of Pseudotsuga menziesii is 1.31 m/s. Pinus ponderosa
have a lower decent velocity compared to their weight. Together the large seed weight and low
decent velocity make the species a viable wind disperser and an effective specimen for animal
dispersal.
While it is possible that a parent Pinus ponderosa resides beyond the perimeter of YFDP,
an animal is most likely the cause of the spatial patterns of this species in YFDP. Given the
distance between the individuals, it is most likely that a bird distributed the seeds to their
locations, given birds disperse seeds greater distances than rodents (Clark et al. 2005). Vander
Wall (2008) found that animals gathered 38 percent of the seeds of the Pinus ponderosa in the 60
days observation study conducted. He noted the importance of animals in the dispersal patterns
of Pinus ponderosa.
26
The Vander Wall study (2008) concluded an inverse relationship between seed size and
predation rates. A significant portion of the seedling establishment of Pinus ponderosa was due
to seed catching rodents. This was a result of the relatively large size of the seed. Rodents have a
greater chance of burying the seeds, which increases the chances of germination given the
favorable microcondition (Brewer and Rejmanek 1999, Forget 1990, Forget 1992).
4.35 Rhamnus californica
There is only one Rhamnus californica present in YFDP. The origin of this tree is most
likely from outside YFDP, unless it is a relic population. The individual at the site is within the
cited elevation ranges made by Sawyer (1993). The fruit of Rhamnus californica is a drupe and
is dispersed by animals. Given the large distance between the tree and the perimeters of the plot,
a bird or bear is most likely the disperser of this tree (Clark et al. 2005).
4.36 Salix scouleriana
All trees of this species are within the elevation ranges cited by Densmore and Zasada.
Most trees are aggregated by each other, and are in or in close proximity to N11, N14 and N15
and 015. The Cremer model gives the correlation that all of the Salix trees have the potential to
be the parent plant of the other trees. There is little research on the relation between DBH and
age, so the potential parent trees that dispersed seeds were indistinguishable. All trees had the
potential to be parent trees through vegetative reproduction.
Analysis of the LiDAR data gave the Salix species uncharacteristic heights compared to
their DBHs. Through the LiDAR data, tree 15-0665 was associated with the tree height of 26 m.
This is highly unlikely, given the DBH of this tree is 1.5 cm.
Seeds of Salix scouleriana are small and thus easily taken long distances by wind. Wind
is most effective for smaller seeds (Siepielski and Benkman 2007). Animals are most likely not
attracted to these seeds given their poor nutrient composition, suggesting that wind is the most
likely cause of the spatial patterns.
27
5. CONCLUSION
Alpha diversity contributes to the seed dispersal potential of a forest. Those with high
alpha diversity have a greater number of potential vectors of dispersal than those will lower
alpha diversity. This diversity in dispersal vectors often leads to more diverse spatial patterns as
each vector is capable of contrasting movement.
With much research on climate change, movement capabilities of plants through seed
dispersal are highly desirable and often modeled. While it was proposed by Anderson (1991) that
models are a better representation of data, because they are more precise and have better
explanatory power when compared to phenomenological description, this may not always be the
case. Seed dispersal models are often a generalization of the event, and factors such as climate,
soil properties, individual vector characteristics and various wind descriptors are not included.
This makes results tenuous. Models need to be calibrated to the specific site at which the data is
accumulated, so unique characteristics of the site can be considered. The Cremer model was an
inaccurate depiction of YFDP, and results could be molded depending on inputs to fit an array of
conclusions.
There are many animals present in YFDP. While they may not be the characteristic
disperser of most of the rare species present at YFDP, they are most likely consuming seeds and
contributing to the spatial patterns of the area. The Vander Wall (2008) study found that rodents
removed 99% of the Pinus lambertiana in the Whittell Forest and Wildlife Area in Nevada. As
shown in Table 5, Pinus lambertiana is the second most dominant species in YFDP, indicating
the method of animal dispersal to be more important than historically considered. As apparent
from the differences in data from studies at various locations, seed morphology is characteristic
of the individual tree and specific location. A basic trend holds that individuals at sites with high
animal dispersal potential have greater seed weights than individuals where numbers are not as
high (Wilson 1990). The biotic vectors at YFDP need to be considered in further research, and
their importance quantified in attempts to understand the co-existence of the tree and animal
species. Further research is needed on the specific seed characteristics of the species at YFDP as
well as a study on the habits of the animals present.

28
References
Allen G. 1942. Douglas-fir (Pseudotsuga taxifolia (Lamb.) Britt.): a summary
of its life history. Res. Note 9. Victoria, British Columbia Forest Service. p. 27
Andrerson M. 1991. Mechanistic models for the seed shadows of wind-dispersed plants. The
American Naturalist 137(4)476-497.
Anderson M. 2001. Salix scouleriana. In: Fire Effects Information System, [Online]. U.S.
Department of Agriculture, Forest Service, Rocky Mountain Research Station, Fire
Sciences Laboratory (Producer). Available: http://www.fs.fed.us/database/feis/ [2011,
May 20].
Argus G. 1986. The Genus Salix (Salicaceae) in the Southeastern United States. Systematic
Botany Monographs 9:1-170.
Brewer S, Rejmanek M. 1999. Small rodents as significant dispersers of tree seeds in a
neotropical forests. Journal of Vegetation Science 10:165-174.
Broadbooks H. 1958. Life history and ecology of the chipmunk (Eutamias amoenus) in eastern
Washington. Misc. Publ. Mus.Zool., University of Michigan 103:5-42.
Chave J, Muller-Landau H, Levin S. 2002. Comparing classical community models: theoretical
consequences for patterns of diversity. American Naturalist 159:1-23.
Clark C, Poulsen J, Connor E, Parker V. 2004. Fruiting trees as dispersal foci in a semi-
deciduous tropical forest. Oecologia 139:66-75.
Clark C, Poulsen J, Bolker B, Connor E, Parker V. 2005. Comparative seed shadows of bird-,
monkey-, and wind-dispersed trees. Ecology 86(19):2684-2694.
Clark J, Fastie C, Hurtt G, Jackson S, Johnson C, King G, Lewis M, Lynch J, Pacala S, Prentice
C, Schupp E, Webb III T, Wyckoff P. 1998. Reid's paradox of rapid plant migration:
dispersal theory and interpretation of paleoecological records. BioScience 48:13–24.
Clark J, Lewis M, McLachlan J, Hille Ris Lambers J. 2003. Estimating population spread: what
can we forecast and how well? Ecology 84(8):1979-1988.
Connell J. 1971. On the role of natural enemies in preventing competitive exclusion in some
marine animals and in rain forest trees. Dynamics of Populations. PUDOC, Wageningen.
p. 298-312.

29
Conrad C. 1987. Common shrubs of chaparral and associated ecosystems of southern California.
Gen. Tech. Rep. PSW-99. Berkeley, CA: U.S. Department of Agriculture, Forest Service,
Pacific Southwest Forest and Range Experiment Station. p. 86
Cremer K. 1971. Speeds of falling and dispersal of seed of Pinus radiata and Pinus contorta.
Australian Forest Research 5:29-32.
Curtis J, McIntosh R. 1950. The interrelations of certain analytic and synthetic phytosociological
characters. Ecology 31(3):34-455.
Dayton W. 1931. Important western browse plants. Misc. Publ. 101. Washington, DC: U.S.
Department of Agriculture. p. 214
Densmore R, Zasada J. 1983. Seed dispersal and dormancy patterns in northern willows:
ecological and evolutionary significance. Canadian Journal of Botany. 61(5027): 3207-
3216.
Dick J. 1955. Studies of Douglas fir seed flight in southwestern Washington. Weyerhaeuser
Timber Company, Forestry Research Note 12. Tacoma, WA. p. 4
Everett P. 1957. A summary of the culture of California plants at the Rancho Santa Ana Botanic
Garden 1927-1950. Claremont, CA: The Rancho Santa Ana Botanic Garden. p. 223
Forget P. 1990. Seed dispersal of Vouacapoua Americana Aublet (Caesalpiniaceae) by
caviomorph rodents. Journal of Tropical Ecology 6:459-468.
Forgot P. 1992. Seed removal and seed fate in Gustavia superba (Lecythidaceae). Biotropica
24:408-414.
Fuentes M. 2000. Fruigivory, seed dispersal and plant community ecology. Trends in Ecology
and Evolution 15(12):487-488.
Furniss R, Carolin V. 1977. Western forest insects. U.S. Department of Agriculture,
Miscellaneous Publication 1339. Washington, DC. p. 654.
Glenn-Lewin D. 1977. Species diversity in North American temperate forests. Plant Ecology
33(2/3): 153-162
Graber D, White M. 1980. Black bear food habits in Yosemite National Park. Bears: Their
Biology and Management, A selection of papers from the fifth international conference
on bear research and management, Madison, Wisconsin, USA 5: 1-10.
Gordon D. 1970. Natural regeneration of white and red fir influence of several factors. USDA
Forest Service, Research Paper PSW-58. Pacific Southwest Forest and Range Experiment
Station, Berkeley, CA. p. 32.

30
Gordon K. 1943. The natural history and behavior of the western chipmunk and mantled ground
squirrel. Oregon State Monograph Studies in Zoology 5:7-38
Greene D, Johnson E. 1989. A model of wind dispersal of winged or plumed seeds. Ecology
70:339-347.
Greene D, Johnson E. 1996. Wind dispersal of seeds form a forest into a clearing. Ecology
77:1956-1963.
Hermann R, Lavender D. 1990. Volume 1: Conifers, Douglas-Fir. Silvics of North America.
Agriculture Handbook 654. United States Department of Agriculture, Forest Service,
Washington, DC. Vol.2
Herrera C. 1981. Are tropical fruits more rewarding to dispersers than temperate ones? The
American Naturalist 118(6): 896-907.
Hickman. 2003. Jepson Manual: Salix scouleriana. University of California, Berkeley, CA.
Hill C. 1920. Forests of Yosemite, Sequoia, and General Grant National Parks. U.S. Forest
Service. Government Printing Office, Washington.
Howe H, Smallwood H. 1982. Ecology of seed dispersal. Annual Review of Ecology and
Systematics 13:201-228.
Hubbard R. 1974. Rhamnus L. Buckthorn. In: Schopmeyer, C.S. ed. Seeds of woody plants in the
United States. Agricultural Handbook No. 450. Washington: U.S. Department of
Agriculture, Forest Services: 704-708.
Hutchins H, Lanner R. 1982. The central role of Clark’s Nutcracker in the dispersal and
establishment of whitebark pine. Oecologia 55(2):192-201.
Janzen D. 1970. Herbivores and the number of tree species in tropical forests. The
American Naturalist 104: 501-528.
Janson C. 1983. Adaptation of fruit morphology to dispersal agents in a neotropical forest.
Science 219:187-189.
Keeley J. 1981. Reproductive cycles and fire regimes. In: Mooney, H, Bonnicksen T,
Christensen N,[and others], technical coordinators. Fire regimes and ecosystem
properties: Proceedings of the conference; 1978 December 11-15; Honolulu, HI. Gen.
Tech. Rep. WO-26. Washington, DC: U.S. Department of Agriculture, Forest Service:
231-277.
Keeley J. 1987. Role of fire in seed germination of woody taxa in California chaparral. Ecology
68(2):434-443.

31
Keeley J. 1991. Seed germination and Life history syndromes in the California Chaparral.
Botanical Review 57(2):81-116
Kelt D, Van Vuren D. 2001. The ecology and macroecology of mammalian home range area.
American Naturalist 157:637-645.
Krugman S, Jenkinson J. 2008. Pinus. Uunited Staes Department of Agricutlure, Forest Service,
Agriculture Handbook 727. Woody Plant Seed Manual, USDA Forest Service
Agriculture Handbook 727. National Seed laboratory, 5675 Riggins Mill Road, Dry
Branch, GA 31020.
Laacke R. 1990. Volume 1: Conifers, California red fir. Silvics of North America.
Agriculture Handbook 654. United States Department of Agriculture, Forest Service,
Washington, DC. Vol.2
Lanner R. 1982. Avian seed dispersal as a factor in the ecology and evolution of limber and
whitebark pines. Proceeding of the Sixth North American Foest Biology Workshop.
University of Alberta, Edmonton, Canada. Pages 15-48.
Leadem C, Gillies S, Yearsley H, Sit V, Spittlehouse D, Burton P.1991. Chapter 4: Seed
dispersal. Field Studies of Seed Biology. Research Branch. B.C. Ministry of Forests:
Victorica, B.C.
Leigh Jr. E, de Alba G. 1992. Barro Colorado island, Panama, Basic Research, and Conservation.
The George Wright FORUM 9 (3 and 4): 32-45.
Lutz J, van Wagtendonk J, Franklin J. 2010. Climate water deficit, tree species ranges, and
climate change in Yosemite National Park. Journal of Biogeography 37:936-950.
MacClintock D. 1970. Squirrels of North America. Van Nostrand Reinhold Co., New York
Muller-Landau H, Hardesty B. 2005. Seed dispersal of woody plants in tropical forests:
concepts, examples, and future directions. Biotic Interactions in the Tropics: Their Role
in the Maintenance of Species Diversity (eds D. Burslem, M. Pinard & S. Hartley), p.
267–309. Cambridge University Press, Cambridge.
Muller-Landau H, Wright S, Calderon O, Condit R, Hubbell S. 2008. Interspecific variation in
primary seed dispersal in a tropical forest. Journal of Ecology 96: 653-667.
Nathan R, Muller-Landau H. 2000. Spatial patterns of seed dispersal , their determinants and
consequences for recruitment. Trends in Ecology and Evolution 15:278-285.
Oliver W, Ryker R. 1990. Volume 1: Conifers, Douglas-Fir. Silvics of North America.
Agriculture Handbook 654. United States Department of Agriculture, Forest Service,
Washington, DC. Vol.2

32
Ouborg N, Piquot Y, Van Groenedael J. 1999. Population genetics, molecular markers and the
study of dispersal in plants. Journal of Ecology 87(4):551-568.
Perala D. 1990. Volume 2: Hardwoods, Quaking Aspen. Silvics of North America.
Agriculture Handbook 654. United States Department of Agriculture, Forest Service,
Washington, DC. Vol.2
Pianka E. 1966. Latitudinal gradients in species diversity: a review of concepts. The American
Naturalist 100(910):33-46.
Prance G. 1977. Floristic inventory of the tropics: where do we stand? Annals of Missouri
Botanical Garden 64:659–684.
Rohde K. 1992. Latitudinal gradients in species diversity: the search for the primary cause.
Oikos 65(3):514-527.
Rundel P, Gordon D, Parsons D. 1977. Montane and subalpine vegetation of the Sierra Nevada
and Cascade Ranges. Pages 559-599 In M. G. Barbour and J. Major, eds. Terrestrial
vegetation of California. John Wiley and Sons, New York.
Russo S. Portnoy S, Augspurger C. 2006. Incorporating animal behavior into seed dispersal
models: Implications for seed shadows. Ecology 87:3160-3174.
Sautu A, Baskin J, Baskin C, Condit R. 2006. Studies on the seed biology of 100 native species
of trees in a seasonal moist tropical forest, Panama, Central America. Forest Ecology and
Management 243:245-263.
Sawyer J. 1993. Rhamnaceae. Treatment from the Jepson Manual. University of California
Press, California.
Scholl A, Taylor A. 2010. Fire regimes, forest change, and self-organization in an old-growth
mixed forest, Yosemite National, USA. Ecological Applications 20(2):362-380.
Schopmeyer C. 1974. Seeds of woody plants in the United States. U.S. Department of
Agriculture, Agriculture Handbook 450. Washington, DC. Page 883.
Seidler T, Plotkin J. 2006. Seed dispersal and spatial pattern in tropical trees. PLoS Biology
4:344.
Shannon C. 1948. A mathematical theory of communication. The Bell System Technical Journal
27:379-423, 623-656.
Sieplielski A, Benkman C. 2007. Selection by a predispersal seed predator constrains the
evolution of avian seed dispersal in pines. Functional Ecology 2(3):611-618.

33
Siggins H. 1933. Distribution and rate of fall of conifer seeds. Journal Agricultural Research
47(2) 119-128.
Soil Survey of Yosemite National Park, California. 2006. United States Department of
Agriculture, Natural Resources Conservation Service, United States Department of the
Interior.
Stebbins G. 1971. Adaptive radiation of reproductive characteristics in angiosperms, II: seeds
and seedlings Ecology, Evolution and Systematics 2:237-260.
Tevis Jr. L. 1953. Stomach contents of chipmunks and mantled ground squirrels in northeastern
California. Journal of Mammalology 34:316-324.
Vander Wall S. 2003. Effects of seed size of wind-dispersed pines (Pinus) on secondary seed
dispersal and the caching behavior of rodents. Oikos 100:25-34.
Vander Wall S, Borchert M, Gworek J. 2006. Secondary dispersal of bigcone Douglas-fir
(Pseudotsuga macrocarpa) seeds. Acta Oecologica 30:100-106.
Vander Wall S. 2008. On the relative contributions of wind vs animlas to seed dispersal of four
Sierra Nevada pines. Ecology 89(7):1837-1849.
Vankat J. 1970. Vegetation change in Sequoia National Park, California. Ph. D. dissertation,
University California Davis.
Vories K. 1981. Growing Colorado plants from seed: a state of the art, volume 1:
shrubs. 80 Ogden, UT: U.S. Department of Agriculture, Forest Service, Intermountain
Forest and Range Experiment Station
Weather Conditions for CNFCI. 2011. Real Time Observation Monitor and Analysis Network.
Meso West, University of Utah and US Forest Service. Available at:
http://raws.wrh.noaa.gov/cgi-bin/roman/meso_base.cgi?stn=CNFC1&time=GMT. [May
2011].
Wenny D, Levey D. 1998. Directed seed dispersal by bellbirds in a tropical cloud forest.
Proceedings of the National Academy of Sciences 85:6204-6207.
West N. 1968. Rodent influenced establishment of ponderosa pine and bitter-brush seedlings in
central Oregon. Ecology 49:1009-1011
Wills C, Condit R, Foster R, Hubbell S. 1997. Strong density- and diversity-related effects help
to maintain tree species diversity in a neotropical forest. Proceedings of the National
Academy of Sciences 94:1252-1257.
Wilson M, Rice B, Westoby M. 1990. Seed dispersal spectra: a comparison of temperate plant
communities. Journal of Vegetation Science 1(4):547-562.

34
Wright S. 2002. Plant diversity in tropical forests: a review of mechanisms of species
coexistence. Oecologia 130: 1-14.
Zasada J, Douglas D, Buechler W. Salix. 2008. United States Department of Agriculture, Forest
Service, Agriculture Handbook 727. Woody Plant Seed Manual, USDA Forest Service
Agriculture Handbook 727. National Seed laboratory, 5675 Riggins Mill Road, Dry
Branch, GA 31020.
35
APPENDIX A: Alpha Diversity of BCI Species
Species Number pi ln(pi) ln(pi)*pi
Abarema macradenia 1 0.000005 -12.2469 -0.0001
Acacia melanoceras 22 0.000106 -9.1559 -0.0010
Acalypha diversifolia 746 0.003581 -5.6322 -0.0202
Acalypha macrostachya 52 0.000250 -8.2957 -0.0021
Adelia macrostachya 142 0.000682 -7.2911 -0.0050
Aegiphila panamensis 44 0.000211 -8.4627 -0.0018
Alchornea costaricensis 227 0.001090 -6.8220 -0.0074
Alchornea latifolia 2 0.000010 -11.5538 -0.0001
Alibertia edulis 370 0.001776 -6.3334 -0.0112
Allophylus psilospermus 103 0.000494 -7.6122 -0.0038
Alseis blackiana 7,754 0.037218 -3.2910 -0.1225
Amaioua corymbosa 22 0.000106 -9.1559 -0.0010
Anacardium excelsum 25 0.000120 -9.0281 -0.0011
Anaxagorea panamensis 794 0.003811 -5.5698 -0.0212
Andira inermis 278 0.001334 -6.6193 -0.0088
Annona acuminata 485 0.002328 -6.0628 -0.0141
Annona spraguei 123 0.000590 -7.4347 -0.0044
Apeiba membranacea 289 0.001387 -6.5805 -0.0091
Apeiba tibourbou 39 0.000187 -8.5834 -0.0016
Aphelandra sinclairiana 8 0.000038 -10.1675 -0.0004
Appunia seibertii 2 0.000010 -11.5538 -0.0001
Ardisia bartlettii 5 0.000024 -10.6375 -0.0003
Ardisia fendleri 103 0.000494 -7.6122 -0.0038
Ardisia guianensis 17 0.000082 -9.4137 -0.0008
Aspidosperma spruceanum 469 0.002251 -6.0963 -0.0137
Astrocaryum standleyanum 165 0.000792 -7.1410 -0.0057
Astronium graveolens 97 0.000466 -7.6722 -0.0036
Attalea butyracea 34 0.000163 -8.7206 -0.0014
Bactris barronis 5 0.000024 -10.6375 -0.0003
Bactris coloniata 2 0.000010 -11.5538 -0.0001
Bactris major 80 0.000384 -7.8649 -0.0030
Beilschmiedia pendula 2,115 0.010152 -4.5901 -0.0466
Borojoa panamensis 1 0.000005 -12.2469 -0.0001
Brosimum alicastrum 892 0.004281 -5.4535 -0.0233
Brosimum guianense 5 0.000024 -10.6375 -0.0003
Calophyllum longifolium 1,427 0.006849 -4.9836 -0.0341
Capparis frondosa 2,749 0.013195 -4.3279 -0.0571
Casearia aculeata 434 0.002083 -6.1739 -0.0129
Casearia arborea 124 0.000595 -7.4266 -0.0044
Casearia commersoniana 24 0.000115 -9.0689 -0.0010
Casearia guianensis 14 0.000067 -9.6079 -0.0006
Casearia sylvestris 131 0.000629 -7.3717 -0.0046
Cassipourea elliptica 1,069 0.005131 -5.2725 -0.0271
Cavanillesia platanifolia 24 0.000115 -9.0689 -0.0010
Cecropia insignis 1,144 0.005491 -5.2046 -0.0286
36
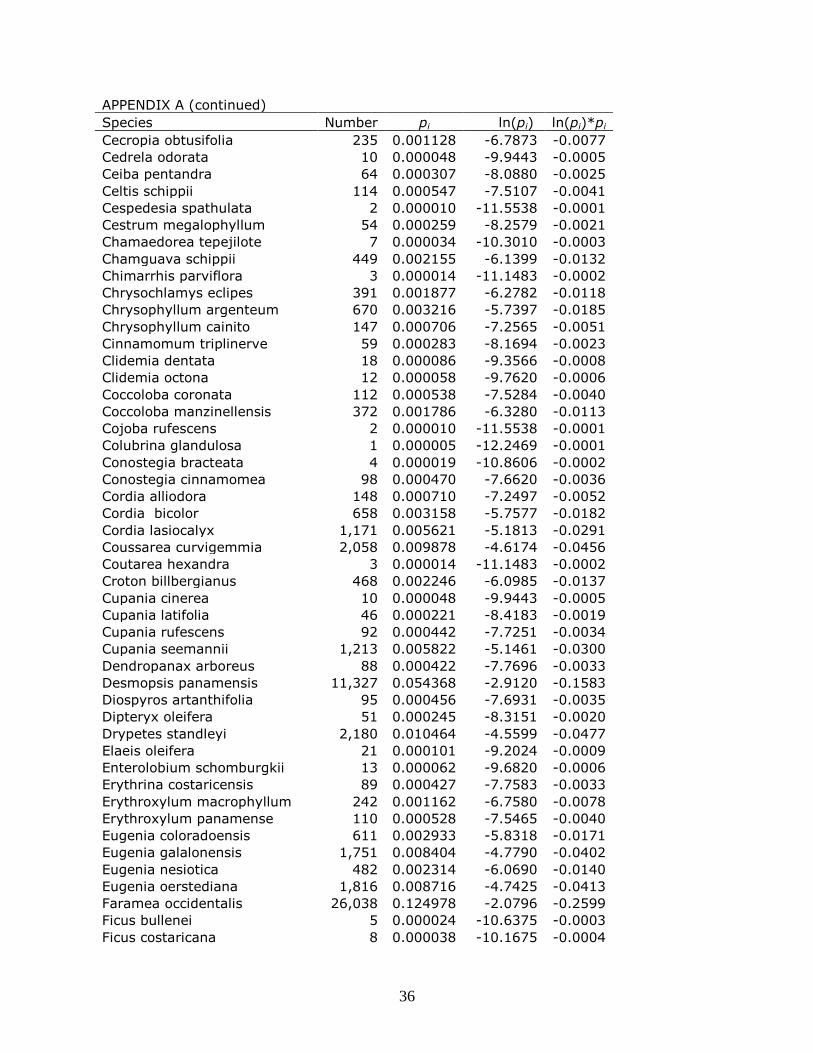
APPENDIX A (continued)
Species Number pi ln(pi) ln(pi)*pi
Cecropia obtusifolia 235 0.001128 -6.7873 -0.0077
Cedrela odorata 10 0.000048 -9.9443 -0.0005
Ceiba pentandra 64 0.000307 -8.0880 -0.0025
Celtis schippii 114 0.000547 -7.5107 -0.0041
Cespedesia spathulata 2 0.000010 -11.5538 -0.0001
Cestrum megalophyllum 54 0.000259 -8.2579 -0.0021
Chamaedorea tepejilote 7 0.000034 -10.3010 -0.0003
Chamguava schippii 449 0.002155 -6.1399 -0.0132
Chimarrhis parviflora 3 0.000014 -11.1483 -0.0002
Chrysochlamys eclipes 391 0.001877 -6.2782 -0.0118
Chrysophyllum argenteum 670 0.003216 -5.7397 -0.0185
Chrysophyllum cainito 147 0.000706 -7.2565 -0.0051
Cinnamomum triplinerve 59 0.000283 -8.1694 -0.0023
Clidemia dentata 18 0.000086 -9.3566 -0.0008
Clidemia octona 12 0.000058 -9.7620 -0.0006
Coccoloba coronata 112 0.000538 -7.5284 -0.0040
Coccoloba manzinellensis 372 0.001786 -6.3280 -0.0113
Cojoba rufescens 2 0.000010 -11.5538 -0.0001
Colubrina glandulosa 1 0.000005 -12.2469 -0.0001
Conostegia bracteata 4 0.000019 -10.8606 -0.0002
Conostegia cinnamomea 98 0.000470 -7.6620 -0.0036
Cordia alliodora 148 0.000710 -7.2497 -0.0052
Cordia bicolor 658 0.003158 -5.7577 -0.0182
Cordia lasiocalyx 1,171 0.005621 -5.1813 -0.0291
Coussarea curvigemmia 2,058 0.009878 -4.6174 -0.0456
Coutarea hexandra 3 0.000014 -11.1483 -0.0002
Croton billbergianus 468 0.002246 -6.0985 -0.0137
Cupania cinerea 10 0.000048 -9.9443 -0.0005
Cupania latifolia 46 0.000221 -8.4183 -0.0019
Cupania rufescens 92 0.000442 -7.7251 -0.0034
Cupania seemannii 1,213 0.005822 -5.1461 -0.0300
Dendropanax arboreus 88 0.000422 -7.7696 -0.0033
Desmopsis panamensis 11,327 0.054368 -2.9120 -0.1583
Diospyros artanthifolia 95 0.000456 -7.6931 -0.0035
Dipteryx oleifera 51 0.000245 -8.3151 -0.0020
Drypetes standleyi 2,180 0.010464 -4.5599 -0.0477
Elaeis oleifera 21 0.000101 -9.2024 -0.0009
Enterolobium schomburgkii 13 0.000062 -9.6820 -0.0006
Erythrina costaricensis 89 0.000427 -7.7583 -0.0033
Erythroxylum macrophyllum 242 0.001162 -6.7580 -0.0078
Erythroxylum panamense 110 0.000528 -7.5465 -0.0040
Eugenia coloradoensis 611 0.002933 -5.8318 -0.0171
Eugenia galalonensis 1,751 0.008404 -4.7790 -0.0402
Eugenia nesiotica 482 0.002314 -6.0690 -0.0140
Eugenia oerstediana 1,816 0.008716 -4.7425 -0.0413
Faramea occidentalis 26,038 0.124978 -2.0796 -0.2599
Ficus bullenei 5 0.000024 -10.6375 -0.0003
Ficus costaricana 8 0.000038 -10.1675 -0.0004

37
APPENDIX A (continued)
Species Number pi ln(pi) ln(pi)*pi
Ficus insipida 16 0.000077 -9.4743 -0.0007
Ficus maxima 8 0.000038 -10.1675 -0.0004
Ficus obtusifolia 6 0.000029 -10.4552 -0.0003
Ficus popenoei 3 0.000014 -11.1483 -0.0002
Ficus tonduzii 24 0.000115 -9.0689 -0.0010
Ficus trigonata 5 0.000024 -10.6375 -0.0003
Ficus yoponensis 7 0.000034 -10.3010 -0.0003
Garcinia intermedia 4,602 0.022089 -3.8127 -0.0842
Garcinia madruno 393 0.001886 -6.2731 -0.0118
Genipa americana 66 0.000317 -8.0573 -0.0026
Guapira standleyana 164 0.000787 -7.1471 -0.0056
Guarea 'fuzzy' 823 0.003950 -5.5340 -0.0219
Guarea grandifolia 59 0.000283 -8.1694 -0.0023
Guarea guidonia 1,774 0.008515 -4.7659 -0.0406
Guatteria dumetorum 896 0.004301 -5.4490 -0.0234
Guazuma ulmifolia 64 0.000307 -8.0880 -0.0025
Guettarda foliacea 268 0.001286 -6.6559 -0.0086
Gustavia superba 734 0.003523 -5.6484 -0.0199
Hamelia axillaris 98 0.000470 -7.6620 -0.0036
Hampea appendiculata 140 0.000672 -7.3053 -0.0049
Hasseltia floribunda 484 0.002323 -6.0648 -0.0141
Heisteria acuminata 100 0.000480 -7.6418 -0.0037
Heisteria concinna 927 0.004449 -5.4150 -0.0241
Herrania purpurea 521 0.002501 -5.9912 -0.0150
Hieronyma alchorneoides 85 0.000408 -7.8043 -0.0032
Hirtella americana 25 0.000120 -9.0281 -0.0011
Hirtella triandra 4,566 0.021916 -3.8205 -0.0837
Hura crepitans 103 0.000494 -7.6122 -0.0038
Hybanthus prunifolius 29,846 0.143256 -1.9431 -0.2784
Inga acuminata 424 0.002035 -6.1972 -0.0126
Inga cocleensis 48 0.000230 -8.3757 -0.0019
Inga goldmanii 313 0.001502 -6.5007 -0.0098
Inga laurina 60 0.000288 -8.1526 -0.0023
Inga marginata 400 0.001920 -6.2555 -0.0120
Inga mucuna 2 0.000010 -11.5538 -0.0001
Inga nobilis 615 0.002952 -5.8253 -0.0172
Inga oerstediana 2 0.000010 -11.5538 -0.0001
Inga pezizifera 126 0.000605 -7.4106 -0.0045
Inga punctata 32 0.000154 -8.7812 -0.0013
Inga ruiziana 8 0.000038 -10.1675 -0.0004
Inga sapindoides 205 0.000984 -6.9239 -0.0068
Inga spectabilis 21 0.000101 -9.2024 -0.0009
Inga thibaudiana 178 0.000854 -7.0651 -0.0060
Inga umbellifera 797 0.003825 -5.5661 -0.0213
Jacaranda copaia 280 0.001344 -6.6121 -0.0089
Lacistema aggregatum 1,276 0.006125 -5.0954 -0.0312
Lacmellea panamensis 100 0.000480 -7.6418 -0.0037
Laetia procera 26 0.000125 -8.9888 -0.0011

38
APPENDIX A (continued)
Species Number pi ln(pi) ln(pi)*pi
Laetia thamnia 410 0.001968 -6.2308 -0.0123
Lafoensia punicifolia 5 0.000024 -10.6375 -0.0003
Licania hypoleuca 127 0.000610 -7.4027 -0.0045
Licania platypus 266 0.001277 -6.6634 -0.0085
Lindackeria laurina 59 0.000283 -8.1694 -0.0023
Lonchocarpus heptaphyllus 659 0.003163 -5.7562 -0.0182
Lozania pittieri 1 0.000005 -12.2469 -0.0001
Luehea seemannii 190 0.000912 -6.9999 -0.0064
Maclura tinctoria 1 0.000005 -12.2469 -0.0001
Macrocnemum roseum 94 0.000451 -7.7036 -0.0035
Malpighia romeroana 38 0.000182 -8.6093 -0.0016
Maquira guianensis 1,396 0.006701 -5.0056 -0.0335
Margaritaria nobilis 2 0.000010 -11.5538 -0.0001
Marila laxiflora 23 0.000110 -9.1114 -0.0010
Maytenus schippii 77 0.000370 -7.9031 -0.0029
Miconia affinis 389 0.001867 -6.2834 -0.0117
Miconia argentea 518 0.002486 -5.9970 -0.0149
Miconia elata 12 0.000058 -9.7620 -0.0006
Miconia hondurensis 58 0.000278 -8.1865 -0.0023
Miconia impetiolaris 14 0.000067 -9.6079 -0.0006
Miconia nervosa 262 0.001258 -6.6786 -0.0084
Mosannona garwoodii 472 0.002266 -6.0900 -0.0138
Mouriri myrtilloides 6,540 0.031391 -3.4612 -0.1087
Myrcia gatunensis 46 0.000221 -8.4183 -0.0019
Myrospermum frutescens 9 0.000043 -10.0497 -0.0004
Nectandra 'fuzzy' 2 0.000010 -11.5538 -0.0001
Nectandra cissiflora 179 0.000859 -7.0595 -0.0061
Nectandra lineata 112 0.000538 -7.5284 -0.0040
Nectandra purpurea 70 0.000336 -7.9984 -0.0027
Neea amplifolia 69 0.000331 -8.0128 -0.0027
Ochroma pyramidale 10 0.000048 -9.9443 -0.0005
Ocotea cernua 237 0.001138 -6.7789 -0.0077
Ocotea oblonga 162 0.000778 -7.1593 -0.0056
Ocotea puberula 131 0.000629 -7.3717 -0.0046
Ocotea whitei 374 0.001795 -6.3227 -0.0114
Oenocarpus mapora 1,787 0.008577 -4.7586 -0.0408
Ormosia amazonica 1 0.000005 -12.2469 -0.0001
Ormosia coccinea 105 0.000504 -7.5930 -0.0038
Ormosia macrocalyx 111 0.000533 -7.5374 -0.0040
Ouratea lucens 1,227 0.005889 -5.1346 -0.0302
Pachira quinata 1 0.000005 -12.2469 -0.0001
Pachira sessilis 15 0.000072 -9.5389 -0.0007
Palicourea guianensis 851 0.004085 -5.5005 -0.0225
Pentagonia macrophylla 300 0.001440 -6.5431 -0.0094
Perebea xanthochyma 233 0.001118 -6.7959 -0.0076
Picramnia latifolia 1,059 0.005083 -5.2819 -0.0268
Piper aequale 27 0.000130 -8.9511 -0.0012
Piper arboreum 19 0.000091 -9.3025 -0.0008

39
APPENDIX A (continued)
Species Number pi ln(pi) ln(pi)*pi
Piper colonense 16 0.000077 -9.4743 -0.0007
Piper cordulatum 50 0.000240 -8.3349 -0.0020
Piper perlasense 17 0.000082 -9.4137 -0.0008
Piper reticulatum 131 0.000629 -7.3717 -0.0046
Piper schiedeanum 5 0.000024 -10.6375 -0.0003
Platymiscium pinnatum 146 0.000701 -7.2633 -0.0051
Platypodium elegans 122 0.000586 -7.4429 -0.0044
Posoqueria latifolia 71 0.000341 -7.9843 -0.0027
Poulsenia armata 1,162 0.005577 -5.1890 -0.0289
Pourouma bicolor 104 0.000499 -7.6025 -0.0038
Pouteria fossicola 3 0.000014 -11.1483 -0.0002
Pouteria reticulata 1,204 0.005779 -5.1535 -0.0298
Pouteria stipitata 63 0.000302 -8.1038 -0.0025
Prioria copaifera 1,348 0.006470 -5.0406 -0.0326
Protium confusum 9 0.000043 -10.0497 -0.0004
Protium costaricense 698 0.003350 -5.6987 -0.0191
Protium panamense 2,853 0.013694 -4.2908 -0.0588
Protium tenuifolium 2,829 0.013579 -4.2993 -0.0584
Pseudobombax septenatum 35 0.000168 -8.6916 -0.0015
Psidium friedrichsthalianum 60 0.000288 -8.1526 -0.0023
Psychotria acuminata 8 0.000038 -10.1675 -0.0004
Psychotria chagrensis 13 0.000062 -9.6820 -0.0006
Psychotria deflexa 13 0.000062 -9.6820 -0.0006
Psychotria graciliflora 53 0.000254 -8.2766 -0.0021
Psychotria grandis 38 0.000182 -8.6093 -0.0016
Psychotria horizontalis 3,119 0.014971 -4.2017 -0.0629
Psychotria limonensis 65 0.000312 -8.0725 -0.0025
Psychotria marginata 581 0.002789 -5.8822 -0.0164
Psychotria pittieri 5 0.000024 -10.6375 -0.0003
Pterocarpus belizensis 2 0.000010 -11.5538 -0.0001
Pterocarpus rohrii 1,380 0.006624 -5.0171 -0.0332
Quararibea asterolepis 2,137 0.010257 -4.5798 -0.0470
Quassia amara 119 0.000571 -7.4678 -0.0043
Randia armata 958 0.004598 -5.3821 -0.0247
Rinorea sylvatica 2,277 0.010929 -4.5163 -0.0494
Rosenbergiodendron
formosum 3 0.000014 -11.1483 -0.0002
Sapium 'broadleaf' 3 0.000014 -11.1483 -0.0002
Sapium glandulosum 52 0.000250 -8.2957 -0.0021
Schizolobium parahyba 23 0.000110 -9.1114 -0.0010
Senna dariensis 135 0.000648 -7.3417 -0.0048
Simarouba amara 1,477 0.007089 -4.9492 -0.0351
Siparuna guianensis 27 0.000130 -8.9511 -0.0012
Siparuna pauciflora 367 0.001762 -6.3416 -0.0112
Sloanea terniflora 461 0.002213 -6.1135 -0.0135
Socratea exorrhiza 540 0.002592 -5.9554 -0.0154
Solanum hayesii 69 0.000331 -8.0128 -0.0027
Solanum steyermarkii 4 0.000019 -10.8606 -0.0002

40
APPENDIX A (continued)
Species Number pi ln(pi) ln(pi)*pi
Sorocea affinis 2,539 0.012187 -4.4074 -0.0537
Spachea membranacea 13 0.000062 -9.6820 -0.0006
Spondias mombin 98 0.000470 -7.6620 -0.0036
Spondias radlkoferi 265 0.001272 -6.6672 -0.0085
Sterculia apetala 52 0.000250 -8.2957 -0.0021
Stylogyne turbacensis 691 0.003317 -5.7088 -0.0189
Swartzia simplex 2,784 0.013363 -4.3153 -0.0577
Swartzia simplex 2,926 0.014044 -4.2655 -0.0599
Symphonia globulifera 152 0.000730 -7.2231 -0.0053
Tabebuia guayacan 71 0.000341 -7.9843 -0.0027
Tabebuia rosea 230 0.001104 -6.8089 -0.0075
Tabernaemontana arborea 1,593 0.007646 -4.8736 -0.0373
Tachigali versicolor 2,234 0.010723 -4.5354 -0.0486
Talisia nervosa 722 0.003465 -5.6649 -0.0196
Talisia princeps 664 0.003187 -5.7486 -0.0183
Terminalia amazonia 47 0.000226 -8.3968 -0.0019
Terminalia oblonga 83 0.000398 -7.8281 -0.0031
Tetragastris panamensis 4,493 0.021566 -3.8367 -0.0827
Tetrathylacium johansenii 6 0.000029 -10.4552 -0.0003
Theobroma cacao 18 0.000086 -9.3566 -0.0008
Thevetia ahouai 91 0.000437 -7.7361 -0.0034
Tocoyena pittieri 7 0.000034 -10.3010 -0.0003
Trattinnickia aspera 66 0.000317 -8.0573 -0.0026
Trema micrantha 43 0.000206 -8.4857 -0.0018
Trichanthera gigantea 5 0.000024 -10.6375 -0.0003
Trichilia pallida 478 0.002294 -6.0773 -0.0139
Trichilia tuberculata 11,344 0.054449 -2.9105 -0.1585
Trichospermum galeottii 1 0.000005 -12.2469 -0.0001
Triplaris cumingiana 242 0.001162 -6.7580 -0.0078
Trophis caucana 149 0.000715 -7.2430 -0.0052
Trophis racemosa 253 0.001214 -6.7135 -0.0082
Turpinia occidentalis 72 0.000346 -7.9703 -0.0028
Unonopsis pittieri 621 0.002981 -5.8156 -0.0173
Urera baccifera 13 0.000062 -9.6820 -0.0006
Virola multiflora 44 0.000211 -8.4627 -0.0018
Virola sebifera 1,394 0.006691 -5.0070 -0.0335
Virola surinamensis 183 0.000878 -7.0374 -0.0062
Vismia baccifera 41 0.000197 -8.5334 -0.0017
Vismia billbergiana 4 0.000019 -10.8606 -0.0002
Vochysia ferruginea 27 0.000130 -8.9511 -0.0012
Xylopia macrantha 1,414 0.006787 -4.9928 -0.0339
Xylosma oligandra 67 0.000322 -8.0422 -0.0026
Zanthoxylum acuminatum 93 0.000446 -7.7143 -0.0034
Zanthoxylum ekmanii 194 0.000931 -6.9791 -0.0065
Zanthoxylum panamense 178 0.000854 -7.0651 -0.0060
Zanthoxylum setulosum 1 0.000005 -12.2469 -0.0001
Zuelania guidonia 34 0.000163 -8.7206 -0.0014
TOTAL= 208341 H'= 3.9553

41
APPENDIX B: Animal Species present in Yosemite National Park
B.1 BIRDS
Bird Elevation Diet
Sooty Grouse (Dendragapus fuliginosus) 4,000-8,000 needles of conifers, berries, insects, flowers
Sharp-shinned hawk (Accipiter striatus) 2,000-9,000 mostly small birds, small mammals, frogs, lizards
Cooper's Hawk (Accipiter cooperii) 2,000-9,000 mostly birds, small mammals, reptiles
Northern Goshawk (Accipiter gentilis) 4,000-10,000 small and medium sized birds and mammals
Band-tailed pigeon (Patagioenas fasciata) 2,000-7,000 nuts and berries, pine seeds, acorns
Flammulated Owl (Otus flammeolus) 4,000-6,000 moths, beetles, spiders, grasshoppers, crickets,
Great Horned Owl (Bubo virginianus) 2,000-9,000 mice, squirrels, hare, crayfish, amphibians, reptiles
Northern Pygmy-Owl (Glaucidium gnoma) 2,000-6,000 rodents
Spotted Owl (Strix occidentalis) 2,000-7,000 mice, rats, occasionally small birds
Great Gray Owl (Strix nebulosa) 4,000-8,000 mice, rats, shrews, moles, rabbits, small birds
Northern Saw-whet Owl (Aegolius acadicus) 2,000-6,000 insects, rarely on mice
Vaux's Swift (Chaetura vauxi) 2,000-7,000 insects
Calliope Hummingbird (Stellula calliope) 4,000-7,000 nectar, insects, small spiders
Lewis's Woodpecker (Melanerpes lewis) 2,000-10,000 insects, fruits and berries, acorns and nuts
Acorn Woodpecker (Melanerpes formicivorus) 2,000-5,000 acorns, (pine) seeds, berries, fruits, sap, nectar
Williamson's Sapsucker (Sphyrapicus thyroideus) 6,000-9,000 Insects, sap, fruits and berries
Red-naped Sapsucker (Sphyrapicus nuchalis) 2,000-7,000 arthropods, tree sap (conifer),
Red-breasted Sapsucker (Sphyrapicus ruber) 2,000-8,000 arthropods, tree sap, nuts and fruits
Hairy Woodpecker (Picoides villosus) 2,000-10,000 insects arthropods, fruit and seed of conifer species
White-headed Woodpecker (Picoides albolarvatus) 4,000-7,000 insects and larvae, pine seeds, pine sap
Northern Flicker (Colaptes auratus) 2,000-10,000 ant and other insects, fruits and berries
Pileated Woodpecker (Dryocopus pileatus) 4,000-7,000 mainly ants, fruits: berries and nuts
Olive-sided Flycatcher (Contopus cooperi) 4,000-9,000 flying insects
Western Wood-Pewee (Contopus sordidulus) 2,000-9,000 flying insects
Hammond's Flycatcher (Empidonax hammondii) 4,000-8,000 beetles, moths, flies, bees and wasps
Dusky Flycatcher (Empidonax oberholseri) 4,000-10,000 moths and other flying insects
Cassin's Vireo (Vireo cassinii) 2,000-6,000 ants, stone flies, dragonflies
Warbling Vireo (Vireo gilvus) 2,000-9,000 insects
Stellar's Jay (Cyanocitta stelleri) 2,000-9,000 acorns, pine seeds, fruit, insects, snakes
Pinyon Jay (Gymnorhinus cyanocephalus) 3,000-9,000 seeds, insects, fruits , berries
Clark's Nutcracker (Nucifraga columbiana) 6,000-12,000 Insects, fallen nuts, seeds of pines
Common Raven (Corvus corax) 2,000-10,000 mammal scavenger, insects, berries
42
Mountain Chickadee (Poecile gambeli) 2,000-10,000 scratch feed, sunflower seeds
Chestnut-backed Chickadee (Poecile rufescens) 2,000-5,000 insects, spiders, conifer seeds
Red-breasted Nuthatch (Sitta canadensis) 2,000-8,000 seeds of conifers, insects
White-breasted Nuthatch (Sitta carolinensis) 2,000-10,000 fruit and seed of pines, sunflowers sees, insects
Pygmy Nuthatch (Sitta pygmaea) 2,000-7,000 pine seeds, insects
Brown Creeper (Certhia americana) 4,000-10,000 insects, nuts and seeds
Winter Wren (Troglodytes hiemalis) 2,000-6,000 insects, berries of red cedar
Golden-crowned Kinglet (Regulus satrapa) 4,000-8,000 insects and tree sap
Western Bluebird (Sialia mexicana) 2,000-10,000 insects and berries
Townsend's Solitaire (Myadestes townsendi) 5,000-10,000 insects, spiders, earthworms, berries, pine seeds
Hermit Thrush (Catharus guttatus) 2,000-10,000 nsects, berries in the fall and winter
American Robin (Turdus migratorius) 2,000-10,000 insects, earthworms, fruit, berries
Cedar Waxwing (Bombycilla cedrorum) 2,000-9,000 fruit, maple sap, insects
Orange-crowned Warbler (Vermivora celata) 2,000-10,000 insects
Nashville Warbler (Vermivora ruficapilla) 3,000-8,000 insects
Yellow-rumped Warbler (Dendroica coronata) 2,000-10,000 insects
Black-throated Gray Warber (Dendroica nigrescens) 2,000-7,000 insects
Townsend's Warbler (Dendroica townsendi) 2,000-10,000 insects, spiders
Hermit Warbler (Dendroica occidentalis) 4,000-7,000 insects, spiders
Western Tanager (Piranga ludoviciana) 2,000-8,000 insects, elderberries cherries
Chipping Sparrow (Spizella passerina) 2,000-10,000 seeds of grasses, forbs, shrubs; insects
Dark-eyed Junco (Junco hyemalis) 2,000-10,000 insects, seeds (not coniferous), berries
Black-headed Grosbeak (Pheucticus melanocephalus) 2,000-6,000 seeds of conifers, berries, insects
Brewer's Blackbird (Euphagus cyanocephalus) 2,000-10,000 spiders, grass and forb seeds, berries
Brown-headed Cowbird (Molothrus ater) 2,000-10,000 spiders, grass and forb seeds, berries
Purple Finch (Carpodacus purpureus) 2,000-6,000 seeds of deciduous trees, berries, insects
Cassin's Finch (Carpodacus cassinii) 4,000-11,000 seeds and buds of conifers, insects, berries
Red Crossbill (Loxia curvirostra ) 4,000-11,000 seeds of conifers, insects
Evening Grosbeak (Coccothraustes vespertinus) 2,000-9,000 Insects, buds and seeds of maples and conifers
Sources: 1) del Hoyo J, Elliott A, Sargatal J. 1994. Handbook of the Birds of the World 2: 401-402. Lynx Edicions, Barcelona.
2) Terres J. 1980. The Audubon Society Encyclopedia of North American Birds. Alfred A. Knopf, Inc., New York
3) Yosemite Bird Checklist. 2009. National Park Service, U.S. Department of the Interior.

43
APPENDIX B (continued)
B.2 RODENTS
Species Diet Elevation
Chaetodipus californicus granivore 193-1714
Microtus longicaudus herbivore 1237-3287
Microtus montanus herbivore 1217-3155
Neotoma macrotis herbivore 183-1713
Peromyscus boylii granivore 61-2469
Peromyscus maniculatus omnivore 57-3287
Peromyscus truei omnivore 651-1809
Sorex monitcolus insectavore 1209-3287
Sorex trowbridgii insectivore 1160-2286
Spermophilus beecheyi omnivore 61-2484
Spermophilus lateralis omnivore 1890-3200
Tamias quadrimaculatus granivore 1494-2260
Tamias speciosus granivore 1896-3220
Tamiasciurus douglasi granivore 1229-3185
Thomomys moticola herbivore 1905-3155
Zapus princeps omnivore 1450-3185
Glaucomys sabrinus omnivore 1300-1900
Sciurus grisceus granivore 80-2500
Tamias amoenus granivore 975-2900
Tamias minimus omnivore 1700-2000
Tamias merriami omnivore below 2700
Source: 1) Moritz C, Patton J, Conroy C, Parra J, White G, Beissinger S. 2008. Impact of a century of climate change on small-
mammal communities in Yosemite National Park, USA. Science 322(261).
2) Roberts S. 2011. Wildlife Ecologist. U.S. Geological Survey. Western Ecological Research Center. Yosemite Field Station.

44
APPENDIX B (continued)
B.3 OTHER MAMMALS
Species
American Badger (Taxidea taxus)
Western white-tailed hare (Lepus townsendii)
Sierra Nevada snowshoe hare (Lepus americanus tahoensis)
Little brown myotis (Myotis lucifugus)
Yuma myotis (Myotis yumanensis)
Long-eared myotis (Myotis evotis)
Finged myotis (Myotis thysanodes)
Long-legged myotis (Myotis volans)
California myotis (Myotis californicus)
Small-footed myotis (Myotis ciliolabrum)
Silver-haired bat (Lasionycteris noctivagans)
Western pipistrelle (Parastrellus hesperus)
Big brown bat (Eptesicus fuscus)
Western red bat (Lasiurs blossevillii)
Hoary bat (Lasiurus cinereus)
Spotted bat (Euderma maculatum)
Townsend's big-eared bat (Corynorhinus townsendii)
Pallis bat (Antrozous palidus)
Mexican free-tailed bat (Tadarida brasiliensis)
Western mastiff bat (Eumops perotis)
Ermine (Mustela ermenea)
Pacific Fisher (Martes americana)
River otter (Lutra canadensis)
Spotted skunk (Spilogale putorius)
Striped skunk (Mephitis mephitis)
California wolverine (Gulo gulo)
Coyote (Canis latrans)
Grey fox (Urocyon cinereogrgenteus)
Sierra Nevada red fox (Vulpes vulpes necator)
Black bear (Ursus americanus)
Raccoon (Procyon lotor)
Source: Roberts S. 2011. Wildlife Ecologist. U.S. Geological Survey. Western Ecological Research Center. Yosemite Field Station.

45