Embed Size (px)
Citation preview
SPAWNING TIMING AND FRY EMERGENCE STUDY HANCOCK AND CALLIGAN CREEKS
(FERC NUMBERS 9025 AND 8864)
HYDRO WEST GROUP November, 1991
CASCADES ENVIRONMENTAL SERVICES, INC.

o
TABLE OF CONTENTS
r
Page # I. Introduction . . . . . . . . . . . . . . . . . . . . . . . . . . . . . . . . . . . . . . . . . . . . . . . . . .. 1
II. Methods. . . . . . . . . . . . . . . . . . . . . . . . . . . . . . . . . . . . . . . . . . . . . . . . . . . . . 3
III. Results & Discussion ............................. . . . . . . . . . . . . . . . 5
A Hancock Creek ........................................... 5 1. Water Temperature .......................... ' ......... 5 2. Fry Emergence & Growth . . . . . . . . . . . . . . . . . . . . . . . . . . . . . . 5 3. Spawning Timing of Rainbow Trout in Hancock Creek ......... 5 4. Recommendations. . . . . . . . . . . . . . . . . . . . . . . . . . . . . . . . . .. 30
B. Calligan Creek .......................................... 30 1. Water Temperature. . . . . . . . . . . . . . . . . . . . . . . . . . . . . . . . .. 31 2. Fry Emergence & Growth ............................. 31 3. Spawning Timing of Rainbow Trout in Calligan Creek ........ 65 4. Recommendations . . . . . . . . . . . . . . . . . . . . . . . . ... . . . . . . . .. 71
IV. Agreements ......................... 0 • • • • • • • • • • • • • • • • • • • • • • • •• 72
Literature Cited
- i -
USTOF TABLES
Table # Description Page #
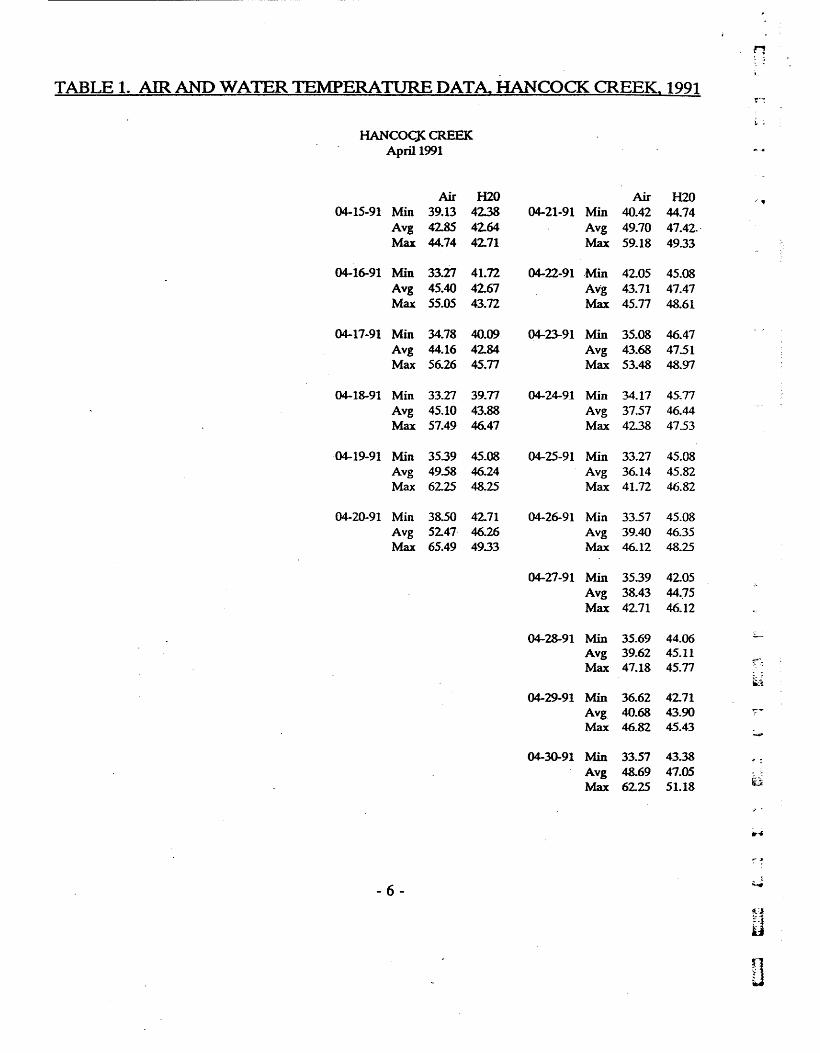
1 Air and Water Temperature Data, Hancock Creek, 1991 . . . . . . . ... . . . . •. 6-12 2 Snorkeling and Electroshocking Observations, Hancock Creek, 1991 ..... 19-22 3 Daily Temperature Units for Hancock Creek
4
5 6 7 8 9
10
11
at Lake and IFIM Site, 1991 ................................. 25-28 Spawning and Emergence Timing of Rainbow Trout
in Hancock Creek, 1991. 1/ . . . . . . . . . . . . . . . . . . . . . . . . . . . . . . . . . . . .. 29 Mean IS-day water temperatures, Hancock Creek . . . . . . . . . . . . . . . . . . . .. 30 Air and Water Temperature Data, Upper Calligan Creek, 1991 . . . . . . . . . 32-38 Air and Water Temperature Data, Lower Calligan Creek, 1991 .......... 39-45 Snorkeling and Electroshocking Observations, Calligan Creek, 1991 ...... 53-58 Daily Temperature Units for Calligan Creek at IFIM Site, 1991 ..... ~ .'. 66-69 . Spawning and Emergence Timing of Trout Observed
in Calligan Creek, 1991 ....................................... 70 Mean 15-day Water Temperatures at IFIM Site, Calligan Creek .......... 71
- 11 -
~ -.
LJ .
UST OF FIGURES
Figure # Description Page #
la Hancock Creek Mean Water Temperature, April - May, 1991 ............. . 13 Ib Hancock Creek Mean Water Temperature, June - July, 1991 ............. . 15 Ic Hancock Creek Mean Water Temperature, August - October, 1991 ........ . 17 --
2 Hancock Creek Electroshocking Data, Cumulative Size Groupings-Rainbow Trout ................... . . . . . . . . . . . . . . . . . . . . 23
3a Calligan Creek Mean Water Temperature, IFIM Site, April - May, 1991 ..... . 47 3b Calligan Creek Mean Water Temperature, IFIM Site, June - July, 1991 ..... . 49 3c Calligan Creek Mean Water Temperature, IFIM Site, August - October, 1991 .. 51 4 Calligan Creek Electroshocking Data, Cumulative Size
Groupings-Rainbow Trout ...................................... . 59-
5 Calligan Creek Electroshocking Data, Cumulative Size Groupings-Cutthroat Trout ..................................... . 61
6 Calligan Creek Electroshocking Data, Cumulative Size Groupings-All Trout .......................................... . 63
- 111 -
I. INTRODUCI10N
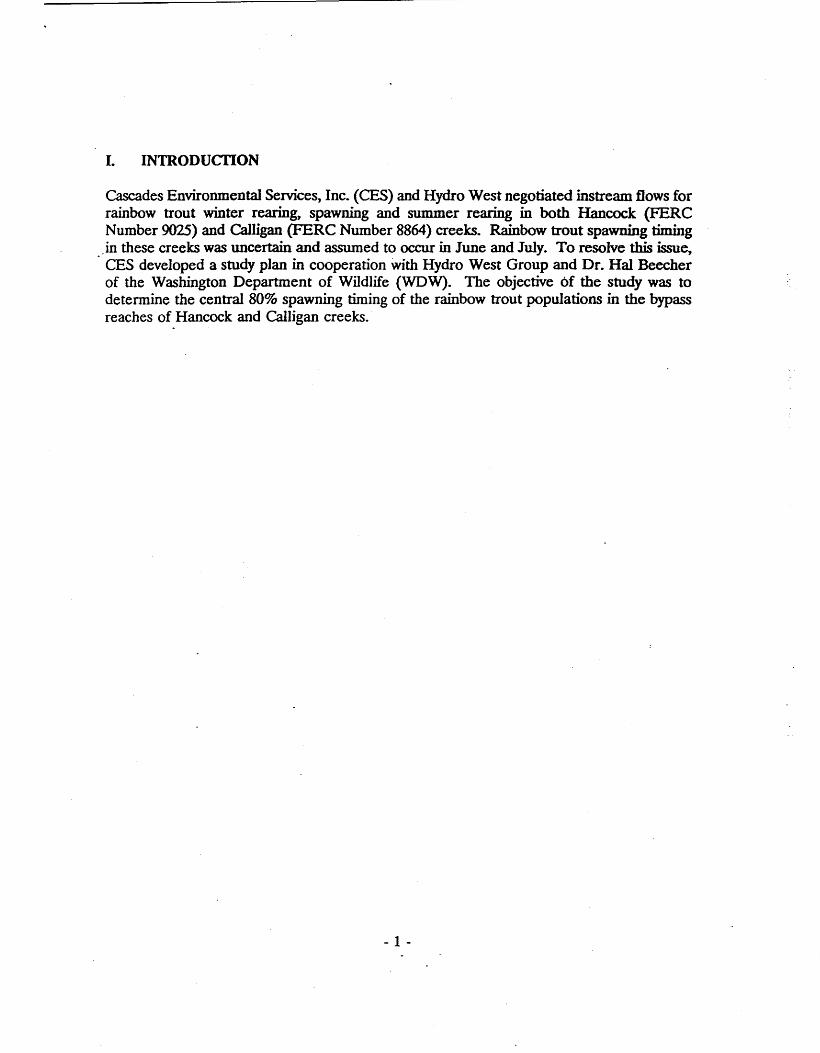
Cascades Environmental Services, Inc. (CES) and Hydro West negotiated instream flows for rainbow trout winter rearing, spawning and summer rearing in both Hancock (FERC Number 9(25) and Calligan (PERC Number 8864) creeks. Rainbow trout spawning timing
.in these creeks was uncertain and assumed to occur in June and July. To resolve this issue, CES developed a study plan in cooperation with Hydro West Group and Dr. Hal Beecher of the Washington Department of Wildlife (WDW). The objective of the study was to detennine the central 80% spawning timing of the rainbow trout populations in the bypass reaches of Hancock and Calligan creeks.
- 1 -
A
I
n : . . ~
II. METHODS
CES used two different techniques to determine spawning timing in the study reaches. The most common methodology for calculating the incubation and emergence period of eggs and fry uses temperature units. One Daily Temperature Unit (DTU) equals 1°F above freezing (32°F) for a 24-hour period. For example, if the water temperature for the first day of incubation is 56~, it would contnbute 24 DTU. Temperature units required for a given species of fish are not fixed. They will vary with different water temperatures and are affected by fluctuations in temperature (piper et al. 1982).
Another commonly used indicator of the onset of trout spawning and summer rearing activity in the Cascade Mountains is· the increase in stream temperatures to above 8°C, or 46.4°F (Campbell and Neuner 1985a). Conversely, winter behavior and changes in depth and velocity preferences typically begin when stream temp'eratures drop below this threshold (Campbell and Neuner 1985b).
CES inst~lled thermographs to record air and water temperatures in April at three different locations: 1) downstream of the outlet to Hancock Lake on Hancock Creek; 2) downstream of the outlet to Calligan Lake on Calligan Creek; and 3) at the IFIM site on Calligan Creek. Data Loggers recorded mean air and water temperatures every two hours. We downloaded the data from the sites every 6 - 8 weeks.
We surveyed Calligan and Hancock creeks once per week from June through September, with a final survey in October. CES snorkeled the streams to observe fish and note the onset of fry emergence. After we documented fry emergence, we electroshocked index areas in both streams to. sample fry populations, noting length and species when possible. We developed cumulative fry emergent timing curves for each stream. CES determined the central 80% of the emergence timing curve, per agreement of the parties, and we backcalculated rainbow trout spawning ~mlng using fry emergence data and temperature information gathered from the Data-pods.
- 3 -
r

m. RESULTS AND DISCUSSION
A Hancock Creek
1. Water Temperature.
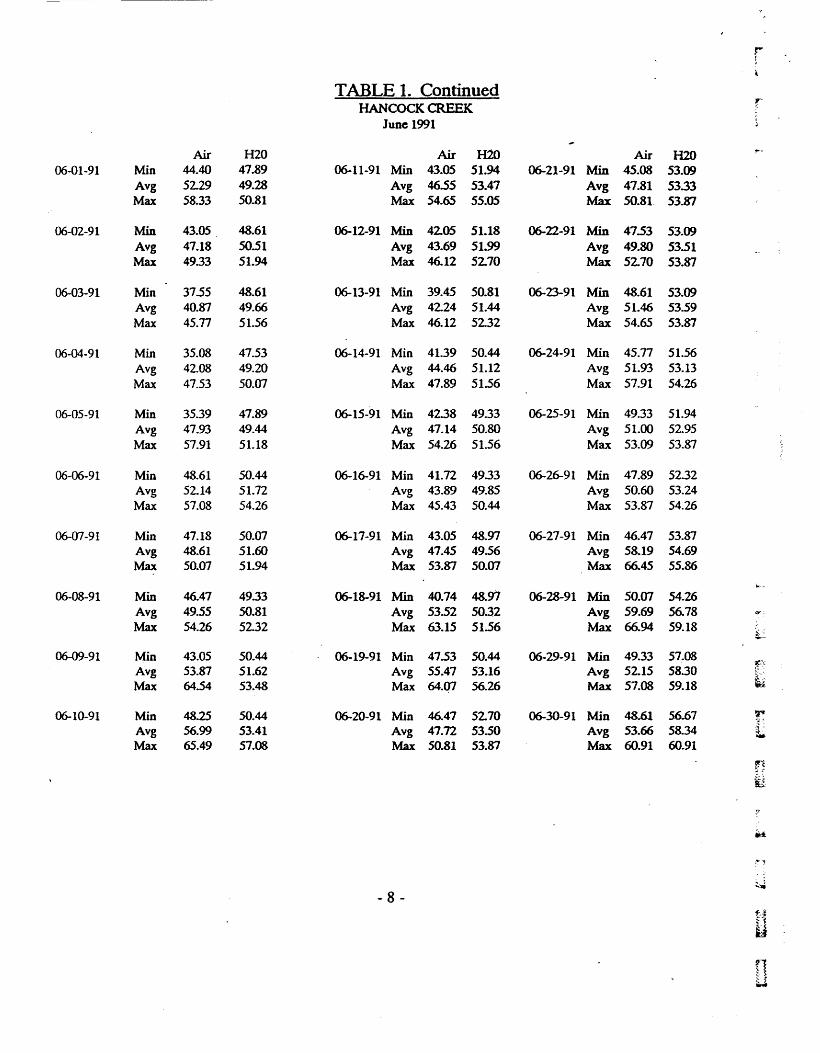
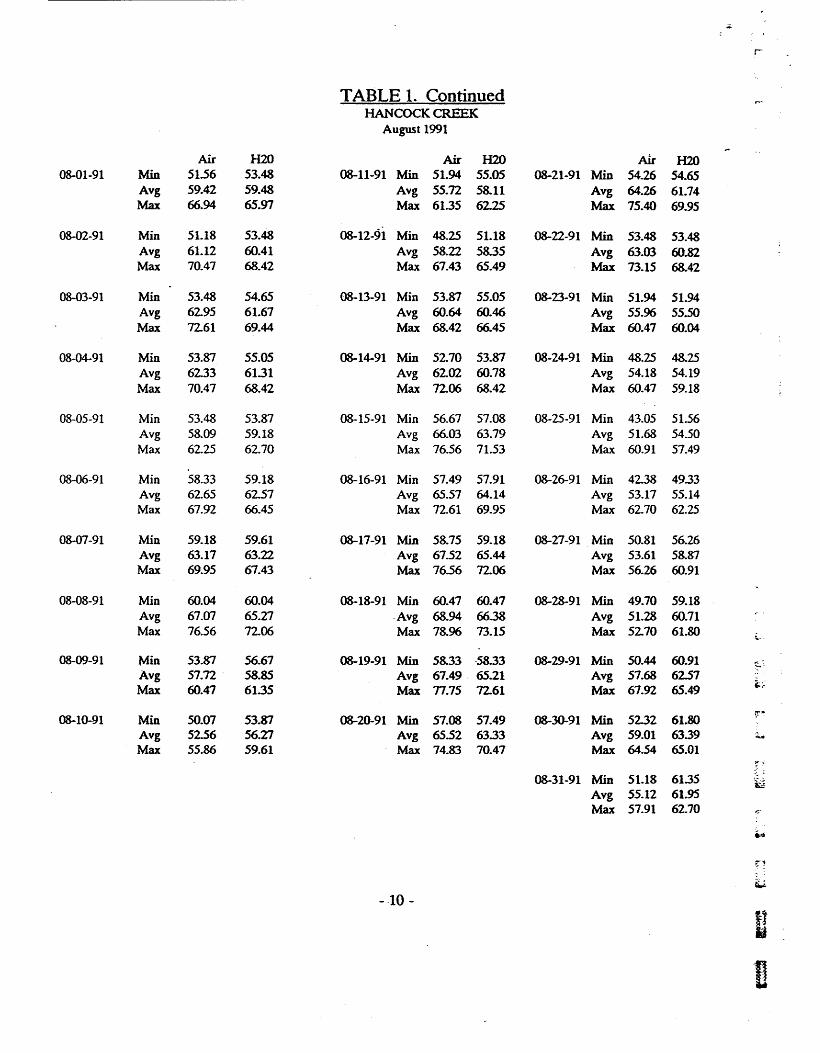
Table 1 descnbes minimum, mean and maximum air and water temperatures at the gaging site below Hancock Lake. Water temperatures at the gaging station varied from a 2-hour mean low of 39.'?F on April 18 to a 2-hour mean high of 7430f" on July 23. Mean water temperature of the period of record was 55.2~.
The gaging station on Hancock Creek is located in a broad, flat, slow-moving section of stream below the lake outlet which receives a great deal of solar radiation. The remainder of the stream, however, travels through much narrower, steeper, and confined channels that are often shaded. From April through mid-June, temperatures at the IFIM site, index areas and gage station were fairly equivalent (Figure 1a). By June 23, however, temperatures in the bypass reach began to deviate from temperatures recorded at the gage station by as much as 12°F (Figures Ib-c). When discrepancies existed, CES used temperatures recorded in the bypass reach for the study calculations.
2. Fry Emergence and Growth
CES started snorkeling Hancock Creek on June 1. We observed several pairs of rainbow trout, but could find no evidence of newly-rlug redds. When we first observed fry near the outlet to the lake and the bypass reach on June 22, CES began electroshocking the stream to collect fry abundance and length data.
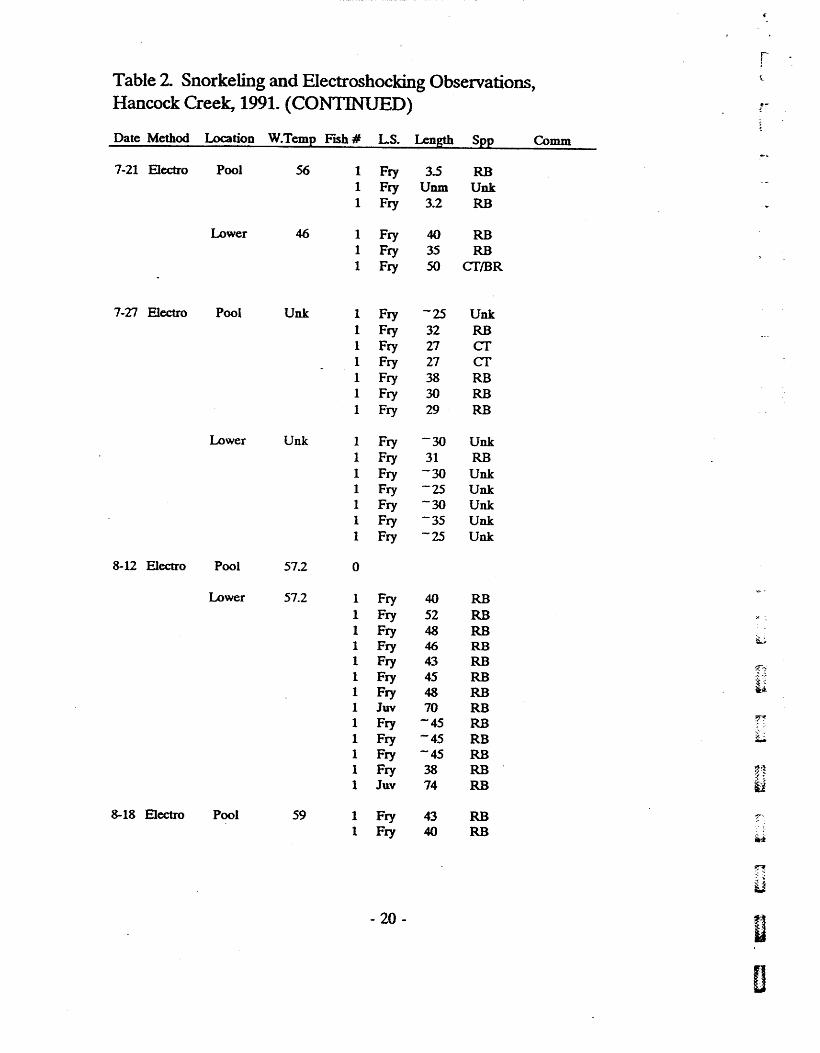
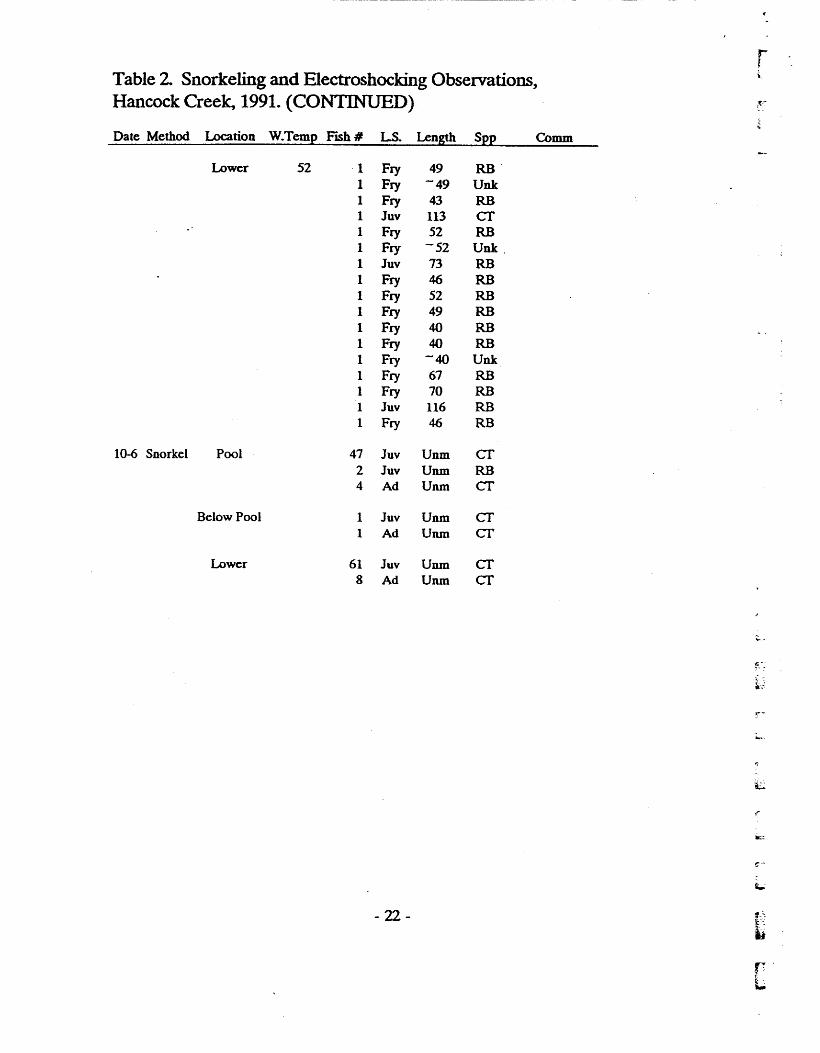
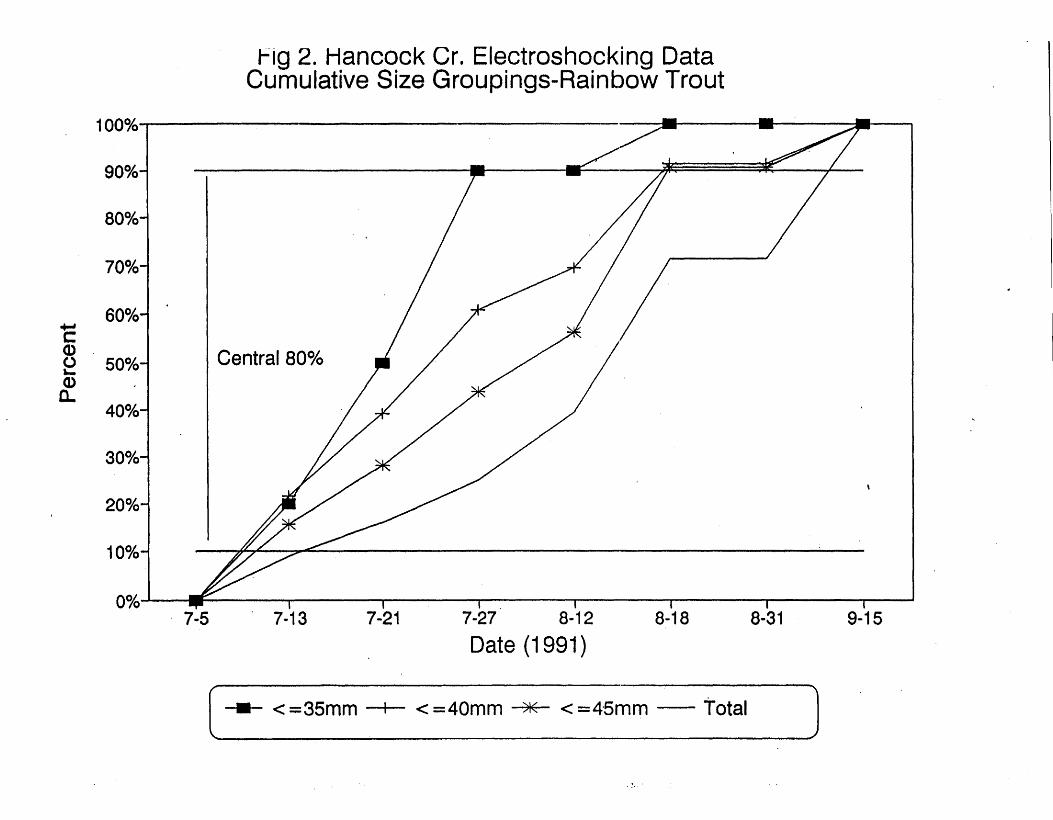
Table 2 summarizes trout fry observations in Hancock C-!"eek. We conducted a length frequency analysis and Figure 2 depicts cumulative emergence timing of rainbow trout in Hancock Creek by size classes (35mm, 40mm and 45mm). We used the central 80% of the run timing curveS, discarding the "tails." Using this methodology, CES determined the central 80% emergence timing of rainbow trout fly « = 35mm) spanned the period July 13 - 27.
3. Spawning Timing of Rainbow Trout in Hancock Creek.
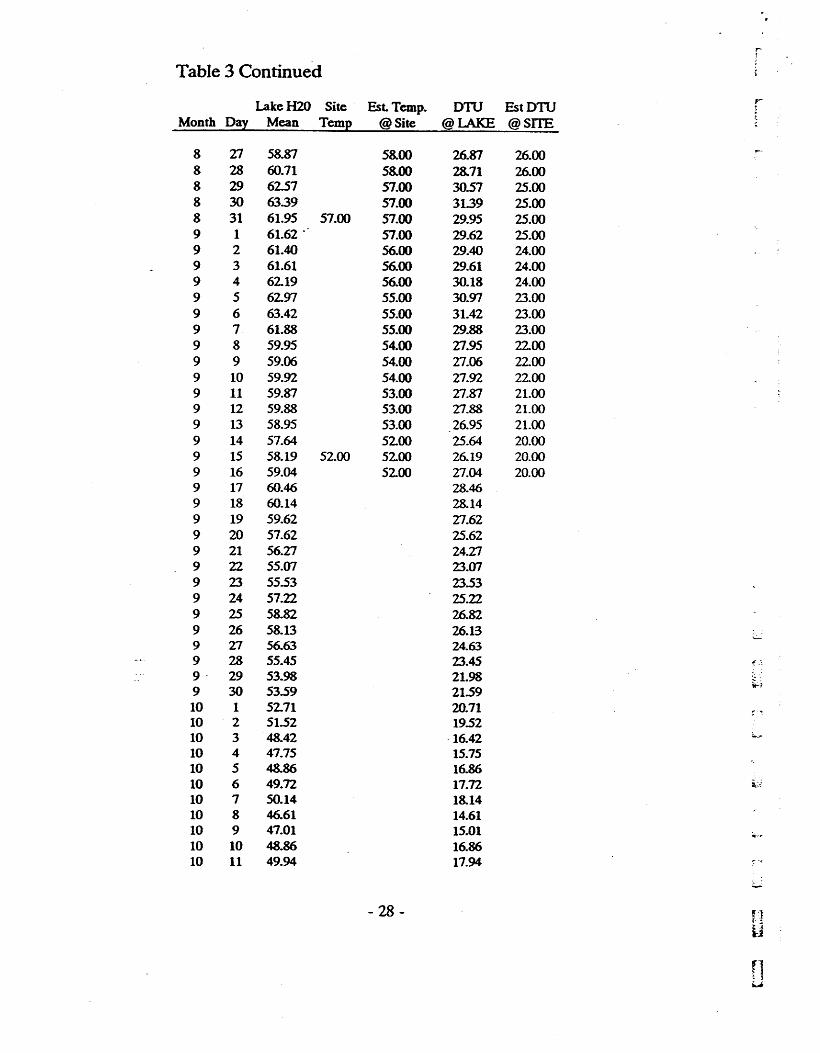
Table 3 presents Daily Temperature Units (DTU) at the Hancock Creek gaging station and the bypass reach. In Hancock Creek, where mean water temperatures remain between 500F and 600F during the spawning and incubation period, approximat~ly 765 DTU are required for emergence of rainbow trout fry (Leitritz and Lewis 1976).
Table 4 shows spawning and fry emergence timing of rainbow trout in. the Hancock Creek bypass reach. By using the central 80% fly emergence curve and back-
-5-
/"
.- .. . ,
-6-
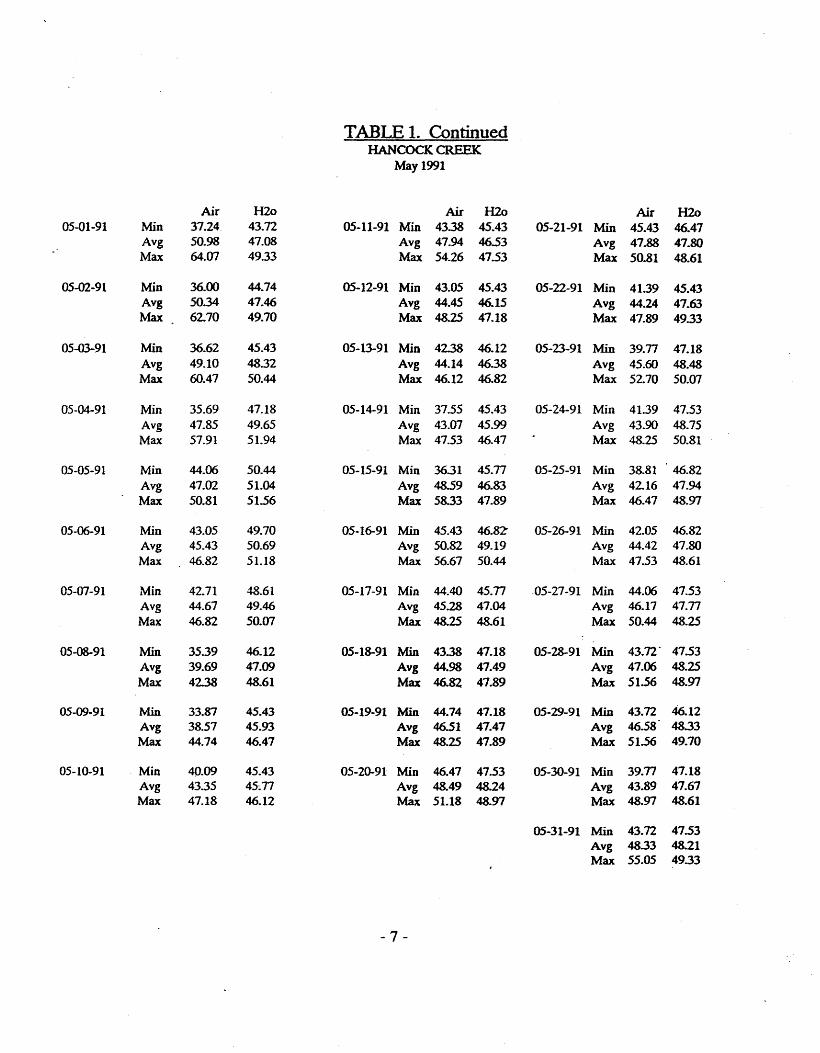
TABLE 1. Continued HANCOCK CREEK
May 1991
Air H2o Air H2o Air H2o 05-01-91 Min 37.24 43.72 05-11-91 Min 4338 45.43 05-21-91 Min 45.43 46.47
Avg 50.98 47.08 Avg 47.94 46.53 Avg 47.88 47.80 Max 64.07 49.33 Max 54.26 47.53 Max 50.81 48.61
05-02-91 Min 36.00 44.74 05-12-91 Min 43.05 45.43 05-22-91 Min 41.39 45.43 Avg 50.34 47.46 Avg 44.45 46.15 Avg 44.24 47.63 Max 62.70 49.70 Max 48.25 47.18 Max 47.89 49.33
05-03-91 Min 36.62 45.43 05-13-91 Min 42.38 46.12 05-23-91 Min 39.n 47.18 Avg 49.10 48.32 Avg 44.14 46.38 Avg 45.60 48.48 Max 60.47 50.44 Max 46.12 46.82 Max 52.70 50.07
05-04-91 Min 35.69 47.18 05-14-91 Min 37.55 45.43 05-24-91 Min 41.39 47.53 Avg 47.85 49.65 Avg 43.07 45.99 Avg 43.90 48.75 Max 57.91 51.94 Max 47.53 46.47 Max 48.25 50.81
05-05-91 Min 44.06 50.44 05-15-91 Min 3631 45.n 05-25-91 Min 38.81 46.82 Avg 47.02 51.04 Avg 48.59 46.83 Avg 42.16 47.94 Max 50.81 51.56 Max 58.33 47.89 Max 46.47 48.97
05-06-91 Min 43.05 49.70 05-16-91 Min 45.43 46.82 05-26-91 Min 42.05 46.82 Avg 45.43 50.69 Avg 50.82 49.19 Avg 44.42 47.80 Max 46.82 51.18 Max 56.67 50.44 Max 47.53 48.61
05-07-91 Min 42.71 48.61 05-17-91 Min 44.40 45.n .05-27-91 Min 44.06 47.53 Avg 44.67 49.46 Avg 45.28 47.04 Avg 46.17 47.n Max 46.82 50.07 Max 48.25 48.61 Max 50.44 48.25
05-08-91 Min 35.39 46.12 05-18-91 Min 43.38 47.18 05-28-91 Min 43.72" 47.53 Avg 39.69 47.09 Avg 44.98 47.49 Avg 47.06 48.25 Max 42.38 48.61 Max 46.82 47.89 Max 51.56 48.97
05-09-91 Min 33.87 45.43 05-19-91 Min 44.74 47.18 05-29-91 Min 43.72 46.12 Avg 38.57 45.93 Avg 46.51 47.47 Avg 46.58 48.33 Max 44.74 46.47 Max 48.25 47.89 Max 5156 49.70
05-10-91 Min 40.09 45.43 05-20-91 Min 46.47 47.53 05-30-91 Min 39.n 47.18 Avg 4335 45~n Avg 48.49 48.24 Avg 43.89 47.67 Max 47.18 46.12 Max 51.18 48.97 Max 48.97 48.61
05-31-91 Min 43.72 47.53 Avg 48.33 48.21 Max 55.05 49.33
- 7 -
r TABLE 1. Continued
HANCOCK CREEK r June 1991 •
Air H2O Air H2O Air H2O 06-01-91 Min 44.40 47.89 Q6.11-91 Min 43.05 51.94 Q6.21-91 Min 45.08 53.09
Avg 52.29 49.28 Avg 46.55 53.47 Avg 47.81 53.33 Max 58.33 SO.81 Max 54.65 55.05 Max 50.81 53.87
06-02-91 Min 43.05 48.61 Q6.12-91 Min 4205 51.18 Q6.22-91 Min 47.53 53.09 Avg 47.18 SO.51 Avg 43.69 51.99 Avg 49.80 53.51 Max 4933 51.94 Max 46.12 5270 Max 52.70 53.87
06-03-91 Min 37.55 48.61 Q6.13-91 Min 39.45 50.81 06-23-91 Min 48.61 53.09 Avg 40.87 49.66 Avg 42.24 51.44 Avg 51.46 53.59 Max 45.77 51.56 Max 46.12 52.32 Max 54.65 53.87
06-04-91 Min 35.08 47.53 06-14-91 Min 41.39 50.44 Q6.24-91 Min 45.77 51.56 Avg 42.08 49.20 Avg 44.46 51.12 Avg 51.93 53.13 Max 47.53 50.07 Max 47.89 51.56 Max 57.91 54.26
06-05-91 Min 35.39 47.89 Q6.15-91 Min 42.38 4933 Q6.25-91 Min 4933 51.94 Avg 47.93 49.44 Avg 47.14 50.80 Avg 51.00 5295 Max 57.91 51.18 Max 54.26 51.56 Max 53.09 53.87
06-06-91 Min 48.61 50.44 06-16-91 Min 41.n 4933 06-26-91 Min 47.89 52.32 Avg 52.14 51.72 Avg 43.89 49.85 Avg 50.60 53.24 Max 57.08 54.26 Max 45.43 50.44 Max 53.87 54.26
06-07-91 Min 47.18 50.07 Q6.17-91 Min 43.05 48.97 06-27-91 Min 46.47 53.87 Avg 48.61 51.60 Avg 47.45 49.56 Avg 58.19 54.69 Max 50.07 51.94 Max 53.87 50.07 Max 66.45 55.86
60:.-.
06-08-91 Min 46.47 4933 06-18-91 Min 40.74 48.91 06-28-91 Min 50.07 54.26 Avg 49.55 50.81 Avg 53.52 50.32 Avg 59.69 56.78 Max 54.26 52.32 Max 63.15 51.56 Max 66.94 59.18
L
06-09-91 Min 43.05 50.44 Q6.19-91 Min 47.53 50.44 06-29-91 Min 49.33 57.08 f' Avg 53.87 51.62 Avg 55.47 53.16 Avg 5215 5830
Max 64.54 53.48 Max 64.07 56.26 Max 57.08 59.18 ~
06-10-91 Min 48.25 SO.44 06-20-91 Min 46.47 5270 06-30-91 Min 48.61 56.67 !l" "'j;"
Avg 56.99 53.41 Avg 47.n 53.50 Avg 53.66 58.34 :i: t¥
Max 65.49 57.08 Max 50.81 53.87 Max 60.91 60.91 Y-( !i: ji
?
ri
~~
~ - 8 -
1~.·t
II n u
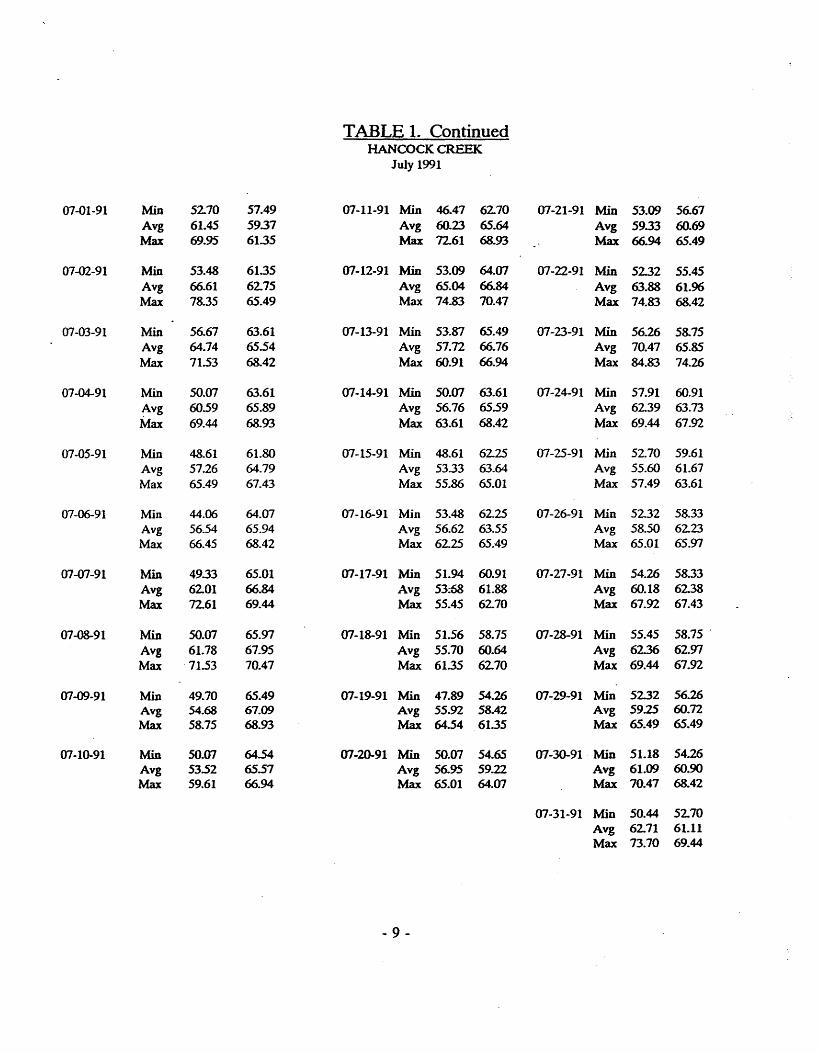
TABLE 1. Continued HANCOCK CREEK
July 1991
07-01-91 Min 52.10 57.49 07-11-91 Min 46.47 62.70 07-21-91 Min 53.09 56.61 Avg 61.45 59.37 Avg 60.23 65.64 Avg 5933 60.69 Max 69.95 6135 Max 72.61 68..93 Max 66.94 65.49
07-02-91 Min 53.48 61.35 01-12-91 Min 53.09 64.07 01-22-91 Min 5232 55.45 Avg 66.61 62.75 Avg 65.04 66.84 Avg 63.88 61.96 Max 78.35 65.49 Max 74.83 70.47 Max 74.83 68..42
07-03-91 Min 56.67 63.61 07-13-91 Min 53.81 65.49 07-23-91 Min 56.26 58.15 Avg 64.14 65.54 Avg 57.72 66.76 Avg 70.47 65.85 Max 11.53 68.42 Max 60.91 66.94 Max 84.83 74.26
07-04-91 Min 50.01 63.61 07-14-91 Min 50.01 63.61 01-24-91 Min 51.91 60.91 Avg 60.59 65.89 Avg 56.76 65.59 Avg 6239 63.73 Max 69.44 68.93 Max 63.61 68.42 Max 69.44 67.92
07-05-91 Min 48.61 61.80 01-15-91 Min 48.61 6225 01-25-91 Min 52.10 59.61 Avg 57.26 64.79 Avg 53.33 63.64 Avg 55.60 61.67 Max 65.49 67.43 Max 55.86 65.01 Max 57.49 63.61
07-06-91 Min 44.06 64.07 07-16-91 Min 53.48 6225 07-26-91 Min 5232 58.33 Avg 56.54 65.94 Avg 56.62 63.55 Avg 58.50 6223 Max 66.45 68.42 Max 6225 65.49 Max 65.01 65.97
07-07-91 Min 4933 65.01 07-11-91 Min 51.94 60.91 07-27-91 Min 54.26 58.33 Avg 6201 66.84 Avg 53~68 61.88 Avg 60.18 6238 Max 72.61 69.44 Max 55.45 62.70 Max 67.92 67.43
07-08-91 Min 50.07 65.97 07-18-91 Min 51.56 58.75 01-28-91 Min 55.45 58.15 .
Avg 61.18 67.95 Avg 55.70 60.64 Avg 62.36 62.97 Max ·71.53 70.47 Max 6135 6270 Max 69.44 67.92
07-09-91 Min 49.70 65.49 07-19-91 Min 47.89 54.26 07-29-91 Min 5232 56.26 Avg 54.68 67.09 Avg 55.92 58.42 Avg 59.2S 60.72 Max 58.75 68.93 Max 64.54 6135 Max 65.49 65.49
07-10-91 Min 50.07 64.54 07-20-91 Min 50.07 54.65 07-30-91 Min 51.18 54.26 Avg 53.52 65.57 Avg 56.95 59.22 Avg 61.09 60.90 Max 59.61 66.94 Max 65.01 64.07 Max 70.47 68.42
07-31-91 Min 50.44 52.70 Avg 62.71 61.11 Max 13.70 69.44
- 9-
---r
TABLE 1. Continued HANCOCK CREEK
August 1991
Air H2O Air H2O Ale H2O 08-01-91 Min 51.56 53.48 08-11-91 Min 51.94 55.05 08-21-91 Min 54.26 54.65
Avg 59.42 59.48 Avg 55.72 58.11 Avg 64.26 61.74 Max 66.94 65.97 Max 61.35 6225 Max 75.40 69.95
08-02-91 Min 51.18 53.48 08-12-91 Min 48.25 51.18 08-22-91 Min 53.48 53.48 Avg 61.12 60.41 Avg 58.22 58.35 Avg 63.03 60.82 Max 70.47 68.42 Max 67.43 65.49 Max 73.15 68.42
08-03-91 Min 53.48 54.65 08-13-91 Min 53.87 55.05 08-23-91 Min 51.94 51.94 Avg 62.95 61.67 Avg 60.64 60.46 Avg 55.96 55.50 Max 72.61 69.44 Max 68.42 66.45 Max 60.47 60.04
08-04-91 Min 53.87 55.05 08-14-91 Min 52.70 53.87 08-24-91 Min 48.25 48.25 Avg 62.33 61.31 Avg 62.02 60.78 Avg 54.18 54.19 Max 70.47 68.42 Max 72.06 68.42 Max 60.47 59.18
08-05-91 Min 53.48 53.87 08-15-91 Min 56.67 57.08 08-25-91 Min 43.05 51.56 Avg 58.09 59.18 Avg 66.03 63.79 Avg 51.68 54.50 Max 6225 62.70 Max 76.56 71.53 Max 60.91 57.49
08-06-91 Min 58.33 59.18 08-16-91 Min 57.49 57.91 08-26-91 Min 42.38 4933 Avg 62.65 62.57 Avg 65.57 64.14 Avg 53.17 55.14 Max 67.92 66.45 Max 72.61 69.95 Max 62.70 62.25
08-07-91 Min 59.18 59.61 08-17-91 Min 58.75 59.18 08-27-91 Min 50.81 56.26 Avg 63.17 63.22 Avg 67.52 65.44 Avg 53.61 58.87 Max 69.95 67.43 Max 76.56 72.06 Max 56.26 60.91
08-08-91 Min 60.04 60.04 08-18-91 Min 60.47 60.47 08-28-91 Min 49.70 59.18 Avg 67.07 65.21 ·Avg 68.94 66.38 Avg 51.28 60.71 Max 76.56 72.06 Max 78.96 73.15 Max 52.70 61.80 ~.-
08-09-91 Min 53.87 .56.67 08-19-91 Min 58.33 -58.33 08-29-91 Min 50.44 60.91 Avg 57.72 58.85 Avg 67.49 65.21 Avg 57.68 62.57 Max 60.47 61.35 Max 77.75 72.61 Max 67.92 65.49
i;;
08-10-91 Min 50.07 53.87 08-20-91 Min 57.08 57.49 08-30-91 Min 52.32 61.80 ~,.
Avg 52.56 56.V Avg 65.52 63.33 Avg 59.01 6339 ~
Max 55.86 59.61 Max 74.83 70.47 Max 64.54 65.01 fI,
08-31-91 Min 51.18 6135 ~ Avg 55.12 61.95 Max 57.91 62.70 r--
.., ~~
~ -10 -
ti n
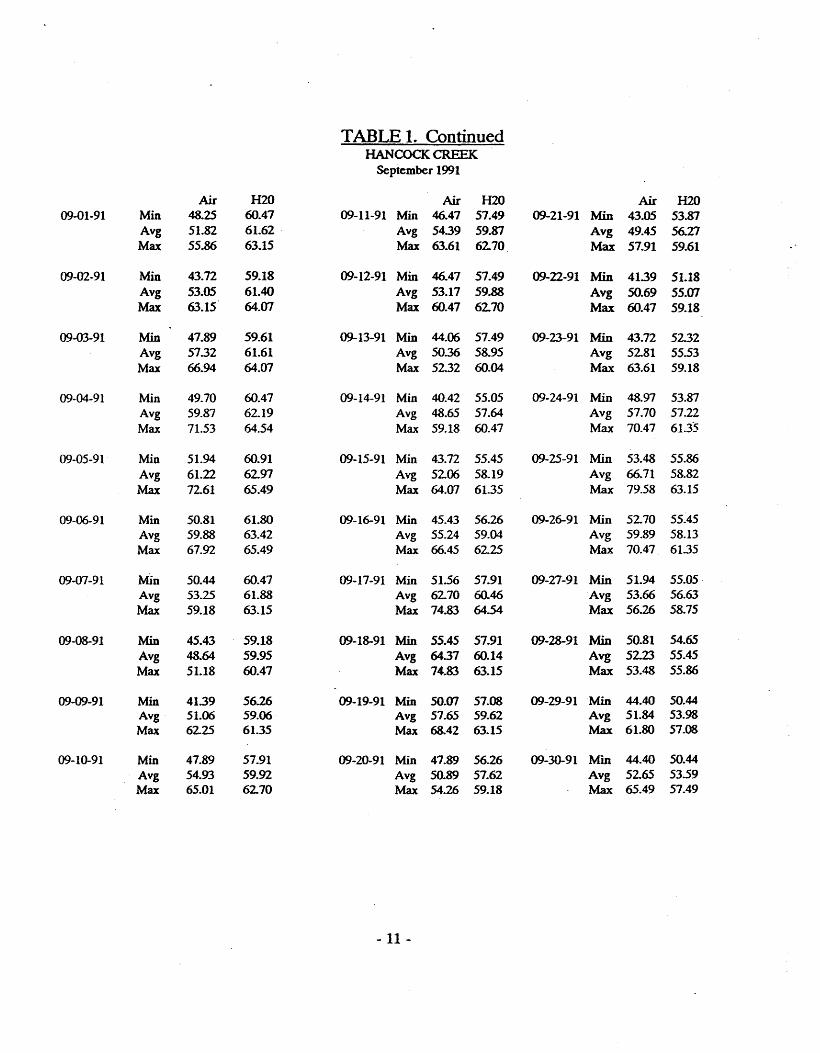
TABLE 1. Continued HANCOCK CREEK
September 1991
Air H2O Air H2O Air H2O 09-01-91 Min 48.25 60.47 09-11-91 Min 46.47 57.49 09-21-91 Min 43.05 53.87
Avg 51.82 61.62 . Avg 54.39 59.87 Avg 49.45 56.27 Max 55.86 63.15 Max 63.61 6270 Max 57.91 59.61
09-02-91 Min 43.n 59.18 09-12-91 Min 46.47 57.49 09-22-91 Min 41.39 51.18 Avg 53.05 61.40 Avg 53.17 59.88 Avg 50.69 55.07 Max 63.15 64.07 Max 60.47 6270 Max 60.47 59.18
09-03-91 Min 47.89 59.61 09-13-91 Min 44.06 57.49 09-23-91 Min 43.72 52.32 Avg 57.32 61.61 Avg 50.36 58.95 Avg 5281 55.53 Max 66.94 64.07 Max 52.32 60.04 Max 63.61 59.18
09-04-91 Min 49.70 60.47 09-14-91 Min 40.42 55.05 09-24-91 Min 48.97 53.87 Avg 59.87 62.19 Avg 48.65 57.64 Avg 57.70 57.22 Max 71.53 64.54 Max 59.18 60.47 Max 70.47 61.35
09-05-91 Min 51.94 60.91 09-15-91 Min 43.72 55.45 09-25-91 Min 53.48 55.86 Avg 61.22 6297 Avg 5206 58.19 Avg 66.71 58.82 Max 7261 65.49 Max 64.07 61.35 Max 79.58 63.15
09-06-91 Min 50.81 61.80 09-16-91 Min 45.43 56.26 09-26-91 Min 5270 55~45 Avg 59.88 63.42 Avg 55.24 59.04 Avg 59.89 58.13 Max 67.92 65.49 Max 66.45 6225 Max 70.47 61.35
09-07-91 Min 50.44 60.47 09-17-91 Min 51.56 57.91 09-27-91 Min 51.94 55.05 Avg 53.25 61.88 Avg 6270 60.46 Avg 53.66 56.63 Max 59.18 63.15 Max 74.83 64.54 Max 56.26 58.75
09-08-91 Min 45.43 59.18 09-18-91 Min 55.45 57.91 09-28-91 Min SO.81 54.65 Avg 48.64 59.95 Avg 64.37 60.14 Avg 5223 55.45 Max 51.18 60.47 Max 74.83 63.15 Max 53.48 55.86
09-09-91 Min 41.39 56.26 09-19-91 Min 50.07 57.08 09-29-91 Min 44.40 50.44 Avg 51.06 59.06 Avg 57.65 59.62 Avg 51.84 53.98 Max 6225 61.35 Max 68.42 63.15 Max 61.80 57.08
09-10-91 Min 47.89 57.91 09-20-91 Min 47.89 56.26 09-30-91 Min 44.40 50.44 Avg 54.93 59.92 Avg 50.89 57.62 Avg 52.65 53.59 Max 65.01 6270 Max 54.26 59.18 Max 65.49 57.49
- 11 -

r-
TABLEt. Continued HANCOCK CREEK
r-
October 1991
Air H2O Air H2O 10-01-91 Min 44.40 50.07 10-11-91 Min 47.89 47.53
Avg 51.00 5271 Avg 54.82 49.94 Max 60.91 56.26 Max 68.42 53.09
10-02-91 Min 44.06 4933 Avg 49.Zl 51.52 Max 57.91 54.65
10-03-91 Min 38.18 45.43 Avg 45.19 48.42 Max 55.05 51.94
10-04-91 Min 38.81 45.08 Avg 48.02 47.75 Max 60.47 51.18
10-05-91 Min 48.25 46.12 Avg 58.10 48.86 Max 70.47 51.56
10-06-91 Min 45.08 46.82 Avg 5218 49.72 Max 57.91 51.56
10-07-91 Min 43.72 47.89 Avg 50.05 50.14 Max 55.86 5232
10-08-91 Min 38.18 43.72 Avg 45.96 46.61 Max 57.08 49.70
L
10-09-91 Min 40.09 44.06 f: Avg 49.04 47.01
Max 6270 50.44 ~;j
10-10-91 Min 44.40 46.12 ~"'
Avg 52.21 48.86 ;;;.. Max 65.CJ7 51.94
$":4
~:; ~
b
-12 -
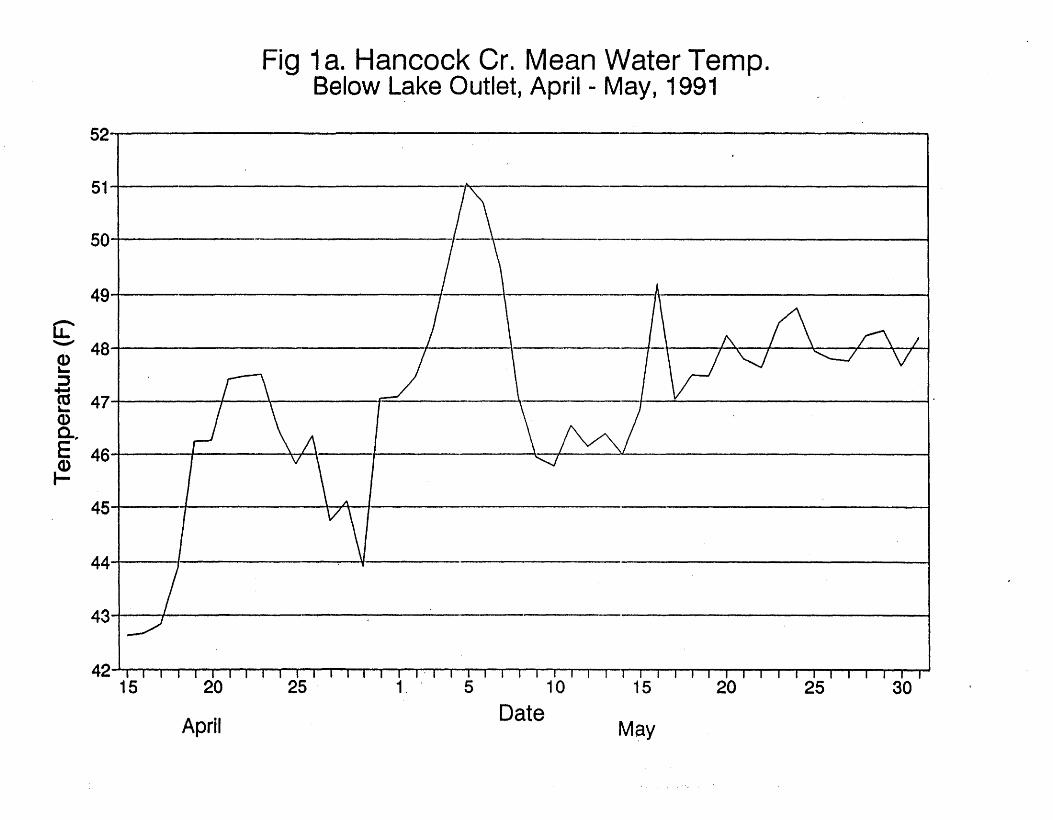
Fig 1 a. Hancock Cr. Mean Water Temp. Below Lake Outlet, April - May, 1991
52~i------------------------------------------------------------------------~
51 I ~~<----------------------------------------------~
50~1-------------'------------------
49
G:" '-" 48 Q) .... ::l
1tS .... Q) c. .. E ~
47
46
45
44 I v
43 I t
42' I I 15 25
April
1. 5 10 15 20 25 30
Date May

f.·1
U

68
66
64
62 (2 ......... Q) .... ::3 1a 58 .... Q) a. E 56
~ 54
52
50
48 1 5
Fig. 1 b. Hancock Cr. Water Temperature June - July, 1991
10 15 20 25 1 5 10 15
Date June July
[ - Below Lake Outlet -I- IFIM Sit-e----J
20 25 30

r !
n

~ ""'-" Q) '-::l 1a '-0> a. E ~
Fig. 1 c. Hancock Cr. Mea'n Water Temp. August-October, 1991
70-i------------------------------------------------------------~
651 A ~-----
60
55
50 I >1 ) I
45 ' , , i
1 5 10 15 20 25
August
30 5
Date 10 15 20 25
Sept.
c=~I;;-L;k~ ()~~I~t-~IFIM-Site . J
30 5
Oct.
10

r
-

Table 2. Snorkeling-and Electroshocking Observations, Hancock Creek, 1991.
Date Method Location W.Temp Fish # .. LS. Length Spp Comm
6-1 Snork Pool 52 1 Juv Unm BT 2 Ad Unm cr 6 Ad Unm Unk 2 pairs 7 Juv Unm Unk
Abv. Pool 1 Juv Unm Unk Lower 52 6 Ad Unm RB
7 Juv Unm RB
6-8 Snork Pool 52 6 Ad Unm Unk 17 JUY Unm Unk
Lower 52 18 Ad Unm Unk 40 Juv Unm Unk
6-15 Snork Pool 53 7 JUY Unm Unk 16 Ad Unm Unk
Lower 53 7 Ad Unm RB 22 JUY Unm RB
Lake 51 0
6-22 Snork Lake 55 1 Juv Unm RB Fry larger 25 Fry Unm Unk than Calligan
Pool 54 3 Ad Unm RB 11 Juv Unm RB 6 Fry Unm Unk 1 Juv Unm BT 1 Ad Unm cr Mort
Lower 54 16 Juv Unm RB 12 Ad Unm RB 15 Fry Unm Unk Newemerg
7-5 Electro Lake 61 0 Electro?
7-13 Electro Pool 56 0
Lower 56 1 Fry 33 1 Ad 115 1 Fry 36 1 Fry 35 1 Fry 39 1 Ad 165 1 Fry 37
- 19 -
..
r Table 2. Snorkeling and Electroshocking Observations, t.
Hancock Creek, 1991. (CONTINUED) ;~
Date Method Location W.Tem~ FISh # LS. Length S22 Comm
7-21 Electro Pool 56 1 Fry 3.5 RB 1 Fry Unm Unk 1 Fry 3.2 RB
Lower 46 1 Fry 40 RB 1 Fry 35 RB 1 Fry 50 cr/BR
7-27 Electro Pool Unk 1 Fry -25 Unk 1 Fry 32 RB 1 Fry 27 cr 1 Fry 27 cr 1 Fry 38 RB 1 Fry 30 RB 1 Fry 29 RB
Lower Unk 1 Fry -30 Unk 1 Fry 31 RB 1 Fry -30 Unk 1 Fry -25 Unk 1 Fry -30 Unk 1 Fry -35 Unk 1 Fry -25 Unk
8-12 Electro Pool 57.2 0
Lower 57.2 1 Fry 40 RB 1 Fry 52 RB 1 Fry 48 RB
~ 1 Fry 46 RB 1 Fry 43 RB
~i 1 Fry 45 RB 11 1 Fry 48 RB 1 Juv 70 RB 1 Fry -45 RB
.,,~
.:' ~
1 Fry -45 RB :.<. -1 Fry -45 RB 1 Fry 38 RB ;n
~c:
1 Juv 74 RB ti
8-18 Electro Pool 59 1 Fry 43 RB f", 1 Fry 40 RB
~
~ tJ
- 20- 0 D
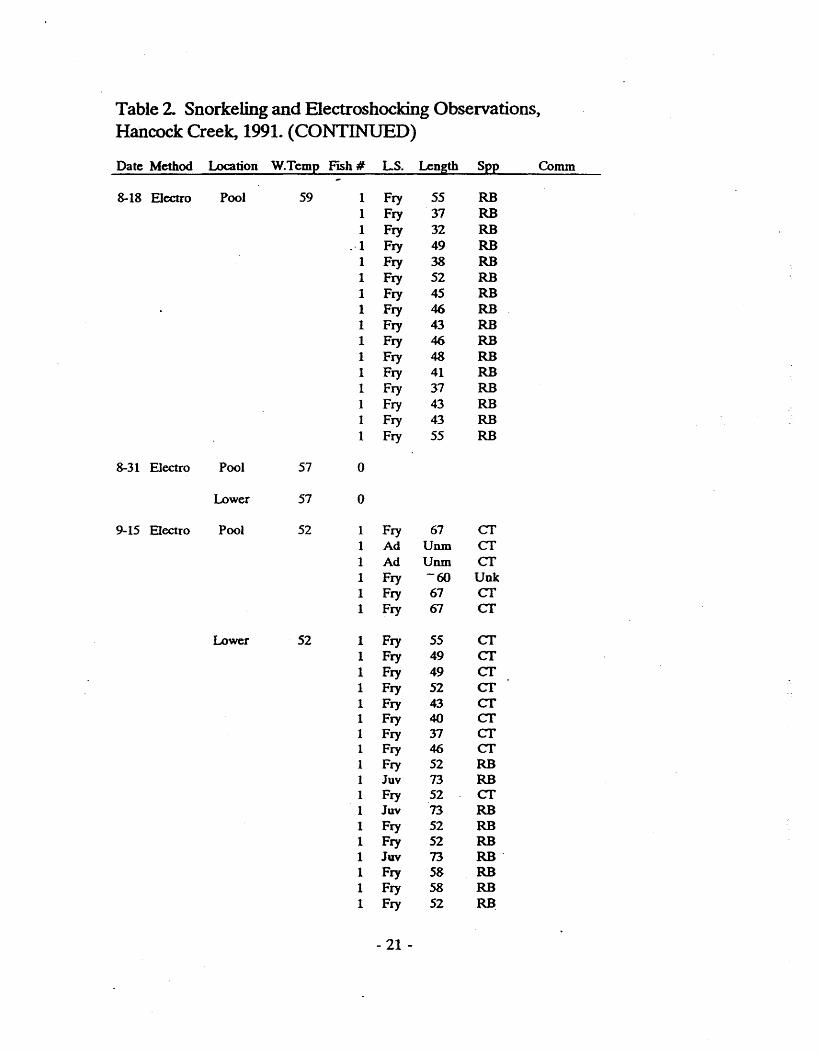
Table 2. Snorkeling and Electroshocking Observations, Hancock Creek, 1991. (CONTINUED)
Date Method Location W.Temp FISh # LS. Length Spp Comm
8-18 Electro Pool 59 1 Fry 55 RB 1 Fry 37 RB 1 Fry 32 RB
0-1 Fry 49 RB 1 Fry 38 RB 1 Fry 52 RB 1 Fry 45 RB 1 Fry 46 RB 1 Fry 43 RB 1 Fry 46 RB 1 Fry 48 RB 1 Fry 41 RB 1 Fry 37 RB 1 Fry 43 RB 1 Fry 43 RB 1 Fry 55 RB
8-31 Electro Pool 57 0
Lower 57 0
9-15 Electro Pool 52 1 Fry 67 cr 1 Ad Unm cr 1 Ad Unm cr 1 Fry -60 Unk 1 Fry 67 cr 1 fry 67 cr
Lower 52 1 Fry 55 cr 1 Fry 49 cr 1 Fry 49 cr 1 Fry 52 cr 1 Fry 43 cr 1 Fry 40 cr 1 Fry 37 cr 1 Fry 46 cr 1 Fry 52 RB 1 Juv 73 RB 1 Fry 52 cr 1 Juv 73 RB 1 Fry 52 RB 1 Fry 52 RB 1 Juv 73 RB -I Fry 58 RB 1 Fry 58 RB 1 Fry 52 RB
- 21 -
r Table 2 Snorkeling and Electroshocking Observations, ~
Hancock Creek, 1991. (CONTINUED) r:~
Date Method Location W.Temp FlSh# L.S. Length Spp Comm
Lower 52 1 Fry 49 RB .
1 Fry -49 Unk 1 Fry 43 RB 1 Juv 113 cr 1 Fry 52 RB 1 Fry -52 Unk 1 Juv 73 RB 1 Fry 46 RB 1 Fry 52 RB 1 Fry 49 RB 1 Fry 40 RB 1 Fry 40 RB 1 Fry -40 Unk 1 Fry 67 RB 1 Fry 70 RB 1 Juv 116 RB 1 Fry 46 RB
10-6 Snorkel Pool 47 Juv Unm cr 2 Juv Unm RB 4 Ad Unm cr
Below Pool 1 Juv Unm cr 1 Ad Unm cr
Lower 61 Juv Unm cr 8 Ad Unm cr
- 22-
.... c: Q) (.) '-Q) a.
rig 2. Hancock Cr. Electroshocking Data Cumulative Size Groupings-Rainbow Trout
100% i =- - =-
90%
80%
70%
Central 80%
0% -= , 7-5 7·13 7-21 7-27 8-12 8-18 8-31 9-15
Date (1991)
[ --- ::-~ITl-;-~-~:~~mm -*- < =45mm ._-. -' - tot~1 J

r. " .

Table 3. Daily Temperature Units (DTU) for Hancock Creek, at lake and IFIM site, 1991.
Lake H2O Site Est. Te~p. OW EstOTIJ Month Day Mean Temp @Site @LAKE @SITE .
4 15 4264 4264 10.64 10.64 4 16 4267 4267 10.67 10.67 4 17 4284 4284 10.84 10.84 4 18 43.88 43.88 11.88 11.88 4 19 46.24 46.24 14.24 14.24 4 20 46.26 46.26 14.26 14.26 4 21 47.42 47.42 15.42 15.42 4 22 47.47 47.47 15.47 15.47 4 23 47.51 47.51 15.51 15.51 4 24 46.44 46.44 14.44 14.44 4 25 45.82 45.82 13.82 13.82 4 26 4635 4635 1435 1435 4 27 44.75 44.75 12.75 12.75 4 28 45.11 45.11 13.11 13.11 4 29 43.90 43.90 11.90 11.90 4 30 47.05 47.05 15.05 15.05 5 1 47.08 47.08 15.08 15.08 5 2 47.46 47.46 15.46 15.46 5 3 48.32 48.32 16.32 1632 5 4 49.65 49.65 17.65 17.65 5 5 51.04 51.04 19.04 19.04-5 6 50.69 .50.69 18.69 18.69 5 7 49.46 49.46 17.46 17.46' 5 8 47.09 47.09 15.09 15.09 5 9 45.93 4S.93 13.93 13.93 5 . 10 45.77 45.77 13.77 13.77 5 11 46.53 46.53 14.53 14.53 5 12 46.15 46.15 14.15 14.15 5 13 4638 46.38 1438 1438 5 14 45.99 45.99 13.99 13.99 5 15 46.83 46.83 14.83 14.83 5 16 49.19 49.19 17.19 17.19 5 17 47.04 47.04 15.04 15.04 5 18 47.49 47.49 IS.49 IS.49 5 19 47.47 47~47 15.47 15.47 5 20 48.24 48.24 16.24 16.24 5 21 47.80 47.80 15.80 IS.80 5 22 47.63 47.63 15.63 15.63 5 23 48.48 48.48 16.48 16.48 5 24 48.75 48.75 16.75 16.75 5 25 47.94 47.94 15.94 IS.94 5 26 47.80 47.80 15.80 15.80 S 27 47.77 47.77 IS.77 15.77 5 28 48.25 48.25 16.25 1625
- 25 -

..
Table 3 Continued
, It
Lake H2O Site Est. Temp. D1U EstDTU r ~
Month DaI Mean Tem~ @Site @I..AKE @SlTE I
-5 29 48.33 48.33 1633 1633 .;-
5 30 47.67 47.67 15.67 15.67 -5 31 48.21 48.21 16.21 16.21 6 1 49.28 52.00 49.28 17.28 17.28 6 2 50.51 50.51 18.51 18.51 6 3 49.66 49.66 17.66 17.66 6 4 49.20 49.20 17.20 17.20 6 5 49.44 49.44 17.44 17.44 6 6 51.72 51.72 19.72 19.72 6 7 51.60 51.60 19.60 19.60 6 8 50.81 52.00 50.81 18.81 18.81 6 9 51.62 51.62 19.62 19.62 6 10 53.41 53.41 21.41 21.41 6 11 53.47 53.47 21.47 21.47 6 12 51.99 51.99 19.99 19.99 6 13 51.44 51.44 19.44 19.44 6 14 51.12 51.12 19.12 19.12 6 15 50.80 53.00 50.80 18.80 18.80 6 16 49.85 49.85 17.85 17.85 6 17 49.56 49.56 17.56 17.56 6 18 50.32 50.32 1832 18.32 6 19 53.16 53.16 21.16 21.16 6 20 53.50 53.50 21.50 21.50 6 21 53.33 5333 21.33 21.33 6 22 53.51 . 54.00 53.51 21.51 21.51 6 23 53.59 54.00 21.59 22.00 6 24 53.13 54.00 21.13 22.00 6 25 52.95 54.00 20.95 22.00 6 26 53.24 54.00 21.24 22.00 6 27 54.69 54.00 22.69 22.00 6 28 56.78 54.00 24.78 22.00 L 6 29 58.30 54.00 26.30 22.00 6 30 58.34 55.00 26.34 23.00 ~ .~:.
7 1 59.37 55.00 21.37 23.00 ;: ... ,~
7 2 62.75 55.00 30.75 23.00 7 3 65.54 55.00 33.54 23.00 7 4 65.89 55.00 33.89 23.00 7 5 64.79 55.00 32.79 23.00
;....
7 6 65.94 55.00 33.94 23.00 7 7 66.84 56.00 34.84 24.00 7 8 67.95 56.00 35.95 24.00 ii
7 9 67.09 56.00 35.09 24.00 7 10 65.57 56.00 33.57 24.00 7 11 65.64 56.00 33.64 24.00 i.o-J
7 12 66.84 56.00 34.84 24.00
~
- 26- n U
n
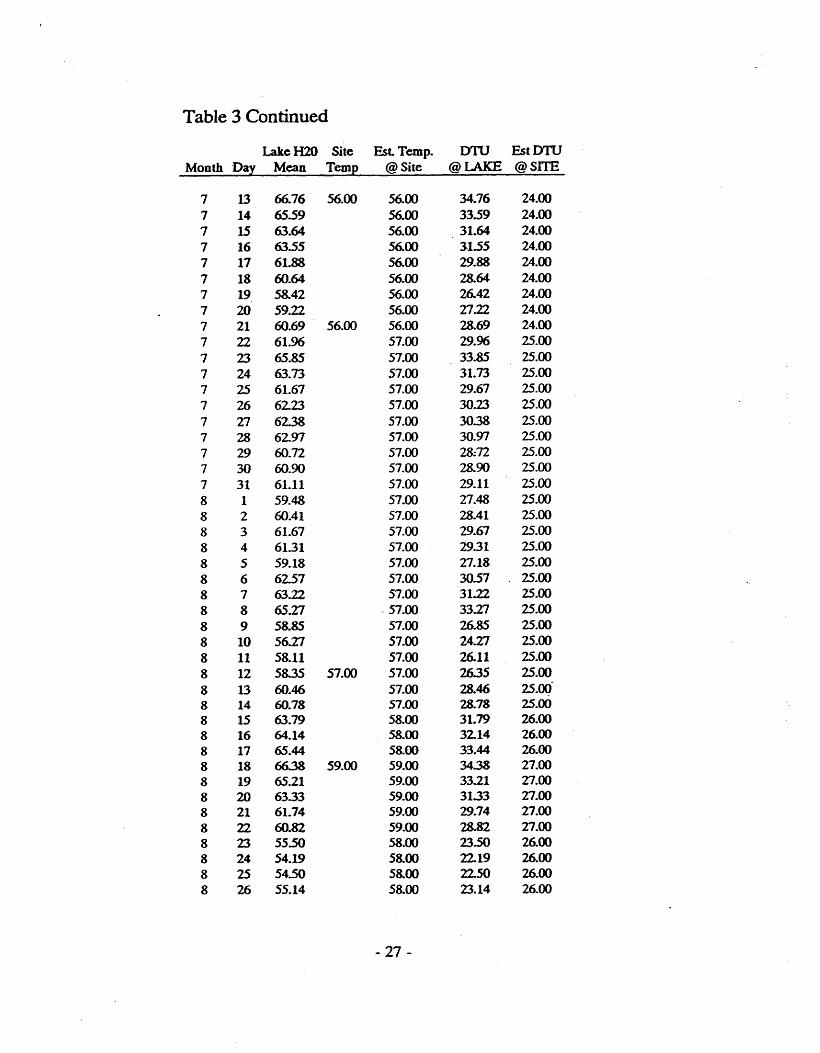
Table 3 Continued
Lake H2O Site Est. Temp. D1U EstDTU Month "Day Mean Temp @Site @LAKE @SITE
7 13 66.76 56.00 56.00 34.76 24.00 7 14 65.59 56.00 33.59 24.00 7 15 63.64 56.00 31.64 24.00 7 16 63.55 56.00 ~1.55 24.00 7 17 61.88 56.00 29.88 24.00 7 18 60.64 56.00 28.64 24.00 7 19 58.42 56.00 26.42 24.00 7 20 59.22 56.00 27.22 24.00 7 21 60.69 56.00 56.00 28.69 24.00 7 22 61.96 57.00 29.96 25.00 7 23 65.85 57.00 33.85 25.00 7 24 63.73 57.00 31.73 25.00 7 25 61.67 57.00 29.67 25.00 7 26 62.23 57.00 30.23 25.00 7 27 62.38 57.00 30.38 25.00 7 28 62.97 57.00 30.97 25.00 7 29 60.72 57.00 28;72 25.00 7 30 60.90 57.00 28.90 25.00 7 31 61.11 57.00 29.11 25.00 8 1 59.48 57.00 27.48 25.00 8 2 60.41 57.00 28.41 25.00 8 3 61.67 57.00 29.67 25.00 8 4 61.31 57.00 29.31 25.00 8 5 59.18 57.00 27.18 25.00 8 6 62.57 57.00 30.57 25.00 8 7 63.22 57.00 31.22 25.00
8 8 65.27 - 57.00 33.27 25.00 8 9 58.85 57.00 26.85 25.00 8 10 56.27 57.00 24.27 25.00 8 11 58.11 57.00 26.11 25.00 8 12 58.35 57.00 57.00 26.35 25.00 8 13 60.46 57.00 28.46 25.00 8 14 60.78 57.00 28.78 25.00 8 15 63.79 58.00 31.79 26.00 8 16 64.14 58.00 3214 26.00 8 17 65.44 58:00 33.44 26J:)O 8 18 66.38 59.00 59.00 34.38 27.00 8 19 65.21 59.00 33.21 27.00 8 20 63.33 59.00 31.33 27.00 8 21 61.74 59.00 29.74 27.00 8 22 60.82 59.00 28.82 27.00 8 23 55.50 58.00 23.50 26.00 8 24 54.19 58.00 22.19 26.00 8 25 54.50 58.00 22.50 26.00 8 26 55.14 58.00 23.14 26.00
- 27 -
r !
Table 3 Continued
Lake H2O Site Est. Temp. oro Est oro ,~
: Month Day Mean Temp @Site @lAKE @SITE
;:
8 Z1 58.87 58.00 26.87 26.00 8 28 60.71 58.00 28.71 26.00 8 29 62.57 57.00 30.57 25.00 8 30 63.39 57.00 31.39 25.00 8 31 61.95 57.00 57.00 29.95 25.00 9 1 61.62 . 57.00 29.62 25.00 9 2 61.40 56.00 29.40 24.00 9 3 61.61 56.00 29.61 24.00 9 4 62.19 56.00 30.18 24.00 9 5 62.97 55.00 30.97 23.00 9 6 63.42 55.00 31.42 23.00 9 7 61.88 55.00 29.88 23.00 9 8 59.95 54.00 27.95 22.00 9 9 59.06 54.00 27JJ6 22.00 9 10 59.92 54.00 27.92 22.00 9 11 59.87 53.00 27.87 21.00 9 12 59.88 53.00 27.88 21.00 9 13 58.95 53.00 26.95 21.00 9 14 57.64 52.00 25.64 20.00 9 15 58.19 52.00 52.00 26.19 20.00 9 16 59.04 52.00 27.04 20.00 9 17 60.46 28.46 9 18 60.14 28.14 9 19 59.62 27.62 9 20 57.62 25.62 9 21 56.27 24.27 9 22 55.07 13.07 9 23 55.53 23.53 9 24 57.22 25.22 9 25 58.82 26.82 9 26 58.13 26.13
~
9 27 56.63 24.63 9 28 55.45 23.45 ~. -..
9- 29 53.98 21.98 .:.. ~i
9 30 53.59 21.59 10 1 52.71 20.71 , -
10 2 51.52 19.52 10 3 -48.42 16.42 ~.""
10 4 47.75 15.75 10 5 48.86 16.86 10 6 49.72 17.72 ~
10 7 50.14 18.14 10 8 46.61 14.61 10 9 47.01 15.01 10 10 48.86 16.86 10 11 49.94 17.94
-- 28- fJ v:;
U
fl u
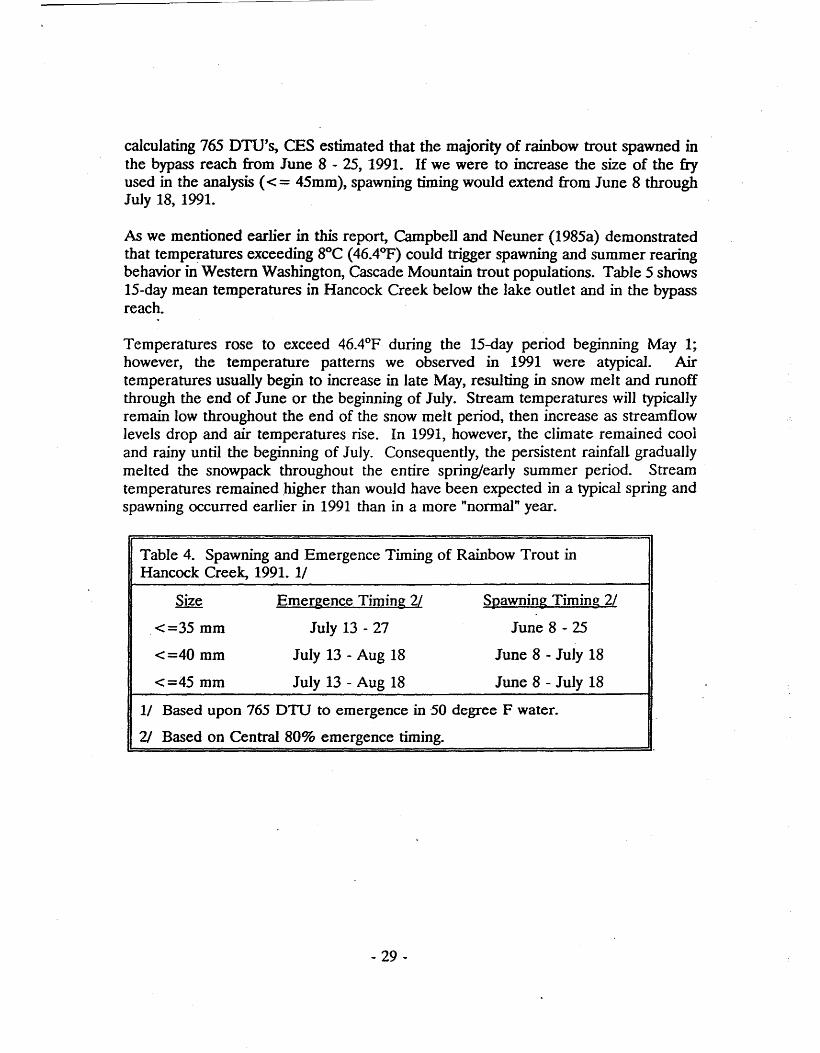
calculating 765 DTU's, CES estimated that the majority of rainbow trout spawned in the bypass reach from June 8 - 25, 1991. If we were to increase the size of the fly used in the analysis « = 45mm), spawning timing would extend from June 8 through July 18, 1991.
As we mentioned earlier in this report, Campbell and Neuner (1985a) demonstrated that temperatures exceeding 8°C (46.4°F) could trigger spawning and summer rearing behavior in Western Washington, Cascade Mountain trout populations. Table 5 shows 15-day mean temperatures in Hancock Creek below the lake outlet and in the bypass reach.
Temperatures rose to exceed 46.4°F during the 15-day period beginning May 1; however, the temperature patterns we observed in 1991 were atypical. Air temperatures usually begin to increase in late May, resulting in snow melt and runoff through the end of June or the beginning of July. Stream temperatures will typically remain low throughout the end of the snow melt period, then increase as streamflow levels drop and air temperatures rise. In 1991, however, the climate remained cool and rainy until the beginning of July. Consequently, the persistent rainfall gradually melted the snowpack throughout the entire spring/early summer period. Stream temperatures remained ,higher than would have been expected in a typical spring and spawning occurred earlier in 1991 than in a more "nonnal" year.
Table 4. Spawning and Emergence Timing of Rainbow Trout in Hancock Creek, 1991. 1/
Size Emergence Timing 2L S12awning Timing 2l
<=35 mm July 13 - 27 June 8 - 25
<=40 mm July 13 - Aug 18 June 8 - July 18
<=45 mm July 13 - Aug 18 June 8 - July 18
1/ Based upon 765 DTU to emergence in -50 degree F water.
2/ Based on Central 80% emergence timing.
- 29-
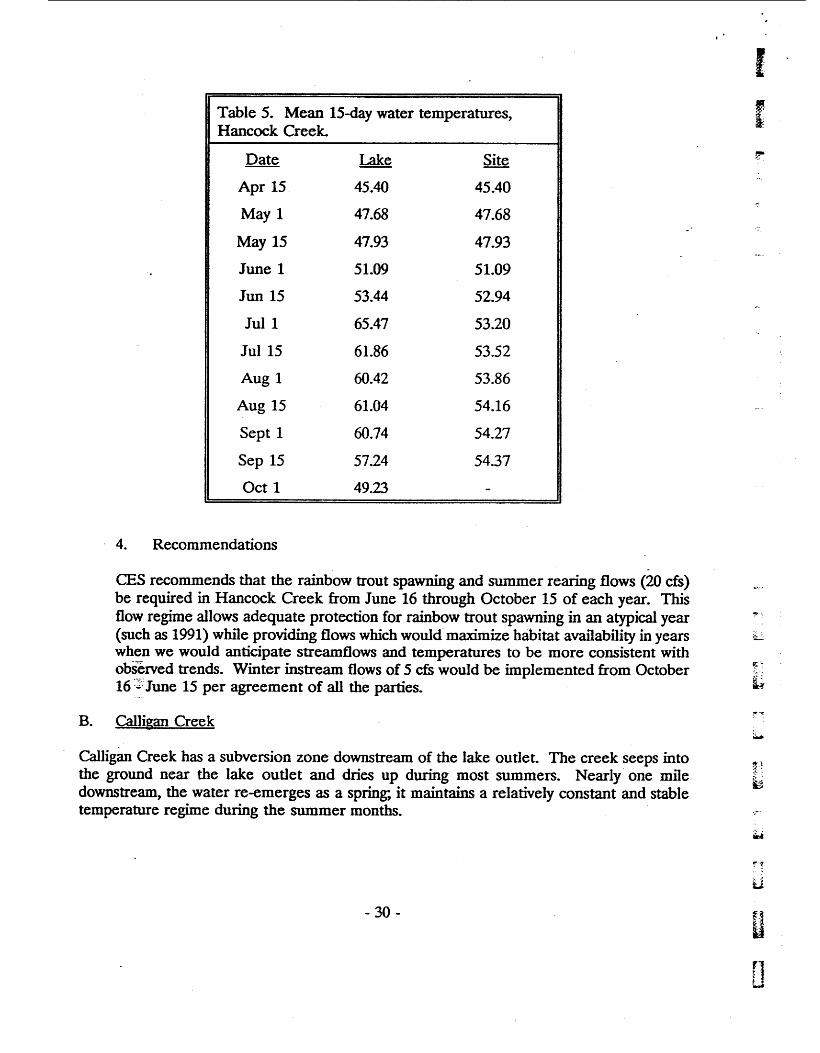
Table 5. Mean 15-day water temperatures, Hancock Creek.
Date Lake Site
Apr 15 45.40 45.40
May 1 47.68 47.68
May 15 47.93 47.93
June 1 51.09 51.09
Jun 15 53.44 52.94
Jul1 65.47 53.20
Jul15 61.86 53.52
Aug 1 60.42 53.86
Aug 15 61.04 54.16
Sept 1 60.74 54.27
Sep 15 5724 54.37
Oct 1 49.23
4. Recommendations
CES recommends that the rainbow trout spawning and summer rearing flows (20 cfs) be required in Hancock Creek from June 16 through October 15 of each year. This flow regime allows adequate protection for rainbow trout spawning in an atypical year (such as 1991) while providing flows which would maximize habitat availability in years when we would anticipate streamflows and temperatures to be more consistent with observed trends. Winter instream flows of 5 cfs would be implemented from October 16 ~~~ June 15 per agreement of all the parties.
B. Calligan Creek
Calligan Creek has a subversion zone downstream of the lake outlet. The creek seeps into the ground near the lake outlet and dries up during most summers. Nearly· one mile downstream, the water re-emerges as a spring; it maintains a relatively constant and stable temperature regime during the summer months.
- 30-
I E !("
~'-
~
.,.,
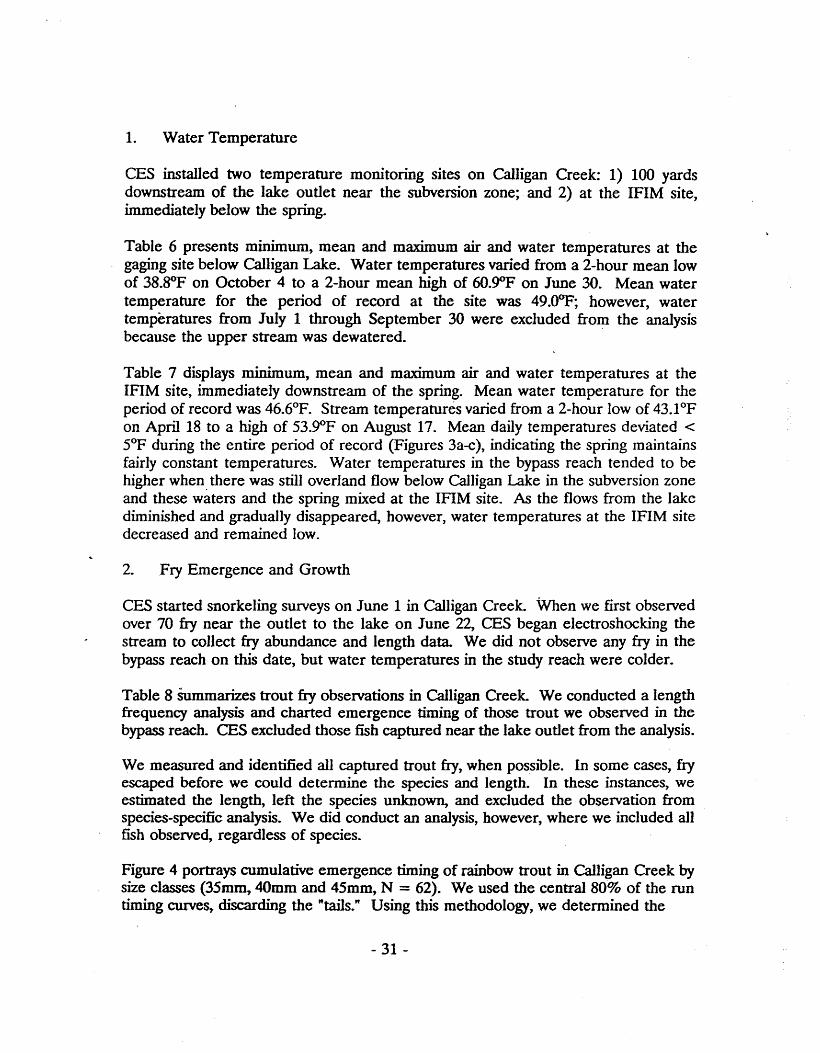
1. Water Temperature
CES installed two temperature monitoring sites on Calligan Creek: 1) 100 yards downstream of the lake outlet near the subversion zone; and 2) at the IFIM site, immediately below the spring.
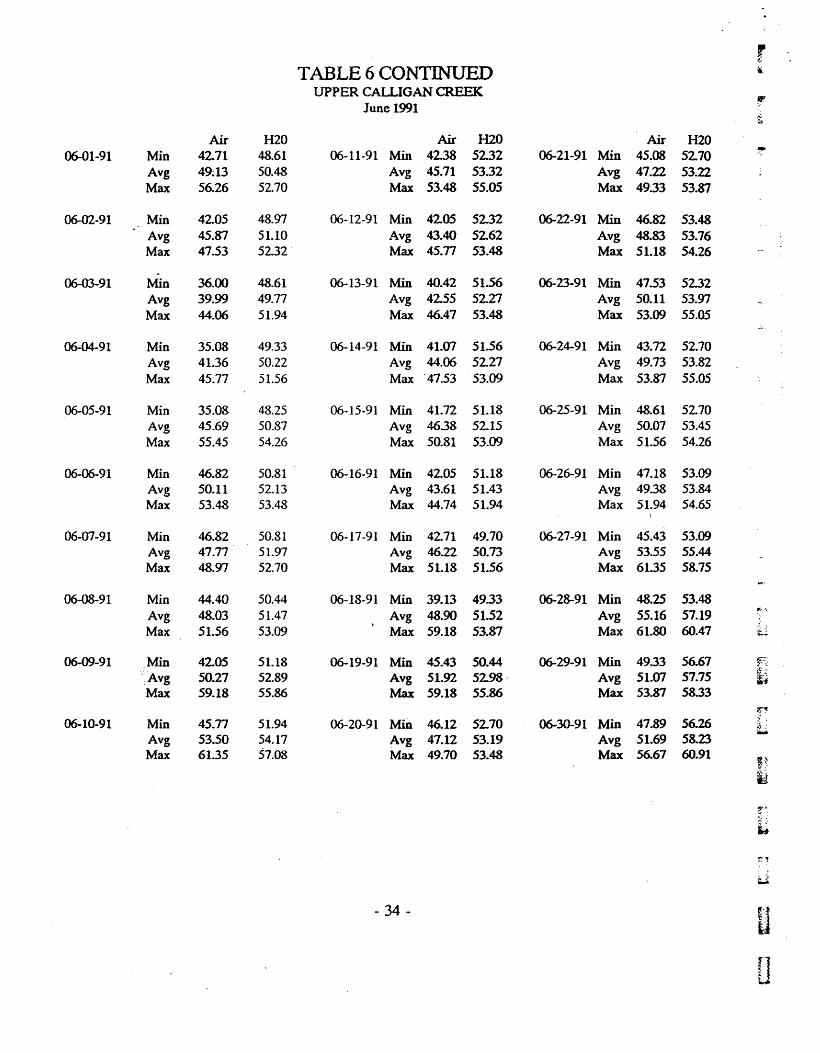
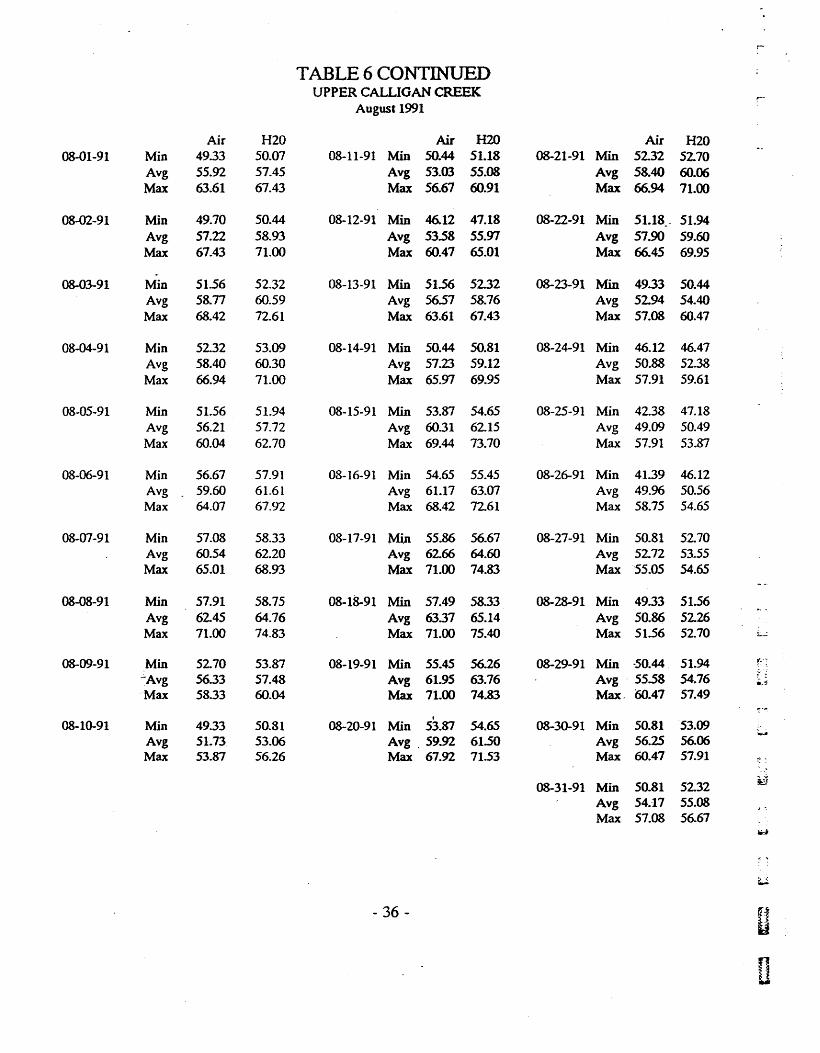
Table 6 presents minimum, mean and maximum air and water temperatures at the gaging site below Calligan Lake. Water temperatures varied from a 2-hour mean low of 38.SOF on October 4 to a 2-hour mean high of 6O.goF on June 30. Mean water temperature for the period of record at the site was 49.00F; however, water temperatures from July 1 through September 30 were excluded from the analysis because the upper stream was dewatered. .
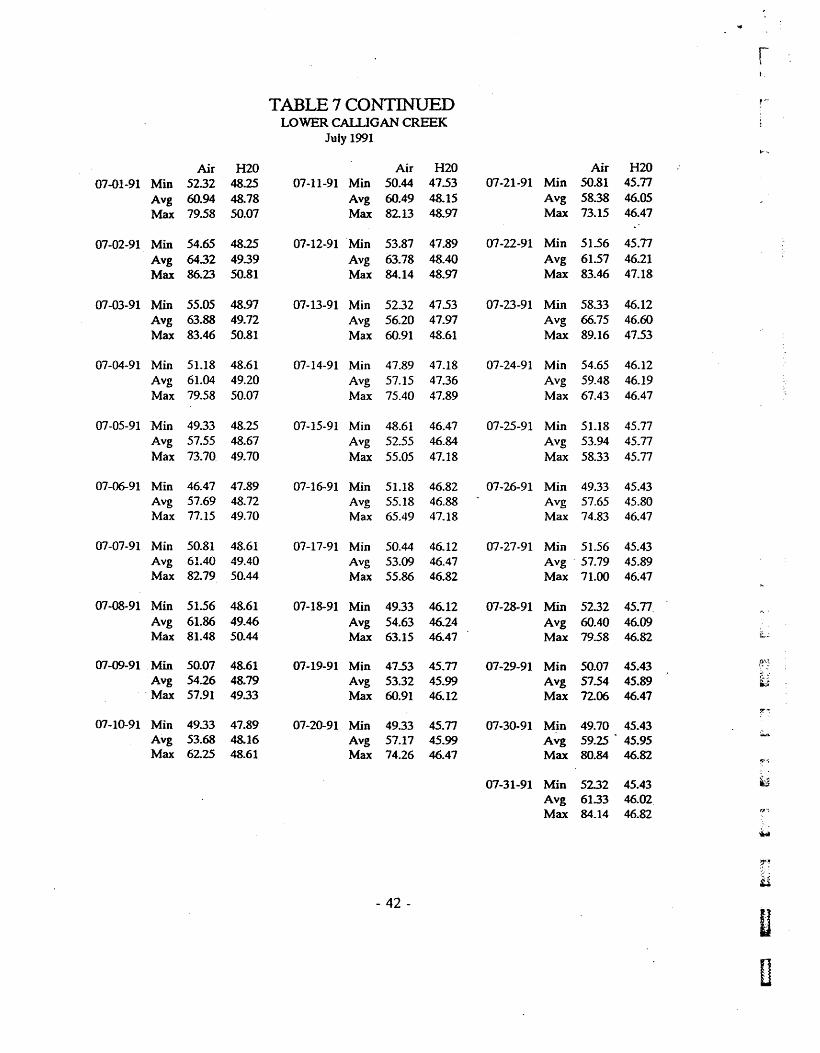
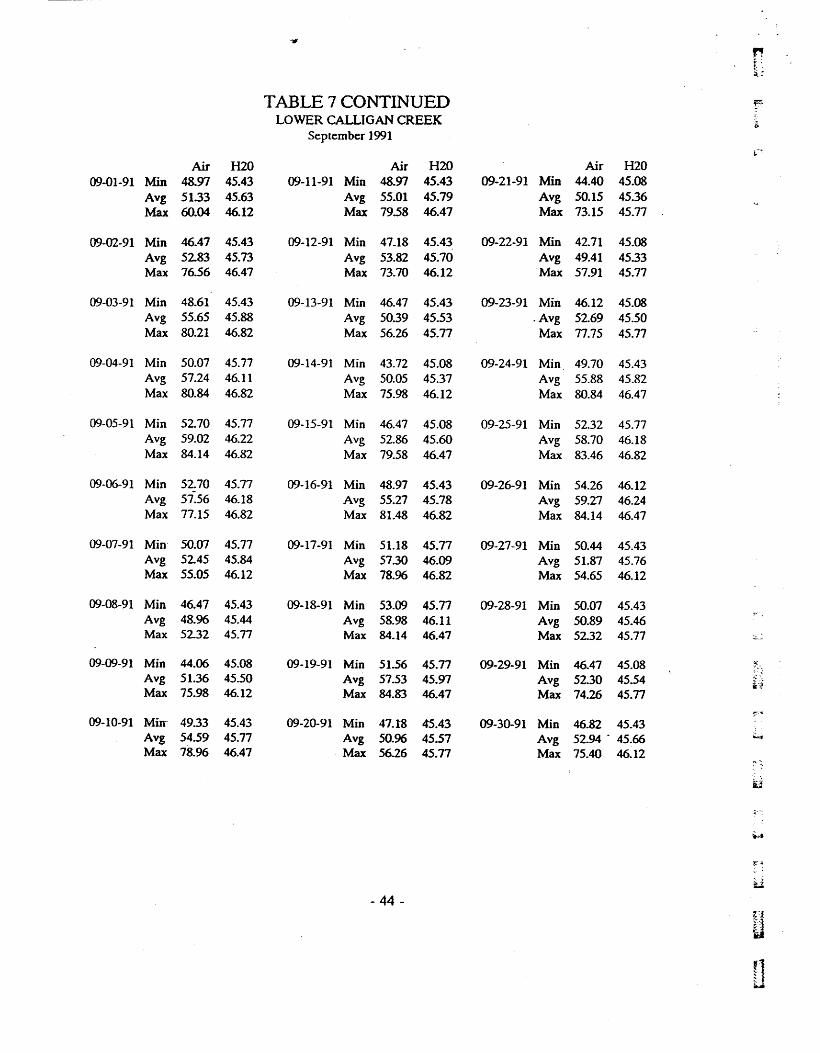
Table 7 displays minimum, mean and maximum air and water temperatures at the IFIM site, immediately downstream of the spring. Mean water temperature for the period of record was 46.6°F. Stream temperatures varied from a 2-hour low of 43.1°F on April 18 to a high of 53.g<>F on August 17. Mean daily temperatures deviated < 5°F during the entire period of record (Figures 3a-c), indicating the spring maintains fairly constant temperatures. Water temperatures in the bypass reach tended to be higher when. there was still overland flow below Calligan Lake in the subversion zone and these waters and the spring mixed at the IFIM site. As the flows from the lake diminished and gradually disappeared, however, water temperatures at the IFIM site decreased and remained low.
2. Fry Emergence and Growth
CES started snorkeling surveys on June 1 in Calligan Creek. When we first observed over 70 fry near the outlet to the lake on June 22, CES began electroshocking the stream to collect fry abundance and length data. We did not observe any fry in the bypass reach on this date, but water temperatures in the study reach were colder.
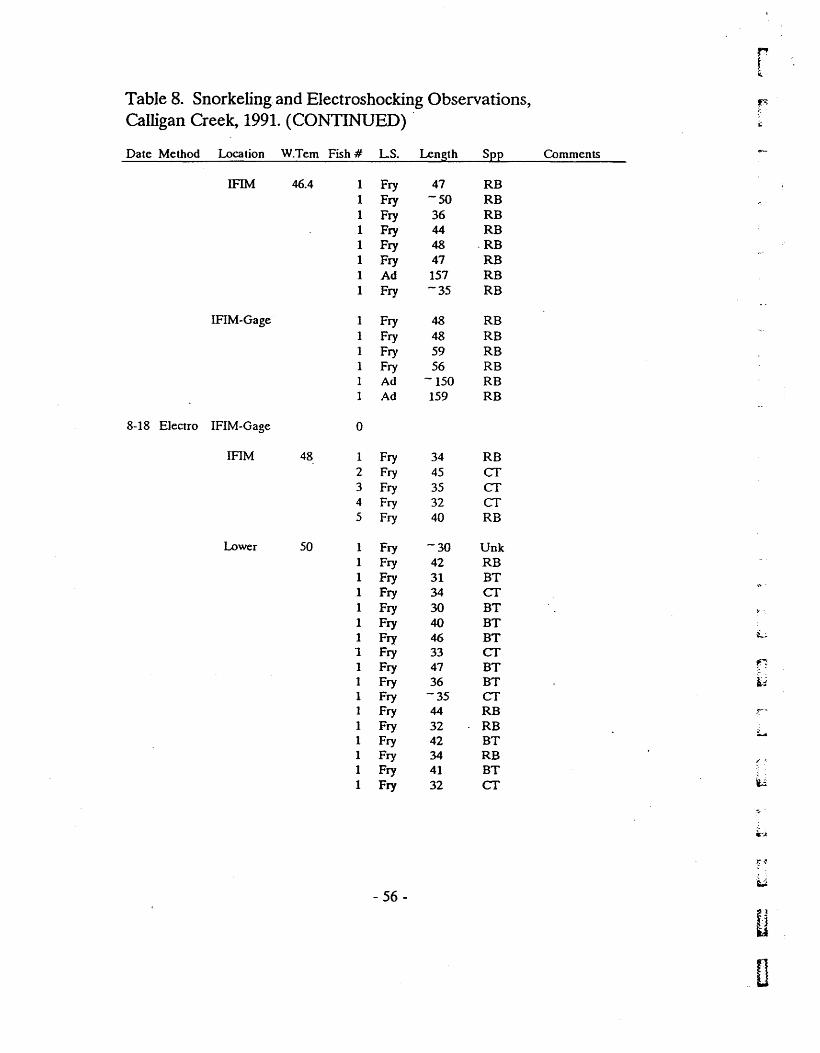
Table 8 Summarizes trout fry observations in Calligan Creek. We conducted a length frequency analysis and charted emergence timing of those trout we observed in the bypass reach. CES excluded those fish captured near the lake outlet from the analysis.
We measured and identified all captured trout fry, when possible. In some cases, fry escaped before we could determine the species and length. In these instances, we estimated the length, left the species unknown, and excluded the ·observation from species-specific analysis. We did conduct an analysis, however, where we included all fish observed, regardless of species.
Figure 4 portrays cumulative emergence timing of rainbow trout in Calligan Creek by size classes (3Smm, 40mm and 45mm, N = 62). We used the central 80% of the run timing curves~ discarding the "tails." Using this methodology, we determined the
- 31 -

r TABLE 6. AIR AND WATER TEMPERATURE DATA., t
UPPER CALLIGAN CREEK, 1991. ~
UPPER CALLIGAN CREEK April 1991 ':"
Air H2o Air H2o 04-15-91 Min 37.55 4238 04-21-91 Min 38.50 43.05
Avg 4221 43.22 Avg 44.94 46.31 Max 48.61 44.74 Max 53.87 49.70
04-16-91 Min 32.09 41.39 04-22-91 Min 41.07 43.05 Avg 40.44 43.21 Avg 42.34 46.20 Max 50.07 45.43 Max 43.72 47.53
04-17-91 Min 33.Z1 41.39 04-23-91 Min 34.17 45.77 Avg 40.31 43.49 Avg 41.14 46.99 Max 47.53 46.82 Max 46.47 48.61
04-18-91 Min 31.50 39.77 04-24-91 Min 33.27 45.08 Avg 40.40 43.17 Avg 36.82 46.06 Max 51.56 47.18 Max 41.72 47.18
04-19-91 Min 34.17 42.38 04-25-91 Min 32.38 44.40 Avg 42.66 45.97' Avg 34.80 45.26 Max 53.09 50.44 Max 38.18 46.47
04-20-91 Min 36.31 44.06 04-26-91 Min 32.38 44.40 Avg 44.83 46.96 . Avg 36.51 46.15 Max 57.91 50.07 Max 4139 49.33
04-27-91 Min 32.68 43.72 Avg 37.00 44.93 Max 41.07 46.12 jT~ -.:
04-28-91 Min 33.87 44.40 iL:
Avg 37.75 45.18 r: Max 41.07 45.77 :r .~ itd
04-29-91 Min 34.78 43.38 39.13 44.47
::~
Avg Max 44.40 45.77 -
04-30-91 Min 32.98 43.38 : :
Avg 41.74 47.11 b Max 53.87 51.94
" ..... 1 ~
U
- 32- U ~~ :. t
fj
: t ... ~
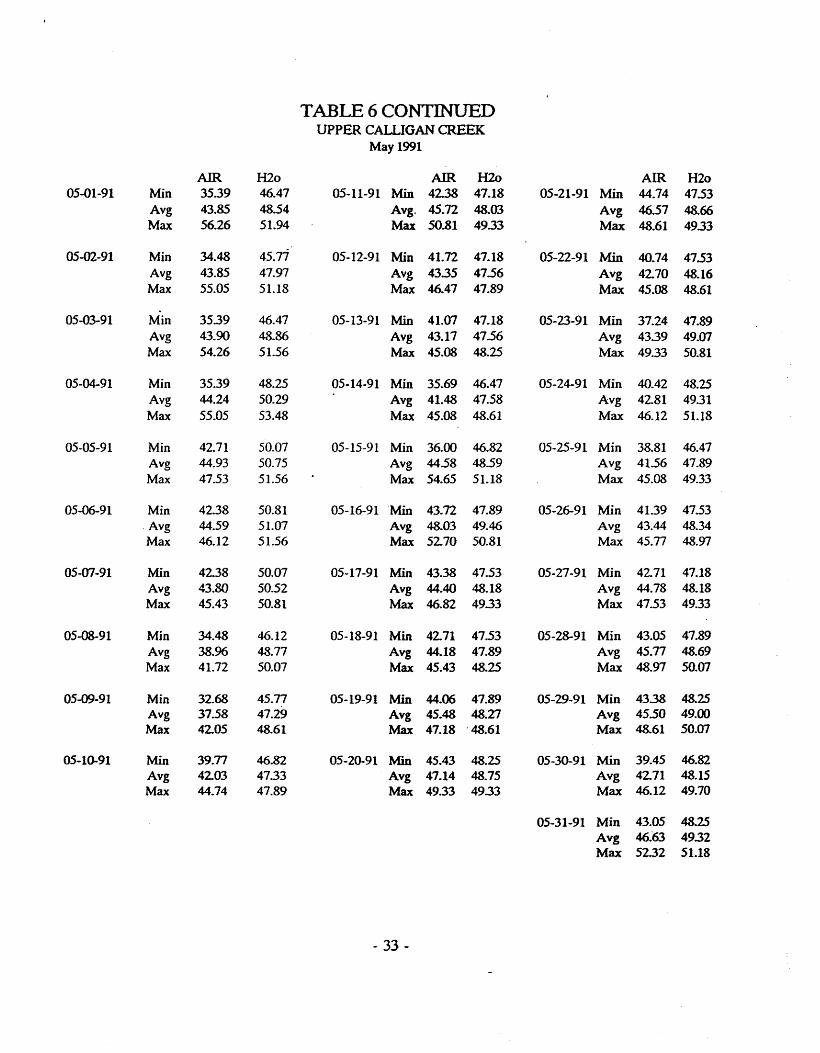
TABLE 6 CONTINUED UPPER CALLIGAN CREEK.
May 1991
AIR H2o AIR H2o AIR H2o 05-01-91 Min 35.39 46.47 05-11-91 Min 42.38 47.18 05-21-91 Min 44.74 47.53
Avg 43.85 48.54 Avg. 45.12 48.03 Avg 46.51 48.66 Max 56.26 51.94 Max 50.81 4933 Max 48.61 4933
05-02-91 Min 34.48 45.77 05-12-91 Min 41.12 41.18 05-22-91 Min 40.74 41.53 Avg 43.85 47.97 Avg 43.35 47.56 Avg 4270 48.16 Max 55.05 51.18 Max 46.47 47.89 Max 45.08 48.61
05-03-91 Min 35.39 46.47 05-13-91 Min 41.07 41.18 05-23-91 Min 37.24 41.89 Avg 43.90 48.86 Avg 43.11 47.56 Avg 4339 49.07 Max 54.26 51.56 Max 45.08 48.25 Max 49.33 50.81
05-04-91 Min 35.39 48.25 05-14-91 Min 35.69 46.47 05-24-91 Min 40.42 48.25 Avg 44.24 50.29 Avg 41.48 47.58 Avg 4281 49.31 Max 55.05 53.48 Max 45.08 48.61 Max 46.12 51.18
05-05-91 Min 42.71 50.07 05-15-91 Min 36.00 46.82 05-25-91 Min 38.81 46.47 Avg 44.93 50.75 Avg 44.58 48.59 Avg 41.56 47.89 Max 47.53 51.56 Max 54.65 51.18 Max 45.08 49.33
05-06-91 Min 42.38 50.81 05-16-91 Min 43.72 47.89 05-26-91 Min 41.39 47.53 - Avg 44.59 51.07 Avg 48.03 49.46 Avg 43.44 48.34 Max 46.12 51.56 Max 5270 50.81 Max 45.77 48.97
05-07-91 Min 4238 50.07 05-17-91 Min 43.38 47.53 05-27-91 Min 42.71 47.18 Avg 43.80 50.52 Avg 44.40 48.18 Avg 44.78 48.18 Max 45.43 50.81 Max 46.82 49.33 Max 47.53 49.33
05-08-91 Min 34.48 46.12 05-18-91 Min 4211 47.53 05-28-91 Min 43.05 47.89 Avg 38.96 48.77 Avg 44.18 47.89 Avg 45.77 48.69 Max 41.72 50.07 Max 45.43 48.25 Max 48.97 50.01
05-09-91 Min 32.68 45.77 05-19-91 Min 44.06 47.89 05-29-91 Min 43.38 48.25 Avg 37.58 47.29 Avg 45.48 48.27 Avg 45.50 49.00 Max 4205 48.61 Max 47.18 . 48.61 Max 48.61 50.07
05-10-91 Min 39.77 46.82 05-20-91 Min 45.43 48.25 05-30-91 Min 39.45 46.82 Avg 4203 47.33 Avg 47.14 48.75 Avg 4271 48.15 Max 44.74 47.89 Max 49.33 4933 Max 46.12 49.70
05-31-91 Min 43.05 48.25 Avg 46.63 4932 Max 5232 51.18
- 33 -
r !';
TABLE 6 CONTINUED lit.
UPPER CALLIGAN CREEK ~ June 1991 .... ~
Air H2O Air H2O Air H2O 06-01-91 Min 42.71 48.61 06-11-91 Min 42.38 52.32 06-21-91 Min 45.08 52.70 !'
Avg 49~13 50.48 Avg 45.71 53.32 Avg 47.12 53.22 Max 56.26 52.70 Max 53.48 55.05 Max 49.33 53.87
06-02-91 Min 42.0S 48.97 06-12-91 Min 4205 52.32 06-22-91 Min 46.82 53.48 Avg 4S.87 51.10 Avg 43.40 52.62 Avg 48.83 53.76 Max 47.53 52.32· Max 4S.77 53.48 Max 51.18 54.26
. 06-03-91 Min 36.00 48.61 06-13-91 Min 40.42 51.56 06-23-91 Min 47.53 5232
Avg 39.99 49.77 Avg 42.55 5227 Avg 50.11 53.97 Max 44.06 51.94 Max 46.47 53.48 Max 53.09 55.05
..:,
06-04-91 Min 3S.08 49.33 06-14-91 Min 41.07 51.56 06-24-91 Min 43.72 52.70 Avg 41.36 50.22 Avg 44.06 52.27 Avg 49.73 53.82 Max 45.77 51.56 Max '47.53 53.09 Max 53.87 55.05
06-05-91 Min 35.08 48.25 06-15-91 Min 41.72 51.18 06-25-91 Min 48.61 52.70 Avg 45.69 50.87 Avg 46.38 52.1S Avg 50.07 53.45 Max 55.45 54.26 Max 50.81 53.09 Max 51.56 54.26
06-06-91 Min 46.82 50.81 06-16-91 Min 42.05 51.18 06-26-91 Min 47.18 53.09 Avg 50.11 52.13 Avg 43.61 51.43 Avg 49.38 53.84 Max 53.48 53.48 Max 44.74 51.94 Max 51.94 54.65
06-07-91 Min 46.82 50.81 06-17-91 Min 42.71 49.70 06-27-91 Min 45.43 53.09 Avg 47.77 51.97 Avg 46.22 SO.73 Avg 53.55 55.44 Max 48.97 52.70 Max 51.18 51.56 Max 61.35 58.75
06-08-91 Min 44.40 50.44 06-18-91 Min 39.13 49.33 06-28-91 Min 48.25 53.48 Avg 48.03 51.47 Avg 48.90 51.52 Avg 55.16 57.19 Max 51.56 53.09 Max 59.18 53.87 Max 61.80 60.47 L
06-09-91 Min 42.05 51.18 06-19-91 Min 45.43 50.44 06-29-91 Min 4933 56.67 r~· .... ,:
-:Avg 50.27 52.89 Avg 51.92 5298- Avg 51.07 57.75 5;
~'* Max 59.18 55.86 Max 59.18 55.86 Max 53.87 58.33 ~
06-10-91 Min 45.77 51.94 06-20-91 Min 46.12 5270 06-30-91 Min 47.89 56.26 ~. ~
~ :
Avg 53.50 54.17 Avg 47.12 51.69 58.23 ..
53.19 Avg Max 61.35 57.08 Max 49.70 53.48 Max 56.67 60.91
i~ i4 ~.
~; .: ~
r.-"
;;. ~ -- 34 - l--l
U
U ~ ~
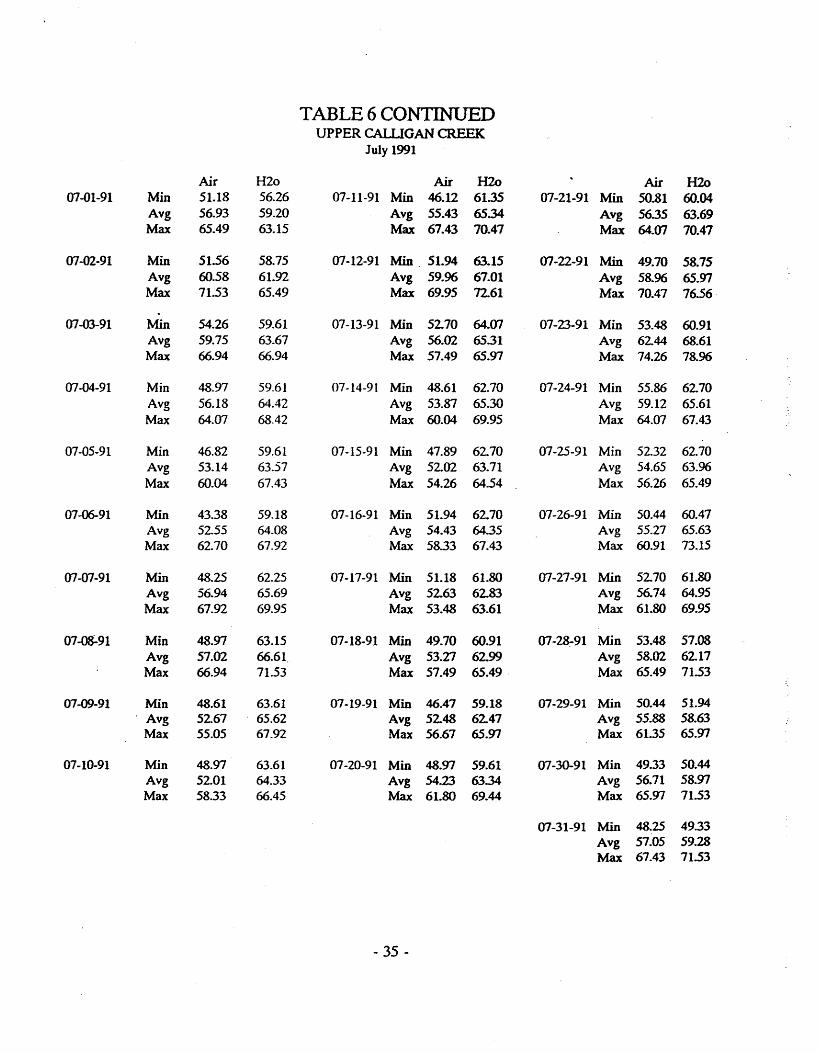
TABLE 6 CONTINUED UPPER CAWGAN CREEK
July 1991
Air H2o Air H2o Air H2o 07-01-91 Min 51.18 56.26 07-11-91 Min 46.12 61.35 07-21-91 Min 50.81 60.04
Avg 56.93 59.20 Avg 55.43 65.34 Avg 56.35 63.69 Max 65.49 63.15 Max 67.43 70.47 Max 64.07 70.47
07-02-91 Min 51.56 58.75 07-12-91 Min 51.94 63.15 07-22-91 Min 49.70 58.75 Avg 60.58 61.92 Avg 59.96 67.01 Avg 58.96 65.97 Max 71.53 65.49 Max 69.95 72.61 Max 70.47 76.56
07-03-91 Min 54.26 59.61 07-13-91 Min 52.70 64.07 07-23-91 Min 53.48 60.91 Avg 59.75 63.67 Avg 56.02 65.31 Avg 6244 68.61 Max 66.94 66.94 Max 57.49 65.97 Max 74.26 78.96
07-04-91 Min 48.97 59.61 07-14-91 Min 48.61 62.70 07-24-91 Min 55.86 6270 Avg 56.18 64.42 Avg 53.87 6530 Avg 59.12 65.61 Max 64.07 68.42 Max 60.04 69.95 Max 64.07 67.43
07-05-91 Min 46.82 59.61 07-15-91 Min 47.89 6270 07-25-91 Min 5232 6270 Avg 53.14 63.57 Avg 5202 63.71 Avg 54.65 63.96 Max 60.04 67.43 Max 54.26 64.54 Max 56.26 65.49
07-06-91 Min 43.38 59.18 07-16-91 Min 51.94 62.70 07-26-91 Min 50.44 60.47 Avg 52.55 64.08 Avg 54.43 64.35 Avg 55.27 65.63 Max 62.70 67.92 Max 58.33 67.43 Max 60.91 73.15
07-07-91 Min 48.25 62.25 07-17-91 Min 51.18 61.80 (J1-27-91 Min 5270 61.80 Avg 56.94 65.69 Avg 52.63 62.83 Avg 56.74 64.95 Max 67.92 69.95 Max 53.48 63.61 Max 61.80 69.95
07-08-91 Min 48.97 63.15 07-18-91 Min 49.70 60.91 (J1-28:-91 Min 53.48 57.08 Avg 57.02 66.61 Avg 53.V 62.99 Avg 58.02 6217 Max 66.94 71.53 Max 57.49 65.49 . Max 65.49 71.53
07-09-91 Min 48.61 63.61 07-19-91 Min 46.47 59.18 07-29-91 Min 50.44 51.94 Avg 5267 65.62 Avg 52.48 62.47 Avg 55.88 58.63 Max 55.05 67.92 Max 56.67 65.97 Max 61.35 65.97
07-10-91 Min 48.97 63.61 07-20-91 Min 48.97 59.61 07-30-91 Min 49.33 50.44 Avg 52.01 64.33 Avg 54.23 63.34 Avg 56.71 58.97 Max 58.33 66.45 Max 61.80 69.44 Max 65.CJ7 71.53
07-31-91 Min 48.25 49.33 Avg 57.05 59.28 Max 67.43 71.53
- 35 -
r
TABLE 6 CONTINUED UPPER.CALLIGAN CREEK ..--
August 1991
Air H2O Air H2O Air H2O 08-01-91 Min 49.33 50.07 08-11-91 Min 50.44 51.18 08-21-91 Min 5232 5270
Avg 55.92 57.45 Avg 53.03 55.08 Avg 58.40 60..06 Max 63.61 67.43 Max 56.67 60.91 Max 66.94 71.00
08-02-91 Min 49.70 50.44 08-12-91 Min 46.12 47.18 08-22-91 Min 51.18. _ 51.94 Avg 57.22 58.93 Avg 53.58 55.97 Avg 57.90 59.60 Max 67.43 71.00 Max 60.47 65.01 Max 66.45 69.95
08-03-91 Min 51.56 52.32 08-13-91 Min 51.56 52.32 08-23-91 Min 49.33 50.44 Avg 58.77 60.59 Avg 56.57 58.76 Avg 5294 54.40 Max 68.42 72.61 Max 63.61 67.43 Max 57.08 60.47
08-04-91 Min 5232 53.09 08-14-91 Min 50.44 50.81 08-24-91 Min 46.12 46.47 Avg 58.40 60.30 Avg 57.13 59.12 Avg 50.88 52.38 Max 66.94 71.00 Max 65.97 69.95 Max 57.91 59.61
08-05-91 Min 51.56 51.94 08-15-91 Min 53.87 54.65 08-25-91 Min 42.38 47.18 Avg 56.21 57.72 Avg 60.31 6215 Avg 49.09 50.49 Max 60.04 62.70 Max 69.44 73.70 Max 57.91 53.87
08-06-91 Min 56.67 57.91 08-16-91 Min 54.65 55.45 08-26-91 Min 41.39 46.12 Avg 59.60 61.61 Avg 61.17 63.07 Avg 49.96 50.56 Max 64.07 67.92 Max 68.42 7261 Max 58.75 54.65
08-07-91 Min 57.08 58.33 08-17-91 MUl 55.86 56.67 08-27-91 Min 50.81 5270 Avg 60.54 62.20 Avg 6266 64.60 Avg 5272 53~55
Max 65.01 68.93 Max 71.00 74.83 Max 55.05 54.65
08-08-91 Min 57.91 58.75 08-18-91 Min 57.49 58.33 08-28-91 Min 49.33 51.56 Avg 6245 64.76 Avg 6337 65.14 Avg 50.86 5226 Max 71.00 74.83 Max 71.00 75.40 Max 51.56 5270 .;:. ~
08-09-91 Min 5270 53.87 08-19-91 Min 55.45 56.26 08-29-91 Min -50.44 , 51.94 f'~
-<Avg 56.33 57.48 Avg 61.95 63.76 Avg . 55.58 54.76 ' -•• :-1
Max 58.33 60.04 Max 7LOO 74.83 Max, 60.47 57.49 ":~-
I
08-10-91 50.81 53.09 Min 49.33 50.81 08-20-91 Min 53.87 54.65 08-30-91 Min ;.... Avg 51.73 53.06 Avg. 59.92 61.50 Avg 56.25 56.06 Max 53.87 56.26 Max 67.92 71.53 Max 60.47 57.91
" .
08-31-91 Min 50.81 5232 ~
Avg 54.17 55.08 Max 57.08 56.67
~
- 36 -
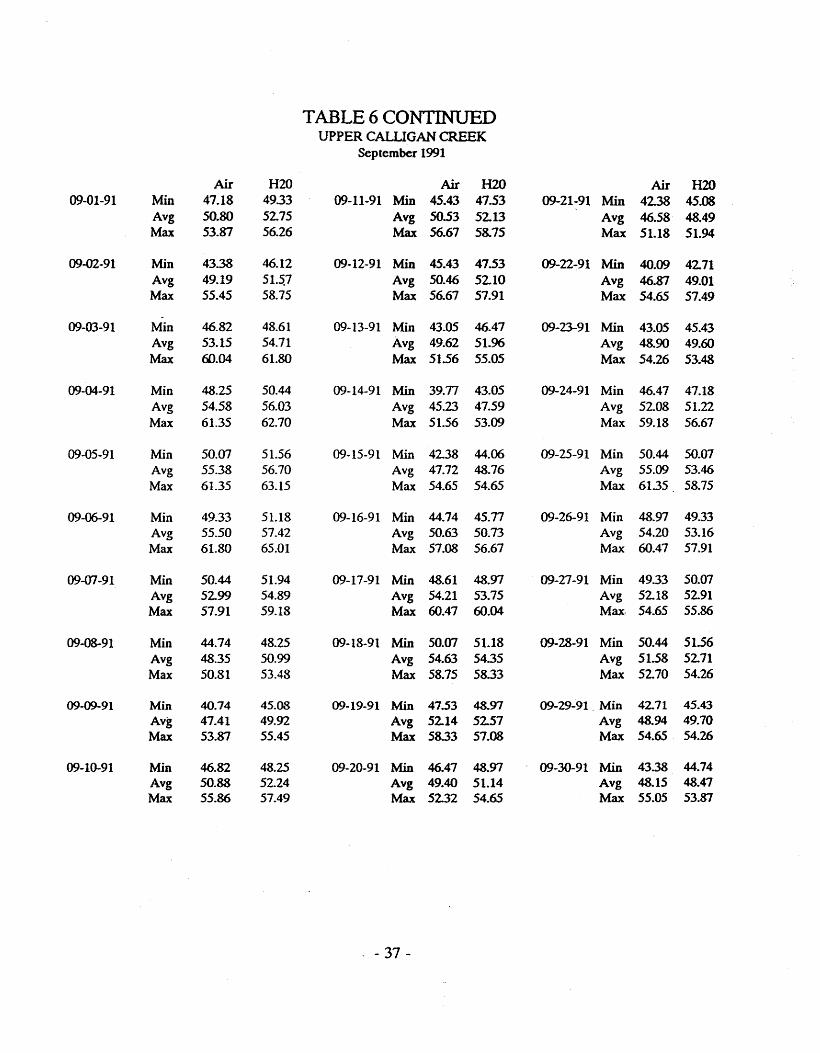
TABLE 6 CONTINUED UPPER CALLIGAN CREEK
September 1991
Air H2O Air H2O Air H2O 09-01-91 Min 47.18 4933 09-11-91 Min 45.43 47.53 09-21-91 Min 42.38 45.08
Avg 50.80 5275 Avg 50.53 5213 Avg 46.58 48.49 Max 53.87 56.26 Max 56.67 58.75 Max 51.18 51.94
09-02-91 Min 43.38 46.12 09-12-91 Min 45.43 47.53 09-22-:91 Min 40.09 4271 Avg 49.19 51.~7 Avg 50.46 5210 Avg 46.87 49.01 Max 55.45 58.75 Max 56.67 57.91 Max 54.65 57.49
09-03-91 Min 46.82 48.61 09-13-91 Min 43.05 46.47 09-23-91 Min 43.05 45.43 Avg 53.15 54.71 Avg 49.62 51.96 Avg 48.90 49.60 Max 60.04 61.80 Max 51.56 55.05 Max 54.26 53.48
09-04-91 Min 48.25 50.44 09-14-91 Min 39.77 43.05 09-24-91 Min 46.47 47.18 Avg 54.58 56.03 Avg 45.23 47.59 Avg 5208 51.22 Max 61.35 62.70 Max 51.56 53.09 Max 59.18 56.67
09-05-91 Min 50.07 51.56 09-15-91 Min 4238 44.06 09-25-91 Min 50.44 50.07 Avg 55.38 56.70 Avg 47.72 48.76 Avg 55.09 53.46 Max 61.35 63.15 Max 54.65 54.65 Max 61.35 58.75
09-06-91 Min 49.33 51.18 09-16-91 Min 44.74 45.77 09-26-91 Min 48.97 49.33 Avg 55.50 57.42 Avg 50.63 50.73 Avg 54.20 53.16 Max 61.80 65.01 Max 57.08 56.67 Max 60.47 57.91
09-07-91 Min 50.44 51.94 09-17-91 Min 48.61 48.97 09-27-91 Min 4933 50.07 Avg 5299 54.89 Avg 54.21 53.75 Avg 5218 5291 Max 57.91 59.18 Max 60.47 60.04 Max- 54.65 55.86
09-08-91 Min 44.74 48.25 09-18-91 Min 50.07 51.18 09-28-91 Min 50.44 51.56 Avg 48.35 50.99 Avg 54.63 5435 Avg 51.58 5271 Max 50.81 53.48 Max 58.75 5833 Max 52.70 54.26
09-09-91 Min 40.74 45.08 09-19-91 Min 47.53 48.97 09-29-91 _ Min 42.71 45.43 Avg 47.41 49.92 Avg 5214 52.57 Avg 48.94 49.70 Max 53.87 55.45 Max 58.33 57.08 Max 54.65 54.26
09-10-91 Min 46.82 48.25 09-20-91 Min 46.47 48.97 09-30-91 Min 43.38 44.74 Avg 50.88 52.24 Avg 49.40 51.14 Avg 48.15 48.47 Max 55.86 57.49 Max 5232 54.65 Max 55.05 53.87
, - 37-
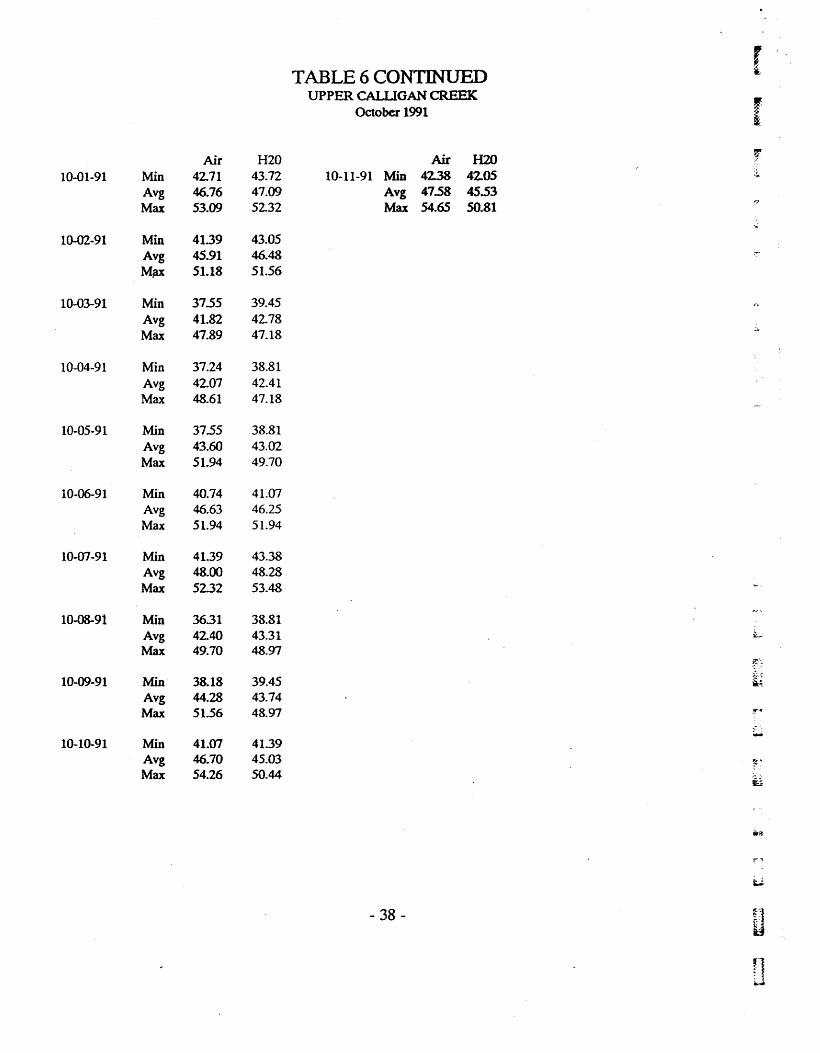
TABLE 6 CONTINUED I: UPPER CALLIGAN CREEK ,
October 1991 i
Air H2O Air H2O r 10-01-91 Min 4271 43.72 10-11-91 Min 4238 4205 :~
Avg 46.76 47.09 Avg 47.58 45.53 Max 53.09 5232 Max 54.65 50.81
10-02-91 Min 41.39 43.05 Avg 45.91 46.48 M~ 51.18 51.56
10-03-91 Min 37.55 39.45 Avg 41.82 42.78 Max 47.89 47.18
.;:..
10-04-91 Min 37.24 38.81 Avg 4207 42.41 Max 48.61 47.18
10-05-91 Min 3755 38.81 Avg 43.60 43.02 Max 51.94 49.70
10-06-91 Min 40.74 41.07 Avg 46.63 46.25 Max 51.94 51.94
10-07-91 Min 41.39 43.38 Avg 48.00 48.28 Max 5232 53.48
1 0-08-9 i Min 36.31 38.81 Avg 4240 43.31 :L
Max 49.70 48.91 ~";
10-09-91 Min 38.18 39.45 );.' ii;.
Avg 44.28 43.74 Max 51.56 48.91 -:r-"
,- "-.... 10-10-91 Min 41.07 41.39
Avg 46.70 45.03 ~r Max 54.26 50.44
!i1
- 38-
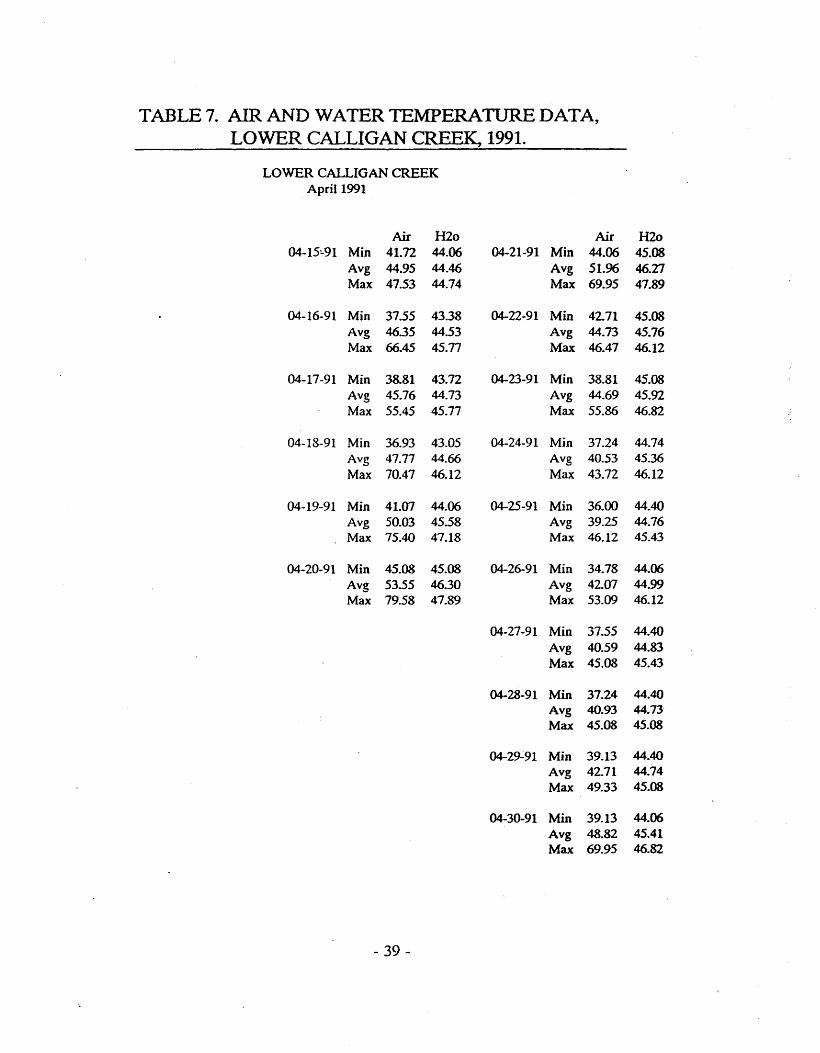
TABLE 7. AIR AND WATER TEMPERATURE DATA, LOWER CALLIGAN CREEK, 1991.
LOWER CALLIGAN CREEK April 1991
Air H2o Air H2o 04-15-;.91 Min 41.n 44.06 04-21-91 Min 44.06 45.08
Avg 44.95 44.46 Avg 51.96 46.27 Max 47.53 44.74 Max 69.95 47.89
04-16-91 Min 37.55 43.38 04-22-91 Min 42.71 45.08 Avg 4635 44.53 Avg 44.73 45.76 Max 66.45 45.77 Max 46.47 46.12
04-17-91 Min 38.81 43.72 04-23-91 Min 38.81 45.08 Avg 45.76 44.73 Avg 44.69 45.92 Max 55.45 45.77 Max 55.86 46.82
04-18-91 Min 36.93 43.05 04-24-91 Min 37.24 44.74 Avg 47.77 44.66 Avg 40.53 45.36 Max 70.47 46.12 Max 43.72 46.12
04-19-91 Min 41.07 44.06 04-25-91 Min 36.00 44.40 Avg 50.03 45.58 Avg 39.25 44.76 Max 75.40 47.18 Max 46.1"2 45.43
04-20-91 Min 45.08 45.08 04-26-91 Min 34.78 44.06 Avg 53.55 4630 Avg 42.07 44.99 Max 79.58 47.89 Max 53.09 46.12
04-27-91 Min 37.55 44.40 Avg 40.59 44.83 Max 45.08 45.43
04-28-91 Min 37.24 44.40 Avg 40.93 44.73' Max 45.08 45.08
04-29':91 Min 39.13 44.40 Avg 42.71 44.74 Max 49.33 45.08
04-30-91 Min 39.13 44.06 Avg 48.82 45.41 Max 69.95 46.82
- 39-

r
TABLE 7 CONTINUED LOWER CALLIGAN CREEK .. '
May 1991
Air H2o Air H2o Air H2o 05-01-91 Min 42.71 45.08 05-11-91 Min 44.74 45.77 05-21-91 Min 46.47 46.47
Avg 52.21 46.08 Avg 48.46 46.25 Avg 48.49 46.85 Max 74.26 47.53 Max 55.05 47.18 Max 51.56 47.18
05-02-91 Min 42.38 44.74 05-12-91 Min 44.40 45.77 05-22-91 Min 42.38 46.12 Avg 51.56 45.95 Avg 45.81 45.95 Avg 45.49 46.22 Max 73.15 47.18 Max 48.25 46.47 Max 50.44 46.47
05-03-91 Min 42.71 45.08 05-13-91 Min 43.38 45.77 05-23-91 Min 41.72 45.77 Avg 51.09 46.17 Avg 45.75 46.00 Avg 47.90 46.40 Max 67.92 47.53 Max 49.70 46.47 Max 58.33 47.18
05-04-91 Min 40.09 45.43 05-14-91 Min 39.77 45.43 05-24-91 Min 42.05 45.77 Avg 50.78 46.57 Avg 45.00 45.93 Avg 46.74 46.50 Max 70.47 47.89 Max 50.07 46.47 Max 59.61 47.18
05-05-91 Min 45.43 46.47 05-15-91 Min 40.42 45.08 05-25-91 Min 41.07 45.43 Avg 47.93 46.81 Avg 49.90 46.39 Avg 44.20 46.25 Max 51.18 47.18 Max 66.94 47.89 Max 48.97 46.82
05-06-91 Min 44.74 46.82 05-16-91 Min 46.47 46.12 05-26-91 Min 43.72 46.47 Avg 46.98 47.05 Avg 50.71 46.85 Avg 45.90 46.68 Max 49.70 47.18 Max 57.08 47.53 Max 48.97 47.18
05-07-91 Min 44.06 47.18 05-17-91 Min 45.43 46.12 05-27-91 Min 45.08 46.12 Avg 46.12 47.34 Avg 46.33· 46.32 Avg 47.14 46.62 Max 49.33 47.53 Max 48.25 46.82 Max 52.70 47.18
05-08-91 Min 38.18 45.43 05-18-91 Min 44.74 46.12 05-28-91 Min 45.08 46.12 Avg 42.80 46.71 Avg 46.23 46.31 Avg 48.37 46.71 Max 47.89 47.18 Max 47.89 46.47 Max 56.67 47~18
05-09-91 Min 36.93 44.74 05-19-91 Min 45.77 46.47 05-29-91 Min 45.08 46.47 Avg 41.38 45.63 Avg 47.53 46.65 Avg 48.12 46.69
;" :.""
t"(
Max 46.47 46.47 Max 49.33 46.82 Max 54.65 47.18
05-10-91 Min 41.72 45.77 05-20-91 Min 46.82 46.47 05-30-91 Min 41.72 45.77 Avg 44.61 45.93 Avg 49.04 46.99 Avg 46.20 46.30 Max 47.53 46.12 Max 52.32 . 47.18 Max 53.87 46.82 ~ :
05-31-91 Min 45.08 46.47 ~:t
Avg 50.49 46.93 Max 64.07 47.89
~4
. ,
U
- 40 - U n
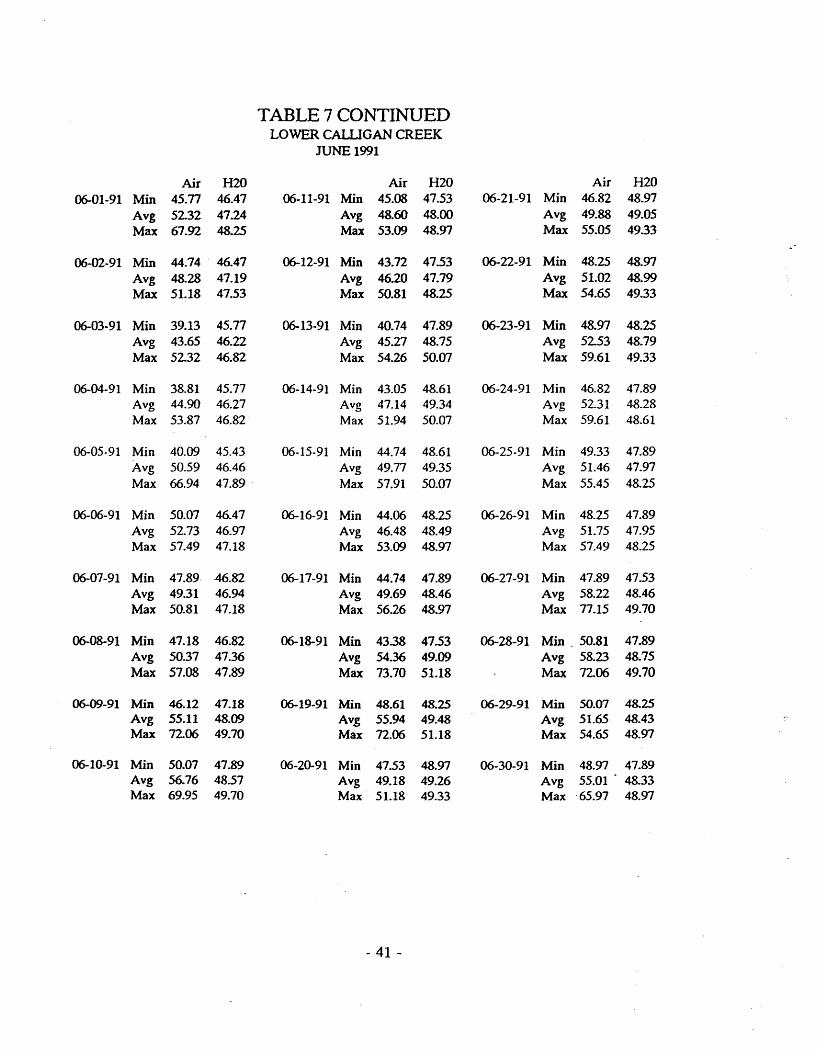
TABLE 7 CONTINUED LOWER CAUUGAN CREEK
JUNE 1991
Air H2O Air H2O Air H2O 06-01-91 Min 45.77 46.47 06-11-91 Min 45.08 47.53 06-21-91 Min 46.82 48.97
Avg 52.32 47.24 Avg 48.60 48.00 Avg 49.88 49.05 Max 67.92 48.25 Max 53.09 48.97 Max 55.05 49.33
06-02-91 Min 44.74 46.47 06-12-91 Min 43.72 47.53 06-22-91 Min 48.25 48.97 Avg 48.28 47.19 Avg 46.20 47.79 Avg 51.02 48.99 Max 51.18 47.53 Max 50.81 48.25 Max- 54.65 4933
06-03-91 Min 39.13 45.77 06-13-91 Min 40.74 47.89 06-23-91 Min 48.97 48.25 Avg 43.65 46.22 Avg 45.27 48.75 Avg 52.53 48.79 Max 52.32 46.82 Max 54.26 50.07 Max 59.61 4933
06-04-91 Min 38.81 45.77 06-14-91 Min 43.05 48.61 06-24-91 Min 46.82 47.89 Avg 44.90 46.27 Avg 47.14 49.34 Avg 52.31 48.28 Max 53.87 46.82 Max 51.94 50.07 Max 59.61 48.61
06-05-91 Min 40.09 45.43 06-15-91 Min 44.74 48.61 06-25-91 Min 49.33 47.89 Avg 50.59 46.46 Avg 49.77 49.35 Avg 51.46 47.97 Max 66.94 47.89 - Max 57.91 SO.07 Max 55.45 48.25
06-06-91 Min 50.07 46.47 06-16-91 Min 44.06 48.25 06-26-91 Min 48.25 47.89 Avg 52.73 46.97 Avg 46.48 48.49 Avg 51.75 47.95 Max 57.49 47.18 Max 53.09 48.97 Max 57.49 48.25
06-07-91 Min 47.89- 46.82 06-17-91 Min 44.74 47.89 06-27-91 Min 47.89 47.53 Avg 4931 46.94 Avg 49.69 48.46 Avg 58.22 48.46 Max 50.81 47.18 Max 56.26 48.97 Max 77.15 49.70
06-08-91 Min 47.18 46.82 06-18-91 Min 43.38 47.53 06-28-91 Min 50.81 47.89 Avg 50.37 47.36 Avg 54.36 49.09 Avg 58.23 48.75 Max 57.08 47.89 Max 73.70 51.18 Max 72.06 49.70
06-09-91 Min 46.12 47.18 06-19-91 Min 48.61 48.25 06-29-91 Min 50.07 48.25 Avg 55.11 48.09 Avg 55.94 49.48 Avg 51.65 48.43 Max 72.06 49.70 Max n.06 51.18 Max 54.65 48.97
06-10-91 Min 50.07 47.89 06-20-91 Min 4753 48.97 06-30-91 Min 48.97 47.89 Avg 56.76 48.57 Avg 49.18 49.26 Avg 55.01 . 4833 Max 69.95 49.70 Max 51.18 49.33 Max -65.97 48.97
- 41 -
'"
r I
TABLE 7 CONTINUED r-
LOWER CALLIGAN CREEK July 1991
Air H2O Air H2O Air H2O 07-01-91 Min 5232 48.25 07-11-91 Min 50.44 47.53 07-21-91 Min 50.81 45.77
Avg 60.94 48.78 Avg 60.49 48.15 Avg 58.38 46.05 Max 79.58 50.07 Max 8213 48.97 Max 73.15 46.47
07-02-91 Min 54.65 48.25 07·12·91 Min 53.87 47.89 07-22-91 Min 51.56 45.77 Avg 6432 4939 Avg 63.78 48.40 Avg 61.57 46.21 Max 86.23 50.81 Max 84.14 48.97 Max 83.46 47.18
07-03-91 Min 55.05 48.97 07-13-91 Min 5232 47.53 07-23-91 Min 5833 46.12 Avg 63.88 49.72 Avg 56.20 47.97 Avg 66.75 46.60 Max 83.46 50.81 Max 60.91 48.61 Max 89.16 47.53
07-04-91 Min 51.18 48.61 07-14-91 Min 47.89 47.18 07-24-91 Min 54.65 46.12 Avg 61.04 49.20 Avg 57.15 47.36 Avg 59.48 46.19 Max 79.58 50.07 Max 75.40 47.89 Max 67.43 46.47
07-05-91 -Min 49.33 48.25 07-15-91 Min 48.61 46.47 07-25-91 Min 51.18 45.77 Avg 57.55 48.67 Avg 52.55 46.84 Avg 53.94 45.77 Max 73.70 49.70 Max 55.05 47.18 Max 58.33 45.77
07-06-91 Min 46.47 47.89 07-16-91 Min 51.18 46.82 07-26-91 Min 49.33 45.43 Avg 57.69 48.72 Avg 55.18 46.88 Avg 57.65 45.80 Max 77.15 49.70 Max 65.49 47.18 Max 74.83 46.47
07·07·91 Min 50.81 48.61 07-17-91 Min 50.44 46.12 07-27-91 Min 51.56 45.43 Avg 61.40 49.40 Avg 53.09 46.47 Avg - 57.79 45.89 Max 8279 50.44 Max 55.86 46.82 Max 71.00 46.47
07-08-91 Min 51.56 48.61 07-18-91 Min 4933 46.12 07-28-91 Min 52.32 45.77 Avg 61.86 49.46 Avg 54.63 46.24 Avg 60.40 46.09 Max 81.48 50.44 Max 63.15 46.47 Max 79.58 46.82 L
07-09-91 _Min 50.07 48.61 07-19-91 Min 47.53 45.77 07-29-91 Min 50.07 45.43 !?\:
Avg 54.26 48.79 Avg 53.32 45.99 Avg 57.54 45.89 .~:.
it.; -Max 57.91 4933 Max 60.91 46.12 Max 7206 46.47
7'-~
07-10-91 Min 49.33 47.89 07-20-91 Min 49.33 45.77 07-30-91 Min 49.70 45.43 Avg 53.68 48.16 Avg 57.17 45.99 Avg 59.25 45.95
M
Max 6225 48.61 Max 74.26 46.47 Max 80.84 46.82 ~.-;
07-31-91 Min 5232 45.43 ~ Avg 6133 46.02 Max 84.14 46.82
W
~: ........ ~
tl - 42 -
U
n
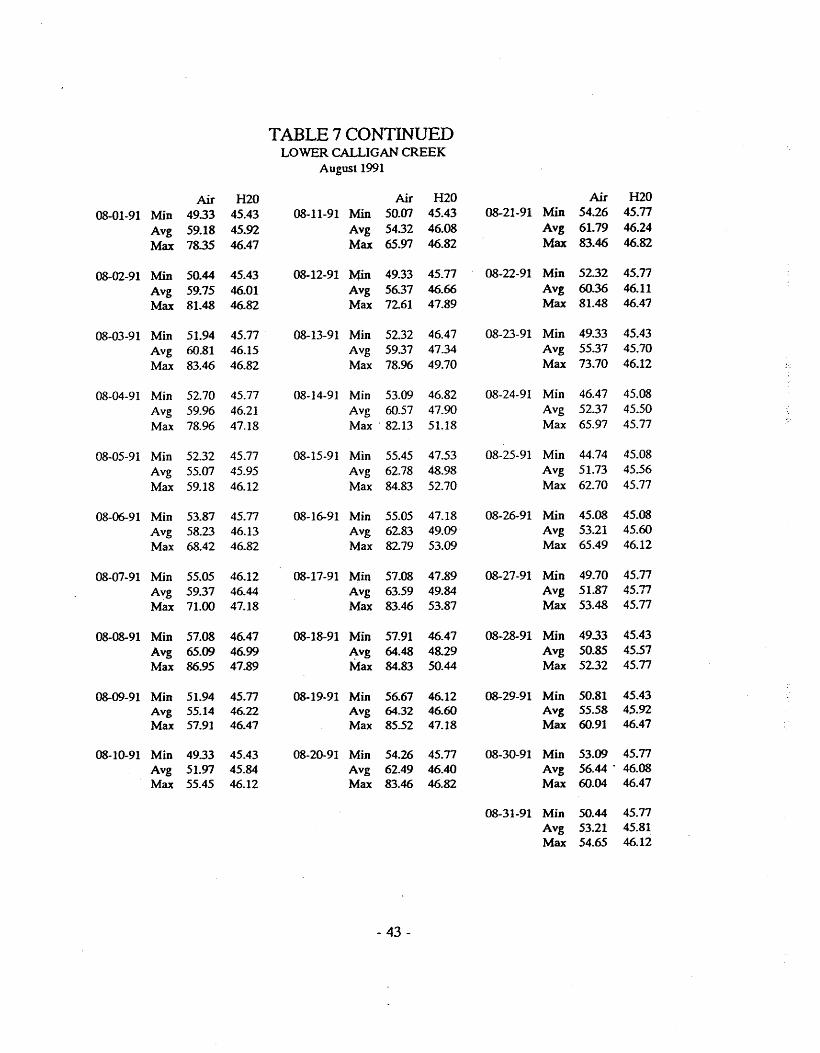
TABLE 7 CONTINUED LOWER CALLIGAN CREEK
August 1991
Air H2O Air H2O Air H2O
08-01-91 Min 4933 45.43 08-11-91 Min 50.07 45.43 08-21-91 Min 54.26 45.77
Avg 59.18 45.92 Avg 5432 46.08 Avg 61.79 46.24
Max 7835 46.47 Max 65.97 46.82 Max 83.46 46.82
08-02-91 Min 50.44 45.43 08-12-91 Min 49.33 45.77 08-22-91 Min 52.32 45.77
Avg 59.75 46.01 Avg 56.37 46.66 Avg 60.36 46.11
Max 81.48 46.82 Max 72.61 47.89 Max 81.48 46.47
08-03-91 Min 51.94 45.77 08-13-91 Min 52.32 46.47 08-23-91 Min 49.33 45.43
Avg 60.81 46.15 Avg 59.37 47.34 Avg 55.37 45.70
Max 83.46 46.82 Max 78.96 49.70 Max 73.70 46.12
08-04-91 Min 52.70 45.77 08-14-91 Min 53.09 46.82 08-24-91 Min 46.47 45.08
Avg 59.96 46.21 Avg 60.57 47.90 Avg 52.37 45.50
Max 78.96 47.18 Max·82.13 51.18 Max 65.97 45.77
08-05-91 Min 52.32 45.77 08-15-91 Min 55.45 47.53 08-25-91 Min 44.74 45.08
Avg 55.07 45.95 Avg 62.78 48.98 Avg 51.73 45.56
Max 59.18 46.12 Max 84.83 52.70 Max 62.70 45.77
08-06-91 Min 53.87 45.77 08-16-91 Min 55.05 47.18 08-26-91 Min 45.08 45.08 Avg 58.23 46.13 Avg 62.83 49.09 Avg 53.21 45.60 Max 68.42 46.82 Max 82.79 53.09 Max 65.49 46.12
08-07-91 Min 55.05 46.12 08-17-91 Min 57.08 47.89 08-27-91 Min 49.70 45.77
Avg 59.37 46.44 Avg 63.59 49.84 Avg 51.87 45.77
Max 71.00 47.18 Max 83.46 53.87 Max 53.48 45.77
08-08-91 Min 57.08 46.47 08-18-91 Min 57.91 46.47 08-28-91 Min 4933 45.43
Avg 65.09 46.99 ~vg 64.48 48.29 Avg 50.85 45.57 Max 86.95 47.89 Max 84.83 50.44 Max 52.32 45.77
08-09-91 Min 51.94 45.77 08-19-91 Min 56.67 46.12 08-29-91 Min 50.81 45.43 Avg 55.14 46.22 Avg 64.32 46.60 Avg 55.58 45.92 Max 57.91 46.47 Max 85.52 47.18 Max 60.91 46.47
08-10-91 Min 49.33 45.43 08-20-91 Min 54.26 45.77 08-30-91 Min 53.09 45.77 Avg 51.97 45.84 Avg 62.49 46.40 Avg 56.44 . 46.08
Max 55.45 46.12 Max 83.46 46.82 Max 60.04 46.47
08-31-91 Min 50.44 45.77 Avg 53.21 45.81 Max 54.65 46.12
- 43 -
n j:' : c" -:i~
TABLE 7 CONTINUED ~
LOWER CALLIGAN CREEK ;. September 1991
t.-'
Air H2O Air H2O Air H2O 09-01-91 Min 48.97 45.43 09-11-91 Min 48.97 45.43 09-21-91 Min 44.40 45.08
Avg 51.33 45.63 Avg 55.01 45.79 Avg 50.15 4536 Max 60.04 46.12 Max 79.58 46.47 Max 73.15 45.TI
09-02-91 Min 46.47 45.43 09-12-91 Min 47.18 45.43 09-22-91 Min 42.71 45.08 Avg 52.83 45.73 Avg 53.82 45.70 Avg 49.41 45.33 Max 76.56 46.47 Max 73.70 46.12 Max 57.91 45.77
09-03-91 Min 48.61 45.43 09-13-91 Min 46.47 45.43 09-23-91 Min 46.12 45.08 Avg 55.65 45.88 Avg 50.39 45.53 .Avg 52.69 45.50 Max 80.21 46.82 Max 56.26 45.77 Max 77.75 45.TI
09-04-91 Min 50.07 45.77 09-14-91 Min 43.72 45.08 09-24-91 Min 49.70 45.43 Avg 57.24 46.11 Avg 50.05 45.37 Avg 55.88 45.82 Max 80.84 46.82 Max 75.98 46.12 Max 80.84 46.47
09-05-91 Min 52.70 45.77 09-15-91 Min 46.47 45.08 09-25-91 Min 52.32 45.77 Avg 59.02 46.22 Avg 52.86 45.60 Avg 58.70 46.18 Max 84.14 46.82 Max 79.58 46.47 Max 83.46 46.82
09-06-91 Min 52.70 45.TI 09-16-91 Min 48.97 45.43 09-26-91 Min 54.26 46.12 Avg 57.56 46.18 Avg 55.27 45.78 Avg 59.27 46.24 Max 77.15 46.82 Max 81.48 46.82 Max 84.14 46.47
09-07-91 Min 50.07 45.77 09-17-91 Min 51.18 45.77 09-27-91 Min 50.44 45.43 Avg 52.45 45.84 Avg 57.30 46.09 Avg 51.87 45.76 Max 55.05 46.12 Max 78.96 46.82 Max 54.65 46.12
09-08-91 Min 46.47 45.43 09-18-91 Min 53.09 45.TI 09-28-91 Min SO.07 45.43 Avg 48.96 45.44 Avg 58.98 46.11 Avg SO.89 45.46 Max 5232 45.77 Max 84.14 46.47 Max 5232 45.77 ~
09-09-91 Min 44.06 45.08 09-19-91 Min 51.56 45.77 09-29-91 Min 46.47 45.08 !f~:_
Avg 51.36 45.50 Avg 57.53 45.97 Avg 52.30 45.54 ~ ~.
it-j Max 75.98 46.12 Max 84.83 46.47 Max 74.26 45.77
09-10-91 Min- 49.33 45.43 09-20-91 1mn 47.18 ~ .. ",
45.43 09-30-91 Min 46.82 45.43 Avg 54.59 45.77 Avg 50.96 45.57 Avg 52.94 . 45.66 .:... Max 78.96 46.47 -Max 56.26 45.77 Max 75.40 46.12
~ ,
~
~~ -.
~~.
r-- o
U - 44 -
l.:l
U
rl io..i
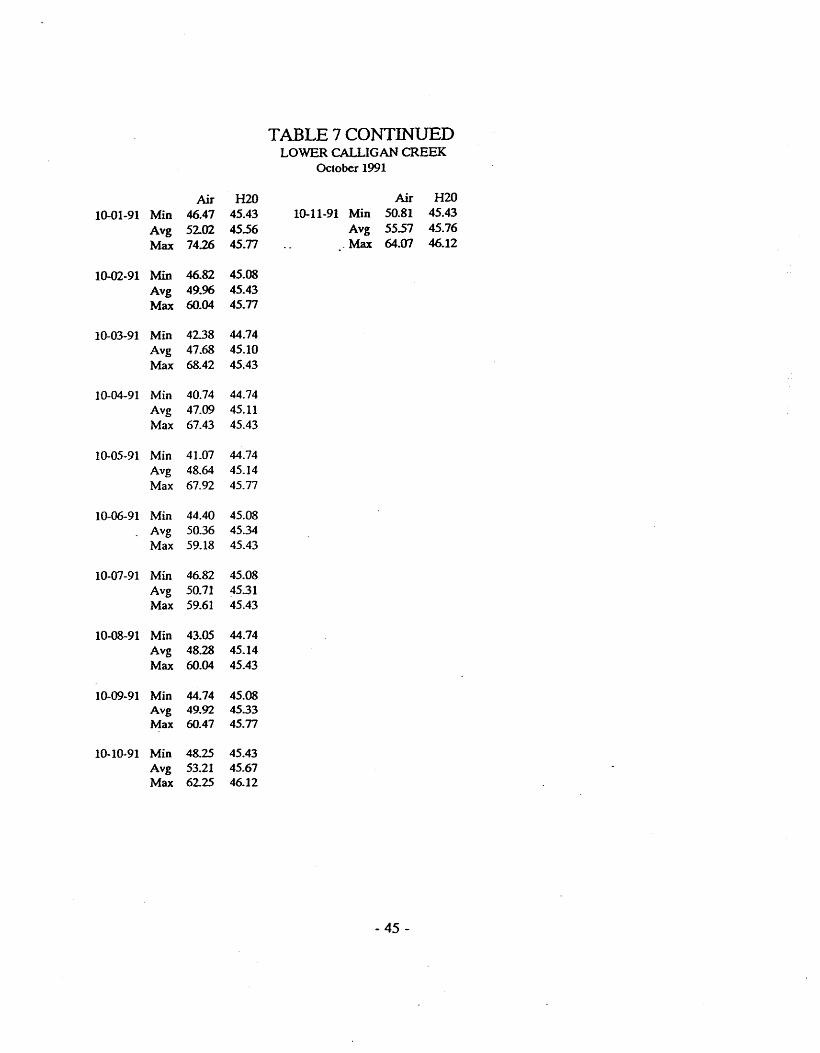
TABLE 7 CONTINUED LOWER CALLIGAN CREEK
October 1991
Air H2O Air H2O 10-01-91 Min 46.47 45.43 10-11-91 Min 50.81 45.43
Avg 52.02 45.56 Avg 55.57 45.76
Max 74.26 45.77 . Max 64.07 46.12
10-02-91 Min 46.82 45.08 Avg 49.96 45.43 Max 60.04 45.77
10-03-91 Min 42.38 44.74 Avg 47.68 45.10 Max 68.42 45.43
10-04-91 Min 40.74 44.74 Avg 47.09 45.11 Max 67.43 45.43
10-05-91 Min 41.07 44.74 Avg 48.64 45.14 Max 67.92 45.77
10-06-91 Min 44.40 45.08 Avg 50.36 4534 Max 59.18 45.43
10-07-91 Min 46.82 45.08 Avg 50.71 45.31 Max 59.61 45.43
10-08-91 Min 43.05 44.74 Avg 48.28 45.14 Max 60.04 45.43
10-09-91 Min 44.74 45.08 Avg 49.92 45.33 Max 60.47 45.77
10-10-91 Min 48.25 45.43 Avg 53.21 45.67 Max 62.25 46.12
- 45 -
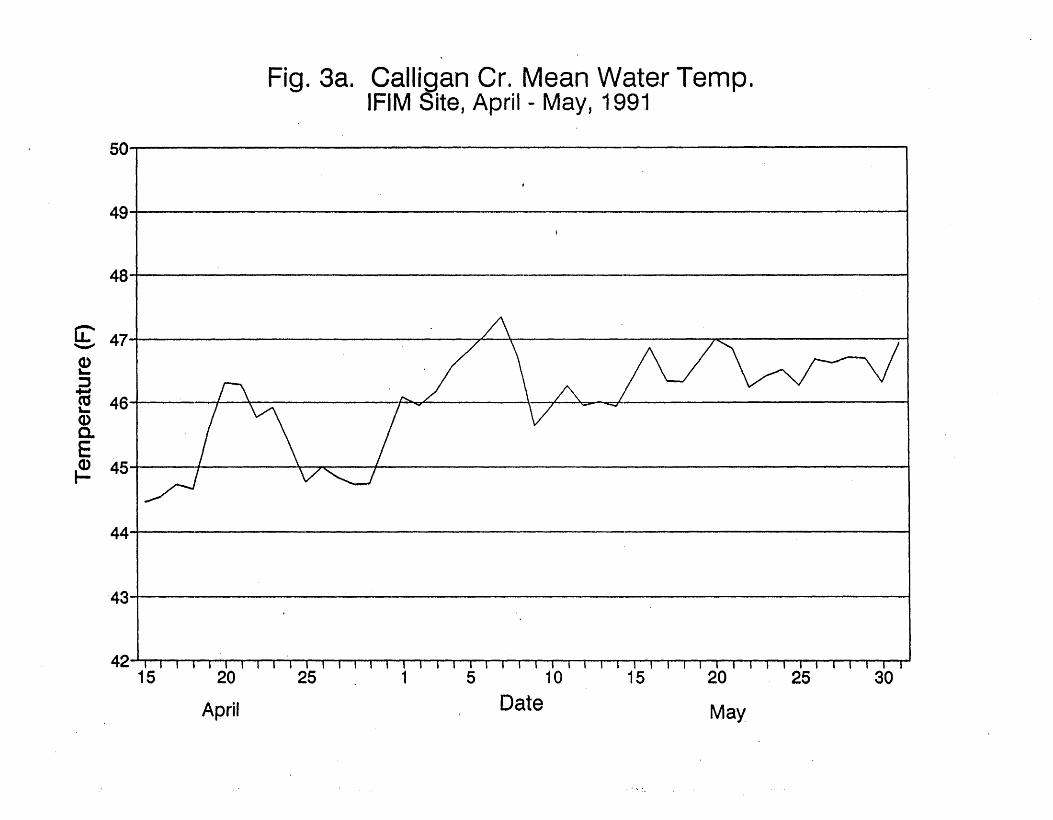
Fig. 3a. Calligan Cr. Mean Water Temp. IFIM Site, April - May, 1991
50~I------------------------------'----------------------------------------~
49~1-----------------------------------------------------------------------------------~
48~1---------------------------------
G::'" 47 I " \ >< . I '-'"
~ ::::s ~ (tS 46 I -I' c> C r) <.---------------( '- 1: j'O ; QIiii"'''''<::i
Q) a. E ~ 45
44~1---------------------------------------'----------·-----------------------------~
43~1----------------------------------------------------------------------------------~
42 "I I I' 15 20
April
25 1 5 10
Date 15 20
May
25 30
-:.
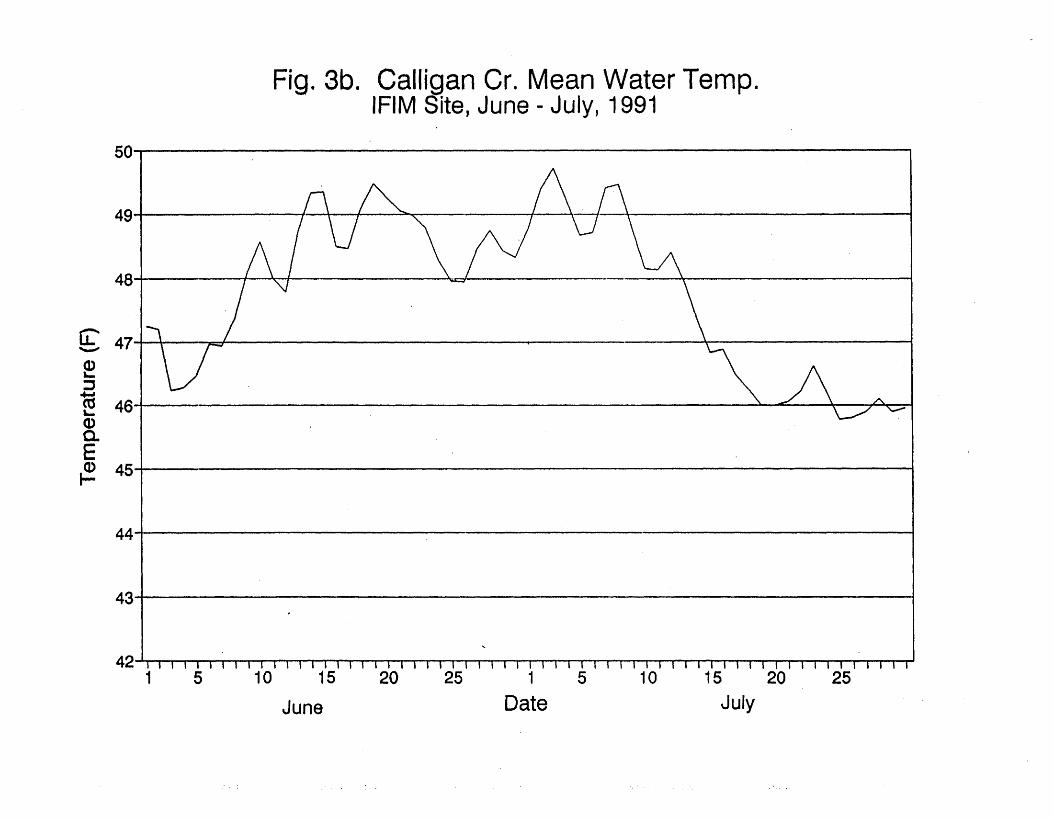
Fig. 3b. Calligan Cr. Mean Water Temp. IFIM Site, June - July, 1991
50~i----------------------------------------------------------------------~
, ? < .,----, 49 I I I >- ' \. j
r '< I ~=f-------48 I I \ I \ ,
G:' "-'"
~ ::J 15 )
'-Q) c. E Q) 45 ~
44~1-------------------------------------------------------------------------~
43~1----------------------------------------------------------------------------~
42~i~i~~~~~~~-r~~~~-r~~~~~~~-r~~~~~~~-r~~~~~~~~~~-r~~~
1 5 10 15 20 25 1 5 10 15 20 25
June Date July

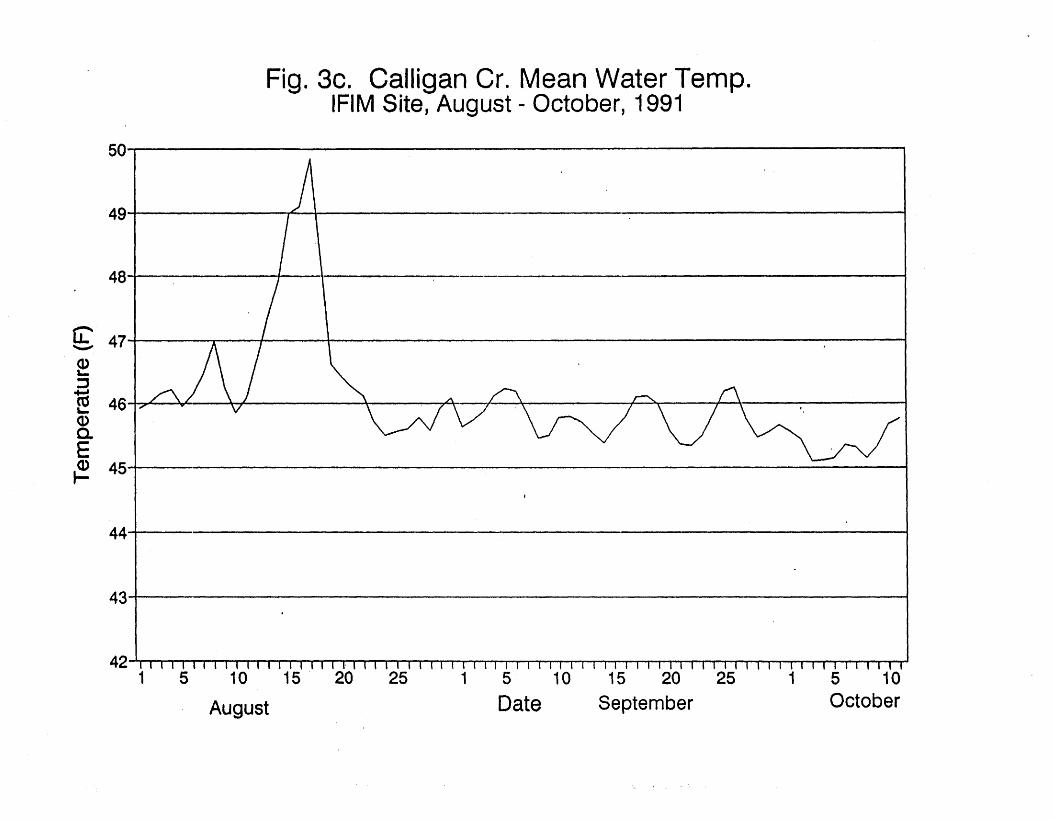
Fig. 3c. Calligan Cr. Mean Water Temp. IFIM Site, August - October, 1991
50Ti----------~-------------------------------------
49 I ,< ,
48~1------.--------~-----------------·
~ ~
~ A L-~
~ L-~ ~
E ~ 45 ~
44T,---------------------------------------------------~--J
43~1--------------------------------------------------------------------~
42 '1'1 I I 'I I I I I I t I I I II I I· I I I I I I I I I I I I I I I II I I I I I I I I I I I I I I I I I I I I I I' 1 5 10 15 20 25
Augu~
1 5 10 15 20 25
Date September 1 5 10
October

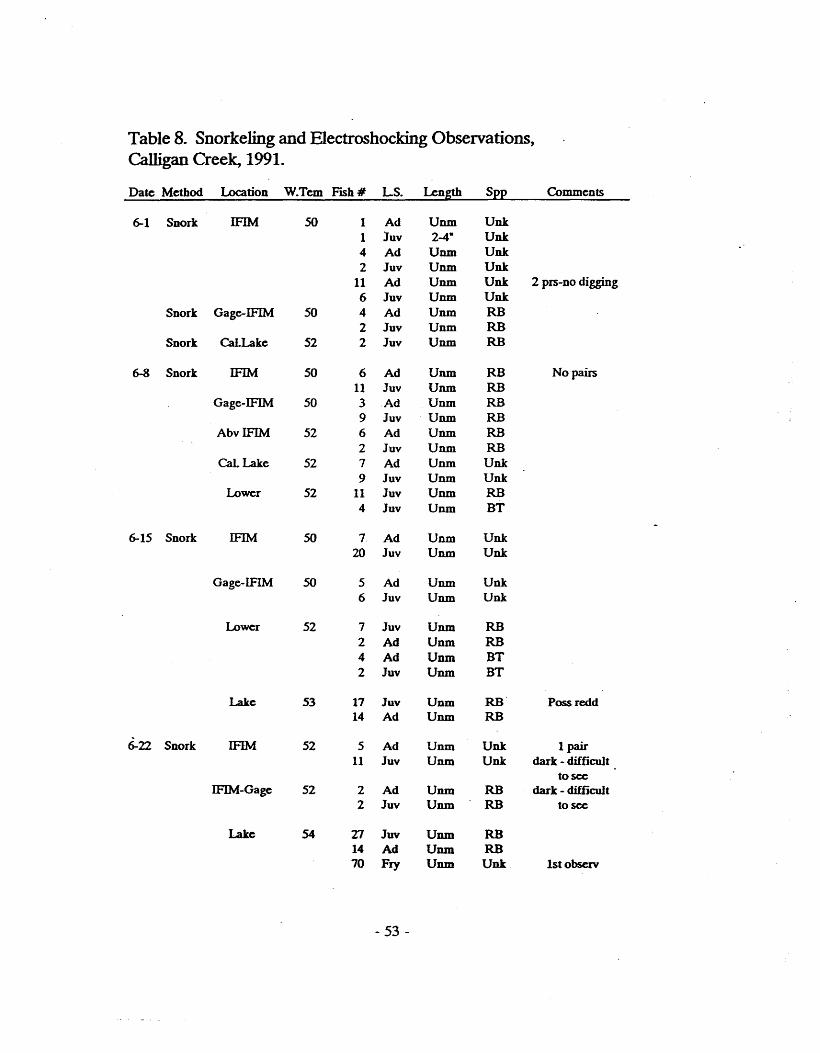
Table 8. Snorkeling and Electroshocking Observations, Calligan Creek, 1991.
Date Method Location W.Tem FlSh# LS. Length S~~ Comments
6-1 Snork IFIM 50 1 Ad Unm UDt 1 Juv 2-4- UDt 4 Ad Unm Unk 2 Juv Unm Unk
11 Ad Unm Unk 2 prs-no digging 6 Juv Unm Unk
Snork Gage-IFIM 50 4 Ad Unm RB 2 Juv Unm RB
Snork CaLLake 52 2 Juv Unm RB
6-8 Snork IFIM 50 6 Ad Unm RB No pairs 11 Juv Unm RB
Gage-IFIM 50 3 Ad Unm RB 9 Juv Unm RB
AbvIFIM 52 6 Ad Unm RB 2 Juv Unm RB
CaL Lake 52 7 Ad Unm Unk 9 Juv Unm Unk
Lower 52 11 Juv Unm RB 4 Juv Unm BT
6-15 Snork IFIM 50 7 Ad Unm Unk 20 Juv Unm UDt
Gage-IFIM 50 5 Ad Unm Unk 6 Juv Unm Unk
Lower 52 7 Juv Unm RB 2 Ad Unm RB 4 Ad Unm BT 2 Juv Unm BT
Lake S3 17 Juv Unm RB· Possredd 14 Ad Unm RB
6-22 Snork IFlM 52 5 Ad Unm Unk 1 pair 11 Juv Unm Unk dark - difficult
to see IFIM-Gage 52 2 Ad Unm RB dark - difficult
2 Juv Unm RB to see
Lake 54 27 Juv Unm RB 14 Ad Unm RB 70 Fry Unm UDt lstobserv
- 53 -

Table 8. Snorkeling and Electroshocking Observations, ~ OJ;;
Calligan Creek, 1991. (CONTINUED)
Date Method Location W.Tem Fish # LS. Length SE~ Comments
7-5 Electro Lake 68 1 Fry 21 Unk " Elect. mal 1 Fry 23 Unk RB? 1 Fry 27 Unk 1 Fry 19 Unk 1 Fry 22 Unk 1 Fry 21 Unk 1 Fry 19 Unk 1 Fry 22 Unk 1 ~ry 24 Unk 1 Fry 22 Unk
Fry 26 Unk 1 Fry 28 Unk 1 Fry 21 Unk 1 Fry 23 Unk 1 Fry 22 Unk 1 Fry 24 Unk 1 Fry 20 Unk 1 Fry 23 Unk 1 Fry 28 Unk 1 Fry 29 Unk 1 Fry 21 Unk 1 Fry 21 Unk 1 Fry 22 Unk
IFIM-Gage 56 1 Fry 19 Unk RB? 1 Fry 18 Unk
7-13 Electro IFIM 52 0 0 No salmonids
7-21 Electro IFIM 46 1 Fry 40 RB 1 Fry 25 RB 1 Fry Unm RB
Fry 25 RB Fry 30 RB ~::
IFIM - Gage 46 1 Fry" 25 RB ..,.,
1 Fry 30 RB 1 Fry 40 BT
~
1 Fry Unm Unk '5'
Lower 49 1 Fry 32 BRlCf ~! 1 Fry 45 RB 1 Fry 43 RB .... --:
1 Fry 45 BRlCf ~
~
il - 54 -
D n
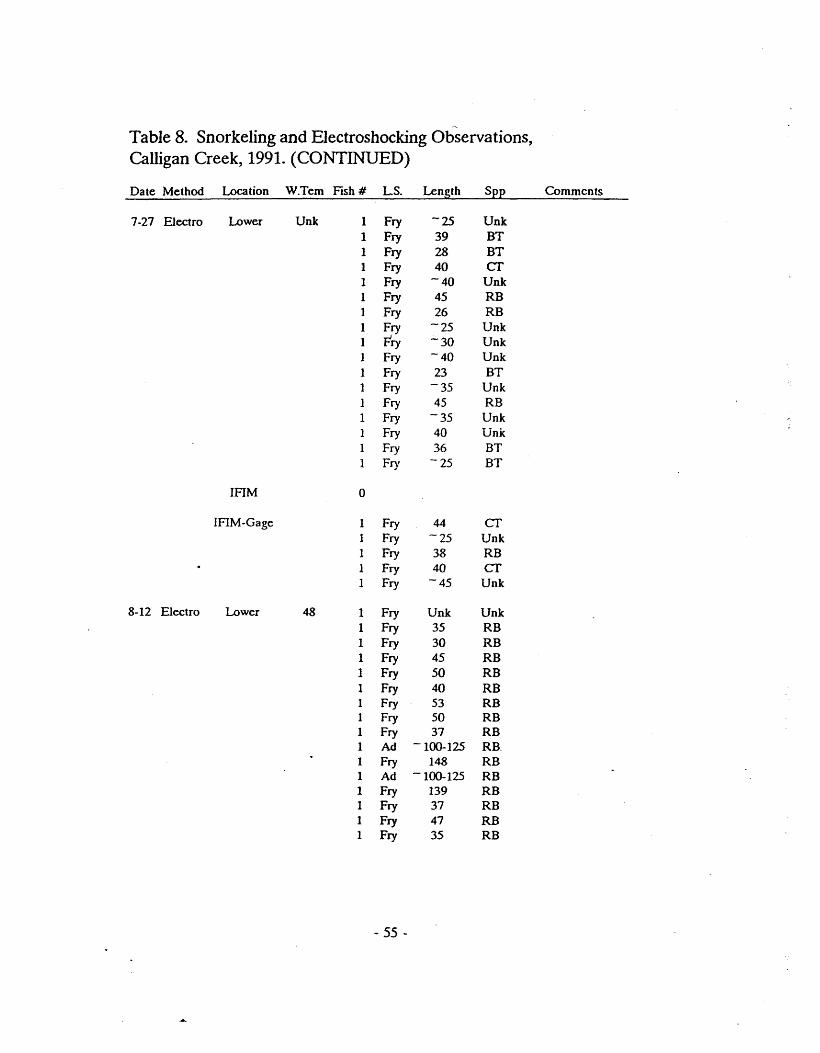
Table 8. Snorkeling and Electroshocking Observations, Calligan Creek, 1991. (CONTINUED)
Date Method Location W.Tem Fish # LS. Length Spp Comments
7-27 Electro Lower Unk 1 Fry -25 Unk 1 Fry 39 BT 1 Fry 28 BT 1 Fry 40 cr 1 Fry -40 Unk 1 Fry 45 RB 1 Fry 26 RB 1 Fry -25 Unk 1 Fry -30 Unk 1 Fry -40 Unk 1 Fry 23 BT
Fry -35 Unk 1 Fry 45 RB 1 Fry -35 Unk 1 Fry 40 Unx 1 Fry 36 BT 1 Fry -25 BT
IFIM 0
IFIM-Gage 1 Fry 44 cr 1 Fry -25 Unk 1 Fry 38 RB 1 Fry 40 cr 1 Fry -45 Unk
8-12 Electro Lower 48 1 Fry Unk Unk 1 Fry 35 RB 1 Fry 30 RB 1 Fry 45 RB 1 Fry 50 RB 1 Fry 40 RB 1 Fry 53 RB 1 Fry 50 RB 1 Fry 37 RB 1 Ad -100-125 RB-I Fry 148 RB 1 Ad -100-125 RB 1 Fry 139 RB 1 Fry 37 RB 1 Fry 47 RB 1 Fry 35 RB
- 55 -
n t II..
Table 8. Snorkeling, and Electroshocking Observations, r Calligan Creek, 1991. (CONTINUED) 0:
Date Method Location W.Tem Fish # LS. Length SEE Comments
IFIM 46.4 1 Fry 47 RB 1 Fry -so RB 1 Fry 36 RB 1 Fry 44 RB 1 Fry 48 .RB 1 Fry 47 RB 1 Ad 157 RB 1 Fry -35 RB
IFIM-Gage 1 Fry 48 RB 1 Fry 48 RB 1 Fry 59 RB 1 Fry 56 RB 1 Ad -150 RB 1 Ad 159 RB
8-18 Electro IFIM-Gage 0
IFIM 48 1 Fry 34 RB 2 Fry 45 cr 3 Fry 35 cr 4 Fry 32 cr 5 Fry 40 RB
Lower 50 1 Fry -30 Unk 1 Fry 42 RB 1 Fry 31 BT 1 Fry 34 cr 1 Fry 30 BT ~ '.
1 Fry 40 BT 1 Fry 46 BT L
1 Fry 33 cr 1 Fry 47 BT r:--;
1 Fry 36 BT ld 1 Fry -35 cr 1 Fry 44 RB f"~
1 Fry 32 RB i..-
1 Fry 42 BT 1 Fry 34 RB ;r-!;
1 Fry 41 BT ~ 1 Fry 32 cr
...
~-;A:
r~
L - 56 -
f:i U
.0
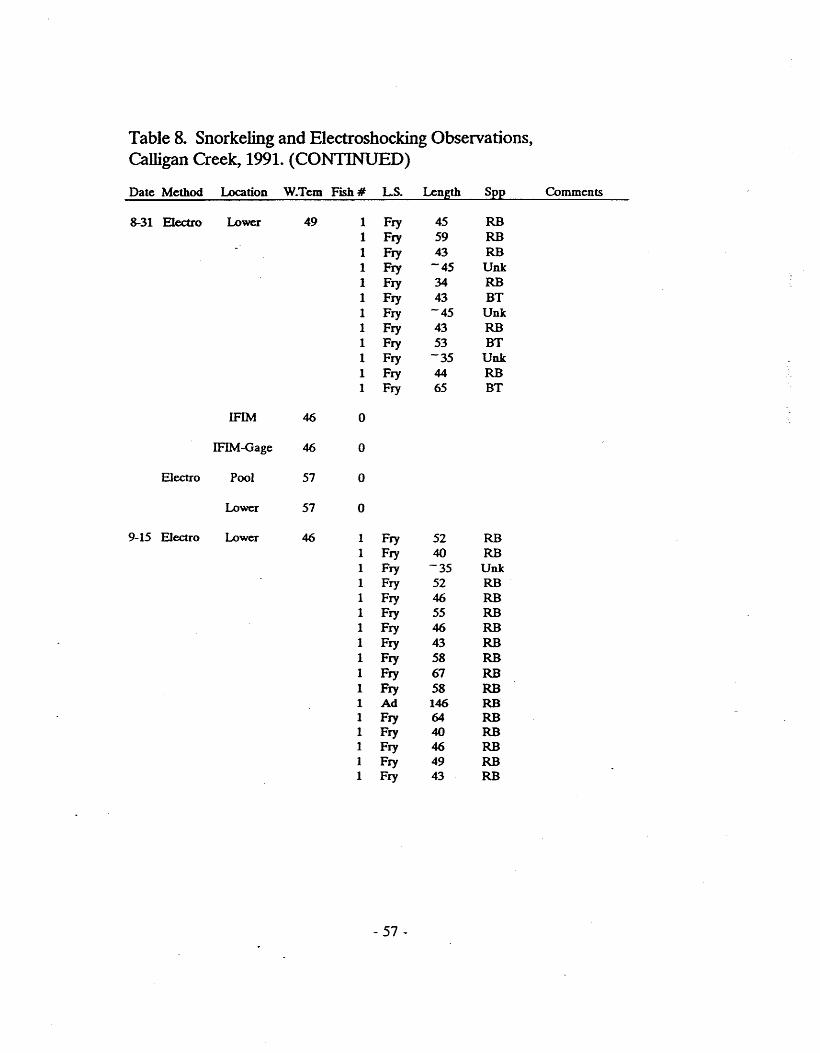
Table 8. Snorkeling and Electroshocking Observations, Calligan Creek, 1991. (CONTINUED)
Date Method Location W.Tem Fish# LS. Length Spp Comments
8-31 Electro Lower 49 1 Fry 45 RB 1 Fry 59 RB 1 Fry 43 RB 1 Fry -45 Unk 1 Fry 34 RB 1 Fry 43 BT 1 Fry -45 Unk 1 Fry 43 RB 1 Fry 53 BT 1 Fry -35 Unk 1 Fry 44 RB 1 Fry 65 BT
IFIM 46 0
IFIM-Gage 46 0
Electro Pool 57 0
Lower 57 0
9-15 Electro Lower 46 1 Fry 52 RB 1 Fry 40 RB 1 Fry -35 Unk 1 Fry 52 RB 1 Fry 46 RB 1 Fry 55 RB 1 Fry 46 RB 1 Fry 43 RB 1 Fry 58 RB 1 Fry 67 RB 1 Fry 58 RB 1 Ad 146 RB 1 Fry 64 RB 1 Fry 40 RB 1 Fry 46 RB 1 Fry 49 RB 1 Fry 43 RB
- 57 -
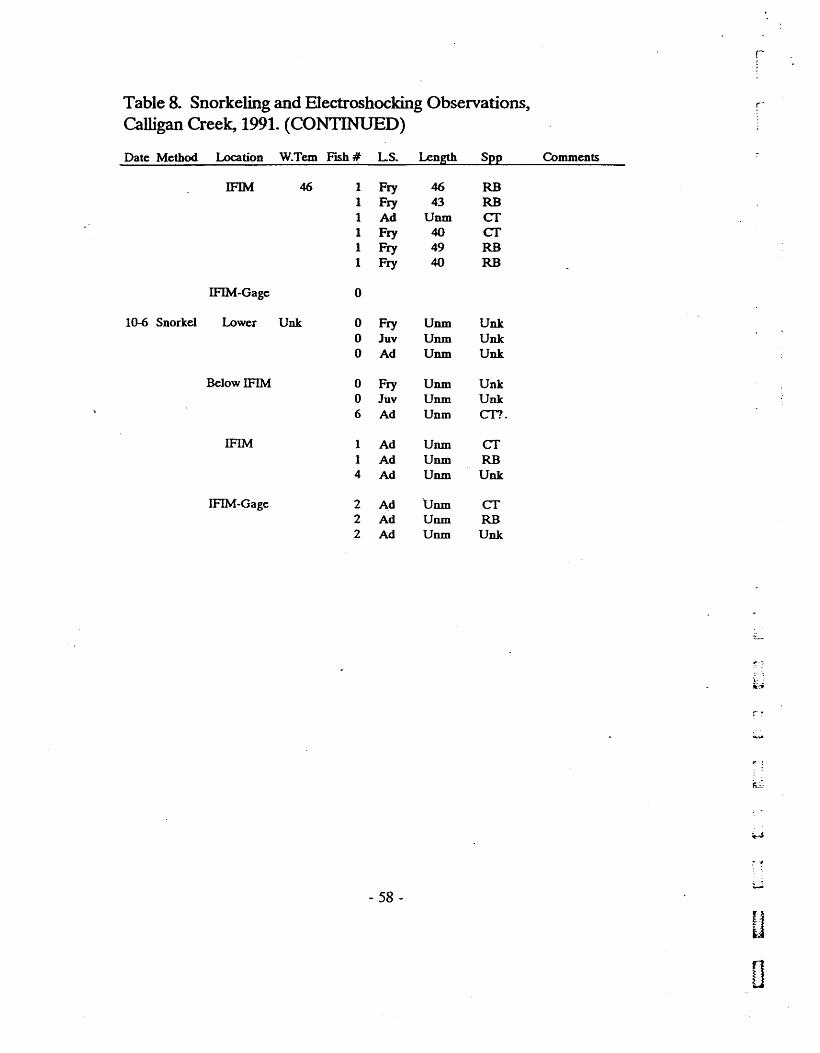
Table 8. Snorkeling and Electroshocking Observations, Calligan Creek, 1991. (CONTINUED)
Date Method Location W.Tem FlSh# LS. Length See
IFIM 46 1 Fry 46 RB 1 Fry 43 RB 1 Ad Unm cr 1 Fry 40 cr 1 Fry 49 RB 1 Fry 40 RB
IFIM-Gage 0
10-6 Snorkel Lower Unk 0 Fry Unm Unk 0 Juv Unm Unk 0 Ad Unm Unk
BelowIFIM 0 Fry Unm Unk 0 Juv Unm UnIt 6 Ad Unm Cf?
IFIM 1 Ad Unm cr 1 Ad Unm RB 4 Ad Unm Unk
IFIM-Gage 2 Ad Unm cr 2 Ad Unm RB 2 Ad Unm Unk
- 58-
Comments
r-
,..-
' .. '
id
" .....
u o

100%
90%
80%
70%
....., 60% c I Q)
~ 50% CD a. 40%
30%
20%
10%
0% 7-5
Fig 4.Calligan Cr. Electroshocking Data Cumulative Size Groupings, Rainbow Tr.
I Central 80%
. 7-13 7-21 7-27 8-12 8-1.8 8-31 Date
----.-.---.,.--------~- .-- .. -.----.---.-.---------~ .. ------.----- .. -.---- -----------,
• < =35mm < =40mm )1( < =45mm
9-15
~--
100%
90%
80%
70%
.... 60%1 c: Q)
50% () '-Q) c.. 40%
30%
20%
10%
0%
Fig 5.Calligan Cr. Electroshocking Data Cumulatiye Size Groupings, Cutthroat
I Central 80%
7-5 7-13 7-21 7-27 8-12 8-18 8-31 9-15 Date
I • < =35mm < =40mm -*- < =45mm

~-'.
"
~
100%
90%
80%
70% ....., 60%1 c: (])
50% (J .... (]) a.. 40%
30%
20%
10%
0%
Fig 6.Calligan Cr. Electroshocking Data Cumulative Size Groupings, All Trout
I Central 80%
7-5' 7-13 7-21 7-27 8-12 8-18 8-31 9-15 Date
• <=35mm <=40mm )I( <=45mm

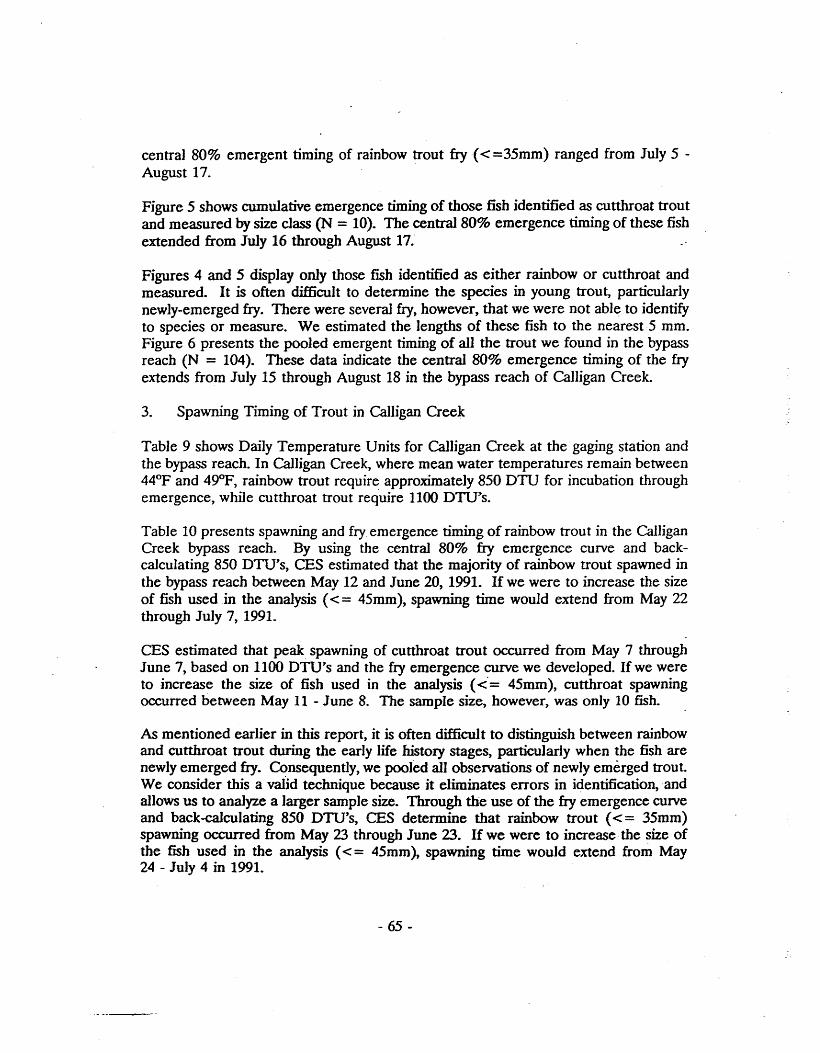
central 80% emergent timing of rainbow trout fry (< =35mm) ranged from July 5 -August 17.
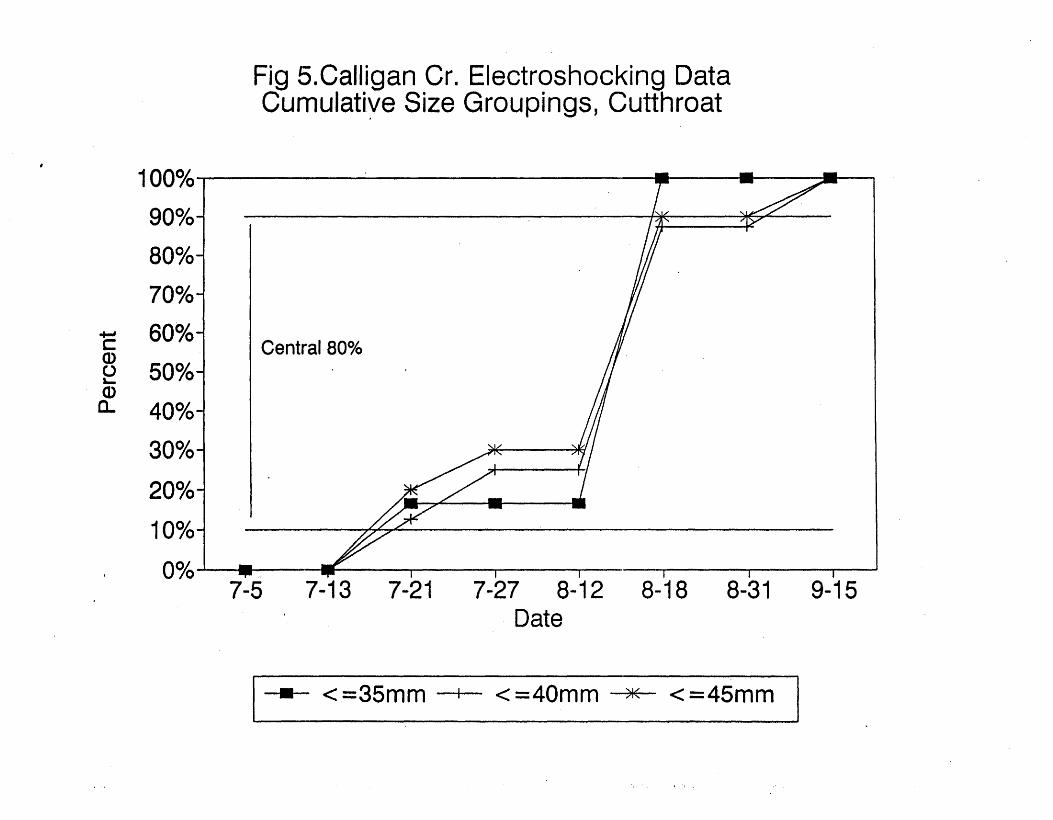
Figure 5 shows cumulative emergence timing of those fish identified as cutthroat trout and measured by size class (N = 10). The central 80% emergence timing of these fish extended from July 16 through August 17.·
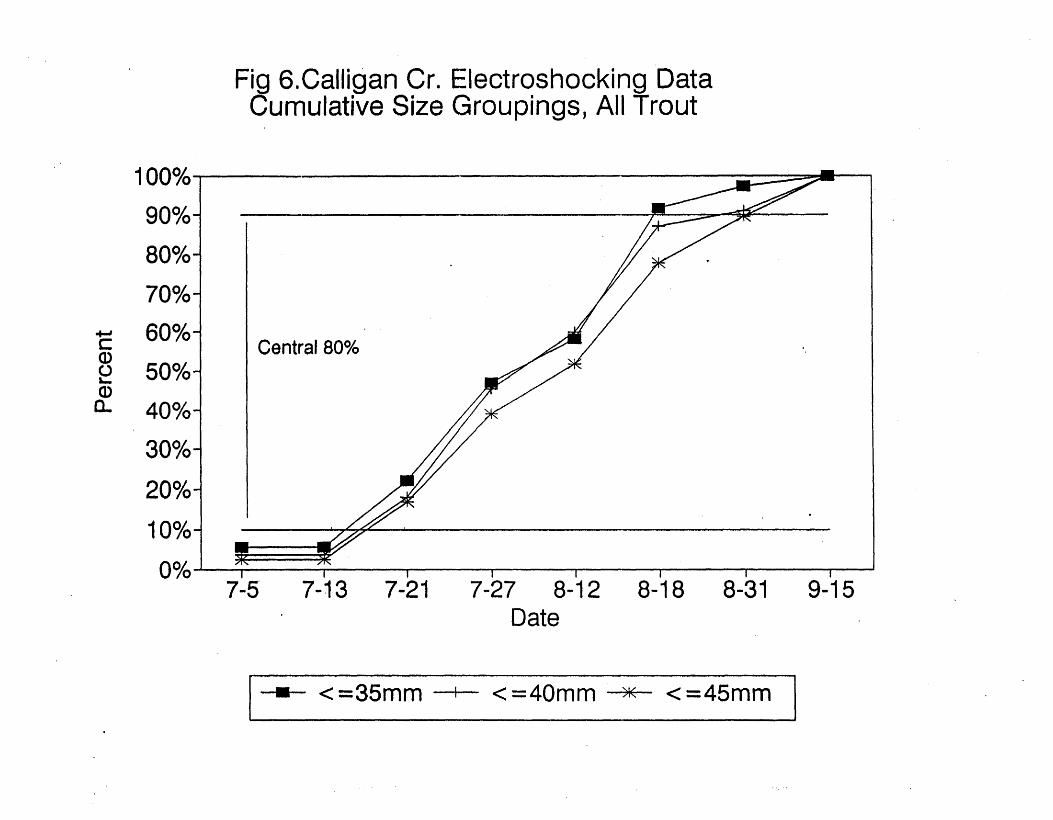
Figures 4 and 5 display only those fish identified as either rainbow or cutthroat and measured. It is often difficult to determine the species in young trout, particularly newly-emerged fly. There were several fry, however, that we were not able to identify to species or measure. We estimated the lengths of these fish to the nearest 5 mm. Figure 6 presents the pooled emergent timing of all the trout we found in the bypass reach (N = 104). These data indicate the central 80% emergence timing of the fry extends from July 15 through August 18 in the bypass reach of Calligan Creek.
3. Spawning Timing of Trout in Calligan Creek
Table 9 shows Daily Temperature Units for Calligan Creek at the gaging station and the bypass reach. In Calligan Creek, where mean water temperatures remain between 44°F and 49OP, rainbow trout require approximately 850 DTU for incubation through emergence, while cutthroat trout require 1100 DTU's.
Table 10 presents spawning and fry emergence timing of rainbow trout in the CalJigan Creek bypass reach. By using the central 80% fry emergence curve and backcalculating 850 DTU's, CES estimated that the majority of rainbow trout spawned in the bypass reach between May 12 and June 20, 1991. If we were to increase the size of fish used in the analysis «= 45mm), spawning time would extend from May 22 through July 7, 1991.
CES estimated that peak spawning of cutthroat trout occurred from May 7 through June 7, based on 1100 DTU's and the fry emergence curve we developed. If we were to increase the size of fish used in the analysis «"= 45mm), cutthroat spawning occurred between May 11 - June 8. The sample size, however, was only 10 fish.
As mentioned earlier in this report, it is often difficult to distinguish between rainbow and cutthroat trout during the early life history stages, particularly when the fish are newly emerged fry. Consequently, we pooled all obsetvations of newly emerged trout. We consider this a vaiid technique because it eliminates errors in identification, ·and allows us to analyze a larger sample size. Through the use of the fly emergence curve and back-ca1culating 850 DTU's, CES determine that rainbow trout « = 35mm) spawning occurred from May 23 through June 23. If we were to increase· the size of the fish used in the analysis « = 45mm), spawning time would extend from May 24 - Ju1y 4 in 1991.
- 65 -
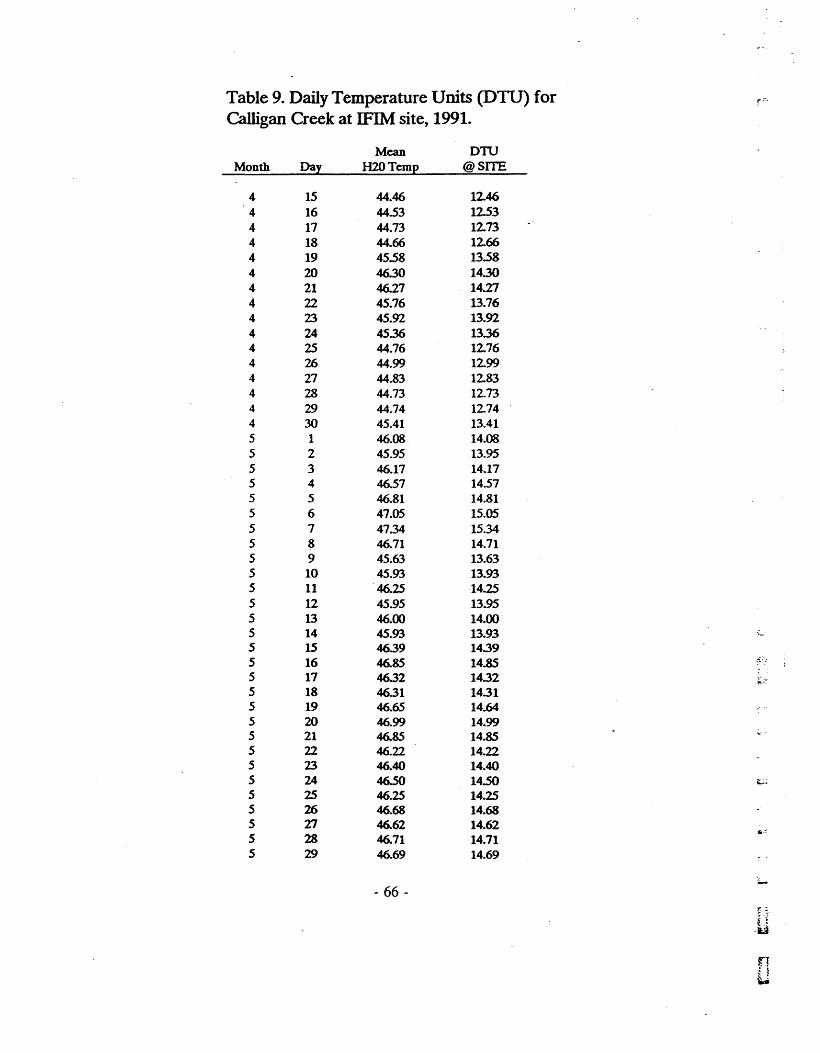
Table 9. Daily Temperature Units (DTU) for r~
Calligan Creek at IFIM site, 1991.
Mean Dro Month DaI H20Tem~ @SITE
4 15 44.46 1246 4 16 44.53 1253 4 17 44.73 1273 4 18 44.66 1266 4 19 45.58 13.58 4 20 46.30 14.30 4 21 46.27 14.27 4 22 45.76 13.76 4 23 45.92 13.92 4 24 45.36 13.36 4 25 44.76 1276 4 26 44.99 1299 4 27 44.83 1283 4 28 44.73 12.73 4 29 44.74 12.74 4 30 45.41 13.41 5 1 46.08 14.08 5 2 45.95 13.95 5 3 46.17 14.17 5 4 46.57 14.57 5 5 46.81 14.81 5 6 47.05 15.05 5 7 47.34 15.34 5 8 46.71 14.71 5 9 45.63 13.63 5 10 45.93 13.93 5 11 -46.25 14.25 5 12 45.95 13.95 5 13 46.00 14.00 5 14 45.93 13.93 -l-
5 15 46.39 14.39 5 16 46.85 14.85 . -
5 17 46.32 14.32 7 ;;.,:_.
5 18 46.31 14.31 5 19 46.65 14.64 5 20 46.99 14.99 5 21 46.85 14.&5 5 22 46.22 14.22 5 23 46.40 14.40 5 24 46.50 14.50 .... 5 25 46.25 14.25 5 26 46.68 14.68 5 27 46.62 14.62 5 28
li)-~
46.71 14.71 5 29 46.69 14.69
~
- 66-r ~.
14 n ~ j ..,.
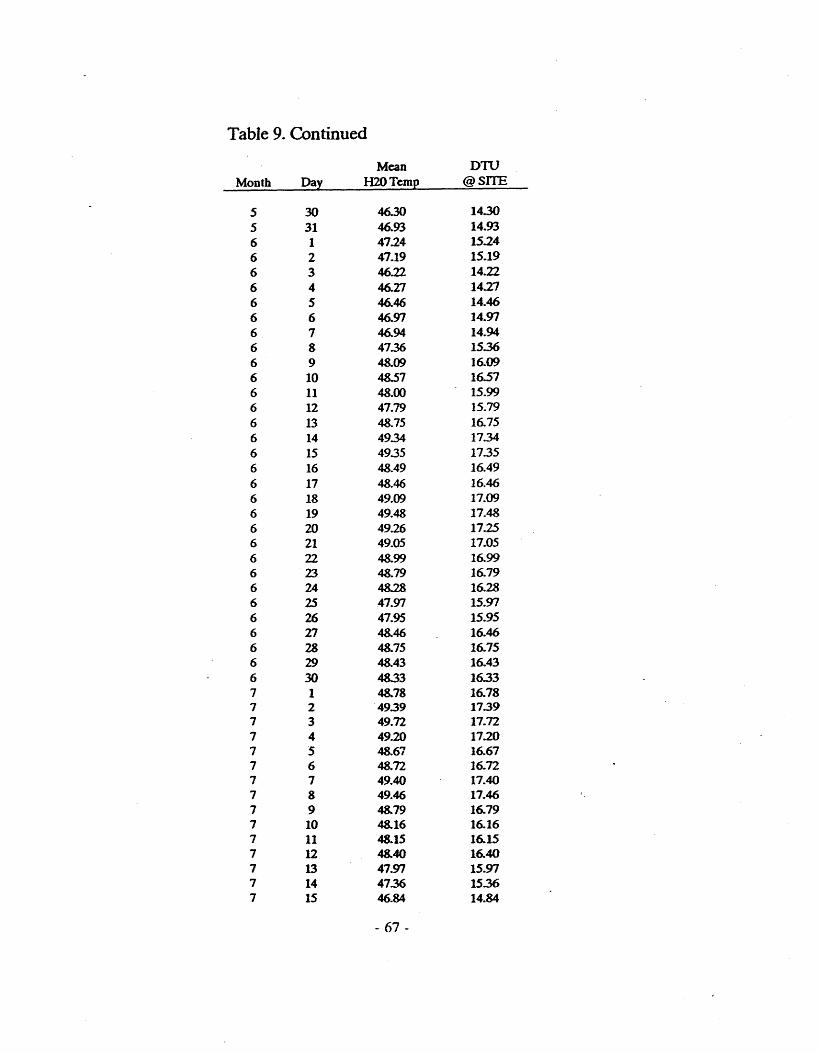
Table 9. Continued
Mean DW Month Day H2O Temp @SfIE
5 30 46.30 14.30 5 31 46.93 14.93 6 1 47.24 15.24 6 2 47.19 15.19 6 3 46.22 14.22 6 4 46.1:1 14.27 6 5 46.46 14.46 6 6 46.97 14.97 6 7 46.94 14.94 6 8 47.36 15.36 6 9 48.09 16.()9 6 10 48.57 16.57 6 11 48.00 15.99 6 12 47.79 15.79 6 13 48.75 16.75 6 14 49.34 1734 6 15 49.35 1735 6 16 48.49 16.49 6 17 48.46 16.46 6 18 49.09 17.09 6 19 49.48 17.48 6 20 49.26 17.25 6 21 49.05 17.05 6 22 48.99 16.99 6 23 48.79 16.79 6 24 48.28 16.28 6 2S 47.97 15.97 6 26 47.95 15.95 6 27 48.46 16.46 6 28 48.75 16.75 6 29 4$.43 16.43 6 30 48.33 1633 7 1 48.78 16.78 7 2 49.39 17.39 7 3 49.72 17.72 7 4 49.20 17.20 7 5 4&67 16.67 7 6 48.72 16.72 7 7 49.40 17.40 7 8 49.46 17.46 7 9 48.79 16.79 7 10 48.16 16.16 7 11 48.15 16.15 7 12 48.40 16.40 7 13 47.97 15.97 7 14 47.36 15.36 7 15 46.84 14.84
- 67 -

r~
Table 9. Continued
Mean DTU Month Da:I H20Tem~ @SITE
1 16 46.88 14.88 1 17 46.47 14.47 1 18 46.24 14.24 7 19 45.99 13.99 7 20 45.99 13.99 7 21 46.05 14.05 7 22 46.21 14.21 7 23 46.60 14.60 1 24- 46.19 14.19 1 25 45.71 13.17 1 26 45.80 13.80 1 27 45.89 13.89 1 28 46.09 14.09 1 29 45.89 13.89 7 30 45.95 13.95 8 1 45.92 13.92 8 2 46.01 14.01 8 3 46.15 14.15 8 4 46.21 14.21 8 5 45.95 13.95 8 6 46.13 14.13 8 7 46.44 14.44 8 8 46.99 14.99 8 9 46.22 14.22 8 10 45.84 13.84 8 11 46.08 14.08 8 12 46.66 14.66 _ 8 13 41.34 15.34 8 14 41.90 15.90 8 15 48.98 16.98 8 16 49.09 11.09 8 11 49.84 17.84 8 18 48.29 16.29 8 19 46.60 14.60 8 20 46.40 14.40 8 21 46.24 14.24 8 22 46.11 14.11 8 23 45.70 13.10 8 24 45.50 13.50 8 25 45.56 13.56 8 26 45.60 13.60 8 Zl 45.77 13.77 8 28 45.51 13.57 8 29 45.92 13.92 8 30 46.08 14.08 9 1 45.63 13.63 9 2 45.73 13.73
- 68 -
L,
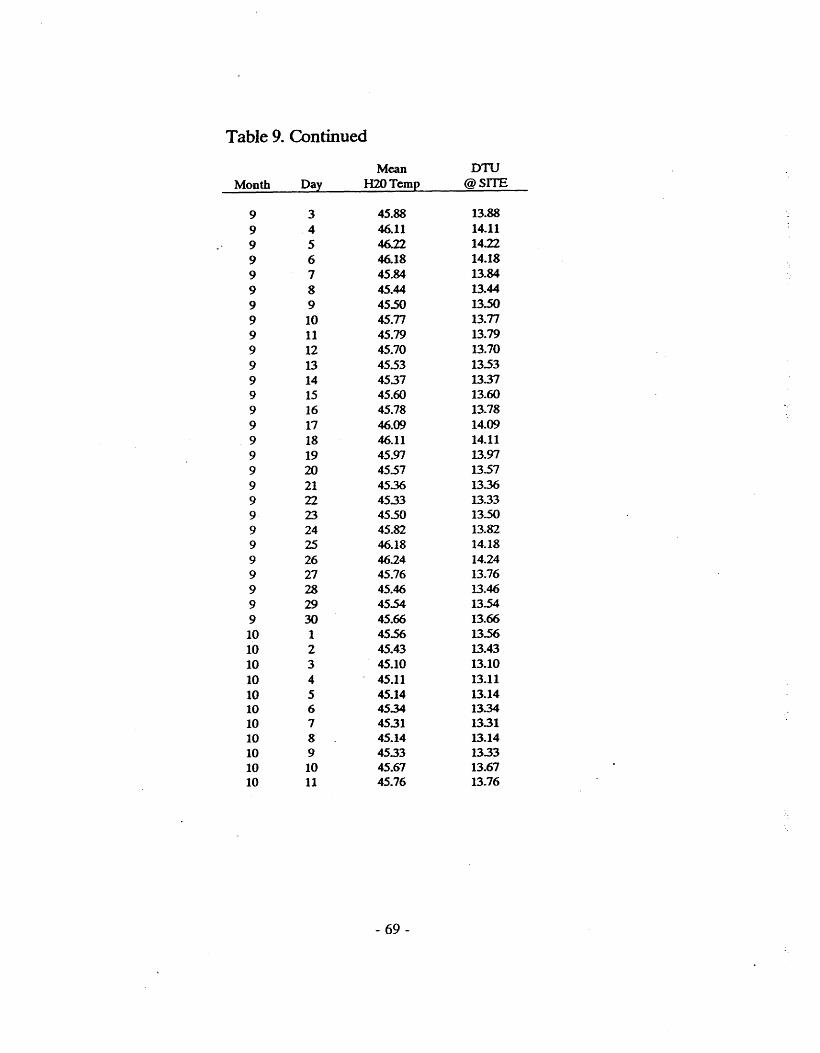
Table 9. Continued
Mean DTU Month Day H2O Temp @SITE
9 3 45.88 13.88 9 4 46.11 14.11 9 5 46.22 14.22 9 6 46.18 14.18 9 7 45.84 13.84 9 8 45.44 13.44 9 9 45.50 13.50 9 10 45.77 13.77 9 11 45.79 13.79 9 12 45.70 13.70 9 13 45.53 13.53 9 14 4537 13.37 9 15 45.60 13.60 9 16 45.78 13.78 9 17 46.09 14.09 9 18 46.11 14.11 9 19 45.97 13.97 9 20 45.57 13.57 9 21 45.36 13.36 9 22 4533 13.33 9 23 45.50 13.50 9 24 45.82 13.82 9 25 46.18 14.18 9 26 46.24 14.24 9 27 45.76 13.76 9 28 45.46 13.46 9 29 45.54 13.54 9 30 45.66 13.66 10 1 45.56 13.56 10 2 45.43 13.43 10 3 45.10 13.10 10 4 45.11 13.11 10 5 45.14 13.14 10 6 4534 13.34 10 7 4531 13.31 10 8 45.14 13.14 10 9 45.33 13.33 10 10 45.67 13.67 10 11 45.76 13.76
- 69 -

Table 10. Spawning and Emergence Timing of Trout ObselVed in Cal1igan Creek, 1991.
SQecies 1[ Size Emergence Timing 21 Sl2awning Timing 21
Rainbow <=35 mm July 5 - Aug 17 May 12 - June 28
<=40mm July 14 - Sept 2 May 22 - July 5
<=45 mm July 15 - Sept 5 May 23 - July 7
Cutthroat 3/ <=35 mm July 16 - Aug 17 May 7 - June 7
<=40 mm July 19 - Aug 18 May 8 - June 8
<=45 mm July 20 - Aug 18 May 11 - June 8
All Species 4/ <=35 mm July 15 - Aug 18 May 23 - June 23
<=40 mm July 16 - Aug 31 May 24 - July 4
<=45 mm July 16 - Aug 31 May 24 - July 4
1/ Based upon 850 DTU to emergence in 45 degree F water.
2/ Based on Central 80% emergence timing.
3/ Based upon 1100 DTU to emergence in 45 degree F water.
4/ Based upon 850 DTU to emergence in 45 degree F water.
Campbell and Neuner (1984a), as mentioned earlier in this report, demonstrated a correlation"between fish behavior and stream temperatures. Table 11 shows 15-day mean water temperatures in Calligan Creek at the IFIM site. Temperatures increased to above 8°C (46.4OP) during the 15-day period beginning May 15, 1991. This date c~ITesponds closely with the dates that spawning commenced.
Conversely, when temperatures drop below 8°C, trout revert to a more dormant, less active behavior. Data from the gage in the bypass reach indicate temperatures drop below this threshold by the end of August, and that "winter conditions" exist as early
.. as September 1 in the bypass reach.
- 70-. "
" -n w
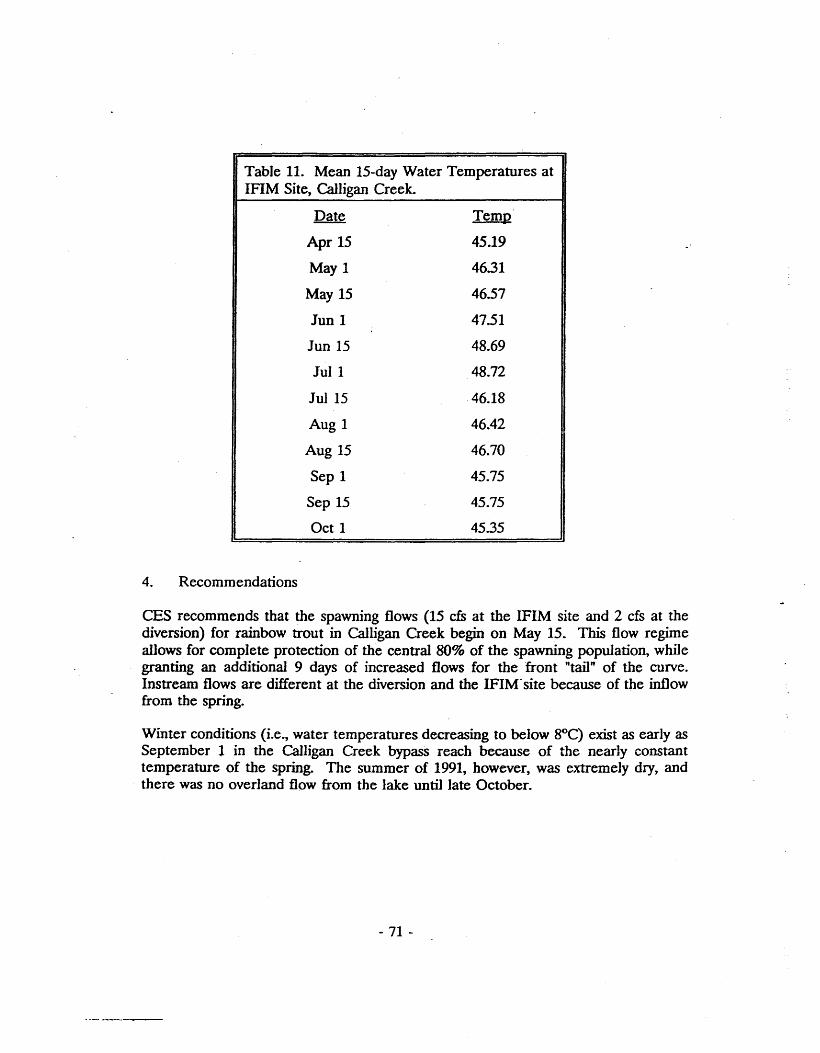
Table 11. Mean 15-day Water Temperatures at IFIM Site, Calligan Creek.
Date Temp
Apr 15 45.19
May 1 46.31
May 15 46.57
Jun 1 47.51
Jun 15 48.69
Jul1 48.72
Jul 15 46.18
Aug 1 46.42
Aug 15 46.70
Sep 1 45.75
Sep 15 45.75
Oct 1 45.35
4. Recommendations
CES recommends that the spawning flows (15 cfs at the IFIM site and 2 cfs at the diversion) for rainbow trout in Calligan Creek begin on May 15. This flow regime allows for complete protection of th'e central 80% of the spawning population, while granting an additional 9 days of increased flows for the front "tail" of the curve. Instream flows are different at the diversion and the IFIM-site because of the inflow from the spring.
Winter conditions (i.e., water temperatures decreasing to below SOC) exist as early as September 1 in the Calligan Creek bypass reach because of the nearly constant temperature of the spring. The summer of 1991, however, was extremely dry, and there was no overland flow from the lake until late October.
- 71 -
Therefore, warmer waters from the lake did not mix with the colder spring waters. It is possible that in wetter years the stream would not dry up and that the warmer surface water from the lake, when merged with the colder spring waters, would elevate stream temperatures in the bypass reach. For this reason, CES recommends that the winter curves take effect from September 15 through May 14 of each year: 2 cfs are required at the diversion and 6 cfs at the IFIM site during the winter period.
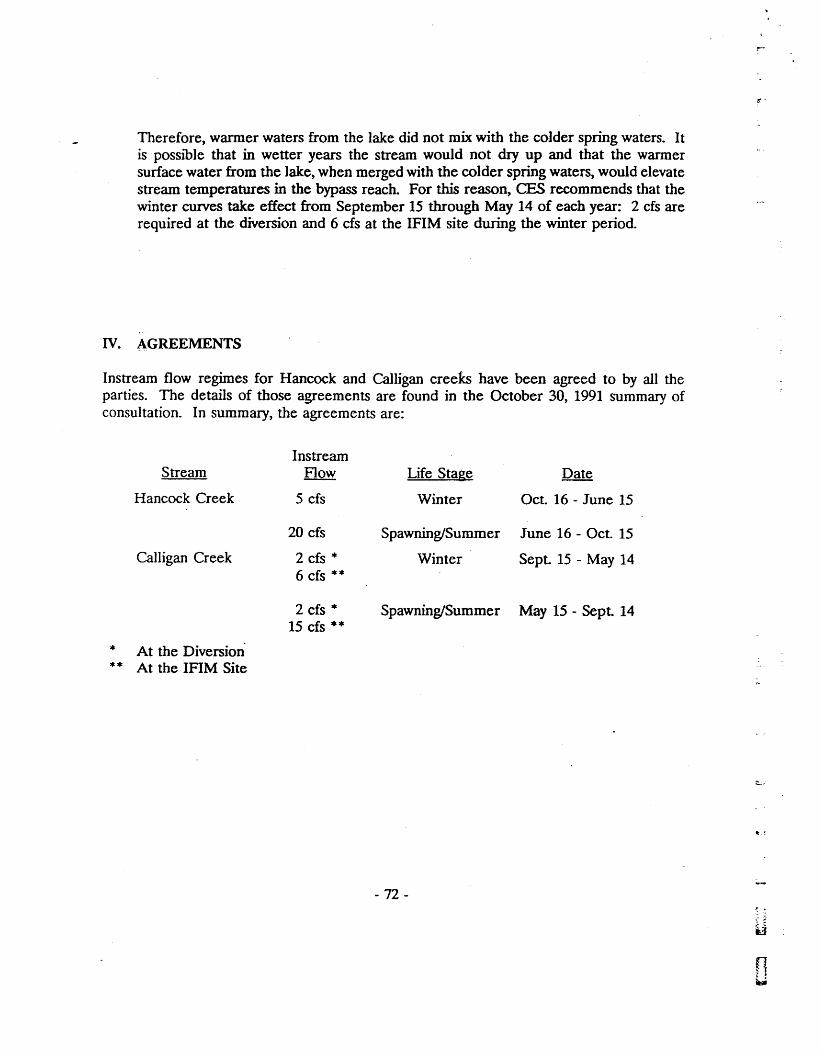
IV. AGREEMENTS
Instream flow regimes for Hancock and Calligan creeks have been agreed to by all the parties. The details of those agreements are found in the October 30, 1991 summary of consultation. In summary, the agreements are:
Instrearn Stream Flow Life Stage Date
Hancock Creek 5 cfs Winter Oct. 16 - June 15
20 cfs Spawning/Summer June 16 - Oct. 15
Calligan Creek 2 cfs * Winter Sept. 15 - May 14 6 cfs **
2 cfs * Spawning/Summer May 15 - Sept 14 15 cfs **
* At the Diversion ** At the IFIM Site
- 72-
,.
It.,
F •
U
LITERATURE CITED
Campbell, R. F. and J. H. Neuner. 1985a Seasonal and diurnal shifts in habitat utilized by resident rainbow trout (Salmno gairdneri) observed in Western Washington Cascade Mountain Streams. Proceedings of Symposium of Small Hydropower and Fisheries, Denver, CO. May 1 - 3?1985.
CampbeIl~ R. F. and J. H. Neuner. 1985b. Habitat suitability and preferen~e criteria development for resident rainbow trout in Western Washington Cascade Mountain streams. Draft report prepared for Puget Sound Power & Light Company, Bellevue, W A, by BEAK Consultants, Kirkland, W A August, 1985.
Leitritz, E., and R. C. Lewis. 1976. Trout and salmon culture (hatchery methods). California Dept. Fish and Game, Fish Bun. 164. 197 p.
Piper, R. G., I. B. McE1wain, L E. Orme, J. T. McCraren, L G. Fowler, J. R. Leonard. 1982 .. Fish Hatchery Management. Dept. of the Interior, U.S. Fish and Wildlife Service. 517 p.

~ ..
...;-
I'