Embed Size (px)
Citation preview
SPE DISTINGUISHED LECTURER SERIESis funded principally
through a grant of the
SPE FOUNDATIONThe Society gratefully acknowledges
those companies that support the programby allowing their professionals
to participate as Lecturers.
And special thanks to The American Institute of Mining, Metallurgical,and Petroleum Engineers (AIME) for their contribution to the program.
E & PA Dynamic Growth Business
Aidan McKay, SPEShell Exploration & Production Company
SPE Paper 84433Originally presented at SPE – ATCE Denver, CO
October 2003

History of Supply / Demand and Growth
Potential Investment Levels Required
Six Competitive Forces Shaping the EP Industry
Profits
Conclusions
SPE 84433 A McKay

Hydrocarbon (Oil & Gas ) Demand from Wellbores
Aggregate global production decline is ~ 5+% per annum.Aggregate long term oil & gas growth is 1.5% per annum average.
Dai
ly P
rod
uct
ion
(M
illio
n B
oe/
d)
0
40
80
120
160128 mln boe/d
1980 1990 2000 2010
200
240
2030
Oil (?)
Gas (?)
19951985 2005 20202015 2025
Current estimated decline rate
SPE 84433 A McKay

0
200
400
600
800
1000
1200
1400
1940 1950 1960 1970 1980 1990 2000 2010 2020 2030
Nu
mb
er o
f C
ars
& L
igh
t T
ruck
s G
lob
ally
(m
illio
ns)
Number of Vehicles Globally (History and Forecast)
Range of Forecasts
[Assumes an 8 Bln population by 2030]
USA ~ 200 mln vehicles (adding 15 mln pa)China ~ 5 mln (Growth undefined)
SPE 84433 A McKay

0
5
10
15
20
25
30
35
1940 1950 1960 1970 1980 1990 2000 2010 2020 2030
Time (Years)
Nu
mb
er
of
Co
mm
erci
al A
irc
raft
(th
ou
sa
nd
s)
Range of Forecasts
Number of Commercial Aircraft
[Assumes an 8 Bln population by 2030 AND economic progress ] SPE 84433 A McKay

Oil 1100 Bln bbl(Expect+ Undiscov.= 2000 Bln)
Gas 700 Bln boe4000 Tcf
0
1000
2000
3000
4000
5000
6000
Hydrocarbon Demand from
WellboresGrowing at ~1-
2% pa
World Proven Hydrocarbons (Bln Boe)
1000-3000 Bln boeOil sands/BitumenHeavy etc
• The planet may have 40 - 100 years supply• 80% of hydrocarbons are in onshore areas; 20% offshore• Much is low cost access…..most owned by governments…• New ones (mature) opening each day.
2002 203044 Bln boe 88 Bln boe
Hy
dro
carb
on
Res
erv
es &
De
ma
nd
(B
ln b
oe
)
?
SPE 84433 A McKay

Private Oil Company Annual EP Capex Actuals & Forecasts
0
50
100
150
200
250
300
1960 1970 1980 1990 2000 2010 2020 2030
Ca
pit
al In
ve
stm
en
t C
ap
ex
($ B
ln)
Time (Years)
~ $1 Bln scale “giant” projects, start of offshore, DW etc
Big 5 oil companies ’93 ~18 Bln pa, 2003 ~$34 Bln toincrease oil by 15 % & Gas by 20 % in 10 years to 14.8 mln Exxon, BP, Shell, Chev, TFE
Big US Independents ~ $8 Bln pa, for 2 mln boe/d
Excludes OPEC Countries and Russia Spend]
SPE 84433 A McKay
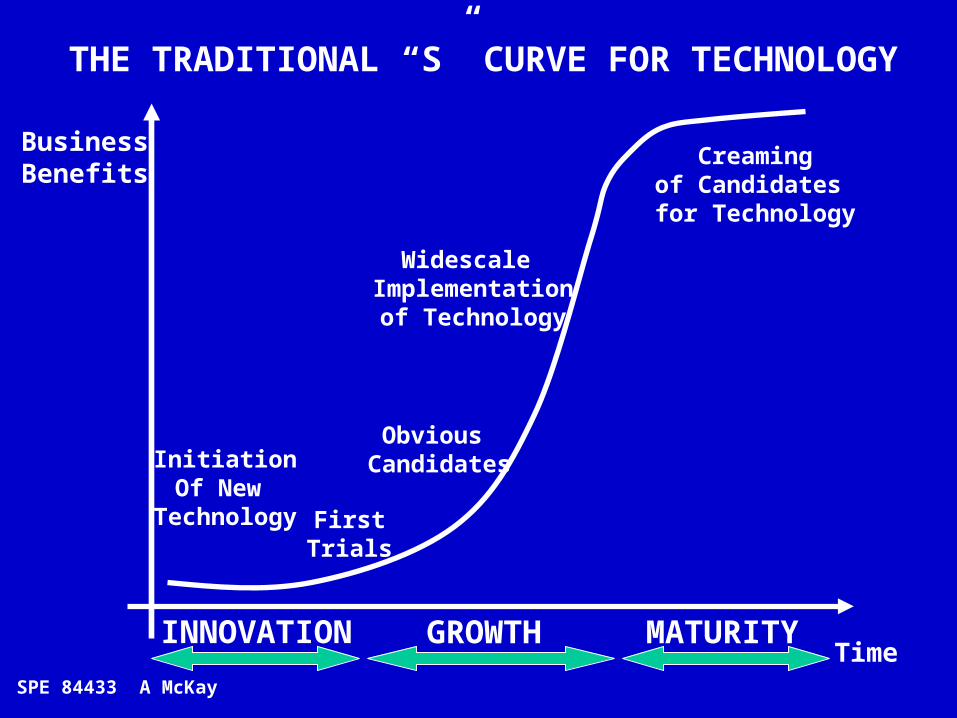
THE TRADITIONAL “S” CURVE FOR TECHNOLOGY
InitiationOf New
Technology
Widescale Implementationof Technology
Creamingof Candidates for Technology
Time
BusinessBenefits
FirstTrials
Obvious Candidates
INNOVATION GROWTH MATURITY
SPE 84433 A McKay

New Well Technology S Curve Evolution
Vertical &Deviated Wells
1970 1980 1990 2000
Time 2010
HydraulicFracturing
HorizontalWells
MultilateralWells
MultilateralMulti-fracced
Wells
Underbalanced Drilling Offshore
HorizontalWells with
Hydraulic Fracturing
Coiled TubingDrilling
Business
Benefits?
Slim HoleExploration
Intelligent Wells
GAINS CONTINUE ?
SPE 84433 A McKay
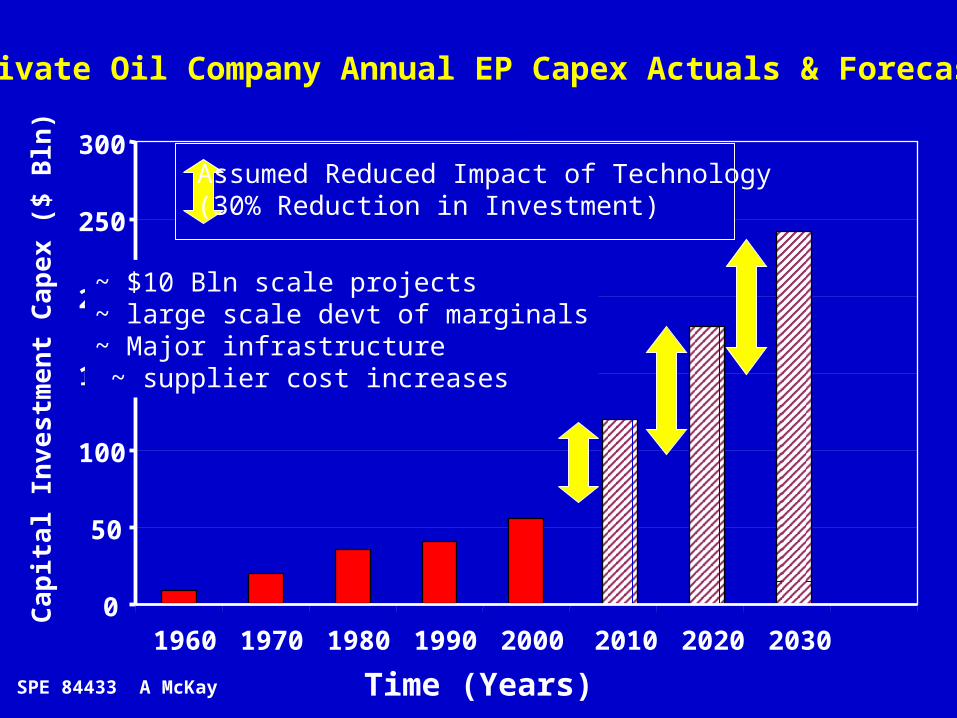
Private Oil Company Annual EP Capex Actuals & Forecasts
0
50
100
150
200
250
300
1960 1970 1980 1990 2000 2010 2020 2030
Ca
pit
al In
ve
stm
en
t C
ap
ex
($ B
ln)
Assumed Reduced Impact of Technology(30% Reduction in Investment)
Time (Years)
~ $10 Bln scale projects~ large scale devt of marginals~ Major infrastructure ~ supplier cost increases
SPE 84433 A McKay

Industry Sector Research and Development Spend 2001
01020304050607080
IT &
Har
dware
Autom
otive
Indust
ry
Pharm
aceu
tical
s
Elect
ronic
s & E
lect
rical
Softwar
e & IT
Ser
vice
s
Chemic
als
Aerosp
ace
& Def
ense
Telec
oms
Oil & G
as
Perso
nal C
are
Diver
sifie
d Indust
rials
(Conglo
mer
ates
)
Industrial Sector
An
nu
al R
&D
In
vest
men
t ($
Bln
)
$3.3 Bln in totalEP ~ $2 Bln in total
Source: UK Financial Times Monday 14th October 2002 pages 10 -11
NB : 1995 equivalent R&D spend was ~ $4 Bln
SPE 84433 A McKay

Oil & Gas Company Research and Development Spend
0
100
200
300
400
500
600
700
800
900
Schlu
mber
ger
Total,
Fina
Elf
ExxonM
obil
Shell/R
oyal D
utch BP
Hallib
urton
Chevro
nTexac
o
ENI (AGIP
)
200120001999
An
nu
al R
&D
Sp
en
din
g (
$ m
ln )
Source : Company Annual Reports
• Pressures from Shareholders to cut R&D spending in 1990s.• Service Industry starts to do material “ tech devt”, but significantly lower profits mean less R&D funding SPE 84433 A McKay
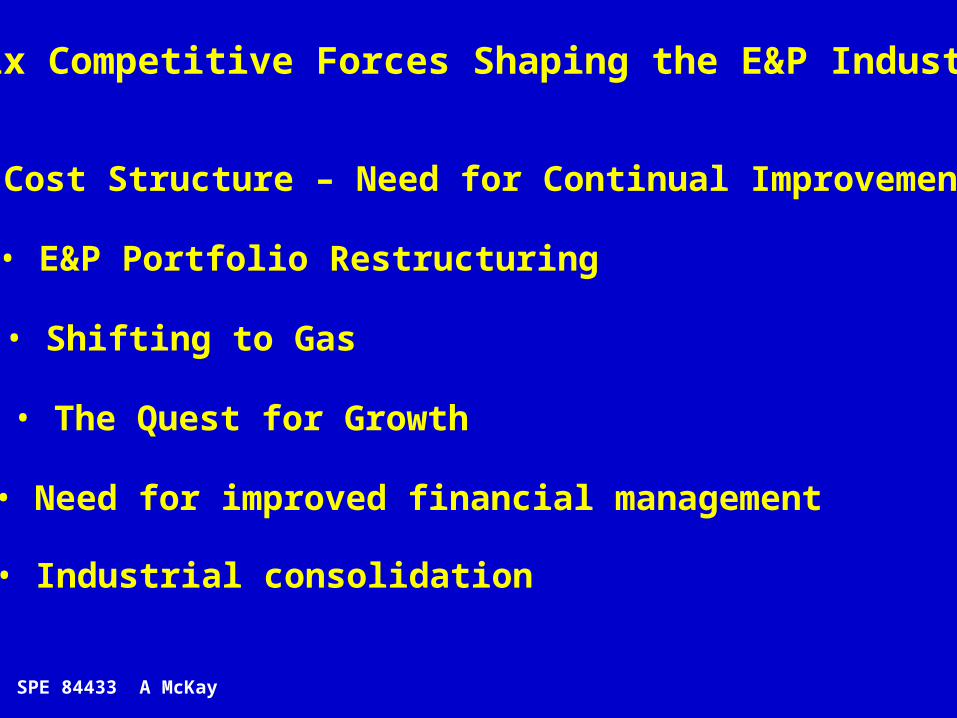
• Cost Structure – Need for Continual Improvement
• E&P Portfolio Restructuring
• Shifting to Gas
• The Quest for Growth
• Need for improved financial management
• Industrial consolidation
Six Competitive Forces Shaping the E&P Industry
SPE 84433 A McKay

Where to Exploit the Hydrocarbons in Longer Term
“OLD” EP Business “NEW” EP Business
USA, Canada, North Sea,Small ME CountriesSelected others
Brazil, Angola, Iran, CIS, Sakhalin, Kazakhstan, ChinaOther OPEC Countries, S. America, Pakistan, Bangladesh
+ Low Govt Take, stable terms- High UTCs- Mature Basins (limited growth)- Capital intensive, - high costs on supply curve+ Long asset tenure+ High upside at higher prices + gas markets are developed
- High Govt Take, less stable terms- Commercially risky- Limited upside @ higher prices- gas markets are emerging- ultra competitive (“loss leading”)- Lower degree of control with govt+ Green/Brownfield (high growth)+ Low UTCs- MRH ; DW High UTCs
Natural Shift with Declines
Where EP Industry made most of the money in the past …..But margin is small @ low pricesand where capex treadmill potential exists
Where the EP industry must go in the future, but where EP margin may be thin.....at all oil/gas prices like R&M or Chemicals
SAUDI, KUWAIT,IRAN, IRAQ, UAE
BIG 5 MEO
- High Govt Take, - Commercially risky- Limited upside @ higher prices- gas markets are emerging- ultra competitive (“loss leading”)- Low degree of control with govt+ Green/Brownfield (high growth)+ Low UTCs resources
QATAR, Russia
BIG GAS
SPE 84433 A McKay

E&P UNIT MARGINS ($/bbl) FOR E&P ENVIRONMENTS
00.5
11.5
22.5
33.5
44.5
55.5
66.5
77.5
88.5
99.510
10.511
11.5
USAUK
Canad
a
Nether
lands
Denm
ark
Germ
any
Egypt
Gabon
Thaila
nd
Niger
ia
Venez
uela
Angola
Brazil
Kazak
hstan
China
Russia
Abu Dhab
i
Kuwait
Saudi
$16/bbl oil & $3/mln scf gas
$22/bbl oil & 3.5/mln scf gas
$30/bbl oil & $4.75/mln scf gas
Ne
t In
com
e A
fter
Tax
pe
r B
oe
($/b
oe
)
OLD E&P(examples)
NEW E&P(examples)
BIG5MEO(likely rents)
BIG- GASQatar
(likely rents)
Which is better: “bond-like” investments or investments with more risks but with price upside?SPE 84433 A McKay

Standard Oil (NJ)Socony VacuumSuperior OilStandard Oil (IN)Standard Oil (OH)AtlanticRichfieldSinclair British Petroleum
PhillipsAminoilGeneral American Oil
1950 1960 1970 1980 1990 2000Exxon/MobilMobil
BP
The Texas Co.TidewaterPacific Western GettySkellyGulf Standard Oil (CA)Standard Oil (KY)
Texaco
Chevron
Chev/Tex
ConocoPhillips
Royal Dutch/ShellShell Oil
Royal Dutch/Shell
AmocoArcoVastar
Union OilPure Oil
Unocal
50 years of EP Consolidation Continues, Nationals Join, What Next?
Continental
OccidentalCities Service
Occidental
Marathon
2005+
State Oils & Former State OilsTFE, ENI, REPSOL, PETROBRAS,
Britoil+ TNK

2003 2005 - 2010Exxon/Mobil
BP
Chev/Tex
Phillips/Conoco
Royal Dutch/Shell
Will Consolidation Continue? In What Form?
TFE
+ Repsol (?)
ENI
Petrobras
Statoil + Norske Hydro (?)
YUKOS Sibneft (?) GaZprom (?)
SPE 84433
• Alignment around geography & cultures• Regulatory involvement is likely • National Oils rightly playing away from home
• Does Aramco marry or eat the survivors• How will Gasprom play going forward ?
Rosneft
SPE 84433 A McKay
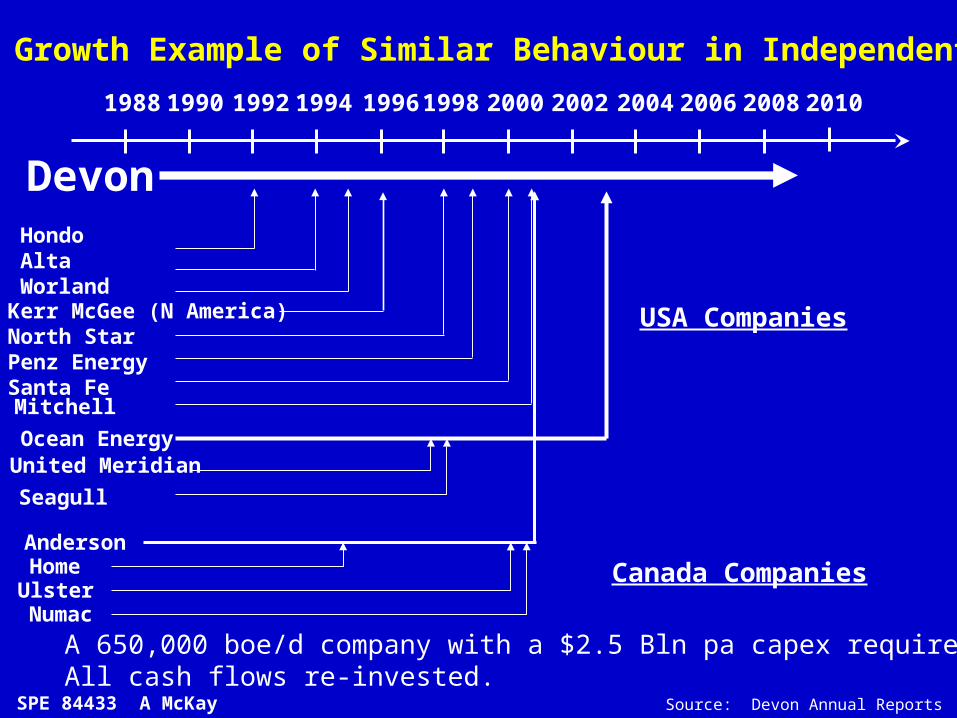
1988 1990 1992 1994 1996 1998 2000 2002 2004 2006 2008
HondoAltaWorlandKerr McGee (N America)North StarPenz EnergySanta Fe
Anderson
Mitchell
Ocean Energy
HomeUlsterNumac
United Meridian
Seagull
2010
Canada Companies
USA Companies
An Growth Example of Similar Behaviour in Independents
Devon
Source: Devon Annual Reports
A 650,000 boe/d company with a $2.5 Bln pa capex requirement,All cash flows re-invested.
SPE 84433 A McKay
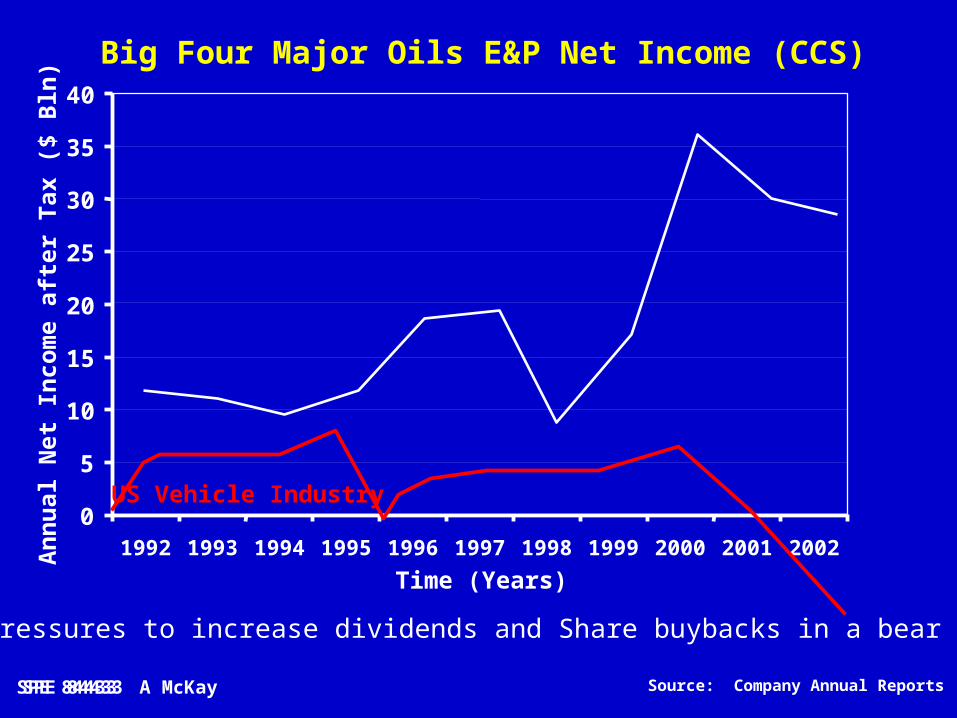
Big Four Major Oils E&P Net Income (CCS)
0
5
10
15
20
25
30
35
40
1992 1993 1994 1995 1996 1997 1998 1999 2000 2001 2002
Time (Years)
An
nu
al N
et I
nco
me
afte
r T
ax (
$ B
ln)
Source: Company Annual ReportsSPE 84433
Large pressures to increase dividends and Share buybacks in a bear market
US Vehicle Industry
SPE 84433 A McKay

General MotorsAT&TUS SteelS..O. N.J. (Exxon)
G.E. DuPont
F.W. WoolworthS.H. KressS.Oil of California
NY Central Railroad
1.2.3.4.
5.6.
7.8.9.
10.
221899
98
776
6
CompanyMkt Cap(S Bln )Rank
1928
IBMAT&TGeneral MotorsEastman Kodak
Exxon Sears Roebuck
TexacoXeroxGE
Gulf Oil
1591027651
5140
323127
24
CompanyMkt Cap($ Bln )
1969
GEMicrosoftCitigroupCisco
ExxonMobil Pfizer
IntelWal-MartIBM
Nokia
459335314306
284271
244239194
187
CompanyMkt Cap($ Bln )
1999
The Ten Largest US Market Capitalisations Versus Time
Source: VariousSPE 84433
Wal-Mart
GE
Citigroup
ExxonMobil
Pfizer
Merck
Johnson & JIBMAIG
266256231217
178173
163137128
114
CompanyMkt Cap($ Bln )
2003
Microsoft
Oil Companies will continue to play huge global role
SPE 84433 A McKay

Conclusions E&P is a dynamic, profitable, growth business
E&P business is capital intensive and requires high technology like space travel or the defence industry
We have interesting conflicts in meeting global hydrocarbon demand whilst meeting the needs of stakeholders
The scale of investment required will be challenging and is not recognised in society.
Sustaining the industry success will require R&D success levels at least equal to those of the past to keep future investment costs down. We need to avoid under-investing in the research we need.
We have met the energy needs of the planet in the past and will do so in future. This is a great place to work.
SPE 84433SPE 84433 A McKay

Key Points to Reflect on: Can we get OEDC individuals out of cars, into buses/trains ?
Quality E&P investments are very, rare (ie risk/reward balance)
Portfolio Management & Mergers add nothing to global supply
Selling assets in production returning WACC+, is dubious.
Role of Exploration 2005 –2030 is very uncertain, If so then where
BI5MEO, BIGGAS, NEW EP, or Frontier exploration
Impact of Technology in Future in Cost Redn (Is it large or small)
Not at all clear that material steps are being made
R&D Spend is low (vs industries & history), so what breakthroughs
Majors & Service Industry may not be doing enough
Cash Today is Mantra, (Dividends & Buybacks) not investment
Having a large surplus of cash today, is not valued in market.
SPE 84433SPE 84433 A McKay

Backup Slides
Not likely to be Used
SPE 84433 A McKay

02468
101214161820222426283032343638
1900 1910 1920 1930 1940 1950 1960 1970 1980 1990 2000 2010 2020 2030
Oil
Pri
ce (
$/b
bl)
Act
ual
Low Oil Price World1910-1970
VolatileOil Price
World1971-2002
VolatileOr Low Oil
PriceWorld again
Possible Outlooks on Oil Prices?
?
SPE 84433 A McKay

March 1999SPE 84433 A McKay
We Tend To Get Overly Pessimistic in Downturns

September 2000SPE 84433 A McKay
Then rapidly revert 12-18 months later ….Yet the big supply demand did not change?
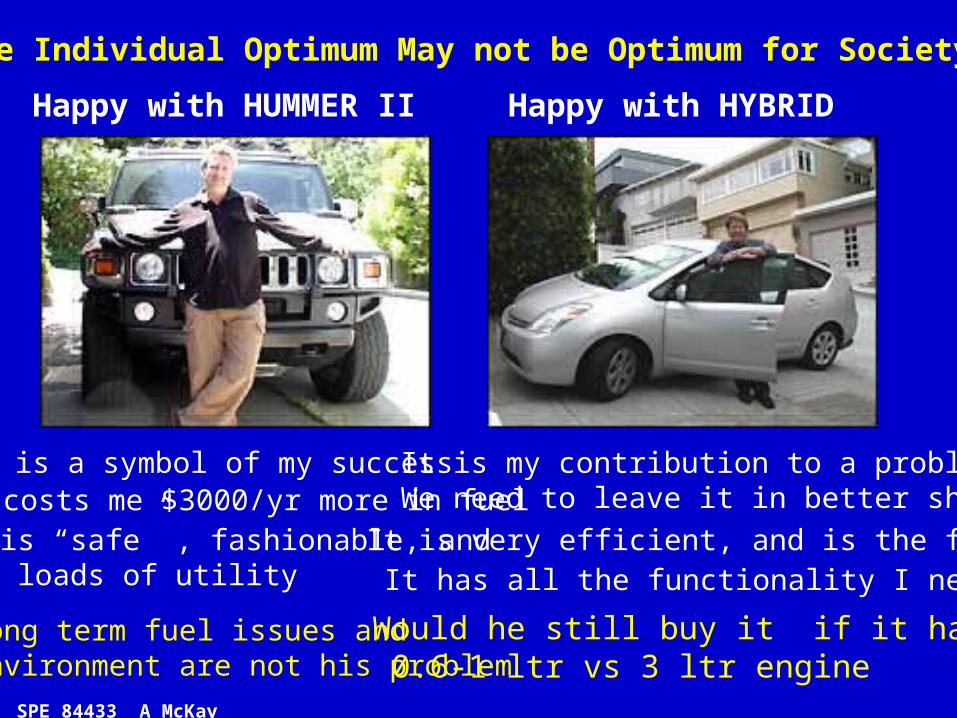
Happy with HUMMER II Happy with HYBRID
It is a symbol of my successIt costs me $3000/yr more in fuelIt is “safe” , fashionable, andHas loads of utility
It is my contribution to a problem,We need to leave it in better shape
It is very efficient, and is the futureIt has all the functionality I need
The Individual Optimum May not be Optimum for Society
SPE 84433 A McKay
Would he still buy it if it had a 0.6-1 ltr vs 3 ltr engine
Long term fuel issues and Environment are not his problem

0123456789
10
Gener
al M
otors
Toyota
Ford
Volksw
agon
Damlie
rChry
sler
PSA/Peu
geot/C
itroen
Hyundai
Auto
motiv
e
Nissa
n
Honda
Renau
lt
Annual Car Sales By Top Ten ManufacturersN
umbe
r of
Car
s (M
lns)
(Does not include Trucks or buses etc)
SPE 84433 A McKay
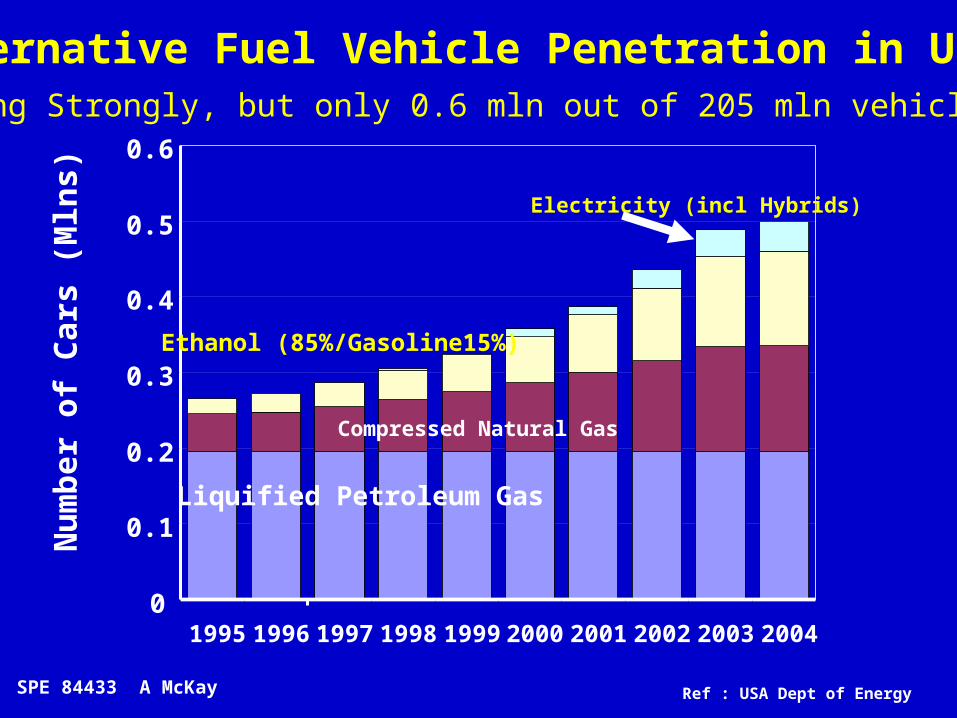
Alternative Fuel Vehicle Penetration in USA N
um
ber
of
Car
s (M
lns)
0
0.1
0.2
0.3
0.4
0.5
0.6
1995 1996 1997 1998 1999 2000 2001 2002 2003 2004
Electricity (incl Hybrids)
Ethanol (85%/Gasoline15%)
Compressed Natural Gas
Liquified Petroleum Gas
Ref : USA Dept of Energy
Growing Strongly, but only 0.6 mln out of 205 mln vehicles
SPE 84433 A McKay

EP Technology S Curve Evolution
Vertical &Deviated Wells
1970 1980 1990 2000
Time 2010
HydraulicFracturing
HorizontalWells
MultilateralWells
MultilateralMulti-fracced
Wells
Underbalanced Drilling Offshore
HorizontalWells with
Hydraulic Fracturing
Coiled TubingDrilling
Business
Benefits?
Slim HoleExploration
Intelligent Wells
GAINS CONTINUE ?
SPE 84433
CREAMING OCCURS ?[Capital Intensity rises]