Embed Size (px)
Citation preview
1 Mission Analytics Group, Inc. | Semiannual Report, January 2018 – June 2018
Special Incident Trends Semiannual Report submitted to the California Department of Developmental Services
January – June 2018
ABOUT THIS REPORT
As one element of risk management and quality assurance, the California Department of Developmental Services (DDS)
and California’s network of regional centers monitor the occurrence of adverse events, captured through Special Incident
Reports (SIR), to identify trends and develop strategies to prevent and mitigate risks. As required by Title 17, Section
54327 of the California Code of Regulations, vendors and long-term health care facilities report occurrences of suspected
abuse, suspected neglect, injury requiring medical attention, unplanned hospitalization, and missing persons, if they
occur when an individual is receiving services funded by a regional center (under vendored care). In addition, any
occurrence of mortality or an individual being the victim of crime must be reported whether or not it occurred while they
were under vendored care. Because of these requirements, mortality incidents are reported for all individuals served by
DDS, but most non-mortality incidents are reported among individuals residing in out-of-home care settings. These
include licensed care facilities, Family Home Agencies (FHA), Independent Living Services (ILS), and Supported Living
Services (SLS).
This report summarizes incident rates for individuals served by DDS between January 2018 and June 2018. Findings on
mortality incidents include all individuals actively served by regional centers, except those residing in developmental
centers. Findings on non-mortality incidents focus on individuals in out-of-home care.
The statistics and graphs presented in this report were constructed using data reported in the SIR system through June
2018. Incident counts may differ from previous reports due to SIRs being added or reclassified as non-reportable. The SIR
data are augmented with three additional data sources maintained by DDS: the Client Master File (CMF), the Client
Development Evaluation Report (CDER), and the Purchase of Service (POS).
Report prepared: September 2018
KEY FINDINGS The mortality rate decreased this period compared to the same period last year.
Mortality rates declined in most age groups and for most residence types.
The non-mortality rate was similar to the same period last year, but lower after adjusting for changes in the mix of individuals served.
Non-mortality rates rose for younger individuals but fell for older individuals compared to the same period last year, when older individuals had higher rates of hospitalization.
MORTALITY AND NON-MORTALITY INCIDENTS
2 Mission Analytics Group, Inc. | Semiannual Report, January 2018 – June 2018
TABLE OF CONTENTS
I. Summary of Non-Mortality and Mortality Incidents ................................................................................................. 3
II. Mortality Incident Findings .......................................................................................................................................... 5
By Age .............................................................................................................................................................................. 5
By Residence Type .......................................................................................................................................................... 6
Over Time ........................................................................................................................................................................ 7
III. Non-Mortality Incident Findings ................................................................................................................................10
By Age ............................................................................................................................................................................. 11
By Residence Type ......................................................................................................................................................... 12
Over Time ....................................................................................................................................................................... 13
IV. Risk Management Efforts ............................................................................................................................................ 18
V. Appendix ...................................................................................................................................................................... 20

MORTALITY AND NON-MORTALITY INCIDENTS
3 Mission Analytics Group, Inc. | Semiannual Report, January 2018 – June 2018
I. SUMMARY OF MORTALITY AND NON-MORTALITY INCIDENTS
Between January and June 2018, 325,080 individuals living in the community received services from a regional center.
During the period, there were 11,141 special incidents reported for these individuals, including 1,043 deaths and 10,098
non-mortality incidents. Since non-mortality SIRs are required primarily for incidents that occur under vendored care, 90
percent of non-mortality incident reports involve the 20 percent of individuals living in out-of-home care settings. DDS
served 63,624 people living in such settings this period.
Table 1: Reported Incidents for Individuals Served by DDS, January – June 2018 Compared to January- June 2017
January - June 2017
(Last Year)
January - June 2018
(Current Period)
Total Number of Individuals as of June, including Early Start1 310,209 325,080
Reported Mortality and Non-Mortality Incidents, including Early Start 11,173 11,141
Number of Deaths, including Early Start 1,078 1,043
Deaths per 1,000 Individuals, including Early Start 3.48 3.21
Number of Individuals, excluding Early Start or Below 36 Months 269,937 281,671
Number of Deaths 1,035 1,001
Deaths per 1,000 Individuals 3.83 3.55
Out-of-Home Individuals 63,378 63,624
Number of Non-Mortality Incidents 9,168 9,136
Non-Mortality Incidents per 1,000 Individuals2 144.7 143.6 Data as received through July 2018. Incident counts may differ from previous reports due to SIRs being added or reclassified as non-reportable. Mortality SIRs that did not occur under vendored care are most likely to be added later. 1Active and Early Start (<36 months) caseload as reported by DDS for final month of the period. 2One person can have multiple non-mortality incidents in a period. .
THE MORTALITY RATE DECREASED THIS PERIOD COMPARED TO THE SAME PERIOD LAST YEAR.
The mortality rate is generally higher from January-June each year, due to seasonal differences in respiratory illnesses
and other health conditions. Therefore, we typically compare rates in each semi-annual period to rates in the same
period in the previous year. Above, we compare January – June 2018 to January – June 2017. The first panel of Table 1
reports the mortality rate measured as the number of deaths per 1,000 individuals served by DDS. In the January-June
2018 period, this rate was 3.21, 8% lower than in the same period last year (3.48). (This difference is statistically significant
at the 90% confidence level.) Note, however, that there are sometimes delays in deaths being reported to DDS,
particularly for individuals residing with parents or guardians, so the number of deaths for this period may increase in
subsequent reports.
Our more detailed mortality analyses exclude children under three and/or those served in the Early Start program. There
are two main reasons for this exclusion. First, children served by Early Start may not qualify for DDS services after
age three, since the Early Start Program provides early intervention services for children with developmental
delays or conditions that put them at high risk of developmental delays or disabilities. These children are not yet,

MORTALITY AND NON-MORTALITY INCIDENTS
4 Mission Analytics Group, Inc. | Semiannual Report, January 2018– June 2018
and may never be, diagnosed with a developmental disability. Second, there are substantial differences in the data
collected for Early Start compared to other DDS services, which makes it difficult to conduct combined analyses. There is
a comparable pattern of rates over time, however, with a 7% decline for this period relative to the same period a year ago.
THE NUMBER OF NON-MORTALITY INCIDENTS PER 1,000 INDIVIDUALS WAS SLIGHTLY LOWER THIS
PERIOD THAN IN THE SAME PERIOD LAST YEAR. Non-mortality special incidents include missing person, suspected abuse, suspected neglect, medication error or serious
injury, unplanned medical or psychiatric hospitalization, victim of crime, and death. In this semiannual period, there
were approximately 144 non-mortality incidents per 1,000 out-of-home individuals served by DDS, just about 1 incident
per 1,000 lower than for January to June last year (144.7).
MORTALITY INCIDENTS
5 Mission Analytics Group, Inc. | Semiannual Report, January 2018 – June 2018
II. MORTALITY INCIDENT FINDINGS
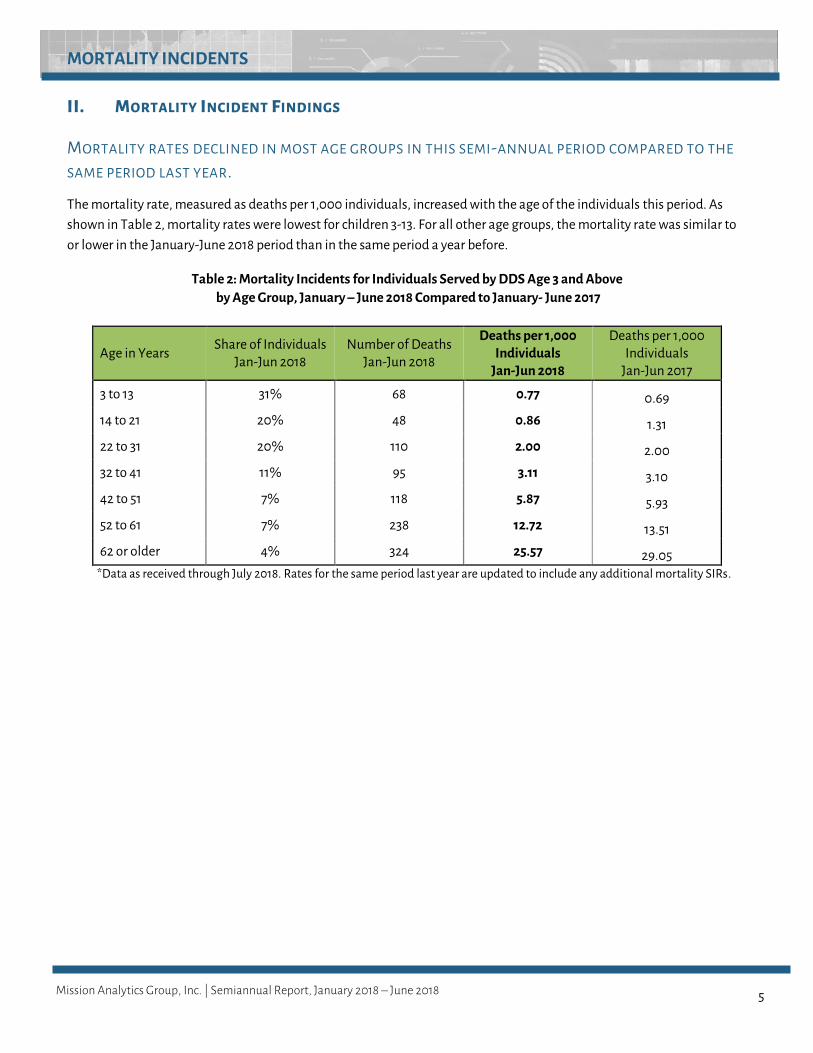
MORTALITY RATES DECLINED IN MOST AGE GROUPS IN THIS SEMI-ANNUAL PERIOD COMPARED TO THE
SAME PERIOD LAST YEAR.
The mortality rate, measured as deaths per 1,000 individuals, increased with the age of the individuals this period. As
shown in Table 2, mortality rates were lowest for children 3-13. For all other age groups, the mortality rate was similar to
or lower in the January-June 2018 period than in the same period a year before.
Table 2: Mortality Incidents for Individuals Served by DDS Age 3 and Above
by Age Group, January – June 2018 Compared to January- June 2017
Age in Years Share of Individuals
Jan-Jun 2018 Number of Deaths
Jan-Jun 2018
Deaths per 1,000 Individuals
Jan-Jun 2018
Deaths per 1,000 Individuals
Jan-Jun 2017
3 to 13 31% 68 0.77 0.69
14 to 21 20% 48 0.86 1.31
22 to 31 20% 110 2.00 2.00
32 to 41 11% 95 3.11 3.10
42 to 51 7% 118 5.87 5.93
52 to 61 7% 238 12.72 13.51
62 or older 4% 324 25.57 29.05 *Data as received through July 2018. Rates for the same period last year are updated to include any additional mortality SIRs.

MORTALITY INCIDENTS
6 Mission Analytics Group, Inc. | Semiannual Report, January 2018 – June 2018
MORTALITY RATES DECLINED IN ALL RESIDENCE TYPES EXCEPT SKILLED NURSING.
Consistent with the predominance of young people, the mortality rate is lowest for those who live at home (1.54 per
1,000). The mortality rate is highest for individuals who live in Skilled Nursing Facilities or Intermediate Care Facilities
(34.61 per 1,000), reflecting their significant health issues. These facilities were the only group that had an increase in the
deaths per 1,000 compared to the same period in 2017, although the difference is not statistically significant.
Table 3: Mortality Incidents for Individuals Served by DDS Age 3 and Above, by Residence Type, January – June 2018 Compared to January – June 2017
Residence Type Share of
Individuals Jan-Jun 2018
Number of Deaths
Jan-Jun 2018
Deaths per 1,000
Individuals Jan-Jun 2018
Deaths per 1,000
Individuals Jan-Jun 2017
Home of Parent/Guardian/Relative 77% 336 1.54 1.73
Independent/Supported Living Services (ILS/SLS)
8% 214 9.06 9.81
Community Care Facilities (CCF) 9% 126 4.78 4.76
Skilled Nursing /Intermediate Care Facilities (SNF/ICF)
3% 279 34.61 32.40
Other 2% 46 8.42 10.16
*As shown in Table 3, the largest number of deaths (34%) occurred among individuals living in the home of a parent or guardian. This residential setting accounts for three quarters of all individuals served by DDS, including most children and young adults.
THE CASE-MIX ADJUSTED MORTALITY RATE DECREASED BY 5% THIS SEMIANNUAL PERIOD COMPARED
TO THE SAME PERIOD LAST YEAR.
Case-mix adjustment allows one to monitor risk management by calculating measures that are not influenced by
changes in the mix of people served by age, health status, or other risk factors. It accounts for the individual
characteristics, including age, residential setting, diagnosis, skills of daily living, behavioral challenges, and history of
incidents. Case-mix adjusted trends examine changes in rates keeping the population characteristics the same over time.
In doing so, the trend in the adjusted rate is more likely to reflect risk management practices or changes in underlying
risks (such as influenza outbreaks). Adjusted rates are calculated for each month and then averaged over the period. The
adjusted rate shows what the mortality rate would be if the caseload characteristics were the same over the past several
years.
The monthly mortality rate is the average likelihood that an individual will die in a month. As shown in Table 4, the
unadjusted average monthly mortality rate is one-sixth of the semiannual rate in Table 1, but it is expressed in
percentages instead of deaths per 1,000. Like the rates shown in Figure 1, the case-mix adjusted mortality rate also
MORTALITY INCIDENTS
7 Mission Analytics Group, Inc. | Semiannual Report, January 2018– June 2018
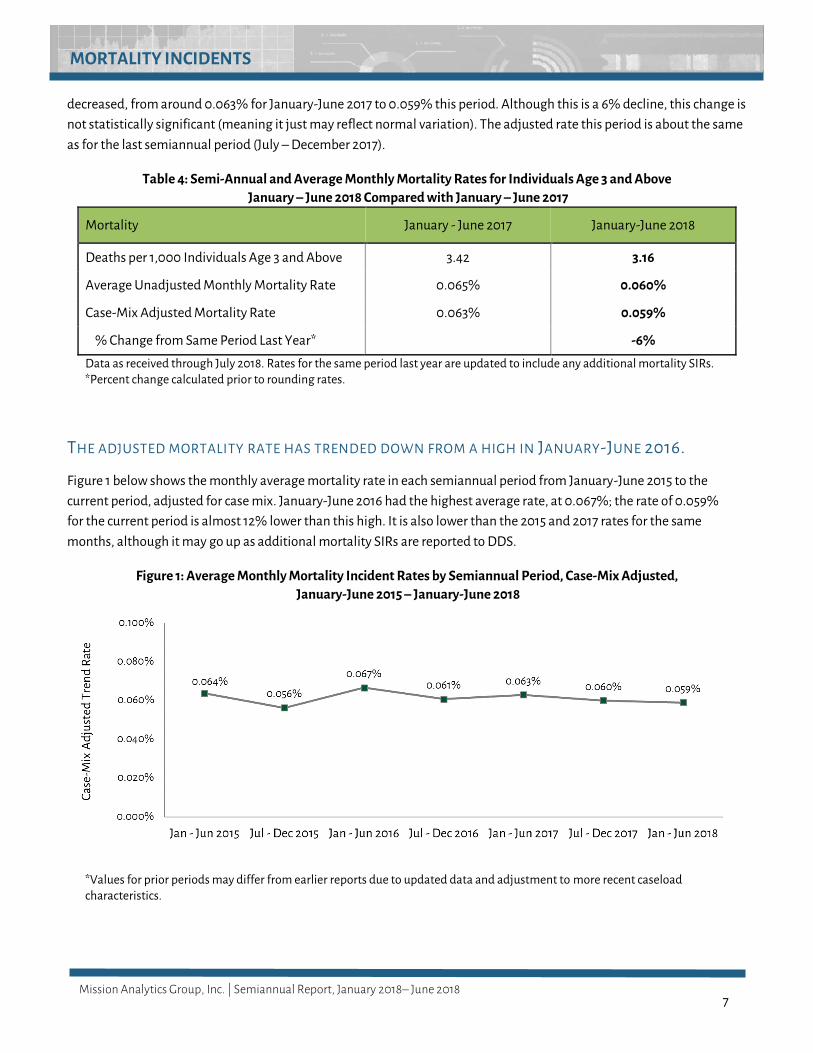
decreased, from around 0.063% for January-June 2017 to 0.059% this period. Although this is a 6% decline, this change is
not statistically significant (meaning it just may reflect normal variation). The adjusted rate this period is about the same
as for the last semiannual period (July – December 2017).
Table 4: Semi-Annual and Average Monthly Mortality Rates for Individuals Age 3 and Above
January – June 2018 Compared with January – June 2017
Mortality January - June 2017 January-June 2018
Deaths per 1,000 Individuals Age 3 and Above 3.42 3.16
Average Unadjusted Monthly Mortality Rate 0.065% 0.060%
Case-Mix Adjusted Mortality Rate 0.063% 0.059%
% Change from Same Period Last Year* -6%
Data as received through July 2018. Rates for the same period last year are updated to include any additional mortality SIRs. *Percent change calculated prior to rounding rates.
THE ADJUSTED MORTALITY RATE HAS TRENDED DOWN FROM A HIGH IN JANUARY-JUNE 2016.
Figure 1 below shows the monthly average mortality rate in each semiannual period from January-June 2015 to the
current period, adjusted for case mix. January-June 2016 had the highest average rate, at 0.067%; the rate of 0.059%
for the current period is almost 12% lower than this high. It is also lower than the 2015 and 2017 rates for the same
months, although it may go up as additional mortality SIRs are reported to DDS.
Figure 1: Average Monthly Mortality Incident Rates by Semiannual Period, Case-Mix Adjusted,
January-June 2015 – January-June 2018
*Values for prior periods may differ from earlier reports due to updated data and adjustment to more recent caseload characteristics.

MORTALITY INCIDENTS
8 Mission Analytics Group, Inc. | Semiannual Report, January 2018– June 2018
THERE IS A WIDE RANGE IN MORTALITY RATES ACROSS REGIONAL CENTERS, EVEN AFTER ACCOUNTING
FOR DIFFERENCES IN POPULATIONS SERVED.
Case-mix adjustment also allows one to compare regional centers, accounting for differences in their caseloads. To do
this, each regional center’s average monthly mortality rate is adjusted to align with the statewide DDS population. The
bars in Figure 2 represent how much each regional center’s adjusted mortality rate is above or below the statewide rate.
Regional centers serving small populations can have substantial month-to-month variation in their mortality rate.
Therefore, Figure 2 shows the average differences over the past year (fiscal year 2017-18). The average monthly rates
(adjusted for case mix) range from 0.043% at San Andreas Regional Center to 0.097% at Kern Regional Center (KRC).
Comparing these to the unadjusted statewide rate, which averaged 0.060% for the year, these translate to a range of
29% below to 59% above the statewide rate.

MORTALITY INCIDENTS
9 Mission Analytics Group, Inc. | Semiannual Report, January 2018– June 2018
Figure 2: Adjusted Mortality Rates by Regional Center, Average Monthly Rate as a Percentage Above or Below the Statewide Average, July 2017 – June 2018
KRC’s adjusted mortality rate increased from the previous semiannual report period (July-December 2017). As
described in that report, KRC’s unadjusted difference (38% above the state average for January 2017 –December 2017)
is smaller than its adjusted difference, indicating that it has a high mortality rate despite an apparently lower risk
caseload. KRC had (unadjusted) mortality rates above the state average in 9 out of 12 months, including four months
when the rate exceeded the state average by more than 70%.

10 Mission Analytics Group, Inc. | Semiannual Report, January 2018 – June 2018
III. NON-MORTALITY INCIDENT FINDINGS
RATES ROSE FOR YOUNGER INDIVIDUALS BUT FELL FOR OLDER INDIVIDUALS.
Non-mortality incidents have a very different pattern by age compared to non-mortality incidents. Table 5 shows the
SIRs per 1,000 individuals by age group, focusing only on those individuals living outside the home of a parent or
guardian (and over age 3) – the same group as in the last panel of Table 1. Out-of-home individuals are predominantly
adults over age 21; only 6% of the group is younger than 22. The share of individuals aged over 61 is 2 percentage points
higher than it was the same period a year ago, with the share of people ages 14 to 31 falling 1 percentage point.
SIRs are least likely to be reported for children aged 3 to 13. For all other groups, however, the SIRs per 1,000 individuals is
U-shaped: youth and young adults are at higher risk than adults 32 to 41. Youth and young adults are at higher risk for
incidents such as injury, involuntary psychiatric admissions, missing person, or victim of crime. Above age 41, the rate of
SIRs rises with age, reflecting greater risk of unplanned hospitalization, in particular.
Table 5: Non-Mortality Incidents for Out-of-Home Individuals Age 3 and Above, by Age Group,
January – June 2018 Compared to January- June 2017
Age in Years
Share of Out-of-Home
Individuals Jan-Jun 2018
Number of Non-Mortality SIRs Jan-Jun 2018
SIRs per 1,000 Out-of-Home
Individuals Jan-Jun 2018
SIRs per 1,000 Out-of-Home
Individuals Jan-Jun 2017
3 to 13 2% 90 59.3 55.6
14 to 21 4% 550 196.3 164.8
22 to 31 18% 1,582 140.7 131.5
32 to 41 19% 1,452 118.1 117.0
42 to 51 18% 1,413 123.6 131.6
52 to 61 21% 2,053 150.9 161.6
62 or older 17% 1,996 188.0 194.9 Data as received through July 2018. Rates for the same period last year are updated to include any additional SIRs.
Compared to the same period a year ago, SIRs per 1,000 individuals were down for people aged 42 and older. This is
consistent with the unusually high rate of unplanned medical hospitalizations in the January-June 2017 period. However,
these decreases were offset by higher rates for younger individuals, especially youth 14 to 21, who experienced a
substantial increase in the number of SIRs per 1,000 individuals.

11 Mission Analytics Group, Inc. | Semiannual Report, January 2018 – June 2018
THE NON-MORTALITY RATE DECREASED IN COMMUNITY CARE FACILITIES AND SKILLED NURSING OR
INTERMEDIATE CARE FACILITIES.
Compared to January-June 2017, the number of SIRs per 1,000 individuals was down in CCFs and SNF/ICFs. The number
rose somewhat for individuals in ILS/SLS, which serves the largest share of individuals, at 42%. The differences between
residential types were consistent with the previous period, with incident rates largely reflecting the care needs of the
individuals. SNF/ICFs typically serve individuals with more intensive care needs or health issues. The decline was the
largest for this residential type, about 3%. The decline reflects the high rate of unplanned medical hospitalizations in
2017.
Table 6: Non-Mortality Incidents for Individuals Age 3 and Above, by Residence Type,
January – June 2018 Compared to January – June 2017
Residence Type
Share of Out-of-Home
Individuals Jan-Jun 2018
Number of Non-Mortality SIRs Jan-Jun 2018
SIRs per 1,000 Out-of-Home
Individuals Jan-Jun 2018
SIRs per 1,000 Out-of-Home
Individuals Jan-Jun 2017
Independent/Supported Living Services (ILS/SLS)
42% 2,633 99.8 97.3
Community Care Facilities (CCF) 37% 4,145 175.6 177.8
Skilled Nursing/Intermediate Care Facilities (SNF/ICF)
13% 1,743 216.5 223.1
Other 9% 615 112.6 110.9
Data as received through July 2018. Rates for the same period last year are updated to include any additional SIRs.
THE CASE-MIX ADJUSTED NON-MORTALITY RATE DECREASED BY 3% COMPARED TO THE SAME
SEMIANNUAL PERIOD LAST YEAR.
The differences in rates by age and residence type underscore the role such characteristics play in determining the
likelihood of a SIR. Other characteristics such as skills of daily living or behavioral challenges also influence the likelihood
that an individual will have a non-mortality incident. In addition, some individuals have multiple incidents. A prior
incident is also helpful in predicting the likelihood of a subsequent incident. A case-mix adjusted rate compares the rate
over time, assuming no changes in these characteristics.
For non-mortality incidents, we calculate the monthly incident rate as the likelihood of an individual having a non-
mortality incident in a given month. This differs from the metric of SIRs per 1,000 not only in time periods but in its
treatment of multiple non-mortality incidents. The monthly rate measures the share of individuals with at least one
incident in a month. Individuals with multiple incidents in the same month are only counted once. We use this approach
because we are accounting for the characteristics of each individual in contributing to the likelihood that he or she will
have an incident.

12 Mission Analytics Group, Inc. | Semiannual Report, January 2018 – June 2018
Table 7 reports the unadjusted and adjusted monthly non-mortality incident rates, averaged over the six-month period.
Although there was very little change in the unadjusted rate (consistent with Table 1), the adjusted rate fell 3% relative to
the same period a year ago. The difference between the unadjusted and adjusted rate suggests that out-of-home
individuals are increasingly likely to have characteristics that put them at risk. This is consistent, for example, with the
aging population we observed in Table 5.
Table 7: Semi-Annual and Average Monthly Mortality Rates for Individuals Age 3 and Above
January – June 2018 Compared with January – June 2017
Non-Mortality January-June 2017 January-June 2018
Non-Mortality Incidents per 1,000 Individuals Age 3 and Above 144.7 143.6
Average Unadjusted Monthly Non-Mortality Rate 2.22% 2.20%
Case-Mix Adjusted Non-Mortality Rate 2.20% 2.14%
% Change from Same Period Last Year* -3% Data as received through July 2018. Rates for the same period last year are updated to include any additional mortality SIRs.
*Percent change calculated prior to rounding rates
THE NON-MORTALITY RATE WAS RELATIVELY FLAT OVER THE LAST TWO PERIODS.
Figure 4 shows the monthly average non-mortality rate in each semiannual period from January-June 2015 to the current
period, adjusted for case mix. In previous years, the January-June rate has been 5-10% higher than the July-December
rate. The same pattern was evident for the two halves of calendar year 2017, where the non-mortality incident rate
dropped in July-December 2017, compared to January-June 2017, but it did not drop as far as it had in earlier years. The
typical seasonal pattern is a marked increase in the January to June period compared to the July to December period, due
to high respiratory illness rates in February and March. This year, the seasonal difference was modest. The lower
decrease for the second half of 2017 and the smaller increase (relative to July-December) in the first half of 2018 result in
an unusually flat rate over the most recent two periods.
Figure 4: Non-Mortality Incidents, Statewide Case-Mix Adjusted Semiannual Trend,
January-June 2015 – January-June 2018
13 Mission Analytics Group, Inc. | Semiannual Report, January 2018 – June 2018
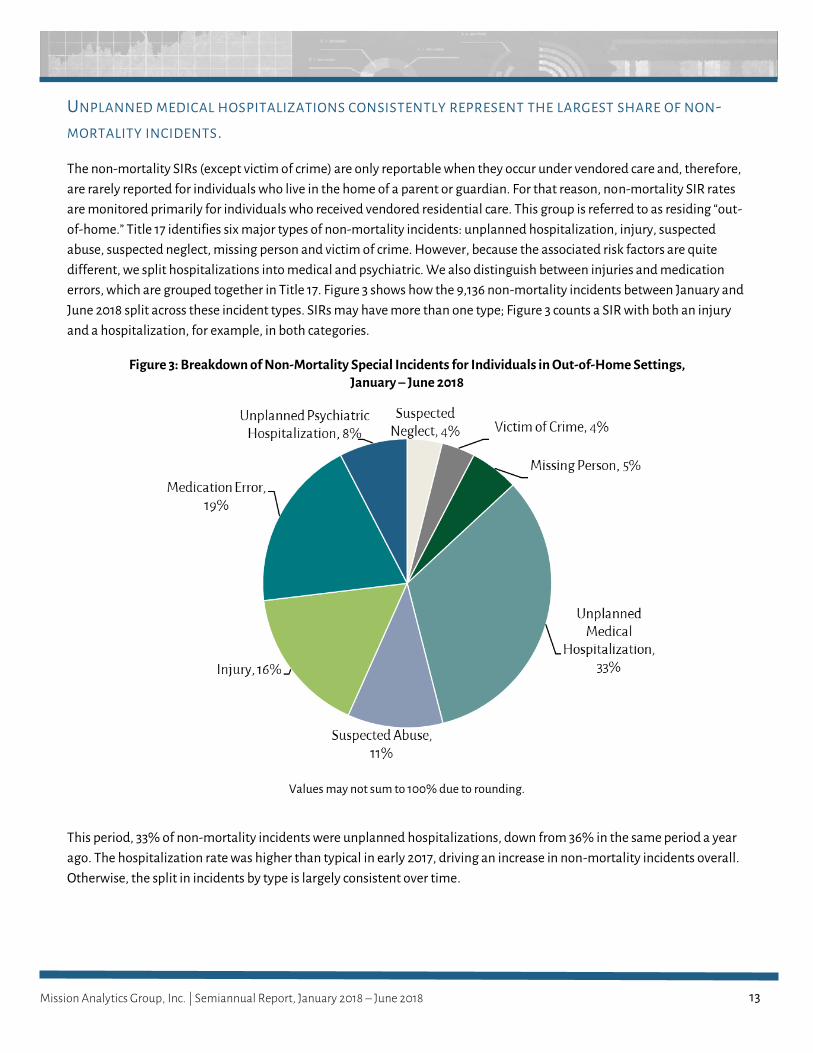
UNPLANNED MEDICAL HOSPITALIZATIONS CONSISTENTLY REPRESENT THE LARGEST SHARE OF NON-
MORTALITY INCIDENTS.
The non-mortality SIRs (except victim of crime) are only reportable when they occur under vendored care and, therefore,
are rarely reported for individuals who live in the home of a parent or guardian. For that reason, non-mortality SIR rates
are monitored primarily for individuals who received vendored residential care. This group is referred to as residing “out-
of-home.” Title 17 identifies six major types of non-mortality incidents: unplanned hospitalization, injury, suspected
abuse, suspected neglect, missing person and victim of crime. However, because the associated risk factors are quite
different, we split hospitalizations into medical and psychiatric. We also distinguish between injuries and medication
errors, which are grouped together in Title 17. Figure 3 shows how the 9,136 non-mortality incidents between January and
June 2018 split across these incident types. SIRs may have more than one type; Figure 3 counts a SIR with both an injury
and a hospitalization, for example, in both categories.
Figure 3: Breakdown of Non-Mortality Special Incidents for Individuals in Out-of-Home Settings, January – June 2018
Values may not sum to 100% due to rounding.
This period, 33% of non-mortality incidents were unplanned hospitalizations, down from 36% in the same period a year
ago. The hospitalization rate was higher than typical in early 2017, driving an increase in non-mortality incidents overall.
Otherwise, the split in incidents by type is largely consistent over time.
14 Mission Analytics Group, Inc. | Semiannual Report, January 2018 – June 2018
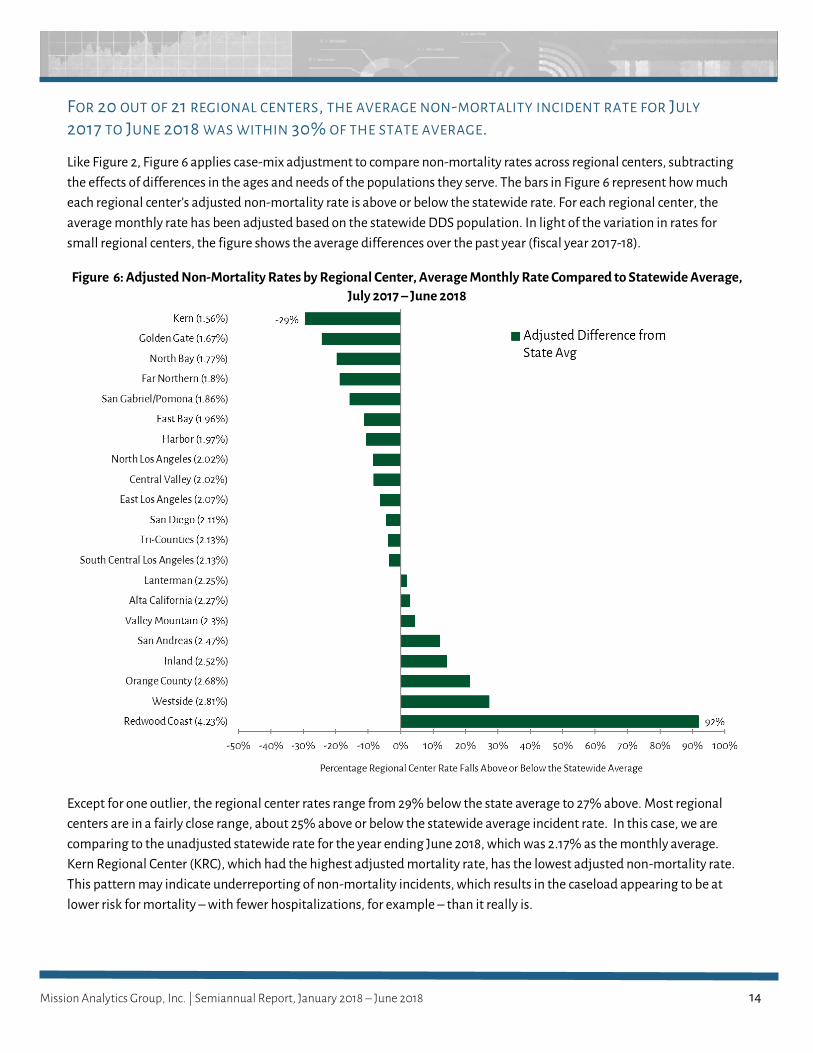
FOR 20 OUT OF 21 REGIONAL CENTERS, THE AVERAGE NON-MORTALITY INCIDENT RATE FOR JULY
2017 TO JUNE 2018 WAS WITHIN 30% OF THE STATE AVERAGE.
Like Figure 2, Figure 6 applies case-mix adjustment to compare non-mortality rates across regional centers, subtracting
the effects of differences in the ages and needs of the populations they serve. The bars in Figure 6 represent how much
each regional center’s adjusted non-mortality rate is above or below the statewide rate. For each regional center, the
average monthly rate has been adjusted based on the statewide DDS population. In light of the variation in rates for
small regional centers, the figure shows the average differences over the past year (fiscal year 2017-18).
Figure 6: Adjusted Non-Mortality Rates by Regional Center, Average Monthly Rate Compared to Statewide Average,
July 2017 – June 2018
Except for one outlier, the regional center rates range from 29% below the state average to 27% above. Most regional
centers are in a fairly close range, about 25% above or below the statewide average incident rate. In this case, we are
comparing to the unadjusted statewide rate for the year ending June 2018, which was 2.17% as the monthly average.
Kern Regional Center (KRC), which had the highest adjusted mortality rate, has the lowest adjusted non-mortality rate.
This pattern may indicate underreporting of non-mortality incidents, which results in the caseload appearing to be at
lower risk for mortality – with fewer hospitalizations, for example – than it really is.

15 Mission Analytics Group, Inc. | Semiannual Report, January 2018 – June 2018
Redwood Coast Regional Center (RCRC) continues to be an outlier for non-mortality incidents. Its adjusted average
monthly non-mortality incident rate is 92% higher than the statewide average, at 4.23%. In this case, the adjustment has
lowered the reported difference. RCRC’s observed non-mortality incident rate was 5.12% on average for the 12 months
ending June 2018, putting it more than double the state average. Recent analyses of incident rates by vendor suggest that
some of this difference may also be reporting: SLS vendors at RCRC are much more likely to report SIRs than SLS vendors
serving other regional centers. RCRC also has a larger share of its population in SLS.

16 Mission Analytics Group, Inc. | Semiannual Report, January 2018 – June 2018
IV. RISK MANAGEMENT EFFORTS
DDS, through Mission, is coordinating closely with the regional centers to track and monitor the follow-up activities
associated with quarterly SIR spikes. For longer-term increases in incident rates, Mission uses SIR case reviews, site visits,
and statistical analyses as part of its monitoring, discovery, and improvement activities. A number of additional activities
continue to support DDS and regional centers in preventing future incidents. We describe these activities below.
MONITORING AND DISCOVERY ACTIVITIES
Reporting Back: Regional centers with quarterly spikes in individual incident types report back to DDS, through Mission,
any discovery and remediation activities related to these spikes, including a description of why any spikes occurred, what
follow-up actions were taken, and whether the centers faced obstacles in implementing these follow-up activities. These
responses are reviewed by the DDS Quality Management Executive Committee and may be used to develop strategies for
how to mitigate risk to individuals statewide.
Long-Term Increases in Incident Rates: Mission has a multi-stage process to investigate long-term increases in incident rates.
We provide additional analyses and technical assistance to regional centers identified based on results such as those
shown on page 8. For identified regional centers, additional analyses are conducted to determine the detailed incident
types and/or individual characteristics associated with the increase. Based on these results, Mission determines whether
a more detailed review of the SIRs is necessary to better understand the issue. As appropriate, Mission also works with
the regional centers to identify mitigation strategies. Activities this period included:
In late 2016, the rate of suspected abuse at North Bay Regional Center (NBRC) was nearly 50% higher than the
state average rate. In 2017 and 2018, Mission conducted a series of analyses attempting to determine why the
rate of suspected abuse at NBRC had risen to that level. As of March 2018, however, the rate of suspected abuse
at NBRC had declined to nearly the state average rate, where it remained in June 2018.
Following technical assistance in 2016 and 2017 to RCRC regarding high levels of non-mortality incidents,
Mission continues to monitor the risk of suspected abuse, suspected neglect, and medication errors at RCRC,
sending updated data to RCRC each quarter. In 2016 and 2017, RCRC had taken steps to limit the risk of
suspected abuse among individuals that it serves, and they appeared to have some success at limiting the risk of
repeat abuse. However, they were not successful at reducing the overall rate of suspected abuse. Mission has
recently summarized for DDS the history of high rates of these incidents at RCRC and associated technical
assistance.
Analysis of Vendor-Level Rates: At DDS’ request, in spring 2018, Mission began developing vendor-level analyses of incident
rates for residential vendors. The analyses produce rates of incidents per client served, at the vendor-regional center level
as well as the vendor (tax ID) level. The initial analyses began as a strategy to identify vendors with high rates of
medication errors to target for more intensive training. However, the analysis has since expanded to look at a range of
incident types. For regional centers, the analysis offers the opportunity to identify providers where incident rates are high
across regional centers—that is providers that serve more than one center and for whom each regional center may see
only part of the picture. Clients are at high risk regardless of centers. As a step in the analysis, Mission calculated the share
of vendors ever reporting an incident in a year, distinct from the number of incidents for a given vendor. For common
incidents, such as medication errors, large differences in these shares within a specific type of residential vendor such as

17 Mission Analytics Group, Inc. | Semiannual Report, January 2018 – June 2018
SLS are likely to reflect different norms in reporting. These analyses have led to additional assessment of the incident
rates at RCRC to determine the role of higher reporting.
SYSTEM IMPROVEMENT ACTIVITIES
Technical Assistance to Regional Centers. Mission provides additional analyses on request to regional centers testing
different mitigation strategies.
Far Northern Regional Center (FNRC):
o In January 2017, FNRC began tracking how falls happen among individuals it serves to better
understand mitigation approaches (this is an ongoing project). Providers are asked to complete a form
each time an individual falls, documenting the circumstances. FNRC sends the forms to Mission, which
compiles them and sends quarterly reports to FNRC summarizing the data. In January-March 2018, for
example, providers reported 29 falls, 11 of which had injuries identified in a SIR. Analysis found that
most falls occur at home, usually in the bedroom, and that inappropriate footwear and failure to use an
assistive walking device are the biggest contributors to falls.
o In September 2017, Far Northern Regional Center (FNRC) sponsored three flu shot clinics for individuals
in its caseload. In May 2018, Mission sent a report of findings regarding subsequent risk of inpatient
admissions for respiratory conditions among those who attended the clinic, versus the rest of the
caseload.
San Gabriel/Pomona Regional Center (SGPRC): In February 2018, San Gabriel/Pomona Regional Centers (SGPRC)
approached Mission with a request for training and technical assistance on information security. Between 2015
and 2018, SGPRC had experienced a series of instances in which HIPPA-protected and other information had
been compromised that concerned individuals whom SGPRC serves. In nearly all cases this occurred when staff
had the information on a laptop, mobile phone, or on hard copies, and the devices or copies were lost or stolen—
often, from their cars. SGPRC asked Mission to develop training on data and information security for staff at
provider agencies. Mission agreed to provide such training but recommended that SGPRC first explore the
feasibility of encrypting electronic media that providers use and strategies to minimize the use of identified
paper records.
Tour of Regional Centers Regarding Risk Management Practices: Mission and DDS will visit all 21 regional centers between
September 2018 and January 2019. The team will meet with regional center executive directors, chief counselors, quality
assurance managers, and SIR coordinators to gain a common understanding of SIR reporting and risk management
practices at each regional center. The visits will also provide an opportunity for regional centers to share their strengths
and challenges in meeting their clients’ needs and managing risk. The discussions will help DDS and Mission identify
strategies to improve risk management activities with the regional centers. Finally, DDS and Mission will document
practices at each regional center and, therefore, identify variation in practices across centers. This is important both to
identify best practices across the system and to assess how differences in reporting practices relate to observed
differences in incident rates.

18 Mission Analytics Group, Inc. | Semiannual Report, January 2018 – June 2018
V. APPENDIX
SPECIAL INCIDENT DEFINITIONS
Injury – Serious injury/accident, including lacerations requiring sutures or staples; puncture wounds requiring medical treatment beyond first aid; fractures; dislocations; bites that break the skin and require medical treatment beyond first aid; internal bleeding requiring medical treatment beyond first aid; any medication errors; medication reactions that require medical treatment beyond first aid; or burns that require medical treatment beyond first aid.
Medication error – When an individual under vendored care experiences one or more of the following situations: 1) wrong medication, 2) wrong dose, 3) wrong time, 4) wrong route, or 5) wrong client. For example, an individual has a one-hour window to take his or her medications based on the time prescribed by the physician. Any medication administered or self-administered more than one hour before or after the prescribed time is considered a missed dose and, therefore, a “wrong time” medication error.
Missing person – These conditions must apply: the vendor has communicated with any law enforcement agency in any way and described the individual as missing to that agency or has filed a formal missing person’s report with a law enforcement agency.
Mortality – Any individual death, regardless of cause.
Suspected abuse – All vendors shall report to the regional center the following special incidents if they occurred during the time the individuals was receiving services and supports from any vendor or long-term health care facility: Reasonably suspected abuse/exploitation, including physical, sexual, fiduciary, emotional/mental, or physical and/or chemical restraint.
Suspected neglect – Reasonably suspected neglect, including failure to provide medical care for physical and mental health needs; prevent malnutrition or dehydration; protect from health and safety hazards; or assist in personal hygiene or the provision of food, clothing, or shelter, or exercise the degree of care that a reasonable person would exercise in the position of having the care and custody of an elder or a dependent adult.
Unplanned medical hospitalization – Unplanned hospitalization due to the following conditions: respiratory illness, including but not limited to asthma, tuberculosis, and chronic obstructive pulmonary disease; seizure-related; cardiac-related, including but not limited to congestive heart failure, hypertension, and angina; internal infections, including but not limited to ear, nose and throat, gastrointestinal, kidney, dental, pelvic, or urinary tract; diabetes, including diabetes-related complications; wound/skin care, including but not limited to cellulitis and decubitus; and nutritional deficiencies, including but not limited to anemia and dehydration.
Unplanned psychiatric hospitalization – Unplanned or unscheduled hospitalization due to a psychiatric condition. An involuntary psychiatric hospitalization accomplished pursuant to Section 6500 of the Welfare and Institutions Code is reportable to DDS when all of the following conditions are met: The discharge diagnosis indicates that the individual was admitted to hospital for a psychiatric condition, the individual is not conserved and does not consent to the admission, or the individual is conserved and the individual’s parent, legal guardian or conservator does not consent to the admission, and the legal mechanism used to accomplish the admission is section 6500.
Victim of crime – Includes the following: robbery, including theft using a firearm, knife, or cutting instrument or other dangerous weapons or methods that force or threaten a victim; aggravated assault, including a physical attack on a victim using hands, fists, feet, or a firearm, knife, or cutting instrument, or other dangerous weapon; larceny, including the unlawful taking, carrying, leading, or riding away of property, except for motor vehicles, from the possession or constructive possession of another person; burglary, including forcible entry; unlawful non-forcible entry, and

19 Mission Analytics Group, Inc. | Semiannual Report, January 2018 – June 2018
attempted forcible entry to a structure to commit a felony or theft therein; and rape, including rape and attempts to commit rape.