Embed Size (px)
Citation preview

Special Report The Commission’s negotiation of 2014-2020 Partnership Agreements and programmes in Cohesion: spending more targeted on Europe 2020 priorities, but increasingly complex arrangements to measure performance
EN 2017 NO 02
1977 - 2017

EUROPEAN COURT OF AUDITORS 12, rue Alcide De Gasperi 1615 Luxembourg LUXEMBOURG
Tel. +352 4398-1Enquiries: eca.europa.eu/en/Pages/ContactForm.aspxWebsite: eca.europa.euTwitter: @EUAuditors
More information on the European Union is available on the internet (http://europa.eu).
Luxembourg: Publications Office of the European Union, 2017
Print ISBN 978-92-872-7145-7 ISSN 1831-0834 doi:10.2865/433363 QJ-AB-17-004-EN-CPDF ISBN 978-92-872-7108-2 ISSN 1977-5679 doi:10.2865/113860 QJ-AB-17-004-EN-NEPUB ISBN 978-92-872-7135-8 ISSN 1977-5679 doi:10.2865/912368 QJ-AB-17-004-EN-E
© European Union, 2017Reproduction is authorised provided the source is acknowledged.

The Commission’s negotiation of 2014-2020 Partnership Agreements and programmes in Cohesion: spending more targeted on Europe 2020 priorities, but increasingly complex arrangements to measure performance
(pursuant to Article 287(4), second subparagraph, TFEU)
Special Report
EN 2017 NO 02

02Audit team
The ECA’s special reports set out the results of its performance and compliance audits of specific budgetary areas or management topics. The ECA selects and designs these audit tasks to be of maximum impact by considering the risks to performance or compliance, the level of income or spending involved, forthcoming developments and political and public interest.
This performance audit was produced by Audit Chamber II — headed by ECA Member Iliana Ivanova — which specialises in investment for cohesion, growth and inclusion spending areas. The audit was led by the Reporting Member Ladislav Balko, supported by Branislav Urbanič, Head of Private Office; Niels-Erik Brokopp, Principal Manager; Bernard Witkos, Head of Task; Simon Dennett, Marija Grguric, Sara Pimentel, Ana Popescu and Anne Poulsen, Auditors.
From left to right: Sara Pimentel, Branislav Urbanič, Ladislav Balko, Niels-Erik Brokopp, Marija Grguric, Simon Dennett, Bernard Witkos.

03Contents
Paragraph
Abbreviations
Glossary
1-X Executive summary
1-26 Introduction
1-3 Cohesion policy is the EU’s main investment policy
4-6 Regulatory provisions contributing to greater focus on performance in Cohesion policy during the 2014-2020 period
7-12 Adoption of the 2014-2020 legal framework for Cohesion policy – the main steps
7-9 Preparation of the Commission’s legislative proposal
10-12 Negotiations of the Cohesion legislative package between Commission, European Parliament and Council
13-26 Programming of Cohesion policy for the 2014-2020 period
13-22 Main building blocks of the programming process: Common Strategic Framework, Thematic objectives, Partnership Agreements and Operational Programmes
23-25 Performance indicators for outputs and results
26 Procedural provisions regarding the adoption of Partnership Agreements and Operational Programmes
27-32 Audit scope and approach
33-136 Observations
33-55 Commission kept delays in the negotiation of Partnership Agreements and of Operational Programmes under control
34-37 The European Parliament and Council adopted the Cohesion policy legislative package late in 2013

04Contents
38-45 The Commission took a pro-active approach to the negotiation of Partnership Agreements and Operational Programmes
46-52 Despite diffculties the Commission adopted PAs and OPs within the deadline specified in the Regulation
53-55 Additional requirements, IT problems and complex approval process contributed to long duration of negotiations of Partnership Agreements and Operational Programmes
56-80 Partnership Agreements were instrumental in focusing Cohesion spending on the Europe 2020 Strategy
60-66 Partnership Agreements are basis for the budget allocation to thematic objectives and investment priorities
67-73 Negotiations of PAs were effective in terms of ring-fencing spending on Europe 2020 strategy objectives
74-80 Examined Member States define in the Partnership Agreements the main results to be achieved, but achieving them will require substantial national contribution beyond the EU funding
81-91 Operational programmes show more clearly what is pursued with the interventions and how this is expected to be achieved, but this is accompanied by increased complexity than the previous programme period
83-87 Commission and Member States have been successful in developing Operational Programmes with a more robust intervention logic in most cases than in the previous programme period
88-91 The structure of the Operational Programmes leads to an increased number of performance indicators that need to be monitored and to an increase in reporting requirements
92-136 Fund-specific differences in the categorisation of financial data and measuring the performance of Operational Programmes likely to pose difficulties in programme monitoring in future years
94-101 The approach to financial monitoring of investments differs between ESI funds
102-109 There are differences between funds in the use of common output indicators and possibility for Member States to define additional programme specific output indicators
110-129 ESF and ERDF result indicators measure different things and measure them differently making it impossible to meaningfully aggregate data at Union level
130-136 Differences in methodology and the high number of programme-specific indicators will cause a significant administrative burden, but it remains to be seen what use will made of this data

05Contents
137-154 Conclusions and recommendations
Annex I — Comparison of key regulatory provisions introduced for the 2014-2020 period with similar provisions in previous periods
Annex II — Europe 2020 Strategy, Thematic Objectives and Thematic concentration
Annex III — Architecture of the Cohesion Policy
Annex IV — Strategic result indicators – analysis of Partnership Agreements for the five Member States covered
Reply of the Commission

06Abbreviations
CF: Cohesion Fund
CPR: Common Provision Regulation
CSF: Common Strategic Framework
DG: Directorate-General
DG EMPL: Directorate-General for Employment, Social Affairs and Inclusion
DG REGIO: Directorate-General for Regional and Urban Policy
DG AGRI: Directorate-General for Agriculture and Rural Development
DG MARE: Directorate-General for Maritime Affairs and Fisheries
EAFRD: European Agricultural Fund for Rural Development
EMFF: European Maritime and Fisheries Fund
ERDF: European Regional Development Fund
ESF: European Social Fund
ESI funds: European Structural and Investment Funds
ETC: European Territorial Cooperation
IPA: Instrument for Pre-Accession Assistance
NSRF: National Strategic Reference Framework
OP: Operational Programme
PA: Partnership Agreement
R&D: Research and development
R&D&I: Research, development and innovation
SFC: System for Fund Management in the European Union
TFEU: Treaty on the Functioning of the European Union
TO: Thematic Objective
07Glossary
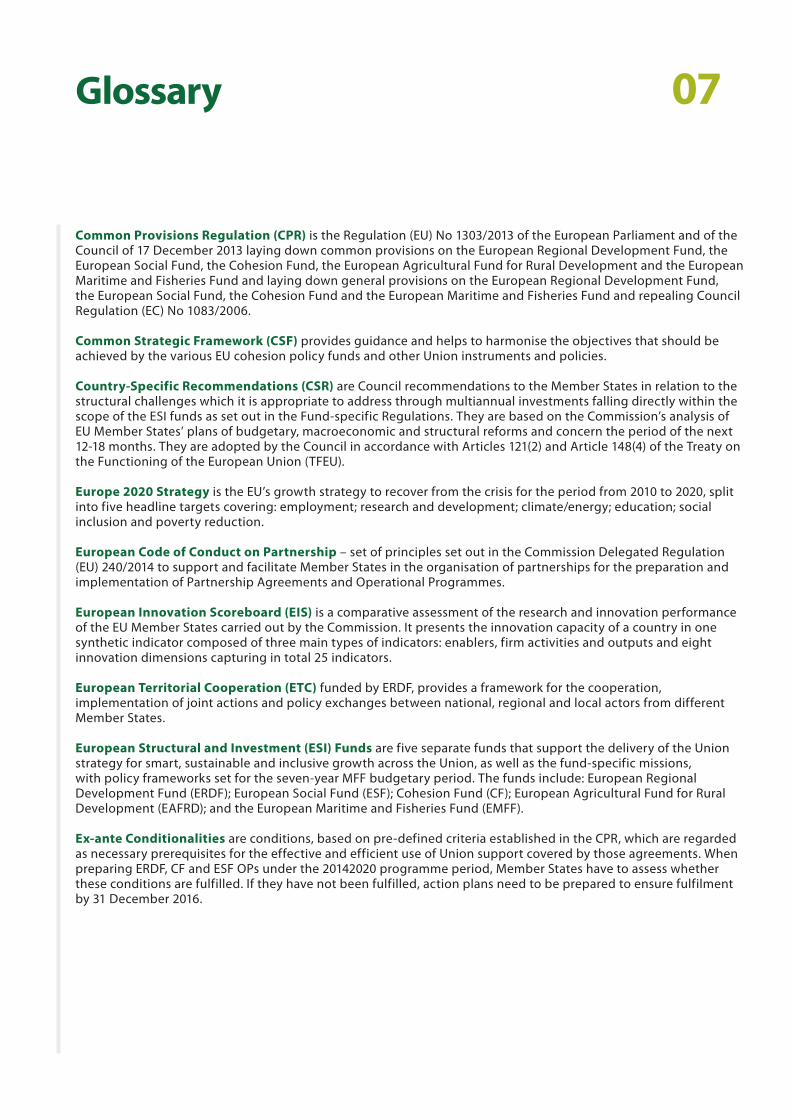
Common Provisions Regulation (CPR) is the Regulation (EU) No 1303/2013 of the European Parliament and of the Council of 17 December 2013 laying down common provisions on the European Regional Development Fund, the European Social Fund, the Cohesion Fund, the European Agricultural Fund for Rural Development and the European Maritime and Fisheries Fund and laying down general provisions on the European Regional Development Fund, the European Social Fund, the Cohesion Fund and the European Maritime and Fisheries Fund and repealing Council Regulation (EC) No 1083/2006.
Common Strategic Framework (CSF) provides guidance and helps to harmonise the objectives that should be achieved by the various EU cohesion policy funds and other Union instruments and policies.
Country-Specific Recommendations (CSR) are Council recommendations to the Member States in relation to the structural challenges which it is appropriate to address through multiannual investments falling directly within the scope of the ESI funds as set out in the Fund-specific Regulations. They are based on the Commission’s analysis of EU Member States’ plans of budgetary, macroeconomic and structural reforms and concern the period of the next 12-18 months. They are adopted by the Council in accordance with Articles 121(2) and Article 148(4) of the Treaty on the Functioning of the European Union (TFEU).
Europe 2020 Strategy is the EU’s growth strategy to recover from the crisis for the period from 2010 to 2020, split into five headline targets covering: employment; research and development; climate/energy; education; social inclusion and poverty reduction.
European Code of Conduct on Partnership – set of principles set out in the Commission Delegated Regulation (EU) 240/2014 to support and facilitate Member States in the organisation of partnerships for the preparation and implementation of Partnership Agreements and Operational Programmes.
European Innovation Scoreboard (EIS) is a comparative assessment of the research and innovation performance of the EU Member States carried out by the Commission. It presents the innovation capacity of a country in one synthetic indicator composed of three main types of indicators: enablers, firm activities and outputs and eight innovation dimensions capturing in total 25 indicators.
European Territorial Cooperation (ETC) funded by ERDF, provides a framework for the cooperation, implementation of joint actions and policy exchanges between national, regional and local actors from different Member States.
European Structural and Investment (ESI) Funds are five separate funds that support the delivery of the Union strategy for smart, sustainable and inclusive growth across the Union, as well as the fund-specific missions, with policy frameworks set for the seven-year MFF budgetary period. The funds include: European Regional Development Fund (ERDF); European Social Fund (ESF); Cohesion Fund (CF); European Agricultural Fund for Rural Development (EAFRD); and the European Maritime and Fisheries Fund (EMFF).
Ex-ante Conditionalities are conditions, based on pre-defined criteria established in the CPR, which are regarded as necessary prerequisites for the effective and efficient use of Union support covered by those agreements. When preparing ERDF, CF and ESF OPs under the 20142020 programme period, Member States have to assess whether these conditions are fulfilled. If they have not been fulfilled, action plans need to be prepared to ensure fulfilment by 31 December 2016.

08Glossary
Impact refers to the longer term socio-economic consequences that can be observed after a certain period after the completion of an intervention, which may affect direct beneficiaries of the intervention or other indirect beneficiaries (e.g. decrease in unemployment levels, improvements in water quality, etc.).
Inputs are financial, human, material, organisational or regulatory means needed for the implementation of a policy, a programme or a project.
Intervention is any action or operation, carried out by public authorities or other organisations, regardless of its nature (policy, programme, measure or project). Means of intervention employed are grants, loans, subsidised interest rates, guarantees, participation in equity and risk capital schemes or other forms of financing.
Intervention logic sets out the link between the assessed needs, objectives, inputs (planned and allocated), outputs (targeted and achieved) and results (intended and actual).
Investment Priority is a preferred area of European Union contribution, set at Union level and related to a specific Thematic Objective.
National Reform Programme is a document which presents the country’s policies and measures to sustain growth and jobs and to reach the Europe 2020 targets.
Operational Programme sets out a Member State’s priorities and specific objectives and how the funding (EU and national public and private co-financing) from the ESI funds will be used during a given period (currently 7 years) to finance projects. These projects must contribute to achieve a certain number of objectives specified at the level of the OP’s priority axis. An OP is prepared by the Member State and has to be approved by the Commission before any payments from the EU budget can be made. OPs can only be modified during the period covered if both parties agree.
Outputs are produced or accomplished with the resources allocated to an intervention (e.g. training courses delivered to unemployed young people, number of sewage plants or km of roads built, etc.).
Partnership Agreements are entered into between the European Commission and each Member State for the 2014-2020 programme period. They set out the national authorities’ plans on how to use funding from the European Structural and Investment Funds and outline each country’s strategic goals and investment priorities, linking them to the overall aims of the Europe 2020 strategy for smart, sustainable, and inclusive growth. They also include, inter alia, details of any ex-ante conditionalities and performance management frameworks. They are prepared by the Member State in a dialogue with the Commission and must be adopted by the Commission.
Performance Framework consists of a set of milestones and targets defined for each priority in a programme, forming an important pillar of the performance-orientation approach.
Performance Reserve accounts 6 % of the resources allocated to the ERDF, ESF, and Cohesion Fund. These resources are currently blocked, but can be made available following performance review planned in 2019, upon the meeting or exceeding of certain requirements.

09Glossary
Result is a measurable consequence deriving – directly or indirectly – from a cause and effect relationship. The results-based approach to public policy relies on the principle that the focus of public interventions should be on the delivery of results, rather than on activity or process management. In the context of Cohesion policy, the term result usually refers to outcomes and impacts.
A Thematic Objective is a structuring element of the Partnership Agreements. It is pre-determined by legislation and present objectives that should to be supported by European Structural and Investment Funds. Thematic objectives establish a link to EU level strategic objectives.
Youth Employment Initiative (YEI) aims to provide financial support to regions experiencing youth unemployment rates above 25 %, by supporting the implementation of the Youth Guarantee to reinforce and complement the activities funded by the ESF. It funds activities directly targeting young people not in employment, education or training (NEETs) aged up to 25 years (or where the Member States consider relevant, up to 29).

10Executive summary
About this report
In this report, we examined whether the Partnership Agreements signed between the European Commis-sion and the Member States help target EU Structural and Investments funds more effectively. We found that, despite initial difficulties, the Commission and the Member States have successfully set out objectives and expected outputs for programmes covered by the Agreements. However, an unnecessarily high number of performance indicators have been developed and some important definitions are not coordinated. We make a number of recommendations to the Commission and the Member States to improve the operation of the Agreements.
About Partnership Agreements
IPartnership Agreements are strategic investment plans for EU Member States which indicate their national spend-ing priorities for the European Structural and Investment funds over a seven year period. They were introduced by legislation and negotiated between the European Commission and Member States in 2014. By December 2015, the Commission had negotiated a total of 387 Operational Programmes for the European Regional Development Fund, the Cohesion Fund and the European Social Fund based on Partnership Agreements. Since these three funds rep-resent the EU’s main investment instruments, totalling some 350 billion euro for the 2014-2020 programme period, the outcome of the negotiations determines how a significant part of the EU budget will be spent.
How we conducted our audit
IIWe sought to determine whether the Commission had effectively negotiated the Partnership Agreements and Operational Programmes so that EU funding is more effectively targeted on the EU 2020 Strategy priorities, inter-ventions are better justified in terms of investment needs and intended results, and conditions against which the performance of these programmes would be measured have been adequately set. Our audit covered the period from December 2013 to December 2015. Our audit work included:
— an analysis of the timeframe in which the negotiations took place and an assessment of the Commission’s inter-nal procedures for negotiation;
— in-depth analysis of Partnership Agreements and 14 Operational Programmes for five Member States - Spain, Ireland, Croatia, Poland and Romania. We also carried out a study visit to Denmark;
— interviews with staff at the Commission and with officials in the Member States and their permanent represen-tations in Brussels;
— consultations with experts in the field of EU regional, structural and cohesion policies and performance budgeting.

11Executive summary
What we found
IIIThe European Parliament and Council adopted the Cohesion policy legislative package just before the start of the 2014-2020 programme period. To help mitigate the impact of the late adoption of the regulations, the Commission started informal negotiations with the Member States as early as 2012. Despite difficulties, the Commission adopted Operational Programmes within the deadlines specified in the CPR and on average, the time taken to adopt an OP was comparable with the previous programme period. Nevertheless, by December 2014, only 64 % of the OPs under the Investment for growth and jobs goal had been adopted, which is mainly due to the delay in the adoption of the legislative package.
IVThe negotiations between the Commission and the Member States were more demanding than in previous periods. The main reasons for this were additional requirements, such as ex-ante conditionalities or the requirement to set out a more explicit intervention logic, IT problems and the need for multiple rounds of approvals by the Commis-sion. Moreover, there were quality issues with the initial drafts of programming documents submitted by Member States.
VPartnership Agreements have proven to be an effective instrument for ring-fencing ESI funding for thematic objec-tives and investment priorities and supporting the focus on the objectives of the Europe 2020 strategy for growth and jobs. The achievement of the strategic results established for the programme period will require a substantial contribution from the national budgets beyond ESIF spending, but also additional regulatory measures and struc-tural reforms. This illustrates that the Commission makes increasing use of the programming of ESI funds to influ-ence overall economic governance in the Member States.
VIFor most of the 2014-2020 Operational Programmes examined, the Commission and Member States have been successful in developing programmes with a more robust intervention logic, i.e. setting out the interventions aims (specific objectives/results) and how these are expected to be achieved (required funding, actions to be undertaken and expected outputs).

12Executive summary
VIIWe found that the way the Operational Programmes are structured resulted in a significant increase in the number of performance indicators for outputs and results that need to be monitored. The fund-specific regulations have introduced different requirements for collecting and reporting performance data on outputs and results and for the financial monitoring of investments. There is no common definition of ‘output’ and ‘result’ and no harmonised approach between the different funds as to the use of common indicators (which need to be reported to the Com-mission). Moreover, Member States have the option of defining additional programme-specific output indicators and splitting indicators between regions.
VIIIOur analysis showed that thousands of performance indicators were created by Member States and the common indicators are significantly outnumbered by programme-specific indicators. This high number of indicators will result in an additional administrative burden, while it remains to be seen what use will be made by Member States of this data. Given the differences in approach, in particular for the programme-specific indicators, we also ques-tion whether a meaningful aggregation of performance data will be possible. On the positive side, more and better performance data on outputs could pave the way for a more performance-based budget in post-2020.
What we recommend
IXThe Member States should:
— provide the Commission with the financial information necessary to effectively monitor compliance with the thematic concentration requirements (including the derogations set out in the ERDF regulation).
— discontinue the use of unnecessary programme-specific indicators in case of programme modifications.
— ensure that the data that is relevant to establish the effects of the ERDF interventions is collected.
XThe Commission should:
— ensure that its Cohesion policy legislative proposals for the post-2020 period are presented in time to complete the negotiations between the European Parliament and the Council before the start of the programme period.
— ensure that the ring-fencing of ESI funding to the thematic objectives is respected by the Member States.
— define a common terminology for ‘output’ and ‘result’ and propose it for inclusion in the Financial Regulation and ensure that the proposals for the sectoral regulations follow these definitions for the post-2020 periods.

13Executive summary
— carry out an analysis of the 2014-2020 programme-specific and common indicators for outputs and results to identify those which are most relevant and best suited to determining the impact of EU interventions.
— disseminate ‘good practices’ by Member States for evaluations which can best determine the impact of EU interventions and assist the Member States in updating their evaluation plans which include such ‘good practice evaluations’.
— use the data collected via the annual implementation reports and the results of ad-hoc and ex-post evaluations for comparative analysis of performance and, where appropriate, to promote benchmarking and allow for policy learning during 2014-2020 period and
— apply the concept of a performance budget, which links each increment in resources to an increment in outputs or other results, to the funding of cohesion policy interventions for the post-2020 period, where appropriate. In this context, the Commission should make use of data on the actual unit costs determined during the 2014-2020 period.

14IntroductionFi
gure
1 EU funding under ERDF, ESF and CF in the 2007-2013 and 2014-2020 programme period including ETC and YEI
Source: ECA, on the basis of the Commission’s data from Infoview, June 2016.
Cohesion policy is the EU’s main investment policy
01 The European Regional Development Fund (ERDF), the European Social Fund (ESF) and the Cohesion Fund (CF) are the funding mechanisms which deliver the EU Cohesion policy. Together with the European Agricultural Fund for Rural De-velopment (EAFRD) and the European Maritime and Fisheries Fund (EMFF), these funds constitute the European Structural and Investment (ESI) funds.
02 Cohesion policy is the EU’s main investment policy supporting job creation, busi-ness competitiveness, economic growth, sustainable development and improve-ment of citizens’ quality of life. The total allocation from the EU budget to the ERDF, ESF and CF in the 2014-2020 programme period is 349.4 billion euro, up from 346.5 billion euro in the 2007-2013 programme period1 (see Figure 1).
1 ECA calculation made on basis of the Commissions data on the adopted OPs for the programme periods 2007-2013 and 2014-2020, Infoview, June 2016.
Allo
catio
n in
bill
ion
euro
196
90
63
200
7770ERDF
ESF
CF
2014-20202007-2013
200
150
100
50
0

15Introduction Fi
gure
2
Source: ECA, on the basis of the Commission’s data from Infoview, June 2016.
EU funding under ERDF, ESF and CF in the 2014-2020 programme period per Member State (in billion euro)
03 Poland (76.8 billion euro), Italy (31.1 billion euro) and Spain (27.0 billion euro) are the Member States with the highest allocation of EU funding for ERDF, ESF and CF during the 2014-2020 programme period (see Figure 2).
0 10 20 30 40 50 60 70 80
AT
BE
BG
CY
CZ
DE
DK
EE
ESFI
FR
GR
HR
HU
IE
ITLT
LU
LV
MT
NLPL
PT
RO
SE
SI
SK
UK

16Introduction
Regulatory provisions contributing to greater focus on performance in Cohesion policy during the 2014-2020 period
04 Programming funds is a crucial first step in the implementation of programmes, since it determines to a large extent to which areas the EU and national funds will be allocated over the programme period.
05 A number of new regulatory provisions have been introduced for the 2014-2020 programme period which aim to respond to these expectations, such as:
— a concentration of Cohesion spending on thematic objectives and investment priorities derived from the Europe 2020 strategy;
— a more structured use of intervention logic during the programming exercise, starting with the identification of investment needs and the specification of the intended long-term results;
— a more consistent and comprehensive use of performance indicators to measure progress towards reaching these results;
— the reintroduction of a mandatory performance reserve (previously manda-tory during the 2000-2006 period and voluntary in 2007-2013 period2) of EU funding which is to be un-blocked only if the indicators reach specific pre-defined milestones; and
— the ex-ante conditionalities which require a Member State to fulfil certain conditions (among others linked to the transposition and effective imple-mentation of EU legislation and to existence of policy/strategic frameworks) in the areas of ESI funds’ investments. It should be noted that Member States can receive co-financing from ESI Funds before the ex-ante conditionalities are fulfilled. The Commission may decide to suspend part or all interim pay-ments if ex-ante conditionalities are not fulfilled.
06 Annex I compares each of these key provisions for the 2014-2020 programme period with corresponding provisions in the 2000-2006 and 2007-2013 periods. The aspects related to the setting of ex-ante conditionalities, the specification of performance indicators and the arrangements concerning the performance reserve will be addressed in a second report (see paragraph 28).
2 Articles 23 and 50 of Council Regulation (EC) No 1083/2006 of 11 July 2006 laying down general provisions on the European Regional Development Fund, the European Social Fund and the Cohesion Fund and repealing Regulation (EC) No 1260/1999 (OJ L 210, 31.7.2006, p. 25).

17Introduction
Adoption of the 2014-2020 legal framework for Cohesion policy – the main steps
Preparation of the Commission’s legislative proposal
07 In 2010, the European Council adopted the Europe 2020 Strategy which aims to help Europe to emerge stronger from the crisis as well as to prepare the EU economy for the next decade. The Strategy identified key priorities for growth and headline targets to be met by 2020 (see Annex II).
08 During 2010, the Commission carried out Impact Assessments for its legislative proposal of the Common Provisions Regulation (CPR) which sets out the general common provisions for all ESI funds3. It was published in October 2011 and rec-ommended the use of ex-ante conditionalities, performance review, performance reserve and a strengthened macro-fiscal conditionality.
09 Finally, during 2012, the Commission developed Position Papers for each Mem-ber State. They were sent to the competent national authorities in autumn 2012 before being presented by high-level Commission officials. They contained the Commission’s analysis of the main challenges faced by each Member State, along with the progress made with respect to the attainment of the Europe 2020 tar-gets, and the Commission’s view on the most relevant priorities for funding. The position papers also contained references to the Country-Specific Recommen-dations (CSRs) and the European Semester. Subsequently, these staff working papers provided the basis for the Commission’s negotiations with the Member States.
3 SEC(2011) 1141 final of 6 October 2011 ‘Impact Assessment’.

18Introduction
Negotiations of the Cohesion legislative package between Commission, European Parliament and Council
Cohesion legislative package closely linked to the Multiannual Financial Framework
10 The discussions at the European Parliament and the Council on the Cohesion policy legislative package were closely linked to those on the Multiannual Financial Framework (MFF)4, which determines the total amount of EU funding available during the programme period. This MFF was the first one adopted in in accordance with the provisions of the Treaty of Lisbon. This means that, the Council, acting in accordance with a special legislative procedure, unanimously adopts the MFF Regulation after having obtained the consent of the European Parliament. The Commission made its MFF proposal for the 2014-2020 period in June 2011. The MFF was adopted by the Council and the European Parliament only in December 20135.
Powers of the European Parliament increased through the use of the ordinary legislative procedure
11 The Treaty on the Functioning of the European Union (TFEU) had increased the European Parliament’s powers by applying the ordinary legislative procedure (co-decision) to the entire Cohesion policy legislative package6. The Commission made its proposal for the legislative package of the Cohesion policy in October 2011. For the first time, the Parliament and the Council played an equal role in the negotiation of the general provisions of the Structural Funds, following the changes made in the TFEU. In the previous programing period, the co-decision procedure only applied to the fund-specific rules. In practice, that meant that both the European Parliament and the Council were able to give opinions on all the Commission’s proposals, and that a common position needed to be reached between the Commission, the Parliament and the Council. The negotiations started in July 2012 under the Cypriot Presidency. Overall, there were 73 meetings between the three institutions, including seven meetings in the presence of the Commissioner, only for the CPR.
12 The CPR and the fund-specific regulations for five ESI funds7 were adopted by the Council on 17 December 2013. The secondary legislation, i.e. the implementing and delegated acts, was then adopted by January 20168 (see Figure 3).
4 COM(2011) 398 final of 29 June 2011 ‘Proposal for a Council Regulation laying down the multiannual financial framework for the years 2014-2020’.
5 Council Regulation (EU, Euratom) No 1311/2013 of 2 December 2013 laying down the multiannual financial framework for the years 2014-2020 (OJ L 347, 20.12.2013, p. 884).
6 Article 177 of TFEU.
7 Regulation (EU) No 1300/2013 of the European Parliament and of the Council of 17 December 2013 on the Cohesion Fund and repealing Council Regulation (EC) No 1084/2006 (OJ L 347, 20.12.2013, p. 281); Regulation (EU) No 1301/2013 of the European Parliament and of the Council of 17 December 2013 on the European Regional Development Fund and on specific provisions concerning the Investment for growth and jobs goal and repealing Regulation (EC) No 1080/2006 (OJ L 347, 20.12.2013, p. 289); Regulation (EU) No 1304/2013 of the European Parliament and of the Council of 17 December 2013 on the European Social Fund and repealing Council Regulation (EC) No 1081/2006 (OJ L 347, 20.12.2013, p. 470); Regulation (EU) No 1305/2013 of the European Parliament and of the Council of 17 December 2013 on support for rural development by the European Agricultural Fund for Rural Development (EAFRD) and repealing Council Regulation (EC) No 1698/2005 (OJ L 347, 20.12.2013, p. 487); and Regulation (EU) No 508/2014 of the European Parliament and of the Council of 15 May 2014 on the European Maritime and Fisheries Fund and repealing Council Regulations (EC) No 2328/2003, (EC) No 861/2006, (EC) No 1198/2006 and (EC) No 791/2007 and Regulation (EU) No 1255/2011 of the European Parliament and of the Council (OJ L 149, 20.5.2014, p. 1).
8 Last Regulation adopted was the Commission Delegated Regulation (EU) 2016/568 of 29 January 2016 supplementing Regulation (EU) No 1303/2013 of the
19Introduction
Programming of Cohesion policy for the 2014-2020 period
Main building blocks of the programming process: Common Strategic Framework, Thematic objectives, Partnership Agreements and Operational Programmes
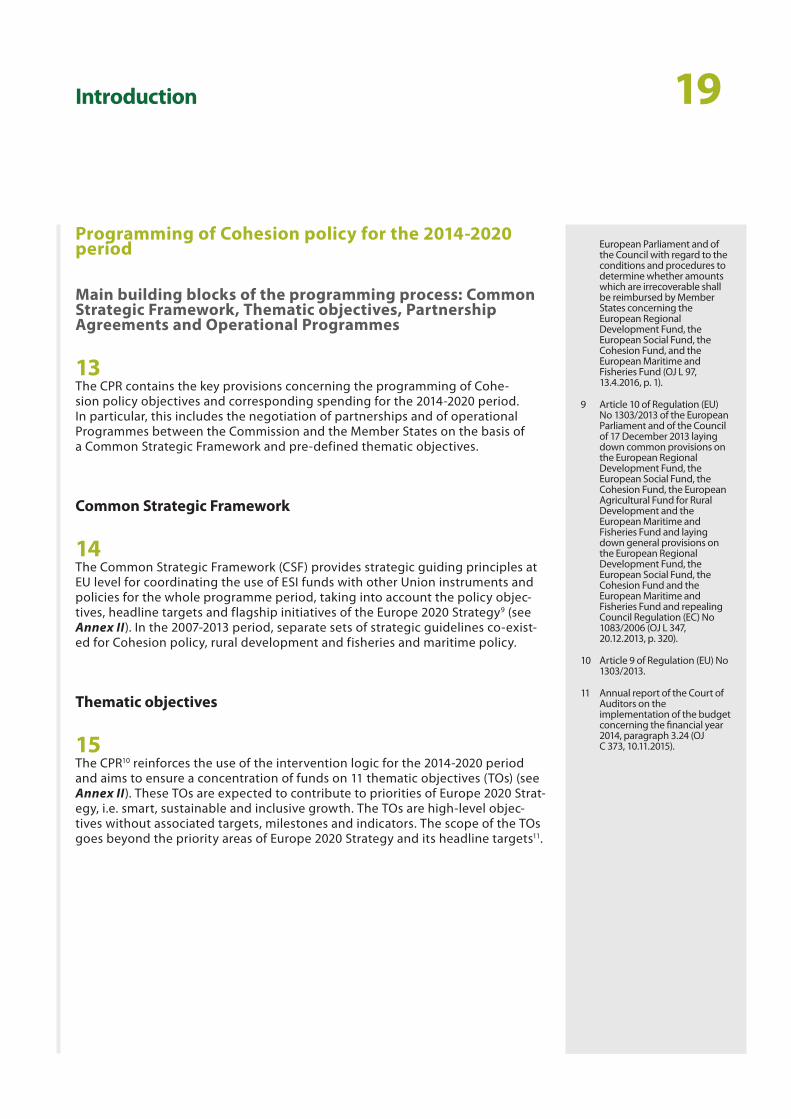
13 The CPR contains the key provisions concerning the programming of Cohe-sion policy objectives and corresponding spending for the 2014-2020 period. In particular, this includes the negotiation of partnerships and of operational Programmes between the Commission and the Member States on the basis of a Common Strategic Framework and pre-defined thematic objectives.
Common Strategic Framework
14 The Common Strategic Framework (CSF) provides strategic guiding principles at EU level for coordinating the use of ESI funds with other Union instruments and policies for the whole programme period, taking into account the policy objec-tives, headline targets and flagship initiatives of the Europe 2020 Strategy9 (see Annex II). In the 2007-2013 period, separate sets of strategic guidelines co-exist-ed for Cohesion policy, rural development and fisheries and maritime policy.
Thematic objectives
15 The CPR10 reinforces the use of the intervention logic for the 2014-2020 period and aims to ensure a concentration of funds on 11 thematic objectives (TOs) (see Annex II). These TOs are expected to contribute to priorities of Europe 2020 Strat-egy, i.e. smart, sustainable and inclusive growth. The TOs are high-level objec-tives without associated targets, milestones and indicators. The scope of the TOs goes beyond the priority areas of Europe 2020 Strategy and its headline targets11.
European Parliament and of the Council with regard to the conditions and procedures to determine whether amounts which are irrecoverable shall be reimbursed by Member States concerning the European Regional Development Fund, the European Social Fund, the Cohesion Fund, and the European Maritime and Fisheries Fund (OJ L 97, 13.4.2016, p. 1).
9 Article 10 of Regulation (EU) No 1303/2013 of the European Parliament and of the Council of 17 December 2013 laying down common provisions on the European Regional Development Fund, the European Social Fund, the Cohesion Fund, the European Agricultural Fund for Rural Development and the European Maritime and Fisheries Fund and laying down general provisions on the European Regional Development Fund, the European Social Fund, the Cohesion Fund and the European Maritime and Fisheries Fund and repealing Council Regulation (EC) No 1083/2006 (OJ L 347, 20.12.2013, p. 320).
10 Article 9 of Regulation (EU) No 1303/2013.
11 Annual report of the Court of Auditors on the implementation of the budget concerning the financial year 2014, paragraph 3.24 (OJ C 373, 10.11.2015).

20Introduction
16 The fund-specific legislation for the ERDF, ESF and CF also specify investment priorities12 linked to TOs. Moreover, there are a number of regulatory require-ments as regards the allocation of funding (see Box 1 and Annex II). Within this framework, each Member State is expected to identify the national or regional investment needs and channel ESI funds to finance investment needs that are most suited to attain or significantly contribute to the achievement of Europe 2020 objectives.
17 The prioritisation of funding is to be done first, at the level of the Partnership Agreements, and, then, at the level of the Operational Programmes. It has an im-pact on the design of interventions in terms of specific objectives which should be achievable within the implementation period and target values of the corre-sponding performance indicators.
Thematic concentration – overview of main regulatory requirements
First, the scope of the support that can be provided by each fund is set in the fund-specific regulations: the ERDF can provide support to TOs 1-11, the ESF to TOs 8-11 and the CF to TOs 4-7 and 1113.
Moreover, under the ERDF, a fixed percentage (from 50 % to 80 %) of the total funding in less-developed, tran-sition and more-developed regions must be allocated to TOs 1-414. In addition, the minimum allocation to TO4 must be between 12 % and 20 % of the total ERDF allocation, depending on the type of region15.
Under the ESF, at least 20 % of the total budget allocation to a Member State must be allocated to TO916 and, at the level of the programmes, 60 % to 80 % of funds must be allocated to up to five investment priorities17.
In addition to these fund-specific requirements on thematic concentration, the scope of the support may ad-ditionally be concentrated on the areas of strategic relevance. For example, Member States and regions that allocated funds to TO1 also had to develop smart specialisation strategies, i.e. they need to identify a limited number of smart specialisation areas with growth potential. The smart specialisation strategies need to ex-plain how the Member States and regions intended to build a competitive advantage for businesses in their country/region. This requirement is part of the ex-ante conditionality 1.118.
13 Article 5 of Regulation (EU) No 1301/2013, Article 3 of Regulation (EU) No 1304/2013 and Article 4 of Regulation (EU) No 1300/2013.
14 Article 4 of Regulation (EU) No 1301/2013.
15 Article 4 of Regulation (EU) No 1301/2013.
16 Article 4.2 of Regulation (EU) No 1304/2013.
17 Article 4.3 of Regulation (EU) No 1304/2013.
18 Regulation (EU) No 1303/2013, Annex XI, ex-ante conditionality 1.1: ‘The existence of a national or regional smart specialisation strategy in line with the National Reform Program’.
Box
1
12 Article 5 of Regulation (EU) No 1301/2013; Article 3 of Regulation (EU) No 1304/2013; and Article 4 of Regulation (EU) No 1300/2013.

21Introduction
Partnership Agreements
18 The Partnership Agreements (PAs) are national investment plans prepared in line with the guiding principles of the CSF. They cover the entire programme period and encompass all five ESI funds. There is one PA per Member State prepared on the basis of the National Reform Programmes presenting the country’s policies and measures to sustain growth and jobs and to reach the Europe 2020 targets, the most recent relevant CSRs and relevant Council recommendations.
19 The content of the PAs is laid down in the CPR19 and the Commission has issued additional guidance on the specific information to be provided in the PAs20 (see Box 2). Key parts of the PAs are approved by the Commission.
19 Article 15(1) and (2) of Regulation (EU) No 1303/2013.
20 Guidance Fiche No 1a, Partnership Agreement, Version 1, April 2013 and Draft Template and Guidelines on the Content of the Partnership Agreement.
Partnership agreements
PAs encompass all ESI funds and outline the goals and TOs pursued by the Member State, thus providing an overview of the information that is further developed in the individual OPs.
Subject of approval by the Commission includes information on the Member State’s development needs; selected TOs; an indicative allocation of EU support; a list of OPs for the Member State; a description of the institutional arrangements; list of partners and partnership principle, assessment of administrative capacity; summary of ex-ante evaluations; information on ex-ante verifications of compliance with rules on addition-ality; a summary of assessment of the ex-ante conditionalities; a methodology and mechanisms to ensure functioning of the performance framework and allocation of performance reserve; and a summary of actions planned in the programmes to reduce the administrative burden.
Box
2

22Introduction
Operational Programmes
20 During the 2014-2020 period, the three ESI funds for Cohesion policy (ERDF, CF and ESF) continue to be implemented through OPs. In an OP a Member State sets out investment priorities and specific objectives for intervention (covering the entire programme period) to meet targets of selected thematic objectives and describes how the funding (EU and national public and private co-financing) will be used during the period to finance projects. The OPs are prepared by the Member States in line with the CSF and the PA. Each OP is built upon priority axes (see Box 3).
Operational Programmes
Within each OP, the information on the selected thematic objectives, which it pursues with the support of ESI funds, and the relevant investment priorities are presented at the level of priority axis. Each priority axis can be linked with more than one thematic objective. Each OP consists of a number of priority axes.
The OPs have a matrix design. That means that they present the performance and financial information along two main parameters, i.e. priority axes defined individually by the Member States and the selected invest-ment priorities set out in the fund-specific Regulations. This information is also broken down by categories of regions such as: less-developed, transitional, outermost and more-developed regions and by fund.
As a general rule, programmes should set out priority axes which are mono-fund (i.e. covering just one fund such as ERDF, ESF or CF) and which cover only one thematic objective and a single category of region. How-ever, it is also possible to set up a priority axis covering more than one fund and more than one category of region, or to set up a priority axis combining investment priorities from different thematic objectives21.
21 Article 96 of the Regulation (EU) No 1303/2013 and Section two of Commission Implementing Regulation (EU) No 288/2014 laying down rules pursuant to Regulation (EU) No 1303/2013 with regard to the model for operational programmes under the Investment for growth and jobs goal and pursuant to Regulation (EU) No 1299/2013 of the European Parliament and of the Council on specific provisions for the support from the European Regional Development Fund to the European territorial cooperation goal with regard to the model for cooperation programmes under the European territorial cooperation goal (OJ L 87, 22.3.2014, p. 1).
Box
3

23Introduction
21 In 2014, the Commission adopted an Implementing Regulation on the template of the OPs that determined the way the content of the OPs is presented22. An OP must be approved by the Commission before any payments from the EU budget can be made.
22 Regulation (EU) No 288/2014.
Tabl
e 1 Number of OPs adopted: comparison between the 2007-2013
and 2014-2020 periods1
Programing Periods
2014-2020 2007-2013
ERDF and CF OPs 124 249
ESF OPs 95 118
ETC OPs 76 73
Multi fund OPs 92 NA
Total 387 440
1 This table excludes the IPA and FEAD OPs, which are not adopted under the CPR.
Source: Commission data from Infoview and SFC2007, adapted by ECA.
22 The Commission negotiated 387 OPs during the 2014-2020 period, compared to 440 OPs in the previous period. For 281 OPs, the Directorate-General for Regional and Urban Policy took the lead. The Directorate-General for Employment, Social Affairs and Inclusion was in charge of the 106 ESF OPs.

24Introduction
Performance indicators for outputs and results
23 The implementation of actions at the level of the OPs’ priority axes is monitored and measured by performance indicators for outputs and results.
— The implementation of the actions foreseen under the investment priorities of the OPs is to be measured by output indicators. Common output indicators are specified in the Regulation for each fund23. Additional programme-specif-ic output indicators can also be determined by the Member State.
— The achievement of the specific objectives of the OPs is to be measured by result indicators24. There are programme-specific result indicators and also, for the ESF, common result indicators.
24 Since the beginning of the 2014-2020 period, the Commission has made the per-formance information reported by Member States publicly available on its ESIF Open Data platform25.
25 Annex III shows how the output and result indicators are linked to the thematic objectives, investment priorities and specific objectives.
Procedural provisions regarding the adoption of Partnership Agreements and Operational Programmes
26 The CPR also details the responsibilities of the Commission and Member States in the process of preparing and adopting the PAs and OPs. Both documents are drawn up by the Member State in dialogue with the Commission and in coop-eration with partners (such as public authorities; economic and social partners and non-governmental organisations)26. This must be based on transparent procedures and be in accordance with the Member States’ institutional and legal framework.
23 Annex I of Regulations (EU) No 1301/2013, No 1304/2013 and No 1300/2013.
24 Article 96.2(b)(ii) of Regulation (EU) No 1303/2013.
25 Open Data Portal for the ESI funds (https://cohesiondata.ec.europa.eu/).
26 Article 5 of Regulation (EU) No 1303/2013.

25Audit scope and approach
27 Through this audit, we examined whether the Commission had effectively nego-tiated the Partnership Agreements (PAs) and Operational Programmes (OPs) with the Member States for the 2014-2020 Cohesion Policy so that EU funding is more effectively targeted on Europe 2020 Strategy priorities, so that interventions are better justified in terms of investment needs and intended results, and so that the conditions against which the performance of these programmes would be measured had been adequately set. In particular, we assessed whether:
— the Commission had completed the negotiation of the PAs and OPs with the Member States as quickly as possible and within the regulatory deadlines;
— the Commission succeeded in ensuring an alignment of Cohesion spending with the Europe 2020 strategy in its negotiation of PAs;
— the OPs showed clearly which investment needs remained to be addressed and what results are expected from the planned interventions; and
— the financial monitoring arrangements and the performance indicators for outputs and results allowed for cost-effective monitoring of spending priori-ties and of performance, and set a solid basis for better performance-based arrangements in allocating funding for the post-2020 programme period.
28 This is the first of two reports dealing with the Commission’s negotiation of the 2014-2020 PAs and OPs. The second report will focus on the setting of ex-ante conditionalities, the specification of performance indicators and the arrange-ments concerning the performance reserve.
29 Our audit work for the present report comprised the following:
— An analysis of the timeframe in which the negotiations of the Cohesion legis-lative package, the PAs and the OPs took place.
— An assessment of the Commission’s internal procedures for the negotiating and adopting the PAs and OPs.
— An in-depth analysis of five PAs and 14 ERDF and ESF OPs for five Member States (Spain, Ireland, Croatia, Poland and Romania) as regards the thematic concentration of spending, the articulation of the intervention logic and ad-equacy of performance indicators for results and outputs. We also carried out a study visit to Denmark covering two OPs.

26Audit scope and approach
— A review of the Commission’s negotiation files and of the Member States’ supporting documentation for the preparation of the PAs and OPs in our sample.
— Interviews with more than 50 staff involved in the negotiations at the Directorate-General for Regional and Urban Policy and DG Directorate-Gen-eral for Employment, Social Affairs and Inclusion and with more than 40 of-ficials in the Member States and their permanent representations in Brussels.
— Consultations with experts in the field of regional, structural and cohesion policies of the European Union and performance budgeting, as well as na-tional experts and representatives of permanent representations of Member States to the EU.
30 Our analysis is focused on the thematic objectives 1 ‘Strengthening research, technological development and innovation’ (TO1) and 8 ‘Promoting sustain-able and quality employment and supporting labour mobility’ (TO8). These two thematic objectives were selected primarily since they account for the highest level of the financial allocation for the ERDF (TO1) and ESF (TO8) shared by all Member States.
31 We also took into account of the Commission’s report on the outcomes of the ne-gotiations concerning the PAs and OPs, which provided a general overview of the key issues (such as contribution of the ESI funds to the EU’s growth strategy, the Investment Plan and the Commission’s priorities over the next decade) for each Member State in December 201527.
32 The period covered by this audit was from December 2013 to December 2015, when the last 2014-2020 OP was adopted.
27 COM(2015) 639 final of 14 December 2015 ‘Investing in jobs and growth - maximising the contribution of European Structural and Investment Funds’, in particular Annex II.

27Observations
Commission kept delays in the negotiation of Partnership Agreements and of Operational Programmes under control
33 We analysed the time taken to adopt the Cohesion legislative package, the Part-nership Agreements (PAs) and Operational Programmes (OPs) for the 2014-2020 programme period and compared this to the length of negotiations during the previous period. We also reviewed the Commission’s preparatory work and their internal procedures set for the negotiations. In addition, we tried to identify the main factors contributing to delays in finalising negotiations.
The European Parliament and Council adopted the Cohesion policy legislative package late in 2013
34 The Commission should prepare and conduct the negotiations of PAs and OPs with Member States in a way that allows them to be adopted within the regula-tory deadlines set out in the legal base as early as possible. Negotiations of PAs and OPs can only formally start once the legal framework has been adopted by the European Parliament and the Council. The deadline for submission of all PAs was April 201428. Member States were also required to submit all OPs within three months from the date of the submission of their PA29.
35 The European Parliament and the Council adopted the Cohesion Policy legislative package in December 2013, i.e. just before the start of the 2014-2020 programme period (see also paragraph 13). Compared to the 2007-2013 period, where the legal base was adopted in July 2006, this represents a delay of five months.
28 Article 14 of Regulation (EU) No 1303/2013.
29 Article 26.4 of Regulation (EU) No 1303/2013 regarding the OPs under the investment for growth and jobs goal. Under the European territorial cooperation goal, the deadline is of 9 months after the entry into force of the CPR.

28Observations
Figu
re 3
1 From the initial proposal to the adoption;
2 Adoption of the implementing regulations (eight Regulations have been adopted until November 2016). Implementing regulations set out the conditions for the implementation of legally binding acts. The Commission adopted these regulations under the ‘comitology’ procedure, i.e., supported by committees of EU countries’ representatives;
3 Adoption of delegated regulations (nine regulations have been adopted up to November 2016). Delegated regulations are ‘non-legislative acts of general application to supplement or amend certain non-essential elements of a legislative act’ (Article 290 of the Treaty on the Func-tioning of the European Union);
4 Period from the submission of the first PA/OP to the adoption of the last PA/OP.
Source: ECA.
Legal framework for the negotiations of PAs and OPs and Commission guidance - timeline
2011
Guid
ance
pro
vide
dAd
optio
n of
PAs
and
OPs
Adop
tion
of Le
gisla
tion
2012 2013 2014 2015 2016
TO1
TO8
Intervention logic
Ex anteconditionalities
Performance Framework
OPs adoption period4
PA adoptionperiod4
Delegated regulations3
Implementing regulations2
Fund Speci�c Regulations1 (ERDF, ESF, CF)
Common Provisions Regulation1

29Observations
36 Compared to the previous period, the Commission presented its legislative proposal three months later (i.e. October of 2011 compared with July of 2004). In addition, the negotiation process between the Council and the European Parlia-ment took two-and-a-half months longer (803 compared with 727 days). More time was needed to find an agreement, due to the need to wait for the adoption of the Financial Regulation30 (adopted in October of 2012) and of the MFF (adopt-ed in December of 2013), as well as due to the comparatively greater power of the European Parliament over the 2014-2020 negotiations (see paragraph 11).
37 The Commission was then required to adopt the secondary legislation, i.e. a total of 17 implementing and delegated acts (see paragraph 13). The adoption of the legal framework was gradually completed until January 2016, i.e. in parallel with adoption of the OPs by the Commission (see Figure 3). A first batch of three implementing acts31 and four delegated acts32 was adopted by March 2014 and a second batch of four implementing acts33 was adopted by January 2015.
The Commission took a pro-active approach to the negotiation of Partnership Agreements and Operational Programmes
38 The Commission’s approach to the negotiations should be consistent across the different funds and Directorates-General, and it should make available to Mem-ber States all relevant information and support needed to prepare their program-ming documents (in the form of guidance, training or informal communications) in good time.
30 Regulation (EU, Euratom) No 966/2012 of the European Parliament and of the Council of 25 October 2012 on the financial rules applicable to the general budget of the Union and repealing Council Regulation (EC, Euratom) No 1605/2002 (OJ L 298, 26.10.2012, p. 1).
31 (1) Regulation (EU) No 288/2014; (2) Commission Implementing Regulation (EU) No 184/2014 of 25 February 2014 laying down pursuant to Regulation (EU) No 1303/2013 on the terms and conditions applicable to the electronic data exchange system between the Member States and the Commission and adopting pursuant to Regulation (EU) No 1299/2013 of the European Parliament and of the Council on specific provisions for the support from the ERDF to the European territorial cooperation goal, the nomenclature of the categories of intervention for support from the ERDF under the European territorial cooperation goal (OJ L 57, 27.2.2014, p. 7) and (3) Commission Implementing Regulation (EU) No 215/2014 of 7 of March 2014 laying down rules for implementing Regulation (EU) No 1303/2013 with regard to methodologies for climate change support, the determination of milestones and targets in the performance framework and the nomenclature of categories of intervention for the ESI Funds (OJ L 69, 8.3.2014, p. 65).
32 (1) Commission Delegated Regulation (EU) No 240/2014 of 7 of January 2014 on the European code of conduct on partnership in the framework of the ESI Funds (OJ L 74, 14.3.2014, p. 1); (2) Commission Delegated Regulation (EU) No 480/2014 of 3 March 2014 supplementing Regulation (EU) No 1303/2013 (OJ L 138, 13.5.2014, p. 5); (3) Commission Delegated Regulation (EU) No 481/2014 of 4 March 2014 supplementing Regulation (EU) No 1299/2013 of the European Parliament and of the Council with regard to specific rules on eligibility of expenditure for cooperation programmes (OJ L 138, 13.5.2014, p. 45); (4) Commission Delegated Regulation (EU) No 522/2014

30Observations
Commission’s negotiation position developed on the basis of inputs received from all relevant services
39 The CPR for the 2014-2020 period covers five different funds and also provides the possibility of setting-up multi-fund OPs. In April 2013, the ESI Funds Direct-orates-General jointly issued operational procedures to be followed by Commis-sion staff during the preparation and negotiation of PAs and these multi-funds OPs. In addition, the Directorate-General for Regional and Urban policy and the Directorate-General for Employment, Social Affairs and Inclusion developed roadmaps with detailed steps to follow during the negotiations with Member States and checklists to ensure consistency in the analysis of the PAs and OPs across the different units. The negotiations of the PAs and the OPs were managed mainly by the geographical units within the Directorates-General.
Informal dialogue on PAs and OPs helped to prepare negotiations and to mitigate the impact of the late adoption of Regulations
40 The Commission encouraged Member States to present drafts of the PAs and OPs as early as 2013. This was the case for the PAs of all Member States covered by this audit. In all these cases, the Commission carried out a consultation with all relevant DGs. Based on this input and its initial assessment in the Position Papers (see paragraph 9), the Commission then provided informal observations on the draft PAs before the start of the negotiations.
41 These discussions during the preparatory phase of the negotiations allowed the Commission to anticipate which subjects would pose particular problems during the formal negotiations and to mitigate the impact of the late adoption of the regulations on the adoption of PAs and OPs.
42 Member States were less active in consulting the Commission on draft OPs. Only five of the 14 OPs examined had been informally sent for review34.
of 11 March 2014 supplementing Regulation (EU) No 1301/2013 of the European Parliament and of the Council with regard to the detailed rules concerning the principles for the selection and management of innovative actions in the area of sustainable urban development to be supported by the ERDF (OJ L 148, 20.5.2014, p. 1).
33 (1) Commission Implementing Regulation (EU) No 821/2014 of 28 July 2014 laying down rules for the application of Regulation (EU) No 1303/2013 as regards detailed arrangements for the transfer and management of programme contributions, the reporting on financial instruments, technical characteristics of information and communication measures for operations and the system to record and store data (OJ L 223, 29.7.2014, p. 7); (2) Commission Implementing Regulation (EU) No 964/2014 of 11 September 2014 laying down rules for the application of Regulation (EU) No 1303/2013 as regards standard terms and conditions for financial instruments (OJ L 271, 12.9.2014, p. 16); (3) Commission Implementing Regulation (EU) No 1011/2014 of 22 September 2014 laying down detailed rules for implementing Regulation (EU) No 1303/2013 as regards the models for submission of certain information to the Commission and the detailed rules concerning the exchanges of information between beneficiaries and managing authorities, certifying authorities, audit authorities and intermediate bodies (OJ L 286, 30.9.2014, p. 1); (4) Commission Implementing Regulation (EU) No 2015/207 of 20 January 2015 laying down detailed rules implementing Regulation (EU) No 1303/2013 as regards the models for the progress report, submission of the information on a major project, the joint action plan, the implementation reports for the Investment for growth and jobs goal, the management declaration, the audit strategy, the audit opinion and the annual control report and the methodology for carrying out the cost-benefit analysis and pursuant to Regulation (EU)

31Observations
Commission provided guidance notes for the negotiations to Member States, but only late in the process
43 The Commission provided a considerable number of general and thematic guid-ance notes to its own staff and to the Member States (with a total volume of more than 200 pages for TO1 and TO8 only and 400 pages for ex-ante conditionalities). These notes contained detailed recommendations and instructions on the differ-ent topics under negotiation.
44 However, this guidance was made available late in the process also due to the fact that the cohesion policy package was adopted only in December 2013. Draft versions of guidance were nevertheless sent to Member States as soon as it was possible, in line with the state of negotiations on the legislation. For example, the first versions of the Commission guidance on ex-ante conditionalities were issued in March and April, and updated in August 2013, but did not yet include guid-ance on the areas that were then still under discussion between the legislators. In August 2013, guidance was available for 34 out of 36 ex-ante conditionalities. Member States had to wait until February 2014 to obtain a comprehensive final version of the guidance note. Final versions of the guidance notes were issued only in a few cases. Even for important areas, such as ex-ante conditionalities or performance framework review and reserve, final versions were not published before February and May 2014. The guidance notes were revised until September 2014.
45 Nevertheless, the representatives of the Member States covered by this audit confirmed that the Commission provided informal and formal assistance during the negotiations and described the cooperation with the Commission as gener-ally constructive. Commission staff in charge of negotiations regularly visited the Member States and kept in regular contact with national authorities.
No 1299/2013 of the European Parliament and of the Council as regards the model for the implementation reports for the European territorial cooperation goal (OJ L 38, 13.2.2015, p. 1).
34 This is the case for the Croatian National ERDF OP, Irish National ESF OP, Romanian National ERDF and ESF OPs, and the Romanian ERDF Regional OP.

32Observations
Despite difficulties, the Commission adopted PAs and OPs within the deadline specified in the Regulation
46 The Commission must make any observations on the PAs and OPs within three months after the date they are submitted35. In response to these obser-vations, the Member State must provide the Commission with all necessary additional information and, where appropriate, revise the document. Provid-ed that any observation made by the Commission has been adequately taken into account by the Member State, the Commission should adopt a decision approving the PA, within the four months after its submission36. Also, the Commission should approve each OP no later than six months following its submission by the Member State, provided that any observation made by the Commission has been adequately taken into account37. The time period from the moment when the Commission send the observations to the Member State until the Member State resubmits the OPs that can be adopted (i.e. where observation made by the Commission has been adequately taken into account)38 is not counted towards this regulatory timeline.
47 In early 2013, the Commission had indicated to the Member States that it intended to adopt all PAs in early 2014 and all OPs by the end of July 201439. Our analysis showed however that the last PA had been adopted in Novem-ber 2014 and the last OP in December 2015. The later adoption of the Cohe-sion policy legislative package deferred the adoption of the PAs and OPs in relation to the Commission’s initial planning. Moreover, the first PAs were submitted to the Commission in January 2014 and first OPs in March 2014. For these PAs and OPs, the informal negotiations were therefore initiated before the relevant regulations had been formally adopted.
Partnership agreements
48 All PAs were submitted within the regulatory deadline (April 2014). The PAs were negotiated more quickly than in the 2007-2013 period. The last PAs were adopted only around one month later than the last NSRF, even though the negotiations started two-and-a-half months later (see Figure 4).
35 Articles 16.1 and 29.3 of Regulation (EU) No 1303/2013 regarding the PAs and OPs, respectively.
36 Article 16.2 of Regulation (EU) No 1303/2013.
37 Article 29.4 of Regulation (EU) No 1303/2013.
38 Article 3 of Regulation (EU) No 1303/2013.
39 Letter sent by the directors-general of the ESIF DGs (Directorate-General for Regional and Urban Policy/WD Ares (2013)) to the Member States.

33Observations
Operational Programmes
49 In November 2014, the European Parliament urged the Commission and the Member States ‘to strengthen their efforts to rapidly increase the quality of Operational Programmes when necessary in order to ensure that as many pro-grammes as possible are ‘ready for adoption’ by 31st December 2014’40, i.e. before the appointment of the new Commission. By December 2014, 198 of the 311 OPs (excluding the ETC OPs) under the ‘Investment for growth and jobs’ goal (64 %) had been adopted, almost all of them (151) during the month of December. In the previous programme period 2007-2013, 98 % of the OPs had been adopted by the equivalent month (December 2007). This is mainly due to the delayed adoption of the legislative package.
50 Member States submitted the majority of their draft OPs 85 % within the regula-tory deadline. The Commission could not start the formal negotiations for 15 % of the OPs within three months after the submission of the PAs.
40 European Parliament - Motion for a resolution on delays in the start-up of cohesion policy for 2014-2020 of 24/11/2014 (B8-0281/2014).

34Observations
Figu
re 4 Negotiations of PAs/NSRF and OPs1 (time between first submission and last
approval) – comparison between the 2007-2013 and 2014-2020 periods
1 Croatia is not included in the analysis of the programing period 2007-2013 as it joined the EU in 2013. It also excludes the IPA and FEAD OPs which are not adopted under the Common Regulation for ERDF, ESF and CF;
2 Takes into account 2 % of outlier OPs.
Source: ECA.
Prog
ram
min
g pe
riod
2014
-202
0Pr
ogra
mm
ing
perio
d 20
17-2
013
800days
2009 | 2010 2008 | 2009 2007 | 2008
ETC OPs adoption
423days
OPs adoption (excludes ETC)
342daysNSRF adoption
1 026days2
ETC OPs adoption599days
703daysOPs adoption (excludes ETC)
312daysPA adoption
2006 | 2007
2016 | 2017 2013 | 2014 2015 | 20162014 | 2015

35Observations
51 On average, during the 2014-2020 period, it took around eight months to finalise the negotiation and to adopt an OP. The average adoption time is comparable with the 2007-2013 period, with around 24 more days needed from the time of submission of an OP until the date of its adoption: 241 as compared to 217 days (see Figure 5).
Figu
re 5 Average adoption time of the OPs1 in calendar days (first submission until final
adoption)
1 This analysis does not consider the IPA and FEAD OPs which are not adopted under the Common Provisions Regulation and does not take into account the stop the clock procedure.
Source: Commission data adapted by ECA.
217
241
Total average days 2007-2013Total average days 2014-20202014-20202007-2013
227
191
240250252
242
209
ETCMulti-fundESFERDF/CF
250
200
150
100
50
0

36Observations
52 In 2007-2013 period, the negotiations for a limited number of OPs took nearly 3 years. There were no such cases in the 2014-2020 period. The maximum time from the first submission to the last adoption of an OP under the investment for growth and jobs goal decreased by 32 % compared to the 2007-2013 period (from 1 02641 to 703 days). In particular, the time needed to negotiate ETC OPs was con-siderably shorter (599 compared with 800 days).This does not take into account the stand-still period given by the CPR (see paragraph 46). For the OPs examined in the audit, 52 % of that time can be attributed to the Member States revising the OPs that would then be resubmitted to the Commission (see paragraph 55).
Additional requirements, IT problems and complex approval process contributed to long duration of negotiations of Partnership Agreements and Operational Programmes
53 There were some delays in adopting PAs and OPs compared to the deadlines specified in the regulations. We found that in some cases the Commission had not respected the deadlines for sending observations to the Member States (three months): this was the case for one of five PAs (Croatia) and seven out of the fourteen OPs (Ireland, Poland and Spain) examined42.
54 There were also considerable quality issues with the draft OPs submitted by Member States; these resulted in the Commission requesting modifications. For example, for the 14 OPs examined, the Commission sent observations, and on average, these OPs had to be resubmitted three times by the Member State to the Commission.
41 This is due to 5 OPs adopted in 2008 and 2009. Without these OPs the maximum duration would have been 423 days.
42 CCI Codes 2014IE16RFOP001, 2014IE16RFOP002, 2014PL16RFOP001, 2014PL05M9OP001, 2014PL16M2OP012, 2014ES16RFOP001, 2014ES05S-FOP002 and 2014ES16RFOP003.

37Observations
55 These delays and the increase in the time needed to adopt an OP suggest that negotiations were more demanding than in the previous programme period. We identified several reasons for this.
— Additional requirements: there were a number of new topics that had not been part of negotiations before. This obviously took more time. Examples include the obligation to agree on ex-ante conditionalities, this required Commission staff to analyse in detail certain policies of the Member State. They also include the requirement to set out a more explicit intervention logic and performance framework, requiring a more in-depth discussion to ensure that the interventions with the most impact in the EU policy are selected for implementation. Moreover the performance output and result indicators were negotiated upfront together with the OPs unlike in the previ-ous programme period when they could be agreed at the later stage.
— IT problems: the formal electronic exchange of information between Member States and the Commission during negotiations was made through the new system SFC2014. The use of this IT tool was mandatory during the negotiations of the OPs43. It was released in January 2014, though it only later became fully operational. During its first year of operation, 19 different versions of SFC2014 were released to fix problems. All Member States visited for this audit reported having experienced problems with its use, and four of them stated that the system was not fully operational when they submitted their PA.
— Commission observations on draft OP subject to approval: unlike in previous periods the Commission’s observations on the draft OPs were required to be adopted by the College of Commissioners44. Consequently, in cases where the documentation submitted by the Member State gave rise to observations being sent by the Commission, at least three inter and intra service consultations would need to be held: one to collect observations from all relevant services, a second to approve the observations to be sent to the Member State and a third one to adopt the OP. We identified a total of 896 (on average 3 per OP) inter service consultations that had been held in connection with the negotiation and adoption of OPs.
43 Regulation (EU) No 184/2014.
44 In the previous programing period only the final OPs needed to be adopted by the College of Commissioners, not the observations.

38Observations
Partnership Agreements were instrumental in focusing Cohesion spending on the Europe 2020 Strategy
56 The PAs were required to be designed on the basis of an intervention logic which is clearly articulated and aimed at avoiding an excessive fragmentation of funding. Member States must identify the main development and investment needs and provide in the PAs these which are attributable to the TOs pre-defined in the CPR and inferred from the Europe 2020 Strategy. The reinforced use of intervention logic required the allocation of funds to the areas in which public interventions are needed according to the CSRs and Member States’ analysis and/or where the growth potential was the highest. The financial allocation shall be consistent with the objectives set out in the PAs and allow for achievement of the results sought by the Member States. The OPs then had to outline the relevant national or regional development needs which are addressed, as well as the financial allocation while staying in line with the content of the PAs.
57 A reprogramming of the PAs and the relevant OPs can be requested by the Com-mission, where it is necessary to support the implementation of the relevant CSRs and Council recommendations or in the macroeconomic adjustment pro-grammes45. The Commission intends to use the reprogramming powers however only in exceptional cases46.
58 CSRs are updated annually, but the underlying challenges are generally of a long-term nature and do not change considerably from one year to another. In 2014, more than two thirds of the 157 CSRs are at least to some extent relevant for Cohesion policy.
59 For the five Member States covered by this audit, we examined whether their PAs covered all essential aspects and provide a useful diagnosis of the Member States’ development and investment needs. We then determined whether the negotiations between the Commission and the Member States had achieved an agreement on concentration of funding on the TOs inferred from the Europe 2020 strategy, and whether they complied with the ring-fencing requirements set out in the regulations. We also compared the negotiation outcome to the one for the 2007-2013 period. Finally, we reviewed whether the PAs clearly indicate the results to be achieved and the extent to which these results were related to the EU funding.
45 Article 23 of the Regulation (EU) 1303/2013.
46 COM(2014) 494 final of 30 July 2014 ‘Guidelines on the application of the measures linking effectiveness of the European Structural and Investment Funds to sound economic governance according to Article 23 of Regulation (EU) 1303/2013’.

39Observations
Partnership Agreements are basis for the budget allocation to thematic objectives and investment priorities
Partnership Agreements provide a diagnosis of the development needs and spending priorities in the Member States
The Partnership Agreements examined covered all essential aspects as required
60 PAs are voluminous documents. For example, the PA for Croatia has 466 pages, the one for Romania has 461 pages, for Spain 368 pages, for Ireland 265 pages, and for Poland 244 pages. The information presented in the PAs varies consider-ably between Member States in terms of structure, form and level of detail. Un-like for OPs, there was no mandatory template set out in the Regulations, but the Commission provided guidance on the draft template and content of the PA22.
61 Our review of the PAs for the five Member States covered by this audit showed that they all
— justified the selection of the TOs based on the identified development and investment needs and complied with the thematic concentration require-ments set out in the fund-specific Regulations47;
— provided information about the indicative allocation of the ESI Funds to each TO;
— identified the main intended results for each TO; and
— listed the OPs contributing to the achievement of the results.
47 For the ESF, this only applies to the thematic concentration requirement for social inclusion.

40Observations
62 We noted, however, that the total aggregated financial allocation by TOs in the PAs for Poland and Spain did not reconcile with the corresponding data in the OPs. We also note that for ERDF, in the absence of complementary financial infor-mation from the Member States, the Commission will face problems in monitor-ing the fulfilment of the financial concentration requirements.
The Commission analysed the challenges and priorities for funding and sent its observations to the Member States before to the formal negotiation of the PAs and OPs
63 The Commission had analysed the main challenges and identified the relevant priorities for funding for each Member State in its Position Papers. These also made reference to the CSRs issued by the Council in 2012 (see paragraph 9). The process of identifying development needs and investment priorities was subject to extensive discussions and preparations within the Member States, as well as negotiations between the Commission and Member States.
Member States identified in the PAs the development and investment needs
64 Our review showed that the PAs, based on the evidence available within the Commission at the time, provide a diagnosis of the situation for each selected TO on the basis of which spending priorities could be identified. Examples are given in Box 4.

41Observations Bo
x 4 Partnership agreements – diagnosis of national situation in relation to a TO
‘Research’ (TO1):
Each Member State provided information concerning the R&D intensity and business expenditure on R&D. The PAs also describe, to a varying extent, the national performance in terms of outputs, as measured by factors such as patents, scientific publications, human potential in R&D; the links and level of cooperation between research organisations and enterprises and the position of the country in the European Innovation Scoreboard (EIS)48.
On this basis, the Member States determined in the PA their estimates of the overall investment needs for TO1. For Ireland, these investment needs were not explicitly articulated but could be inferred from the diagnosis and the envisaged strategic results. Poland, Romania and Croatia indicated that structural and/or regulatory adjustments were needed to stimulate the development of R&D activities, in addition to financial support. We noted, however, that only limited information on the underlying causes was provided and that the PAs did not provide details about what structural changes were necessary. Nonetheless, the PAs satisfy the minimum requirements set out in the CPR.
‘Promotion of Employment’ (TO8):
Each Member State’s PA addressed specific challenges related to TO8. High youth unemployment was given as a problem for all examined countries. High levels of unemployment in general were identified as a chal-lenge in Ireland and Spain, while Ireland gave increasing long-term unemployment as a problem. Low general labour market participation (particularly among women and elderly people) was one of the main challenges for Poland. Romania’s PA emphasised the need to increase the labour market participation of Roma, elderly people, women and people with disabilities. Poland, Romania and Croatia made reference to the need to improve the effectiveness of the public employment services.
48 European Commission, DG GROW, 2014 http://ec.europa.eu/growth/industry/innovation/facts-figures/scoreboards_fr

42Observations
Partnership Agreements examined addressed almost all thematic objectives inferred from the Europe 2020 strategy
65 All five Member States had addressed almost all TOs in their PAs. Poland, Ro-mania and Croatia addressed all TOs, Spain addressed TOs 1 to 10 and Ireland excluded TOs 7 and 11.
66 This led to a situation where there is no clear link between individual CSRs and an allocation of funds. The examined Member States justified the allocation of funds to thematic objectives primarily based on the ring-fencing requirements and also by taking into account the identified national needs and the CSRs for 2012 and 2013. Moreover, it remains unclear if the proportion of funds allocated to thematic objectives is adequate to address the identified needs and allows for the achievement of the results sought by the Member States.
Negotiations of PAs were effective in terms of ring-fencing spending on Europe 2020 strategy objectives
Thematic concentration requirements in the fund-specific regulations were met
ERDF – thematic objectives 1 to 4
67 Overall, the 28 EU Member States had allocated around 62 % of their ERDF alloca-tion to the TOs 1 to 4. Our analysis also showed that the budget allocations for each Member State exceeded the minimum threshold of 50 % for less-developed regions.

43Observations
68 The ERDF funding in the five Member States examined in detail concentrates on the areas of research and innovation (TO1); ICT (TO2), competitiveness of SMEs (TO3) and shift towards a low-carbon economy (TO4). The fund-specific Regula-tions set out minimum concentration requirements for certain TOs (see Box 1). Our analysis showed that the thematic concentration requirements, at the level of the PAs, were even exceeded (see Table 2).
Tabl
e 2 Thematic concentration requirements for ERDF by
Member State at the level of the PA
ERDF TO 1, 2, 3, 4
more developed region transition region less developed region
minimum required 80 % 60 % 50 %
ES1 81 % 63 % 56 %
HR N/A N/A 61 %
IE 91 % N/A N/A
PL2 70 % N/A 58 %
RO 84 % N/A 51 %
ERDF TO 4 (Climate change)
more developed region transition region less developed region
minimum required 20 % 15 % 12 %
ES 20 % 17 % 18 %
HR N/A N/A 13 %
IE 22 % N/A N/A
PL3 24 % N/A 24 %
RO 48 % N/A 60 %
1 The data for Spain cannot be reconciled with the OPs, since the OPs classify the regions in ac-cordance with the criteria set out in the CPR but not in accordance with the derogation set out in the ERDF Regulation;
2 Fulfilled based on derogations set out under article 4.1 of the ERDF Regulation;
3 Fulfilled based on derogations set out under article 4.3 of the ERDF Regulation.
Source: ECA based on the data from the Commission’s IT applications Infoview and SFC2014.

44Observations
69 We note that for the Member States making use of the derogations set out in the ERDF regulation49, the financial information available in the OPs does not always permit to establish if thematic concentration requirements are respected (see Table 2). In such cases the regions are classified differently for thematic concentration purposes and for NUTS level 2 classification of regions used for the programming50. In the absence of complementary information from Member States, the Commission will be unable to monitor the fulfilment of the thematic concentration requirements.
ESF – thematic objectives 8 to 10
70 For the ESF, the largest share of funds (30.7 billion euro around 37 %) was allo-cated to TO8, TO10 ‘Education’, received 27.1 billion euro (around 33 %). Overall, all EU Member States allocated approximately 26 % of their ESF allocation to the TO9. All five examined Member States examined allocated between 22 % and 36 % to the ‘Support social inclusion’ (TO9), again significantly above the mini-mum requirements in the fund-specific regulation (see Table 3).
Tabl
e 3 Thematic concentration requirements for TO9 on the
examined Member State
minimum required 20 %
ES 27 %
HR 23 %
IE 36 %
PL 22 %
RO 26 %
Source: ECA with data from the Commission’s IT applications Infoview and SFC2014.
49 Article 4 of the Regulation (EU) 1301/2013.
50 Article 90 of the Regulation (EU) 1303/2013.

45Observations
71 Our analysis shows that the Commission and Member States were effective in ring-fencing funds at OP level for the priorities inferred from the Europe 2020 strategy. During the negotiations of the OPs, this had direct implications for their intervention logic and the target values of the performance indicators for out-puts since most target values are calculated on the basis of unit costs determined by past experience.
Funding in the 2014-2020 period focused more on ‘smart and inclusive growth’ than in previous periods
72 Overall, the negotiations between the Commission and Member States have re-sulted in the higher concentration of funding for all 28 EU Member States on the Europe 2020 priorities: ‘Inclusive growth’ (TOs 8 to 11) increased by nearly 8 %, whereas ‘Sustainable growth’ (TOs 4 to 7) decreased by nearly 4 % (see Figure 6).The attribution of Thematic Objectives to the priority areas of Europe 2020 strat-egy: smart, sustainable and inclusive growth is not set out in the Regulations51. It was introduced by the Commission in several documents published since 201452.
73 In the 2014-2020 programme period, the allocation of funds to TO4, ‘Low car-bon economy’, was increased significantly by approx. 22.4 billion euro (57 %). At the same time, the funding was significantly reduced for: TO6, Preserving and protecting the environment and promoting resource efficiency allocated funding for which decreased by 10.6 billion euro (-30 %) and TO7, ’Transport’, for which allocated funding decreased by 16.9 billion euro (-29 %). The total allocation for the TOs addressed by this audit was reduced by 8.4 billion euro (-20 %) for TO1, ’Research’, whereas the funding allocated to TO8, ’Promotion of employment’, increased by 10.3 billion euro (28 %) (see Figure 6).
51 Annual report of the Court of Auditors on the implementation of the budget concerning the financial year 2014, paragraph 3.22.
52 DG Directorate-General for Regional and Urban Policy, ‘European Structural and Investment funds 2014-2020: official texts and commentaries’, November 2015.

46Fi
gure
6 Allocation of ERDF, ESF (including YEI) and CF funds to the Europe 2020 strategy – comparison between the programme periods 2007–2013 and 2014–2020
million euro
InclusiveGrowth
(TOs 8-11)
SustainableGrowth
(TOs 4-7)
Smart Growth(TOs 1-3)
8 %6 %4 %2 %0 %
-2 %-4 %
7 853
-5 221596
TO11TO10TO9TO8TO7TO6TO5TO4TO3TO2TO1
70 %
50 %
30 %
10 %
-10 %
-30 %
2 337
4 788-
88-
10 393
16 926-
111-
22 432
9 842
833-
8 412-
10 616-
Note: The financial data between programme periods is not directly comparable. Our estimate is based on the financial data for 2007—2013 encoded and assigned retroactively by the Commission to the TOs.
Source: ECA based on the data from the Commission’s IT applications Infoview and DG Directorate-General for Regional and Urban Policy.

47Observations
Examined Member States define in the Partnership Agreements the main results to be achieved, but achieving them will require substantial national contribution beyond the EU funding
74 In the PAs, the Member States outline selected TOs and define main results of interventions expected for each ESI funds (see Box 2). Overall, we consider that the expected results defined for TO1 and TO8 in all PAs examined can be linked to the needs and challenges described. The level of detail and the quality of in-formation concerning the expected results vary however between the examined PAs:
— the Irish PA directly rephrases the results defined for the OPs;
— the Croatian, Spanish and Romanian PAs determine priorities for funding under each TO and set the results expected for each fund (ERDF, ESF, CF). In addition, the Spanish PA sets specific objectives that are common to all ESF and ERDF OPs and all OPs were required to use only these specific objectives; and
— the Polish PA sets overall specific objectives for TO1 and TO8 and breaks them down into funding priorities and corresponding expected results (see Box 5).
Link between investment needs and results for the ‘Promotion of employment’ (TO8) - example of Poland
Poland identified the low level of employment of women as one of the challenges facing the labour market. One of the most pertinent problems preventing the return of women to the labour market is the limited avail-ability of child care. Poland seeks to use the ESI funds to achieve increased access to care for children aged up to three years old and, as a result, to improve the women’s employment prospects. This is the intended result set out in the PA.
Box
5

48Observations
75 We found that all examined Member States determine in their PAs key result indicators for TO1 and for TO8 to measure the results to be achieved with the planned investments (see Annex IV). For three out of five examined PAs, all of the result indicators for TO1 and TO8 are accompanied by a quantified baseline and target value. Spain provided a qualitative description of the expected change for three out of four result indicators for TO853. Ireland provided neither baselines nor target values for TO1 and TO8 in its PA and makes instead reference to the OPs. The baselines and targets can be inferred from the ERDF OPs for TO1, but not from the ESF OP for TO8.
76 For TO1 and TO8, all examined Member States, with exception of Ireland, used as their strategic result indicators two headline targets set by the Europe 2020 strat-egy: 3 % of GDP (public and private combined) to be invested in R&D/innovation and 75 % of the 20-64 year-olds to be in employment. We also found that, where referred to, the targets set were consistent with the national reform programmes that translate the Europe 2020 strategy into the national targets.
77 The overall ERDF allocation to TO1 for all 28 EU Member States accounts for less than 5 % of their total estimated spending on R&D during the 2014-2020 period. Spending on research through the ERDF accounts for more than 5 % of the total national R&D expenditure54 in 15 Member States; in all other Member States it is marginal. It accounts for more than 25 % only in Lithuania, Poland, Estonia and Slovakia, and more than 50 % only in Latvia.
78 According to the Polish PA, a quarter of the anticipated result for TO1 is expected to result directly from the ESIF interventions. This is broadly in line with the cor-responding share of total R&D spending. None of the other Member States make a quantified estimate of the expected contribution of ESI funds to the attainment of the target values, as this was not required by the CPR (see Annex IV).
53 Annual report of the Court of Auditors on the implementation of the budget concerning the financial year 2015, paragraph 3.59 (OJ C 375, 13.10.2016).
54 On the basis of EUROSTAT ‘Total intramural R&D expenditure (GERD) by sectors of performance 2014’.

49Observations
79 As regards the active labour market policy, the ESI funds, and in particular the ESF, are estimated to have a stronger impact, at least in some Member States. For example for Romania, the ESI funds allocation to the ’Promotion of employment’ (TO8) corresponds to more than six times the annual national spending on active labour market policies (in 2014). In practice, the funding of active labour market policies in Romania will be substantially increased by ESI funds.
80 Based on our analysis of the PAs, we consider it to be obvious that achieving most of the results set out in these documents will require a substantial contribu-tion from the national budgets beyond ESI funds spending, but also additional regulatory measures and structural reforms. At the same time, a non-attainment of the result, e.g. employment rate, may not be due to the failure of the ESI funds interventions, but due to the factors outside the scope of ESI funds, such as unfa-vourable socio-economic situation and/or ineffective national policies.
Operational programmes show more clearly what is pursued with the interventions and how this is expected to be achieved, but this is accompanied by increased complexity than the previous programme period
81 OPs should set out the rationale of the EU interventions in a consistent and har-monised manner. They should outline development and investment needs and growth potential, the problems to tackle and identify the direction of the desired change through the clear and coherent setting of objectives to achieve, targets to reach and actions to address the set objectives.
82 We therefore examined a sample of 14 OPs in the five Member States covered by this audit and verified whether the development and investment needs are clearly identified and supported by evidence, the objectives specified coherently address the needs identified; and the actions are expected to contribute to the results sought. We also looked at the overall structure of the 2014-2020 OPs and its impact on how performance indicators are specifically designed to measure the achievement of objectives and results.

50Observations
Commission and Member States have been successful in developing Operational Programmes with a more robust intervention logic in most cases than in the previous programme period
Operational programmes are generally based on a more robust intervention logic
83 Our analysis of the sample of OPs examined indicates that in general the Com-mission and Member States have been successful in developing OPs with a more robust intervention logic. Box 6 provides an example on how the link between development needs and specific objectives can be inferred from the OPs. How-ever, in in some cases, it is necessary to take also account of aspects presented in other programming documents (such as the PA or the ex-ante evaluations) to fully understand the intervention logic.
Link between development and investment needs and specific objectives for investment priority 8i (‘access to employment’) under priority axes 1A, 1B, 1C, 1D of the Spanish OP ‘Employment, Training and Education’Bo
x 6
Result indicators with baselines
and targets
Participants gaining a quali�cation upon leaving
Participants in employment, includ-ing self-employment, upon leaving
Speci�c objective
Improve employability, especially of unemployed persons and/or job seekers through the acquisition and/or updating of profes-sional skills
Needs
Increased employability of job seekers and people a�ected by unemployment, including long-term unemployed and the elderly;
Improving the e�ectiveness of active employment policies, ensuring gender impact and decreasing inequalities, involv-ing the attendance of a larger number of participants to improve their employability.
Source: ECA based on the Spanish OP ‘Employment, Training and Education’.

51Observations
84 The Commission also encouraged Member States to use a logical framework to better explain the rationale of the interventions proposed in the OPs55. Within our sample, 11 out of the 14 OPs developed a stylised presentation of how needs would be addressed by the planned actions and which indicators would best measure the objectives and results set.
85 Overall, for nine out of the 14 OPs in our sample, we consider that the objectives established by the Member States regarding TO1 and TO8 can be related to the identified development and investment needs.
Shortcomings identified for five out of the 14 OPs examined
86 For four OPs, the relation between the objectives set and the development needs identified could not be established for a limited number of investment priorities. For example, we found that
— the development and investment needs were not supported with evidence of the situation or the objectives set do not address an identified need (Roma-nia56 and Spain57). This poses a risk that the interventions will not appropri-ately address the most relevant needs and that the public funding will be misallocated;
— objectives were defined too broadly, often due to the fact that they address several dimensions of improvement or cover multiple regions with diverse settings (Romania58 and Spain59). The objectives are not sufficiently specific in terms of what exactly the interventions set out in the OPs seek to change (see Box 7).
87 For three OPs it is unclear how some actions that are presented in the OP will contribute to the achievement of its specific objectives and results. In several cases this relation is either vague or cannot be substantiated (Poland60, Romania61 and Spain62).This indicates a risk that public spending may be misallocated or not be fully effective.
55 European Commission, ‘Monitoring and evaluation of European Cohesion Policy, ERDF, ESF, CF, guidance document on ex-ante evaluation, January 2014 and Guidance fiche for desk officers, intervention logic’, version 2 – 18/09/2014.
56 Regional ERDF OP for Romania, for TO1.
57 Regional ERDF OP Andalucia, for TO8.
58 Romanian ESF OP Human Capital, investment priority 8v.
59 Spanish ERDF OP Smart Growth and Regional ERDF OP Andalucia, TO1.
60 Polish ESF OP Knowledge, Education, Growth, priority axis IV, social innovation and international cooperation.
61 Regional ERDF OP, investment priority 8b.
62 Spanish ESF OP Employment, Training and Education, investment priority 8iii, priority axis 6A, 6B, 6C and 6D.

52Observations
Examples of specific objectives which are too broad (Romania and Spain)
Two63 out of the eleven specific objectives defined by Romania, in its Human Capital OP, are formulated in a broad manner. For example, the objective of ‘Increasing the number of employees benefitting of new tools, methods, practices, etc. of human resource management and of improved working conditions in order to adapt the activities to the dynamic of the potentially competitive economic sectors identified according to NCS / smart specialization areas identified according to NSRDI’ is not clear. Contrary to the Commission’s guidance64, it will not be possible to measure a specific change achieved with EU support, i.e., if the interven-tions contributed to increase the number of employees benefiting from new tools, or increase the number of employees benefiting from new methods or of improved working conditions, etc.
Spain established a list of specific objectives to be used by all ERDF and ESF OPs in the Member State. By doing so, the different individual regional challenges were incorporated into broader objectives, reflecting different dimensions of what is intended to be achieved. For example, under TO1, the ERDF OP ‘Smart Growth’ set as a specific objective the ‘Strengthening of R&D institutions and creation, consolidation and improvement of scientific and technological infrastructures’. In this case, it is not clear what is intended to be achieved: if it is the strengthening of R&D institution or if it is the creation or the improvement or the consolidations of sci-entific and technological infrastructures. While the lack of clarity and focus was also part of the Commission’s observations to the PA65, the objectives were not changed.
63 Specific objectives 3.8 and 3.9.
64 Page 5, version 1 (06/05/2013) of ‘Guidance Fiche’ on ‘Intervention Logic’: ‘specific objectives (…) reflect the change, including the direction of the change, which the MS seeks to achieve with EU support. This change should be as specific as possible, so that intervention to be supported can contribute to the change and this impact can be evaluated. It is therefore advisable for the ERDF/CF not to choose ‘increasing the productivity in region x’ (which will depend on a too wide range of factors) but rather ‘increasing the productivity of sector y in region x’’.
65 Observation 59 of Ref. Ares (2014) 2366781 of 16/07/2014, ‘observations on the Partnership Agreement with Spain: ‘They [specific objectives] are the corner-stone on which the programmes will be developed. In this sense, it should be stressed that the current specific objectives are not concrete enough to appreciate the change in the baseline situation and will not be an appropriate basis for the corresponding result indicators. Likewise, often there is not only one specific objective, but several, which leads to many actions to implement them. The specific objective should cover only one objective and the number of actions should also be limited (otherwise it will be difficult to follow up its impact through the corresponding result indicators)’.
Box
7

53Observations
The structure of the Operational Programmes leads to an increased number of performance indicators that need to be monitored and to an increase in reporting requirements
88 The 2014-2020 OPs are designed as a three-dimensional matrix structure combin-ing the priority axes set individually by the Member States, selected investment priorities and types of regions addressed (see Annex III). The specific objectives and the performance indicators for outputs and results are presented for the combination of these elements, i.e. for each single investment priority addressed under the priority axes. The complexity of the OPs depends particularly on first, the number of priority axes as defined by the Member States and number of the investment priorities addressed by them and second, the number of programme-specific indicators selected by the Member State in addition or instead of the common indicators. A further factor is the number of different types of region covered.
89 In the Spanish ESF OP, the TO8 is addressed under 12 different priority axes (three main priority axes divided into four types of regions), each of them subdivided into different investment priorities (ranging from 1 to 4) and further down into a different number of specific objectives. To simplify the structure, the Spanish authorities decided to use only four output and four result indicators to measure the actions under all priority axis covering TO8.
Reporting requirements for the cohesion output indicators triples
90 In terms of output indicators, the current matrix structure of the OP increases the reporting requirements by 196 % on the ERDF and 93 % on the ESF, as the indica-tors defined in the OP can be used under different priority axis and investment priorities. Moreover, the requirement to report indicators per category of region66 further increases reporting requirements by 23 % for the ERDF and by 36 % for the ESF (see Figure 7). For example, the Polish national ESF OP defined 163 out-put indicators at the outset. Once these indicators are broken down per priority axis, investment priorities and categories of regions, the national authorities will be reporting 422 different figures.
66 Commission Implementing Regulation (EU) No 288/2014.

54Observations
Source: ECA based on the information from the Commission’s IT application Infoview.
Figu
re 7 Reporting requirements relating to output indicators (number of times an indicator
needs to be reported)
T02T01 T03 T04 T05 T06 T07 T08 T09 T010 T011 T08 T09 T010 T011
2 500
2 000
1 500
1 000
500
0
Output indicators usedIncrease due to split per investment priority
Increase due to split per priority axisIncrease due to split per category of region
ESFERDF

55Observations
Source: ECA based on the information from the Commission’s IT application Infoview.
Reporting requirements for ESF result indicators doubled
91 In terms of result indicators, the current matrix structure of the OP increases the reporting requirements for ERDF by 27 % and for ESF by 57 %, as the indicators defined in the OP can be used under different priority axes, investment priorities and specific objectives. As to the reporting by category of region, the reporting requirements are increased by 36 % for the ESF (see Figure 8). The combination of these requirements doubles the volume of the data to be reported for ESF. For example, in the case of the Polish national ESF OP, the number of result indicators increases from 135 to 366 after dividing the indicators per priority axis, invest-ment priorities, specific objectives and categories of regions.
Figu
re 8 Reporting requirements relating to result indicators (number of times an indicator
needs to be reported)
ESFERDF
Result indicators usedIncrease due to split per investment priorityIncrease due to split per category of region
Increase due to split per priority axisIncrease due to split per speci�c objective
T02T01 T03 T04 T05 T06 T07 T08 T09 T010 T011 T08 T09 T010 T011
1 200
1 500
1 600
1 000
800
600
400
200
0

56Observations
Fund-specific differences in the categorisation of financial data and measuring the performance of Operational Programmes likely to pose difficulties in programme monitoring in future years
92 The system for recording financial flows and for assessing the performance of programmes should be aligned with the TOs inferred from the Europe 2020 strat-egy. The performance indicators to measure outputs and results of an interven-tion described in the OP should reflect the intervention logic and help to monitor the achievement of specific objectives in a cost-efficient way. Moreover, it should be possible to aggregate them at EU level and compare between different OPs.
93 We therefore examined whether the Commission had put in place an adequate system to record the financial allocation to specific types of intervention for the ERDF and the ESF. We also analysed in detail the methodology underlying the concept of ‘performance’ for the two funds and how the Commission and the Member States had specified the performance indicators for outputs and results. Finally, we calculated the overall number of indicators to be monitored during the 2014-2020 period in order to assess whether the system can be operated in a cost-effective manner.
The approach to financial monitoring of investments differs between ESI funds
94 In the 2014-2020 programme period, the OPs include, for each priority axis, an indicative financial allocation for six categories of intervention: intervention fields, form of finance, territory type, territorial delivery mechanisms, TOs and ESF secondary theme. Two additional categories (economic and location dimen-sions) are to be reported at a later stage. These eight categories of intervention are based on a nomenclature adopted by the Commission67 for the categorisation of financial data. This nomenclature comprises 120 different intervention fields and only these fields should be used to define the content of the actions to be financed68.
67 Regulation (EU) No 215/2014.
68 Codes 1-101 apply to the ERDF OPs, whereas codes 102-120 apply to the ESF.

57Observations
95 This system of categories of intervention plays an important role in programme monitoring and in the Member States’ reporting on the implementation of their programme in the annual implementation reports, because it defines the infor-mation that can readily be made available in order to report on what the funding has been used for.
ESF: intervention fields are fully aligned with investment priorities
96 In the case of the ESF, the intervention fields are fully aligned with the investment priorities, i.e., each investment priority corresponds directly to an intervention field. For instance, the intervention code 102 is exclusively linked to the invest-ment priority 8i.
97 With this approach, the financial support is assigned in proportion to the con-tribution it makes. As a result, the target, and later the rate of achievement, of output indicators (also reported by investment priority) can be linked with the overall cost of the corresponding actions. Intervention fields can then also be used to monitor thematic concentration requirements. Finally, the horizontal issues linked to all intervention priorities (e.g. climate change or gender equality) are captured by means of an additional dimension of the categories of interven-tion: the ‘ESF secondary theme’.
ERDF: the same intervention fields can be used under different thematic objectives or investment priorities
98 In the case of the ERDF, contrary to the ESF, the same intervention fields can be used under different TOs or investment priorities. The financial resources allocat-ed to a specific TO need to be reported under the ‘thematic objective’ dimension of the categories of intervention (see Figure 9).

58Observations
Source: ECA, based on the OPs.
Figu
re 9 Link between investment priorities and categories of intervention – example of the
Croatian national ERDF OP regarding TO1
Intervention fields attributed to the Thematic Objective
002 R&I processes in large enterprises056 Investment in infrastructure, capacities and equipment in SMEs directly linked to research and innovation activities057 Investment in infrastructure, capacities and equipment in large companies directly linked to research and innovation activities058 R&i infrastructure (public)059 R&i infrastructure (private, including science parks)060 R&i activities in public research centres and centres of competence including networking061 R&i activities in private research centres including networking063 Cluster support and business networks primarily bene�ting SMEs065 R&i infrastructure, processes, technology transfer and cooperation in enterprises focusing on the low carbon economy and on resilience … 070 Promotion of energy e�ciency in large enterprises121 Preparation, implementation, monitoring and inspection
Specific objective 1b2 RDI activities of business sector increased through
creation of favourableinnovation environment
Specific objective 1b1 Increased development of new products and services
resulted from R&D activities
Specific objective 1a1 Increased R&D capacities of R&D
sector to perform excellent research and to serve the needs
of economy
Investment priority 1b promoting business investment in R&D,
developing links and synergies between enterprises, research and development centres
and the higher education sector…
Investment priority 1a Enhancing R&I infrastructure and capacities to develop R&I
excellence, and promoting centres of competence
Priority axis 1Strengthening the economy through application of research and innovation
Structure of OP for Thematic Objective 1

59Observations
99 This approach makes it possible to categorise investment priorities horizontally by their common, cross-cutting issues, but makes it impossible to trace financial flows for individual investment priorities. As a consequence, financial allocations and spending are monitored only by TO at the level of each priority axis. The financial data cannot readily be aggregated at the same level as the performance information, and the financial progress made in implementing the investment priorities cannot be measured effectively. The absence of the relevant financial data hampers assessment of the cost-effectiveness and cost-efficiency of the in-terventions and comparison of performance between OPs and between Member States per euro spent.
Financial allocations to each intervention field need to be coded by different categories of region
100 The Member States are also required to split the financial resources allocated to the different intervention fields by category of region (such as less-developed, transition and more-developed regions). We found that Member States’ ap-proaches differed in this regard (see Box 8).
Allocation of financial resources to categories of regions – examples of Poland, Romania and Spain
In Poland, according to the PA, two distribution keys were used for allocating funds between the regions: pro-rata allocation, with a fixed ratio of allocation to both types of region; and standard allocation, with the allocation of funds in proportion to the number of regions the investment concerns.
In Romania, a pro-rata allocation was used depending on the nature of the actions, namely either based on number of regions, population or number of SMEs.
In Spain, the allocation of the ERDF funds between regions is agreed between the regional and central gov-ernment beforehand and, during implementation, expenditure is allocated to the regions in accordance with the project location.
Box
8

60Observations
101 The Member States also follow different approaches as regards the split of finan-cial resources and performance information per category of region. These differ-ent national approaches to the allocation of funds have a direct impact on the number of indicators, their target values and milestones, the OP’s key implemen-tation steps and the financial indicators used, i.e., the values of output and result indicators by type of regions are established using different allocation keys. More importantly, the absence of a common approach negatively affects the compar-ability and the accuracy of the information provided by Member States with more than one category of region. In particular, this may have an impact on the fulfilment of the thematic concentration requirements.
There are differences between funds in the use of common output indicators and possibility for Member States to define additional programme specific output indicators
Common output indicators for both ERDF and ESF, but only ESF OPs are required to report on all of them on an annual basis
102 There are common output indicators for both the ERDF and the ESF: 40 indicators grouped under eight categories for the ERDF and 23 indicators related to persons and entities for the ESF (see Table 4).
Tabl
e 4 Output indicators – differences between ERDF and ESF
ERDF ESF
Common output indicatorsYes,
40 common output indicators grouped under 8 categories
Yes, 23 common output indicators related to persons and entities
Obligation to use common output indicators
Yes (whenever relevant)
Yes (in the annual implementation reports)
Actions measured Only completed actions Partially or fully implemented actions
Distribution by category of regionYes
(baselines and targets broken down by category of region)
Yes (baselines and targets split by
category of region and by gender as optional)
Source: ECA, based on the regulation and guidance documents.

61Observations
103 For ESF OPs, Member States are required to gather and report data to the Com-mission on all common output indicators, even if no target for these indicators has been set in the OP. In the case of the ERDF, the use of common output indica-tors is mandatory when they are relevant to the interventions to be supported. We note that the Directorate-General for Regional and Urban policy encouraged Member States to use these common indicators so that progress made in imple-menting of programmes could be assessed also at EU level by aggregating the national indicators. Our analysis showed, however, that these common output in-dicators were not consistently used by Member States in the examined ERDF OPs.
104 According to the Commission’s guidance for TO1 the ERDF investments should be aimed at technological development and applied R&D and be related to business needs. However, the common output indicators measuring the business motiva-tion for undertaking research were used only to a limited extent. The indicators used to measure a company’s commitment to developing a product that is ‘new to the firm’ or ‘new to the market’ (CO28 and CO29) were used only in 57 % of the OPs with funds allocated to TO1. Other indicators were used in between 40 % and 90 % of the OPs (see Figure 10). This suggests that these output indicators can-not be meaningfully aggregated at EU level.
Figu
re 1
0 Common output indicators from the ‘research and innovation’ category used in the OPs with funds allocated to TO1
CO24 CO25 CO26 CO27 CO28 CO29 CO28 and CO29
Num
ber o
f new
rese
arch
ers
in su
ppor
ted e
ntiti
es
Num
ber o
f res
earch
ers
work
ing in
impr
oved
rese
arch
inf
rastr
uctu
re fa
ciliti
es
Num
ber o
f ent
erpr
ises
coop
erat
ing w
ith re
sear
ch
instit
ution
s
Priva
te in
vestm
ent m
atch
ing
publi
c sup
port
in inn
ovat
ion
or R&
D pr
ojects
Num
ber o
f ent
erpr
ises
supp
orte
d to i
ntro
duce
new
to th
e mar
ket p
rodu
cts
Num
ber o
f ent
erpr
ises
supp
orte
d to i
ntro
duce
new
to th
e �rm
prod
ucts
Num
ber o
f ent
erpr
ises
supp
orte
d to i
ntro
duce
new
to th
e �rm
prod
ucts
or ne
w to
the m
arke
t pro
ducts
40 %
65 %
90 %
64 %
44 % 42 %
57 %
Source: ECA based on the data from the Commission’s IT application infoview.

62Observations
105 On average, four of the six common indicators defined for the ‘research and inno-vation’ category were used, with 165 of the 168 OPs with funds allocated to the TO1 using these common indicators to measure R&D interventions. In our sample, we found that in one of the nine OPs with funds allocated to TO1, the indicator CO29 was not used - despite the fact that it was clearly a relevant indicator for measuring output (see Box 9).
Example of a relevant common output indicator not being used (Spain)
The ERDF OP for the Andalucía region in Spain includes activities related to innovation in enterprises. Accord-ing to the regional authorities, the indicator ‘Number of enterprises supported to introduce new products to the firm’ (CO29) would have been relevant, but during the course of negotiations, they decided against using it, in agreement with the Commission, as this impact was already encompassed in the indicator ‘Number of enterprises receiving support’ (CO01). However, these two indicators are both relevant as they provide differ-ent information on the outputs to be achieved.
Box
9
Programme-specific output indicators negotiated between Commission and Member State on a case-by-case basis
106 In addition to the common output indicators, Member States may also use programme-specific output indicators. These indicators need to be negotiated between the Commission and the Member State on a case-by-case basis.
107 Overall, for the ERDF, the 28 EU Member States combined created a total of 2 240 different programme-specific output indicators in addition to the 40 common output indicators. On average, each ERDF OP used 13.2 different programme-specific output indicators and 14.8 common output indicators (see Figure 11 and Figure 12).

63Observations Fi
gure
11 Total number of output indicators used in the ERDF and ESF OPs of all Member
States (excludes the CF and the YEI interventions, as well as technical assistance indicators)
Source: ECA based on the data from the Commission’s IT application Infoview.
T02T01 T03 T04 T05 T06 T07 T08 T09 T010 T011 T08 T09 T010 T011
Common indicatorsProgramme-specific indicators
ESFERDF
258
629
479480
121
228
37
148
335
99
512
235
307268
4
23
2323
9
5
19
16
9
17
5
26
15
1316
All TOs ESFAll TOs ERDF
1 7692 240
2340

64Observations
Source: ECA with data from the Commission’s IT application Infoview.
Figu
re 1
2 Average number of output indicators used per OP in all Member States (excludes the CF and the YEI interventions, as well as technical assistance indicators)
All TOs ERDF All TOs ESF
6.2
14.8
13.513.2
Common indicatorsProgramme-specific indicators
T011T010T09T08T011T010T09T08T07T06T05T04T03T01 T02
ERDF ESF
1.5
3.5
2.8
3.3
1.1
2.7
2.82.1
3.0
1.3
4.46.2
2.1
6.0
7.27.3
4.75.7
2.33.53.1
1.92.5
3.52.2
4.33.12.92.7

65Observations
108 As regards the ESF, the regulation establishes 23 common output indicators relat-ing to both persons and entities. They should be used in the OPs where relevant and they must be reported once per year in the OP’s annual implementation report (see Table 4).
109 Our analysis showed that, in total, the 28 EU Member States developed 1 769 ESF programme-specific output indicators for all OPs combined. On average, each ESF OP used 13.5 different programme-specific output indicators and 6.2 com-mon output indicators.
ESF and ERDF result indicators measure different things and measure them differently making it impossible to meaningfully aggregate data at Union level
Performance indicators for results for ERDF and ESF are defined differently
110 Our analysis also shows that some indicators set out as output indicators for ERDF could be perceived as result indicators for the ESF. For instance, the common ERDF output indicator defined for productive investments ‘Employment increase in supported entreprises’ can be seen as an immediate result of the action. How-ever, such results are not systematically measured by common output indicators for all TOs supported with ERDF interventions. This is due to the fact that the CPR and the fund specific regulations do not provide a consistent definition of result.
111 In our 2015 Annual Report69 we have already drawn the attention to the Com-mission’s lack of clarity in respect to the definition of performance indicators. In its reply, the Commission has stated that the terms ‘output’ and ‘results’ were defined in the May 2015 Better Regulation Guideline70. We analysed this guide-line and found that the definition of ‘results’ captures the direct effects of the interventions, in line with the approach applied by the ESF. However, this has not led to any changes. We also note that these key concepts are not defined in the Financial Regulation.
69 Annual report of the Court of Auditors on the implementation of the budget concerning the financial year 2015, paragraph 3.59.
70 Commission Staff Working Document, Better Regulation Guidelines, SWD (2015) 111 final, 19.5.2015.

66Observations
112 Programme specific performance indicators for results cannot be aggregated either for ERDF or for ESF at EU level71. There are common result indicators only for the ESF, but not for the ERDF (see Table 5). For the ERDF, it is therefore not possible to aggregate this data at EU level as Member States can use different in-dicators (or similar indicators with small variations in their definition) to measure the same type of specific objective.
71 For instance, our analysis regarding TO8 showed that only 11 % of programme-specific result indicators had been used in more than one ESF OP.
Tabl
e 5 Results of interventions – differences between ERDF and ESF
Contribution to achievementof results
Distribution by category of region
Targets
Baselines
Common result indicators
Obligation to use common result indicators
The immediate results can be measured by the result indicators. The impact needs to be
measured ex-post by evaluationsTo be measured ex-post by evaluations
Yes(baselines and targets broken down by
category of region and by gender as optional)No
Common indicators must be quantitativeCumulative value re�ecting the e�ects of the
interventions (past performance data whenever possible and by representative sample for the
common longer-term result indicators)
Quantitative or qualitativeRelates to all potential bene�ciaries and is
in�uenced by the programme and other factors
Mandatory for each result indicatorValue of result indicator at the beginning of programme period for the country/region in
accordance with the latest available data (statistics or administrative data) or by surveys
Zero in exceptional circumstances, where it is not possible to calculate
Value from the existing or previous similar interventions based on the latest available data
Yes(in the annual implementation reports)No
Yescommon immediate result indicators and
common longer-term result indicators (only in relation to persons, not to entities)
No(negotiated individually with the Member States)
ESFERDF
Source: ECA based on the regulation and guidance documents.

67Observations
113 For instance, our analysis regarding TO1 has shown that only 12 % of the ERDF result indicators were used in more than one OP, i.e., individual result indicators were developed for the majority of each ERDF specific objective. Overall, the 28 EU Member States developed 2 955 programme-specific result indicators for the ERDF72 and, on average, each OP used 17.4 different specific result indicators (see Figure 13 and Figure 14).
Figu
re 1
3 Total number of result indicators used in the ERDF and ESF OPs of all Member States (excludes the CF and the YEI interventions, as well as technical assistance indicators)
72 These numbers refer to all indicators created by EU-28 Member States (as available in the Commission’s IT application Infoview) for all TOs used under the ERDF (excluding CF).
ESF (all TOs)ERDF (all TOs)
21
1 9762 955
Common indicatorsProgramme-speci�c indicators
T011T010T09T08T011T010T09T08T07T06T05T04T03T01 T02
ERDF ESF
1
8
921
248
639
569573
9
148
254
33
234
428
102
596
460
311
401
Source: ECA based on the data from the Commission’s IT application Infoview.

68Observations
114 The ESF regulation sets five common immediate result indicators and four longer-term result indicators73 to be used for ESF interventions to measure the fund’s contribution to changes affecting persons. There are no common result in-dicators measuring the impact on entities. The regulation also sets nine common immediate result indicators and three long-term result indicators for the YEI74. They were negotiated and agreed upon individually between the Commission and the Member States.
115 However, not all common indicators are mandatory to be used in an OP, and Member States have the option of using programme-specific result indicators in addition to the common ones. For the 2014-2020 period, the 28 EU Member States use all the nine common ESF result indicators and have developed an ad-ditional 1 976 programme-specific result indicators75. On average, each ESF OP used 3.1 common result indicators and 14.4 different programme-specific result indicators (see Figure 13 and Figure 14).
Figu
re 1
4 Average number of result indicators used per OP in all Member States (excludes the CF and the YEI interventions, as well as technical assistance indicators)
Common indicatorsProgramme-specific indicators
T011T010T09T08T011T010T09T08T07T06T05T04T03T01 T02
ERDF ESF
ESF (All TOs)ERDF (All TOs)
3.1
14.417.4
1.0
1.7
1.6
2.2
4.96.1
5.25.5
2.32.32.71.5
3.33.7
1.7
4.13.6
3.03.3
Source: ECA based on the data from the Commission’s IT application Infoview.
73 Regulation (EU) No 1304/2013, Annex I.
74 Regulation (EU) No 1304/2013, Annex II.
75 These numbers refer to all indicators created by EU-28 Member States (as available in the Commission’s IT application Infoview) for all TOs used under the ESF (excluding YEI).

69Observations
ERDF result indicators are not specifically related to the interventions funded by the programme
116 There are fundamental differences between the ERDF and the ESF when it comes to the definition of a ‘result’. For the ERDF, a result is ‘the specific dimension of the well-being and progress for people that motivates policy action, i.e., what is intended to be changed, with the contribution of the interventions designed’76. Results are influenced not only by ERDF funding but also by external factors (see Box 10).
76 Directorate-General for Regional and Urban policy, ‘Guidance document on monitoring and evaluation’ of the ERDF and CF, for the programing period 2014-2020, March 2014, p. 4.
Example of an ERDF result indicator (Spain)
For the Spanish ‘Smart Growth’ ERDF OP, one of the result indicators chosen is the ‘percentage of companies making technological innovations on the total active companies’. The baseline was calculated by the national statistical office based on a national survey. The survey is intended to provide information on the structure of the innovation processes of companies of all types in Spain not just those funded by the ERDF (which account for around 7 % of the total number of relevant companies). Consequently, this result cannot be fully attributed to the OP itself.
Box
10
117 In other words, in the case of the ERDF OPs, it is not possible to isolate the impact attributable to the ERDF-interventions and it is not known which factors may influence the achievement of the results. This approach has the advantage of be-ing able to maintain an overview of the main intended change. However, in order to assess the change or impact that can be attributed to an ERDF intervention, Member States will need to make use of complementary approaches.

70Observations
ERDF result indicators focus on a specific dimension of the intended change
118 Moreover, in most cases, ERDF result indicators only provide information on a specific dimension of the intended change depending on the action that is be-ing implemented. This results in the use of different result indicators for the same investment priority. For example, eight out of the 14 OPs examined have allo-cated funds creating research infrastructure and purchasing research equipment (investment priority 1a), but almost all OPs have defined their own result indica-tors to measure progress in this field, sometimes even OPs in the same Member State (see Box 11).
Examples of ERDF result indicators for the investment priority 1a defined by the Member States (Croatia, Ireland, Poland, Romania and Spain)
The investments supported under the Polish ‘Smart Growth’ OP are expected to contribute to increasing spending by enterprises on research produced by research organisations. This is based on the assumption that the quality of the research will be improved, that its value for the enterprises will be increased, and that as a result, enterprises will purchase R&D services from these research organisations.
Under the Romanian ‘Competitiveness’ OP, the investments should contribute to improving research capacity and to developing enterprises’ competitiveness. This will be measured in terms of the contribution attracted under Horizon 2020 and the increase in the number of scientific publications. The Spanish ‘Andalucía’ OP is aimed at increasing the number of patent applications submitted. In the Croatian ‘Competitiveness and Cohe-sion’ OP, the result indicator is the number of publications in scientific journals, whereas in the Irish OPs, it is the number of industry partners. None of the indicators are defined in exactly the same way.
According to the OECD, some of these indicators, in particular spending on R&D and patent statistics and sci-entific publications, are adequate for measuring innovation77. The ERDF promotes synergies with research and development funds, in particular Horizon 2020. Therefore, participation in Horizon 2020 could also be seen as an indication of improved research capacity. However these indicators may give limited information on how the research will be used to benefit the economic development of the regions/countries concerned.
77 OECD and Eurostat, Oslo Manual, guidelines for collecting and interpreting innovation data, 3rd edition, 2005.
Box
11

71Observations
ESF result indicators are directly related to the ESF interventions
119 For the ESF, the concept of a ‘result’ relates to ESF specific interventions. It re-cords the change in a particular situation, in most cases relating to supported en-tities or participants. For the Directorate-General for Employment, Social Affairs and Inclusion ‘it is advisable to set indicators which are as close as possible to the activities conducted under the respective investment priority’. Moreover, under the ESF, ‘impact’ relates to the achievement of the objectives set under a priority axis, i.e., benefit for wider groups in society beyond the participants or entities in direct receipt of the support.
120 In other words, the emphasis is on the direct effects of ESF interventions, limiting as far as possible the effect that external factors may have had in the indicator being reported. Results can be immediate (situation directly after the end of the activity) or longer-term (situation at a certain point in time after the end of the activity) (see Box 12).
Example of an ESF result indicator used in the Human Capital OP in Romania
Employment in non-agricultural enterprises in urban areas in Romania will be promoted by supporting the creation of start-ups or supporting existing SMEs in creating new jobs, as well as by providing of customised counselling/guidance and entrepreneurial training.
The specific objective is being measured using three result indicators, one of them being ‘the number of cre-ated and existing jobs, 6 months after completion of the interventions supporting unemployed and inactive persons’. The job posts being counted refer to participants in ESF actions.
Box
12

72Observations
Evaluations will be needed in order to measure the impact of interventions for both the ERDF and the ESF
121 The impact of ERDF and ESF interventions will need to be established by means of evaluations during the implementation of the OP and after it has finished (ex-post evaluation)78. This will be more demanding for the ERDF interventions where the responsible authorities will need to collect additional data on the results dir-ectly attributable to the projects. To establish whether the result, e.g. increased number of scientific publications, is attributable to the ERDF interventions or to other external factors, a comparison will need to be made with entities that did not receive any support, by means of an evaluation for which additional informa-tion will need to be collected.
122 In Poland, managing authorities therefore introduced, on a voluntary basis, direct result indicators to record the immediate benefits delivered by the ERDF interventions and to ensure the availability of data for evaluations of the effec-tiveness, efficiency and impact of ERDF interventions. These immediate result indicators are not included in the OPs and are not subject to regular reporting via the annual implementation report. Consequently the data on the immediate results will not be readily available to the Commission and to the wider audience (via the ESIF Open Data platform).
123 For the ESF, information on immediate results will be directly linked to inter-ventions, thus providing a stronger evidence base for assessing the impact of ESF interventions, and less additional data will be needed than for the ERDF interventions.
Baselines and targets are calculated differently in the ERDF and the ESF, based on their respective definitions of ‘result’
124 Baselines and targets set for the ERDF result indicators are mainly based on statis-tics kept by national statistical bodies relating to all potential beneficiaries of the ERDF interventions, encompassing all external factors and recording the impacts on the entire country/region. These result indicators do not set the performance targets for the ERDF interventions and, therefore, cannot be considered immedi-ate results of the OPs. Accountability for achieving these results lies mainly with the Member States, and to a lesser extent with the managing authorities of the OPs.
78 Articles 56 and 57 of Regulation (EU) No 1303/2013.

73Observations
125 For the ESF, baselines and targets are mainly calculated based on historical data or past experience directly related to ESF interventions, i.e., the result indica-tors are function of the output indicators. For example, for the common indi-cator ‘participants in employment, including self-employment, upon leaving’, the baseline corresponds to the performance ratio (percentage of persons that obtained employment after participating in ESF training) reached in comparable programmes.
126 The ESF result indicators show the contribution made by the OPs to the specific objectives and can be used to determine the contribution made by the ESF inter-ventions to the strategic result indicators set out in the PA. Accountability for the attainment of the results is clearly allocated to the managing authorities. Since the results are defined in terms of the population benefitting from ESF support, managing authorities are expected to have a stronger influence over the achieve-ment of results.
127 For the ESF, data needs to be recorded79 for all participants (with very few excep-tions) and entities every year, and participants need to be traced once the action concerned has been completed in order to calculate the common result indica-tors (which will also need to be reported in the annual implementation report). In addition, the values of indicators need to be reported by gender whenever relevant.
128 The data on the employment of participants, however, cannot be used mechani-cally since it may be biased by factors over which under the authorities in charge of the programme implementation have limited control. According to the rel-evant Commission guidance, the results reflect the situation of participants upon leaving the co-financed project80. This means that even if a participant had left a co-financed training programme without completing it, his or her subsequent employment would be counted as a result, even if this employment is not primar-ily attributable to his or her participation in the training, but rather to the socio-economic situation in the country/region or other factors.
129 Figure 15 summarises the strengths and weaknesses of the different approaches to performance indicators taken for the two funds.
79 Except for the indicators ‘homelessness or affected by housing exclusion’ and ‘from rural areas’.
80 Monitoring and Evaluation of European Cohesion Policy, European Social Fund, guidance document, June 2015.

74Observations
Strengths and weaknesses of the ERDF and ESF approaches to performance measurement
Figu
re 1
5
1 See paragraph 112.
Source: ECA.
• Result indicators do not make it possible to measure the direct impact of interventions
• Results generated by individual projects are not gathered. Evaluations will require additional information on the immediate results of the projects to be collected
• Data on the immediate results of the projects is not subject to regular reporting to the Commis-sion, thus not subject to the regular scrutiny
• No common result indicators and hence, no possibility to aggregate results at EU level1
• Common output indicators are mandatory only when relevant
• High number of specific indicators• Categories of intervention not aligned with
investment priorities
• Result indicators measure the direct impact of interventions relating to persons
• Information is available on the immediate results directly linked to interventions. Evaluations will have a good basis to assess its impact.
• Data on the immediate results of the projects is regularly reported to the Commission and made available in a timely manner. It is subject to scrutiny.
• Common output and result indicators exist relating to persons, making it possible to aggregate data at EU level.
• Categories of intervention aligned with investment priorities
• Greater accountability for the delivery of results (for interventions expected to improve the situation of the supported persons/entities)
• Result indicators provide an overview of the main expected effects for the region/country
• Common output indicators exist, making it possible to aggregate data at EU level
• Result indicators do not provide an overview over the strategic change sought
• Evaluations will require additional information to be collected
• Extensive data to be collected by Member States on a mandatory basis
• High number of specific indicators
Weaknesses
Strengths
ESFERDF

75Observations
Differences in methodology and the high number of programme-specific indicators will cause a significant administrative burden, but it remains to be seen what use will made of this data
Different reporting requirements for the ERDF and the ESF
130 We consider the fact that the fund-specific regulations have introduced differ-ent requirements for collecting and reporting performance data for outputs and results to be a weakness in the system put in place for the 2014-2020 period. The meaning of performance differs between the two funds and, as a result, Member States are obliged to develop fund-specific performance monitoring systems, even in the case of multi-fund OPs.
131 In addition, there is the issue of the overall number of different performance indi-cators: there are thousands of performance indicators for outputs and for results, both common and programme-specific. For all these indicators, data will need to be gathered and reported by the managing authorities. Moreover, in addition to their work on the regularity of the expenditure audit authorities will have to check that data collection and storage systems are reliable.
132 We see a risk that this comprehensive approach to collecting performance- related information will result in a considerable administrative burden for manag-ing authorities, without a commensurate benefit. Moreover, it is also still unclear how the Member States and/or the Commission intend to make use of and moni-tor the information for which data will have to be collected.

76Observations
The data collected on outputs and results could be used to strengthen performance budgeting in the next programme period
133 We note however, that a broad range of performance data on outputs and results is available to the Commission. It will also be available to the interested parties in real time via the open cohesion data platform. Therefore, it can be scrutinised by the responsible authorities and by the Commission, but also by external inter-ested parties.
134 The Commission can take account of the actual performance data in order to re-assess the validity of the historical unit costs used for target setting and/or confirm cost-effectiveness and cost-efficiency. In one of our previous reports we have for example identified significant differences in unit costs of construction of motorways between different Member States. We recommend the Commis-sion analyse the causes of these differences and ensure that best practices are applied81.
135 We consider that this could even pave the way for the use of such information in a more performance-based allocation of funds to the interventions after 2020 (see Box 13). The CPR provides for the Joint Action Plans which make financial allocation exclusively dependent on the level of achievement of outputs or results82. This possibility has however so far not been used by any of the OP in the 28 Member States. This illustrates that Member States are reluctant to make use of performance-based arrangements for the allocation of funds. This may also be due to the fact that currently not sufficiently reliable information on average unit costs is available.
136 For post-2020 programme period, the Member States should be in a better posi-tion to identify the budget necessary to address their needs and CSRs and to deliver expected outputs and results in the OPS.
81 Special Report No 5/2013, ‘Are EU Cohesion Policy funds well spent on roads?’
82 Article 106 of the Regulation (EU) 1303/2013.

77Observations
Performance budgeting
According to the Organisation for Economic Co-operation and Development (OECD), approaches to perfor-mance budgeting are generally evolving over time and modifications are made with every new budget pro-gramming process. The approaches also differ between countries because they need to fit the given national political context83.
The OECD works with several definitions of performance-based budgeting, noting that ‘there are no single agreed standard definitions of performance budgeting’ and that ‘There is no single model of performance budgeting’84.
Generally speaking there are two main approaches:
Performance-based budgeting is aimed at enriching the supply of information to decision makers or changing the way budgets are decided85. Already, the funds allocated need to be linked to measurable results. Currently, however, information on future or past performance is used along with other information in the decision-making process.
A performance budget, on the other hand, is a budget that explicitly links each increment in resources to an increment in outputs or other results. In broad terms, a performance budget presents information on what organisations have done or expect to do with the money provided to them. This implies that the financial al-location is determined on the basis of or at least taking into account the expected outputs and/or results.
83 OECD, Learnings from the 2011/2012 OECD survey on performance budgeting, 11th Annual Meeting of the OECD Senior Budget Officials Performance and Results Network, OECD Conference Center Paris, 26-27 November 2015.
84 OECD, Performance Budgeting: A Users’ Guide, Policy Brief, March 2008.
85 Allen Schick, ‘The Metamorphoses of performance budgeting, OECD Journal on budgeting’, Volume 2013/2.
Box
13

78Conclusions and recommendations
137 Overall, the Commission was effective in negotiating the 2014-2020 PAs and OPs in Cohesion. It completed the negotiations with Member States within the regu-latory deadlines, focused the funding on the Europe 2020 strategy and ensured a more robust intervention logic in the OPs. However, it has not succeeded in harmonising the financial monitoring arrangements between funds and in ensur-ing a consistent definition of performance indicators for outputs and results. This would, however, be needed for a meaningful aggregation and comparison of performance data between programmes. Moreover, given the overall number of performance indicators that need to be monitored and the continued need for complementary data to establish the impact of EU funds, there is a risk of con-siderable administrative burden associated with this performance regime for the 2014-2020 period.
Commission kept delays in the negotiation of Partnership Agreements and of Operational Programmes under control
138 The European Parliament and Council adopted the Cohesion policy legislative package in December 2013, i.e. just before the start of the 2014-2020 programme period. Compared to the previous period, this represents a delay of five months, partly due to the Commission making its legislative proposal later and partly due to more time being needed to finalise the negotiations. By January 2016, the Commission adopted the secondary legislation, i.e. after the majority of the OPs had already been adopted by the Commission (see paragraphs 33 to 37).
139 Overall, despite difficulties the Commission adopted PAs and OPs within the deadline specified in the Common Provision Regulation: the last PA was adopted in November 2014 and the last OP in December 2015. The Commission took a pro-active approach and started informal negotiations as early as 2012. This also helped to mitigate the impact of the late adoption of the regulations. It also provided a considerable number of guidance notes to Member States, although this was done in a piecemeal manner and at a late stage in the process (by Sep-tember 2014). The Commission could only finalise the guidance notes only once the legislative framework had been put in place (December 2013) (see paragraphs 47 to 48).

79Conclusions and recommendations
140 Member States submitted all PAs in time (by April 2014) and, on average, the ne-gotiations were completed within five months. This was significantly faster than the corresponding step in the preparations of the 2007-2013 NSRFs and helped to compensate in part for the delays (see paragraph 48 to 49).
141 Member States, submitted the majority of their draft OPs (85 %) by the required deadline. For 15 % of the OPs, the Commission was unable to start the formal negotiations within three months of PAs being submitted. On average, it took around eight months to adopt an OP (not taking account of the standstill periods, i.e. the periods between sending the observations to the Member States and submission of the OP). This is comparable to the previous period. By December 2014, 64 % of the OPs under the Investment for growth and jobs goal had been adopted. In the previous programme period 2007-2013, 98 % of the OPs had been adopted in the equivalent period. This is mainly due to the delayed adoption of the legislative package (see paragraph 49).
142 This suggests that negotiations were more demanding. The main reasons for this were additional requirements, such as ex-ante conditionalities or the requirement to set out a more explicit intervention logic, IT problems and the need for mul-tiple rounds of approvals by the Commission involving time-consuming inter and intra service consultations. Moreover, there were quality issues with the initial drafts of programming documents (see paragraphs 53 to 55).
Recommendation 1
The Commission should ensure that its Cohesion policy legislative proposals for the post 2020 period are presented timely so that there remains sufficient time to complete the negotiations between the European Parliament and the Council before the start of the programme period.
Target implementation date: when preparing the legislative proposals for the period post- 2020.

80Conclusions and recommendations
Partnership agreements were instrumental in focusing Cohesion spending on the Europe 2020 Strategy
143 PAs have proven to be an effective instrument for ring-fencing ESI funding for TOs and priorities for investment. The PAs examined cover all essential aspects and provide a diagnosis of development needs and priorities for investment in the Member States. The Commission and Member States have succeeded in fo-cusing EU funding for the period 2014-2020 on the objectives of the Europe 2020 strategy for growth and jobs. Funding is even concentrated on a limited num-ber of key areas within the TOs and the fund-specific requirements for thematic concentration were generally exceeded. Overall, more funds are allocated to SME competitiveness, climate change and employment and less funds to transport and the environment compared to the 2007-2013 programme period (see para-graphs 57 and 68).
144 However, we note that the information provided in the PAs is not always con-sistent with the information in the OPs and that, for the Member States making use of the derogations set out in the ERDF regulation, the financial information available in the OPs does not always permit to establish if thematic concentration requirements are respected (see paragraph 69).
Recommendation 2
(a) Member States should provide to the Commission the financial information necessary for the Commission to effectively monitor the compliance with the thematic concentration requirements (including the derogations set out in the ERDF regulation).
(b) The Commission should ensure that the ring-fencing of ESI funding to the-matic objectives is respected by Member States.
Target implementation date: from 2017 onwards, on a yearly basis.

81Conclusions and recommendations
145 Member States identify in the PAs the main results to be achieved, but generally do not make a quantified estimate of the expected contribution of ESI funds to the attainment of the target values. It is however obvious that achieving most of the results set out in the PAs will require a substantial contribution from the national budgets beyond ESIF spending, but also additional regulatory measures and structural reforms. At the same time, a non-attainment of the result may not be due to the failure of the ESIF interventions, but due to the factors outside the scope of ESIF, such as unfavourable socio-economic situation and/or ineffective national policies (see paragraphs 74 to 80).
Operational programmes show more clearly what is pursued with the interventions and how this is expected to be achieved, but this is accompanied by increased complexity
146 For most of the OPs examined, the Commission and Member States have been successful in developing programmes with a more robust intervention logic, i.e. setting out what are the intervention’s aims (specific objectives/results) and how these are expected to be achieved (finances-actions-outputs). Where weaknesses did exist, these were due to development needs not being documented and ob-jectives not seeming to address the needs identified. Objectives were often also defined too broadly, or there were doubts as to whether the actions presented in the OP would contribute to the achievement of its objectives and to its results. In such cases, there is a risk of public spending not being correctly allocated or not used in the most effective way (see paragraphs 81 to 87).
147 The complexity of the 2014-2020 OPs depends on the following parameters: the number of priority axes as defined by the Member States, the number of the investment priorities addressed by them and the number of the categories of region covered by the OPs. Moreover, it depends on the number of programme-specific indicators selected by the Member States. The 2014-2020 OPs are de-signed as a three-dimensional matrix structure combining the priority axes set individually by the Member States, selected investment priorities and types of re-gions addressed. While this ensures the strategic coherence of the programming, it also significantly increases the number of performance indicators that need to be monitored, since they are multiplied to take account of the specific context in which funding takes place within the OP. Within the sample of OPs examined the number of output indicators rose by up to 450 % and the number of result indica-tors by up to around 500 % (see paragraphs 88 to 91).

82Conclusions and recommendations
Fund-specific differences in the categorisation of financial data and measuring the performance of Operational Programmes’ likely to pose difficulties in programme monitoring in future years
148 The approach to the financial monitoring of investments differs between the ERDF and the ESF, but also between Member States with more than one category of regions (e.g less-developed, transitional and more-developed regions). For the ERDF in particular, the link between actions and funding cannot be readily established since the financial information is not aligned with the investment pri-orities. This will impede the monitoring of progress, since it will not be clear how much money was allocated to the implementation of the investment priorities supported under ERDF (see paragraphs 92 to 99).
149 There are also differences between the funds in their use of common output in-dicators and Member States have the option of defining additional programme-specific output indicators. Again, for the ERDF, there will be significant difficulties in aggregating the performance information for outputs, since on average Mem-ber States selected nearly as many programme-specific indicators as common indicators. Overall, for the ERDF, the 28 EU Member States created 2 240 different programme-specific output indicators in addition to the 40 common output indi-cators. On average, each ERDF OP used 13.2 different programme-specific output indicators and 14.8 common output indicators (see paragraphs 100 to 109).
150 The situation is even more problematic when it comes to result indicators: here, ERDF and ESF indicators measure different things and measure them differently. In fact, the concept of a ‘result’ is interpreted differently in the fund-specific regulation. Common result indicators exist only for the ESF, but not for the ERDF. However, they are not frequently used. Overall, the 28 EU Member States devel-oped 2 955 programme-specific result indicators for the ERDF and, on average, each ERDF OP used 17.4 different specific result indicators. For the ESF, there are 23 common result indicators and an additional 1 976 programme-specific result indicators. On average, each ESF OP used 3.1 common result indicators and 14.4 different programme-specific result indicators. As a result, for both funds, it does not appear possible to meaningfully aggregate performance data at EU level. Overall, given the cost of collecting such data on a regular basis, the number of performance indicators appears to be excessive. In our opinion 1/201786 we recommended to harmonise the definitions of the performance terminology on ‘outputs’ and ‘results’ (see paragraph 110 to 130).
86 See opinion 1/2017 concerning the proposal for an amendment of the Regulation of the European Parliament and of the Council on the financial rules applicable to the general budget of the Union (paragraph 148).

83Conclusions and recommendations
151 The Member States are also required to split the financial resources allocated to the different intervention fields as well as performance data by category of region (such as less-developed, transition and more-developed regions). We found that Member States follow different approaches in this regard. These dif-ferent national approaches have a direct impact on the number, target values and milestones of the output indicators, key implementation steps and financial indicators used on those OPs, i.e., the values of output and result indicators by type of regions are established using different allocation keys. More importantly, the absence of a common approach raises doubts as to the comparability and the accuracy of the information provided by Member States with more than one category of region. In particular, this may have an impact on the fulfilment of the thematic concentration requirements (see paragraphs 100 to 101).
Recommendation 3
The Commission should define a common terminology for ‘output’ and ‘result’ and propose it for inclusion in the Financial Regulation and ensure that the proposals for the sectoral regulations follow these definitions for the post-2020 periods.
Target implementation date: when preparing the legislative proposals for the period post- 2020.
Recommendation 4
The Commission should carry out an analysis of the 2014-2020 programme- specific and common indicators for outputs and results to identify those which are most relevant and best suited to determining the impact of the EU interventions.
Member States should discontinue the use of unnecessary programme-specific indicators in case of programme modifications.
Target implementation date: by mid 2018.

84Conclusions and recommendations
152 As in the past, the impact of Cohesion spending on the achievement of the antici-pated results will have to be established by means evaluations. This requires the availability of data on the results directly attributable to the co-financed opera-tions. For the ESF OPs, data on the immediate results of interventions will be systematically collected and will be reported by the Member States to the Com-mission. However, the ERDF result indicators do not record the immediate results of projects and will not be readily available, unless the Member States decide to collect this additional data on a voluntary basis (see paragraphs 121 to 123).
Recommendation 5
The Commission should:
ο disseminate ‘good practices’ by Member States as regards evaluations which can best determine the impact of EU interventions;
ο assist the Member States in updating their evaluation plans which include such ‘good practice evaluations’.
Member States should ensure that the data that is relevant to establish the ef-fects of the ERDF interventions is collected.
Target implementation date: by the end of 2017.
153 The fact that the fund-specific regulations have introduced different require-ments for collecting and reporting performance data on outputs and results is considered to be a major weakness in the system put in place for the 2014-2020 period. Our analysis shows that some indicators set out as output indicators for ERDF could be perceived as result indicators for the ESF. However, immediate results are not systematically measured by common output indicators for all TOs supported with ERDF interventions (see paragraphs 124 to 130).

85Conclusions and recommendations
154 As a result, Member States are obliged to develop fund-specific performance monitoring systems, even in the case of multi-fund OPs. These differences in methodology and the excessive number of programme-specific indicators will cause a significant administrative burden, but it remains to be seen what use will be made of this data. It is still unclear how the Member States and/or the Commission intend to make use of and monitor the performance information for which data will have to be collected, checked and, at least for the common indicators, reported to the Commission. However, the improved availability of performance data on outputs could pave the way for the use of such unit costs and information on effectiveness and efficiency of interventions in a more performance-based allocation of budget to the interventions after 2020. (see paragraphs 131 to 134).
Recommendation 6
The Commission should:
ο use the data collected via the annual implementation reports and the results of ad hoc and ex-post evaluations for comparative analysis of performance and, where appropriate, to promote the use of benchmarking to allow for policy learning during 2014-2020 period.
ο apply the concept of a performance budget, which links each increment in resources to an increment in outputs or other results, to the funding of cohe-sion policy interventions for the post-2020 period where appropriate. In this context, the Commission should make use of data on the actual unit costs determined during the 2014-2020 period.
Target implementation date: when preparing the legislative proposals for the period post- 2020.
This Report was adopted by Chamber II, headed by Mrs Iliana IVANOVA, Member of the Court of Auditors, in Luxembourg at its meeting of 8 February 2017.
For the Court of Auditors
Klaus-Heiner LEHNE President
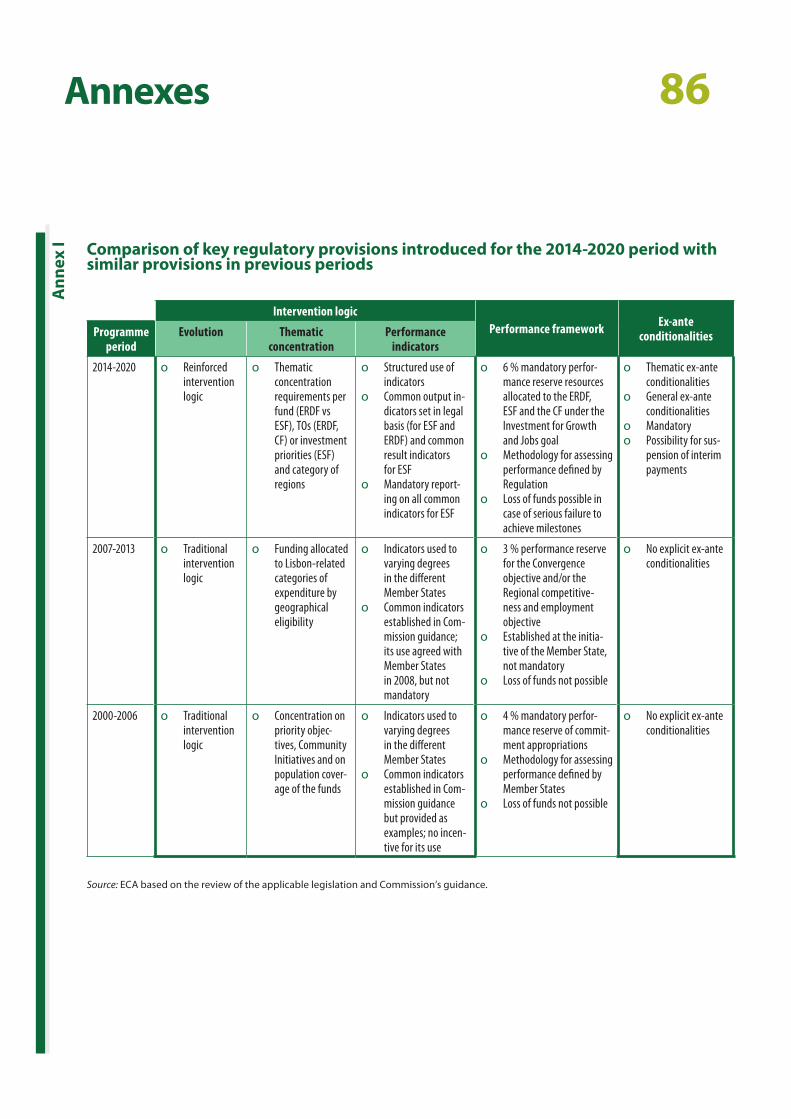
86Annexes
Comparison of key regulatory provisions introduced for the 2014-2020 period with similar provisions in previous periods
Intervention logicPerformance framework Ex-ante
conditionalitiesProgramme period
Evolution Thematic concentration
Performance indicators
2014-2020 ο Reinforced intervention logic
ο Thematic concentration requirements per fund (ERDF vs ESF), TOs (ERDF, CF) or investment priorities (ESF) and category of regions
ο Structured use of indicators
ο Common output in-dicators set in legal basis (for ESF and ERDF) and common result indicators for ESF
ο Mandatory report-ing on all common indicators for ESF
ο 6 % mandatory perfor-mance reserve resources allocated to the ERDF, ESF and the CF under the Investment for Growth and Jobs goal
ο Methodology for assessing performance defined by Regulation
ο Loss of funds possible in case of serious failure to achieve milestones
ο Thematic ex-ante conditionalities
ο General ex-ante conditionalities
ο Mandatory ο Possibility for sus-
pension of interim payments
2007-2013 ο Traditional intervention logic
ο Funding allocated to Lisbon-related categories of expenditure by geographical eligibility
ο Indicators used to varying degrees in the different Member States
ο Common indicators established in Com-mission guidance; its use agreed with Member States in 2008, but not mandatory
ο 3 % performance reserve for the Convergence objective and/or the Regional competitive-ness and employment objective
ο Established at the initia-tive of the Member State, not mandatory
ο Loss of funds not possible
ο No explicit ex-ante conditionalities
2000-2006 ο Traditional intervention logic
ο Concentration on priority objec-tives, Community Initiatives and on population cover-age of the funds
ο Indicators used to varying degrees in the different Member States
ο Common indicators established in Com-mission guidance but provided as examples; no incen-tive for its use
ο 4 % mandatory perfor-mance reserve of commit-ment appropriations
ο Methodology for assessing performance defined by Member States
ο Loss of funds not possible
ο No explicit ex-ante conditionalities
Source: ECA based on the review of the applicable legislation and Commission’s guidance.
Ann
ex I

87Annexes
Europe 2020 Strategy, Thematic Objectives and Thematic concentration1
Ann
ex II
Them
atic
obje
ctiv
ePi
rorit
ies a
nd ta
rget
s
1. Development 3 % of the EU’s GDP (public and private combined) to be invested in the research and development (R&D) and innovation sector
2. Education Reducing school drop-out rates below 10 % At least 40 % of 30-34–year-olds completing third level education
3. Climate change and energy sustainability Reduce greenhouse gas emissions by 20 % compared to 1990 levels Increase the share of renewables in �nal energy consumption to 20 % 20 % increase in energy e�ciency
4. Employment 75 % of 20-64-year-olds to be employed
5. Fighting poverty and social exclusion At least 20 million fewer people in or at risk of poverty and social exclusion
Inclusive growth
TO8 - Promoting sustainable and quality employment and supporting labour mobility
TO9 - Promoting social inclusion, combating poverty and any discrimination
T10 - Investing in education, training and vocational training for skills and lifelong learning
T11 - Enhancing institutional capacity of public authorities and stakeholders and e�cient public administration
Sustainable growth
TO4 - Supporting the shift towards a low-carbon economy in all sectors
TO5 - Promoting climate change adaptation, risk prevention and management
TO6 - Preserving and protecting the environment and promoting resource e�ciency
TO7 - Promoting sustainable transport and removing bottlenecks in key network infrastructures
Smart growth
TO1 - Strengthening research, technological development and innovation
TO2 - Enhancing access to, and use and quality of, information and communica-tion technologies (ICT) (Broadband target)
TO3 - Enhancing the competitiveness of small and medium-sized enterprises (SMEs)
1 The attribution of Thematic Objectives to the priority areas of Europe 2020 strategy: smart, sustainable and inclusive growth is not set out in the Regulations. It was introduced by the Commission in several documents published since 2014.

88Annexes
Source: ECA, on basis of Commission’s publication ‘Panorama, Inforegio, No 48, 2013’.
Ann
ex II
TO 8
Transition regions
12 % 50 %
15 % 60 %
20 % 80 %
TO4
Supported by the ESF
Supported by the CF
TO1
TO2 TO3
TO8TO9
TO10TO4 TO11
TO5 TO6
TO7
Main priorities
for the ERDF Main priorities
for the ESF
Supp
orted by the ERDF
Less developed regions
More developed regions
TO1-4
TO4 TO1-4
TO4 TO1-4
70 %
80 %
60 %20 %
20 %
20 %
TO9 up to 5 IPs
TO9
TO9
up to 5 IPs
up to 5 IPs
Focus on up to 5 investment priorities (IPs) under the thematic objectives and 20 % focus in each country on social inclusion, combating poverty and anti-discrimination.
For the European Social FundInvestment to focus on at least 2 of the 4 main priorities with a speci�c allocation to low carbon-economy (TO4)
For the European Regional Development Fund
Europe 2020 Strategy, Thematic Objectives and Thematic concentration

89Annexes
Architecture of the Cohesion Policy
Ann
ex II
I
Partnership agreement(with expected strategic results)
LDR: Less Developed Regions
TR: Transition Regions
MDR: More Developed Regions
Operational programme 1
Oper
atio
nal p
rogr
amm
e NOp
erat
iona
l pro
gram
me.
..
Fina
ncia
l allo
catio
nSp
ecifi
c Ob
jectiv
e 1an
d ex
pecte
dre
sults
...
...
...LD
R (E
SF)
TR (E
SF)
MDR
(ESF
)...
...
LDR (E
SF)
TR (ESF)
MDR (ESF)
Resu
lt In
dica
tor 1
Result
Indicator N
LDR (ESF)
TR (ESF)
MDR (ESF)Result
Indicator 1
......
Specific
Objective Nand
expectedresults
Actions
Result Indicator N
LDR (ESF)
TR (ESF)
MDR (ESF)
OutputIndicator 1
LDR
TR
MDR ...
...OutputIndicator N LDR
TR MDR
Result
Indicator 1 LDR (ESF)
TR (ESF)
MDR (ESF)
...
...
Specific
Objective1
and
expected
results
Result
Indicator N
LDR (ESF)
TR (ESF)
MDR (ESF)
......
Result Indicator 1
LDR (ESF)TR (ESF)
MDR (ESF)
......
LDR
TR
MDR ...
...
LDR TR MDR LDR (ESF)TR (ESF)MDR (ESF)...
...
LDR (ESF)TR (ESF)MDR (ESF)......
LDR (ESF)TR (ESF)
MDR (ESF)... ...
LDR (ESF)
TR (ESF)
MDR (ESF)
LDR
TR
MDR
...
...
LDR
TR
MDRLD
R (E
SF)
TR (E
SF)
MDR
(ESF
)
OutputIndicator NOutput
Indicator 1ResultIndicator N
ResultIndicator 1
ResultIndicator N
ResultIndicator 1
Output
Indicator N
Outpu
tInd
icato
r 1Re
sult
Indi
cato
r N
Actions
Specific Objective Nand expected
results
Specific Objective 1
and expected
results
...
Actions Specific Objective Nand expectedresults
Investm
ent
priorit
y N
Investmentpriority 2
Investment
priority 1
Priority Axis 1
Priority Axis 2
Priority Axis 3
Priorityaxis 1
...

90Annexes
Source: ECA.
Investment priorities are specific actions to be developed within each Thematic Objective. They should form the basis for the definition of specific objectives. The investment priorities of the TOs examined for this audit are:
Ann
ex II
I
(b)
(a)
TO1: ‘strengthening research, technological development andinnovation by:
Active and healthy ageing.(vi)
Adaptation of workers, enterprises and entrepreneurs to change;
(v)
Equality between men and women in all areas, including in access to employment, career progression, reconcilia-tion of work and private life and promotion of equal pay for equal work;
(iv)
Self-employment, entrepreneurship and business creation including innovative micro, small and medium sized enterprises;
(iii)
Sustainable integration into the labour market of young people, in particular those not in employment, education or training, including young people at risk of social exclusion and young people from marginalised communities, including through the implementation of the Youth Guarantee;
(ii)
Access to employment for job-seekers and inactive people, including the long-term unemployed and people far from the labour market, also through local employment initiatives and support for labour mobility;
(i)
TO8: 'promoting sustainable and quality employment and supporting labour mobility':
enhancing research and innovation (R&I) infrastructure and capacities to develop R&I excellence, and promoting centres of competence, in particular those of European interest;
promoting business investment in R&I, developing links and synergies between enterprises, research and development centres and the higher education sector, in particular promoting investment in product and service development, technology transfer, social innovation, eco-innovation, public service applications, demand stimulation, networking, clusters and open innovation through smart specialisation, and supporting technological and applied research, pilot lines, early product validation actions, advanced manufacturing capabilities and �rst production, in particular in key enabling technologies and di�usion of general purpose technologies’.

91Annexes
Strategic result indicators – analysis of Partnership Agreements for the five Member States covered
(a) for the Thematic Objective 1
Country Main Result Indicator in the PA Baseline (year) Interim target 2020
EU-allocation ESIF in euro
(thereof ERDF)
EU contribution to the target
value
ES R&D expenditure in relation to GDP (GERD) 1.3 % (2012) 2.00 %
4 653 741 999 (4 424 158 787)
N/A
ES Spending in R&D financed by the private sector 45.6 % (2012) 60.0 % N/A
ES Companies performing technological innovations on the total active companies with 10 or more employees
13.22 % (2010-2012) 25.00 % N/A
IE Increased number of industry partners engaged with funded strategic research centres in the regions N/A1 N/A
186 992 153 (142 000 000)
N/A
IE Increase in the number of Licenses as a result of research in S&E Region N/A N/A N/A
IEThe number of SME clients of Enterprise Ireland in the BMW Region spending >100 000 euro per annum on R&D (BMW).
N/A N/A N/A
HR R&D expenditure in relation to GDP (GERD) 0.75 % (2012) 1.40 % 690 292 165 (664 792 165) N/A
PL R&D expenditure in relation to GDP (GERD) 0.90 % (2012) 1.70 %8 436 055 741.-
(8 351 428 665.-)
26 %
PL R&D expenditure incurred by the enterprise sector in relation to GDP 0.30 % (2012) 0.80 % 30 %
RO R&D expenditure in relation to GDP (GERD) 0.49 % (2012) 2.00 % 1 061 811 455.- (973 404 255.-) N/A
1 Reference is made to the result indicators in the OPs.
Ann
ex IV

92Annexes
(b) or the Thematic Objective 8
Country Result Indicator in the PA Baseline (year) Interim target 2020
EU-allocation ESIF in euro
(thereof ERDF, ESF, YEI)
EU contribution to the target
value
ES Increase the employment rate of 20-64 year-olds 59.3 % (2012) 74 %
4 195 708 141.- (3 645 694 060.-)
N/A
ES Youth unemployment rate 55.7 % (2013) Decrease baseline N/A
ES Unemployment rate of the less qualified workers 34 % (2012) Decrease baseline N/A
ES Percentage of the medium and highly qualified employ-ment in relation to the total employment rate 78.97 % (2012) Increase baseline N/A
IEUnemployed persons or other job-seekers, including long-term and young unemployed persons, obtain employment or progress to education or training
N/A N/A307 325 622.-
(299 075 622.-)
N/A
IEMore young people, in particular those who are not in employment, education or training, aged under 25 progress to education, training or employment
N/A N/A N/A
HR Increase the employment rate of 20-64 year-olds 55.4 % (2013) 62.9 % 680 687 318.- (532 933 273.-) N/A
PL Increase the employment rate of 20-64 year-olds (F/M) 57.6 % F (2013)72.1 % M (2013)
62.3 % F79.8 % M
5 796 315 058.- (5 450 532 063.-)
5 % 3.2 %
PL Increase the employment rate of 55-64 year-olds (F/M) 31.0 % F (2013)51.3 % M (2013)
34.5 % F64.4 % M
4.7 % 1.6 %
PL Increase the employment rate in rural areas to 53.3 % 50.3 % (2013) 53.3 % 6.2 %
RO Increase of employment rate of 20-64 year-olds 63.8 % (2012) 70 % 2 334 594 271.- (1 770 988 630.-) N/A
Source: ECA.
Ann
ex IV

93Reply of the Commission
Executive summary
IVThe Commission refers to its reply under paragraph 55.
Common Commission reply to paragraphs VII and VIII The Commission notes that ERDF and ESF programme specific performance indicators for results are not intended to be aggregated at EU level. Those specific indicators are suited for target setting and reporting on performance in relation to the targets, while common indicators allow reporting on achievements based on pre-defined categories that reflect frequently used investments across the EU. Programme-specific output indicators refer to the physical products that allow grasping the changes achieved by the EU-funded interventions in programmes. These interven-tions are tailor-made to resolve place-based development bottlenecks. By definition, these need to be specific to the region and action foreseen.
VIIIThe Commission refers to its replies under paragraphs 90, 91, 110, 112, 131, 134 and Box 13.
IXFirst bullet: The Commission refers to its reply under recommendation 2.
Second bullet: The Commission refers to its reply under recommendation 5.
Third bullet: The Commission refers to its reply under recommendation 4.
XFirst bullet: The Commission refers to its reply under recommendation 1.
Second bullet: The Commission refers to its reply under recommendation 2.
Third bullet: The Commission refers to its reply under recommendation 3.
Fourth bullet: The Commission refers to its reply under recommendation 4.
Fifth bullet: The Commission refers to its reply under recommendation 5.
Sixth bullet: The Commission refers to its reply under recommendation 6.

Reply of the Commission 94
Observations
36The Commission proposal for 2014-2020 was presented slightly later than the proposal for the 2007-2013 period. The main reason for the delay in the entry into force of the regulation, however, was the increased complexity of the leg-islative negotiations (enhanced role of EP, proposal covering 5 funds) and the fact that the MFF Regulation was only adopted by the co-legislators in December 2013. The sectorial legislation could not have been adopted before that, even if the Commission had presented its proposals earlier.
37The Commission prioritised the adoption of secondary legislation according to the needs of the programming cycle. Secondary legislation necessary for the adoption of Partnership Agreements (PAs) or Operational Programmes (OPs) and for the set-up of basic delivery structures was adopted by March 2014, followed by acts which provided essen-tial rules for implementation by January 2015. The fact that the legal framework was completed only in January 2016 did not have an impact on the start-up of programming.
In addition, in order to facilitate a timely adoption of the secondary legislation, drafting and consultation processes with Member States were carried out in parallel to the legislative negotiations.
49The Commission notes that its performance on the negotiations and adoption of programmes in comparison with the previous programming period can also be assessed by comparing the first 12 months following the adoption of the legal framework. Using the period of 12 months from the adoption of the relevant legislative packages in both periods would offer a more accurate picture. This would mean that in 2014-2020, in the first 12 months after the adoption of the regulation 40 % of OPs were adopted, in comparison to 6% of OPs in the same timeframe of the 2007-13 programming period.
52The Commission notes that the 703 days pointed out by the Court include the informal submission of an OP not in line with the requirements of the CPR.
53The Commission notes that certain delays were caused by the need for extensive observations. Furthermore, Spain did not agree for the observations to be transmitted in English leading to a delay in their submission to the ES authorities. Concerning Poland, the reason for the delays in sending the observations was the ongoing negotiation process of the Partnership Agreement. As the OPs were submitted before the adoption of the PA, the observations had to be aligned and consistent with the adopted PA.

Reply of the Commission 95
55The Commission notes that 100 % of PAs and 99% of OPs were adopted within the regulatory deadline (i.e. 6 months for OPs and 4 months for PAs). It took the Commission on average 107 days/3.6 months to adopt an OP and 81 days on average to adopt a PA (taking into consideration the stop the clock procedure, in accordance with Article 3 CPR).
Please also refer to the Commission’s reply under paragraph 52.
Third indent: Considering the economic importance of the Cohesion Policy allocation, the Commission takes the quality of the programmes very seriously and has put in place procedures that ensure consultation of all concerned services in order to pool all available expertise in view of quality programmes that allow spending the EU budget effectively.
62Thanks to the IT tools at the Commission level, the monitoring of the fulfilment of the financial concentration requirements will be possible, including also additional information requested from the concerned Member States outside the PA and OPs.
66During negotiations, the Commission verified that the CSRs were prioritised in the Partnership Agreements and specific objectives of the operational programmes. Nevertheless, there is no regulatory requirement for the CSRs to be given specific funding allocations.
74The Commission notes that the requirements set apply to all Member States. The quality of information is subject to the robustness of the monitoring systems which falls under their responsibility.
75Concerning the Irish PA, the Commission notes that it is in line with the requirements of the regulation when sum-marising the main results sought and that the necessary detail is provided in the OPs.
76Concerning the Irish PA, while the main results sought do not include a specific reference to the EU2020 targets, the PA makes frequent reference to IE’s targets, including in the introduction on page 10. These targets also had an impact on the preparation of the OPs. Both OPs refer frequently to both the EU2020 strategy and IE’s targets.

Reply of the Commission 96
86First indent: For ERDF Andalucía TO8, the Commission considers that in addition to the information included in the programme and in the Partnership Agreement, sufficient clarifications on the need to invest in infrastructure and equipment for the Employment Service were provided by the Andalusian authorities during the negotiation of the OPERATIONAL PROGRAMME.
Second indent: Regarding Romania, the Commission notes that the very large majority of the objectives were not defined too broadly. The Commission considers that the specific objectives have an established series of output and result indicators. Concerning Spain, the objectives of the OP are further specified in the national and regional smart specialisation strategies and the Multi-annual plan for budgeting and prioritisation of Research Infrastructure investment to which the OP refers.
87The Commission notes as far as Poland is concerned that Priority Axis IV social innovation and international cooper-ation is clearly divided into types of actions identified for two separate specific objectives - micro and macro social innovations and transnational mobility.
All these types of projects are supposed to contribute to:
- new ideas and policy solutions to be developed, tested and implemented either at local/small or at national level;
- mobility programmes of people eligible under the OP KED intervention.
Regarding Spain, the Commission notes the negligible magnitude of the allocation for priority axes 6A, 6B, 6C and 6D (7 million euro, or 0.33% of an OP with a total allocation of 2.1 billion euro). Furthermore, it should be noted that the activities in these priority axes are indeed complementary with the ones developed in the priority axes 1 cover-ing the Thematic Objective 8 “Employment” with its own Specific Objective 8.3.1. These priority axes only develop the “social innovation” element of the main actions funded in the core specific objective. On this basis, they cannot be seen as a stand-alone measure.
90The Commission notes that it is an essential element of cohesion policy that the allocations are higher for the less developed regions and thus reporting is done accordingly, i.e. by category of region.
91The Commission refers to its reply under paragraph 90.
The Commission notes that all Member States need to report on all common indicators for the ESF, as they provide information of great importance, but they are not obliged to set targets for them.
The reporting requirements defined by the CPR have been set in agreement with the Member States. The majority of these indicators have already been reported by the Managing Authorities, as required.
Indicators in the performance framework (Table 6 in the OP) are a subset of the indicators of the programme (Table 4 and 5). They do not represent any additional burden in reporting.

Reply of the Commission 97
101The Commission notes that the fact that Member States follow different approaches is a reflection of the thematic and regional nature of cohesion policy interventions.
104The Commission notes that the regulation specifies that common output indicators shall be used where relevant. The result orientation enables Member States to determine the indicators they will use based on the formulation of the specific objective and the determination of the actions they plan to carry out. Indicators used in between 40% and 90% of the OPs cannot be considered “limited extent”.
Box 9 - Example of a relevant common output indicator not being used (Spain)The Commission notes that TO 1 covers a wide range of investment priorities leading to more than the performance indicators included under this heading. The Commission would like to recall the intervention logic of the current programming period whereby a specific objective entailing a desired change/result may be achieved through dif-ferent actions to be translated in different relevant performance indicators. In the Spanish example, both CO01 and CO29 were relevant. The Member State decided – also in light of non-proliferation of indicators - to limit the rel-evant indicators used to the aggregate one, CO01.
110The Commission notes that the concept of result indicators is indeed different in the ESF and ERDF regulation primarily due to the different objectives and expected results of the two funds. As a result, not all indicators lend themselves to aggregation across funds.
The Commission is exploring the possibility to proceed towards a harmonisation of those concepts in the context of the post 2020 discussions.
111The Commission’s replies to chapter 3 of the 2015 Annual report, which the Court is referring to, also refer to the fact that the adoption of the different Regulations for the 2014-2020 MFF period preceded the better regulation guidelines (May 2015). Moreover, the content of these regulations is the result of a political negotiation between the co-legislators which has led to some inconsistencies.
Since the adoption of the better regulation guidance, the better regulation terminology should be consistently used in the monitoring and evaluation of all programmes. Consistent use of terms across all legislation may, however, not be possible in the short term.
112The Commission notes that ERDF and ESF programme specific performance indicators for results are not intended to be aggregated at EU level. Those specific indicators are suited for target setting, and reporting on performance in relation to the targets, while common indicators allow reporting on achievement based on pre-defined categories.
ERDF does not include common result indicators, as the result is “what is intended to be changed, with the contribu-tion of the interventions designed”. Different factors can drive the intended result towards or away from the desired change. To better represent the specific context in which the interventions take place, the Member States establish a specific result indicator that takes all of these parameters into account.

Reply of the Commission 98
115The Commission notes that it is indeed not necessary that the OP defines targets for all the common indicators. That is the reason why they are not all in the OP. However, they need to be reported on for all investment priorities.
124As indicated in the ERDF Guidance document on Monitoring and evaluation, result indicators in ERDF refer to the specific dimension of well-being and progress for people that motivates policy action and relate to all potential beneficiaries. Contrary to output indicators, result indicators are therefore not strictly and solely related to ERDF investments. While the ERDF investment will probably be an important contributor towards the change envisaged, other exogenous factors – going beyond the Managing Authority’s and, sometimes, even national and/or regional authorities’ control - will also have an effect.
127The Commission notes that the data on the longer term result indicators are to be collected on the basis of a repre-sentative sample and thus not for all participants (see Annex I ESF Regulation).
128The Commission underlines that the assessment of net effects goes beyond the scope of monitoring and is the subject of evaluations by the Managing Authorities. Managing Authorities are required to assess at least once the impact of each specific objective. The Commission has intensively promoted the conduct of counterfactual impact evaluations so as to estimate net effects of the ESF, which is facilitated by the collection and storage of individual data on participants.
130The Commission notes that there are different information requirements but this does not necessarily lead to com-pletely different performance monitoring systems.
131The Commission notes that ERDF programmes cover a wide variety of investment themes and operate in hetero-geneous social, economic and geographical contexts. The new 2014-2020 result orientation approach places emphasis on a clearer articulation of policy objectives clarified in the respective Fund-specific regulations. In terms of performance information, ERDF common output indicators cover the most frequently used interventions to ensure meaningful aggregation at EU level. They are not sufficient however to cover the complexity and variety of interventions carried out by Member States across the EU. Therefore, programme-specific indicators (either output or result indicators) were explicitly chosen by MS in addition to common indicators to reflect the specific context in which the programmes operate. In many cases, the relevant information is available and primarily collected bottom-up.

Reply of the Commission 99
132Please refer to the Commission reply under paragraph 131.
134The Commission considers that a one-size-fits-all approach to performance budgeting is not feasible or practical in line with expert research concluding that there is no best way of implementing performance budgeting. Practice shows that attempts to implement a rigid approach lead to a bureaucratic exercise of checklist ticking, rather than a genuine budget management tool.
Refer also to the Commission’s reply to Box 13.
Concerning the possible causes of the variations in unit costs of construction of motorways between different Member States that the Court refers to, the Commission noted in the referred previous report1 that “usually demand forecasts and therefore the related cost per use take into consideration the very specific context of the regions (…) Technically more complex roads have higher costs per km than other roads.. This analysis also depends highly on the geographical circumstances under which the audited roads were built.”
The Commission in this regard accepted to continue to undertake further unit cost studies.
Box 13 - Performance budgetingThe OECD[*] has defined performance budgeting as budgeting that links the funds allocated to measurable results. There are three broad types: presentational performance budgeting, performance-informed budgeting, and direct performance budgeting. [*See OECD’s website at http://www.oecd.org/gov/budgeting/seniorbudgetofficialsnet-workonperformanceandresults.htm. ] The Commission works closely with the OECD as part of EU Budget Focused on Results efforts to introduce practical improvements in the existing performance framework of programmes established with the MFF 2014-2020.
Performance information is not and should not be the only element driving budgetary decisions, and therefore it is normal that other information is considered as well.
The EU Budget is a performance budget which enables the budgetary authority to take performance information into account during the budgetary process by providing information on the objectives of the programmes and the progress in achieving them (i.e. what is done or expected to be done with the funds allocated to each programme) in the programme statements attached to the Draft Budget. Explicitly linking each increment in resources to an increment in outputs or other results at the budget level is rarely used in practice and if so, only in specific cases (World Bank, OECD). The direct budgeting approach implying linking each increment/reduction in resources to an increment/reduction in outputs or other results is not considered feasible or applicable at the EU budget level, across programmes and management modes.
1 Common Commission reply to paragraph 32 and 33 of Special Report No 5/2013, “Are EU Cohesion Policy funds well spent on roads?”

Reply of the Commission 100
Conclusions and recommendations
136The Commission notes that the data provided by Member States on all the common output indicators and, for the ESF, also on the common result indicators, can and will be aggregated by Fund at EU level and the Commission provides a summary report to the EP, the Council, EESC and COR on a yearly basis. The first report was adopted on 20.12.2016 (COM(2016)812). Moreover, detailed data are publicly available and can be consulted on the open data platform2.
The Commission is of the view that the common indicators – as adopted by the co-legislators in the Fund-specific Regulations – provide data which are necessary in order to be able to demonstrate to the Budget Authority, but also to the European citizens, what the ESI Funds are achieving and that the EU budget is focused on and delivering results.
137The Commission notes that the MFF Regulation was also only adopted by the co-legislators in December 2013. The sectorial legislation could not have been adopted before that even if the Commission’s proposal had been made earlier.
The Commission underlines that another factor that should be taken into account is the fact that the general rules on the Funds (i.e. the CPR) now had to be adopted by both the Council and the EP.
The Commission prioritised the adoption of secondary legislation according to the needs of the programming cycle. Secondary legislation necessary for the adoption of partnership agreements or operational programmes and for the set-up of basic delivery structures was adopted by March 2014 (early drafts discussed with Member States in 2013), followed by acts which provided essential rules for implementation by January 2015. The fact that the legal frame-work was completed only in January 2016 did not have an impact on the start-up of programming.
138Regarding guidance, the Commission recalls that these were already discussed in the Expert Group on Delegated and Implementing Acts prior to the adoption and entry into force of the basic acts. By definition, the Commission is only in a position to finalise the guidance notes once the regulatory framework has been agreed to and adopted by the co-legislators. Please also refer to the Commission’s reply under paragraph 37.
2 https://cohesiondata.ec.europa.eu/

Reply of the Commission 101
140The Commission notes that the overall duration of programming was considerably shorter than in 2007 – 2013. Please refer to paragraphs 49, 52, 53, and 55 for more detailed statistics.
141The Commission refers to its reply under paragraph 55.
Recommendation 1The Commission accepts this recommendation, The presentation of timely legislative proposals for Cohesion policy is a priority for the Commission. The timing, however, is dependent on the adoption of the proposal for the MFF Regulation. In accordance with Article 25 MFF Regulation3, the Commission has to present its proposal for the post 2020 multiannual financial framework before 1 January 2018. The Commission’s proposal for the cohesion policy legislative package post 2020 will be presented subsequently.
The Commission will work closely with the co-legislators with a view to a timely adoption and entry into force of the legislative framework.
143The Commission has implemented a system to monitor thematic concentration through the data provided in the OPs, together with additional information from the concerned Member States and is confident that this is sufficient to establish if thematic concentration requirements are respected.
Please refer to the Commission’s reply under paragraph 62 for more detail.
Recommendation 2
(a)The Commission takes note of the recommendation which is addressed to the Member States.
(b)The Commission accepts the recommendation. The Commission underlines that compliance with the thematic con-centration requirements is verified at the time of the OP adoption/OP amendment. During implementation compli-ance is monitored via the data provided by Member States in the Annual Implementation Report.
144The Commission refers to its replies under paragraphs 75 and 76.
145The Commission refers to its replies under paragraphs 86 and 87.
3 Regulation (EU, EURATOM) No 1311/2013.

Reply of the Commission 102
146The Commission notes that cohesion policy is a place-based instrument delivering tailor-made solutions for the specific needs and challenges of Member States and regions. Thus, the reporting requirements have been set in agreement with Member States in order to sufficiently reflect the specific context of each OP and to allow for mean-ingful reporting as well as evaluation. Please refer to the Commission’s replies under paragraphs 90 and 91 for more insight.
147The Commission notes that while the financial information in ERDF is indeed not formally aligned to the perfor-mance one, Member States have this information and can share it on an ad hoc basis.
The Commission underlines that such information will almost certainly be available to the programmes for the impact evaluation of the programmes during the period also with a view to evaluating cost-effectiveness and cost-efficiency of the interventions.
148The Commission refers to its reply under paragraph 104.
149The Commission is exploring the possibility to proceed towards a harmonisation of those concepts in the context of the post 2020 discussions. Please refer also to the Commission’s replies under paragraphs 110 - 112 for further analysis.
150The Commission notes that it was Member States’ responsibility to determine their approach to the split by cat-egory of region and thus there can be differences in methodology. Guidance was provided in order to facilitate the correct implementation of this split. Please refer to the Commission’s reply under paragraph 101.
Recommendation 3The Commission partially accepts this recommendation.
The Commission accepts to examine the scope for coherent performance terminology in the Financial Regulation and across sectorial legal bases for the post 2020 period. However, the Commission is not in a position at this stage to make any specific commitment in relation to legislative proposals for the post 2020 period.
Recommendation 4The Commission accepts this recommendation and it will be implemented with a view to preparing the post 2020 proposals as follows:
On the basis of the 2014-2020 data, the Commission is exploring the possible wider use of common result and out-put indicators. Nevertheless, in order to determine the impact, evaluations will be needed (as it was also the case in the past).
The Commission notes that the recommendation is addressed to the Member States.

Reply of the Commission 103
151The Commission refers to its reply under paragraph 124.
Recommendation 5The Commission accepts the recommendation and it will continue to be implemented as detailed below:
The Commission continues to disseminate good practice evaluations.
Through the ESF evaluation partnership and through other activities, such as the support provided through CRIE (Centre for Research on Impact Evaluation) promoting the use of counterfactual impact evaluations.
Furthermore, the REGIO evaluation network with the Member States meets 2-3 times per year with the purpose, among other things, to disseminate good practice across its members.
With the support of the REGIO-EMPL Evaluation Help desk, the Commission is assisting Member States in updating their evaluation plans and reviewing evaluations produced by Member States (Peer review).
The Commission notes that the recommendation is addressed to the Member States.
152The Commission refers to its replies under paragraphs 130 and 131.
153The Commission refers to its replies under paragraphs 130 and 131.
Recommendation 6First indent: The Commission accepts this recommendation. In the 2014-2020 period, the Commission communi-cates summaries of annual reports of AIRs to EP/Council. Policy learning is also facilitated by making data on indica-tors, targets and their fulfilment available on the ESIF Open Data Platform. The Commission is also using the Evalu-ation Network with the Member States to promote the sharing of good practice results and policy learning from evaluations.
Second indent: The Commission does not accept the recommendation made by the Court. The EU Budget is a performance budget which enables the budgetary authority to take performance information into account during the budgetary process by providing information on the objectives of the programmes and the progress in achiev-ing them (i.e. what is done or expected to be done with the funds allocated to each programme) in the programme statements attached to the Draft Budget. Explicitly linking each increment in resources to an increment in outputs or other results at the budget level is rarely used in practice and if so, only in specific cases (World Bank, OECD). The direct budgeting approach implying linking each increment/reduction in resources to an increment/reduction in outputs or other results is not considered feasible or applicable at the EU budget level, across programmes and management modes.


HOW TO OBTAIN EU PUBLICATIONS
Free publications:
• one copy: via EU Bookshop (http://bookshop.europa.eu);
• more than one copy or posters/maps: from the European Union’s representations (http://ec.europa.eu/represent_en.htm); from the delegations in non-EU countries (http://eeas.europa.eu/delegations/index_en.htm); by contacting the Europe Direct service (http://europa.eu/europedirect/index_en.htm) or calling 00 800 6 7 8 9 10 11 (freephone number from anywhere in the EU) (*).(*) The information given is free, as are most calls (though some operators, phone boxes or hotels may charge you).
Priced publications:
• via EU Bookshop (http://bookshop.europa.eu).
Event Date
Adoption of the Audit Planning Memorandum/Start of audit 11.11.2015
Official sending of draft report to Commission (or other auditee) 15.12.2016
Adoption of the final report after the adversarial procedure 8.2.2017
Commission’s (or other auditee’s) official replies received in all languages 30.3.2017

Partnership Agreements are strategic investment plans for EU Member States which indicate their national spending priorities for the European Structural and Investment funds for the programme period 2014-2020.In this report, we examined whether the Partnership Agreements signed between the European Commission and the Member States help target the funds with a total funding volume of 350 billion euro more effectively.
We found that, despite initial difficulties, the Commission and the Member States have better focused the funds on growth and jobs, identified investment needs and successfully translated them into objectives and results sought. They have set actions addressing the needs and identified outputs for programmes covered by the Agreements. However, an unnecessarily high number of performance indicators have been developed and performance measurement is not harmonised between the funds. We make a number of recommendations to the Commission and the Member States to improve the operation of the Agreements.
1977 - 2017