Embed Size (px)
Citation preview

Special Report on Summer:
Missed Opportunities, Unmet Demand
May 2010

America After 3PM Special Report on Summer: Missed Opportunities, Unmet Demand 2
Special Report on Summer:
Missed Opportunities, Unmet Demand
For many children in America, summer vacation means camp, trips to new or familiar destinations, visits to museums, parks and libraries, and a variety of enriching activities – either with families or as part of a summer learning program. But for millions of others, when schools close for the summer, safe and enriching learning environments are out of reach, replaced by boredom, lost opportunities and risk. This disparity in summer learning opportunities each summer is a great shame and a significant contributor to the crisis in education in this country. Research spanning 100 years shows that students typically score lower on standardized tests at the end of summer vacation than they do on the same tests at the beginning of the summer.1 More than half of the achievement gap present in ninth grade between lower and higher income youth can be explained by summer learning loss that disproportionately affects low-income children. It is a significant part of the reason that low-income youth are less likely to graduate from high school or enter college.2 It’s true that some children and families in America have the luxury of choosing from a variety of summer learning opportunities including summer camps, community-based programs, parks and recreation activities, library reading programs and traditional summer school. Throughout this report, we focus specifically on summer learning programs—safe, structured programs that provide a variety of activities designed to encourage learning and development in the summer months—since high quality summer learning programs are emerging as an important strategy to prevent summer learning loss.3
America After 3PM Special Report on Summer adds a new dimension to the research on summer learning by providing answers to key questions, including:
• What percentage of America’s children participate in summer learning programs?
• What percentage of children would likely participate based on parental interest?
• What percentage of parents support public funding for summer learning programs?
1 Alexander, K. Entwisle, D., and Olson, L. (2007). Lasting consequences of the summer learning gap. American Sociological Review, 72, 167-180. Cooper, H., Nye, B., Charlton, K., Lindsay, J., & Greathouse, S. (1996). The effects of summer vacation on achievement test scores: A narrative and meta-analytic review. Review of Educational Research, 66, 227-268. Downey, D, von Hippel, P., and Broh, B. (2004). Are schools the great equalizer? Cognitive inequality during the summer months and the school year. American Sociological Review, 69, 613-635. Entwisle, D., and Alexander, K. (1992). Summer setback: Race, poverty, school composition, and mathematics achievement in the first two years of school. American Sociological Review, 57, 72-84. Heyns, B. (1978). Summer Learning and the Effects of Schooling. New York: Academic Press. White,W. (1906). Reviews before and after vacation. American Education, 185-188 2 Alexander, K. L., Entwise, D. R., & Olson, L. (2007). Lasting Consequences of the Summer Learning Gap. American Sociological Review, 72. 3 Chaplin, D. and Capizzano, J. (2006). Impacts of a Summer Learning Program: A Random Assingment Study of Building Educated Leaders for Life (BELL). Urban Institute.

America After 3PM Special Report on Summer: Missed Opportunities, Unmet Demand 3
The data for America After 3PM Special Report on Summer were collected in the 2009 America
After 3PM study, which surveyed nearly 30,000 households. This report presents general findings and breaks them out by ethnicity and socio-economic status as measured by eligibility for free and reduced price lunch, while also offering data on demand and support for summer learning programs in each state. America After 3PM Special Report on Summer, sponsored by The Wallace Foundation, offers a snapshot of how children spend their summers and finds that the nation is missing a key opportunity to help millions of children succeed in school. Key findings include:
• In the United States today, only 25 percent of school-age children (an estimated 14.3 million children) participate in summer learning programs.
• Based on parent interest in enrolling their child in a summer learning program, 56 percent of all non-participating children (an estimated 24 million children) would likely enroll in summer learning programs.
• Parents of only one-third of children show no interest in enrolling their children in summer learning programs.
• Low-income and ethnic minority children are more likely to attend summer learning programs than other children, but the unmet demand among low-income and minority families are also greatest.
• By an overwhelming margin, parents support public funding for summer learning programs, with the strongest level of support coming from low-income and ethnic minority parents.
Background on America After 3PM Special Report on Summer The data for America After 3PM Special Report on Summer were gathered through the 2009 America After 3PM study. In 2009, the Afterschool Alliance and JCPenney Afterschool commissioned the most in-depth study ever to examine how America’s kids spend their hours after school. Conducted by RTi, a market research firm, America After 3PM definitively answered questions such as:
• What are kids doing after school?
• How many kids are in afterschool programs?
• How many kids go home alone?
• What is the demand for afterschool programs? In addition, the 2009 America After 3PM study gathered answers to key questions regarding how many children participate in summer learning programs, how many more would likely participate, and how many parents support public funding for summer learning programs. In total, nearly 30,000 households were surveyed. The findings from the summer related questions are presented in this report.

America After 3PM Special Report on Summer: Missed Opportunities, Unmet Demand 4
Key Findings America After 3PM Special Report on Summer finds that summer learning programs are serving a significant portion of our nation’s children, but even more children are not reaping the benefits of these valuable programs each summer. The demand for programs is very high, especially among those who need them most.
• Three quarters of America’s schoolchildren are not participating in summer learning programs. Despite a growing awareness that summer learning loss is a major contributor to the achievement gap between low-income and high-income youth, the number and percentage of children participating in summer enrichment programs is startlingly low.
– Twenty-five percent of children (an estimated 14.3 million4) participate in summer learning programs. Forty-three percent of summer participants qualify for free/reduced price lunch5.
– Children who participate in afterschool programs participate in summer learning programs at much higher levels than children who do not attend afterschool programs during the regular school year. Fifty-five percent of afterschool participants were in a summer learning program in 2008, compared to 21 percent of students who did not participate in afterschool programs.
• There are many quality summer learning programs around the country, but not nearly enough to keep pace with demand.
– Fifty-six percent of non-participating children (an estimated 24 million) would be likely to participate in a summer learning program, based on parent interest.
– What’s more, nearly half the children (46 percent) who are likely to participate in a summer learning program are eligible for free/ reduced price lunch.
• While ethnic minority and low-income children are more likely than others to be in summer learning programs, the unmet demand is great.
– Thirty-five percent of African-American, 29 percent of Hispanic and 27 percent of low-income children attended summer learning programs in 2008, compared to the national average of 25 percent.
– Yet more than three in four African-American kids (77 percent) and at least two in three Hispanic (70 percent) and low-income (67 percent) kids would likely enroll in a summer learning program, based on parent interest.
• Parents overwhelmingly support summer learning programs, and there is even greater support among parents of minority and low-income students.
– Eight in ten parents (83 percent) support public funding for summer learning programs.
– Fully 95 percent of African-American, 91 percent of Hispanic and 90 percent of low-income parents support public funding for summer learning programs.
4 Estimations of the number of children included in this study reflect projections calculated using 2007 U.S. Census school-age population data. 5 For the purposes of this report, qualification for free/reduced price meals under the National School Lunch Program is used as a proxy for low-income. (For the 2008-2009 school year, a family of four with an annual income of $39,220 or lower would qualify for assistance under the National School Lunch Program).

America After 3PM Special Report on Summer: Missed Opportunities, Unmet Demand 5
Differences by Ethnicity and Socioeconomic Status
There are significant differences in how children of different ethnic and socio-economic backgrounds spend their summers. While support is strong among the entire population, high need populations back summer learning programs in even greater numbers.
Ethnicity and Socioeconomic Status of Summer Learning Program
Participants
Ethnicity and Socioeconomic Status of Likely Participants
Ethnic and Socioeconomic Differences in Supply and Demand for Summer Learning Programs
Overall African-
American Hispanic
Qualify for Free or
Reduced Price Lunch
Percentage of Kids in Summer Learning Programs
25 35 29 27
Percentage of Kids Not Currently Participating Whose
Parents Have Interest in Enrolling Them in the Future
56 77 70 67
Percentage of Parents who Support Public Funding for Summer Learning Programs
83 95 91 90
Kids in Summer Learning Programs by
Ethnicity
61%
18%
2%
14%5%
Caucasian
African-
American
Native
American
Hispanic
Asian
Likley Participants by Ethnicity
65%
15%2% 14%
4% Caucasian
African-American
Native American
Hispanic
Asian
43 percent of kids (an estimated 6.2 million) in summer learning programs are from low-income households
46 percent of kids (an estimated 11 million) whose parents have interest in enrolling them in summer learning programs in the future are from low-income households.

America After 3PM Special Report on Summer: Missed Opportunities, Unmet Demand 6
There are not enough summer learning programs to meet the demand. Much like what America After 3PM found for afterschool programs, it is clear that demand for summer learning programs far outpaces supply. Parents overwhelmingly support public funding for programs and, based on parent interest, an estimated 24 million more kids would enroll in summer learning programs if they could. The findings are especially dramatic for low-income and minority youth. While an estimated three million African-American children and 3.3 million Hispanic children participate in summer learning programs, parents of another estimated 4.4 million African-American children and 5.6 million Hispanic children are interested in enrolling their children in a summer learning program. Children who are without access to summer learning programs are at particular risk of losing the academic, social and emotional gains that they have accrued during the school year. In our country today, too many children slip farther and farther behind each summer. Just as afterschool programs have the potential to support student learning, so do summer learning programs. In many cases, the same providers can offer both afterschool and summer learning programs, and kids who participate in afterschool programs are more likely to participate in summer learning programs, too. By increasing our investment in afterschool and summer, we can better ensure that all kids make the most of summer, start each school year better prepared to learn, and maintain that learning advantage throughout the year.
Overall Support for Public
Funding
Neutral
11%
Favor
83%
Oppose 6%

America After 3PM Special Report on Summer: Missed Opportunities, Unmet Demand 7
Topline Findings from Summer Questions in the 2009
America After 3PM Survey
1. During the 2008 summer, did your child(ren) participate in a summer learning program that is a
safe, structured program that provided a variety of activities designed to encourage learning and development during the summer months? Yes ................................................. 25%
No .................................................. 75%
1a. If your child(ren) did not participate in a summer learning program during the 2008 summer, do you have interest in enrolling them in a program in the future?
Yes ................................................. 56%
No .................................................. 44%
Sample population base: 28,336
2. Do you favor or oppose public funding for programs that provide summer learning opportunities to students in communities that have few opportunities for children and youth?
Favor…………………………………...83% Oppose…………………………………6% Don’t Know……………………………11%
Sample population base: 27,654
About America After 3PM Special Report on Summer
America After 3PM Special Report on Summer is sponsored by The Wallace Foundation. All data cited in this report are from the 2009 America After 3PM research, which was sponsored by JCPenney Afterschool. Between March and May 2009, 29,754 parents/guardians responded to survey questions about their after school and summer child care arrangements during the summer of 2008 and the 2008-2009 school year. RTi, a market research firm, conducted the survey and analyzed the data for the Afterschool Alliance. According to U.S. Census data from 2007, the total school-age population is 57.3 million, which is the foundation for the national projections in America After
3PM Special Report on Summer. Additional information from America After 3PM is available at www.afterschoolalliance.org.

America After 3PM Special Report on Summer: Missed Opportunities, Unmet Demand 8
Demand and Support for Summer Learning Programs in Each State Based on responses to questions from the 2009 America After 3PM survey, the following charts detail participation levels, demand and support for summer learning programs in each of the 50 states. The charts also include the estimated number of children participating in summer learning programs in each state and the estimated number of children whose parents are interested in enrolling them in summer learning programs.
Alabama
In Alabama, 574 households were surveyed for this study. Among those households, 44 percent qualified for free or reduced price lunch, 1 percent were Hispanic and 29 percent were African-American. *According to U.S. Department of Education data from 2005-2006, the total school enrollment in Alabama is 804,245, which is the foundation for all statewide projections in Alabama.
Alaska
In Alaska, 269 households were surveyed for this study. Among those households, 26 percent qualified for free or reduced price lunch, 5 percent were Hispanic and 3 percent were African-American. *According to U.S. Department of Education data from 2005-2006, the total school enrollment in Alaska is 136,480, which is the foundation for all statewide projections in Alaska
6 Percent responding does not add up to 100% for this question in each chart in this section because respondents were also given the option to answer “Don’t Know”.
State Level Demand and Support for Summer Learning Programs
Percent
Responding Question YES NO
Estimated Number of Kids*
Does your child participate in a
summer learning program? 21 79
Participating
168,891
If not, are you interested in enrolling
your child in a summer learning
program?
57 43
Whose Parents are Interested in
Enrolling Them
337,783
Do you support public funding for
summer learning programs?6
82 7
State Level Demand and Support for Summer Learning Programs Percent
Responding Question YES NO
Estimated Number of Kids*
Does your child participate in a
summer learning program? 24 76
Participating
32,755
If not, are you interested in enrolling
your child in a summer learning
program? 51 49
Whose Parents are Interested in
Enrolling Them
53,227
Do you support public funding for
summer learning programs? 76 8
America After 3PM Special Report on Summer: Missed Opportunities, Unmet Demand 9
Arizona
In Arizona, 590 households were surveyed for this study. Among those households, 36 percent qualified for free or reduced price lunch, 21 percent were Hispanic and 3 percent were African-American. *According to U.S. Department of Education data from 2005-2006, the total school enrollment in Arizona is 1,132,541, which is the foundation for all statewide projections in Arizona.
Arkansas
In Arkansas, 505 households were surveyed for this study. Among those households, 50 percent qualified for free or reduced price lunch, 2 percent were Hispanic and 17 percent were African-American. *According to U.S. Department of Education data from 2005-2006, the total school enrollment in Arkansas is 486,478, which is the foundation for all statewide projections in Arkansas.
California
In California, 1,166 households were surveyed for this study. Among those households, 39 percent qualified for free or reduced price lunch, 27 percent were Hispanic and 7 percent were African-American. *According to U.S. Department of Education data from 2005-2006, the total school enrollment in California is 6,831,025, which is the foundation for all statewide projections in California.
State Level Demand and Support for Summer Learning Programs Percent
Responding Question YES NO
Estimated Number of Kids*
Does your child participate in a
summer learning program? 22 78
Participating
249,159
If not, are you interested in enrolling
your child in a summer learning
program? 65 35
Whose Parents are Interested in
Enrolling Them
577,596
Do you support public funding for
summer learning programs? 85 4
State Level Demand and Support for Summer Learning Programs Percent
Responding Question YES NO
Estimated Number of Kids*
Does your child participate in a
summer learning program? 17 83
Participating
82,701
If not, are you interested in enrolling
your child in a summer learning
program?
58 42
Whose Parents are Interested in
Enrolling Them
233,509
Do you support public funding for
summer learning programs? 86 4
State Level Demand and Support for Summer Learning Programs Percent
Responding Question YES NO
Estimated Number of Kids*
Does your child participate in a
summer learning program? 27 73
Participating
1,844,377
If not, are you interested in enrolling
your child in a summer learning
program?
66 34
Whose Parents are Interested in
Enrolling Them
3,278,892
Do you support public funding for
summer learning programs? 84 6
America After 3PM Special Report on Summer: Missed Opportunities, Unmet Demand 10
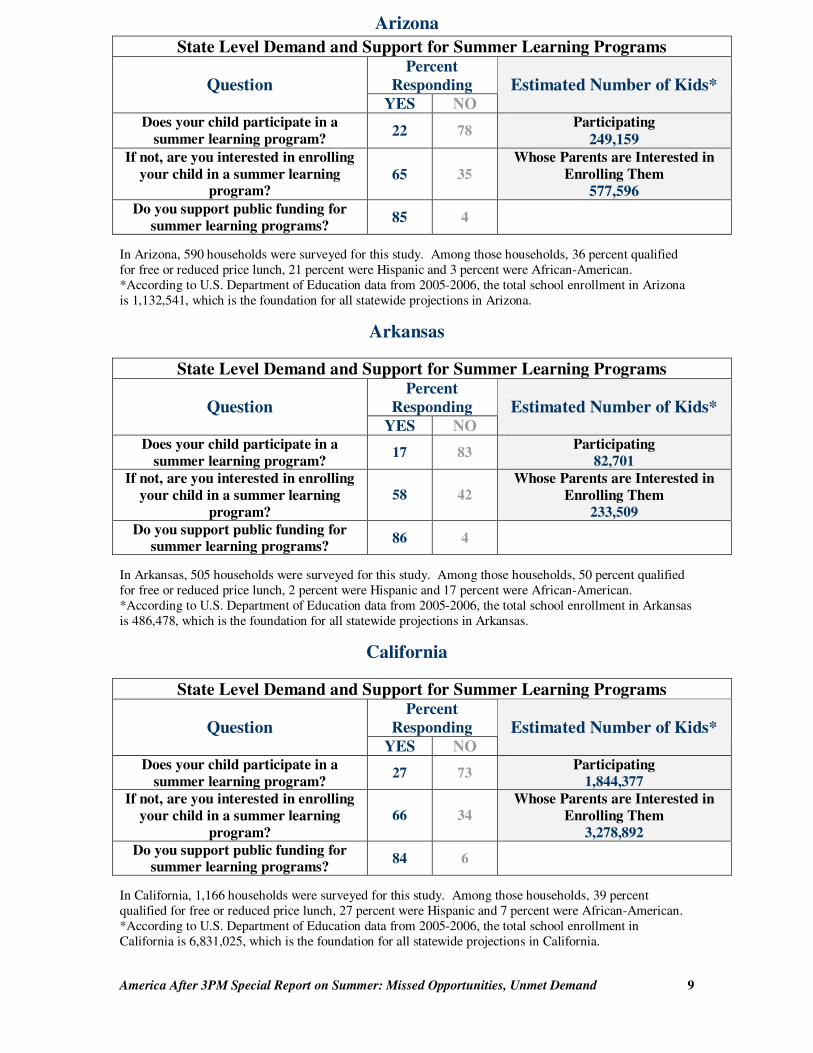
Colorado
In Colorado, 461 households were surveyed for this study. Among those households, 32 percent qualified for free or reduced price lunch, 15 percent were Hispanic and 4 percent were African-American. *According to U.S. Department of Education data from 2005-2006, the total school enrollment in Colorado is 804,244, which is the foundation for all statewide projections in Colorado.
Connecticut
In Connecticut, 497 households were surveyed for this study. Among those households, 26 percent qualified for free or reduced price lunch, 10 percent were Hispanic and 8 percent were African-American. *According to U.S. Department of Education data from 2005-2006, the total school enrollment in Connecticut is 622,445, which is the foundation for all statewide projections in Connecticut.
Delaware
In Delaware, 286 households were surveyed for this study. Among those households, 35 percent qualified for free or reduced price lunch, 4 percent were Hispanic and 22 percent were African-American. *According to U.S. Department of Education data from 2005-2006, the total school enrollment in Delaware is 143,804, which is the foundation for all statewide projections in Delaware.
State Level Demand and Support for Summer Learning Programs Percent
Responding Question YES NO
Estimated Number of Kids*
Does your child participate in a
summer learning program? 17 83
Participating
136,721
If not, are you interested in enrolling
your child in a summer learning
program?
48 52
Whose Parents are Interested in
Enrolling Them
321,698
Do you support public funding for
summer learning programs? 80 6
State Level Demand and Support for Summer Learning Programs Percent
Responding Question YES NO
Estimated Number of Kids*
Does your child participate in a
summer learning program? 33 67
Participating
205,407
If not, are you interested in enrolling
your child in a summer learning
program?
46 54
Whose Parents are Interested in
Enrolling Them
192,958
Do you support public funding for
summer learning programs? 85 5
State Level Demand and Support for Summer Learning Programs Percent
Responding Question YES NO
Estimated Number of Kids*
Does your child participate in a
summer learning program? 30 70
Participating
43,141
If not, are you interested in enrolling
your child in a summer learning
program?
54 46
Whose Parents are Interested in
Enrolling Them
54,646
Do you support public funding for
summer learning programs? 79 8

America After 3PM Special Report on Summer: Missed Opportunities, Unmet Demand 11
Florida
In Florida, 1,153 households were surveyed for this study. Among those households, 42 percent qualified for free or reduced price lunch, 17 percent were Hispanic and 15 percent were African-American. *According to U.S. Department of Education data from 2005-2006, the total school enrollment in Florida is 2,923,440, which is the foundation for all statewide projections in Florida.
Georgia
In Georgia, 577 households were surveyed for this study. Among those households, 42 percent qualified for free or reduced price lunch, 5 percent were Hispanic and 32 percent were African-American. *According to U.S. Department of Education data from 2005-2006, the total school enrollment in Georgia is 1,670,846, which is the foundation for all statewide projections in Georgia.
Hawaii
In Hawaii, 181 households were surveyed for this study. Among those households, 23 percent qualified for free or reduced price lunch, 4 percent were Hispanic and 0 percent was African-American. *According to U.S. Department of Education data from 2005-2006, the total school enrollment in Hawaii is 209,343, which is the foundation for all statewide projections in Hawaii.
State Level Demand and Support for Summer Learning Programs Percent
Responding Question YES NO
Estimated Number of Kids*
Does your child participate in a
summer learning program? 27 73
Participating
789,329
If not, are you interested in enrolling
your child in a summer learning
program?
62 38
Whose Parents are Interested in
Enrolling Them
1,315,548
Do you support public funding for
summer learning programs? 85 5
State Level Demand and Support for Summer Learning Programs Percent
Responding Question YES NO
Estimated Number of Kids*
Does your child participate in a
summer learning program? 21 79
Participating
350,878
If not, are you interested in enrolling
your child in a summer learning
program?
62 38
Whose Parents are Interested in
Enrolling Them
818,715
Do you support public funding for
summer learning programs? 86 6
State Level Demand and Support for Summer Learning Programs Percent
Responding Question YES NO
Estimated Number of Kids*
Does your child participate in a
summer learning program? 39 61
Participating
81,644
If not, are you interested in enrolling
your child in a summer learning
program?
64 36
Whose Parents are Interested in
Enrolling Them
81,644
Do you support public funding for
summer learning programs? 82 6
America After 3PM Special Report on Summer: Missed Opportunities, Unmet Demand 12
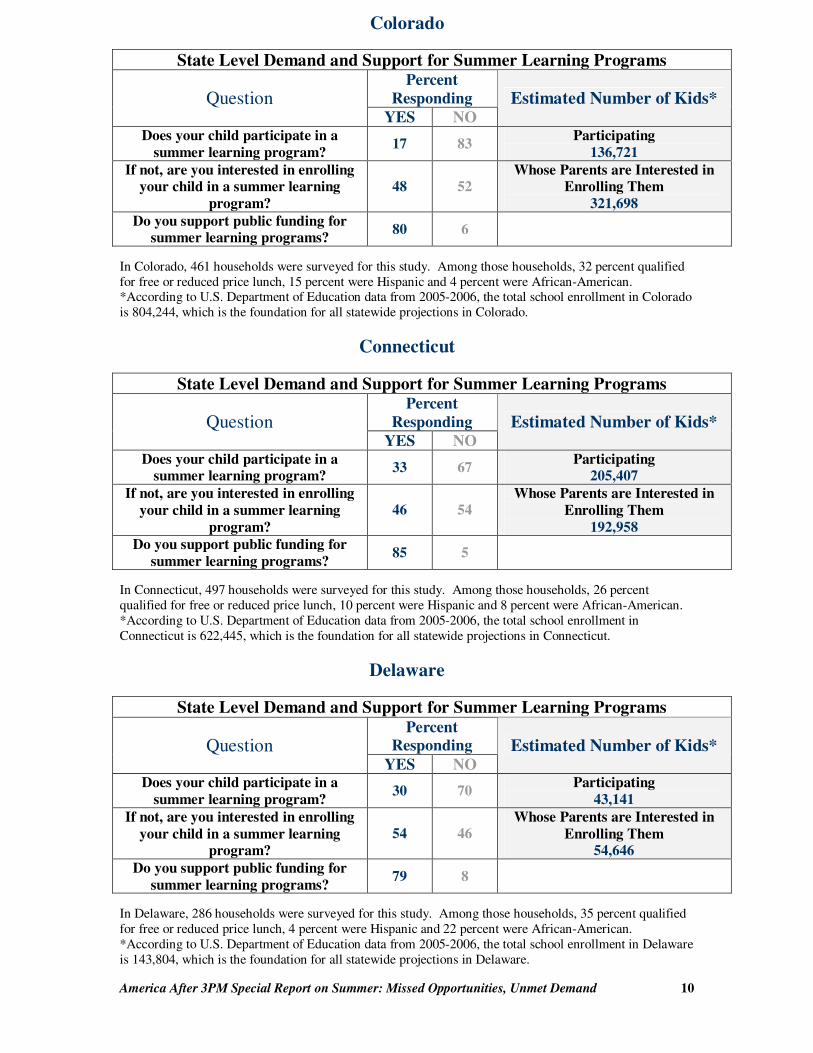
Idaho
In Idaho, 496 households were surveyed for this study. Among those households, 40 percent qualified for free or reduced price lunch, 1 percent was Hispanic and 0 percent was African-American. *According to U.S. Department of Education data from 2005-2006, the total school enrollment in Idaho is 269,263, which is the foundation for all statewide projections in Idaho.
Illinois
In Illinois, 750 households were surveyed for this study. Among those households, 37 percent qualified for free or reduced price lunch, 12 percent were Hispanic and 14 percent were African-American. *According to U.S. Department of Education data from 2005-2006, the total school enrollment in Illinois is 2,284,610, which is the foundation for all statewide projections in Illinois.
Indiana
In Indiana, 730 households were surveyed for this study. Among those households, 31 percent qualified for free or reduced price lunch, 3 percent were Hispanic and 8 percent were African-American. *According to U.S. Department of Education data from 2005-2006, the total school enrollment in Indiana is 1,123,792, which is the foundation for all statewide projections in Indiana.
State Level Demand and Support for Summer Learning Programs Percent
Responding Question YES NO
Estimated Number of Kids*
Does your child participate in a
summer learning program? 17 83
Participating
45,775
If not, are you interested in enrolling
your child in a summer learning
program?
52 48
Whose Parents are Interested in
Enrolling Them
115,783
Do you support public funding for
summer learning programs? 78 8
State Level Demand and Support for Summer Learning Programs Percent
Responding Question YES NO
Estimated Number of Kids*
Does your child participate in a
summer learning program? 24 76
Participating
548,306
If not, are you interested in enrolling
your child in a summer learning
program?
54 46
Whose Parents are Interested in
Enrolling Them
936,690
Do you support public funding for
summer learning programs? 81 5
State Level Demand and Support for Summer Learning Programs Percent
Responding Question YES NO
Estimated Number of Kids*
Does your child participate in a
summer learning program? 20 80
Participating
224,758
If not, are you interested in enrolling
your child in a summer learning
program?
49 51
Whose Parents are Interested in
Enrolling Them
438,279
Do you support public funding for
summer learning programs? 79 8

America After 3PM Special Report on Summer: Missed Opportunities, Unmet Demand 13
Iowa
In Iowa, 620 households were surveyed for this study. Among those households, 36 percent qualified for free or reduced price lunch, 2 percent were Hispanic and 1 percent was African-American. *According to U.S. Department of Education data from 2005-2006, the total school enrollment in Iowa is 518,951, which is the foundation for all statewide projections in Iowa.
Kansas
In Kansas, 602 households were surveyed for this study. Among those households, 39 percent qualified for free or reduced price lunch, 5 percent were Hispanic and 6 percent were African-American. *According to U.S. Department of Education data from 2005-2006, the total school enrollment in Kansas is 487,325, which is the foundation for all statewide projections in Kansas.
Kentucky
In Kentucky, 613 households were surveyed for this study. Among those households, 49 percent qualified for free or reduced price lunch, 1 percent was Hispanic and 8 percent were African-American. *According to U.S. Department of Education data from 2005-2006, the total school enrollment in Kentucky is 700,099, which is the foundation for all statewide projections in Kentucky.
State Level Demand and Support for Summer Learning Programs Percent
Responding Question YES NO
Estimated Number of Kids*
Does your child participate in a
summer learning program? 21 79
Participating
108,980
If not, are you interested in enrolling
your child in a summer learning
program?
51 49
Whose Parents are Interested in
Enrolling Them
207,580
Do you support public funding for
summer learning programs? 77 7
State Level Demand and Support for Summer Learning Programs Percent
Responding Question YES NO
Estimated Number of Kids*
Does your child participate in a
summer learning program? 23 77
Participating
112,085
If not, are you interested in enrolling
your child in a summer learning
program?
42 58
Whose Parents are Interested in
Enrolling Them
155,944
Do you support public funding for
summer learning programs? 80 6
State Level Demand and Support for Summer Learning Programs Percent
Responding Question YES NO
Estimated Number of Kids*
Does your child participate in a
summer learning program? 15 85
Participating
105,015
If not, are you interested in enrolling
your child in a summer learning
program?
49 51
Whose Parents are Interested in
Enrolling Them
294,042
Do you support public funding for
summer learning programs? 82 6
America After 3PM Special Report on Summer: Missed Opportunities, Unmet Demand 14
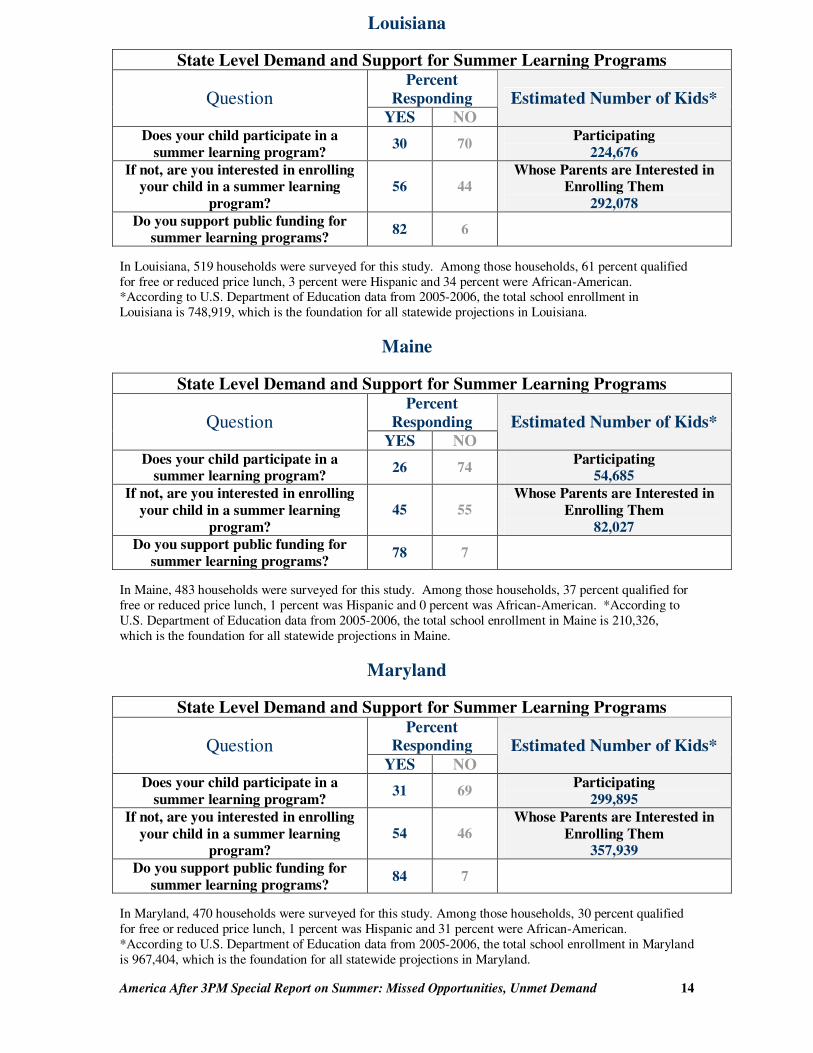
Louisiana
In Louisiana, 519 households were surveyed for this study. Among those households, 61 percent qualified for free or reduced price lunch, 3 percent were Hispanic and 34 percent were African-American. *According to U.S. Department of Education data from 2005-2006, the total school enrollment in Louisiana is 748,919, which is the foundation for all statewide projections in Louisiana.
Maine
In Maine, 483 households were surveyed for this study. Among those households, 37 percent qualified for free or reduced price lunch, 1 percent was Hispanic and 0 percent was African-American. *According to U.S. Department of Education data from 2005-2006, the total school enrollment in Maine is 210,326, which is the foundation for all statewide projections in Maine.
Maryland
In Maryland, 470 households were surveyed for this study. Among those households, 30 percent qualified for free or reduced price lunch, 1 percent was Hispanic and 31 percent were African-American. *According to U.S. Department of Education data from 2005-2006, the total school enrollment in Maryland is 967,404, which is the foundation for all statewide projections in Maryland.
State Level Demand and Support for Summer Learning Programs Percent
Responding Question YES NO
Estimated Number of Kids*
Does your child participate in a
summer learning program? 30 70
Participating
224,676
If not, are you interested in enrolling
your child in a summer learning
program?
56 44
Whose Parents are Interested in
Enrolling Them
292,078
Do you support public funding for
summer learning programs? 82 6
State Level Demand and Support for Summer Learning Programs Percent
Responding Question YES NO
Estimated Number of Kids*
Does your child participate in a
summer learning program? 26 74
Participating
54,685
If not, are you interested in enrolling
your child in a summer learning
program?
45 55
Whose Parents are Interested in
Enrolling Them
82,027
Do you support public funding for
summer learning programs? 78 7
State Level Demand and Support for Summer Learning Programs Percent
Responding Question YES NO
Estimated Number of Kids*
Does your child participate in a
summer learning program? 31 69
Participating
299,895
If not, are you interested in enrolling
your child in a summer learning
program?
54 46
Whose Parents are Interested in
Enrolling Them
357,939
Do you support public funding for
summer learning programs? 84 7

America After 3PM Special Report on Summer: Missed Opportunities, Unmet Demand 15
Massachusetts
In Massachusetts, 509 households were surveyed for this study. Among those households, 32 percent qualified for free or reduced price lunch, 8 percent were Hispanic and 6 percent were African-American. *According to U.S. Department of Education data from 2005-2006, the total school enrollment in Massachusetts is 1,066,834, the foundation for all statewide projections in Massachusetts.
Michigan
In Michigan, 669 households were surveyed for this study. Among those households, 39 percent qualified for free or reduced price lunch, 3 percent were Hispanic and 15 percent were African-American. *According to U.S. Department of Education data from 2005-2006, the total school enrollment in Michigan is 1,814,472, which is the foundation for all statewide projections in Michigan.
Minnesota
In Minnesota, 691 households were surveyed for this study. Among those households, 26 percent qualified for free or reduced price lunch, 2 percent were Hispanic and 3 percent were African-American. *According to U.S. Department of Education data from 2005-2006, the total school enrollment in Minnesota is 911,314, which is the foundation for all statewide projections in Minnesota.
State Level Demand and Support for Summer Learning Programs Percent
Responding Question YES NO
Estimated Number of Kids*
Does your child participate in a
summer learning program? 30 70
Participating
330,719
If not, are you interested in enrolling
your child in a summer learning
program?
51 49
Whose Parents are Interested in
Enrolling Them
394,729
Do you support public funding for
summer learning programs? 84 6
State Level Demand and Support for Summer Learning Programs Percent
Responding Question YES NO
Estimated Number of Kids*
Does your child participate in a
summer learning program? 23 77
Participating
417,329
If not, are you interested in enrolling
your child in a summer learning
program?
52 48
Whose Parents are Interested in
Enrolling Them
725,789
Do you support public funding for
summer learning programs? 81 6
State Level Demand and Support for Summer Learning Programs Percent
Responding Question YES NO
Estimated Number of Kids*
Does your child participate in a
summer learning program? 28 72
Participating
255,168
If not, are you interested in enrolling
your child in a summer learning
program?
47 53
Whose Parents are Interested in
Enrolling Them
309,847
Do you support public funding for
summer learning programs? 76 9

America After 3PM Special Report on Summer: Missed Opportunities, Unmet Demand 16
Mississippi
In Mississippi, 452 households were surveyed for this study. Among those households, 54 percent qualified for free or reduced price lunch, 0 percent were Hispanic and 40 percent were African-American. *According to U.S. Department of Education data from 2005-2006, the total school enrollment in Mississippi is 522,788, which is the foundation for all statewide projections in Mississippi.
Missouri
In Missouri, 666 households were surveyed for this study. Among those households, 43 percent qualified for free or reduced price lunch, 2 percent were Hispanic and 12 percent were African-American. *According to U.S. Department of Education data from 2005-2006, the total school enrollment in Missouri is 1,007,223, which is the foundation for all statewide projections in Missouri.
Montana
In Montana, 359 households were surveyed for this study. Among those households, 32 percent qualified for free or reduced price lunch, 1 percent was Hispanic and 1 percent was African-American. *According to U.S. Department of Education data from 2005-2006, the total school enrollment in Montana is 153,331, which is the foundation for all statewide projections in Montana.
State Level Demand and Support for Summer Learning Programs Percent
Responding Question YES NO
Estimated Number of Kids*
Does your child participate in a
summer learning program? 20 60
Participating
104,558
If not, are you interested in enrolling
your child in a summer learning
program?
64 36
Whose Parents are Interested in
Enrolling Them
266,622
Do you support public funding for
summer learning programs? 83 5
State Level Demand and Support for Summer Learning Programs Percent
Responding Question YES NO
Estimated Number of Kids*
Does your child participate in a
summer learning program? 35 65
Participating
352,528
If not, are you interested in enrolling
your child in a summer learning
program?
54 46
Whose Parents are Interested in
Enrolling Them
352,528
Do you support public funding for
summer learning programs? 82 6
State Level Demand and Support for Summer Learning Programs Percent
Responding Question YES NO
Estimated Number of Kids*
Does your child participate in a
summer learning program? 21 79
Participating
32,200
If not, are you interested in enrolling
your child in a summer learning
program?
51 49
Whose Parents are Interested in
Enrolling Them
61,332
Do you support public funding for
summer learning programs? 78 9

America After 3PM Special Report on Summer: Missed Opportunities, Unmet Demand 17
Nebraska
In Nebraska, 571 households were surveyed for this study. Among those households, 34 percent qualified for free or reduced price lunch, 1 percent was Hispanic and 3 percent were African-American. *According to U.S. Department of Education data from 2005-2006, the total school enrollment in Nebraska is 316,778, which is the foundation for all statewide projections in Nebraska.
Nevada
In Nevada, 388 households were surveyed for this study. Among those households, 46 percent qualified for free or reduced price lunch, 17 percent were Hispanic and 7 percent were African-American. *According to U.S. Department of Education data from 2005-2006, the total school enrollment in Nevada is 427,929, which is the foundation for all statewide projections in Nevada.
New Hampshire
In New Hampshire, 359 households were surveyed for this study. Among those households, 24 percent qualified for free or reduced price lunch, 1 percent were Hispanic and 0 percent were African-American. *According to U.S. Department of Education data from 2005-2006, the total school enrollment in New Hampshire is 224,877, which is the foundation for all statewide projections in New Hampshire.
State Level Demand and Support for Summer Learning Programs Percent
Responding Question YES NO
Estimated Number of Kids*
Does your child participate in a
summer learning program? 25 75
Participating
79,195
If not, are you interested in enrolling
your child in a summer learning
program?
47 53
Whose Parents are Interested in
Enrolling Them
110,872
Do you support public funding for
summer learning programs? 78 7
State Level Demand and Support for Summer Learning Programs Percent
Responding Question YES NO
Estimated Number of Kids*
Does your child participate in a
summer learning program? 15 85
Participating
64,189
If not, are you interested in enrolling
your child in a summer learning
program?
61 39
Whose Parents are Interested in
Enrolling Them
222,523
Do you support public funding for
summer learning programs? 83 4
State Level Demand and Support for Summer Learning Programs Percent
Responding Question YES NO
Estimated Number of Kids*
Does your child participate in a
summer learning program? 29 71
Participating
65,214
If not, are you interested in enrolling
your child in a summer learning
program?
42 58
Whose Parents are Interested in
Enrolling Them
67,463
Do you support public funding for
summer learning programs? 74 8

America After 3PM Special Report on Summer: Missed Opportunities, Unmet Demand 18
New Jersey
In New Jersey, 574 households were surveyed for this study. Among those households, 32 percent qualified for free or reduced price lunch, 13 percent were Hispanic and 13 percent were African-American. *According to U.S. Department of Education data from 2005-2006, the total school enrollment in New Jersey is 1,485,297, which is the foundation for all statewide projections in New Jersey.
New Mexico
In New Mexico, 390 households were surveyed for this study. Among those households, 47 percent qualified for free or reduced price lunch, 34 percent were Hispanic and 1 percent was African-American. *According to U.S. Department of Education data from 2005-2006, the total school enrollment in New Mexico is 340,109, which is the foundation for all statewide projections in New Mexico.
New York
In New York, 971 households were surveyed for this study. Among those households, 45 percent qualified for free or reduced price lunch, 15 percent were Hispanic and 15 percent were African-American. *According to U.S. Department of Education data from 2005-2006, the total school enrollment in New York is 3,068,034, which is the foundation for all statewide projections in New York.
State Level Demand and Support for Summer Learning Programs Percent
Responding Question YES NO
Estimated Number of Kids*
Does your child participate in a
summer learning program? 33 67
Participating
490,148
If not, are you interested in enrolling
your child in a summer learning
program?
52 48
Whose Parents are Interested in
Enrolling Them
519,854
Do you support public funding for
summer learning programs? 82 6
State Level Demand and Support for Summer Learning Programs Percent
Responding Question YES NO
Estimated Number of Kids*
Does your child participate in a
summer learning program? 28 72
Participating
95,231
If not, are you interested in enrolling
your child in a summer learning
program?
63 37
Whose Parents are Interested in
Enrolling Them
153,049
Do you support public funding for
summer learning programs? 88 5
State Level Demand and Support for Summer Learning Programs Percent
Responding Question YES NO
Estimated Number of Kids*
Does your child participate in a
summer learning program? 31 69
Participating
951,091
If not, are you interested in enrolling
your child in a summer learning
program?
57 43
Whose Parents are Interested in
Enrolling Them
1,196,533
Do you support public funding for
summer learning programs? 85 4

America After 3PM Special Report on Summer: Missed Opportunities, Unmet Demand 19
North Carolina
In North Carolina, 688 households were surveyed for this study. Among those households, 40 percent qualified for free or reduced price lunch, 3 percent were Hispanic and 24 percent were African-American. *According to U.S. Department of Education data from 2005-2006, the total school enrollment in North Carolina is 1,498,950, which is the foundation for all statewide projections in North Carolina.
North Dakota
In North Dakota, 290 households were surveyed for this study. Among those households, 33 percent qualified for free or reduced price lunch, 1 percent was Hispanic and 1 percent was African-American. *According to U.S. Department of Education data from 2005-2006, the total school enrollment in North Dakota is 103,268, which is the foundation for all statewide projections in North Dakota.
Ohio
In Ohio, 851 households were surveyed for this study. Among those households, 34 percent qualified for free or reduced price lunch, 3 percent were Hispanic and 13 percent were African-American. *According to U.S. Department of Education data from 2005-2006, the total school enrollment in Ohio is 2,015,421, which is the foundation for all statewide projections in Ohio.
State Level Demand and Support for Summer Learning Programs Percent
Responding Question YES NO
Estimated Number of Kids*
Does your child participate in a
summer learning program? 18 82
Participating
269,811
If not, are you interested in enrolling
your child in a summer learning
program?
56 44
Whose Parents are Interested in
Enrolling Them
689,517
Do you support public funding for
summer learning programs? 83 5
State Level Demand and Support for Summer Learning Programs Percent
Responding Question YES NO
Estimated Number of Kids*
Does your child participate in a
summer learning program? 27 73
Participating
27,882
If not, are you interested in enrolling
your child in a summer learning
program?
40 60
Whose Parents are Interested in
Enrolling Them
29,948
Do you support public funding for
summer learning programs? 72 6
State Level Demand and Support for Summer Learning Programs Percent
Responding Question YES NO
Estimated Number of Kids*
Does your child participate in a
summer learning program? 22 78
Participating
443,393
If not, are you interested in enrolling
your child in a summer learning
program?
50 50
Whose Parents are Interested in
Enrolling Them
786,014
Do you support public funding for
summer learning programs? 80 7

America After 3PM Special Report on Summer: Missed Opportunities, Unmet Demand 20
Oklahoma
In Oklahoma, 546 households were surveyed for this study. Among those households, 48 percent qualified for free or reduced price lunch, 6 percent were Hispanic and 8 percent were African-American. *According to U.S. Department of Education data from 2005-2006, the total school enrollment in Oklahoma is 624,770, which is the foundation for all statewide projections in Oklahoma.
Oregon
In Oregon, 543 households were surveyed for this study. Among those households, 36 percent qualified for free or reduced price lunch, 8 percent were Hispanic and 2 percent were African-American. *According to U.S. Department of Education data from 2005-2006, the total school enrollment in Oregon is 593,466, which is the foundation for all statewide projections in Oregon.
Pennsylvania
In Pennsylvania, 896 households were surveyed for this study. Among those households, 34 percent qualified for free or reduced price lunch, 4 percent were Hispanic and 10 percent were African-American. *According to U.S. Department of Education data from 2005-2006, the total school enrollment in Pennsylvania is 2,083,250, the foundation for all statewide projections in Pennsylvania.
State Level Demand and Support for Summer Learning Programs Percent
Responding Question YES NO
Estimated Number of Kids*
Does your child participate in a
summer learning program? 20 80
Participating
124,954
If not, are you interested in enrolling
your child in a summer learning
program?
58 42
Whose Parents are Interested in
Enrolling Them
287,394
Do you support public funding for
summer learning programs? 84 6
State Level Demand and Support for Summer Learning Programs Percent
Responding Question YES NO
Estimated Number of Kids*
Does your child participate in a
summer learning program? 23 77
Participating
136,497
If not, are you interested in enrolling
your child in a summer learning
program?
48 52
Whose Parents are Interested in
Enrolling Them
219,582
Do you support public funding for
summer learning programs? 76 9
State Level Demand and Support for Summer Learning Programs Percent
Responding Question YES NO
Estimated Number of Kids*
Does your child participate in a
summer learning program? 26 74
Participating
541,645
If not, are you interested in enrolling
your child in a summer learning
program?
49 51
Whose Parents are Interested in
Enrolling Them
749,970
Do you support public funding for
summer learning programs? 83 5

America After 3PM Special Report on Summer: Missed Opportunities, Unmet Demand 21
Rhode Island
In Rhode Island, 334 households were surveyed for this study. Among those households, 31 percent qualified for free or reduced price lunch, 9 percent were Hispanic and 1 percent was African-American. *According to U.S. Department of Education data from 2005-2006, the total school enrollment in Rhode Island is 175,902, which is the foundation for all statewide projections in Rhode Island.
South Carolina
In South Carolina, 567 households were surveyed for this study. Among those households, 50 percent qualified for free or reduced price lunch, 2 percent were Hispanic and 33 percent were African-American. *According to U.S. Department of Education data from 2005-2006, the total school enrollment in South Carolina is 729,331, which is the foundation for all statewide projections in South Carolina.
South Dakota
In South Dakota, 327 households were surveyed for this study. Among those households, 34 percent qualified for free or reduced price lunch, 0 percent were Hispanic and 0 percent were African-American. *According to U.S. Department of Education data from 2005-2006, the total school enrollment in South Dakota is 131,284, which is the foundation for all statewide projections in South Dakota.
State Level Demand and Support for Summer Learning Programs Percent
Responding Question YES NO
Estimated Number of Kids*
Does your child participate in a
summer learning program? 36 64
Participating
63,325
If not, are you interested in enrolling
your child in a summer learning
program?
44 56
Whose Parents are Interested in
Enrolling Them
49,253
Do you support public funding for
summer learning programs? 81 8
State Level Demand and Support for Summer Learning Programs Percent
Responding Question YES NO
Estimated Number of Kids*
Does your child participate in a
summer learning program? 25 75
Participating
182,333
If not, are you interested in enrolling
your child in a summer learning
program?
59 41
Whose Parents are Interested in
Enrolling Them
320,906
Do you support public funding for
summer learning programs? 80 7
State Level Demand and Support for Summer Learning Programs Percent
Responding Question YES NO
Estimated Number of Kids*
Does your child participate in a
summer learning program? 22 78
Participating
28,882
If not, are you interested in enrolling
your child in a summer learning
program?
44 56
Whose Parents are Interested in
Enrolling Them
44,637
Do you support public funding for
summer learning programs? 70 11

America After 3PM Special Report on Summer: Missed Opportunities, Unmet Demand 22
Tennessee
In Tennessee, 570 households were surveyed for this study. Among those households, 47 percent qualified for free or reduced price lunch, 1 percent was Hispanic and 18 percent were African-American. *According to U.S. Department of Education data from 2005-2006, the total school enrollment in Tennessee is 1,014,849, which is the foundation for all statewide projections in Tennessee.
Texas
In Texas, 1,129 households were surveyed for this study. Among those households, 51 percent qualified for free or reduced price lunch, 25 percent were Hispanic and 11 percent were African-American. *According to U.S. Department of Education data from 2005-2006, the total school enrollment in Texas is 4,526,595, which is the foundation for all statewide projections in Texas.
Utah
In Utah, 746 households were surveyed for this study. Among those households, 29 percent qualified for free or reduced price lunch, 7 percent were Hispanic and 1 percent was African-American. *According to U.S. Department of Education data from 2005-2006, the total school enrollment in Utah is 520,526, which is the foundation for all statewide projections in Utah.
State Level Demand and Support for Summer Learning Programs Percent
Responding Question YES NO
Estimated Number of Kids*
Does your child participate in a
summer learning program? 19 81
Participating
192,821
If not, are you interested in enrolling
your child in a summer learning
program?
56 44
Whose Parents are Interested in
Enrolling Them
456,682
Do you support public funding for
summer learning programs? 85 5
State Level Demand and Support for Summer Learning Programs Percent
Responding Question YES NO
Estimated Number of Kids*
Does your child participate in a
summer learning program? 24 76
Participating
1,086,383
If not, are you interested in enrolling
your child in a summer learning
program?
62 38
Whose Parents are Interested in
Enrolling Them
2,127,500
Do you support public funding for
summer learning programs? 84 6
State Level Demand and Support for Summer Learning Programs Percent
Responding Question YES NO
Estimated Number of Kids*
Does your child participate in a
summer learning program? 16 84
Participating
83,284
If not, are you interested in enrolling
your child in a summer learning
program?
55 45
Whose Parents are Interested in
Enrolling Them
244,647
Do you support public funding for
summer learning programs? 76 8

America After 3PM Special Report on Summer: Missed Opportunities, Unmet Demand 23
Vermont
In Vermont, 256 households were surveyed for this study. Among those households, 24 percent qualified for free or reduced price lunch, 1 percent was Hispanic and 1 percent was African-American. *According to U.S. Department of Education data from 2005-2006, the total school enrollment in Vermont is 101,706, which is the foundation for all statewide projections in Vermont.
Virginia
In Virginia, 562 households were surveyed for this study. Among those households, 36 percent qualified for free or reduced price lunch, 4 percent were Hispanic and 21 percent were African-American. *According to U.S. Department of Education data from 2005-2006, the total school enrollment in Virginia is 1,292,883, which is the foundation for all statewide projections in Virginia.
Washington
In Washington, 596 households were surveyed for this study. Among those households, 40 percent qualified for free or reduced price lunch, 6 percent were Hispanic and 1 percent were African-American. *According to U.S. Department of Education data from 2005-2006, the total school enrollment in Washington is 1,099,167, which is the foundation for all statewide projections in Washington.
State Level Demand and Support for Summer Learning Programs Percent
Responding Question YES NO
Estimated Number of Kids*
Does your child participate in a
summer learning program? 31 69
Participating
31,529
If not, are you interested in enrolling
your child in a summer learning
program?
43 57
Whose Parents are Interested in
Enrolling Them
30,512
Do you support public funding for
summer learning programs? 80 8
State Level Demand and Support for Summer Learning Programs Percent
Responding Question YES NO
Estimated Number of Kids*
Does your child participate in a
summer learning program? 26 74
Participating
336,150
If not, are you interested in enrolling
your child in a summer learning
program?
54 46
Whose Parents are Interested in
Enrolling Them
517,153
Do you support public funding for
summer learning programs? 84 6
State Level Demand and Support for Summer Learning Programs Percent
Responding Question YES NO
Estimated Number of Kids*
Does your child participate in a
summer learning program? 21 79
Participating
230,825
If not, are you interested in enrolling
your child in a summer learning
program?
49 51
Whose Parents are Interested in
Enrolling Them
428,675
Do you support public funding for
summer learning programs? 79 6

America After 3PM Special Report on Summer: Missed Opportunities, Unmet Demand 24
West Virginia
In West Virginia, 678 households were surveyed for this study. Among those households, 57 percent qualified for free or reduced price lunch, 1 percent were Hispanic and 2 percent were African-American. *According to U.S. Department of Education data from 2005-2006, the total school enrollment in West Virginia is 285,212, which is the foundation for all statewide projections in West Virginia.
Wisconsin
In Wisconsin, 593 households were surveyed for this study. Among those households, 28 percent qualified for free or reduced price lunch, 3 percent were Hispanic and 7 percent were African-American. *According to U.S. Department of Education data from 2005-2006, the total school enrollment in Wisconsin is 963,614, which is the foundation for all statewide projections in Wisconsin.
Wyoming
In Wyoming, 176 households were surveyed for this study. Among those households, 34 percent qualified for free or reduced price lunch, 5 percent were Hispanic and 1 percent was African-American. According to U.S. Department of Education data from 2005-2006, the total school enrollment in Wyoming is 85,582, which is the foundation for all statewide projections in Wyoming After 3PM.
State Level Demand and Support for Summer Learning Programs Percent
Responding Question YES NO
Estimated Number of Kids*
Does your child participate in a
summer learning program? 16 84
Participating
45,634
If not, are you interested in enrolling
your child in a summer learning
program?
52 48
Whose Parents are Interested in
Enrolling Them
125,493
Do you support public funding for
summer learning programs? 82 5
State Level Demand and Support for Summer Learning Programs Percent
Responding Question YES NO
Estimated Number of Kids*
Does your child participate in a
summer learning program? 31 69
Participating
298,720
If not, are you interested in enrolling
your child in a summer learning
program?
49 51
Whose Parents are Interested in
Enrolling Them
327,629
Do you support public funding for
summer learning programs? 76 8
State Level Demand and Support for Summer Learning Programs Percent
Responding Question YES NO
Estimated Number of Kids*
Does your child participate in a
summer learning program? 30 70
Participating
25,675
If not, are you interested in enrolling
your child in a summer learning
program?
47 53
Whose Parents are Interested in
Enrolling Them
28,242
Do you support public funding for
summer learning programs? 76 7