Embed Size (px)
Citation preview

ORIGINAL ARTICLE
Species-specific responses to landscape fragmentation:implications for management strategies
Simon Blanchet,1,2,* Olivier Rey,2,3,* Roselyne Etienne,2 Sovan Lek2 and Geraldine Loot2
1 Eco-Ex Moulis, Station d’Ecologie Experimentale du CNRS a Moulis, U.S.R. 2936, Moulis, France
2 Laboratoire Evolution et Diversite Biologique, U.M.R 5174, C.N.R.S – Universite Paul Sabatier, Toulouse cedex 4, France
3 Centre de Biologie et de Gestion des Populations, Campus International de Baillarguet, Montferrier-sur-Lez Cedex, France
Introduction
Habitat fragmentation is probably the most pervasive
effect humans impose on wild species (Vitousek et al.
1997; Lawler et al. 2006). It is also among the most highly
studied phenomenon of the process of global change, and
many studies have improved our knowledge on the eco-
logical and evolutionary outcomes of fragmented popula-
tions (Fahrig 2003; Ewers and Didham 2006; Lawler et al.
2006). Typically, at the meta-population scale, habitat
fragmentation causes habitat patches to be reduced in size
and to be isolated from one another, hence decreasing
gene flow between patches (Fahrig 2003). For most spe-
cies, this spatial rearrangement also decreases the effective
population size as well as genetic diversity at the patch
scale, through the processes of genetic drift and inbreed-
ing (Frankham 1998; Couvet 2002; DiBattista 2008).
Ultimately, in the better cases, changes in the genetic
structure of connected populations modify their evolu-
tionary trajectory (by changes in life-history characteris-
tics for instance Johansson et al. 2007; Waples et al.
2008), or in the worst cases, lead to local extinction
(Spielman et al. 2004).
An important question that needs to be resolved for
predicting the ecological and evolutionary damages caused
by habitat fragmentation is as follows: is the response to
habitat fragmentation species-specific? Answering this
question is essential for ecological managers as it allows
the identification of ‘umbrella species’ (i.e. species whose
environmental requirements encapsulate the needs of
Keywords
cultural context, cyprinids, dams, genetic
structure, historical monument, meta-analysis,
river restoration, umbrella species, weirs.
Correspondence
Simon Blanchet, Eco-Ex Moulis, Station
d’Ecologie Experimentale du CNRS a Moulis,
U.S.R. 2936, 09200 Moulis, France.
Tel.: + 33 5 61 55 85 81;
fax: + 33 5 61 55 67 28;
e-mail: [email protected]
*These authors contributed equally to this
work.
Received: 15 June 2009
Accepted: 16 November 2009
First published online: 25 January 2010
doi:10.1111/j.1752-4571.2009.00110.x
Abstract
Habitat fragmentation affects the integrity of many species, but little is known
about species-specific sensitivity to fragmentation. Here, we compared the
genetic structure of four freshwater fish species differing in their body size
(Leuciscus cephalus; Leuciscus leuciscus; Gobio gobio and Phoxinus phoxinus)
between a fragmented and a continuous landscape. We tested if, overall, frag-
mentation affected the genetic structure of these fish species, and if these spe-
cies differed in their sensitivity to fragmentation. Fragmentation negatively
affected the genetic structure of these species. Indeed, irrespective of the species
identity, allelic richness and heterozygosity were lower, and population diver-
gence was higher in the fragmented than in the continuous landscape. This
response to fragmentation was highly species-specific, with the smallest fish
species (P. phoxinus) being slightly affected by fragmentation. On the contrary,
fish species of intermediate body size (L. leuciscus and G. gobio) were highly
affected, whereas the largest fish species (L. cephalus) was intermediately
affected by fragmentation. We discuss the relative role of dispersal ability and
effective population size on the responses to fragmentation we report here. The
weirs studied here are of considerable historical importance. We therefore
conclude that restoration programmes will need to consider both this societal
context and the biological characteristics of the species sharing this ecosystem.
Evolutionary Applications ISSN 1752-4571
ª 2010 Blackwell Publishing Ltd 3 (2010) 291–304 291

most other species) that are used to define the appropri-
ate ways landscapes must be managed for preserving
diversity (Lambeck 1997). Indeed, several phenotypic
traits can make a species more or less susceptible to habi-
tat fragmentation. Body size is one such trait because it
correlates with several characteristics of individuals or
populations (e.g. dispersal, effective population size or
trophic status) that are known to affect species sensibility
to fragmentation (Davies et al. 2000; Henle et al. 2004;
Ewers and Didham 2006). For instance, all things being
equal, theory predicts that large-bodied species should
have a higher dispersal capability enabling them to rescue
or re-colonize distant patches and hence to support patch
isolation, even in a highly fragmented habitat (reviewed
in Ewers and Didham 2006; Henle et al. 2004). Alterna-
tively, large-bodied species often have a small population
size (Cotgreave 1993; Blackburn and Gaston 1997), and
rare species are expected to be more sensitive to fragmen-
tation, probably because of their low effective population
size (Ne) (Davies et al. 2000). However, empirical studies
testing the hypothesis that body size underlies species-spe-
cific responses to fragmentation remain scant because
most studies target single species (but see Davies et al.
2000).
Fragmentation caused by humans is particularly preva-
lent in freshwater ecosystems (Nilsson et al. 2005).
Indeed, for a very long time, humans have built dams for
managing irrigation, producing energy or for recreational
purposes. Dams are so widespread that the water flow of
over half the large river systems in the world is affected
by them (Nilsson et al. 2005). The ecological and evolu-
tionary impacts of dams are obvious and range from the
loss of biodiversity to the malfunctioning of the whole
ecosystem (Loot et al. 2007; Poulet 2007; Grenouillet
et al. 2008; Maloney et al. 2008). At the genetic level, the
negative effects of dams have been unambiguously dem-
onstrated for many fish species (Alo and Turner 2005;
Wofford et al. 2005; Raeymaekers et al. 2008). Based on
these results, a straightforward restoration tool consists in
‘un-damming’ rivers (Bednarek 2001; Palmer et al. 2005,
2008). Although environmentally beneficial, this solution
can however prove undesirable when dams are also part
of the historical and cultural heritage of a region or when
they provide benefits for society. For example, many small
to medium European rivers are scattered with water mills
associated to small weirs (2–3 m high) that, at least par-
tially, impede the movement of fish (Ovidio and Philippart
2002; Raeymaekers et al. 2008). Many of these man-made
structures date back to the 15th century, and are thus part
of the cultural heritage of local populations (see Fig. 1 and
Raeymaekers et al. 2009). In such cases, adopting manage-
ment practices requires consideration of both the eco-
logical and social dimensions of these structures.
In this study, we present a comparative study aimed at
evaluating the effects of anthropogenic river fragmenta-
tion on the genetic integrity of four widespread fish spe-
cies (the European chub, Leuciscus cephalus; the rostrum
dace, Leuciscus leuciscus; the gudgeon, Gobio gobio and the
European minnow, Phoxinus phoxinus). These fish species
differ mostly with respect to their maximal body size and
we hypothesized that they may display species-specific
responses to river fragmentation (Davies et al. 2000). To
test this hypothesis, we sampled and genotyped (using
microsatellite loci) these species along two nearby river
basins (i.e. landscapes); one being highly fragmented (the
river Viaur) and the other being a continuous landscape
(the river Cele). We first compared the spatial patterns of
genetic diversity between the landscapes and among the
fish species using allelic richness (AR) and heterozygosity
as two measures of genetic diversity. Irrespective of the
species, we expected to find a lower genetic diversity in
the fragmented landscape because of the stronger influ-
ence of patch isolation on genetic drift and inbreeding
(Frankham 1998; Couvet 2002; Keller and Waller 2002).
We also expected the smallest fish species to exhibit the
greatest response to fragmentation if dispersal ability is
the most important characteristic explaining species sensi-
tivity to fragmentation (Ewers and Didham 2006). The
reverse is expected (i.e. the largest species are more sensi-
tive) if, alternatively, effective population size is the best
explanation for sensitivity to fragmentation (Davies et al.
2000). By combining the use of F-statistics (Wright 1951)
and the isolation-by-distance (IBD) framework (hereafter
IBD Hutchison and Templeton 1999; Slatkin 1993), we
then compared the population genetic structure of each
species between the two landscapes. We expect a higher
level of genetic structure (i.e. higher Fst values) for all
species in the fragmented landscape because weirs might
partially impede dispersal between patches (Raeymaekers
Figure 1 Traditional mill weir of the river Viaur (the fragmented land-
scape). They are made of rocks and most date back to the Middle
Ages (12th–15th centuries). They are hence part of the local and
cultural heritage, but they also impede the dispersal of several fish
species. More than 50 such weirs are scattered along the river Viaur.
Copyright: Loıc Tudesque.
Species-specific responses to fragmentation Blanchet et al.
292 ª 2010 Blackwell Publishing Ltd 3 (2010) 291–304

et al. 2008). Particularly, the smallest or the largest species
should be more strongly affected if dispersal ability or
effective population size respectively explain sensitivity to
fragmentation. We also expect species-specific responses
on IBD patterns. Specific responses would depend upon
the initial equilibrium between genetic drift and gene
flow of each species in the absence of fragmentation
(Hutchison and Templeton 1999; Templeton et al. 2001).
For all species, IBD in the fragmented river basin should
tend towards a pattern whereby genetic drift is higher
and gene flow is lower. Finally, we discuss our results in
the light of the cultural and historical status of the
particular human fragmentation studied here (Fig. 1).
Material and methods
Study area
The area studied is located in Southwestern France and
encompasses two river basins: the River Cele and the
River Viaur (Fig. 2). We focused on these two river basins
because (i) they are geographically very close to one
another (their sources are roughly 50 km apart) and (ii)
they both belong to the Adour-Garonne river drainage,
which suggest a shared geological, colonization and evolu-
tionary histories (Costedoat et al. 2006). These two rivers
are very similar in terms of hydrological and chemical
characteristics (G. Loot and S. Blanchet, unpublished
data). Respectively, the River Cele and the River Viaur
are 136 and 168 km long, their drainage areas cover 1350
and 1530 km2 and their annual mean flow ranges
between 7–30 m3/s and 8–25 m3/s.
However, these two rivers differ with regards to the level
of anthropogenic fragmentation. The river Viaur is highly
fragmented and will be hereafter referred to as the ‘frag-
mented landscape’. More than 50 small mill weirs (2–3 m
high; see Fig. 1) are scattered along its main channel
(approximately one weir every 2–3 km; Grenouillet et al.
2008; Poulet 2007). Most of these structures were built
during the 15th century (it seems that weir building even
began during the 12th century, see also Raeymaekers et al.
2009) and very few of them have been equipped with fish
ladders. Based on non-standardized interviews, these weirs
(even if often non-functional) are often viewed as parts of
the local culture and heritage (G. Loot and S. Blanchet,
unpublished data). In the first half of the 20th century,
two hydroelectric dams (30 m high) were built; one
located 30 km from the source and the other located
80 km from the source of the river (Fig. 2). The River Cele
is weakly fragmented and will be hereafter referred to as
the ‘continuous landscape’. Ten small weirs (2–3 m high)
were constructed on the River Cele during the 20th
century but most were equipped with fish ladders, enabling
nearly all of the fish species to disperse between river
segments (Fig. 2).
Sampling design
We sampled 11 sites on the river Cele (from C1 to C11;
Fig. 2) and 10 sites on the river Viaur (from V1 to V10;
Fig. 2). Because the genetic structure of freshwater fish is
often spatially structured along the upstream–downstream
gradient (Hanfling and Weetman 2006; Raeymaekers et al.
2008), the sites were directly on the main channel of each
river and were chosen at regular distances along the gra-
dient to cover this whole upstream–downstream gradient
(Fig. 2). The riparian distance between each sampling site
and the river source was calculated using a geo-referenced
map (ArcView v.9ª, ESRI, Redlands, CA, USA). A maxi-
mum of 24 adults per species and per site were caught by
electrofishing (Table 1). For each individual, a small piece
of pelvic fins was collected and preserved in 70% ethanol.
Two fish species (L. leuciscus and L. cephalus) were absent
from some sampling sites (i.e. the upper sampling sites,
Table 1) while the other two species (G. gobio and
P. phoxinus) were present all along the sampled gradient.
At each site we also estimated the density of each species
following a standardized two-pass electrofishing method
(Bohlin et al. 1989).
Figure 2 Map showing the geographical position of the river Cele (the continuous landscape) and the river Viaur (the fragmented landscape). Both
rivers belong to the Adour-Garonne basin drainage. This map also shows the sampling sites (black dots) within each river. Weirs (small lines) and
hydro-electric dams (large lines in the river Viaur) are also shown. However, note that not all weirs (over 50) are represented on the river Viaur.
Blanchet et al. Species-specific responses to fragmentation
ª 2010 Blackwell Publishing Ltd 3 (2010) 291–304 293

Biological models
All four fish species are widely distributed in Europe and
belong to the Cyprinids family, which is the most diverse
family in Europe (Reyjol et al. 2007). These species varied
strikingly according to their maximal body length (Keith
and Allardi 2001). The largest is L. cephalus which can
reach a maximum body length of 600 mm, followed by
L. leuciscus (400 mm), G. gobio (200 mm) and P. phoxinus
(140 mm) (Keith and Allardi 2001). The average body
lengths of the sampled fish were highly correlated with
the maximal body lengths reported in the literature
(r2 = 0.96, n = 4; see also Table 1). All these species are
mainly insectivorous, with some feeding in the water
column (L. cephalus and P. phoxinus) and the other
preferentially feeding on the bottom (L. leuciscus and
G. gobio) (Keith and Allardi 2001). By focusing on species
belonging to the same trophic level and the same family,
we should limit potential comparative biases inherent to
phylogenetic constraints and to phenotypic attributes
other than fish body size (Henle et al. 2004). Finally, by
focusing on fish species that are not targeted by anglers,
we limit the possibility of stocking effects and uninformed
translocation between river drainages.
In fish, as in most animals, body length is positively
correlated to dispersal ability at the interspecific level, and
body size can hence be viewed as a good proxy of dis-
persal capability (Hugueny 1989; Jenkins et al. 2007).
Although we lack of precise data on the dispersal ability
of each of these four species, there are evidences that
L. cephalus and L. leuciscus are good dispersers as they are
both able to perform long-distance upstream movements
(up to 10 km) and to migrate into section upstream weirs
(Clough and Beaumont 1998; Lucas 2000; Bolland et al.
2008; De Leeuw and Winter 2008). On the contrary, the
two other species (G. gobio and P. phoxinus) seems to
have lower dispersal ability (Holthe et al. 2005;
Knaepkens et al. 2007), which is not surprising given
their relatively small body sizes. Moreover, a negative
relationship between species body size and population
density is expected at the interspecific level (Cotgreave
1993; Blackburn and Gaston 1997). Accordingly, the two
largest species (L. cephalus and L. leuciscus) had lower
densities than the two smallest species (G. gobio and
P. Phoxinus) (see details in Table 1), which suggested a
lower effective population size for these two largest
species. Effective population sizes were estimated using
microsatellites data (see below the section Descriptive
genetic analyses). Both dispersal ability and effective
population size are considered as important predictors of
vulnerability to fragmentation; the relative role of
both characteristics will be considered further in the
discussion.Tab
le1.
Sam
plin
gch
arac
terist
ics
of
the
study.
Spec
ies
Proport
ion
of
occ
upie
d
site
s(m
ean
sam
plin
gsi
ze±
95%
CI)
Mea
nden
sity
(ind/1
00m
2)
(mea
n±
95%
CI)
Mea
nef
fect
ive
popula
tion
size
(mea
n±
95%
CI)
Mea
nbody
length
(mm
)
(mea
n±
95%
CI)
Frag
men
ted
Continuous
Frag
men
ted
Continuous
Frag
men
ted
Continuous
Frag
men
ted
Continuous
Leuci
scus
cephal
us
8/1
0(1
7.5
±0.9
6)
9/1
1(1
8.4
4±
2.7
9)
1.4
3±
1.0
80.9
4±
0.4
933.3
1±
31.9
777.0
5±
55.4
3212.3
0±
25.9
3182.6
3±
25.2
7
Leuci
scus
leuci
scus
8/1
0(1
8.3
7±
1.9
7)
10/1
1(1
5.1
2±
3.6
9)
0.9
4±
1.1
72.6
4±
2.9
965.3
8±
21.5
475.8
7±
46.9
0185.6
8±
10.5
5165.7
2±
38.8
2
Gobio
gobio
10/1
0(2
0.0
0±
0.0
0)
11/1
1(1
9.7
2±
0.7
2)
20.1
2±
8.5
518.6
1±
9.7
0123.6
0±
62.9
9113.2
7±
74.4
083.1
1±
5.8
183.1
9±
7.1
1
Phoxi
nus
phoxi
nus
10/1
0(2
0.4
4±
0.9
2)
11/1
1(1
9.8
1±
0.6
9)
26.2
9±
19.1
211.4
4±
5.8
5126.3
0±
67.8
0115.0
0±
81.9
259.5
4±
2.8
957.5
9±
4.0
1
This
table
show
s,fo
rea
chla
ndsc
ape
(fra
gm
ente
dor
continuous)
,th
epro
port
ion
of
sam
plin
gsi
tes
that
was
occ
upie
d,
the
mea
nsa
mple
size
,th
em
ean
popula
tion
den
sity
,th
em
ean
effe
ctiv
e
popula
tion
size
,an
dth
em
ean
body
length
(tota
lbody
length
inm
m)
for
each
of
the
four
sam
ple
dsp
ecie
s(9
5%
CI,
95%
confiden
cein
terv
al).
Species-specific responses to fragmentation Blanchet et al.
294 ª 2010 Blackwell Publishing Ltd 3 (2010) 291–304

Genetic analyses
Genomic DNA was extracted from the pelvic fins using a
salt-extraction protocol (Aljanabi and Martinez 1997). We
employed a cross-amplification approach for selecting the
loci for each species. Using an initial set of 40 markers
developed for target and sister species (see Table S1), we
cross-amplified the 40 markers for each of the four spe-
cies and we conserved only the markers that displayed
highly readable and repeatable profiles. These cross-
amplified markers were then tested for the presence of
null-alleles using the software micro-checker 2.3 (Van
Oosterhout et al. 2004). The loci that showed evidence of
the presence of null-alleles were dropped out from our
final choice. This approach resulted in the selection of a
set of 8–15 loci according to the species [L. cephalus
(n = 10); L. leuciscus (n = 15); G. gobio (n = 8), P. phoxi-
nus (n = 8); Table S1]. The selected loci were co-ampli-
fied using the QIAGEN� Multiplex PCR Kit (Qiagen,
Valencia, CA, USA). Polymerase chain reaction (PCR)
reactions were carried out in a 10 lL final volume con-
taining 5–20 ng of genomic DNA, 5 lL of 2· QIAGEN
Multiplex PCR Master Mix, and locus-specific optimized
combination of primers (detailed recipes are available
upon request). PCR amplifications were performed in a
Mastercycler PCR apparatus (Eppendorf�, Hauppauge,
NY, USA) under the following conditions: 15 min at 95�C
followed by 30 cycles of 1 min at 94�C, 1 min at 60�C and
1 min at 72�C and finally followed by a 60 min final elon-
gation step at 72�C. Amplified fragments were then sepa-
rated on an ABI PRISM� 3730 automated capillary
sequencer (Applied Biosystems). Allelic sizes were then
scored using GENEMAPPER� v.4.0 (Applied Biosystems,
Foster City, CA, USA).
Statistical analyses
Descriptive analyses
For each species, locus-by-locus heterozygosity (observed
and expected) as well as Fis estimates were calculated
using GENETIX version 4.05.2 (Belkhir et al. 2002).
Departure from the Hardy–Weinberg equilibrium was
tested using GENEPOP version 3.4 (Raymond and
Rousset 1995). Linkage disequilibrium between all pairs
of loci was tested in the program Fstat version 2.9.3.2
(Goudet 1995). We used the software NeEstimator 1.3
(Queensland Government, Brisbane, Australia) to estimate
the effective population size for each species. We used a
point estimation method based on linkage/gametic
disequilibrium (Hill 1981). This method was preferred
over the ‘heterozygote excess method’ (Pudovkin et al.
1996) because the later was less effective for converging.
It was applied on each sampling site independently and
we calculated a mean effective population size over all
sampling sites. Point estimation methods must be inter-
preted cautiously and more sophisticated methods involv-
ing computationally intensive algorithms and/or multiple
cohorts are often preferred to estimate properly effective
population size (Waples 1989). The results presented here
will therefore be used only for inter-species comparison
but not for inter-landscapes comparison.
In addition, we used unpaired t-test (two-tails) to test
if, within-species, density, effective population size and
mean body size differed between the two landscapes.
Effect of fragmentation on genetic diversity
Two measures of genetic diversity were computed for
each sampling site and for each species. AR corrected for
the minimum sampling size was computed using Fstat
version 2.9.3.2 (Goudet 1995), and observed heterozygos-
ity (Hobs) was computed using GENETIX version 4.05.2
(Belkhir et al. 2002). For each species we computed gen-
eralized linear models (GLM) with either AR or Hobs as
the dependent variables, landscape status (fragmented or
continuous landscapes) as a categorical predictor and the
position of each sampling site from the river source as a
continuous predictor. As observed elsewhere (e.g.
Raeymaekers et al. 2008) we expected both AR and Hobs
to be positively correlated to the distance from the river’s
source. We also fitted the two-way interaction to test for
a significant effect of the landscape status on the slope of
the relationship between either AR or Hobs and the dis-
tance from the source. For all models we assumed a
Gaussian error-term distribution and the sampling site
was the replicate unit.
In addition to testing for a significant effect, we also
used a meta-analytic framework to investigate how the
magnitude of the effect of fragmentation (i.e. the effect
size; Nakagawa and Cuthill 2007) differed between spe-
cies. From mean and standard deviation data, we calcu-
lated the Hedges’ d-value for each species and each
measure of genetic diversity (see Rosenberg et al. 2000 for
formulas). The Hedges’ d-value is a standardized effect
size that is comprised between )¥ and +¥, with a nega-
tive value representing effects where the control group
(here the continuous landscape) attains a greater value
than the experimental group (here the fragmented land-
scape) (Rosenberg et al. 2000). We then calculated the
cumulative effect size (�E) and the 95% confidence interval
for all pooled species. This procedure allows the calcula-
tion of a mean effect size weighted for differential sam-
pling sizes between species (Rosenberg et al. 2000). We
then verified whether the effect size calculated for each
species fell within the 95% confidence interval calculated
for all species (i.e. did an individual effect significantly
differ from the mean effect?). Finally, we evaluated if the
Blanchet et al. Species-specific responses to fragmentation
ª 2010 Blackwell Publishing Ltd 3 (2010) 291–304 295

set of effect sizes calculated for each species was homoge-
neous or not. The total heterogeneity of a sample (Qt)
was calculated as described in Rosenberg et al. (2000) and
its significance was tested using chi-square statistics.
Effect of fragmentation on genetic structure
We first investigated the population genetic structure by
estimating the Fst (Weir and Cockerham 1984). We calcu-
lated global Fst values for each locus and each species using
the program Fstat version 2.9.3.2 (Goudet 1995). For each
species, we computed a GLM with Fst as the dependent
variable and landscape status (fragmented or continuous
landscapes) as a categorical predictor. For all models. we
assumed a Gaussian error-term distribution and the locus
was the replicate unit. The meta-analytic framework we
described above was used to compare the magnitude of the
effect of fragmentation on the Fst values for each species.
We then investigated the spatial genetic structure using
the IBD framework (Hutchison and Templeton 1999;
Templeton et al. 2001). Pairwise Fst between all pairs of
populations were computed for each landscape and each
species separately using GENETIX version 4.05.2 (Belkhir
et al. 2002). Pairwise riparian distances between sites were
computed using the Geographical Information System.
We first graphically inspected the linear relationship
between Fst/(1 ) Fst) and the distance between pairs of
sampling sites as proposed by Hutchison and Templeton
(1999) to infer the migration drift equilibrium for
each species in each landscape. Because of the non-
independence of the replicate unit (i.e. a pair of sampling
sites), we assessed the strength (as the Pearson coefficient
of correlation) and the significance of each linear rela-
tionship using a re-sampling procedure (i.e. procedure
analogous to the Mantel test; Manly 1997). We then
investigated the effect of fragmentation on the slope of
the linear relationship between Fst/(1 ) Fst) and the
distance between a pair of sampling sites using another
re-sampling procedure in which the slope of the frag-
mented landscape for a given species was compared with
the slope of the continuous landscape for this species
(Manly 1997, #2831; see also Epps et al. 2005). If gene
flow is reduced between sub-populations, we would
expect a significantly higher slope in the fragmented than
in the continuous landscape.
Results
Descriptive analyses
We did not find evidence for any significant heterozygous
deficit (after Bonferroni correction) for any of the loci that
were considered (Table S1). No pair of loci displayed sig-
nificant linkage disequilibrium (results not shown). As
expected, population density correlates quite strongly to
effective population size (r2 = 0.766, n = 8, P < 0.005; see
Table 1). Roughly, the two largest bodied-species (L. ceph-
alus and L. leuciscus) tended to have lower effective popu-
lation size than the two smallest-bodied species (G. gobio
and P. phoxinus) (Table 1). However, within-species, we
detected no significant differences between landscapes in
term of mean body length, population density and effec-
tive population size (t-test, all P > 0.05, see Table 1).
Effect of fragmentation on genetic diversity
In case of the AR, we found significant differences
between the fragmented versus the continuous landscape
for all the species except P. phoxinus (Table 2; Fig. 3A).
In all significant cases, the AR was lower in the frag-
mented landscape (Fig. 3A). It is noteworthy that the AR
(irrespective of the landscape) increases as the maximum
body size of the considered species decreases (Fig. 3A, see
also Frankham 1996). Over all species, the magnitude of
the effect imposed by fragmentation was significantly dif-
ferent from 0 (see the 95% confidence interval in
Fig. 4A), but was significantly heterogeneous among spe-
cies (Qt = 24.44, d.f. = 3, P < 0.001). This means that
not all species respond equally to river fragmentation.
Specifically, the effect sizes for L. leuciscus and G. gobio
were greater than the mean whereas the effect size was
lower than the mean for P. phoxinus (Fig. 4A). For one
species (G. gobio), the AR was not affected by the distance
of the sampling site from the river’s source (Table 2D).
For L. leuciscus and P. phoxinus, there was a significant
positive correlation between AR and distance from the
river’s source (Table 2D; see also Fig. S1C,G). We also
found a significant interaction between ‘fragmented sta-
tus’ and ‘distance from the river’s source’ for L. cephalus
(Table 2A). This indicated that the relationship between
AR and distance from the source was positive and signifi-
cant for the continuous landscape (r = 0.75, n = 8,
P = 0.033) but not for the fragmented landscape
(r = 0.03, n = 8, P = 0.936; see Fig. S1A).
Concerning observed heterozygosity, we found signifi-
cant differences between the fragmented versus the
continuous landscape for all species (Table 2; Fig. 3B). In
all cases, the observed heterozygosity was lower in the
fragmented landscape (Fig. 3B). Over all species, the
magnitude of the effect imposed by fragmentation was
significantly different from 0 (Fig. 4B), and did not differ
significantly among species (Qt = 1.58, d.f. = 3,
P = 0.661). The effect sizes for P. phoxinus tended to be
slightly lower than for the other species (Fig. 4B). The
effect of the distance of the sampling site from the river’s
source on Hobs was significant only for P. phoxinus
(Table 2D). For this species, there was also a significant
interaction between ‘fragmented status’ and ‘distance
Species-specific responses to fragmentation Blanchet et al.
296 ª 2010 Blackwell Publishing Ltd 3 (2010) 291–304
from the river’s source’ (Table 2D). This showed that the
relationship between AR and distance from the source
was positive for both the continuous and the fragmented
landscape, but the slope of the relationship was steeper in
the continuous landscape (Fig. S1H).
Effect of fragmentation on genetic structure
Concerning Fst, we found significant differences between
the continuous and fragmented landscape for the two
largest species [L. cephalus (F1,18 = 9.828, P = 0.006) and
L. leuciscus (F1,28 = 10.844, P = 0.003)] but not for the
two smallest species [G. gobio (F1,14 = 1.964, P = 0.182)
and P. phoxinus (F1,14 = 0.159, P = 0.696)]. In both sig-
nificant cases, the level of population differentiation (i.e.
Fst) was higher in the fragmented landscape (Fig. 3C).
Over all species, the magnitude of the effect was signifi-
cantly different from zero (Fig. 4C), and did not differ
significantly between species (Qt = 3.518, d.f. = 3,
P = 0.320). There was a positive tendency between the
maximum body size of each species and the magnitude of
the effect (Fig. 4C).
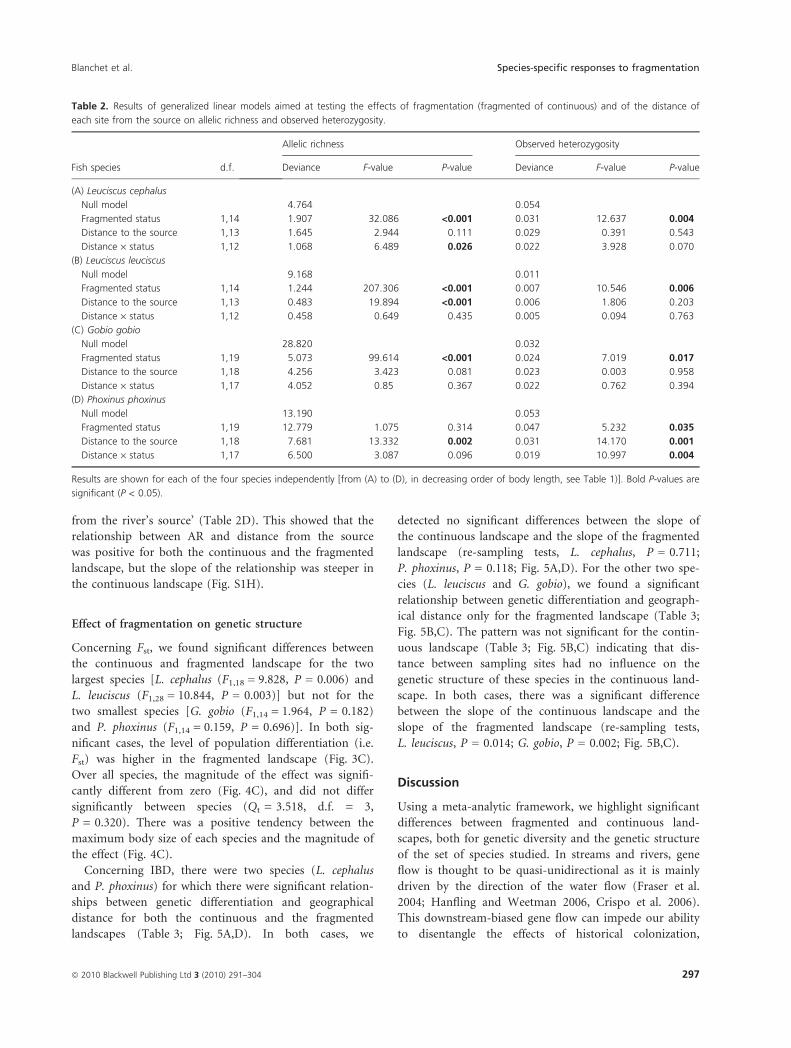
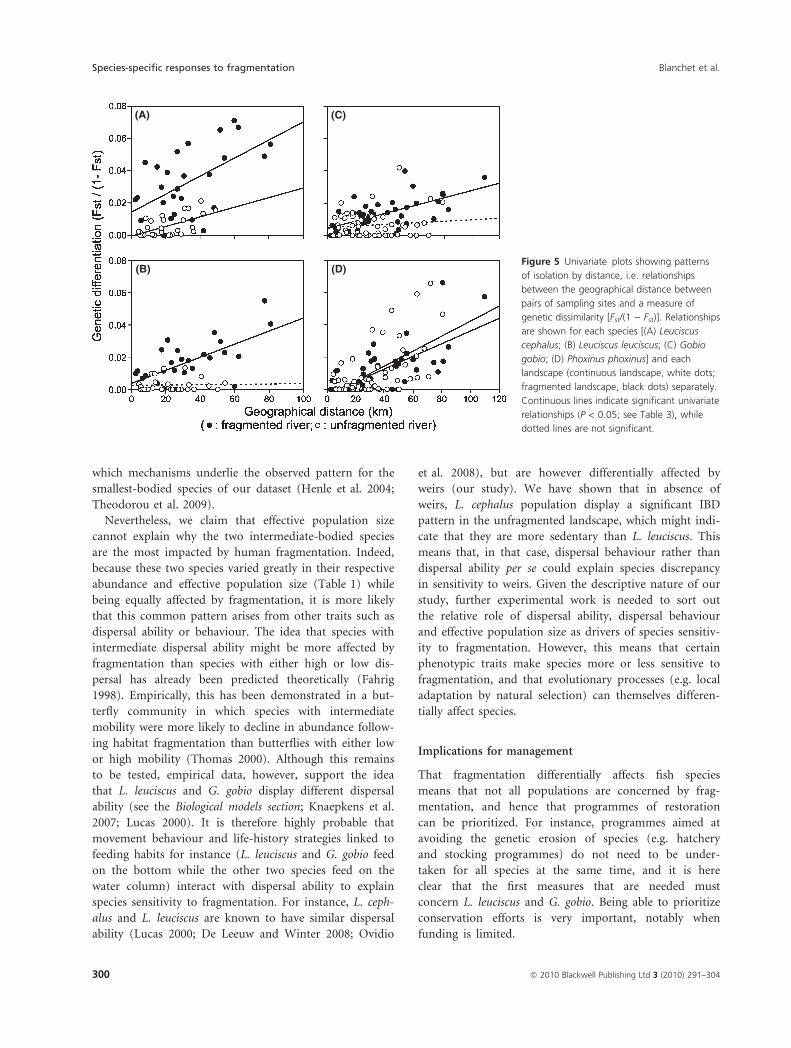
Concerning IBD, there were two species (L. cephalus
and P. phoxinus) for which there were significant relation-
ships between genetic differentiation and geographical
distance for both the continuous and the fragmented
landscapes (Table 3; Fig. 5A,D). In both cases, we
detected no significant differences between the slope of
the continuous landscape and the slope of the fragmented
landscape (re-sampling tests, L. cephalus, P = 0.711;
P. phoxinus, P = 0.118; Fig. 5A,D). For the other two spe-
cies (L. leuciscus and G. gobio), we found a significant
relationship between genetic differentiation and geograph-
ical distance only for the fragmented landscape (Table 3;
Fig. 5B,C). The pattern was not significant for the contin-
uous landscape (Table 3; Fig. 5B,C) indicating that dis-
tance between sampling sites had no influence on the
genetic structure of these species in the continuous land-
scape. In both cases, there was a significant difference
between the slope of the continuous landscape and the
slope of the fragmented landscape (re-sampling tests,
L. leuciscus, P = 0.014; G. gobio, P = 0.002; Fig. 5B,C).
Discussion
Using a meta-analytic framework, we highlight significant
differences between fragmented and continuous land-
scapes, both for genetic diversity and the genetic structure
of the set of species studied. In streams and rivers, gene
flow is thought to be quasi-unidirectional as it is mainly
driven by the direction of the water flow (Fraser et al.
2004; Hanfling and Weetman 2006, Crispo et al. 2006).
This downstream-biased gene flow can impede our ability
to disentangle the effects of historical colonization,
Table 2. Results of generalized linear models aimed at testing the effects of fragmentation (fragmented of continuous) and of the distance of
each site from the source on allelic richness and observed heterozygosity.
Fish species d.f.
Allelic richness Observed heterozygosity
Deviance F-value P-value Deviance F-value P-value
(A) Leuciscus cephalus
Null model 4.764 0.054
Fragmented status 1,14 1.907 32.086 <0.001 0.031 12.637 0.004
Distance to the source 1,13 1.645 2.944 0.111 0.029 0.391 0.543
Distance · status 1,12 1.068 6.489 0.026 0.022 3.928 0.070
(B) Leuciscus leuciscus
Null model 9.168 0.011
Fragmented status 1,14 1.244 207.306 <0.001 0.007 10.546 0.006
Distance to the source 1,13 0.483 19.894 <0.001 0.006 1.806 0.203
Distance · status 1,12 0.458 0.649 0.435 0.005 0.094 0.763
(C) Gobio gobio
Null model 28.820 0.032
Fragmented status 1,19 5.073 99.614 <0.001 0.024 7.019 0.017
Distance to the source 1,18 4.256 3.423 0.081 0.023 0.003 0.958
Distance · status 1,17 4.052 0.85 0.367 0.022 0.762 0.394
(D) Phoxinus phoxinus
Null model 13.190 0.053
Fragmented status 1,19 12.779 1.075 0.314 0.047 5.232 0.035
Distance to the source 1,18 7.681 13.332 0.002 0.031 14.170 0.001
Distance · status 1,17 6.500 3.087 0.096 0.019 10.997 0.004
Results are shown for each of the four species independently [from (A) to (D), in decreasing order of body length, see Table 1)]. Bold P-values are
significant (P < 0.05).
Blanchet et al. Species-specific responses to fragmentation
ª 2010 Blackwell Publishing Ltd 3 (2010) 291–304 297

man-made migration barriers and downstream-biased
gene flow (Raeymaekers et al. 2008). We ought to bypass
this difficulty by using a synchronic comparison, i.e. a
comparison between a fragmented and a continuous
landscape that share similar evolutionary and geological
histories (Hoehn et al. 2007; Hendry et al. 2008).
Although we can not totally discard that the pattern
observed here are a hangover from the past or down-
stream-biased gene flow (Hanfling and Weetman 2006),
such a comparison makes it likely that the between-
landscape differences reported here are (at least in part)
the result of anthropogenic fragmentation. Thus, our
results support numerous studies on many animal species
showing that human fragmentation modifies the genetic
integrity of natural populations, notably in decreasing
gene flow among populations and genetic diversity within
the remnant population patch (e.g. Van den Bussche
et al. 2003; Alo and Turner 2005; Trizio et al. 2005;
Hoehn et al. 2007; Schiffer et al. 2007). It is worth noting
that our preliminary results on the ecological characteris-
tics of these fish populations (see Table 1) indicate that,
from an ecological point of view, these populations have
not suffered intensively from the changes in genetic diver-
sity and structure we report here. Therefore, it is possible
that these species have undergone evolutionary changes
that allow them to cope with fragmentation (and the
associated genetic changes), and/or that genetic conse-
quences reported here are not strong enough to influence
significantly the biological fitness of populations.
More interestingly, we detected obvious species-specific
responses to fragmentation. This important result is con-
sistent with previous papers showing that not all species
are equally affected by fragmentation (Davies et al. 2000;
Henle et al. 2004; Ewers and Didham 2006; Hoehn et al.
2007), and hence suggest that the effect of fragmentation
in streams and rivers can not be generalized from one fish
species to another. Contrary to certain expectations
(Ewers and Didham 2006), we failed to verify the hypo-
thesis that large-bodied species are less sensitive to habitat
fragmentation. On the contrary, all genetic indices clearly
indicated that the smallest-bodied species (P. phoxinus;
Table 1) was the least affected by fragmentation. We fur-
ther provide evidence that species with intermediate body
size might in fact be the most affected by fragmentation,
at least at the genetic level. Species differences in the
responses to fragmentation were obvious and significant
for two discriminant genetic indices; the AR and IBD pat-
terns. For these two genetic indices, L. leuciscus and
G. gobio (which are the two intermediate-bodied species;
Table 1) were most affected by the presence of weirs.
Indeed, in the case of AR, these two species had an effect
size that was significantly lower than the mean (Fig. 4A).
With regard to IBD, these two species showed patterns
that significantly differed between landscapes: a pattern
evocative of high gene flow and low genetic drift in
the continuous landscape, and a pattern evocative of a
Figure 3 Bar plots showing the mean allelic richness (A), the mean
observed heterozygosity (B) and the mean Fst (C) for each of the four
species studied independently and each landscape (continuous land-
scape, black bars; fragmented landscape, grey bars). The four species
are ranked from the largest to the smallest from left to right (see also
Table 1). The stars (*P < 0.05; **P < 0.01; ***P < 0.001) indicated
significant differences (generalized linear models; see Table 2)
between the two landscapes. n.s., non-significant differences. Error
bars are standard errors.
Species-specific responses to fragmentation Blanchet et al.
298 ª 2010 Blackwell Publishing Ltd 3 (2010) 291–304

regional equilibrium between gene flow and drift in the
fragmented landscape (Hutchison and Templeton 1999).
As expected, this latter result suggests that barriers limit
gene flow between populations and favour genetic drift
within them. Very interestingly, this demonstrates that
human fragmentation has disturbed the initial balance
between genetic drift and gene flow, and has constrained
all these fish species in a similar population structure
whereby an equilibrium between genetic drift and gene
flow is attained (Raeymaekers et al. 2008). We can hence
conclude that (i) not all species react similarly to
fragmentation, (ii) the smallest sized species (P. phoxinus)
is the least affected by fragmentation and (iii) there is a
tendency for the intermediate-bodied species (L. leuciscus
and G. gobio) to be the more affected.
Many traits have been proposed as potential predictors
of species sensitivity to fragmentation (reviewed in Ewers
and Didham 2006; Henle et al. 2004). Predictions regard-
ing body size depend upon the level of organization being
considered. For instance, it is often claimed that large-
bodied species are at greater risk of extinction than small-
bodied species because large-bodied species are often at
higher trophic levels and hence, have lower population
size and more unstable population dynamics (Gaston and
Blackburn 1996; Henle et al. 2004). However, we control
for this possibility by selecting species of the same trophic
level, which orientates our prediction towards the hypoth-
esis that large-bodied species are better dispersers and are
therefore less sensitive to fragmentation (see Fig. 2Q,R in
Ewers and Didham 2006). As stated above, this hypothe-
sis was not supported, as the smallest-bodied species was
the least sensitive to fragmentation. In fish, small-bodied
species generally have a narrower habitat range than
large-bodied species (Pyron 1999; Rosenfield 2002).
Therefore, we can speculate that small-bodied species are
not affected by fragmentation because their home range is
smaller than the distance separating two barriers. A non-
mutually exclusive speculation relates to the possibility
that small-bodied species also have large effective popula-
tion size (which is verified in our dataset; Table 1), which
might blur the effect of genetic drift within remnant pop-
ulation patches (Lawton et al. 1994; Davies et al. 2000).
Because of the strong covariance between body size and
several other traits such as home range, population size
and dispersal ability, it is currently difficult to ascertain
Figure 4 Effect sizes (measured as the Hedges’ d ratio) measured for each genetic indices [(A) allelic richness; (B) observed heterozygosity; (C) Fst]
and for each of the four species studied independently (Leuciscus cephalus, Leuciscus leuciscus, Gobio gobio and Phoxinus phoxinus). Error bars
are standard deviations. For each genetic index, the mean effect size has been summarized across species using the cumulative effect size (�E, full
horizontal lines). The 95% confidence interval around the cumulative effect size has been added (dotted horizontal lines). Low values of effect
size indicate strong effects of fragmentation.
Table 3. Results of bootstrap-based test aimed at assessing the rela-
tionships between a measure of genetic dissimilarity [Fst/(1 ) Fst)] and
the riparian distance between pairs of sites.
Fish species
Fragmentation status
Continuous Fragmented
(A) Leuciscus cephalus 0.571 (0.071)
0.002
0.586 (0.074)
0.001
(B) Leuciscus leuciscus 0.033 (0.092)
0.565
0.648 (0.094)
< 0.001
(C) Gobio gobio 0.106 (0.094)
0.182
0.637 (0.039)
< 0.001
(D) Phoxinus phoxinus 0.587 (0.057)
< 0.001
0.680 (0.035)
< 0.001
The first line of each row reports the coefficient of correlation (Pear-
son r, 1000 iterations) of the relationships and of its standard devia-
tion (in brackets). The second line of each row is the P-value (italic)
associated to such coefficients. Bold P-values are significant
(P < 0.05). Results are shown for each landscape (fragmented or con-
tinuous) and each of the four species [from (A) to (D), in decreasing
order of body length; see Table 1] separately.
Blanchet et al. Species-specific responses to fragmentation
ª 2010 Blackwell Publishing Ltd 3 (2010) 291–304 299
which mechanisms underlie the observed pattern for the
smallest-bodied species of our dataset (Henle et al. 2004;
Theodorou et al. 2009).
Nevertheless, we claim that effective population size
cannot explain why the two intermediate-bodied species
are the most impacted by human fragmentation. Indeed,
because these two species varied greatly in their respective
abundance and effective population size (Table 1) while
being equally affected by fragmentation, it is more likely
that this common pattern arises from other traits such as
dispersal ability or behaviour. The idea that species with
intermediate dispersal ability might be more affected by
fragmentation than species with either high or low dis-
persal has already been predicted theoretically (Fahrig
1998). Empirically, this has been demonstrated in a but-
terfly community in which species with intermediate
mobility were more likely to decline in abundance follow-
ing habitat fragmentation than butterflies with either low
or high mobility (Thomas 2000). Although this remains
to be tested, empirical data, however, support the idea
that L. leuciscus and G. gobio display different dispersal
ability (see the Biological models section; Knaepkens et al.
2007; Lucas 2000). It is therefore highly probable that
movement behaviour and life-history strategies linked to
feeding habits for instance (L. leuciscus and G. gobio feed
on the bottom while the other two species feed on the
water column) interact with dispersal ability to explain
species sensitivity to fragmentation. For instance, L. ceph-
alus and L. leuciscus are known to have similar dispersal
ability (Lucas 2000; De Leeuw and Winter 2008; Ovidio
et al. 2008), but are however differentially affected by
weirs (our study). We have shown that in absence of
weirs, L. cephalus population display a significant IBD
pattern in the unfragmented landscape, which might indi-
cate that they are more sedentary than L. leuciscus. This
means that, in that case, dispersal behaviour rather than
dispersal ability per se could explain species discrepancy
in sensitivity to weirs. Given the descriptive nature of our
study, further experimental work is needed to sort out
the relative role of dispersal ability, dispersal behaviour
and effective population size as drivers of species sensitiv-
ity to fragmentation. However, this means that certain
phenotypic traits make species more or less sensitive to
fragmentation, and that evolutionary processes (e.g. local
adaptation by natural selection) can themselves differen-
tially affect species.
Implications for management
That fragmentation differentially affects fish species
means that not all populations are concerned by frag-
mentation, and hence that programmes of restoration
can be prioritized. For instance, programmes aimed at
avoiding the genetic erosion of species (e.g. hatchery
and stocking programmes) do not need to be under-
taken for all species at the same time, and it is here
clear that the first measures that are needed must
concern L. leuciscus and G. gobio. Being able to prioritize
conservation efforts is very important, notably when
funding is limited.
Figure 5 Univariate plots showing patterns
of isolation by distance, i.e. relationships
between the geographical distance between
pairs of sampling sites and a measure of
genetic dissimilarity [Fst/(1 ) Fst)]. Relationships
are shown for each species [(A) Leuciscus
cephalus; (B) Leuciscus leuciscus; (C) Gobio
gobio; (D) Phoxinus phoxinus] and each
landscape (continuous landscape, white dots;
fragmented landscape, black dots) separately.
Continuous lines indicate significant univariate
relationships (P < 0.05; see Table 3), while
dotted lines are not significant.
Species-specific responses to fragmentation Blanchet et al.
300 ª 2010 Blackwell Publishing Ltd 3 (2010) 291–304

In case of river fragmentation by dams or weirs, four
practical management solutions can be undertaken to
restore the genetic integrity of populations: (i) the stock-
ing of fish produced in a hatchery, (ii) the translocation
of individuals from site to site, (iii) the construction of
fish passages and (iv) the un-damming of rivers
(Bednarek 2001; Palmer et al. 2005, 2008; Raeymaekers
et al. 2009). Stocking is often associated with other evolu-
tionary problems that make this solution undesirable
(Blanchet et al. 2008; Frankham 2008). Translocation is
too time-consuming to be efficient. For weirs such as
those in the river Viaur (the fragmented landscape),
un-damming is not a solution because these weirs date
back to the Middle Ages (see also Raeymaekers et al.
2009) and are thus part of the local heritage and culture.
However, there is some evidence that building fish pas-
sages can be an efficient restoration tool to preserve both
the genetic integrity of fish species and the authenticity of
the weirs (Raeymaekers et al. 2009). In the river Viaur,
there are more than 70 weirs that have been identified.
Because of the high financial cost of constructing fish pas-
sages on all the weirs, a priority must be given to weirs
that have a high impact on the fish genetic structure, and
the passages must be efficient (i.e. all fish can benefit
from the passage). Prioritization in weirs restoration can
be evaluated qualitatively and quantitatively by using the
same procedure as the one used in Raeymaekers et al.
(2009). According to the ‘umbrella species’ principle
(Lambeck 1997), L. leuciscus and G. gobio appear as good
candidates species for investigating prioritization in weirs
restoration in the near future. The construction of fish
passages should, however, follow the biological require-
ments of most species inhabiting such river systems.
Following the recommendations made by Raeymaekers
et al. (2009) in a similar system, we can expect that prior-
ity will be given to the highest weirs. However, the con-
struction of fish passages should follow the biological
requirements of most species inhabiting such river
systems. Following the recommendations made by
Raeymaekers et al. (2009) in a similar system, we propose
that priority will be given to the highest weirs.
It is worth remembering that the river Viaur also con-
tains two recently built hydro-electrics dams that are
more than 30-m high. The effect of these dams (relative
to the effect of weirs) on the evolution and ecology of
fish populations is currently not known, and it should be
the focus of our future studies. However, the flow rate of
the river Viaur has been considerably altered by these two
dams, being severely decreased downstream of the dams
(i.e. a major part of the flow is diverted for agricultural
purposes), which has increased sedimentation above small
weirs (S. Blanchet and G. Loot personal observation). If
fish ladders are installed in the river Viaur, they will need
to be built according to the flow rate imposed by dams
to ensure that these ladders function well (Larinier et al.
2002).
The approach used here for evaluating the effect of
fragmentation on fish populations differs from previous
studies in that (i) it focuses on four fish species and (ii)
it uses a synchronic sampling design (Hendry et al. 2008).
These characteristics make this study highly valuable from
a conservation perspective, as it allows inferring the effect
of fragmentation at a ‘community-wide’ level. Further-
more, it allows detecting subtle effects that can be blurred
when more traditional approaches are used (i.e. when
only a single-fragmented landscape is considered). How-
ever, this approach implicitly assumes that differences
observed between landscapes are mainly the result of
human fragmentation. This assumption is hard to ascer-
tain and as a consequence, our study should be viewed as
a basis for future studies considering simultaneously the
effects of historical and contemporary histories on the
genetic structure of wild fish populations. The use of a
larger spatial scale sampling design and/or different
genetic markers could be use for reaching this goal. This
improvement should get a more complete picture of the
relative role of humans in shaping the nowadays genetic
structure of wild fish populations, and hence should
improve management policies.
Conclusion
To conclude, our study demonstrates the importance of
considering several species when investigating the effect of
fragmentation mediated by humans. We have shown that
a biological trait such as body size is important to under-
stand the influence of fragmentation on the genetic integ-
rity of fish populations. This means that the evolutionary
outcomes of fragmentation will depend upon the traits
that characterize species. Moreover, this implies that res-
toration programmes will need to be prioritized and tar-
geted according to the specificity of each species. Future
experimental studies are needed to ascertain the traits that
affect the genetic sensitivity to fragmentation, and to test
restoration programmes that can benefit a spectrum of
species that are functionally dissimilar.
Acknowledgements
The authors thank Julie Turgeon for comments on an
early draft. Gael Grenouillet, Loıc Tudesque, Muriel
Gevrey, Laetitia Buisson, Sebastien Brosse, Leslie Faggiano
and Fabien Leprieur are thanking for their help on the
field. The authors also thank the Agence de l’Eau
Adour-Garonne for financial support and the Genopole
Toulouse for their help with genotyping. Joost
Blanchet et al. Species-specific responses to fragmentation
ª 2010 Blackwell Publishing Ltd 3 (2010) 291–304 301

Raymaekers as well as two anonymous referees are
thanked for their constructive comments.
Literature cited
Aljanabi, S. M., and I. Martinez. 1997. Universal and rapid
salt-extraction of high quality genomic DNA for PCR-based
techniques. Nucleic Acids Research 25:4692–4693.
Alo, D., and T. F. Turner. 2005. Effects of habitat fragmenta-
tion on effective population size in the endangered Rio
Grande silvery minnow. Conservation Biology 19:1138–1148.
Bednarek, A. T. 2001. Undamming rivers: a review of the
ecological impacts of dam removal. Environmental
Management 27:803–814.
Belkhir, K., P. Borsa, L. Chikhi, N. Raufaste, and
F. Bonhomme. 2002.genetix 4.05.2, Logiciel sous Windows
TM pour la genetique des populations. Laboratoire Genome
Population, Interactions: CNRS UMR 5000. University of
Montpellier, France.
Blackburn, T. M., and K. J. Gaston. 1997. A critical assessment
of the form of the interspecific relationship between abun-
dance and body size in animals. Journal of Animal Ecology
66:233–249.
Blanchet, S., D. J. Paez, L. Bernatchez, and J. J. Dodson. 2008.
An integrated comparison of captive-bred and wild Atlantic
salmon (Salmo salar): implications for supportive breeding
programs. Biological Conservation 141:1989–1999.
Bohlin, T., S. Hamrin, T. G. Heggberget, G. Rasmussen, and S.
J. Saltveit. 1989. Electrofishing – theory and practice with
special emphasis on salmonids. Hydrobiologia 173:9–43.
Bolland, J. D., I. G. Cowx, and M. C. Lucas. 2008. Movements
and habitat use of wild and stocked juvenile chub, Leuciscus
cephalus (L.), in a small lowland river. Fisheries Management
and Ecology 15:401–407.
Clough, S., and W. R. C. Beaumont. 1998. Use of miniature
radio-transmitters to track the movements of dace, Leuciscus
leuciscus (L.) in the River Frome, Dorset. Hydrobiologia
372:89–97.
Costedoat, C., R. Chappaz, B. Barascud, O. Guillard, and A.
Gilles. 2006. Heterogeneous colonization pattern of Euro-
pean Cyprinids, as highlighted by the dace complex
(Teleostei: Cyprinidae). Molecular Phylogenetics and
Evolution 41:127–148.
Cotgreave, P. 1993. The relationship between body-size and
population abundance in animals. Trends in Ecology &
Evolution 8:244–248.
Couvet, D. 2002. Deleterious effects of restricted gene flow in
fragmented populations. Conservation Biology 16:369–376.
Crispo, E., P. Bentzen, D. N. Reznick, M. T. Kinnison and A.
P. Hendry. 2006. The relative influence of natural selection
and geography on gene flow in guppies. Molecular Ecology
15:49–62.
Davies, K. F., C. R. Margules, and K. F. Lawrence. 2000.
Which traits of species predict population declines in
experimental forest fragments? Ecology 81:1450–1461.
De Leeuw, J. J., and H. V. Winter. 2008. Migration of rheophilic
fish in the large lowland rivers Meuse and Rhine, the Nether-
lands. Fisheries Management and Ecology 15:409–415.
DiBattista, J. D. 2008. Patterns of genetic variation in anthro-
pogenically impacted populations. Conservation Genetics
9:141–156.
Epps, C. W., P. J. Palsboll, J. D. Wehausen, G. K. Roderick,
R. R. Ramey, and D. R. McCullough. 2005. Highways block
gene flow and cause a rapid decline in genetic diversity of
desert bighorn sheep. Ecology Letters 8:1029–1038.
Ewers, R. M., and R. K. Didham. 2006. Confounding factors
in the detection of species responses to habitat fragmenta-
tion. Biological Reviews 81:117–142.
Fahrig, L. 1998. When does fragmentation of breeding
habitat affect population survival? Ecological Modelling
105:273–292.
Fahrig, L. 2003. Effects of habitat fragmentation on biodiver-
sity. Annual Review of Ecology Evolution and Systematics
34:487–515.
Frankham, R. 1996. Relationship of genetic variation to popu-
lation size in wildlife. Conservation Biology 10:1500–1508.
Frankham, R. 1998. Inbreeding and extinction: island popula-
tions. Conservation Biology 12:665–675.
Frankham, R. 2008. Genetic adaptation to captivity in species
conservation programs. Molecular Ecology 17:325–333.
Fraser, D. J., C. Lippe, and L. Bernatchez. 2004. Consequences
of unequal population size, asymmetric gene flow and
sex-biased dispersal on population structure in brook charr
(Salvelinus fontinalis). Molecular Ecology 13:67–80.
Gaston, K. J., and T. M. Blackburn. 1996. Global scale
macroecology: interactions between population size,
geographic range size and body size in the Anseriformes.
Journal of Animal Ecology 65:701–714.
Goudet, J. 1995. fstat (version 1.2): a computer program to
calculate F-statistics. Journal of Heredity 86:485–486.
Grenouillet, G., S. Brosse, L. Tudesque, S. Lek, Y. Baraille, and
G. Loot. 2008. Concordance among stream assemblages and
spatial autocorrelation along a fragmented gradient.
Diversity and Distributions 14:592–603.
Hanfling, B., and D. Weetman. 2006. Concordant genetic
estimators of migration reveal anthropogenically enhanced
source-sink population structure in the River Sculpin,
Cottus gobio. Genetics 173:1487–1501.
Hendry, A. P., T. J. Farrugia, and M. T. Kinnison. 2008.
Human influences on rates of phenotypic change in wild
animal populations. Molecular Ecology 17:20–29; doi:
10.1111/j.1365-1294X.2007.03428.x.
Henle, K., K. F. Davies, M. Kleyer, C. Margules, and J. Settele.
2004. Predictors of species sensitivity to fragmentation.
Biodiversity and Conservation 13:207–251.
Hill, W. G. 1981. Estimation of effective population size from data
on linkage disequilibrium. Genetical Research 38:209–216.
Hoehn, M., S. D. Sarre, and K. Henle. 2007. The tales of two
geckos: does dispersal prevent extinction in recently frag-
mented populations? Molecular Ecology 16:3299–3312.
Species-specific responses to fragmentation Blanchet et al.
302 ª 2010 Blackwell Publishing Ltd 3 (2010) 291–304

Holthe, E., E. Lund, B. Finstad, E. B. Thorstad, and R. S.
McKinley. 2005. A fish selective obstacle to prevent
dispersion of an unwanted fish species, based on leaping
capabilities. Fisheries Management and Ecology 12:143–147.
Hugueny, B. 1989. Biogeographie et structure des peuplements
de poissons d’eau douce d’Afrique de l’Ouest : approches
quantitatives. PhD Thesis, Universite Paris-VII, Paris.
Hutchison, D. W., and A. R. Templeton. 1999. Correlation of
pairwise genetic and geographic distance measures: inferring
the relative influences of gene flow and drift on the distribu-
tion of genetic variability. Evolution 53:1898–1914.
Jenkins, D. G., C. R. Brescacin, C. V. Duxbury, J. A. Elliott,
J. A. Evans, K. R. Grablow, M. Hillegass et al. 2007. Does
size matter for dispersal distance? Global Ecology and
Biogeography 16:415–425.
Johansson, M., C. R. Primmer, and J. Merila. 2007. Does
habitat fragmentation reduce fitness and adaptability? A case
study of the common frog (Rana temporaria) Molecular
Ecology 16:2693–2700.
Keith, P., and J. Allardi. 2001. Atlas des poissons d’eau douce
de France. Patrimoines Naturels 47:387.
Keller, L. F., and D. M. Waller. 2002. Inbreeding effects in
wild populations. Trends in Ecology and Evolution
117:230–241.
Knaepkens, G., E. Maerten, and M. Eens. 2007. Performance
of a pool-and-weir fish pass for small bottom-dwelling
freshwater fish species in a regulated lowland river. Animal
Biology 57:423–432.
Lambeck, R. J. 1997. Focal species: a multi-species umbrella
for nature conservation. Conservation Biology 11:849–856.
Larinier, M., F. Travade, and J. P. Porcher. 2002. Fishways:
Biological Basis, Design Criteria and Monitoring. Bulletin
Francais de la Peche et de la Pisciculture 364.
Lawler, J. J., J. E. Aukema, J. B. Grant, B. S. Halpern, P.
Kareiva, C. R. Nelson, K. Ohleth et al. 2006. Conservation
science: a 20-year report card. Frontiers in Ecology and the
Environment 4:473–480.
Lawton, J. H., G. Daily, and I. Newton. 1994. Population–
dynamic principles. Philosophical Transactions of the
Royal Society of London Series B-Biological Sciences
344:61–68.
Loot, G., Y. Reyjol, N. Poulet, A. Simkova, S. Blanchet, and S.
Lek. 2007. Effects of small weirs on fish parasite communi-
ties. Parasitology Research 101:1265–1276.
Lucas, M. C. 2000. The influence of environmental factors on
movements of lowland-river fish in the Yorkshire Ouse
system. Science of the Total Environment 251:223–232.
Maloney, K. O., H. R. Dodd, S. E. Butler, and D. H. Wahl.
2008. Changes in macroinvertebrate and fish assemblages in
a medium-sized river following a breach of a low-head dam.
Freshwater Biology 53:1055–1068.
Manly, B. F. J. 1997. Randomization, Bootstrap and Monte
Carlo Methods in Biology. Chapman et Hall, London.
Nakagawa, S., and I. C. Cuthill. 2007. Effect size, confidence
interval and statistical significance: a practical guide for
biologists. Biological Reviews 82:591–605; doi: 10.1111/
j.1469-185X.2007.00027.x.
Nilsson, C., C. A. Reidy, M. Dynesius, and C. Revenga. 2005.
Fragmentation and flow regulation of the world’s large river
systems. Science 308:405–408.
Ovidio, M., and J. C. Philippart. 2002. The impact of small
physical obstacles on upstream movements of six species of
fish – synthesis of a 5-year telemetry study in the River
Meuse basin. Hydrobiologia 483:55–69.
Ovidio, M., H. Capra, and J. C. Philippart. 2008. Regulated
discharge produces substantial demographic changes on four
typical fish species of a small salmonid stream. Hydrobio-
logia 609:59–70.
Palmer, M. A., E. S. Bernhardt, J. D. Allan, P. S. Lake, G.
Alexander, S. Brooks, S. Clayton et al. 2005. Standards for
ecologically successful river restoration. Journal of Applied
Ecology 42:208–217.
Palmer, M. A., C. A. R. Liermann, C. Nilsson, M. Florke, J.
Alcamo, P. S. Lake, and N. Bond. 2008. Climate change and
the world’s river basins: anticipating management options.
Frontiers in Ecology and the Environment 6:81–89.
Poulet, N. 2007. Impact of weirs on fish communities in a
piedmont stream. River Research and Applications 23:1038–
1047.
Pudovkin, A. I., D. V. Zaykin, and D. Hedgecock. 1996. On
the potential for estimating the effective number of breeders
from heterozygote excess in progeny. Genetics 144:383–387.
Pyron, M. 1999. Relationships between geographical range size,
body size, local abundance, and habitat breadth in North
American suckers and sunfishes. Journal of Biogeography
26:549.
Raeymaekers, J. A. M., G. E. Maes, S. Geldof, I. Hontis, K.
Nackaerts, and F. A. M. Volckaert. 2008. Modeling genetic
connectivity in sticklebacks as a guideline for river
restoration. Evolutionary Applications 1:475–488.
Raeymaekers, J. A. M., D. Raeymaekers, I. Koizumi, S. Geldof,
and F. A. M. Volckaert. 2009. Guidelines for restoring
connectivity around water mills: a population genetic
approach to the management of riverine fish. Journal of
Applied Ecology 46:562–571.
Raymond, M., and F. Rousset. 1995. genepop (version-1.2) –
population genetics software for exact tests and ecumeni-
cism. Journal of Heredity 86:248–249.
Reyjol, Y., B. Hugueny, D. Pont, P. G. Bianco, U. Beier, N.
Caiola, F. Casals et al. 2007. Patterns in species richness and
endemism of European freshwater fish. Global Ecology and
Biogeography 16:65–75.
Rosenberg, M. S., D. C. Adams, and J. Gurevitch. 2000.
MetaWin: Statistical Software for Meta-Analysis, Version
2.0. Sinauer Associates, Inc., Sunderland.
Rosenfield, J. A. 2002. Pattern and process in the geographical
ranges of freshwater fishes. Global Ecology and Biogeo-
graphy 11:323–332.
Schiffer, M., W. J. Kennington, A. A. Hoffmann, and M. J.
Blacket. 2007. Lack of genetic structure among ecologically
Blanchet et al. Species-specific responses to fragmentation
ª 2010 Blackwell Publishing Ltd 3 (2010) 291–304 303

adapted populations of an Australian rainforest Drosophila
species as indicated by microsatellite markers and mitochon-
drial DNA sequences. Molecular Ecology 16:1687–1700.
Slatkin, M. 1993. Isolation by distance in equilibrium and
non-equilibrium populations. Evolution 39:53–65.
Spielman, D., B. W. Brook, and R. Frankham. 2004. Most
species are not driven to extinction before genetic
factors impact them. Proceedings of the National Academy
of Sciences of the United States of America 101:15261–
15264.
Templeton, A. R., R. J. Robertson, J. Brisson, and J. Strasburg.
2001. Disrupting evolutionary processes: the effect of habitat
fragmentation on collared lizards in the Missouri Ozarks.
Proceedings of the National Academy of Sciences of the
United States of America 98:5426–5432.
Theodorou, K., H. Souan, and D. Couvet. 2009. Metapopula-
tion persistence in fragmented landscapes: significant inter-
actions between genetic and demographic processes. Journal
of Evolutionary Biology 22:152–162.
Thomas, C. D. 2000. Dispersal and extinction in fragmented
landscapes. Proceedings of the Royal Society of London
Series B-Biological Sciences 267:139–145.
Trizio, I., B. Crestanello, P. Galbusera, L. A. Wauters, G. Tosi,
E. Matthysen, and H. C. Hauffe. 2005. Geographical distance
and physical barriers shape the genetic structure of Eurasian
red squirrels (Sciurus vulgaris) in the Italian Alps. Molecular
Ecology 14:469–481.
Van den Bussche, R. A., S. R. Hoofer, D. A. Wiedenfeld, D. H.
Wolfe, and S. K. Sherrod. 2003. Genetic variation within
and among fragmented populations of lesser prairie-
chickens (Tympanuchus pallidicinctus). Molecular Ecology
12:675–683.
Van Oosterhout, C., W. F. Hutchinson, D. P. M. Wills, and
P. Shipley. 2004. micro-checker: software for identifying
and correcting genotyping errors in microsatellite data.
Molecular Ecology Notes 4:535–538.
Vitousek, P. M., H. A. Mooney, J. Lubchenco, and J. M.
Melillo. 1997. Human domination of earth’s ecosystems.
Science 277:494–499.
Waples, R. S. 1989. A generalized approach for estimating
effective population size from temporal changes in allele
frequency. Genetics 121:379–391.
Waples, R. S., R. W. Zabel, M. D. Scheuerell, and B. L.
Sanderson. 2008. Evolutionary responses by native species to
major anthropogenic changes to their ecosystems: Pacific
salmon in the Columbia River hydropower system.
Molecular Ecology 17:84–96.
Weir, B. S., and C. C. Cockerham. 1984. Estimating F-statistics
for the analysis of population structure. Evolution 38:1358–
1370.
Wofford, J. E. B., R. E. Gresswell, and M. A. Banks. 2005.
Influence of barriers to movement on within-watershed
genetic variation of coastal cutthroat trout. Ecological
Applications 15:628–637.
Wright, S. 1951. The gnetical structure of populations. Annals
of Eugenics 15:323–354.
Supporting Information
Additional Supporting Information may be found in the
online version of this article:
Figure S1. Relationships between distance from the
source and genetic diversity (AR and Obs H) for the four
species studied here.
Table S1. Description of the microsatellites loci used in
this study.
Please note: Wiley-Blackwell are not responsible for the
content or functionality of any supporting materials sup-
plied by the authors. Any queries (other than missing
material) should be directed to the corresponding author
for the article.
Species-specific responses to fragmentation Blanchet et al.
304 ª 2010 Blackwell Publishing Ltd 3 (2010) 291–304