Embed Size (px)
Citation preview

DOI: 10.1126/science.1220893, 1536 (2012);337 Science
et al.Christopher B. KaelinWild CatsSpecifying and Sustaining Pigmentation Patterns in Domestic and
This copy is for your personal, non-commercial use only.
clicking here.colleagues, clients, or customers by , you can order high-quality copies for yourIf you wish to distribute this article to others
here.following the guidelines
can be obtained byPermission to republish or repurpose articles or portions of articles
): September 20, 2012 www.sciencemag.org (this information is current as of
The following resources related to this article are available online at
http://www.sciencemag.org/content/337/6101/1536.full.htmlversion of this article at:
including high-resolution figures, can be found in the onlineUpdated information and services,
http://www.sciencemag.org/content/suppl/2012/09/19/337.6101.1536.DC1.html can be found at: Supporting Online Material
http://www.sciencemag.org/content/337/6101/1536.full.html#ref-list-1, 14 of which can be accessed free:cites 33 articlesThis article
http://www.sciencemag.org/cgi/collection/geneticsGenetics
subject collections:This article appears in the following
registered trademark of AAAS. is aScience2012 by the American Association for the Advancement of Science; all rights reserved. The title
CopyrightAmerican Association for the Advancement of Science, 1200 New York Avenue NW, Washington, DC 20005. (print ISSN 0036-8075; online ISSN 1095-9203) is published weekly, except the last week in December, by theScience
on
Sep
tem
ber
20, 2
012
ww
w.s
cien
cem
ag.o
rgD
ownl
oade
d fr
om
tion involves a large displacement of H1, sta-bilized by new salt bridges with b-tubulin, and anopening of CC1 at the base of the stalk (Fig. 4E).The movements of H1 and CC1 likely constrainthe registries that can be explored by the stalk,biasing the distribution toward the high-affinitya registry (Fig. 4E). Propagation of this signal tothe head would elicit conformational changesthat produce a movement of the linker domainand a displacement of dynein toward the MTminus end.
Our analysis of dynamic salt bridges revealsthat cytoplasmic dynein has been selected forsubmaximal processivity. Whereas kinesin hasdiversified its functional repertoire through geneduplication and divergence (33), cytoplasmicdynein is expressed from a single locus andmay have evolved suboptimal processivity to in-crease the dynamic range of its regulation. Highprocessivity could also be detrimental when mul-tiple dyneins and kinesins must balance theiractions on a single cargo (34). Consistent withthis idea, intraflagellar dyneins, responsible forlong, unidirectional transport within cilia (35, 36),contain neutral or basic residues at the equiva-lent of H6-E3378 (fig. S12), which would likelyincrease their processivity.
References and Notes1. I. R. Gibbons, Cell Motil. Cytoskeleton 32, 136 (1995).2. P. Höök, R. B. Vallee, J. Cell Sci. 119, 4369 (2006).3. R. D. Vale, Cell 112, 467 (2003).4. R. B. Vallee, G. E. Seale, J.-W. Tsai, Trends Cell Biol. 19,
347 (2009).5. R. B. Vallee, J. C. Williams, D. Varma, L. E. Barnhart,
J. Neurobiol. 58, 189 (2004).6. S. A. Burgess, M. L. Walker, H. Sakakibara, P. J. Knight,
K. Oiwa, Nature 421, 715 (2003).
7. A. J. Roberts et al., Cell 136, 485 (2009).8. I. R. Gibbons, B. H. Gibbons, G. Mocz, D. J. Asai,
Nature 352, 640 (1991).9. T. Kon, M. Nishiura, R. Ohkura, Y. Y. Toyoshima,
K. Sutoh, Biochemistry 43, 11266 (2004).10. S. L. Reck-Peterson, R. D. Vale, Proc. Natl. Acad. Sci. U.S.A.
101, 1491 (2004).11. S. L. Reck-Peterson et al., Cell 126, 335 (2006).12. T. Shima, T. Kon, K. Imamula, R. Ohkura, K. Sutoh,
Proc. Natl. Acad. Sci. U.S.A. 103, 17736 (2006).13. A. P. Carter, C. Cho, L. Jin, R. D. Vale, Science 331, 1159
(2011).14. T. Kon, K. Sutoh, G. Kurisu, Nat. Struct. Mol. Biol. 18,
638 (2011).15. M. P. Koonce, J. Biol. Chem. 272, 19714 (1997).16. M. A. Gee, J. E. Heuser, R. B. Vallee, Nature 390, 636
(1997).17. A. P. Carter et al., Science 322, 1691 (2008).18. I. R. Gibbons et al., J. Biol. Chem. 280, 23960 (2005).19. T. Kon et al., Nat. Struct. Mol. Biol. 16, 325 (2009).20. T. Kon et al., Nature 484, 345 (2012).21. N. Mizuno et al., EMBO J. 23, 2459 (2004).22. C. V. Sindelar, K. H. Downing, J. Cell Biol. 177, 377
(2007).23. C. V. Sindelar, K. H. Downing, Proc. Natl. Acad. Sci. U.S.A.
107, 4111 (2010).24. D. B. Wells, A. Aksimentiev, Biophys. J. 99, 629
(2010).25. J. Löwe, H. Li, K. H. Downing, E. Nogales, J. Mol. Biol.
313, 1045 (2001).26. L. G. Trabuco, E. Villa, K. Mitra, J. Frank, K. Schulten,
Structure 16, 673 (2008).27. L. G. Trabuco, E. Villa, E. Schreiner, C. B. Harrison,
K. Schulten, Methods 49, 174 (2009).28. J. Schlitter, M. Engels, P. Krüger, J. Mol. Graph. 12, 84
(1994).29. S. Uchimura, Y. Oguchi, Y. Hachikubo, S. Ishiwata,
E. Muto, EMBO J. 29, 1167 (2010).30. M. P. Koonce, I. Tikhonenko, Mol. Biol. Cell 11, 523
(2000).31. Z. Wang, M. P. Sheetz, Biophys. J. 78, 1955 (2000).32. L. McNaughton, I. Tikhonenko, N. K. Banavali, D. M. LeMaster,
M. P. Koonce, J. Biol. Chem. 285, 15994 (2010).33. E. M. Dagenbach, S. A. Endow, J. Cell Sci. 117, 3
(2004).
34. M. A. Welte, Curr. Biol. 14, R525 (2004).35. C. Iomini, V. Babaev-Khaimov, M. Sassaroli, G. Piperno,
J. Cell Biol. 153, 13 (2001).36. J. A. Laib, J. A. Marin, R. A. Bloodgood, W. H. Guilford,
Proc. Natl. Acad. Sci. U.S.A. 106, 3190 (2009).
Acknowledgments: We thank A. Carter (Laboratory ofMolecular Biology-Medical Research Council) for reagents andadvice, C. Sindelar (Yale), V. Ramey [University of California(UC)–Berkeley], E. Egelman (University of Virginia), andR. Sinkovits (UC–San Diego) for sharing processing scriptsand helpful advice; M. Sotomayor (Harvard) and R. Gaudet(Harvard) for advice concerning MD; J. Hogle (Harvard),M. Strauss (Harvard), and M. Wolf (Harvard) for help with filmand the use of a film scanner; and E. Nogales (UC-Berkeley),N. Francis (Harvard), and D. Pellman (Harvard) for criticallyreading the manuscript, as well as all the members of theLeschziner and Reck-Peterson Labs for advice and helpfuldiscussions. EM data were collected at the Center forNanoscale Systems (CNS), a member of the NationalNanotechnology Infrastructure Network (NNIN), which issupported by the National Science Foundation under NSFaward no. ECS-0335765. CNS is part of Harvard University.MD simulations were run on the Odyssey cluster supported bythe Faculty of Arts and Sciences Science Division ResearchComputing Group, Harvard University. S.L.R.-P. is funded bythe Rita Allen Foundation, the Harvard Armenise Foundation,and an NIH New Innovator award (1 DP2 OD004268-1).A.E.L. was funded in part by a Research Fellowship from theAlfred P. Sloan Foundation. R.H.-L. was supported in part byConsejo Nacional de Ciencia y Tecnología and FundaciónMéxico en Harvard. The cryo-EM map was deposited at theEM Data Bank (EMDB-5439) and pseudo-atomic models at theProtein Data Bank (PDB-3J1T and -3J1U).
Supplementary Materialswww.sciencemag.org/cgi/content/full/337/6101/1532/DC1Materials and MethodsFigs. S1 to S12Tables S1 to S3References (37–53)Movies S1 to S6
2 May 2012; accepted 20 July 201210.1126/science.1224151
Specifying and SustainingPigmentation Patterns in Domesticand Wild CatsChristopher B. Kaelin,1,2* Xiao Xu,3,4* Lewis Z. Hong,2 Victor A. David,3 Kelly A. McGowan,2Anne Schmidt-Küntzel,3,5 Melody E. Roelke,3,6 Javier Pino,7 Joan Pontius,3,6 Gregory M. Cooper,1Hermogenes Manuel,2 William F. Swanson,8 Laurie Marker,5 Cindy K. Harper,9 Ann van Dyk,10Bisong Yue,4 James C. Mullikin,11 Wesley C. Warren,12 Eduardo Eizirik,13,14 Lidia Kos,7Stephen J. O’Brien,3†‡ Gregory S. Barsh,1,2† Marilyn Menotti-Raymond3
Color markings among felid species display both a remarkable diversity and a common underlyingperiodicity. A similar range of patterns in domestic cats suggests a conserved mechanism whoseappearance can be altered by selection. We identified the gene responsible for tabby pattern variationin domestic cats as Transmembrane aminopeptidase Q (Taqpep), which encodes a membrane-boundmetalloprotease. Analyzing 31 other felid species, we identified Taqpep as the cause of the rare kingcheetah phenotype, in which spots coalesce into blotches and stripes. Histologic, genomic expression,and transgenic mouse studies indicate that paracrine expression of Endothelin3 (Edn3) coordinateslocalized color differences. We propose a two-stage model in which Taqpep helps to establish a periodicpre-pattern during skin development that is later implemented by differential expression of Edn3.
The molecular basis and evolutionary var-iation of periodic mammalian color pat-terns have been difficult to investigate from
genetic crosses of model organisms. Domestic cats(Felis catus) exhibit heritable variation of tabbymarkings—mackerel versus blotched—that pro-
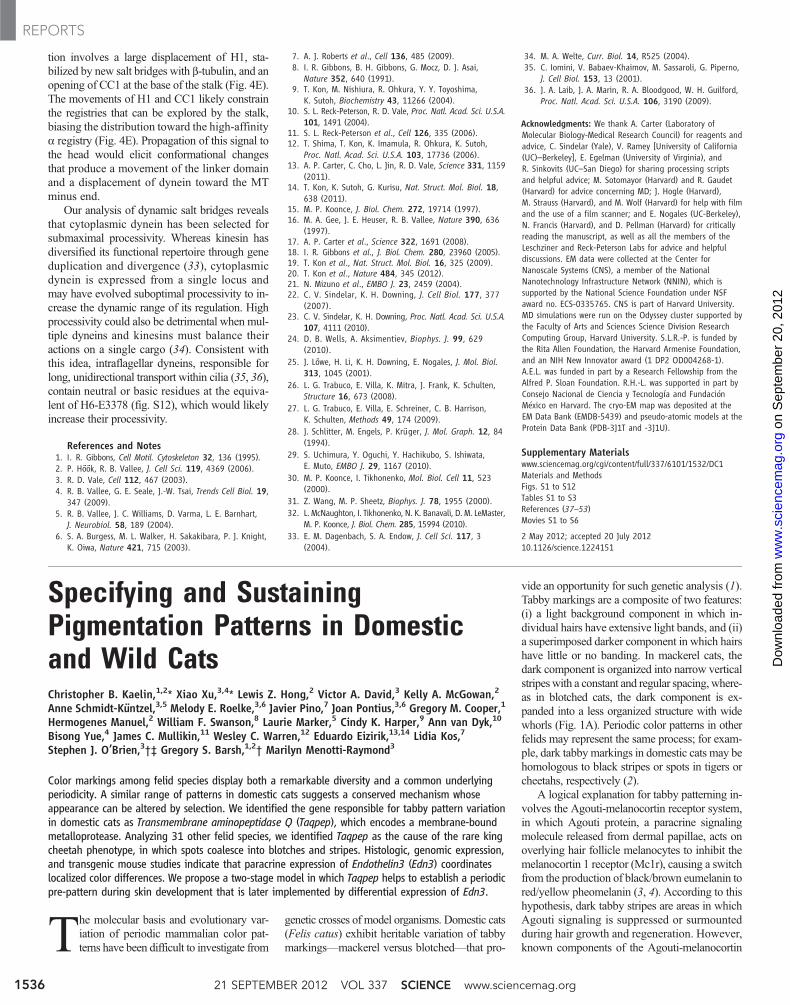
vide an opportunity for such genetic analysis (1).Tabby markings are a composite of two features:(i) a light background component in which in-dividual hairs have extensive light bands, and (ii)a superimposed darker component in which hairshave little or no banding. In mackerel cats, thedark component is organized into narrow verticalstripeswith a constant and regular spacing, where-as in blotched cats, the dark component is ex-panded into a less organized structure with widewhorls (Fig. 1A). Periodic color patterns in otherfelids may represent the same process; for exam-ple, dark tabby markings in domestic cats may behomologous to black stripes or spots in tigers orcheetahs, respectively (2).
A logical explanation for tabby patterning in-volves the Agouti-melanocortin receptor system,in which Agouti protein, a paracrine signalingmolecule released from dermal papillae, acts onoverlying hair follicle melanocytes to inhibit themelanocortin 1 receptor (Mc1r), causing a switchfrom the production of black/brown eumelanin tored/yellow pheomelanin (3, 4). According to thishypothesis, dark tabby stripes are areas in whichAgouti signaling is suppressed or surmountedduring hair growth and regeneration. However,known components of the Agouti-melanocortin
21 SEPTEMBER 2012 VOL 337 SCIENCE www.sciencemag.org1536
REPORTS
on
Sep
tem
ber
20, 2
012
ww
w.s
cien
cem
ag.o
rgD
ownl
oade
d fr
om
pathway do not affect the shape of tabby patterns(1, 2, 5, 6). Instead, the difference betweenmack-erel and blotched is controlled by a single locus,Tabby (Ta), whose genetic position does not sug-gest an obvious candidate gene (7) but whose ef-fects could be manifested via differential controlof melanocortin signaling.
The 3X cat genome assembly is not contig-uous across the Tabby linkage interval (7), butcomparison to homologous regions in the dogand human genomes suggests a candidate inter-val of ~5Mb in length (fig. S1A). OldWorld wildcats, fromwhich domestic cats arose ~10,000 yearsago (8), exhibit a mackerel-like pattern. However,the blotched pattern is common in many modernbreeds, suggesting that one or a few Tab causalvariants would lie in a region of reduced allelicvariation due to recent selection. We used com-parative genomic information to identify single-nucleotide polymorphisms (SNPs) in the candidateinterval, then genotyped and analyzed 16 blotched(Tab/Tab) and 33 mackerel (TaM/TaM or TaM/Tab)animals from a feral population in northern Cali-fornia. Five SNPs from a 180-kb interval on chrA1showed significant association (P range = 9 × 10⁻⁴
to 3.2 × 10⁻⁹) (fig. S1B).Twenty-four markers genotyped in and around
the associated region in 58 blotched and 19mackerel cats indicated that all blotched animalsshared a common haplotype extending for 244 kb,whereas mackerel samples exhibited several hap-lotypes within the same interval (figs. S1C andS2). Coding sequences from three genes are lo-cated within the 244-kb interval: Commd10,LOC644100, and a third gene whose humanortholog has been referred to as both Aminopep-tidase Q and Laeverin (9). No sequence alterationswere observed in LOC644100 or Commd10, butmost blotched cats carried a nonsense mutation,
W841X (Fig. 1B, fig. S2, and table S1), in exon 17of the third gene. We subsequently identified twoadditional variants in the same gene, S59X and
D228N (Fig. 1B, fig. S2, and table S1). This gene isexpressed in developing felid skin, and its loss offunction causes a loss of color pattern periodicity
A
B
S59X (T139N) D228N W841X
.04 .11 .02 .83
Ta b mutant allele:
Frequency:(non-breed cats)
Transmembrane Aminopeptidase Q (Taqpep)
1 990extra-cellular
intra-cellular SAMEN HEXXHX18E
(exopeptidase, 380-384) (zinc binding, 416 - 439)
Mackerel tabby (TaM/TaM or TaM/Tab) Blotched (aka classic) tabby (Tab/Tab)
Fig. 1. (A) Allelic variation at Tabby [mackerel (TaM) is dominant to blotched (Tab)] controls the ar-rangement of dark- and light-colored areas. Diagrams indicate how the distribution of black or browneumelanin versus yellow or pale pheomelanin within individual hairs underlies the macroscopic colorpatterns, although in reality cat hairs frequently exhibit multiple pheomelanic bands. (B) Taqpep encodesa type II membrane protein with aminopeptidase activity encoded by the ectodomain. Mutant allelefrequencies are from a survey of 119 feral and outbred cats (table S1). The T139N allele is associated (P =0.0017, Fisher’s exact test) with an atypical swirled pattern but is incompletely penetrant (table S1 andfig. S2).
Spotted cheetah King cheetahA
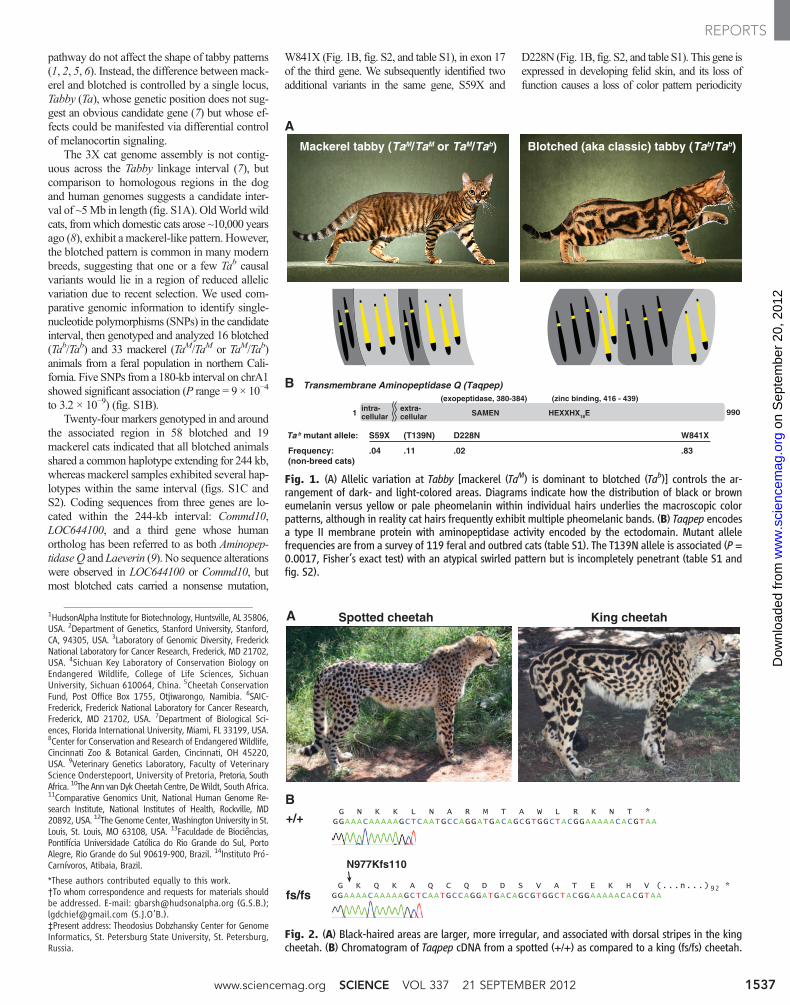
Fig. 2. (A) Black-haired areas are larger, more irregular, and associated with dorsal stripes in the kingcheetah. (B) Chromatogram of Taqpep cDNA from a spotted (+/+) as compared to a king (fs/fs) cheetah.
1HudsonAlpha Institute for Biotechnology, Huntsville, AL 35806,USA. 2Department of Genetics, Stanford University, Stanford,CA, 94305, USA. 3Laboratory of Genomic Diversity, FrederickNational Laboratory for Cancer Research, Frederick, MD 21702,USA. 4Sichuan Key Laboratory of Conservation Biology onEndangered Wildlife, College of Life Sciences, SichuanUniversity, Sichuan 610064, China. 5Cheetah ConservationFund, Post Office Box 1755, Otjiwarongo, Namibia. 6SAIC-Frederick, Frederick National Laboratory for Cancer Research,Frederick, MD 21702, USA. 7Department of Biological Sci-ences, Florida International University, Miami, FL 33199, USA.8Center for Conservation and Research of Endangered Wildlife,Cincinnati Zoo & Botanical Garden, Cincinnati, OH 45220,USA. 9Veterinary Genetics Laboratory, Faculty of VeterinaryScience Onderstepoort, University of Pretoria, Pretoria, SouthAfrica. 10The Ann vanDyk Cheetah Centre, De Wildt, South Africa.11Comparative Genomics Unit, National Human Genome Re-search Institute, National Institutes of Health, Rockville, MD20892, USA. 12The GenomeCenter,WashingtonUniversity in St.Louis, St. Louis, MO 63108, USA. 13Faculdade de Biociências,Pontifícia Universidade Católica do Rio Grande do Sul, PortoAlegre, Rio Grande do Sul 90619-900, Brazil. 14Instituto Pró-Carnívoros, Atibaia, Brazil.
*These authors contributed equally to this work.†To whom correspondence and requests for materials shouldbe addressed. E-mail: [email protected] (G.S.B.);[email protected] (S.J.O’B.).‡Present address: Theodosius Dobzhansky Center for GenomeInformatics, St. Petersburg State University, St. Petersburg,Russia.
www.sciencemag.org SCIENCE VOL 337 21 SEPTEMBER 2012 1537
REPORTS
on
Sep
tem
ber
20, 2
012
ww
w.s
cien
cem
ag.o
rgD
ownl
oade
d fr
om

without obvious effects on other organ systems.Werefer to this gene as Transmembrane Aminopepti-dase Q (Taqpep) and the protein product as Tabulinto reflect its organismal function.
Taqpep encodes a type II membrane-spanningprotein of the M1 aminopeptidase family, whosemembers are characterized by the presence ofGAMEN exopeptidase (SAMEN in Taqpep) andHEXXHX18E zinc-binding motifs in their extra-cellular domains (Fig. 1B) (9). In feral cats, weobserved homozygosity or compound heterozy-gosity for the Tab S59X or W841X alleles in 58out of 58 (58/58) blotched animals, with nophenotypic distinction among the different geno-typic classes, compared to 51/51 mackerel catsthat carried 0 or 1 Tab alleles (table S1). A thirdTab allele, D228N, was found to cosegregate withthe blotched phenotype in a research colony (fig.S2D). In feral cats, we also observed two variantsat codon 139, one of which, T139N, was signif-icantly associated (P = 0.0017, Fisher’s exacttest) with an atypical swirled pattern (figs. S2 andS4D and table S1) and therefore may representhypomorphic or neomorphic activity. Overall,the mutant W841X allele predominates and isresponsible for the strong haplotype signature(fig. S1C), although the S59X allele occurs onthe same haplotype background, in trans toW841X (fig. S2).
Cheetahs (Acinonyx jubatus) with the rareking pattern were originally described as a dis-tinct felid species (10) but were later recognizedas having a monogenic trait with an autosomalrecessive mode of inheritance (11). In king chee-tahs, the black spots coalesce into larger areas,and multiple longitudinal black stripes appearon the dorsum (Fig. 2A). Wild king cheetahshave been sighted only in a small area of sub-Saharan Africa (fig. S3) (11). Taqpep genomicsequence from a captive king cheetah in NorthAmerica revealed a base pair insertion in exon20, predicting a frameshift that replaces whatwould normally be the carboxy-terminal 16 ami-no acids with 109 new residues (N977Kfs110,Fig. 2B). Additional DNA samples from captivecheetahs in a large pedigree demonstrated com-plete cosegregation of the king pattern with theN977Kfs110 mutation [LOD (logarithm of odds)score = 5.7], and further revealed that the mutantallele was introduced into the pedigree by onehomozygous and two heterozygous animals (fig.S3). We did not detect the N977Kfs110 mutationin wild cheetahs caught in Namibia (n = 191),Tanzania (n = 23), or Kenya (n = 3).
Depictions of tabbymarkings from theMiddleAges are mostly mackerel, but the blotched phe-notype increased to a sufficiently high frequencyto be described by Linnaeus in 1758 as character-istic for the domestic cat, predating the formationof most modern breeds. We examined the pre-dicted Tabulin sequence in 351 cats from 24 breeds(table S2) and observed that the W841X allele ispolymorphic inmost breeds ofWestern origin, butrare or absent in Eastern breeds. The high allelefrequency forW841X in Abyssinian (1.0), Birman
(0.71), and Himalayan (0.77) cats is especiallynotable, because tabby markings in these breedsare masked by epistatic interactions. The S59Xallele, probably representing a complete ablation ofprotein function, is most common in NorwegianForest Cats, and we observed one S59X/S59Xhomozygote with a blotched phenotype.
We determined Taqpep sequence for 31 wildfelid species, identifying 130 synonymous and64 nonsynonymous predicted substitutions (fig.S4A). We assessed the potential functional im-pact of the nonsynonymous substitutions withmultivariate analysis of protein polymorphism(MAPP) (12), a quantitative approach that takesinto account both evolutionary conservation andside-chain physicochemical properties. A MAPPscore >10 indicates a likely impact on proteinfunction, and the T139N and D228N substitutionsassociated with atypical swirled and blotched mu-tant phenotypes, respectively, in the domestic cat
yield MAPP scores of 11 (P = 1.5 × 10⁻³) and 14(P= 3.9 × 10⁻⁴) (fig. S4B). In contrast, the T139Avariant in the domestic cat (which does not affectpattern) yields a MAPP score of 3.8. The black-footed cat (Felis nigripes) is a clear outlier fromother Felidae, with five lineage-specific nonsyn-onymous substitutions and a combined MAPPscore of 50 (fig. S4C). F. nigripes exhibits a spot-ting phenotype that is similar to the atypical swirledpattern associated with the T139N allele in do-mestic cats (fig. S4D); thus, recent evolution ofTaqpep in F. nigripes may contribute to its char-acteristic pattern.
To investigate how color patterns are imple-mented, we examined fetal cat skin at 3, 5, and7 weeks of gestation, and observed that the firsthistologic indication of tabby markings coincideswith their external appearance at 7 weeks, whenfollicle architecture is established and hair shaftsbegin to protrude through the epidermal surface
A B
5 wks
7 wks
en face; epidermis up3 wks
darklightdarklight
en face; dermis up
Fig. 3. Skin sections of fetal cats [(A), at 3, 5, and 7 weeks of gestation] stained with hematoxylin andeosin, together with unstained flat-mount (en face) skin preparations of fetal cats [(B), at 7 weeks ofgestation]. The 7-week images in (B) are from an orange (O/Y or O/O) individual, which allows thedark component of the tabby pattern (which is orange-colored) to be more easily visualized. In thetrans-illuminated “dermis-up” panel, hair follicle outlines (dashed red lines) appear light-colored;melanin incorporation and blood vessels appear dark-colored. Scale bars in (A), 150, 50, and 250 mmin 3-, 5-, and 7-week fetal cat sections, respectively, and 50 mm in the 7-week epidermis close-up.Scale bars in (B), 2 mm, 100 mm, and 600 mm in epidermis-up, follicle histology, and dermis-uppanels, respectively.
21 SEPTEMBER 2012 VOL 337 SCIENCE www.sciencemag.org1538
REPORTS
on
Sep
tem
ber
20, 2
012
ww
w.s
cien
cem
ag.o
rgD
ownl
oade
d fr
om
(Fig. 3). At this stage, the boundary between darkand light tabby components reflects differencesin the amount of melanin deposition, with noapparent difference in cell type; melanocytes arepresent in both dark and light areas but producemore melanin in dark areas. Furthermore, thedensity and architecture of hair follicles are in-dependent of localization to dark and light areas(Fig. 3B). This suggests that tabbymarkings arisefrom spatial variation in transcriptional activityrather than cell type distribution.
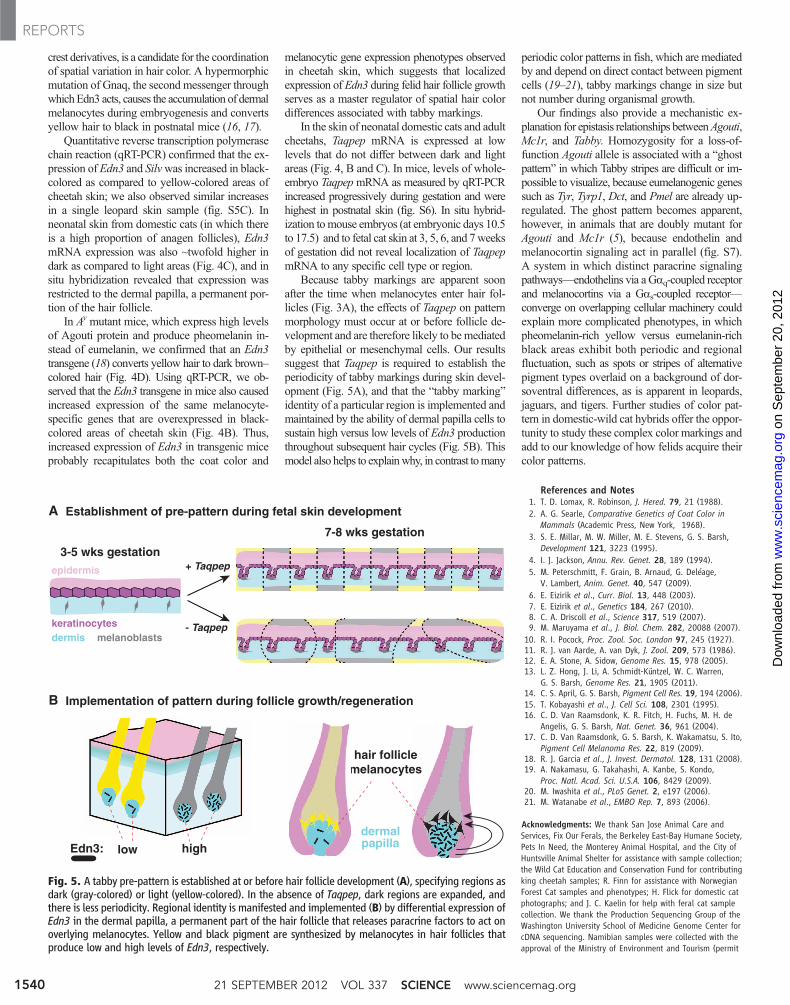
We used the EDGE (EcoP15I-tagged DigitalGene Expression) (13) method for gene expres-sion profiling to examine the transcriptome ofcheetah skin, in which there are sharp boundariesbetween black spots and the yellow interspotareas and for which multiple skin biopsies were
available for study. Cheetah skin exhibits an un-usual histologic architecture; the epidermis isheavily pigmented, and hair follicles are organizedin clusters with extensive accessory structures(Fig. 4A and fig. S5A). However, the numberand size of follicle clusters, as well as the numberof epidermal pigment cells, do not vary betweenblack-haired and yellow-haired areas (fig. S5B).Based on a previous analysis of EDGE resultsfrom a single cheetah, we hypothesized that blackcoloration involves localized alterations of genesdownstream of Mc1r signaling (13). Biopsies ofyellow- and black-colored areas from five differ-ent animals enabled a genome-wide approach,in which the expression of 14,014 genes couldbe measured across a 106-fold dynamic range(Fig. 4B). At a false discovery rate (q) < 0.05, we
identified 74 differentially expressed genes (tablesS7 and S8).
Among 60 genes up-regulated in black as com-pared to yellow cheetah skin, 7 are melanocyte-specific, of which 4 [Tyr (4.9-fold, q=3.8 × 10⁻¹⁹),Silv (7.3-fold,q=1×10−36),Dct (3.2-fold,q=5.3 ×10⁻⁸), and Tyrp1 (3.1-fold, q = 1.7 × 10⁻⁵)] en-code pigment type-switching components (14, 15).Genes that encode ligands or regulators of Mc1rsignaling are not differentially expressed betweenyellow and black cheetah skin (Fig. 4B and tableS7). However, one of the nonmelanocytic genesup-regulated in black as compared to yellowcheetah skin (4.9-fold, q = 2.1 × 10⁻⁴), Edn3, aparacrine hormone expressed mostly by mesen-chymal cells that promotes differentiation andproliferation of melanocytes and other neural
Fig. 4. (A) A cheetah skin biopsy thatincludes a black-yellow boundary (alsosee fig. S6). (B) EDGE (13) determina-tion of differential gene expression inblack- as compared to yellow-coloredareas of cheetah skin. Transcript fre-quency (observationspermillion sequencereads, mean of five samples) is plottedas a function of differential expression.The 74 genes with significant differen-tial expression are shown in black oryellow (FDR < 0.05, see methods andtables S8 and S9); 7 additional pig-mentation genes that are not differen-tially expressed are shown in pink. (C)RelativemRNA levels (mean T SE) for theindicated genes as assessed by qRT-PCRfrompaired samples (n=4) of dark andlight neonatal tabby skin; *P < 0.05(dark versus light, two-tailed t test). Der-mal papilla expression of Edn3 mRNA(purple stain, white arrows) as detectedby in situ hybridization, from a browntabby individual. The left panel illus-trates the expression of Edn3 mRNA inboth pheomelanin- and eumelanin-containing follicles. (D) Phenotypes of2-week-old mice of the indicated geno-types. Relative mRNA levels (mean TSE) for the indicated genes from qRT-PCR of cDNA from control (n = 4) andtransgenic (n= 4)mice are shown; *P<0.05 (Ay versus Ay;Tg.K5-tTA;Tg.TRE-Edn3,two-tailed t test). Scale bars in (A), 40 and200 mmin epidermis and whole-skin sec-tions, respectively. In (C), 60 and20mminleft and right panels, respectively.
Ay;Tg.K5-tTA;Tg.TRE-Edn3
Ay
A
C D
B Cheetah gene expression (EDGE)
Edn3 in situ hybridization
420
103
105
101
10-1
-2
black/yellow (log2 fold-change)
in black spotin yellow bkgnd.
no change
Exp
ress
ion
leve
l (ta
gs/
mill
ion
)Edn3
Trpm1
Tyr
Dct
Defb103Mitf
CorinSlc7a11
PomcTaqpep
Asip
Krtap
Silv
Tyrp1
Mlan1Slc24a5
0
1
2
3
Edn3 Silv Dct Slc7a11 Mitf Taqpep
Rel
ativ
e m
RN
A le
vels
** Light
Dark
Cheetah histology
Cat gene expression
yellow backgnd black spot
Silv Dct Slc7a11Slc24a5 TyrTyrp1 Trpm1
*
***
*
*
0
1
2
3
7
8
Rel
ativ
e m
RN
A le
vels Ay
Ay;Tg.K5-tTA;Tg.TRE-Edn3
Effect of skin-specific Edn3 transgene
www.sciencemag.org SCIENCE VOL 337 21 SEPTEMBER 2012 1539
REPORTS
on
Sep
tem
ber
20, 2
012
ww
w.s
cien
cem
ag.o
rgD
ownl
oade
d fr
om
crest derivatives, is a candidate for the coordinationof spatial variation in hair color. A hypermorphicmutation of Gnaq, the second messenger throughwhichEdn3 acts, causes the accumulation of dermalmelanocytes during embryogenesis and convertsyellow hair to black in postnatal mice (16, 17).
Quantitative reverse transcription polymerasechain reaction (qRT-PCR) confirmed that the ex-pression of Edn3 and Silvwas increased in black-colored as compared to yellow-colored areas ofcheetah skin; we also observed similar increasesin a single leopard skin sample (fig. S5C). Inneonatal skin from domestic cats (in which thereis a high proportion of anagen follicles), Edn3mRNA expression was also ~twofold higher indark as compared to light areas (Fig. 4C), and insitu hybridization revealed that expression wasrestricted to the dermal papilla, a permanent por-tion of the hair follicle.
In Ay mutant mice, which express high levelsof Agouti protein and produce pheomelanin in-stead of eumelanin, we confirmed that an Edn3transgene (18) converts yellow hair to dark brown–colored hair (Fig. 4D). Using qRT-PCR, we ob-served that the Edn3 transgene in mice also causedincreased expression of the same melanocyte-specific genes that are overexpressed in black-colored areas of cheetah skin (Fig. 4B). Thus,increased expression of Edn3 in transgenic miceprobably recapitulates both the coat color and
melanocytic gene expression phenotypes observedin cheetah skin, which suggests that localizedexpression of Edn3 during felid hair follicle growthserves as a master regulator of spatial hair colordifferences associated with tabby markings.
In the skin of neonatal domestic cats and adultcheetahs, Taqpep mRNA is expressed at lowlevels that do not differ between dark and lightareas (Fig. 4, B and C). In mice, levels of whole-embryo TaqpepmRNA as measured by qRT-PCRincreased progressively during gestation and werehighest in postnatal skin (fig. S6). In situ hybrid-ization tomouse embryos (at embryonic days 10.5to 17.5) and to fetal cat skin at 3, 5, 6, and 7weeksof gestation did not reveal localization of TaqpepmRNA to any specific cell type or region.
Because tabby markings are apparent soonafter the time when melanocytes enter hair fol-licles (Fig. 3A), the effects of Taqpep on patternmorphology must occur at or before follicle de-velopment and are therefore likely to bemediatedby epithelial or mesenchymal cells. Our resultssuggest that Taqpep is required to establish theperiodicity of tabby markings during skin devel-opment (Fig. 5A), and that the “tabby marking”identity of a particular region is implemented andmaintained by the ability of dermal papilla cells tosustain high versus low levels of Edn3 productionthroughout subsequent hair cycles (Fig. 5B). Thismodel also helps to explainwhy, in contrast tomany
periodic color patterns in fish, which are mediatedby and depend on direct contact between pigmentcells (19–21), tabby markings change in size butnot number during organismal growth.
Our findings also provide a mechanistic ex-planation for epistasis relationships betweenAgouti,Mc1r, and Tabby. Homozygosity for a loss-of-function Agouti allele is associated with a “ghostpattern” in which Tabby stripes are difficult or im-possible to visualize, because eumelanogenic genessuch as Tyr, Tyrp1, Dct, and Pmel are already up-regulated. The ghost pattern becomes apparent,however, in animals that are doubly mutant forAgouti and Mc1r (5), because endothelin andmelanocortin signaling act in parallel (fig. S7).A system in which distinct paracrine signalingpathways—endothelins via aGaq-coupled receptorand melanocortins via a Gas-coupled receptor—converge on overlapping cellular machinery couldexplain more complicated phenotypes, in whichpheomelanin-rich yellow versus eumelanin-richblack areas exhibit both periodic and regionalfluctuation, such as spots or stripes of alternativepigment types overlaid on a background of dor-soventral differences, as is apparent in leopards,jaguars, and tigers. Further studies of color pat-tern in domestic-wild cat hybrids offer the oppor-tunity to study these complex color markings andadd to our knowledge of how felids acquire theircolor patterns.
References and Notes1. T. D. Lomax, R. Robinson, J. Hered. 79, 21 (1988).2. A. G. Searle, Comparative Genetics of Coat Color in
Mammals (Academic Press, New York, 1968).3. S. E. Millar, M. W. Miller, M. E. Stevens, G. S. Barsh,
Development 121, 3223 (1995).4. I. J. Jackson, Annu. Rev. Genet. 28, 189 (1994).5. M. Peterschmitt, F. Grain, B. Arnaud, G. Deléage,
V. Lambert, Anim. Genet. 40, 547 (2009).6. E. Eizirik et al., Curr. Biol. 13, 448 (2003).7. E. Eizirik et al., Genetics 184, 267 (2010).8. C. A. Driscoll et al., Science 317, 519 (2007).9. M. Maruyama et al., J. Biol. Chem. 282, 20088 (2007).
10. R. I. Pocock, Proc. Zool. Soc. London 97, 245 (1927).11. R. J. van Aarde, A. van Dyk, J. Zool. 209, 573 (1986).12. E. A. Stone, A. Sidow, Genome Res. 15, 978 (2005).13. L. Z. Hong, J. Li, A. Schmidt-Küntzel, W. C. Warren,
G. S. Barsh, Genome Res. 21, 1905 (2011).14. C. S. April, G. S. Barsh, Pigment Cell Res. 19, 194 (2006).15. T. Kobayashi et al., J. Cell Sci. 108, 2301 (1995).16. C. D. Van Raamsdonk, K. R. Fitch, H. Fuchs, M. H. de
Angelis, G. S. Barsh, Nat. Genet. 36, 961 (2004).17. C. D. Van Raamsdonk, G. S. Barsh, K. Wakamatsu, S. Ito,
Pigment Cell Melanoma Res. 22, 819 (2009).18. R. J. Garcia et al., J. Invest. Dermatol. 128, 131 (2008).19. A. Nakamasu, G. Takahashi, A. Kanbe, S. Kondo,
Proc. Natl. Acad. Sci. U.S.A. 106, 8429 (2009).20. M. Iwashita et al., PLoS Genet. 2, e197 (2006).21. M. Watanabe et al., EMBO Rep. 7, 893 (2006).
Acknowledgments: We thank San Jose Animal Care andServices, Fix Our Ferals, the Berkeley East-Bay Humane Society,Pets In Need, the Monterey Animal Hospital, and the City ofHuntsville Animal Shelter for assistance with sample collection;the Wild Cat Education and Conservation Fund for contributingking cheetah samples; R. Finn for assistance with NorwegianForest Cat samples and phenotypes; H. Flick for domestic catphotographs; and J. C. Kaelin for help with feral cat samplecollection. We thank the Production Sequencing Group of theWashington University School of Medicine Genome Center forcDNA sequencing. Namibian samples were collected with theapproval of the Ministry of Environment and Tourism (permit
epidermis + Taqpep
Establishment of pre-pattern during fetal skin development
3-5 wks gestation
7-8 wks gestation
Implementation of pattern during follicle growth/regeneration
- Taqpepdermiskeratinocytes
melanoblasts
hair folliclemelanocytes
dermalpapillaEdn3: low high
A
B
Fig. 5. A tabby pre-pattern is established at or before hair follicle development (A), specifying regions asdark (gray-colored) or light (yellow-colored). In the absence of Taqpep, dark regions are expanded, andthere is less periodicity. Regional identity is manifested and implemented (B) by differential expression ofEdn3 in the dermal papilla, a permanent part of the hair follicle that releases paracrine factors to act onoverlying melanocytes. Yellow and black pigment are synthesized by melanocytes in hair follicles thatproduce low and high levels of Edn3, respectively.
21 SEPTEMBER 2012 VOL 337 SCIENCE www.sciencemag.org1540
REPORTS
on
Sep
tem
ber
20, 2
012
ww
w.s
cien
cem
ag.o
rgD
ownl
oade
d fr
om
1532). Supported in part by the HudsonAlpha Institute forBiotechnology and by the Intramural Research Program of theNIH, National Cancer Institute, Center for Cancer Research,using federal funds under contract N01-CO-12400. L.Z.H. andJ.P. were supported by fellowships from Genentech and theNational Institutes of Health, respectively. A.vD. is the founderand director of the Ann van Dyk Cheetah Centre, a nonprofit
conservation organization. DNA sequence data for this study areavailable at http://genome.wustl.edu/genomes/view/felis_catus/and the NIH Short Read Archive (SRA056885).
Supplementary Materialswww.sciencemag.org/cgi/content/full/337/6101/1536/DC1Materials and Methods
Supplementary TextTables S1 to S9Figs. S1 to S7References (22–36)
22 February 2012; accepted 20 July 201210.1126/science.1220893
Loss of the Tumor Suppressor BAP1Causes Myeloid TransformationAnwesha Dey,1 Dhaya Seshasayee,2 Rajkumar Noubade,2 Dorothy M. French,3 Jinfeng Liu,4Mira S. Chaurushiya,1 Donald S. Kirkpatrick,5 Victoria C. Pham,5 Jennie R. Lill,5Corey E. Bakalarski,4 Jiansheng Wu,5 Lilian Phu,5 Paula Katavolos,6 Lindsay M. LaFave,7Omar Abdel-Wahab,7 Zora Modrusan,8 Somasekar Seshagiri,8 Ken Dong,9 Zhonghua Lin,10Mercedesz Balazs,10 Rowena Suriben,1 Kim Newton,1 Sarah Hymowitz,9Guillermo Garcia-Manero,11 Flavius Martin,2 Ross L. Levine,7 Vishva M. Dixit1*
De-ubiquitinating enzyme BAP1 is mutated in a hereditary cancer syndrome with increased riskof mesothelioma and uveal melanoma. Somatic BAP1 mutations occur in various malignancies.We show that mouse Bap1 gene deletion is lethal during embryogenesis, but systemic orhematopoietic-restricted deletion in adults recapitulates features of human myelodysplasticsyndrome (MDS). Knockin mice expressing BAP1 with a 3xFlag tag revealed that BAP1 interactswith host cell factor–1 (HCF-1), O-linked N-acetylglucosamine transferase (OGT), and the polycombgroup proteins ASXL1 and ASXL2 in vivo. OGT and HCF-1 levels were decreased by Bap1 deletion,indicating a critical role for BAP1 in stabilizing these epigenetic regulators. Human ASXL1 ismutated frequently in chronic myelomonocytic leukemia (CMML) so an ASXL/BAP1 complex maysuppress CMML. A BAP1 catalytic mutation found in a MDS patient implies that BAP1 loss offunction has similar consequences in mice and humans.
Somatic inactivating BAP1 mutations occurin the majority of metastatic uveal mel-anomas and approximately one-quarter of
malignant pleural mesotheliomas. Somatic mu-tations also have been identified in breast, lung,and renal cell cancers (1–5). Recently, germlineBAP1 mutations were linked to a tumor predis-position syndrome characterized by melanocytictumors, mesothelioma, and uveal melanoma(6, 7).
We investigated the normal physiologicalrole of BAP1 using BAP1-deficient mice (fig.S1A). Bap1−/− embryos showed developmen-
tal retardation at embryonic day 8.5 (E8.5) andwere not detected beyond E9.5, indicating thatBAP1 is essential for embryo development (fig.S1, B and C). To bypass this embryonic lethal-ity, we bred mice that expressed the tamoxifen-inducible recombinase creERT2 ubiquitouslyfrom the Rosa26 locus (8) and had Bap1 exons4 and 5 flanked by lox sites (floxed) (fig. S1A).The floxed Bap1 exons were deleted from mostadult mouse tissues at 1 week after daily ta-moxifen injections for 5 days were completed,the brain being the expected exception (fig.S1D). Loss of Bap1 mRNA from hematopoieticlineages at 1 week after the final tamoxifen in-jection was confirmed by quantitative reversetranscription polymerase chain reaction (fig.S1E), and BAP1 protein was no longer detectedin splenocytes by Western blotting (fig. S1F).Within 4 weeks of the last tamoxifen injection,100% of the Bap1fl/fl creERT2+ mice [hereafterreferred to as BAP1 knockout (BAP1 KO) mice]developed splenomegaly (n = 12 mice). Thisphenotype was never observed in Bap1+/+
creERT2+ control mice [hereafter referred to aswild-type (WT) mice] (Fig. 1, A and B). Histo-pathology, flow cytometry, and myeloperoxidaseimmunohistochemistry revealed that splenomeg-aly in the KO mice resulted from extramedullaryhematopoiesis and expansion of the myeloidlineage (Fig. 1, C to E). Myeloid cells also wereincreased in lymph nodes (fig. S2) and bonemarrow (Fig. 1F).
Peripheral blood taken from 11 out of 12 BAP1KO mice at 4 weeks after the final tamoxifen in-jection showed cytological features consistent withmyelodysplasia and ineffective erythropoiesis (Fig.1G). Total leukocyte numbers were elevated (Fig.1H) because of monocytosis (Fig. 1I) and neutro-philia (Fig. 1J), which is consistent with chronicmyelomonocytic leukemia (CMML)–like disease[classified as a myelodysplastic/myeloproliferativedisease according to the new World Health Or-ganization classification of myeloid neoplasms(9)]. Thrombocytopenia was detected as early as1 week after the final tamoxifen injection (Fig.1K), and all diseased mice developed severe pro-gressive anemia (Fig. 1L). We noted morphologicfeatures of erythroid dysplasia, including increasednumbers of nucleated red blood cells, anisopoi-kilocytosis, and prominent basophilic stippling(Fig. 1L). Hypersegmented neutrophils (Fig. 1J),bilobed granulocytes (Fig. 1I), giant platelets (Fig.1K), hyposegmented neutrophils consistent withpseudo-Pelger-Huët anomaly, and atypical im-mature cells with myelomonocytic features werealso observed. Mitotic figures and apoptotic cells(fig. S3) were consistent with human myelodys-plastic syndrome (MDS) (10), whereas blastswere rare. Collectively, these data show thatBap1 deletion produces a myeloproliferative/myelodysplastic disorder with features of humanCMML. Consistent with what is seen in patientswith end-organ damage from myeloid neoplasms,the BAP1 KO heart contained microthrombiwith multifocal necrosis, neutrophilic inflamma-tion, and infiltration of myeloblastic cells (fig. S4).
Given that chronic myeloid neoplasms orig-inate in the phenotypic hematopoietic stem cell(HSC) compartment (11), we characterized thelineage-depleted hematopoietic progenitor cell pop-ulation in the BAP1 KO mice. Lineage-negativeScaI– c-Kit+ myeloid progenitor cells and HSC-enriched lineage-negative ScaI+ c-Kit+ (LSK) cellswere increased in BAP1 KO spleen and bone mar-row as early as 2 weeks after the final tamoxifeninjection (fig. S5A). Given that BAP1 KO micedevelop monocytosis and neutrophilia, BAP1 KOLSK cells harvested 1 month after tamoxifen treat-ment expressed higher levels of a subset of genesinvolved in myelopoiesis [fig. S5, B and C (12)].In methylcellulose colony-forming assays, BAP1KO LSK cells yielded fewer colonies than WTLSK cells (fig. S6, A and B). In addition, unlikecells from WT colonies, which could be replatedafter 10 days in culture to form new colonies, re-plated BAP1 KO cells did not produce well-formed colonies, and many exhibited cytoplasmicblebbing characteristic of apoptosis (fig. S6, Cand D). These in vitro data suggest that BAP1
1Department of Physiological Chemistry, Genentech, 1 DNAWay, South San Francisco, CA 94080, USA. 2Department ofImmunology, Genentech, 1 DNA Way, South San Francisco,CA 94080, USA. 3Department of Pathology, Genentech, 1DNA Way, South San Francisco, CA 94080, USA. 4Departmentof Bioinformatics and Computational Biology, Genentech, 1DNA Way, South San Francisco, CA 94080, USA. 5Departmentof Protein Chemistry, Genentech, 1 DNA Way, South SanFrancisco, CA 94080, USA. 6Department of Safety Assessment,Genentech, 1 DNA Way, South San Francisco, CA 94080, USA.7Human Oncology and Pathogenesis Program and LeukemiaService, Memorial Sloan-Kettering Cancer Center, 1275 YorkAvenue, New York, NY 10065, USA. 8Department of MolecularBiology, Genentech, 1 DNA Way, South San Francisco, CA94080, USA. 9Department of Structural Biology, Genentech, 1DNA Way, South San Francisco, CA 94080, USA. 10Departmentof Translational Immunology, Genentech, 1 DNA Way, SouthSan Francisco, CA 94080, USA. 11MD Anderson Cancer Center,1515 Holcombe Boulevard, Houston, TX 77030, USA.
*To whom correspondence should be addressed. E-mail:[email protected]
www.sciencemag.org SCIENCE VOL 337 21 SEPTEMBER 2012 1541
REPORTS
on
Sep
tem
ber
20, 2
012
ww
w.s
cien
cem
ag.o
rgD
ownl
oade
d fr
om
![GINGIVAL PIGMENTATION · Oral Pigmentation Oral pigmentation is a discolouration of the oral mucosa or gingiva associated with several exogenous and endogenous factors.[1-3] This](https://img.pdfslide.net/doc/110x75/5f82dc5ea46ef73d4a1ef172/gingival-pigmentation-oral-pigmentation-oral-pigmentation-is-a-discolouration-of.jpg)