Embed Size (px)
Citation preview

20
Spectral Imaging as a Tool in Food Research and Quality Monitoring of Food Production
Stina Frosch, Bjørn Skovlund Dissing, Jens Adler-Nissen and Michael Engelbrecht Nielsen
Technical University of Denmark, National Food Institute Denmark
1. Introduction
A forward-looking food industry must obviously continue to develop its production technology to be able to produce foods that meet both present legislation and consumers’ expectations and demands. Ensuring a healthy, secure and sensory food quality, as well as ensuring cost competitiveness / effectiveness is of high importance to survive the strong competition within the field. The high costs in many food-processing areas are primary caused by the extensive use of manual work e.g. for visual inspection of quality parameters and the subsequent sorting or removal of products. However, new production and / or distribution technologies in themselves neither create nor ensure high quality of products or the optimization of the production. This requires knowledge about both new opportunities to create specific production and distribution conditions in combination with knowledge about product response given the production and distribution conditions. Food and food production covers a broad variety of both raw materials and production processes. Therefore, application of new technology cannot be regarded as a simple procurement of accessible standard products but requires research and development including several tests to ensure optimal outcome. The assessment of the visual appearance of food products from size and colour of the product to uniformity of packaging is an important part of the control system in the food supply chain. To ensure that the required standards are met, inspections at all stages from primary production to final retail distribution are needed. However, visual inspection of quality parameters and the subsequent sorting and sometimes also rejection of products by manual work are significant contributors to the total production costs in the food industry. To save costs and to enhance visual quality assessments, automatic vision systems are introduced and tested in many food-manufacturing operations. Vision systems are attractive for online quality assessment and process control, because the methods are rapid, contact free and non-destructive. The introduction of vision systems for quality monitoring in the food manufacturing industry is challenged by the relatively harsh production environment, typically in the form of a high humidity, low / high temperatures, routine wash down and sanitation. The technology is maturing, however, and the special hardware requirements on system design are now met, so that computer-based vision systems are now gaining wider application for quality monitoring in food processing.
www.intechopen.com

Wide Spectra of Quality Control
374
2. The present state-of-the art of vision systems for food quality control
The present state-of-the art vision systems for quality and process control in agriculture and the food processing industries are typically based on traditional trichromatic (Red Green Blue) or grey scale imaging, and related to visual quality characteristics such as size, shape, colour and appearance. Examples on industrial applications of vision systems are in relation to inspection and grading of fruit and vegetables (Chen et al., 2002). Within the fish industry examples include fish species sorting, length and colour measurement with subsequent grading and inspection ensuring right trimming and cutting of the fish (Erikson & Misimi, 2008). It is, however, difficult with most trichromatic or grey-scale vision technologies to reliably distinguish small differences in the appearance of food products. To increase sensitivity and ability to discriminate, the combination of imaging with spectroscopy in the form of spectral imaging technology covering both multi- and hyperspectral imaging seems promising (Geladi et al., 2004). This technology makes use of light reflection at usually a large number of different wavelengths for producing a spectral image attaining both spatial and spectral information simultaneously of an object. Spectral imaging is particularly well suited for applications where it is crucial to detect small differences in texture, colour and surface chemistry (Hansen, 2005; Maletti, 2003; Gomez, 2005; Clemmensen & Ersbøll, 2006; Hansen et al., 2003; Sun, 2010). The spectral images are analysed using advanced data analysis to extract the relevant information e.g. changes in both physical and chemical parameters relating to biological features or processing conditions. The use of spectral imaging is highly advantageous compared to traditional sensors based on point measurements when working with non-uniform material such as food; the full spectral signature for each spatial location (pixel) is obtained and thereby reflecting the natural diversity in the measured sample e.g. as astaxanthin in a fish fillet (Dissing et al., 2011; Frosch et al., 2011). In theory, this allows prediction of the specific quality attribute under consideration for each pixel in the image resulting in an image, which may also be considered as a chemical surface map (Burger & Geladi, 2006). An introduction of spectral image technology will enable measuring of more biological quality parameters at the same time and ensure highly specific information relating to the analysed product. An overview of the fundamentals and recently developed applications of spectral imaging for food quality analysis and control can be found in Sun (2010).
3. Recent developments in food related applications with spectral imaging
New cases from authors’ on-going projects will be used in the following to elucidate the different applications where spectral imaging may play an important role in the future; Process control, process/quality optimization and documentation. Furthermore, the development within spectral imaging is also beneficial within research as illustrated in the last case described.
3.1 Control of extruded food and feed products
Extrusion is a commonly used processing technology both within food and feed production e.g. expanded snacks, breakfast cereals, pastas and fish feed pellets (Gonzalez et al., 2002). Food extrusion is a high-temperature short-time (HTST) technology (Frame, 1994) where the
www.intechopen.com
Spectral Imaging as a Tool in Food Research and Quality Monitoring of Food Production
375
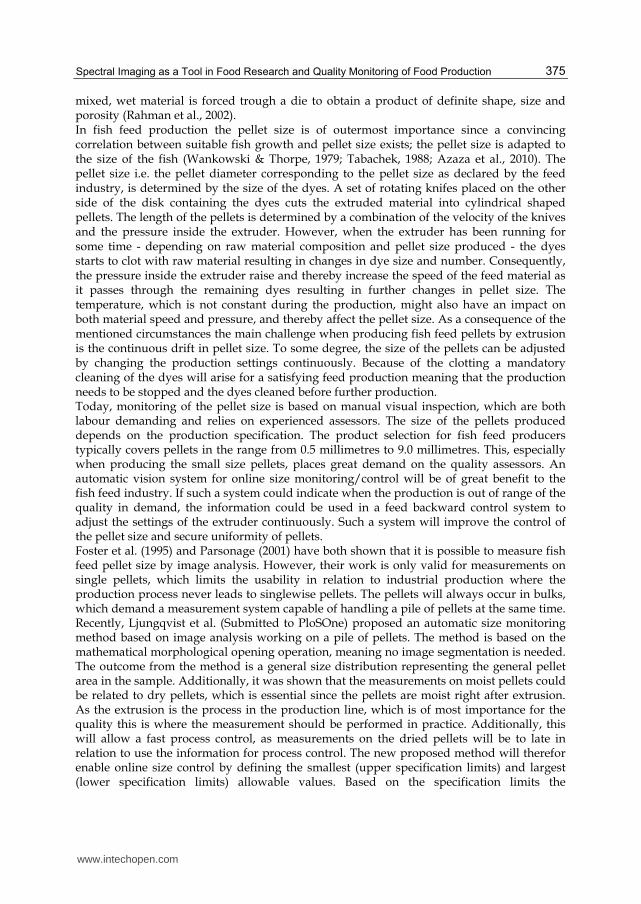
mixed, wet material is forced trough a die to obtain a product of definite shape, size and porosity (Rahman et al., 2002). In fish feed production the pellet size is of outermost importance since a convincing correlation between suitable fish growth and pellet size exists; the pellet size is adapted to the size of the fish (Wankowski & Thorpe, 1979; Tabachek, 1988; Azaza et al., 2010). The pellet size i.e. the pellet diameter corresponding to the pellet size as declared by the feed industry, is determined by the size of the dyes. A set of rotating knifes placed on the other side of the disk containing the dyes cuts the extruded material into cylindrical shaped pellets. The length of the pellets is determined by a combination of the velocity of the knives and the pressure inside the extruder. However, when the extruder has been running for some time - depending on raw material composition and pellet size produced - the dyes starts to clot with raw material resulting in changes in dye size and number. Consequently, the pressure inside the extruder raise and thereby increase the speed of the feed material as it passes through the remaining dyes resulting in further changes in pellet size. The temperature, which is not constant during the production, might also have an impact on both material speed and pressure, and thereby affect the pellet size. As a consequence of the mentioned circumstances the main challenge when producing fish feed pellets by extrusion is the continuous drift in pellet size. To some degree, the size of the pellets can be adjusted by changing the production settings continuously. Because of the clotting a mandatory cleaning of the dyes will arise for a satisfying feed production meaning that the production needs to be stopped and the dyes cleaned before further production. Today, monitoring of the pellet size is based on manual visual inspection, which are both labour demanding and relies on experienced assessors. The size of the pellets produced depends on the production specification. The product selection for fish feed producers typically covers pellets in the range from 0.5 millimetres to 9.0 millimetres. This, especially when producing the small size pellets, places great demand on the quality assessors. An automatic vision system for online size monitoring/control will be of great benefit to the fish feed industry. If such a system could indicate when the production is out of range of the quality in demand, the information could be used in a feed backward control system to adjust the settings of the extruder continuously. Such a system will improve the control of the pellet size and secure uniformity of pellets. Foster et al. (1995) and Parsonage (2001) have both shown that it is possible to measure fish feed pellet size by image analysis. However, their work is only valid for measurements on single pellets, which limits the usability in relation to industrial production where the production process never leads to singlewise pellets. The pellets will always occur in bulks, which demand a measurement system capable of handling a pile of pellets at the same time. Recently, Ljungqvist et al. (Submitted to PloSOne) proposed an automatic size monitoring method based on image analysis working on a pile of pellets. The method is based on the mathematical morphological opening operation, meaning no image segmentation is needed. The outcome from the method is a general size distribution representing the general pellet area in the sample. Additionally, it was shown that the measurements on moist pellets could be related to dry pellets, which is essential since the pellets are moist right after extrusion. As the extrusion is the process in the production line, which is of most importance for the quality this is where the measurement should be performed in practice. Additionally, this will allow a fast process control, as measurements on the dried pellets will be to late in relation to use the information for process control. The new proposed method will therefor enable online size control by defining the smallest (upper specification limits) and largest (lower specification limits) allowable values. Based on the specification limits the
www.intechopen.com

Wide Spectra of Quality Control
376
information can be used for control charts in relation to statistical process control. Based on the information from the process the machine settings of the extruder can be adjusted to ensure that the right pellet size is produced and if necessary stop the production. Another process in the fish feed production where image analysis can be applied for online measurement is in the control of the pellet coating procedure. Some feed-recipes intended for salmonids include coating of pellets with astaxanthin. Astaxanthin is a naturally occurring carotenoid with a high antioxidant activity essential for reproduction, growth and survival, and important for the development of the red colour in salmonid fishes (Owen, 1991). As fish cannot synthesize carotenoids de novo their intake rely on the content of carotenoids in the feed. Astaxanthin is highly expensive and even though it only constitutes less than 20% of the total fish feed costs, optimization of its use in fish feed production is of importance for a cost effective fish feed production. Today feed samples are taken from the production line on a regular basis and sent to laboratories for analysis. A fast but not necessarily online measurement system with pellet astaxanthin concentration as output will be a valuable tool in relation to process control and process optimization for the fish feed industry. Due to the coating procedure, that is a batchwise process not allowing any changes during the process, continuous automated monitoring will not be necessary. However directly after the batchwise coating process an automated system could ensure that the pellets contains the right astaxanthin concentration. If the outcome of the measurement gives a value outside the specified limits the operator can either coat the pellets again and / or change the settings for the next batch produced. In a preliminary study of Ljungqvist et al. (2010) it has been shown that it is possible to distinguish between feed pellets with and without astaxanthin coating using multispectral image analysis. The equipment used was a VideometerLab (Videometer A/S, Hørsholm, Denmark), which supports a multispectral resolution of up to 20 wavelengths distributed over the visible and first near infrared region, ranging from 385 nm to 1050 nm. The image resolution is 1280 x 960 pixels. Images of the feed pellets lying separately were captured, and the pellets were segmented from the background using a threshold. A canonical discriminant analysis on the mean pixel values for each pellet gave the best result with a classification correctness of 93%. Despite these promising results much research is still needed before the method is ready for use in the industry. A future challenge is how well the method will work for different concentrations of astaxanthin and different feed recipies. In general, an important issue to take into consideration when evaluating these models is the criteria set by the industry – how precise do the results need to be to be satisfying compared with existing methods? Maybe three intervals e.g. low, middle, high, is enough and not necessarily exact numbers is mandatory.
3.2 Monitoring of frying processes Fried food elements are used in various ready-made meals, which are sold in retail and served in canteens and fast food restaurants around the world. Fried minced meat is used in various production recipes, where the frying treatment gives the meat specific flavour and colour. The flavour and colour is essential for the recipe, and the end consumers high quality demands, which the industry needs to comply to. Frying of minced or small cut meat in large-scale batches is a difficult task, while still complying with consumer quality demands. Different industrial frying procedures used include batchwise frying on large pans or vessels, frying tables or continuous wok (Adler-Nissen, 2002). In order to meet the quality specifications, trained human operators are often judging the quality of the meat frying process by visual inspection.
www.intechopen.com

Spectral Imaging as a Tool in Food Research and Quality Monitoring of Food Production
377
Monitoring frying processes using automated methods poses different challenges than monitoring meat quality in general. When monitoring the meat frying process, the browning of the meat through mainly Maillard reactions must be closely followed through the whole process. The Maillard reactions create melanoidins giving the fried meat its distinctive brown colour and many of its organoleptic properties (Nursten, 2005). Controlling the browning process of the meat requires accurate control of the frying parameters. Continues sampling can be performed by non-contact methods as for example with an imaging device designed to measure reflected electromagnetic radiation from the meat. By simultaneously inspection of visual and near infrared wavelengths, disorders caused by thermal radiation may be avoided, without lose of ability to quantify colours and correlations with chemical compounds such as fat and water in the frying meat. The imaging technology enables the monitoring of a spatial distribution of water content and melanoidin production giving a dense surface sampling of large batches. A successive sampling may be used to create a feedback loop to control the frying media and thus create a fully automated frying system. In an experiment described in Daugaard et al. (2010), minced meat has been monitored during frying. In the experiment meat was fried with variations both in frying time and temperature (see Table 1).
Time/Temp 120s 160s 200s 240s
200°C I I I I
225°C I A A A
250°C A A A A
I = The frying process have been inadequately processed; A = The frying process have been adequately processed
Table 1. Processing times and categorization of fried minced beef (From Daugaard et al., 2010)
Two skilled experts evaluated the state of the meat as being either inadequately or adequately processed. For each sample a multispectral image was acquired with spectral channels ranging from 430 nm to 970 nm. By training a canonical discriminant function (Fisher, 1936), the multispectral images were projected into a one-dimensional subspace ensuring the distance between the two classes; inadequate and adequate, was maximized. The subspace is used as a score space, termed “frying treatment score”, which describes the browning of the meat. Utilizing this transformation it is possible to visualize the browning distribution as shown in Figure 1. The irregular topology of the minced meat gives rise to scattering effects, which causes spectral differences between granules “peaks” and “valleys”. Granule peaks have been preserved whereas remaining parts have been left out of the analysis using a grey scale morphology technique, known as the H-dome method (Vincent, 1993). A mean value of the frying treatment scores in an area may be used as an overall score of the area. The magnitude of the loadings of the canonical discriminant analysis, wich is illustrated in Figure 2, reveal which wavelengths are most significant for quantifying the browning of the meat. The loadings reveal that the browning is best described as a linear combination of recordings at 970 nm, 700 nm and 470 nm. While the colour reveals the progression of the Maillard reactions, knowledge about future browning may be acquired by learning about the current water content (Nursten, 2005).
www.intechopen.com

Wide Spectra of Quality Control
378
Fig. 1. Frying treatment scores superimposed on RGB (Red Green Blue) representation of multispectral image of minced meat, which was fried at 225°C for 200 seconds. Blue values represents less fried areas, red values represents more fried areas (From Daugaard et al., 2011)
Fig. 2. Canonical Discriminant Function for fried meat samples (From Daugaard et al., 2010)
Because water has a large absorption peak in the near infrared area, quantification of the water content using a spectral camera recording electromagnetic waves in this area is possible as investigated in Dissing et al. (2009). Based on the same data as the quantification of the browning experiment, the water content of each batch was determined using a oven method for water removal. Based on the near infrared spectral reflection values of the granular tops a large feature space was extracted. All pairwise ratios of the near infrared channels and following selection of percentiles in the resulting distributions were used as features. A variable selection procedure known as stepwise selection with a p-value of 0.03 was used to select the linear combination of features which best described the water content. The linear prediction model suggested by the stepwise selection is described in equation 1:
( ) ( ) 9201 970 2 890 1
910
,50% ,99% ,1%y q q qλα λ α λ α ελ
⎛ ⎞= + + +⎜ ⎟⎝ ⎠ (1)
www.intechopen.com

Spectral Imaging as a Tool in Food Research and Quality Monitoring of Food Production
379
αi denotes coefficient values, q(.) denotes the quantile function with two parameters; the wavelength ratio and the quantile-number, and ε is the error term. The model suggest that 970 nm together with 890 nm are the most significant wavelengths for predicting water content in fried minced meat. An absorption peak of water is sensitive to temperature, which means that the model might be different for other temperatures. The experiment was performed at 20°C. Figure 3 shows how the prediction model based on the feature set extracted from the multispectral images correlates very well with the actual water content with a root mean square error of prediction (RMSEP) of 0.50. It is very important to note that when having few data points as in this example, it is necessary to use cross validation to validate the prediction ability with the risk of obtaining an too optimistic model validation outcome.
56
54
52
50
48
46
44
Measu
red
44 46 48 50 52 54 56
Model fit
R2=0.95033
RMSEP=0.49878
Predicted
Fig. 3. Predicted versus measured water content in minced fried meat
Thus, by using a sensible combination of data acquisition techniques, image analysis and statistical methods a system for monitoring frying processes of minced meat may be designed. An advantage is the non-contact probing ensuring that the quality measurement will not cause contamination of the meat sample. Furthermore, the rapidness of the process monitoring and analysing as such will make it possible to conduct process adjustments very fast and could in the future be used to predict the process rather than monitor it directly, and thereby alter process parameters to avoid process drifts.
3.3 Spectral imaging as a method for measuring colouring compounds in salmonid fish The high labour costs of fish processing are predominantly due to the extensive use of manual labour e.g. visual detection of quality parameters and removal of defect products. However, new processing concepts with automation represent a common strategy within the fish industry today (Erikson & Misimi, 2008). Only computer vision can ensure less fatigue, consistent accuracy, higher speed and adjustability, besides offering process-related feedback/ forward among handling and processing machines. Current state-of-the art vision systems for
www.intechopen.com

Wide Spectra of Quality Control
380
quality and process control in the fish processing industries are typically based on traditional trichromatic (Red Green Blue) imaging. However, the aquaculture and fish processing industries are definitely areas where the added information in a spectral image can be exploited to improve the general quality and/or reduce the production cost e.g. assessment of fat and water content distribution in fillets (ElMasry & Wold, 2008), determination of freshness (Chau et al., 2009), detection of nematodes in cod fillets (Wold et al., 2001; Heia et al., 2007) and detection of melanin spots in Atlantic Salmon fillets (Mathiassen et al., 2007). The consumers associate increased intensity of red in salmonid fishes with superior quality, the fish being fresher and having a better flavour (Gormley, 1992; Anderson, 2000). This means that colour is a highly important quality parameter in relation to the commercial production of salmonid fishes. To ensure that farmed salmon and trout achieve coloration that comply with the consumer preferences it is common practice within aquaculture to add astaxanthin to the fish feed. As previously mentioned astaxanthin is highly expensive, and control and optimization of the astaxanthin concentration from feed to fish is of paramount importance for a cost effective salmonid fish production. The traditional methods for determination of astaxanthin in fish meat are based on a chemical extraction of astaxanthin from a sample of minced fish meat, and subsequently determination by spectrophotometric analysis or high-performance liquid chromatography (HPLC) analysis. However, the methods are time consuming, labour demanding and sample destructive. Dissing et al. (2011) investigated the potential of using multispectral imaging for prediction of astaxanthin concentration in rainbow trout, Oncorhynchus mykiss. Fillets from 59 fish where imaged by a VideometerLab (Videometer A/S, Hørsholm, Denmark) prior to determination of the true concentration of astaxanthin by chemical extraction and HPLC analysis. The analysed samples ranged from 0.20 to 4.34 μg astaxanthin per g fish meat. The VideometerLab obtains multispectral images at 19 different wavelengths ranging from 385 to 970 nm (395 nm, 435 nm, 450 nm, 470 nm, 505 nm, 525 nm, 570 nm, 590 nm, 630 nm, 645 nm, 660 nm, 700 nm, 850 nm, 870 nm, 890 nm, 910 nm, 940 nm, 950 nm and 970 nm). After segmentation, removing unwanted information such as background material and arrears assumed to be fat and collagen, the spectra contained in the remaining part, the so-called region of interest (ROI) was transformed to a spectrum based on a mean calculation. Thus each image contributed with a single spectrum for the model calibration. Partial least squares regression [Brown, 1995] was then used to estimate a calibration model between the extracted spectra and reference values (the true values). The model was validated by a test set. The model showed good results with a prediction error expressed as root mean square error of prediction (RMSEP) of 0.27. For comparison a similar model where built for normal colour images, which yielded a RMSEP of 0.45. The results clearly illustrate that multispectral imaging is a promising method for rapid analysis of the astaxanthin concentration of rainbow trout, and thereby a qualified candidate for replacement of ordinary laborious and destructive sampling of astaxanthin for concentration prediction. Additionally, Dissing et al. (2011) and Frosch et al. (2011) illustrated how pixel-wise prediction can be used to get an impression of the spatial distribution of the astaxanthin concentration within the fillet. Figure 3 illustrates the pixel-wise prediction of astaxanthin within the analysed sample. The pixel-wise prediction is color-coded according to the amount of astaxanthin predicted in each pixel, so that pixels with high values of astaxanthin appears red, while low value astaxanthin pixels appear blue.
3.4 Spectral image analysis for monitoring biological process in research The relationship between biological processes in the live organism and subsequent final food quality are an upcoming field of research. Such an understanding will have a huge
www.intechopen.com

Spectral Imaging as a Tool in Food Research and Quality Monitoring of Food Production
381
Fig. 3. Pixel-wise predicted astaxanthin image. The true astaxanthin concentration is determined to be 2.26 μg astaxanthin per g fish meat (From Dissing et al., 2011)
impact on the futures food production as knowing the history and thereby the capabilities of the raw materials can ensure its use in the most profitable way. A linkage between biological mechanisms related to tissue regeneration and texture changes have recently been established in salmonid fishes (Ingerslev et al., 2010a). Observed variations in the texture of the fish fillets relate to changes in structural components in the live organisms as a response to effects of production. It has further been found that changes in fillet texture due to bacterial infections is expressed in the eating quality of the steamed fish fillet whereas the effect is no longer expressed in smoked fillets (Ingerslev et al., 2010b). By knowing the history of the fish it will be possible to ensure that raw material is used in the most optimal way depending on whether the fish has been infected or not. Today these structural changes are monitored by laborious and expensive molecular methods (Ingerslev et al., 2010a). Additionally, the available methods are destructive meaning that it is not possible to follow the individual samples over time. If structural changes in tissue can be examined using image analysis in a non-destructive manner and thus be used to follow impact of the biological process on the subsequent product quality this would be a valuable research tool. In general image analysis making non-destructive sampling possible, unlocks new possibilities to follow biological processes continuously, securing minimal usage of experimental animals and biological facilities. Furthermore the possibility of combining collection of spatial image information and specific individual sample recognition considerably reduces the impact of biological variance. Thus, for example enabling a visual detection of individual specimen’s in a group and thereby overcome differences in experimental setup (Dissing et al., 2011; Schmidt et al., 2011). The individual approach and the unique ability of vision /image analysis to compare on an individual level ensure the implementation of correlation between biological parameters and image data as a frontier in research for the future.
www.intechopen.com

Wide Spectra of Quality Control
382
4. Perspectives for spectral image analysis
Spectral imaging systems are in the process of taking the step from being mainly an academic research tool for application oriented research in a variety of fields, to be developed into a tool for solving real life problems in a variety of applications ranging from airborne remote sensing to online quality control in e.g. the food industry. Image analysis of biological processes on individual level reveal new opportunities to the food processing industry as a unique possibility of single product handling can be the future. The rapid non-destructive measurement of raw material empowers differentiation between individual specimens / batches and thus enabling optimization of the use of raw material on an individual / batch level. An individual/batch sorting will ensure the best quality of the processed raw material where the knowledge from the raw product will be utilized based on known capacities. Ensuring a well designed and implemented traceability system in the production is therefore of significant importance (Frosch Møller, 2005; Frosch et al., 2008). It is expected that vision systems based on spectral imaging will be employed to a much larger extent in the coming years, and that the food processing industry is an area where the added information in a spectral image can be exploited to improve the quality and or reduce the production cost. Some of the challenges for the future implementation of image analysis in quality control of food are the rapid and reliable transfer of complex information to the operators in a logical way. The usage of image analysis is highly depend on which characteristics that explain the quality of a food product. Today the criteria for process control are often based on personal knowledge obtained during many years of practice of the operator. Thus further development within optimal automation of such operations will be dependent on close collaborative research between the food industry and the image analysis scientists to achieve a reliable transfer of the complex data from the image analysis into criteria for making automatic decisions to process control.
5. References
Adler-Nissen J. (2002). The continuous wok – A new unit operation in industrial food processes. Journal of Food Process Engineering, Vol. 25, pp. 435 – 453.
Anderson S. (2000). Salmon color and the consumer. Proceedings of the Tenth Biennial Conference of the International Institute of Fisheries Economics and Trade Presentations, ISBN 0-9763432-2-3, Corvallis: Oregon USA, July, 2000.
Azaza, M.; Dhraief, M.; Kraiem, M. & Baras, E. (2010). Influences of food particle size on growth, size heterogeneity, food intake and gastric evacuation in juvenile Nile tilapia, Oreochromis niloticus, L., 1758. Aquaculture, Vol. 309, pp. 193 - 202.
Burger, J. & Geladi, P. (2006). Hyperspectral NIR imaging for calibration and prediction: a comparison between image and spectrometer data for studying organic and biological samples. The Analyst, Vol. 131, pp. 1152 – 1160.
Chen, Y-R.; Chao, K. & Kim, M.S. (2002). Machine vision technology for agricultural applications. Computers and Electronics in Agriculture, Vol. 36, pp. 173 - 191.
Clemmensen, L. H. & Ersbøll, B. K. (2006). Multispectral recordings and analysis of ́psoriasis lesions. 9th MICCAI Conference Proceedings, pages 15–18. MICCAI ’06 - Workshop on Biophotonics Imaging for Diagnostics and Treatment, Copenhagen, Denmark, October 2006.
www.intechopen.com
Spectral Imaging as a Tool in Food Research and Quality Monitoring of Food Production
383
Daugaard, S. B.; Adler-Nissen, J. & Carstensen, J. M. (2010). New vision technology for multidimensional quality monitoring of continuous frying of meat. Food Control, Vol. 21, No. 5, pp.626 – 632.
Dissing, B. S.; Ersbøll, B. K. & Adler-Nissen, J. (2009). Monitoring water content using multispectral imaging and NIR in a minced meat preparation process. The 14th international conference of Near Infrared Spectroscopy, Bangkok, Thailand, November 2009.
Dissing, B. S.; Nielsen, M. E.; Ersbøll, B. K. & Frosch, S. (2011). Multispectral imaging for determination of astaxanthin concentration in salmonids. PLoS One,, Vol. 6, No. 5, e19032. Doi:10.1371/journal.pone.0019032.
Dissing, B. S.; Schmidt, J. G.; Ersbøll, B. K. & Nielsen, M. E. (2011). Visual effects of β-glucans on wound healing in fish. Scandinavian workshop on imaging food quality (SWIFQ). Ystad, Sweden, May 2011.
ElMasry, G. & Wold, J. P. (2008). High-speed assessment of fat and water content distribution in fish fillets using online imaging spectroscopy. Journal of Agricultural and Food Chemistry, Vol. 56, No. 17, pp. 7672 – 7677.
Erikson, U. & Misimi, E. (2008). Atlantic salmon skin and fillet color changes as affected by perimortem handling stress, rigor mortis and ice storage. Journal of Food Science, Vol. 73, pp. 50-58.
Fisher, R. A. (1936). The use of multiple measurements in taxonomic problems. Annals of Eugenics, Vol. 7, pp. 179 – 188.
Foster, M.; Petrell, R.; Ito, M. R.; Ward, R. (1995). Detection and counting of uneaten food pellets in a sea cage using image analysis. Aquacultural Engineering, Vol. 14, pp. 251-269.
Frame, N. D. (1994). The technology of extrusion cooking. London: Blackie Academic and Professional.
Frosch Møller, S. (2005). The Importance of Data Quality and Traceability in Data Mining. Applications of Robust Methods for Multivariate Data Analysis. Ph.D. Thesis, BioCentrum, Technical University of Denmark.
Frosch S.; Dissing, B. S.; Nielsen, M. E. (2011). Determination of astaxanthin concentration in Rainbow trout (Oncorhynchus mykiss) by multispectral image analysis. 12th Scandinavian Symposium on Chemometrics, Billund, Denmark, 7 - 10 June 2011.
Frosch, S.; Randrup M. & Frederiksen M. T. (2008). Opportunities for the herring industry to optimize operations through information recording, effective traceability systems and use of advanced data analysis. Journal of Aquatic Food Product Technology, Vol. 17, No. 4, pp. 387 - 403.
Gomez, D.D. (2005). Development of an image based system to objectively score the severity of psoriasis. PhD thesis, Informatics and Mathematical Modelling, Technical University of Denmark, DTU, Richard Petersens Plads, Building 321, DK-2800 Kgs. Lyngby.
Gonzalez, R.; Torres, R. & Degreef, D. (2002). Extrusion-coccion de cereales. Boletin, Vol. 36, No. 2, 104e115, SBCTA, Campinas.
Gormley, T.R. (1992). A note on consumer preference of smoked salmon colour. Irish Journal of Agricultural and Food Research, Vol. 31, pp. 199 – 202.
Hansen, M. E.; Lund, F. & Carstensen, J. M. (2003). Visual clone identification of Penicillium commune isolates. Journal of Microbiological Methods, Vol. 52, pp. 221–229.
Hansen, M. E. (2005). Indexing and Analysis of Fungal Phenotypes Using Morphology and Spectrometry. PhD thesis, Informatics and Mathematical Modelling, Technical University of Denmark, DTU, Richard Petersens Plads, Building 321, DK-2800 Kgs. Lyngby.
www.intechopen.com

Wide Spectra of Quality Control
384
Heia, K.; Sivertsen, A. H.; Stormo, S. K.; Elvevoll, E.; Wold, J. P. & Nielsen, H. (2007). Detection of nematodes in cod (Gadus morhua) fillets by imaging spectroscopy. Journal of Food Science, Vol. 72, No. 1, pp. E011 – E015.
Ingerslev, H. C. & Nielsen, M. E. (2010b). Infection of Atlantic Salmon (Salmo salar) by Moritella viscosa induces quality related markers in the musculature. 40th WEFTA Annual Meeting, Izmir, Turkey, 2010.
Ingerslev, H. C.; Lunder, T. & Nielsen, M. E. (2010a). Inflammatory and regenerative responses in salmonids following mechanical tissue damage and natural infection. Fish and Shellfish Immunology, Vol. 29, No. 3, pp. 440-450.
Ljungqvist, M. G.; Frosch, S; Nielsen, M. E. & Ersbøll, B. K. (2010). Analysis of astaxanthin in fish feed pellets. Proceedings of West European Fish Technologists Association, Vol. 40, pp. 59–60, October, Izmir, Tyrkey 2010.
Ljungqvist, M. G.; Nielsen, M. E.; Ersbøll, B. K. & Frosch, S. Image analysis of pellet size for a control system in industrial feed production. Submitted to PLoS One.
Maletti, G. M.(2003). Novelty detection in dermatological images. PhD thesis, Informatics and Mathematical Modelling, Technical University of Denmark, DTU, Richard Petersens Plads, Building 321, DK-2800 Kgs. Lyngby.
Mathiassen, J. R.; Misimi, E. & Skavhaug, A. (2007). A Simple Computer Vision Method for Automatic Detection of Melanin Spots in Atlantic Salmon Fillets. Proceedings of the International Machine Vision and Image Processing Conference, IEEE Computer Society Washington, DC, USA.
Nursten, H. (2005). The Maillard reaction: Chemistry, biochemistry and implications. Culinary and Hospitality Industry Publications Services.
Owen, J. B. (1991). Genetic variation and nutrition - edited by A. P. Simopoulus and B. Childs. Clinical Nutrition, Vol. 10, No. 1, pp.: 61–62.
Parsonage, K. D. (2001). Detection of fish-food pellets in highly-cluttered underwater images with variable illumination. Master thesis, Department of Chemical and Biological Engineering, The University of British Columbia.
Geladi, P.; Burger, J. & Lestander, T. (2004). Hyperspectral imaging: calibration problems and solutions. Chemometrics and Intelligent Laboratory Systems, Vol. 72, pp. 209–217.
Rahman, L.; Rowe, P.; Cheyne, A. & Wilson, D. I. (2002). Ram extrusion of potato starch dough through multiholed dies. Food and Bioproducts Processing, Vol. 80, pp. 12 - 19.
Schmidt, J.; Dissing, B. S.; Ljungqvist, M. G.; Frosch, S.; Ersbøll, B. K. & Nielsen, M. E. (2011). Multispectral imaging of the effects of ß-glucans on wound healing in fish, 12th Scandinavian Symposium of Chemometrics, Billund, Denmark, June, 2011.
Sun, D. W. (2010). Hyperspectral imaging for food quality analysis and control. Academic Press, 2010.
Tabachek, J. L. (1988). The effect of feed particle size on the growth and feed efficiency of Arctic charr [Salvelinus alpinus (L.)]. Aquaculture, Vol. 71, pp. 319-330.
Vincent, L. (1993). Morphological grayscale reconstruction in image analysis: Applications and efficient algorithms. IEEE Transactions on Image Processing, Vol. 2, No. 2, pp. 176 – 201.
Wankowski, J. W. J. & Thorpe, J. E. (1979). The role of food particle size in the growth of juvenile Atlantic salmon (Salmo salar L.). Journal of Fish Biology, Vol.14, pp. 351-370.
Wold, J. P.; Westead, F. & Heia, K. (2001). Detection of parasites in cod fillets by using SIMCA classification in multispectral images in the visible and NIR region. Applied Spectroscopy, Vol. 75, No. 1, pp. 78 – 83.
www.intechopen.com

Wide Spectra of Quality ControlEdited by Dr. Isin Akyar
ISBN 978-953-307-683-6Hard cover, 532 pagesPublisher InTechPublished online 07, July, 2011Published in print edition July, 2011
InTech EuropeUniversity Campus STeP Ri Slavka Krautzeka 83/A 51000 Rijeka, Croatia Phone: +385 (51) 770 447 Fax: +385 (51) 686 166www.intechopen.com
InTech ChinaUnit 405, Office Block, Hotel Equatorial Shanghai No.65, Yan An Road (West), Shanghai, 200040, China
Phone: +86-21-62489820 Fax: +86-21-62489821
Quality control is a standard which certainly has become a style of living. With the improvement of technologyevery day, we meet new and complicated devices and methods in different fields. Quality control explains thedirected use of testing to measure the achievement of a specific standard. It is the process, procedures andauthority used to accept or reject all components, drug product containers, closures, in-process materials,packaging material, labeling and drug products, and the authority to review production records to assure thatno errors have occurred.The quality which is supposed to be achieved is not a concept which can becontrolled by easy, numerical or other means, but it is the control over the intrinsic quality of a test facility andits studies. The aim of this book is to share useful and practical knowledge about quality control in severalfields with the people who want to improve their knowledge.
How to referenceIn order to correctly reference this scholarly work, feel free to copy and paste the following:
Stina Frosch, Bjørn Skovlund Dissing, Jens Adler-Nissen and Michael Engelbrecht Nielsen (2011). SpectralImaging as a Tool in Food Research and Quality Monitoring of Food Production, Wide Spectra of QualityControl, Dr. Isin Akyar (Ed.), ISBN: 978-953-307-683-6, InTech, Available from:http://www.intechopen.com/books/wide-spectra-of-quality-control/spectral-imaging-as-a-tool-in-food-research-and-quality-monitoring-of-food-production

© 2011 The Author(s). Licensee IntechOpen. This is an open access articledistributed under the terms of the Creative Commons Attribution 3.0License, which permits unrestricted use, distribution, and reproduction inany medium, provided the original work is properly cited.