Embed Size (px)
Citation preview
Lauri Laaksonen
SPECTRAL RETINAL IMAGE PROCESSING ANDANALYSIS FOR OPHTHALMOLOGY
Acta Universitatis Lappeenrantaensis 699
Thesis for the degree of Doctor of Science (Technology) to be presented with due permission for public examination and criticism in the Auditorium 4301 at Lappeenranta University of Technology, Lappeenranta, Finland on the 27th
of May, 2016, at noon.

Supervisor Professor Lasse LensuLUT School of Engineering ScienceLappeenranta University of TechnologyFinland
Reviewers Professor Alain TrémeauLaboratory of Computer Graphics and Image VisionDepartment of PhysicsUniversity of Jean MonnetFrance
Professor Emanuele TruccoSchool of ComputingUniversity of DundeeScotland, UK
Opponents Professor Ulla RuotsalainenDepartment of Signal ProcessingTampere University of TechnologyFinland
Professor Emanuele TruccoSchool of ComputingUniversity of DundeeScotland, UK
ISBN 978-952-265-956-9ISBN 978-952-265-957-6 (PDF)
ISSN-L 1456-4491ISSN 1456-4491
Lappeenrannan teknillinen yliopistoYliopistopaino 2016

To my friends and family.


Preface
This thesis consists of work performed during project ReVision, a collaboration of theMachine Vision and Pattern Recognition Laboratory in Lappeenranta University of Tech-nology, Department of Ophthalmology in University of Tampere and Color Research Lab-oratory in University of Eastern Finland (Joensuu). A number of people participated,directly or indirectly, in the work presented in this thesis, and I want to express mygratitude.
Firstly, I want to thank my supervisor Professor Lasse Lensu for the constant guidance,support and ideas, both during the PhD work and earlier. The balanced combinationof direction and individual responsibility made me a considerably better researcher. Ialso want to thank Professor Ela Claridge for supervising my work in Birmingham andhelping with numerous practical matters during my stay, and valued collaboration in theproject.
I want to thank my co-workers and co-authors Professors Markku Hauta-Kasari, Profes-sor Hannu Uusitalo, Dr. Pauli Fält, Dr. Pasi Ylitepsa, Dr. Kati Ådjers, Joni Herttuainenand Antti Hannuksela for rewarding collaboration, and new insights and points of view.I also want to extend my gratitude to Professor Alain Trémeau of the University of JeanMonnet and Professor Emanuele Trucco of the University of Dundee for reviewing thethesis and suggesting many improvements that lead to a significantly better version ofthe thesis. Furthermore, Professor Trucco and Professor Ulla Ruotsalainen of TampereUniversity of Technology have my thanks for agreeing to be the opponents in my thesisdefence.
I wish to thank the whole MVPR laboratory for creating a relaxed, enjoyable and yetprofessional work environment. Doctors Jukka Lankinen, Ekaterina Ryabchenko andNataliya Strokina deserve a special mention. I am thankful for your friendship and ournumerous conversations that were always interesting, often peculiar, and occasionallyrelated to research. I want to thank my parents and my family for teaching me to valueeducation and hard work, and for your unwavering support. It was always appreciated,even though that appreciation was too rarely expressed.
I would like to thank the Academy of Finland for the financial support of the ReVisionproject (No. 259560), and Lappeenrannan teknillisen yliopiston tukisäätiö for the finan-cial support to initiate the thesis work. I also wish to thank Prof. Majid Mirmehdi fromthe University of Bristol, U.K. for assistance with the comparative experiments.
Lappeenranta, May 2016
Lauri Laaksonen

Abstract
Lauri LaaksonenSpectral retinal image processing and analysis for ophthalmologyLappeenranta, 2016159 p.
Acta Universitatis Lappeenrantaensis 699Diss. Lappeenranta University of Technology
ISBN 978-952-265-956-9ISBN 978-952-265-957-6 (PDF)ISSN-L 1456-4491ISSN 1456-4491
Diabetic retinopathy, age-related macular degeneration and glaucoma are the leadingcauses of blindness worldwide. Automatic methods for diagnosis exist, but their perfor-mance is limited by the quality of the data. Spectral retinal images provide a significantlybetter representation of the colour information than common grayscale or red-green-blueretinal imaging, having the potential to improve the performance of automatic diagnosismethods.
This work studies the image processing techniques required for composing spectral retinalimages with accurate reflection spectra, including wavelength channel image registration,spectral and spatial calibration, illumination correction, and the estimation of depth in-formation from image disparities. The composition of a spectral retinal image databaseof patients with diabetic retinopathy is described. The database includes gold standardsfor a number of pathologies and retinal structures, marked by two expert ophthalmolo-gists. The diagnostic applications of the reflectance spectra are studied using supervisedclassifiers for lesion detection. In addition, inversion of a model of light transport is usedto estimate histological parameters from the reflectance spectra.
Experimental results suggest that the methods for composing, calibrating and post-processing spectral images presented in this work can be used to improve the qualityof the spectral data. The experiments on the direct and indirect use of the data showthe diagnostic potential of spectral retinal data over standard retinal images. The use ofspectral data could improve automatic and semi-automated diagnostics for the screeningof retinal diseases, for the quantitative detection of retinal changes for follow-up, clinicallyrelevant end-points for clinical studies and development of new therapeutic modalities.
Keywords: Image processing, spectral imaging, retinal imaging, diabetic retinopathy

Symbols and abbreviations
AMD age-related macular degeneration
AUC area under the curve
BDT binary decision tree
BRISK binary Robust Invariant Scalable Keypoints
BristolDB Bristol retinal image data set
CC correlation coefficient
CCD charge-coupled device
CD2 similarity measure by Myronenko et al.
CLAHE contrast limited adaptive histogram equalisation
CT computed tomography
DiaRetDB1 DiaRetDB1 diabetic retinopathy database
DiaRetDB2 DiaRetDB2 diabetic retinopathy database
DIV difference in variation
DR diabetic retinopathy
ED-DB-ICP edge-driven dual-bootstrap iterative closest point
FA fluorescein angiogram
FCM fuzzy c-means clustering
FNR false-negative rate
FOV field-of-view
FP false positive
FPR false-positive rate
FREAK fast retina keypoint
GDB-ICP generalized dual-bootstrap iterative closest point
GLCM graylevel co-occurrence matrix
GMM Gaussian mixture model
Graph graph-cuts
GrowCut GrowCut algorithm
HMA haemorrhage and microaneurysm
ICP iterative closest point
IRMA intra-retinal microvascular abnormalities
ISOS inner segment/outer segment
KDE kernel density estimate
kNN k-nearest neighbour
Lab CIE Lab
LBP local binary pattern
LBPHF local binary pattern histogram Fourier feature
LED light emitting diode
LSO laser scanning ophthalmoscopy
MAP maximum a posteriori
MC Monte Carlo
MCMC Markov-chain Monte Carlo
MI mutual information
ML maximum likelihood
MP macular pigment
MRI magnetic resonance imaging
MS similarity measure by Cohen and Dinstein
MSER maximally stable extremal regions
MSRM maximal similarity region merging
NB Bayesian probability regions
NCC normalised cross-correlation
NN neural network
NPV negative predictive value
OCT optical coherence tomography
PCA principal component analysis
PDF probability density function
PET positron emission tomography
PPV positive predictive value
QI quality index
RANSAC random sample consensus
RC minimisation of residual complexity
RF random forest
RGB red-green-blue
RMSE root-mean-square error
ROC receiver operating characteristic
ROI region of interest
RPE retinal pigment epithelium
RRGS recursive region-growing segmentation
SAD sum of absolute differences
SAM spectral angle measure
SCM spectral correlation measure
SD-OCT spectral domain optical coherence tomography
SH systemic hypertension
SID spectral information divergence
SIFT scale invariant feature transform
SN sensitivity
SNAKE active contour
SP specificity
SSD sum of squared differences
SURF speeded-up robust feature
SVM support vector machine
SWFCM spatially weighted fuzzy c-means clustering
TH5 Otsu thresholding
TN true negative
TNR true-negative rate
TP true positive
TPR true-positive rate
x a vector
A a matrix
AT the transpose of A
A−1 matrix inversion of A
I identity matrix
s photon propagation step size
φ photon propagation direction
log(x) natural logarithm of x
µt tissue interaction coefficient
µa tissue absorption coefficient
µs tissue scattering coefficient
ξ random number from uniform distribution between [0, 1]
E photon energy
Φ photon scattering azimuthal angle
θ photon scattering deflection angle
g tissue anisotropy factor
db photon distance to tissue boundary
αi angle of incidence (boundary reflection)

ni refractive index of incident medium
nt refractive index of transmission medium
R(αi) likelihood of internal reflection
αt photon angle of transmission
su camera scale factor
du pixel width
dv pixel height
δu(r) radial distortion term
δu(t) tangential distortion term
pd geometric distortion model parameters
p(x) probability of x
µ mean
x sample mean of x
σ standard deviation
σxy covariance of x and y
Σ covariance matrix∑i sum over i
m∑i=n
sum over i from n to m
W weight matrix
T transmittance matrix
η noise term
tλ exposure time of wavelength channel λ
fill estimated illumination field
v0 vector of reflected intensities
v vector of image intensity values
Y intermediate template image
dU image width
αfov horizontal field-of-view angle of camera
R homogeneous rotation matrix
ϕx angle of rotation around x-axis
β vector of illumination field parameters
f camera focal length
α0 radial vignetting factor
γ angle of camera tilt
A ∪B union of A and B

A ∩B intersection of A and B
ω haemoglobin absorption based weight factor
res vector of residual values
P projection matrix
ε reprojection error
logn(x) base n logarithm of x
p(x | y) probability of x given y
C matrix of principal component vectors

Contents
1 Introduction 171.1 Objectives . . . . . . . . . . . . . . . . . . . . . . . . . . . . . . . . . . . . 181.2 Contribution and publications . . . . . . . . . . . . . . . . . . . . . . . . . 191.3 Outline of the thesis . . . . . . . . . . . . . . . . . . . . . . . . . . . . . . 20
2 Spectral fundus imaging and spectral image composition 212.1 Introduction . . . . . . . . . . . . . . . . . . . . . . . . . . . . . . . . . . . 212.2 Related work . . . . . . . . . . . . . . . . . . . . . . . . . . . . . . . . . . 222.3 Spectral fundus image formation . . . . . . . . . . . . . . . . . . . . . . . 25
2.3.1 Structure of the eye . . . . . . . . . . . . . . . . . . . . . . . . . . 272.3.2 Modelling of light interaction with retinal tissue . . . . . . . . . . 28
2.4 Spectral fundus image acquisition . . . . . . . . . . . . . . . . . . . . . . . 332.4.1 30-channel spectral fundus camera . . . . . . . . . . . . . . . . . . 332.4.2 Six-channel spectral fundus camera . . . . . . . . . . . . . . . . . . 35
2.5 Spectral camera calibration . . . . . . . . . . . . . . . . . . . . . . . . . . 362.5.1 Related work . . . . . . . . . . . . . . . . . . . . . . . . . . . . . . 382.5.2 Methods . . . . . . . . . . . . . . . . . . . . . . . . . . . . . . . . . 382.5.3 Experiments and results . . . . . . . . . . . . . . . . . . . . . . . . 432.5.4 Discussion . . . . . . . . . . . . . . . . . . . . . . . . . . . . . . . . 462.5.5 Summary . . . . . . . . . . . . . . . . . . . . . . . . . . . . . . . . 46
2.6 Spectral image composition . . . . . . . . . . . . . . . . . . . . . . . . . . 472.6.1 Related work . . . . . . . . . . . . . . . . . . . . . . . . . . . . . . 472.6.2 Methods . . . . . . . . . . . . . . . . . . . . . . . . . . . . . . . . . 492.6.3 Registration strategy . . . . . . . . . . . . . . . . . . . . . . . . . . 502.6.4 Experiments . . . . . . . . . . . . . . . . . . . . . . . . . . . . . . 512.6.5 Results . . . . . . . . . . . . . . . . . . . . . . . . . . . . . . . . . 602.6.6 Discussion . . . . . . . . . . . . . . . . . . . . . . . . . . . . . . . . 692.6.7 Summary . . . . . . . . . . . . . . . . . . . . . . . . . . . . . . . . 71
2.7 Illumination correction in spectral images . . . . . . . . . . . . . . . . . . 722.7.1 Illumination field estimation using the image spectra . . . . . . . . 732.7.2 Experiments and results . . . . . . . . . . . . . . . . . . . . . . . . 752.7.3 Discussion . . . . . . . . . . . . . . . . . . . . . . . . . . . . . . . . 772.7.4 Summary . . . . . . . . . . . . . . . . . . . . . . . . . . . . . . . . 77
2.8 3D-reconstruction of the retina from spectral images . . . . . . . . . . . . 782.8.1 Methods . . . . . . . . . . . . . . . . . . . . . . . . . . . . . . . . . 802.8.2 Experiments and results . . . . . . . . . . . . . . . . . . . . . . . 832.8.3 Discussion . . . . . . . . . . . . . . . . . . . . . . . . . . . . . . . . 842.8.4 Summary . . . . . . . . . . . . . . . . . . . . . . . . . . . . . . . . 86
3 Spectral image database of diabetic retinopathy patients 893.1 Introduction . . . . . . . . . . . . . . . . . . . . . . . . . . . . . . . . . . . 893.2 Public fundus image databases . . . . . . . . . . . . . . . . . . . . . . . . 903.3 DiaRetDB2 spectral retinal image database with gold standard . . . . . . 91
3.3.1 Human subjects and ethical considerations . . . . . . . . . . . . . 91
3.3.2 Imaging procedure . . . . . . . . . . . . . . . . . . . . . . . . . . . 913.3.3 Gold standard annotations . . . . . . . . . . . . . . . . . . . . . . 913.3.4 Summary . . . . . . . . . . . . . . . . . . . . . . . . . . . . . . . . 93
3.4 Effect of ground truth inaccuracy on lesion classification . . . . . . . . . 933.4.1 Related work . . . . . . . . . . . . . . . . . . . . . . . . . . . . . . 943.4.2 Methods . . . . . . . . . . . . . . . . . . . . . . . . . . . . . . . . . 953.4.3 Experiments and results . . . . . . . . . . . . . . . . . . . . . . . 973.4.4 Discussion . . . . . . . . . . . . . . . . . . . . . . . . . . . . . . . . 1003.4.5 Summary . . . . . . . . . . . . . . . . . . . . . . . . . . . . . . . . 100
3.5 Annotation refinement . . . . . . . . . . . . . . . . . . . . . . . . . . . . 1013.5.1 Related work . . . . . . . . . . . . . . . . . . . . . . . . . . . . . . 1013.5.2 Region refinement through stable probability regions . . . . . . . . 1043.5.3 Experiments and results . . . . . . . . . . . . . . . . . . . . . . . . 1043.5.4 Discussion . . . . . . . . . . . . . . . . . . . . . . . . . . . . . . . . 1083.5.5 Summary . . . . . . . . . . . . . . . . . . . . . . . . . . . . . . . . 108
4 Medical applications of spectral fundus data 1104.1 Introduction . . . . . . . . . . . . . . . . . . . . . . . . . . . . . . . . . . . 1104.2 Lesion detection by supervised classification . . . . . . . . . . . . . . . . . 112
4.2.1 SVM . . . . . . . . . . . . . . . . . . . . . . . . . . . . . . . . . . . 1124.2.2 Gaussian Mixture Models . . . . . . . . . . . . . . . . . . . . . . . 1124.2.3 Neural Networks . . . . . . . . . . . . . . . . . . . . . . . . . . . . 1134.2.4 Random Forests . . . . . . . . . . . . . . . . . . . . . . . . . . . . 1134.2.5 Evaluation . . . . . . . . . . . . . . . . . . . . . . . . . . . . . . . 113
4.3 Histological parameter maps from spectral images . . . . . . . . . . . . . 1144.3.1 Model generation . . . . . . . . . . . . . . . . . . . . . . . . . . . . 1144.3.2 Alignment of model and image data . . . . . . . . . . . . . . . . . 114
4.4 Experiments and results . . . . . . . . . . . . . . . . . . . . . . . . . . . . 1164.4.1 Lesion detection by supervised classification . . . . . . . . . . . . . 1164.4.2 Histological parameter maps from spectral images . . . . . . . . . 119
4.5 Discussion . . . . . . . . . . . . . . . . . . . . . . . . . . . . . . . . . . . . 1244.6 Summary . . . . . . . . . . . . . . . . . . . . . . . . . . . . . . . . . . . . 126
5 Discussion 1345.1 Main contributions . . . . . . . . . . . . . . . . . . . . . . . . . . . . . . . 1345.2 Limitations of the study . . . . . . . . . . . . . . . . . . . . . . . . . . . . 1355.3 Future work . . . . . . . . . . . . . . . . . . . . . . . . . . . . . . . . . . . 135
6 Conclusion 137
Bibliography 139
Appendix
I Spectral image composition 161I.1 Registration method parameters . . . . . . . . . . . . . . . . . . . . . . . 161I.2 Transformation parameter distributions used for sampling . . . . . . . . . 162

II Histological parameter maps from spectral images 164

Chapter I
Introduction
Diabetic retinopathy (DR) , age-related macular degeneration (AMD) and glaucomaare among the leading causes of blindness world wide [78, 109, 186]. In addition to thepersonal impact on quality of life due to impairment or loss of vision, the aforementionedconditions form a significant financial cost to the society in the form of disability benefits,medical care and early retirement. [65,104]
Prolonged high blood glucose levels associated with diabetes damage the capillaries anddisrupt the circulation of blood in the retina. As the delivery of oxygen and nutrientsis disrupted, the growth of new retinal blood vessels accelerates as the retina tries tocircumvent the disrupted circulation. The increased growth rate of vessels can cause adilation of small blood vessels (intra-retinal microvascular abnormalities (IRMA)) and aformation of new vessels. IRMA and neovascularisation lead to a high risk of haemor-rhage, and with the tendency of the new vessels to form over the retina, haemorrhagesmay block light entering the photoreceptors and lead to sudden loss of vision (this pro-cess is known as proliferative diabetic retinopathy). [219] The most common cause ofvisual impairment in diabetic patients is macular edema, a condition where the increasevascular permeability causes exudation and swelling of the macular structures.
AMD is the leading cause of blindness in the elderly [99]. With the ageing of the eyefundus, the metabolism of the retina may begin to slowly deteriorate. Problems withthe metabolism may lead to an accumulation of extracellular material, forming yellow orgrey spots called drusen. The appearance of large drusen in significant numbers has beenassociated with the development of exudative form of AMD that is the most commoncause of AMD-related visual impairment.
Despite the severity of the diseases, a number of treatments exist that can delay or stopthe progression of the pathologies and prevent the loss of vision (e.g., [33, 61, 77, 79, 168,193]). Therefore, early detection of pathology is crucial for effective and cost-effectivetreatment, and preserving the vision of the patient. Diabetic retinopathy (DR) andAMD are typically diagnosed from colour or grayscale fundus images. Fundus imagingoffers a non-invasive view of the human retina, but due to the small aperture (the pupil),
17
18 1. Introduction
the curvature of the fundus, and the optical system of the eye, specialised optics arerequired to acquire an in-focus image of the curved fundus on a flat digital camera sensorarray.
Eye disease screening programs have been implemented [41, 142, 199] to bring patientsin early stages of the disease (who have not yet exhibited symptoms) into the treatmentprogram. Widening the screening programs, however, means a significant increase inthe workload of the ophthalmologists responsible for performing diagnosis based on theimages.
To enable automatic diagnostics and support the screening programs, a significant bodyof work on automatic detection of lesions related to DR and AMD exists (e.g., [23,72,138,161,162, 184,198, 227]). However, automated methods are limited by the available data.Early pathological changes in the retina may be difficult or impossible to automaticallydetect from red-green-blue (RGB) or grayscale fundus images.
Various imaging modalities have been developed to acquire more representative viewsof different features of the eye fundus. These modalities include angiography, retinaloptical coherence tomography (OCT), retinal magnetic resonance imaging (MRI) andlaser scanning ophthalmoscopy (LSO). Products providing multiple modalities in a singledevice have also become available (e.g., [171,222]).
Among the promising relatively recent imaging modalities is spectral fundus imaging.Spectral images combine the benefits of spectroscopy with the field-of-view (FOV) oftraditional retinal imaging. As the spectra are measured simultaneously over the wholeFOV, the analysis of the spectra is not limited to a set of point-wise measurements. Thespectra can be used to better discriminate between different retinal tissues and structuresthan standard RGB colour information, potentially improving segmentation and contrastof the structures.
However, spectral imaging has a number of additional challenges compared to the ac-quisition of traditional grayscale or RGB fundus images. Depending on the approachto spectral fundus imaging, several steps are required to compose a spectral image withcorrect spectral content from the individual channel images. Depending on the system,these steps may include image registration, correcting geometric distortions, correctingbias due to uneven illumination fields in the channel images or due to spectral aberrations,and dealing with artifacts caused by dust and dirt in the optics.
1.1 Objectives
Spectral fundus image data has the potential to significantly improve the automatic diag-nosis of retinal pathologies. The goal of the work in this thesis was to study two availablespectral image acquisition systems and to study and develop methods for composing andpost-processing the spectral channel images acquired by the systems. The challenges ofthe acquisition of accurate retinal spectra are addressed in this work by the study ofregistration, calibration and illumination correction of the retinal spectral images.
One of the main goals of the work was the composition of a database of spectral fundusimages with gold standard of the location of lesions of multiple types, provided by two
1.2 Contribution and publications 19
expert ophthalmologists. Another important goal was to provide examples and consid-erations on the use of the spectral data.
The scope of this work was limited to the acquisition, processing and use of spectralfundus image data in the context of automatic detection of retinal pathologies. Thestudy of automatic detection concentrated on intensity, colour and spectral features ofthe fundus images. In-depth studies into other automatic diagnostic approaches, and themedical and biological study of retinal pathologies were considered out of the scope.
1.2 Contribution and publications
During the thesis work, an evaluation of the performance of a number of image registra-tion methods on spectral fundus image data was performed, and the results were reportedin [129]. An extended study on the registration has been performed and a manuscriptof the study has been submitted for review [128]. The author was responsible for theperforming and reporting of both the initial and the extended studies.
This thesis introduces a method for spectral retinal image illumination correction thatconsiders the consistency of the image spectra. The author has been responsible for thereporting, partially implementing, and planning the implementation of the method.
In addition, an extension of the method by Lin and Medioni [139] for estimating the 3D-structure of the retina from the disparities between retinal images was implemented. Theauthor was responsible for a part of the implementation of the original method, planningthe implementation of the extensions and the reporting of the extended method.
As a part of the ReVision consortium project, methods for visualising spectral imageswith the visual contrast of lesions or retinal structures optimised were developed. Themethods were published in [57]. The author contributed to the quantitative evaluationof the methods and participated in the reporting of the study.
Among the major contributions of the work in this thesis is the gathering of the gold stan-dard annotations for the spectral fundus image database DiaRetDB2 diabetic retinopa-thy database (DiaRetDB2). The author implemented the software tool used for theannotations, guided and supported the annotation work, and was responsible for thedevelopment, implementation and evaluation of the annotation post-processing and thebaseline lesion detection methods.
As a part of the annotation gathering, the effect of ground truth inaccuracy on differentimage features and the possibility of refinement by post-processing of the annotationswas studied. A paper on the annotation refinement work has been published in [131].The annotation refinement manuscript has been extended with results related to therelevance of the annotation accuracy, and the extended manuscript has been submittedfor review [130]. The author was responsible for the development and implementation ofthe post-processing methods, and for the experiments, evaluation and reporting of theresults.
During a research visit in the University of Birmingham, the author participated inthe extension of the inverse modelling of light transport in the retina. The author wasresponsible for improving the original model (Styles et al. [216]), developing approaches
20 1. Introduction
for aligning the model with the image data, and applying the model on data from adifferent spectral retinal imaging system.
The main contributions of the thesis work can be summarised as
• Quantitative evaluation of registration methods for channel image registration.
• Implementation, improvement and evaluation of the method of Lin and Medioni [139]for estimating depth information for retinal images.
• Method for correcting uneven illumination in spectral images.
• Software tool and support for gathering gold standard annotations for DiaRetDB2.
• Study on the effect of ground truth inaccuracy on the performance of supervisedclassifiers.
• A method for post-processing coarse manual annotations.
• Improvement of the light interaction model by Styles et al. [216], and the alignmentof the model with spectral image data.
1.3 Outline of the thesis
The rest of the thesis is structured as follows:
Chapter 2, Spectral fundus imaging and spectral image composition, presents a theory ofspectral fundus image formation and its modelling, detailed descriptions of the imagingequipment utilised in this thesis, considerations and approaches to challenges in spec-tral fundus camera calibration, and the composition of spectral images from individualchannel images. Spectral image composition includes the introduction and quantitativeevaluation of image registration methods and strategies. In addition, certain uniquefeatures (and their use) of spectral images, such as channel-wise independent illumi-nation fields and their correction, and stereo reconstruction from the disparity due tointer-channel eye movement, are discussed.
Chapter 3, Spectral image database of diabetic retinopathy patients, details the acqui-sition and composition of a new publicly available spectral fundus image database withground truth markings by an expert ophthalmologist, DiaRetDB2. The importance ofthe level of spatial accuracy of the ground truth in lesion detection is quantitatively eval-uated for a number of different image features. Methods and quantitative evaluation forthe post-processing of the expert annotations are presented.
Chapter 4, Medical applications of spectral fundus data, discusses the use of the spectralimage data in medical applications. A method for automatic diagnosis based on theclassification of spectral colour features is presented and evaluated. Another applica-tion using inverse modelling of light interaction in retinal tissue to generate histologicalparameter maps of the retina is presented.
Chapter 5, Discussion, presents the implications of the results, and the future workrelated to the content of the thesis.
Chapter 6, Conclusion, summarises the goals, methods, experiments and results, andconcludes the thesis.

Chapter II
Spectral fundus imaging and spectral image composition
2.1 Introduction
Fundus imaging offers a non-invasive view to the eye fundus. A typical modern funduscamera consists of a light source, a digital camera, and microscope optics for both pro-jecting the illumination onto the eye fundus and guiding the light reflected from the eyefundus into the camera. Due to its ease of use and relative inexpensiveness, digital fundusimaging remains the standard method for diagnosing diseases of the eye fundus, such asDR, AMD and glaucoma. Typically either RGB images or grayscale images taken witha red-free filter are used (see Figure 2.1).
(a) RGB. (b) Red-free.
Figure 2.1: Example fundus images from DiaRetDB2.
21
22 2. Spectral fundus imaging and spectral image composition
Other modalities such as OCT, MRI and angiography are available for cases where tra-ditional retinal images are not sufficient for diagnosis or treatment planning, MRI andOCT providing a non-invasive view to the inner structure of the retina, and angiographyproviding a view of the vasculature and retinal blood flow. These, however, require spe-cialised, and often expensive, equipment which are not available in all diagnosis centres.
Spectral fundus cameras capture images of the retina with a significantly higher wave-length resolution than traditional RGB images. Spectral retinal images are, in short,3-dimensional matrices with two spatial and one spectral dimension. Instead of one in-tensity channel of a grayscale, or the three colour channels of an RGB image, the spectraldimension of a spectral image consists of several, tens or even hundreds of channels, de-pending on the imaging system. They can provide information on the eye fundus beyondthat of the traditional fundus cameras with low additional cost or requirements for theoperator.
The analysis of fundus reflectance spectra has been used in a number of medical applica-tions. Retinal reflectance spectroscopy has been used to evaluate the oxygen saturationof retinal blood (e.g., [87, 202]), for the estimation of the concentrations of xanthophyll,melanin and haemoglobin in the retina and choroid (e.g., [84]), and for determining theoptical density of macular pigment (e.g., [20]).
Spectral images have been used to produce improved visualisations of clinically interestingstructures and pathologies. Fält et al. [55] suggest directly modifying the illuminationspectra to optimise the contrast between various retinal structures or lesions, and thefundus background. Another approach to enhanced visualisation of retinal structuresis presented in [57], where the contrast between the structures and the background isoptimised by assigning different weights to the individual channels of the spectral images.
Due to the significant increase in the colour resolution, spectral retinal images offer aricher feature space for automatic detection, classification and diagnosis. Thus, the useof spectral fundus images has the potential to significantly increase the performance ofautomatic diagnostics.
2.2 Related work
The eye has been studied extensively, and a significant body of work on imaging, measur-ing and modelling the eye fundus exists. Various approaches to imaging and quantifyingthe structures, both in vivo and in vitro (usually from animals), and or functional pa-rameters (e.g., blood oxygen saturation) have been developed.
Berendschot et al. [19] review historical and modern instruments for the measurementand applications of fundus reflectance. A number of reflectometers, fundus imaging andvideo systems, and scanning laser ophthalmoscopes are presented. The paper includes areview of reflectance models for various parts of the eye derived from the measurementsof the different systems, as well as the evaluation of the retinal microstructure such asmacular pigment (MP) density, melanin content and retinal blood oxygenation based onthe reflectance measurements.
Historical and present approaches to the MRI of the retina are presented by Duong [53].While the emphasis is on MRI performed on animals, some studies on MRI of the hu-man retina are presented. A more recent review of techniques and instruments used in

2.2 Related work 23
ophthalmology is presented by Keane and Sadda [119]. In addition to retinal imaging,techniques such as adaptive optics, angiography, and spectral imaging are presented. Anumber of methods for retinal OCT are also introduced.
Retinal reflectometry has been used to obtain measurements of various retinal absorbersand to study the reflectance of retinal structures. Delori and Pflibsen [51] used a reflec-tometer based on a modified Carl Zeiss fundus camera to capture the reflectance spectraat nasal fundus, perifovea and fovea of ten healthy subjects. A fundus reflectance modelincluding ocular media, inner limiting membrane, photoreceptor and retinal pigment ep-ithelium (RPE) layers, Bruch’s membrane, choriocapillaris, choroidal stroma and sclerawas derived from the reflectance measurements.
Kaya et al. [118] used fundus reflectance to compare the optical density of MP betweenpatients with AMD and healthy subjects. The fundus reflectance was measured and theoptical density estimated using the system and model in [251]. The optical density ofMP was found to be reduced for patients with AMD.
Berendschot et al. [21] measured the fovea of 435 subjects of age 55 and older using afundus reflectometer to determine whether age-related maculopathy affected the opticaldensity of MP and/or melanin. No differences were found between healthy subjects andsubjects with any stage of age-related maculopathy.
Van de Kraats et al. [229] studied the interaction between light and photoreceptor layer ofthe eye to derive a model of the spectral, directional and bleaching properties of the foveausing the retinal densitometer described in [232]. The model was validated by comparingthe visual pigment density estimated using the model with results from psychophysicalexperiments.
To measure the reflectance spectrum over a specific region of the retina, a number of in-struments for retinal spectroscopy have been developed. Schweitzer et al. [200] presenteda method for measuring the oxygen saturation retinal reflectance spectra. Using a CarlZeiss CS 250 adapted with a Jobin Yvon CP 200 spectrograph, reflection spectra fromline scans over retinal vessels can be acquired. A model based on the transmission ofoxygenated and deoxygenated blood was used to estimate the retinal blood oxygenationlevels from 30 eyes. The mean oxygen saturation was found to be 92.2% for arteries and57.9% for veins.
Delori [49] presented a spectrophotometer capable of both inducing fluorescence andcapturing the reflected or fluorescent light from the fundus. Utilising a motorised filterwheel placed after a 150-W xenon-arc lamp, the system is capable of producing excitationat wavelengths between 430nm and 550 nm. A neutral filter is included for traditionalreflectance measurements. The same optical setup is used for capturing the reflected orfluorescence light.
Zagers et al. [251] described an apparatus for simultaneously measuring the spectralreflectance of the fovea, and the directionality of cone-photoreceptors. A least-squares fitof the model described in [229] to the measured spectra was performed for the purposeof evaluating the densities of photostable ocular absorbers.
Retinal spectroscopy has been used to acquire measurements of various retinal structures.Delori and Burns [50] measured the absorption of the crystalline lens of the human eye in

24 2. Spectral fundus imaging and spectral image composition
vivo on 148 eyes of varying age and retinal health, using a fundus spectrometer. The spec-tra acquired by the spectrometer were corrected for lens back-scatter and fluorescence,and instrument noise using an additional baseline measurement with the illuminationfield in a different position on the retina. Lens density was estimated from the measuredspectra.
Savage et al. [197] compared different non-invasive measurements of the optical densityof the ocular media of 41 healthy subjects. An objective measurement of the spectraltransmission of the lens is gained by comparing the intensity of the reflectance fromthe posterior surface of the lens to an external reference on eight wavelengths. Theresults of the objective measurement were compared with those from a psychophysicalprocedure with low-light condition brightness-matching of the halves of a bipartite fieldafter 15min dark-adaptation. The two approaches were found to correlate well for theshortest measured wavelength, but not at longer wavelengths.
Bone et al. [29] measured the distributions of macular pigment, photopigments andmelanin in the retina. They used a Topcon TRC NW5SF non-mydriatic retinal camerawith the original exciter filter replaced with two multiband interference filters to acquirereflectance maps at wavelengths, where the density of the pigments can be estimatedbased on the amount of light they absorb.
Salyer et al. [194] studied the diffuse spectral reflectance of the fundus using a Spectralonreflectance target inserted into the eye of domestic swine. The target placed in the eyeunder the retina was image in vivo. Spectral images of the fundus with reflectancetarget were acquired using narrow-band illumination at a number of different centralwavelengths.
A number of systems for acquiring spectral retinal images can be found in the literature.Fawzi et al. [60] presented an instrument for fast hyperspectral retinal imaging. Thesystem uses computed tomography to reconstruct images from spectra acquired by animaging spectrometer attached to a fundus camera. The acquired spectra were used torecover MP optical density using spectra measured in vitro as a prior.
Retinal blood oximetry has been presented as either the motivation for or the exampleuse case of many of the spectral retinal imaging systems. Beach et al. [17] describeda modified fundus camera with optics dividing the light reflected from the retina totwo separate band-pass filters to acquire simultaneous dual-wavelength images. Thedual-wavelength images, where one filter is centred at a wavelength where the differencebetween the spectra of oxygenated and deoxygenated blood is significant, and the otherwhere the difference is minimal, were used in retinal oximetry.
In [88], Harvey et al. propose a spectral imaging system capable of acquiring a multi-spectral image in a single exposure. An optical system of polarising beam splitters andwaveplates (a plate that alters the polarisation state of the transmitted light) is used toseparate the desired wavelengths and to guide them to different parts of a sensor array.As the system projects the wavelength channels to different locations on the same sensorarray, spectral resolution of the acquired spectral image comes at the cost of the FOVof the system. The system has been used to study the effect of acute mild hypoxia onretinal oxygen saturation [42].
Hirohara et al. [95] validated their spectral fundus imaging system via oxygen saturationanalysis. The imaging system consisted of a Topcon TRC-50LX fundus camera fitted
2.3 Spectral fundus image formation 25
with a VariSpec liquid crystal tunable filter. The system is capable of acquiring images inthe range 500nm to 720nm with 10nm steps. The validation was performed comparingthe spectra from imaging to the spectra measured from artificial capillaries with knownblood oxygenation levels.
Ramella-Roman et al. [182] presented a multiaperture system for acquiring spectral fun-dus images for estimating the oxygen saturation of the retinal blood. A lenslet array isutilised to project the light passing through an array of narrow-band filters to specificlocations of a charge-coupled device (CCD) array. The system is capable of simultaneousacquisition of fundus images at six different wavelengths.
Mordant et al. [149] use a spectral imaging system based on a liquid crystal tunablefilter for retinal blood oximetry. By nonlinear fitting of the acquired image spectrato a model of (wavelength-dependent) optical density of oxygenated and deoxygenatedhaemoglobin, the ratio of blood oxygenation is estimated at each point of the spectralimage corresponding to a blood vessel. In [150], Mordant et al. validate the performanceof their approach to blood oximetry. The validation was performed by placing samplesof human blood, with reference oxygen saturations measured with a CO oximeter, intoquartz tubes placed inside a model eye. The mean difference between the measuredreference and the estimated oxygenation was found to be approximately 5%.
Rodmell et al. [191] study light propagation through the retina using Monte Carlo sim-ulation. The paper concludes that illumination at the edges of the vessel, and detectiondirectly above the vessel result in the capture of light that has made only a single passthrough the vessel. This has relevance in retinal oximetry where light interaction withother retinal tissue can affect the reflected spectrum and influence the estimated oxygensaturation values.
Based on the reviewed literature, the properties of retinal structures and molecules havebeen studied largely using retinal reflectometry and spectroscopy. An emphasis on themeasurement of the properties of ocular media and retinal absorbers can be found. Var-ious approaches to spectral retinal imaging have been proposed, with an emphasis onretinal blood oximetry. Partly due to the multitude of approaches for image acquisition,general calibration and signal processing to acquire accurate spectra have received lim-ited attention. Calibration and image processing are typically specific to an individualimage acquisition system or measurement. A table summarising the presented literatureis shown in Table 2.1.
2.3 Spectral fundus image formation
While relevant clinical knowledge on the eye fundus and its pathologies may be sufficientto analyse traditional fundus images, to properly understand the characteristics of thespectral fundus image data, insight into the process of spectral fundus image formationis required. As the spectrum of the light reflected from the fundus is affected by theinteraction with retinal tissue, structural changes in the retina due to pathologies changethe measured spectrum. However, visual inspection of the spectra is generally not usefuldiagnostically, and any individual channel is unlikely to be sufficient to identify a specificchange in structure.

26 2. Spectral fundus imaging and spectral image composition
Table 2.1: Summary of literature review.
Category Modality Molecule/microstructure Property Subjects Year Reference(s)Review Various 2003 [19]Review Various 2014 [119]Review MRI 2011 [53]Instrument Spectroscopy Vasculature Oxygenation 1999 [17,200]Instrument Spectral retinal images Vasculature Oxygenation 2005-2011 [88,95,149,150,182]Instrument Spectroscopy, fluorescence 1994 [49]Instrument Spectral retinal images Macular pigment Optical density 2011 [60]Instrument Spectroscopy Ocular absorbers Density 2002 [251]Measurement Reflectometry Macular pigment Optical density 181 2012 [118]Measurement Reflectometry Macular pigment, melanin Optical density 435 2002 [21]Measurement Reflectometry Various Reflectance 10 1989 [51]Measurement Spectroscopy Various Distribution 22 2007 [29]Measurement Spectroscopy Fundus Reflectance 2008 [194]Measurement Densitometry Fovea Various 10 1996 [229]Measurement Spectroscopy Lens Absorption 148 1996 [50]Measurement Spectroscopy Ocular media Optical density 41 2001 [197]
The structures of the eye have a complex effect on the spectrum of the light that isreflected from the eye fundus (see Figure 2.2). Longer wavelengths penetrate deeper intothe fundus, resulting in different tissue interactions than shorter wavelengths. Retinaltissues have significantly different optical properties, with various degrees of absorption,scatter and refraction.
Figure 2.2: Light paths in the retina. [216]
The paths the photons take through the retinal tissue before being reflected back to thedetector have a significant, non-linear effect on the resulting reflectance spectrum. Assome of the photons are reflected from the interfaces and inside the tissue layers, thecontribution of a single layer on the emitted spectrum is difficult to determine.
To the knowledge of the authors, no comprehensive physical model of light interaction

2.3 Spectral fundus image formation 27
with the eye exists. As the reflectance spectrum is the result of reflection, absorption andback-scatter from multiple different layers with various optical properties, and accuratereference measurements are difficult to obtain, the interactions become difficult to modelproperly. However, computational models of the light interaction in retinal tissue havebeen proposed (e.g., [48, 81,181,231]).
2.3.1 Structure of the eye
The human eye is a complex organ, both functionally and structurally. The eye iscomposed of various tissues and media, with significant differences in how they interactwith light entering the eye. This section provides a short description of the differentparts of the eye, their function and optical properties.
Cornea and ocular media
Cornea is the transparent outermost part of the eye. It helps protect the eye fromexternal, often harmful forces, and refracts light to provide a larger field of vision. Behindthe cornea are the (near-) transparent parts of the eye that allow the light entering theeye to be transmitted onto the retina. The transparent ocular media located between thecornea and the eye fundus can be divided into aqueous humor, lens and vitreous humor.
While mostly transparent in the longer wavelengths, the lens absorbs strongly in thenear-ultraviolet and short wavelengths. Furthermore, the absorption of the lens changeswith time, the lens becoming more yellow as the person becomes older. [179]
Retina
The retina consists of several layers with different structures and functions (see Fig-ure 2.3). The main functionality related to the sensing of light is located at the retina.
Figure 2.3: Retinal layers. [219]
Neural retina is the outermost layer of the eye fundus, located between the ocular me-dia and the retinal RPE layer. The neural retina contains the photoreceptors that are

28 2. Spectral fundus imaging and spectral image composition
responsible for converting the photons striking the retina into neural responses to beprocessed by the visual system.
The inner segment/outer segment (ISOS) junction is a structure inside the neural retinathat is assumed to originate from the boundary between the inner and the outer segmentof the photoreceptor [243]. While a separate functional part of the retina, the ISOSjunction interacts with photons passing through the neural retina.
The RPE layer, located below the neural retina, is a pigmented layer that absorbs a largeportion of the scattered light in the retina, reducing false photoreceptor activations. TheRPE also protects the retina from photo-oxidation and subsequent oxidative damage,and take part in many essential processes such as metabolism of the visual pigments,phagocytosis of the photoreceptor outer segments, formation of the blood-retinal barrierand homeostasis of the retinal micro-environment by producing growth factors regulatingthe vital functions like angiogenesis and vascular bed maturation.
Choroid and sclera
The choroidal layer contains connective tissue and vasculature. The choroid is responsiblefor the blood supply of the outer parts of the retina. While not directly a part of theformation of visual stimuli, the choroid is vital for healthy vision as it provides parts ofthe retina with nutrients and oxygen. [90].
The sclera is the white matter of the eye. It forms and maintains the shape of the eyeball.The sclera connects the optical system it surrounds to the muscles responsible for themovement of the eye.
2.3.2 Modelling of light interaction with retinal tissue
The model of light interaction in retinal tissue described in this section extends the modelby Styles et al. [216]. While general structure of the model remains the same, a layermodelling the cornea is added, and the transmittance values of ocular media are altered.
The retinal interaction model discussed in this work is built upon the Monte Carlo (MC)model of light transport in multilayered tissue by Wang et al. [239]. The model simulatesthe transport of an infinitely narrow photon beam in a multilayered tissue of infinitewidth, with the beam perpendicular to the tissue surface. Each layer of the tissue ischaracterised by its thickness, refractive index, absorption and scattering coefficients,and anisotropy factor. A flowchart of the simulation process is shown in Figure 2.4.
At each iteration, the photon takes a step of the size s in the propagation direction φ(initially perpendicular to the tissue layer) before tissue interaction. The step size isdefined
s =− log ξ
µt, (2.1)
where ξ is a random number between [0, 1]. µt is a tissue interaction coefficient definedas µt = µa + µs, where µa and µs are the tissue absorption and scattering coefficients.The photon position is updated by
x = x+ φxsy = y + φysz = x+ φzs
(2.2)
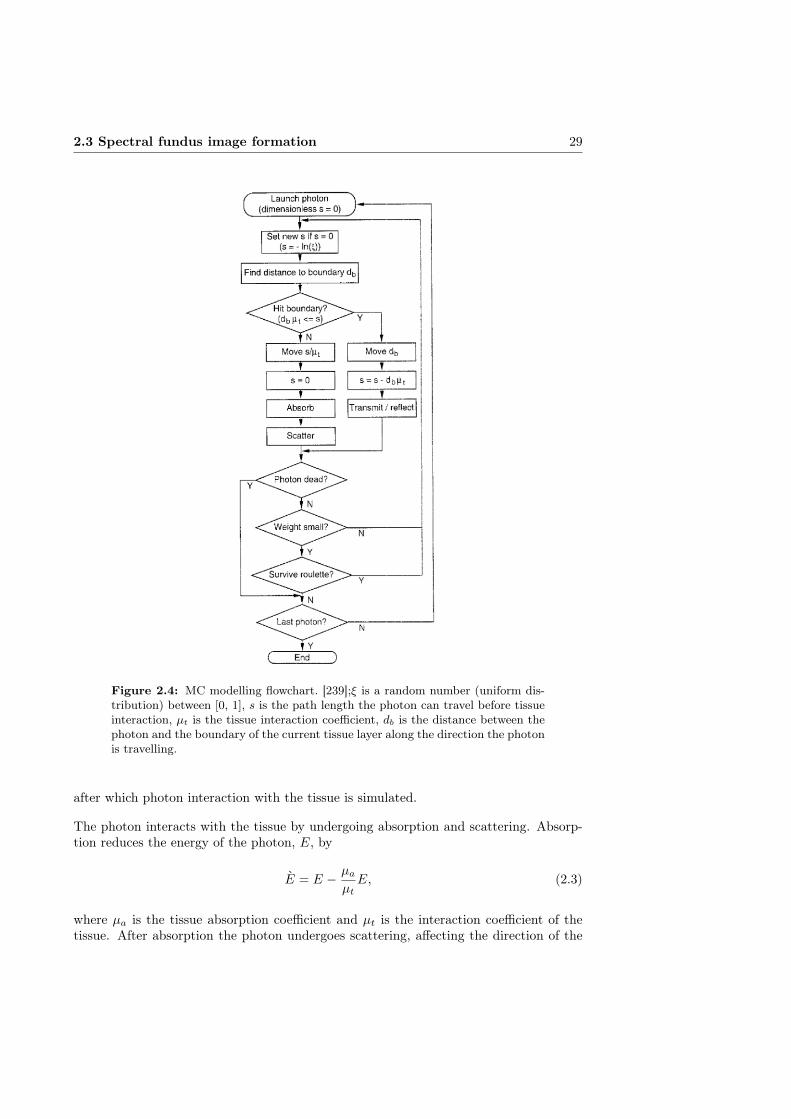
2.3 Spectral fundus image formation 29
Figure 2.4: MC modelling flowchart. [239];ξ is a random number (uniform dis-tribution) between [0, 1], s is the path length the photon can travel before tissueinteraction, µt is the tissue interaction coefficient, db is the distance between thephoton and the boundary of the current tissue layer along the direction the photonis travelling.
after which photon interaction with the tissue is simulated.
The photon interacts with the tissue by undergoing absorption and scattering. Absorp-tion reduces the energy of the photon, E, by
E = E − µaµtE, (2.3)
where µa is the tissue absorption coefficient and µt is the interaction coefficient of thetissue. After absorption the photon undergoes scattering, affecting the direction of the
30 2. Spectral fundus imaging and spectral image composition
photon propagation. The new propagation direction after scattering becomes
φx =sin θ(φxφz cos Φ−φy sin Φ)√
1−φ2z+φx cos θ
φy =sin θ(φyφz cos Φ+φx sin Φ)√
1−φ2z+φy cos θ
φz = sin θ cos Φ√
1− φ2z + φz cos θ,
(2.4)
where Φ is a randomly sampled azimuthal angle defined as Φ = 2πξ. The deflectionangle θ is dependent on the anisotropy of the tissue layer, and is defined as
cos θ =
12g
{1 + g2 −
[1−g2
1−g+2gξ
]2}if g 6= 0
2ξ − 1 if g = 0, (2.5)
where g is the anisotropy factor of the current tissue layer.
During step s, the photon may encounter a tissue boundary. The distance to the closesttissue boundary in the photon propagation direction is defined
db =
(z0 − z)/Φz if Φz < 0∞ if Φz = 0(z1 − z)/Φz if Φz > 0
(2.6)
where z0 and z1 are the z coordinates of the tissue boundaries above and below thecurrent photon position. If the size of the evaluated step s is greater than the distanceto the closest boundary, i.e., dbµt ≤ s, the current step size is reduced to s = s − dbµtand interaction with the tissue boundary is simulated.
Depending on the angle of incidence, αi = cos−1(|µz|), the photon has a chance tobe either transmitted or internally reflected. If αi is greater than the critical anglesin−1(nt/ni), where ni and nt are the refractive indices of the media that the photonis incident from and transmitted to, the likelihood of internal reflection, R(αi) is 1.Otherwise R(αi) is defined
R(αi) =1
2
[sin2(αi − αt)sin2(αi + αt)
+tan2(αi − αt)tan2(αi + αt)
](2.7)
where αt is the angle of transmission, defined as
αt = sin−1
(ni sinαint
). (2.8)
Whether the photon is internally reflected or transmitted to new layer is based on arandom number ξ. If ξ ≤ R(αi) the photon is reflected, otherwise it is transmittedto a new layer. In the case of internal reflection, the photon propagation direction ismirrored, i.e., Φz = −Φz. In the case of transmission, the propagation direction ischanged according to
Φx = Φxni/ntΦy = Φyni/nt
Φz =
{cosαt if Φz ≥ 0− cosαt if Φz < 0
(2.9)
2.3 Spectral fundus image formation 31
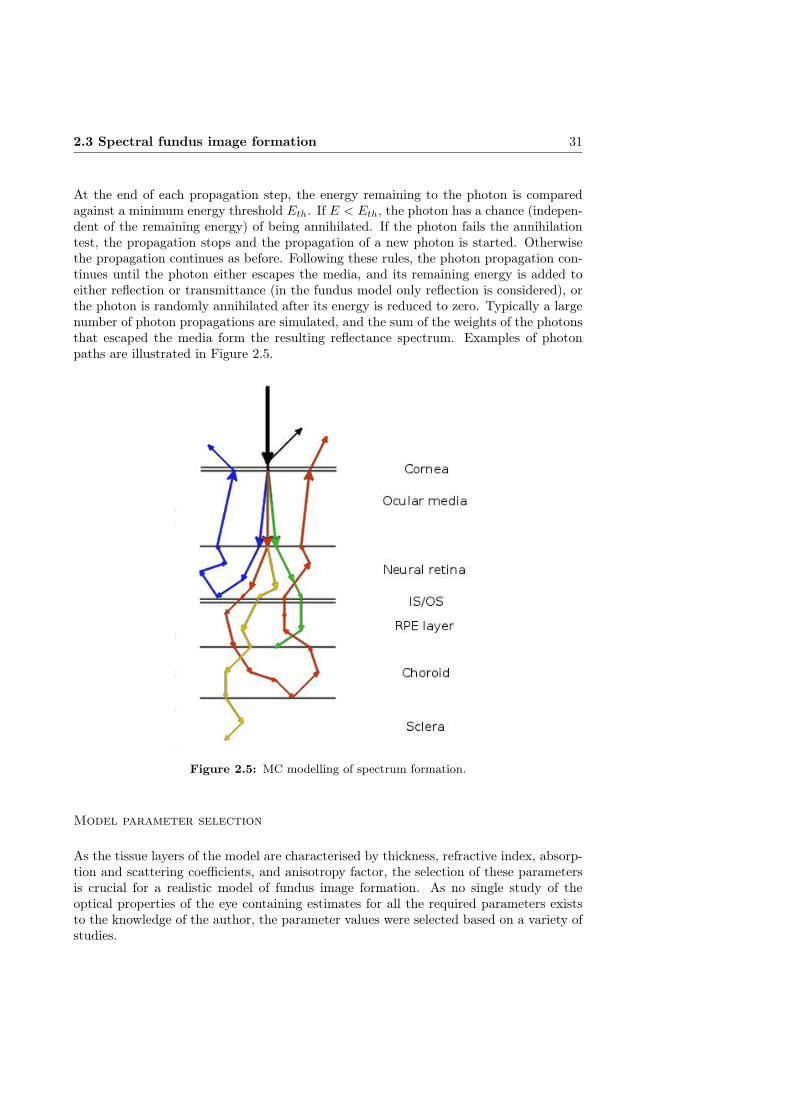
At the end of each propagation step, the energy remaining to the photon is comparedagainst a minimum energy threshold Eth. If E < Eth, the photon has a chance (indepen-dent of the remaining energy) of being annihilated. If the photon fails the annihilationtest, the propagation stops and the propagation of a new photon is started. Otherwisethe propagation continues as before. Following these rules, the photon propagation con-tinues until the photon either escapes the media, and its remaining energy is added toeither reflection or transmittance (in the fundus model only reflection is considered), orthe photon is randomly annihilated after its energy is reduced to zero. Typically a largenumber of photon propagations are simulated, and the sum of the weights of the photonsthat escaped the media form the resulting reflectance spectrum. Examples of photonpaths are illustrated in Figure 2.5.
Figure 2.5: MC modelling of spectrum formation.
Model parameter selection
As the tissue layers of the model are characterised by thickness, refractive index, absorp-tion and scattering coefficients, and anisotropy factor, the selection of these parametersis crucial for a realistic model of fundus image formation. As no single study of theoptical properties of the eye containing estimates for all the required parameters existsto the knowledge of the author, the parameter values were selected based on a variety ofstudies.
32 2. Spectral fundus imaging and spectral image composition
Hammer et al. [83] used the double-integrating-sphere technique to measure the colli-mated and diffuse transmittance, and diffuse reflectance of the retina, RPE, choroid,and sclera layer of the eye fundus. From the measured reflectance and transmittancespectra, the absorption and scattering coefficients, and the anisotropy of scattering wereestimated by inverse MC simulation.
The corneal refractive index used in the model is derived from Fitzke III [68]. The meanof the individual values of the epithelium, stromal anterior and posterior surfaces of thecornea was used to represent the refraction in the cornea.
The transmittance for the ocular media were taken from Boettner and Wolter [28], whomeasured the transmission in human ocular media in vitro from freshly removed eyes.Both the total transmittance and the transmittance of the individual media, cornea,aqueous humor, lens, vitreous humor, were measured. The refractive index reportedin [124] was used for vitreous.
The yellowing of the lens is dependent on the age of the patient and has to be consideredseparately from the model generation. The average lens transmission function for lensesof different ages from [179] was used to correct the simulated spectra to account for theage related lens yellowing. The model spectra were corrected individually based on theage of the patient whose spectral image data was analysed using the model.
Two neural retina layers with identical parameters were used to enable the insertion ofa layer simulating the interface between the neural retinal tissue and the photoreceptorswithin the neural retina layer. The free model parameters retinal haemoglobin andmacular pigment density are present in the neural retina layer. Refractive indices forretina reported by Knighton et al. [124] were used.
An estimate of the refractive index and scattering of the ISOS layer is derived basedon the physical and biological properties of the ISOS junction [43]. The absorptioncoefficient was assumed to follow that of the neural retinal layer.
The RPE layer holds retinal melanin, the distribution of which is a free parameter in themodel. An estimate for the refractive index of the RPE layer is derived by Hammer etal. [85] from literature and OCT measurements.
No reported values of the refraction index of choroid were found in literature. However,no experimental evidence (i.e., a reflection in OCT scan indicative of an interface be-tween layers with different refractive indices) was found of difference in refractive indicesbetween choroid and sclera. There was assumed to be no (significant) difference in therefractive indices of the choroid and the sclera. The similar (collagen matrix) structureof the layers would also support this assumption. [43]
The sclera is the final layer simulated in the model. Any light transmitted throughthe sclera is considered to be completely absorbed or scattered, as the amount of lightsurviving back to the detector after passing to layers below the sclera can safely beassumed to be negligible. The refractive index of the sclera reported by Bashkatov etal. [15] was adopted for the model.
In addition to the characteristic optical properties of the individual layers, the maincontributors to the formation of the spectra are the haemoglobins and melanin, bothof which are strong absorbers, and the thickness of the layers. The model values were
2.4 Spectral fundus image acquisition 33
taken from literature: haemoglobins from Horecker [98], melanin from Anderson andParrish [10], and layer thickness from Rohen [192]. An 80% oxygen saturation level wasassumed for the haemoglobins based on Alm and Bill [9].
The absorption, scatter and refractive indices for the different layers are considered asconstant. The model has five free parameters that can vary within histologically plausiblelimits: concentration of macular pigments in the retina, concentration of haemoglobins inthe retina, concentration of melanin in the RPE, concentration of melanin in the choroidand concentration of haemoglobins in the choroid.
The estimations of the optical characteristics of the retinal molecules RPE melanin andmacular pigment, and haemoglobin can be expected to be relatively accurate as theycan be expected to stay constant between individuals and can be measured in laboratoryconditions. To a lesser degree, similar assumption can be made regarding the cornea, theocular media, and the tissues of the neural retina, RPE, choroid and sclera.
The thickness of the different layers, however, is a subject to greater individual variation.Another potential source of inaccuracy is the level of haemoglobin oxygenation. The levelof oxygenated blood is affected by the phase of circulation, the size of blood vessels at(or near) the location, and changes in circulation due to disease. The model also expectsmajority of the retinal tissue to be free of pathologies and not (significantly) affectedby any systemic disease. As it is not possible to determine what the values of theseparameters were at the time of the acquisition of a spectral retinal image, it is difficultto measure the representativeness of the values used in this work.
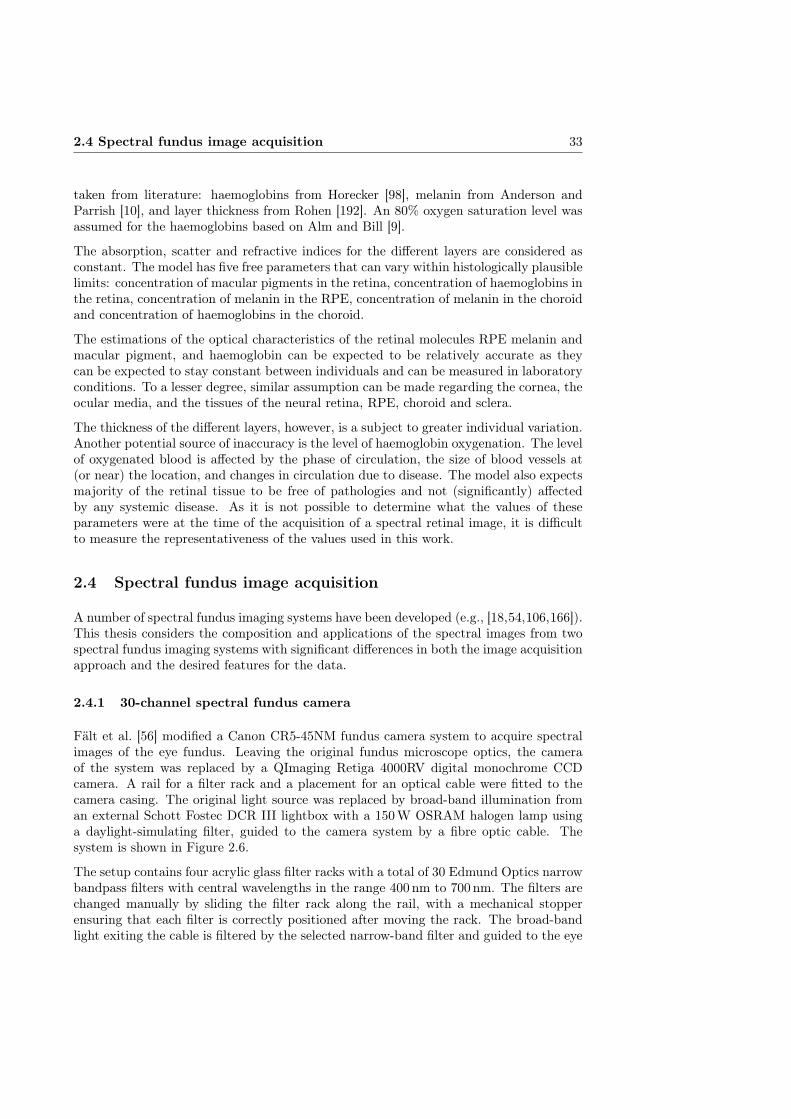
2.4 Spectral fundus image acquisition
A number of spectral fundus imaging systems have been developed (e.g., [18,54,106,166]).This thesis considers the composition and applications of the spectral images from twospectral fundus imaging systems with significant differences in both the image acquisitionapproach and the desired features for the data.
2.4.1 30-channel spectral fundus camera
Fält et al. [56] modified a Canon CR5-45NM fundus camera system to acquire spectralimages of the eye fundus. Leaving the original fundus microscope optics, the cameraof the system was replaced by a QImaging Retiga 4000RV digital monochrome CCDcamera. A rail for a filter rack and a placement for an optical cable were fitted to thecamera casing. The original light source was replaced by broad-band illumination froman external Schott Fostec DCR III lightbox with a 150W OSRAM halogen lamp usinga daylight-simulating filter, guided to the camera system by a fibre optic cable. Thesystem is shown in Figure 2.6.
The setup contains four acrylic glass filter racks with a total of 30 Edmund Optics narrowbandpass filters with central wavelengths in the range 400nm to 700nm. The filters arechanged manually by sliding the filter rack along the rail, with a mechanical stopperensuring that each filter is correctly positioned after moving the rack. The broad-bandlight exiting the cable is filtered by the selected narrow-band filter and guided to the eye

34 2. Spectral fundus imaging and spectral image composition
Figure 2.6: Spectral camera system by Fält et al [56].
Figure 2.7: Montage of channel images acquired with the system by Fält etal [56]. Images normalised for visualisation.
fundus through the camera optics. The reflected light captured by the camera systemrepresents the fundus reflectance for that wavelength. An example is shown in Figure 2.7.

2.4 Spectral fundus image acquisition 35
A suitable exposure time was estimated individually for each filter from the area in theretina with the highest reflectivity (typically the optic disk). For each filter, five successivechannel images were acquired to avoid motion blur or significant difference in the imagingangle due to eye movement. After a qualitative evaluation, the highest quality imageat each wavelength was selected and the images were automatically aligned using thealgorithm by Stewart et al [214]. Manual registration was performed for the image pairsfor which the automatic alignment failed. The registered spectral channel images werecomposed into a spectral image with each channel normalised to unit exposure time (i.e.,1 s).
2.4.2 Six-channel spectral fundus camera
Styles et al. [216] modified a Zeiss RCM250 fundus microscope. The original camerabody was replaced by a QImaging Retiga EXi 12-bit monochrome digital camera and aCambridge Research Instruments VariSpec LCD programmable filter was added in frontof the camera, with an additional lens to fit the image to the 1/3 inch CCD sensor arrayof the Retiga EXi, which is significantly smaller than the original 35mm film. A halogenlamp was used to illuminate the fundus through the camera optics instead of the originalxenon flash. The xenon flash was considered unsuitable due to sharp emission peaksin its illumination spectrum, and the transient (instead of steady-state) nature of theprovided illumination. The setup is shown in Figure 2.8.
Figure 2.8: The spectral camera system by Styles et al [216].
The VariSpec LCD programmable filter is a configurable interference filter capable of im-plementing Gaussian narrow-band filters with central wavelengths in the range 400 nmto 700nm. The spectral image is composed of six sequentially acquired channel images,filter central wavelengths 507, 525, 552, 585, 596 and 611 nm (the selection of the wave-length is related to the application and is discussed in detail in Chapter 4.3), with eachchannel image normalised to 1 s exposure time. An example is shown in Figure 2.9.

36 2. Spectral fundus imaging and spectral image composition
Figure 2.9: Montage of channel images acquired with the spectral camera systemby Styles et al [216]. Images were normalised for visualisation.
Further development of the spectral fundus camera system is described in [54]. Thehalogen white light source was replaced with a light source composed of 12 programmablelight emitting diodes (LEDs). LEDs of different emission spectra can be individuallyaddressed, allowing the precise control of intensity, illumination time, and the sequenceof illumination.
The total acquisition time for a set of channel images was 0.5 s. To minimise eye move-ment between the acquisition of the channel images, three image sets were acquiredconsequently for a high probability of capturing at least one set that contains no move-ment. The absence of inter-channel movement was confirmed by registering the imagesusing the method by Stewart et al. [214] and examining the resulting transformation. Ifthe transformation required to align the images was below 2.3 pixels, any eye movementpresent in the images was deemed to fall within the system error and the spectral imagecomposed of the set of channel images was accepted. The system error was derived fromthe maximum registration error over a set of images, acquired using the system, whereno observable eye movement was present.
The system providing the data used in this thesis is a modification of the spectral funduscamera presented in [54]. While attaining a short acquisition time, the LED illuminantof the system caused refraction patterns to appear in the channel images. The LED lightsource was replaced with a white light source and a VariSpec LCD filter.
2.5 Spectral camera calibration
Fundus cameras offer a non-invasive view to the ocular fundus and are an importanttool for diagnosing a number of eye and systematic diseases, e.g., AMD and DR [1]. A

2.5 Spectral camera calibration 37
fundus camera system has several independent components and their characteristics thatcontribute to the features and quality of the acquired image. These include the sensor,the light source and the optics, both optics for guiding the light from the light source tothe eye and to guide the reflected light to the camera, with attributes that are often not(accurately) known. Due to the small size and the proximity of the target (i.e., the eye),and the magnification of the eye lens, special optics are used to acquire images with areasonable field of view, making radial distortions [136] and vignette (i.e., the decreaseof image intensity values towards image edges) [96] prevalent in fundus images.
There are a number of fundus camera characteristics that should be taken into accountwhen analysing the acquired images. The wide-angle optics cause increasing deformationto perceived objects as their distance to the principal point of the image increases [217],which is likely to cause error in measurements, complicate image registration and resultin an accumulation of error when compiling longitudinal data or data from multiplesources. For any dimensional measurement of fundus features (absolute measurementsare important for certain clinical purposes such as the classification of AMD [207]), thespatial resolution of the image has to be known or estimated. An uneven illuminationfield may hinder the diagnosis and statistical classification and segmentation based onpixel intensities, and cause problems with longitudinal data. Dirt, dust and stains on orinside the optical system of a camera cause artifacts to the images acquired by the system.The artifacts can cause false positive detections in an automatic analysis algorithm oreven be misclassified as lesions by a human analyst. When combining data from differentimaging systems, the accumulation of the artifacts may have unforeseen consequences ifnot taken into account.
In the case of spectral imaging, the error to the spectra due to uneven illuminationdistribution can be significant. Furthermore, as light passes through the multiple lenses ofthe optical system in a fundus camera, wavelength-dependent differences in the refractionindices of the lens materials and coatings may cause aberrations at different wavelengthsof the captured light. While not a significant issue in grayscale or RGB-imaging, thespectral aberrations may cause significant errors in the captured spectra.
Quantifying the effects of and the distortions caused by the imaging system on the imagedata becomes especially important in the case of longitudinal studies. When studying theretinal changes or the progression of a pathology over years or even decades, the imagingparameters, protocols and even equipment are likely to change between the examinations.If the imaging systems are not properly characterised and calibrated, it may be difficultor even impossible to differentiate between the changes in the data due to changes in theclinical condition and changes due to differences in the data acquisition.
This section presents a protocol for calibrating a fundus camera, with special consider-ation to spectral fundus cameras. The calibration steps include geometric and spectralcalibration, determining the spatial resolution, consideration for correcting uneven illu-mination and vignetting, and accounting for dirt and scratches in the optics. Practicalexamples of calibrating the interference filter based spectral camera system by Fält etal. [56] will also be discussed.

38 2. Spectral fundus imaging and spectral image composition
2.5.1 Related work
Xu and Chutatape [247] compare the errors of two calibration methods for a funduscamera, one method based on a 3D target and the other on a planar calibration target.The method using the planar calibration target was found to produce more stable andaccurate results for fundus camera calibration.
In [141], Lujan et al. use spectral domain optical coherence tomography (SD-OCT) tocalibrate fundus cameras by determining the distance between the optic nerve and thecentre of the fovea from both the SD-OCT scans and the fundus image, giving the samemeasurement in millimetres and pixels.
Deguchi et al. [46] calibrate a fundus camera by utilising a transparent acrylic plate witha regular grid painted on both sides with different colours. Using the imaged grid points,the lines passing through the calibration planes are identified and used to account for theoptical distortions of the camera when constructing a 3D reconstruction of the fundusfrom stereo images.
Martinello et al. [145] discuss the calibration of a stereo fundus camera and modelsrequired for estimating the distortions caused by the lens system, in the context of 3D-reconstruction of the eye fundus.
Spectral calibration of a fundus camera is discussed by, e.g., Ramella-Roman et al. [182],who use Spectralon reflectance standards to determine the effect of their camera andfilter system on the acquired spectra.
The majority of the work including fundus camera calibration seems to have a focusoutside calibration, and deal with calibration only to the degree it is relevant to thespecific goal of the work. This section presents a general protocol for fundus cameracalibration, encompassing imaging system characteristics necessary to determined whenanalysing longitudinal data, or data from multiple sources or imaging systems.
2.5.2 Methods
Correction of geometric distortions
Imaging a calibration target with a regular pattern with known dimensions, the cameraparameters and lens distortions can be approximated. While a planar calibration patterncannot represent all the distortion present in retinal images, as the outer parts of the eyeand individual retinal curvature contribute to the distortion, the distortion caused bythe camera system can be characterised and corrected. This is important when dealingwith data acquired by different camera systems with different distortion characteristics.
If significant vignette is present, the illumination field of the images may need to be cor-rected (see Section 2.7 for details) to properly extract the reference points, such as cornerpoints or grid centroids, from the calibration target. A corner detector or thresholdingcan then be applied to extract the reference points.
Knowing the grid centroid locations in the image space and the dimensions of the phys-ical target, the intrinsic camera parameters including the principal point, focal length,and radial and tangential distortion can be estimated using the calibration approach

2.5 Spectral camera calibration 39
of Zhang [253], with the intrinsic camera model from Heikkilä and Silvén [91] for moreaccurate modelling of the distortion. The model by Heikkilä and Silvén is defined as[
uivi
]=
[dusu(u+ δu
(r)i + δu
(t)i )
dv(v + δv(r)i + δv
(t)i )
]+
[u0
v0
], (2.10)
where (u0, v0) are the image centre coordinates, (u, v) are the points projected onto theimage plane by a pinhole camera model, du and dv are the pixel width and height andsu is the camera (intrinsic) scale factor. The radial distortion terms, δu(r) and δv(r), andthe tangential distortion terms, δu(t) and δv(t), are defined as[
δu(r)
δv(r)
]=
[ui(k1r
2i + k2r
4i + . . . )
vi(k1r2i + k2r
4i + . . . )
](2.11)
and [δu(t)
δv(t)
]=
[2ρ1uivi + ρ2(r2
i + 2u2i )
ρ1(r2i + 2v2
i ) + 2ρ2uivi
], (2.12)
where k and ρ are the radial and tangential distortion coefficients, and r =√u2i + v2
i .The geometric calibration steps are given in algorithmic form in Algorithm 2.1.
Algorithm 2.1 Geometric calibration.Input: Calibration image I, intensity threshold th, eccentricity threshold theOutput: Distortion parameters pdCorrect uneven illumination of I using Algorithm 2.2Apply threshold th to I to extract binary image IBW
Perform connected component analysis on IBW
Remove connected components with eccentricity > theExtract centroids X of remaining componentsFit distortion model to X and solve pd
When analysing data that were not acquired recently, are from a third party or frommultiple sources, the imaging system used is often not available for acquiring images ofa calibration target. Several methods have been developed for determining the cameratarget parameters without the use of a calibration target, e.g., [37,58,67,180]. However,many of the methods rely on the movement of the camera or the imaged scene betweenthe images. In the case of fundus images, the movement between frames is generallyminuscule, and a data set is not guaranteed to have multiple images of the same eye.
Determination of spatial resolution
When the physical dimensions of the imaged target can be measured, determining thespatial resolution of an image is trivial. This, however, is not the case with retinal images.While the retinal features can be measured, it requires separate measurements with spe-cialised equipment. Determining the spatial resolution for specific imaging parameterswill not be sufficient as the size of the eye (and consequently the distance between theretina and the imaging plane) varies from person to person. However, the spatial resolu-tion of the image can be approximated by comparing the size of the retinal features to
40 2. Spectral fundus imaging and spectral image composition
known reference measurements. Hemminki et al. [92] include a meta-analysis of the sizeof the optic disc from 2774 eyes from a total of 13 publications. The mean optic disc areawas found to be 2.65mm, with standard deviation of 0.17mm. It should be noted that,in order to estimate the spatial resolution based on the cited reference measurements,the optic disc has to be fully visible in the image and not obscured or distorted by e.g.,haemorrhages, scar tissue, glaucoma or inter-cranial pressure.
The area of the optic disc can be automatically approximated from images acquired by thecamera system under calibration. A number of methods for the automatic segmentationof the optic disc from retinal images have been developed, e.g., [11,156,242]. It should benoted that the geometric distortions caused by the lens systems may produce significanterror to the measurements. The estimation and removal of these distortions is discussedin Section 2.5.2.
Correction of uneven illumination
Numerous methods for the correction of uneven illumination in different applications canbe found in the literature, and the selection between well-working methods for specificdata can be largely arbitrary. The method by Narasimha-Iyer et al. [154] was chosen asan example due to good previous performance with the data from DiaRetDB1 diabeticretinopathy database (DiaRetDB1) [116]).
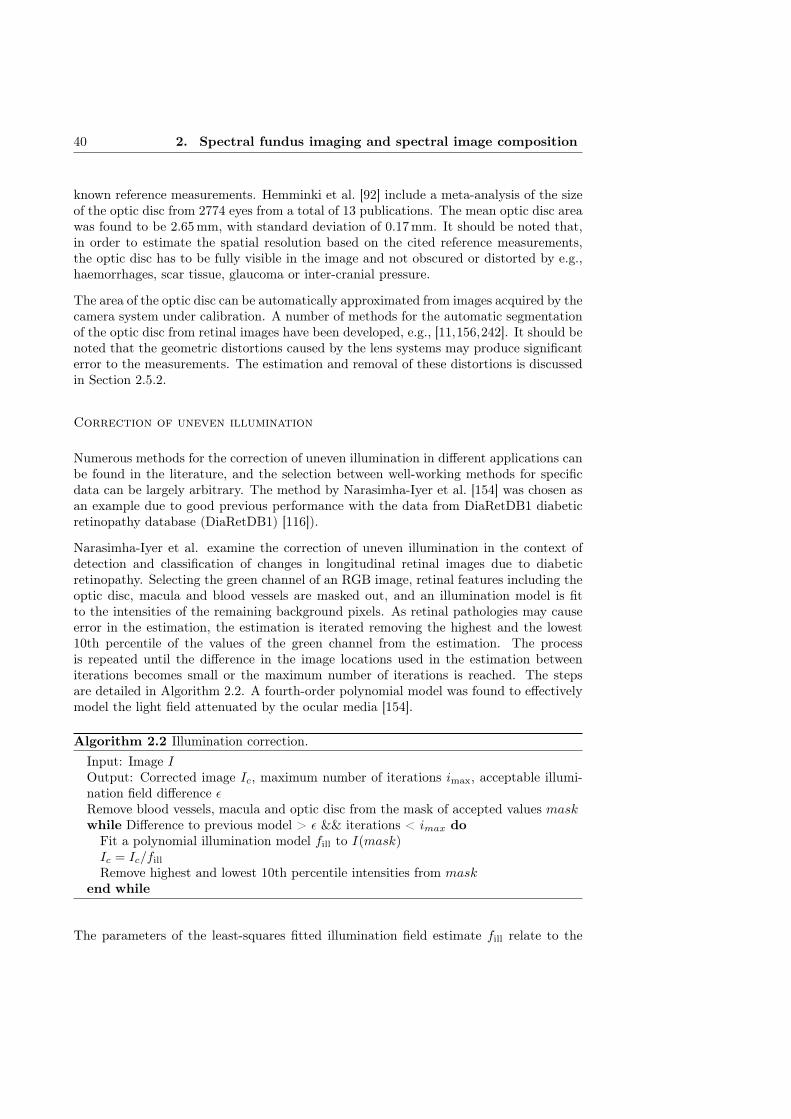
Narasimha-Iyer et al. examine the correction of uneven illumination in the context ofdetection and classification of changes in longitudinal retinal images due to diabeticretinopathy. Selecting the green channel of an RGB image, retinal features including theoptic disc, macula and blood vessels are masked out, and an illumination model is fitto the intensities of the remaining background pixels. As retinal pathologies may causeerror in the estimation, the estimation is iterated removing the highest and the lowest10th percentile of the values of the green channel from the estimation. The processis repeated until the difference in the image locations used in the estimation betweeniterations becomes small or the maximum number of iterations is reached. The stepsare detailed in Algorithm 2.2. A fourth-order polynomial model was found to effectivelymodel the light field attenuated by the ocular media [154].
Algorithm 2.2 Illumination correction.Input: Image IOutput: Corrected image Ic, maximum number of iterations imax, acceptable illumi-nation field difference εRemove blood vessels, macula and optic disc from the mask of accepted values maskwhile Difference to previous model > ε && iterations < imax doFit a polynomial illumination model fill to I(mask)Ic = Ic/fill
Remove highest and lowest 10th percentile intensities from maskend while
The parameters of the least-squares fitted illumination field estimate fill relate to the
2.5 Spectral camera calibration 41
image values as
I(x, y) =
x41 x3
1y1 . . . y1 1...
x4i x3
i yi . . . yi 1
β1
...β15
= Ap, (2.13)
where (x, y) are image coordinate values belonging tomask, A is the design matrix deter-mining the illumination model and β is the vector of model parameters. The parametersof the illumination field estimate fill are gained by
p = (ATA)−1AT
I(x1, y1)I(x2, y1)
...I(xi, yi)
. (2.14)
An example result of the presented illumination correction approach is shown in Fig-ure 2.10.
(a) Original im-age.
(b) Estimated il-lumination field.
(c) Corrected im-age.
Figure 2.10: An example of uneven illumination correction (images from [116]).
Correction of spectral aberrations
The spectral aberrations (i.e., the effect of different wavelengths of light refracting atdifferent rates in the camera optics) can be determined for each wavelength by imaging areference white reflectance target (see Figure 2.11). For example, Labsphere Spectralon
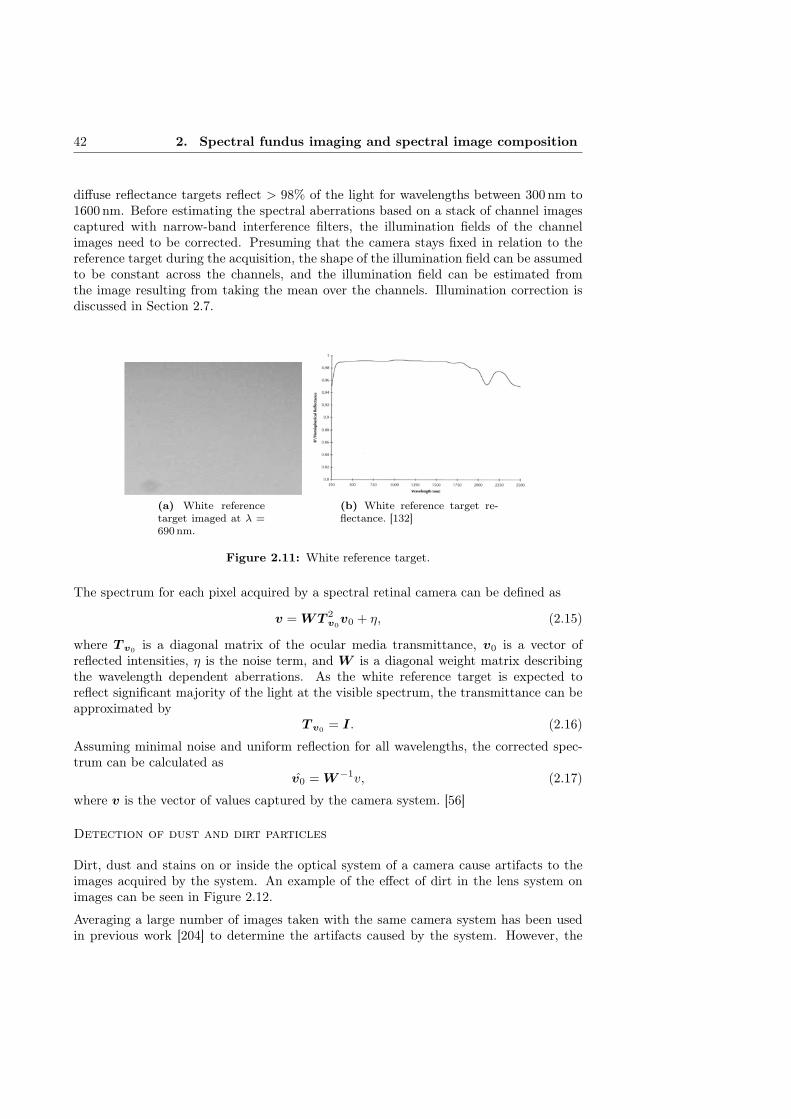
42 2. Spectral fundus imaging and spectral image composition
diffuse reflectance targets reflect > 98% of the light for wavelengths between 300nm to1600nm. Before estimating the spectral aberrations based on a stack of channel imagescaptured with narrow-band interference filters, the illumination fields of the channelimages need to be corrected. Presuming that the camera stays fixed in relation to thereference target during the acquisition, the shape of the illumination field can be assumedto be constant across the channels, and the illumination field can be estimated fromthe image resulting from taking the mean over the channels. Illumination correction isdiscussed in Section 2.7.
(a) White referencetarget imaged at λ =690nm.
(b) White reference target re-flectance. [132]
Figure 2.11: White reference target.
The spectrum for each pixel acquired by a spectral retinal camera can be defined as
v = WT 2v0v0 + η, (2.15)
where T v0 is a diagonal matrix of the ocular media transmittance, v0 is a vector ofreflected intensities, η is the noise term, and W is a diagonal weight matrix describingthe wavelength dependent aberrations. As the white reference target is expected toreflect significant majority of the light at the visible spectrum, the transmittance can beapproximated by
T v0 = I. (2.16)
Assuming minimal noise and uniform reflection for all wavelengths, the corrected spec-trum can be calculated as
v0 = W−1v, (2.17)
where v is the vector of values captured by the camera system. [56]
Detection of dust and dirt particles
Dirt, dust and stains on or inside the optical system of a camera cause artifacts to theimages acquired by the system. An example of the effect of dirt in the lens system onimages can be seen in Figure 2.12.
Averaging a large number of images taken with the same camera system has been usedin previous work [204] to determine the artifacts caused by the system. However, the

2.5 Spectral camera calibration 43
white reference target used for determining the spectral aberrations can be used to detectthe artifacts caused by dirt and scratches in the optics. The white reference images arepreprocessed by applying the illumination correction method detailed in Section 2.7 toproduce a more even illumination field and to facilitate segmentation.
The extended-minima transform [209] is applied to the preprocessed images to deter-mine the regional minima. Regional minima represent connected pixels with values withlow variation and of lower intensity than their neighbourhood. The extended-minimatransform runs through a range of thresholds and combines the binary masks with thelogical or operation. The segmented regions are thresholded based on the area to removeartifacts.
(a) Full imagewith enhancedvisualisation of theregion of interest.
(b) Dirt on vein. (c) Dirt next tovein.
Figure 2.12: Effect of dirt in optics; channel images at λ = 600 nm of the samepatient.
2.5.3 Experiments and results
This section describes the methods for the distortion correction, and the estimation ofdirt particle locations and spectral aberrations. As in-vivo reference measurements ofthe human retina for calibration purposes are very challenging, and a phantom encom-passing the relevant characteristics of the eye (e.g., curvature, optics, transmission andreflectance) does not exist yet, only qualitative experiments are presented. In the exper-iments, the system by Fält et al. [56] was used.
Geometric distortions
The distortion generated by the optics of the example system was estimated by imaginga grid distortion target (Edmund Optics #46-250 [170]), with 0.25mm to 1mm diameterchrome circles on glass at 0.5mm to 2mm intervals, against a white background anddetermining the mapping from the dot centroids of the imaged grid to the dot locationsof the physical target.

44 2. Spectral fundus imaging and spectral image composition
29 channel images of the target were acquired with the camera using filters within therange of 410mm to 694mm. To test if the distortion varies between the channels ofthe spectral image, the distortion was estimated individually for each channel. As nosystematic inter-channel change in the estimated distortion parameters was observed,suggesting a wavelength-independent distortion, the dot centroid means over all channelswere used for the calibration to reduce error from the segmentation.
To determine the accurate centroids and to remove binarisation artifacts, the binaryregions resulting from the thresholding were tested for low eccentricity and the regions notmeeting these criteria were discarded. While a more sophisticated methods for extractingthe dot centroids could be used, the number of successfully extracted centroids using theaforementioned approach was sufficient for estimating the distortion caused by the optics.The calibration parameters were estimated from the centroid locations using the toolboxby Bouguet [30]. The result of correcting the calibration images using the estimateddistortion can be seen in Figure 2.13.
(a) Original image. (b) Corrected image.
Figure 2.13: An example of distortion correction.
Spectral aberrations
The system described in [56] uses a set of 30 narrow-band interference filters to acquirespectral images in the range of 400 nm to 700nm, with ∼ 10nm steps. The intensitiesof each channel of the spectral images acquired with the system were normalised by theimage exposure time. With the near-uniform reflectance of the white reference targetand the exposure time accounted for, the remaining differences in the intensity levelsbetween the channels can be accounted to the spatial and spectral characteristics of theilluminant. The spatial distribution of the illumination was normalised by taking themean over the channels, fitting a polynomial model to the resulting image and dividingeach individual channel with the estimated model.

2.5 Spectral camera calibration 45
Taking the mean over the normalised intensities of each channel, the resulting mean vectoris the (relative) spectrum of the illumination. Dividing the intensities of each channelby the illumination spectrum, the channel images can be normalised to correspond toimages acquired with uniform white illumination. The normalisation can be summarisedas
Iλ =IλIλtλ
, (2.18)
where Iλ is the channel image acquired at wavelength λ, Iλ is the mean and tλ is theexposure time for the wavelength λ.
After the normalisation, if no spectral aberrations are present, each individual channelshould be identical (except for small variation due to noise and numerical error due tonormalisation). The only significant source of intensity variation is the illumination fieldwhich has been normalised with respect to wavelength.
The spectral aberrations were studied by taking a circle integral over the normalisedchannel images. The area of the integrating circle was set to 10000 pixels centred atthe image focal point and with an increasing radius, with the artifacts due to dirt andscratches masked out (see Section 2.5.3). The results are visualised in Figure 2.14.
(a) Normalisedwhite refer-ence image(mean over allchannels).
(b) Circle integral over allchannels.
Figure 2.14: Effect of aberrations on measured spectra.
The results show significant spectral aberration especially at the shorter wavelengths ofthe spectrum. The maximal intensity difference due to aberration, 22%, was measuredat λ = 410 nm. Therefore, any measurement or application relying on accurate spectrafrom the example system should correct or otherwise take into account the aberrations.
Dirt and dust
The dirt and dust in the optics of the example system were determined by acquiringa 30-channel spectral image of a Labsphere Spectralon SRS-99-020 diffuse reflectancetarget [132] and applying the segmentation approach detailed in Section 2.5.3. The
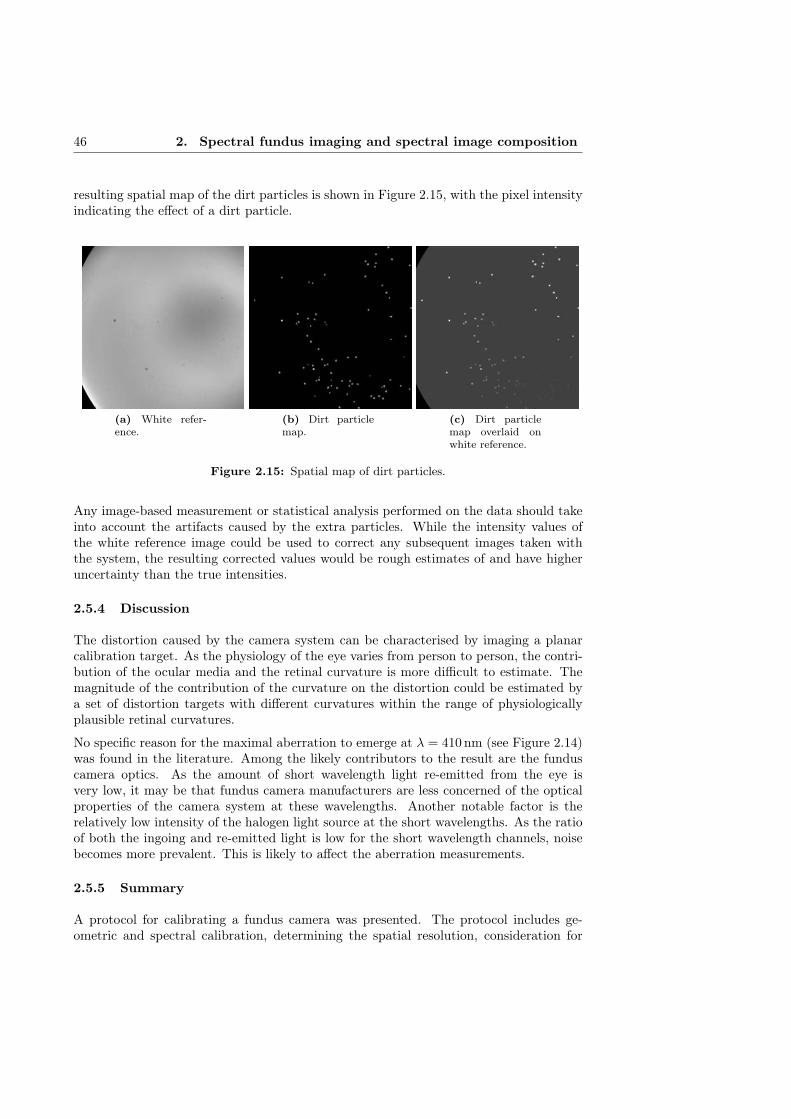
46 2. Spectral fundus imaging and spectral image composition
resulting spatial map of the dirt particles is shown in Figure 2.15, with the pixel intensityindicating the effect of a dirt particle.
(a) White refer-ence.
(b) Dirt particlemap.
(c) Dirt particlemap overlaid onwhite reference.
Figure 2.15: Spatial map of dirt particles.
Any image-based measurement or statistical analysis performed on the data should takeinto account the artifacts caused by the extra particles. While the intensity values ofthe white reference image could be used to correct any subsequent images taken withthe system, the resulting corrected values would be rough estimates of and have higheruncertainty than the true intensities.
2.5.4 Discussion
The distortion caused by the camera system can be characterised by imaging a planarcalibration target. As the physiology of the eye varies from person to person, the contri-bution of the ocular media and the retinal curvature is more difficult to estimate. Themagnitude of the contribution of the curvature on the distortion could be estimated bya set of distortion targets with different curvatures within the range of physiologicallyplausible retinal curvatures.
No specific reason for the maximal aberration to emerge at λ = 410nm (see Figure 2.14)was found in the literature. Among the likely contributors to the result are the funduscamera optics. As the amount of short wavelength light re-emitted from the eye isvery low, it may be that fundus camera manufacturers are less concerned of the opticalproperties of the camera system at these wavelengths. Another notable factor is therelatively low intensity of the halogen light source at the short wavelengths. As the ratioof both the ingoing and re-emitted light is low for the short wavelength channels, noisebecomes more prevalent. This is likely to affect the aberration measurements.
2.5.5 Summary
A protocol for calibrating a fundus camera was presented. The protocol includes ge-ometric and spectral calibration, determining the spatial resolution, consideration for

2.6 Spectral image composition 47
correcting uneven illumination and vignetting, and accounting for dirt and dust in theoptics. Based on the presented qualitative evaluation results, significant improvementscan be achieved related to the quality of spectral retinal images, longitudinal data anddata from multiple sources.
Due to the specialised optics and illumination of fundus cameras, imaging a planar whitereference target may not accurately capture the spectral aberrations experienced whenimaging a curved retina. In general, an appropriate reference target or phantom withsimilar characteristics as the human eye would improve the calibration process. Thefuture work includes quantitative evaluation of the different sub-tasks of the calibrationby using specialised targets, or in vivo eye measurements when possible.
2.6 Spectral image composition
Depending on the imaging technology, composing spectral images based on a set of chan-nel images may require image registration at some stage. The purpose of the registrationis to find the geometric transformation needed to align the floating image with the baseimage. Manual registration by selecting corresponding points in image pairs becomesdifficult and even infeasible when the number of individual channels increases, or whenthere are large differences between the images due to differences in viewpoint or modality.When the wavelength difference between the channel image bands increases, the salientimage features become very different, which makes manual registration slow, difficult anderror-prone.
There is a significant body of work in the field of image registration to solve the problemof image alignment. However, the majority of the approaches are designed for imagesfrom the same imaging modality. While registration approaches specific for multimodaldata exist (e.g. [236, 255]), the modalities are expected to have similar information con-tent. Neither of these prerequisites are necessarily true for the channel images when thedifference in acquisition wavelength is large. Despite the fact that the channel imagesare captured with a single modality, the image appearance varies significantly.
To evaluate the performance of different registration methods on spectral fundus imagedata, a comparison of image registration approaches for the composition of spectralretinal images is presented. The registration methods are quantitatively evaluated ona set of channel images of an eye phantom and a retinal image set, with each imagedeformed by a known transformation.
2.6.1 Related work
Medical image registration (and image registration in general) is a widely studied problemand, consequently, a vast body of literature on proposed solutions exists. Maintz andViergever [143] present an extensive review of medical image registration approachespublished between the year 1993 and 1997. A significant number of the methods revieweddeal with the registration of radiological images, with methods dealing with monomodal,multimodal and modality to model registration.
A significant part of medical image registration literature concentrates on MRI, computedtomography (CT) and other radiological modalities. In their paper, published 2001, Hill
48 2. Spectral fundus imaging and spectral image composition
et al. [93] review the main approaches (of the time) for registering radiological images.The review presents an overview of rigid feature-based methods and intra- and intermodal(voxel) similarity-based methods.
Feature-based registration methods have been popular in general (i.e., without emphasison medical modalities) image registration. Zitová and Flusser [256] present a reviewof general feature- and area-based registration methods. The paper discusses differentapproaches to feature detection, feature matching, mapping function design, and imagetransformation and resampling. The evaluation of registration performance of featureand area based registration methods is also discussed.
Deformable transformation models have been widely used in medical image registration.In their 2004 paper, Crum et al. [45] present an overview of deformable medical imageregistration, with the presented methods dealing mostly with radiological modalities. Anumber of well-known similarity measures, such as sum of squared differences (SSD),correlation coefficient (CC) and mutual information (MI) are included. Non-rigid trans-formation models including splines and demons are also discussed. Bhatia et al. [26]present a qualitative evaluation of similarity metrics for group-wise non-rigid registra-tion, including a novel metric. The methods are evaluated on MRI data. Sotiras etal. [212] present a comprehensive study of recent approaches to deformable image regis-tration. A large number of deformable registration methods, classified by the deformationmodels, matching criteria and optimisation approach used, are described. While not lim-ited to the application area, the study puts an emphasis on methods dealing with theregistration of medical images.
A more recent review, published in 2012, of registration methods for medical data hasbeen conducted by Markelj et al. [144]. Three classes of registration base and strategyare identified: feature-, intensity- and gradient-based methods, and projection, back-projection and reconstruction strategies. However, while the paper cites a number ofother modalities, the scope of the review is limited to 3D-to-2D registration. More mod-ern approaches to image registration are presented in the study by Wyawahare et al. [245].In addition to the registration approaches discussed in earlier reviews, e.g., [143], registra-tion methods using wavelets, neural networks, genetic algorithms, fuzzy sets and roughsets are discussed. In [169], Oliveira and Tavares describe the geometric transforma-tions, similarity measures and optimisation methods in common (medical) registrationapproaches. In addition, available registration software and methods for performanceevaluation are reviewed.
While a large part of medical image registration literature is concentrated on radiologi-cal modalities, methods focused on the registration of retinal images have been studied.As a part of their review on methods applicable to the automatic screening of diabeticretinopathy, published 2002, Teng et al. [220] present an overview of feature-based reg-istration methods (and two methods that utilise the whole image) used in relation toretinal images. The features used include matched filter responses, vessel branchingpoints and manually marked anatomy markers. The reviewed methods were constrainedto rigid transformation models. Laliberté et al. [133] quantitatively evaluate registrationmethods on retinal colour and fluorescein angiography images. A novel method based onvessel network structure is also presented.
Methods for the registration of spectral images have been proposed by e.g., [89,178,215].

2.6 Spectral image composition 49
However, the papers on the registration of spectral images seem to generally deal withremote sensing data, and are not (directly) applicable to spectral retinal data. While asignificant body of work related to image registration exists (including applications inmedical imaging and spectral images), little attention has been given to the inter-channelregistration of spectral retinal images.
2.6.2 Methods
A number of methods from the registration literature were selected for a quantitative com-parison of registration accuracy on retinal channel images. To offer a broader selectionof different approaches, a number of methods based on different frameworks (similarity-,demons- and feature-based methods) found in medical image registration literature werechosen for the comparison. Publicly available implementations were used for all themethods.
Deformable registration by similarity
In local similarity based registration, the floating image is deformed in such a mannerthat a set of local similarities are maximised. In the framework used in this work, thenodes of an n × n grid are iteratively moved based on local similarity of the base andfloating image.
The final transformation is obtained by b-spline interpolation using the grid nodes ascontrol points. Several similarity measures were quantitatively evaluated in this frame-work: CC, similarity measure by Myronenko et al. (CD2) [153], similarity measure byCohen and Dinstein (MS) [44], MI [236], minimisation of residual complexity (RC) [152],sum of absolute differences (SAD) and SSD.
Mutual Information (MI) [236] is a measure of similarity (or dependence) between twodata sets, measured by the distance between their joint probability distribution andthe independent probability distribution. Methods based on maximisation of mutualinformation have seen frequent use in registration of multimodal medical images.
Myronenko and Song [152] present a similarity measure, RC, that accounts for spatialintensity distortions and based on the minimisation of the complexity of residual image.The method outperforms state-of-the-art similarity measures in several medical registra-tion problems (including retinal image registration), but is limited to monomodal data.
The maximum likelihood (ML) based motion estimation scheme by Cohen and Din-stein [44], MS, differs from other ML schemes by assuming both images to be corruptedby multiplicative noise that follows the Rayleigh distribution in the likelihood func-tion formulation. Another ML based scheme by Myronenko et al. [153], CD2, assumesRayleigh and blurred speckle noise, and uses spherical coordinates.
Registration by demons
Thirion [221] has presented a registration approach (Demons) where the floating imageis considered as a deformable grid model diffusing through semi-permeable membranesdefined by, e.g., the gradients of the base image. The floating image is transformed by
50 2. Spectral fundus imaging and spectral image composition
a grid that is deformed by internal forces (relations between grid points) and demonsthat locally push a diffusing model (grid node) based on the underlying base image.Vercauteren et al. [233, 234] have extended the demons framework to the space of dif-feomorphic transformations by Lie groups, and further extend the diffeomorphic demonsframework into log-domain (Log-demons) to guarantee the existence of and access to theinverse transformation.
Feature-based registration
The generalized dual-bootstrap iterative closest point (GDB-ICP) [250] algorithm findsa transformation aligning two images by starting from a small area of overlap (bootstrapregion) between the images and a locally stable similarity transformation. An initialtransformation derived from a scale invariant feature transform (SIFT) descriptor matchis refined and validated by feeding edge and corner points inside a growing bootstrapregion to a robust iterative closest point (ICP) algorithm.
To reduce the number of incorrect feature matches, the edge and corner points are dividedinto driving and matchable features. The driving features, having stricter validationthresholds, are matched to a larger pool of matchable features. To increase the bootstrapregion stability, GDB-ICP determines both the forward and inverse transformations anduses bi-directional mapping of the feature points to increase the number of constraints.
The edge-driven dual-bootstrap iterative closest point (ED-DB-ICP) [225] algorithm isa modification of GDB-ICP designed for the registration of multimodal fluorescein an-giogram (FA) sequences. The main differences of ED-DB-ICP with respect to GDB-ICPare the use of gradient magnitude images instead of intensity images and extending theSIFT descriptors with a shape context descriptor presented in detail in [151].
2.6.3 Registration strategy
In the case of spectral image composition, all channels need to be transformed into thesame space to form a complete spectral image. This section discusses different strategiesfor composing the set of pair-wise registrations into a spectral image where all channelsare aligned with respect to each other.
Registration to a single base image and sequential registration
A simple approach for channel image set registration is to register each image to a pre-viously selected base image. In the case of spectral images, however, this can meanconsiderable difference in image features as a result of large differences in wavelengthbetween the base image and the image to be registered. The difference in the wave-length means differences with respect to their structure and intensity due to the varyingreflectance of different features of the retina.
Large differences in image structure and intensity due to wavelength can be avoidedby registering each channel image to its immediate neighbour (in the direction of thebase image). For images that are not immediate neighbours of the base image, thetransformations steps can be sequentially combined to align the images with the chosenbase image.

2.6 Spectral image composition 51
Joint registration
Instead of registering the channel image set as a number of independent pair-wise regis-trations, the overall registration result is likely to be improved if the registration strategyconsiders the whole image set. Joint registration has been extensively studied, especiallyin MRI and tomography [13, 25, 108, 226, 244, 249]. However, the majority of joint regis-tration approaches in the literature are applicable (at least without significant changes)only to registration methods based on a similarity measure, and are often an integratedpart of the method.
Considering the promising performance of feature-based methods in retinal image regis-tration, two joint registration strategies applicable to both feature and similarity measurebased registration are presented.
Registration using intermediate templates Instead of directly registering to a neigh-bouring or to the base image, the floating image can be registered to an intermediatetemplate to avoid both accumulation of error from combined transformations and largedifferences in features and intensities. Each floating image is registered to a templatethat is a combination of the previously registered intermediate (i.e., channels betweenthe floating and the base) images. Similar approaches for group-wise registration havebeen presented in e.g., [82, 105].
The template Yi used as the registration target for floating image Ii can be defined as
Yi =Ii−1 + Yi−1
2, (2.19)
where Yi−1 is the template of the previous step and Ii−1 is the previously registeredfloating image. In the first step, the base image is used as the template. Each intermediateimage can be given an equal weight in the generation of the template, but this was foundto yield poor results in initial experiments. As each template has been (not accountingfor the registration error) transformed into the same space with the base image, theresulting transformation is of the same complexity for each channel image.
Registration using shortest path The sequential registration strategy can be im-proved by registering only the images along the shortest path from a floating image tothe base image instead of all intermediate images. Here the cost of each registration stepis measured in image similarity. A cost matrix is defined by calculating the squared sumof intensity error for each combination of pairs for the image set. For each image, Dijk-stra’s algorithm is applied to the cost matrix to determine the shortest path to the baseimage. The final transformation is gained by combining the pair-wise transformationsalong the path.
2.6.4 Experiments
Synthetic and semisynthetic data sets
To quantitatively evaluate the performance of each method with the data acquired withthe system described in [55], five sets of channel images were used to directly estimate

52 2. Spectral fundus imaging and spectral image composition
the image registration error. A fully aligned spectral image consisting of 30 channelswith spatial resolution of 1024x1024 of a phantom (artificial eye) was used as the basis.
The Carl-Zeiss Meditec eye phantom used as the basis for the synthetic images is a closedcontainer with a small entry pupil fitted with an optical system simulating the lens ofthe human eye. The back of the container is concave (to represent the curvature of theeye fundus), with painted retinal structures (e.g., vasculature and fovea).
A known transformation of increasing degree was applied to each set to simulate eyemovement between the acquisitions of individual channels of spectral retinal images. Theinitial and the extended performance evaluation use different approaches to generatingthe known transformation. The approaches are described in Sections and , respectively.The produced sets are referred to as the (synthetic) test set A1-A5.
To evaluate the registration performance on real medical data, a semisynthetic test setwas generated by warping a set of five spectral retinal images taken with the systemin [36]. The system captures a set of six channel images in approximately 0.5 s toavoid inter-channel eye movement [36]. The retina was illuminated at six selected wave-lengths 507, 525, 552, 585, 596, 611 nm [216] using a halogen white-light source filteredthrough a liquid crystal tunable filter. During the experiments, the maximum inter-channel displacement was found to be 2.3 pixels (referred to as the system error). Thesame approaches for generating the transformation simulating the movement of the eyewere used as with the synthetic test sets A1-A5. The produced sets are referred to asthe (semisynthetic) test set B1-B5.
Registration error and the quality of image spectra
The channel-wise registration errors can cause significant error in the image spectra. Toestimate the deterioration of the quality of the spectra as the registration error increases,artificial systematic misalignment was applied to a spectral image of an eye phantom andmetrics measuring the quality of the spectra were calculated.
30 channel images of the eye phantom were translated n pixels in a direction unique foreach channel (by a monotonically increasing angle) to simulate a mean registration errorof n pixels. The decrease in spectral quality was calculated using a set of quality metricsfrom the resulting misaligned spectral image y, using the original aligned image as thereference x. An example is shown in Figure 2.16.
Vaiopoulos [228] has implemented a number of technical and reference metrics for theassessment of spectral image quality. The metrics for spectral image y and referencespectral image x adopted for the evaluation were correlation coefficient (CC), qualityindex (QI) and root-mean-square error (RMSE), defined as
CC =σxyσxσy
, (2.20)
QI =4σxyxy
(σ2x + σ2
y)(x2 + y2)and (2.21)
RMSE =
√√√√ n∑i=1
(xi − yi)2
n, (2.22)

2.6 Spectral image composition 53
(a) Original image. (b) 2 pixel translation.
(c) 5 pixel translation. (d) 10 pixel translation.
Figure 2.16: Examples of the reference set for the effect of registration erroron image quality. The images are mean images over the wavelength channelswith each channel translated n pixels into a different direction (except the origi-nal). [128]
where n is the number of channel image pixels, x is mean over x and σx is the standarddeviation of x.
Van der Meer [230] presents a number of similarity measures for spectral data. Thesimilarity measures, spectral angle measure (SAM), spectral correlation measure (SCM)and spectral information divergence (SID), can be used as a measure of how well the

54 2. Spectral fundus imaging and spectral image composition
image spectra are preserved after the alignment. The similarity measures are defined as
SAM = cos−1
d∑i=1
xiyi√d∑i=1
x2i
√d∑i=1
y2i
(2.23)
SCM =
d∑i=1
xiyi −d∑i=1
xid∑i=1
yi√[d
d∑i=1
x2i −
d∑i=1
(xi)2
] [d
d∑i=1
y2i −
d∑i=1
(yi)2
] (2.24)
SID =d∑i=1
pi(log pi − log qi) +d∑i=1
qi(log qi − log pi), (2.25)
wherepi =
xid∑j=1
xj
, qi =yid∑j=1
yj
, (2.26)
and d is the number of channels in the spectra.
Initial performance evaluation
An initial performance evaluation was performed with all the presented methods to de-termine a subset of the methods for more in-depth evaluation [129]. The registrationstrategies were not considered in the initial evaluation, and a more straightforward ap-proach to the artificial deformations to produce the synthetic and semisynthetic datasets was taken. The methods with the lowest registration errors were selected for furtherevaluation.
For both the synthetic and semisynthetic test sets, five image sets were generated fromthe original images by transforming each channel by a known transformation with trans-formation parameters sampled from a parameter distribution. Based on the experimentsin [214], a quadratic transformation was deemed appropriate to represent the deforma-tions caused by eye movement during the acquisition of retinal images. The parameterdistributions for the transformation parameters is determined from a previously regis-tered true retinal channel image set (with 1 442 images and successful registration con-firmed by an expert) by using kernel density estimate (KDE). The parameters used fordeforming the images of the test sets were gained by randomly sampling the distributions.The parameter distributions are shown in the Appendix I.2.
The quadratic term parameters were multiplied by an increasing weighting constant k foreach image set to simulate increasingly distorted images. For each set, a channel imagenear the middle of the wavelength range (λ = 540nm for the synthetic and λ = 552nmfor the semisynthetic, respectively) was chosen as the base image for each registration.

2.6 Spectral image composition 55
(a) An original im-age of the syn-thetic Set A (λ =600nm).
(b) An original im-age of the semisyn-thetic Set B1 (λ =585nm).
(c) An original im-age of the semisyn-thetic Set B5 (λ =585nm).
(d) An example transformationgrid for synthetic Set A1.
(e) An example transformationgrid for synthetic Set A5.
Figure 2.17: Examples of synthetic and semisynthetic test sets (enhanced forvisualisation). [129]

56 2. Spectral fundus imaging and spectral image composition
Examples of the test set images and the corresponding transformations are shown inFigure 2.17.
The parameters for each registration method were systematically selected by registeringa subset of the test images whilst varying the parameter values. The parameter com-bination that produced the smallest error on the images was chosen. The parametersselected for the evaluation are presented in the Appendix in Tables I.1 and I.2.
The implementation of GDB-ICP released by the authors of the method was used forthe evaluation. Publicly available third party implementations were used for methodsfor which the original implementations were not available.
In the semisynthetic test set, it is possible that the registration method, in additionto estimating the synthetic transform, corrects some of the system error. This wouldmanifest itself as increased error despite the more accurate registration. Therefore, errorvalues below the system error of 2.3 pixels were considered as zero for the semisynthetictest set. All registration errors were measured as the Euclidean distance between thegrid points of the registered image and their expected locations based on the knowntransformation.
Extended performance evaluation
The three methods with the lowest registration errors in the initial study were selectedfor the extended performance evaluation [128]. A more realistic transformation modelwas used for the generation of the test sets, and all the presented image set registrationstrategies were considered for the three methods.
In the extended performance evaluation, five image sets were generated from the originalimages of both the synthetic and semisynthetic test sets by transforming each channel bya designed transformation. To simulate the changes in retinal images as the eye moveswith respect to the camera, the test set images were first projected onto a semi-spherewith the pixel depth values defined as
Z =√r2 − (X − x0)2 − (Y − y0)2, (2.27)
where X and Y are the x- and y-coordinates of the image pixels (with origin at the imagecentre), and r is the radius of the semi-sphere, defined as
r = (dU2
+A2)/(2 ∗A), (2.28)
where dU is the image width and
A =dU2/(tanαfov/2), (2.29)
where αfov is the (horizontal) field-of-view (FOV) angle of the camera.
The semi-sphere was translated and rotated to simulate an offset in the optical axisand movement of the eye with respect to the camera. The rotated and translated 3D-coordinates are gained by
Vi = R
Xi + txYi + tyZi1
, (2.30)

2.6 Spectral image composition 57
where tx and ty are the translation parameters, and R is a homogeneous rotation matrixdefined by the rotation angles ϕx and ϕy around the x- and y-axis (with no rotationaround z-axis).
The transformed image coordinates were gained from the rotated and translated 3D-coordinates as
Xi =Vxi
Vwi
Yi =VyiVwi
, (2.31)
where Vw is the fourth component of the homogeneous transformed 3D-coordinates. Thedeformed image was gained by estimating the values at the transformed image coordi-nates by bicubic interpolation. Examples of the test set images and the correspondingtransformations are shown in Figures. 2.18 and 2.19.
(a) Original im-age (Set A1).
(b) Transformedimage (Set A1).
(c) Grid (Set A1).
(d) Original im-age (Set A5).
(e) Transformedimage (Set A5).
(f) Grid (Set A5).
Figure 2.18: Synthetic test set A; examples at λ = 589 nm of the original andtransformed images (enhanced for visualisation) with corresponding transforma-tion grids. [128]
To validate the approach for the generation of the test sets, images of an eye phantomsetup, for which the angle between the phantom and camera can be accurately set, weredeformed with the approach for test set generation. The set contained three sets ofimages with the phantom in 6 different rotations in relation to the camera (3◦, 1.5◦,−1.5◦, −3◦, −4.5◦, −6◦ ). An example is shown in Figure 2.20.

58 2. Spectral fundus imaging and spectral image composition
(a) Original im-age (Set B1).
(b) Transformedimage (Set B1).
(c) Grid (set 1).
(d) Original im-age (Set B5).
(e) Transformedimage (Set B5).
(f) Grid (Set B5).
Figure 2.19: Semisynthetic test set B; examples at λ = 585 nm of the originaland transformed images (enhanced for visualisation) with corresponding transfor-mation grids. [128]

2.6 Spectral image composition 59
An image with the phantom facing the camera directly was deformed with an increasingangle ϕy, and the deformed image was compared to an image with the phantom phys-ically rotated ϕy degrees. The error between the physical and simulated deformationwas determined as the displacement of speeded-up robust feature (SURF)-keypoints [16]visible in both images. The numerical results are shown in Table 2.2.
(a) Image facingcamera.
(b) Physically ro-tated phantom.
(c) Estimation ofrotated image.
(d) Images (b) and(c) overlaid.
Figure 2.20: Examples of phantom set used in the validation of synthetic datageneration. [128]
It should be noted that the artificial retinal features of the phantom used for validat-ing the synthetic data generation approach are painted on a plane (and consequently,the pixel locations of the deformed image are projected onto a plane instead of a semi-sphere). Due to the differences between the true retinal curvature (semi-synthetic data),the curvature of the synthetic test set phantom and an ideal semi-sphere, the deforma-tions in the synthetic ground truth are unlikely to correspond accurately with the eyemovements they are simulating. However, the purpose of the deformation approach isnot to accurately simulate specific eye movements, but to produce realistic deformationsto the synthetic ground truth. Based on the validation results, the approach to syntheticground truth generation can be expected to produce deformations similar to those causedby the movements of the eye in relation to the camera.

60 2. Spectral fundus imaging and spectral image composition
Table 2.2: Validation of the synthetic data generation approach; errors (in pixels)between feature locations in mechanically rotated and artificially deformed images,respectively.
ϕy −6◦ −4.5◦ −3◦ −1.5◦ 1.5◦ 3◦
Mean 2.98 1.85 1.38 0.83 1.71 2.74Std 0.67 0.48 0.45 0.32 1.00 1.07
The same parameters for each registration method were used as in the initial study(Appendix Tables I.1 and I.2). As with the initial study, all registration errors weremeasured as the Euclidean distance between the grid points of the registered image andtheir expected locations based on the known transformation, and error values below thesystem error of 2.3 pixels were considered as zero for the semisynthetic test set.
2.6.5 Results
Initial evaluation
The results of the image registration performance comparison on the synthetic andsemisynthetic test sets are summarised in Tables 2.3 and 2.4, respectively.
Table 2.3: Median (Med.) and standard deviation (STD) of registration errorfor the synthetic set A. Base stands for the initial error before registration. Corris the correlation with baseline error. Lowest median errors are in bold. [129]
Base CC CD2 MI MS RC SAD SSD Demons Log- GDB- ED-demons ICP DB-ICP
Med. Set A1 33.7 2.9 64.4 2.3 154.1 2.0 128.8 93.9 110.4 33.5 1.0 0.7Set A2 47.3 2.6 101.3 7.2 128.6 2.0 144.3 81.0 323.8 48.4 1.1 0.7Set A3 28.2 3.0 105.8 3.6 233.8 2.2 177.4 114.4 143.4 28.9 1.1 0.7Set A4 28.9 4.2 29.4 11.9 257.2 4.3 115.3 55.8 18.7 32.8 1.1 0.7Set A5 43.0 6.1 105.0 11.8 200.1 5.4 147.4 126.6 139.9 43.3 1.0 0.7
STD. Set A1 6.6 3.0 46.4 1.9 74.9 4.9 67.8 51.2 50.8 10.3 0.4 0.4Set A2 18.6 6.4 40.4 9.3 52.4 4.6 47.4 40.0 210.9 18.7 0.4 0.3Set A3 9.8 3.5 22.3 5.4 53.8 6.1 47.1 42.4 63.8 15.2 0.3 0.2Set A4 14.6 8.6 28.2 19.4 69.3 18.9 50.7 30.6 18.9 17.4 0.4 0.4Set A5 14.5 8.3 20.7 9.0 41.5 8.9 35.2 44.0 75.4 18.4 0.4 0.3
Corr. 1.00 0.16 0.53 0.25 -0.74 0.09 0.01 0.20 0.78 0.98 -0.33 0.05
CC performed relatively well for both the synthetic and semisynthetic sets, achieving amedian registration error below five pixels for most images. The variation of error forsome images was high, especially for the synthetic sets A4 and A5, however. Excludingsome individual images, RC produced low median errors for all sets for both syntheticand semisynthetic images. However, the error variance was high, especially for the fourthsynthetic set A5. MI produced relatively good results for the first synthetic set, butshowed sensitivity to the increasing level of deformation with the successive sets.
For the semisynthetic set B, MI performed comparably to CC. CD2, MS, SAD and SSDmanaged to, at least in part, successfully register the images at wavelengths near thebase image, but produced high errors elsewhere.

2.6 Spectral image composition 61
Table 2.4: Median (Med.) and standard deviation (STD) of registration errorfor the semisynthetic set B. Base stands for the initial error before registration.Corr is the correlation with baseline error. Lowest median errors are in bold. [129]
Base CC CD2 MI MS RC SAD SSD Demons Log- GDB- ED-demons ICP DB-ICP
Med. Set B1 13.8 4.5 36.8 5.8 50.8 4.0 56.5 33.0 39.2 16.1 0.0 3.5Set B2 51.4 0.0 18.4 0.0 21.3 9.9 44.7 15.1 15.2 39.0 0.0 0.0Set B3 25.7 0.0 32.6 0.0 10.9 0.0 61.4 3.7 15.2 23.3 0.0 -Set B4 58.7 4.6 167.7 4.5 6.4 5.1 17.1 4.8 8.7 34.2 0.0 34.7Set B5 33.2 3.4 41.3 3.5 11.5 4.2 29.4 10.2 12.4 31.8 0.0 332.2
STD Set B1 5.1 3.8 14.6 21.6 21.6 11.3 21.4 13.1 14.5 6.0 0.2 2.3Set B2 1.3 0.3 7.9 10.9 10.9 14.1 21.5 6.3 6.7 4.4 0.0 0.0Set B3 3.5 1.1 2.4 5.6 5.6 5.0 27.6 2.2 5.3 3.5 0.0 -Set B4 9.2 2.0 6.7 4.8 4.8 2.4 11.3 2.3 4.8 9.6 0.0 13.0Set B5 13.6 3.2 19.9 8.4 8.4 6.4 16.9 8.0 9.6 11.1 0.0 117.6
Corr. 1.00 -0.07 0.59 -0.23 -0.65 0.59 -0.74 -0.57 -0.76 0.91 0.00 -0.15
Demons showed very high standard deviation in error and produced globally unrealistictransformations. The method, however, registered local image areas with high accuracy,resulting in error minimum close to zero for most images and low median errors for thewavelengths close to the base image. Log-Demons performed similarly to Demons, butproduced less extreme errors and smaller standard deviations for most images. Further-more, log-demons showed high correlation between the registration and baseline error,suggesting that the method is sensitive to the initial configuration.
ED-DB-ICP was hindered because of using the gradient information, especially in thesemisynthetic test set B. While the successful registrations were highly accurate, themethod failed (i.e., the method found no stable transformation) with several images in allsets. GDB-ICP showed very good performance for both the synthetic and semisynthetictest sets. With the exception of failed registrations for the two shortest wavelength imagesof the synthetic set A, and two partially successful registration in the semisynthetic set B,the method achieved a close to sub-pixel accuracy with minimal standard deviation. Thechannel-wise performances for Sets A1 and B1 of the test sets are shown in Figure 2.21.
As expected, the errors tend to increase with the wavelength difference of the registeredimages as the prominent image features change. The channel-wise errors of the best-performing methods are visualised in Fig. 2.22.
Extended evaluation
The registration accuracy was measured as pixel error between the resulting grid pointsand the original ones before the known transformation. MI produced relatively goodresults for the medium and long wavelengths of the first synthetic set A1, but performedpoorly for wavelengths shorter than 520 nm and showed sensitivity to the increasinglevel of deformation with the successive sets (see Figure 2.23). Furthermore, due to thedeformable transformation, regions of high registration error could be found in otherwisewell registered images.
Using intermediate templates significantly decreases the registration error in the shorterwavelengths (see Figure 2.24). While the shortest path strategy similarly improved the

62 2. Spectral fundus imaging and spectral image composition
(a) Synthetic (Set A1). (b) Semisynthetic (Set B1).
Figure 2.21: The generalized dual-bootstrap iterative closest point (GDB-ICP)errors; the median error is shown with a circle, the boxes represent the 25thand 75th percentiles, and the whiskers extend to the most extreme values stillconsidered as inliers. The outliers are plotted individually. [129]
(a) Synthetic images. (b) Semisynthetic images.
Figure 2.22: Wavelength-wise registration error; Median errors over the sets foreach wavelength. [129]

2.6 Spectral image composition 63
(a) Set A1. (b) Set A4.
Figure 2.23: The mutual information (MI) errors with the synthetic set A; allimages registered to a single base image captured at 540 nm; the median error isshown with a circle, the boxes represent the 25th and 75th percentiles, and thewhiskers extend to the most extreme values still considered as inliers. The outliersare plotted individually. [128]
registrations in the shorter wavelengths, there was an adverse effect to the general regis-tration performance (shown in Figure 2.26).
In the semisynthetic set B, the intermediate template strategy improved the performanceto a point where the mean registration error was within the system error for majority ofthe images. The errors are visualised in Figure 2.25. However, most of the registered im-ages in the test set contained regions with higher registration error, i.e., the registrationswere only partially successful. For the semisynthetic set B, MI did not show similar lossof performance with shorter wavelengths.
RC performed similarly to MI for the medium and longer wavelengths, but showed signif-icantly better performance in the shorter wavelengths. However, similar regions of largererror were present (although less severe than with MI) in the images, and the methodshowed similar sensitivity to increasing deformation of the test images. Furthermore, fora few images of the synthetic set A, RC failed completely (i.e., the registration error forall pixels was over 60). Neither of the joint registration strategies provided any significantincrease in performance for RC. The errors are visualised in Figure 2.27.
GDB-ICP showed very good performance for both the synthetic and semisynthetic testsets. With the exception of failed registrations for two of the synthetic set, and one failedregistration in Set B5 in the semisynthetic set, the method achieved a reasonable regis-tration error with minimal standard deviation. The median registration error remainedbelow 2 pixels for the majority of the images. As the level of deformation increased in thesynthetic images, some regions showed increased registration error (denoted as outliers).The results are shown in Figures 2.28 and 2.29
For GDB-ICP, registering to a single base image provided the lowest error for the methodin both synthetic and semisynthetic sets. Likely due to restricting the transformation
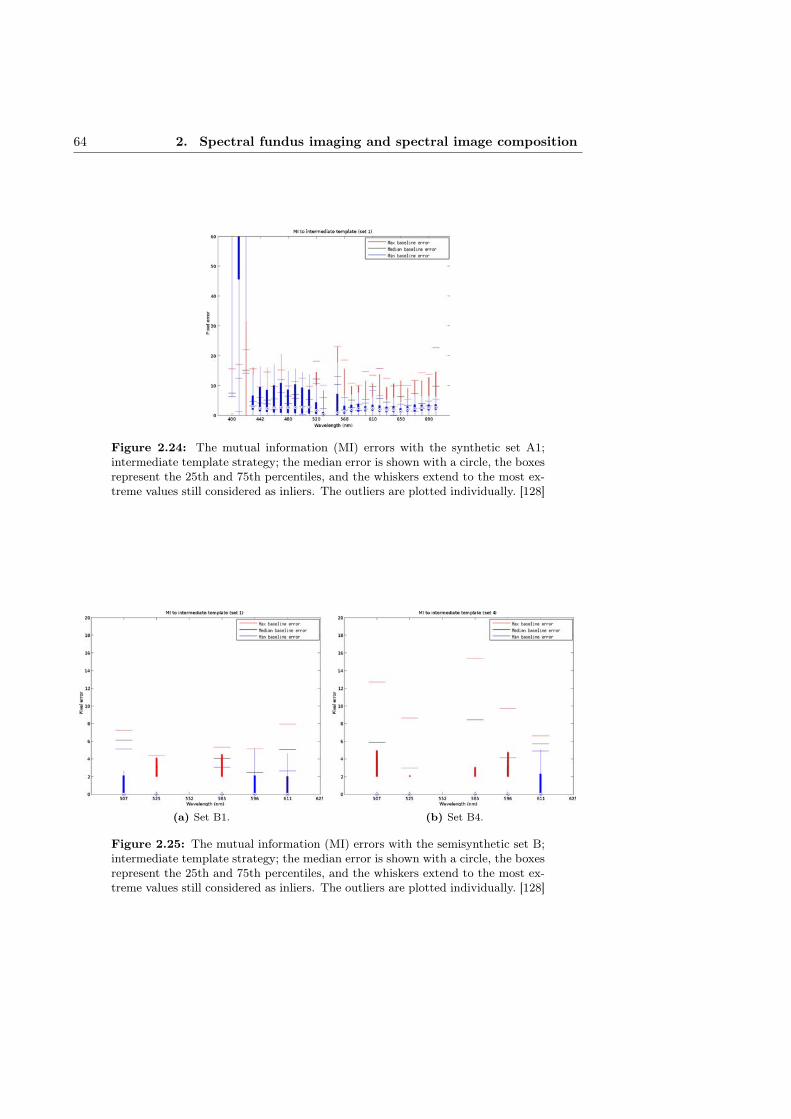
64 2. Spectral fundus imaging and spectral image composition
Figure 2.24: The mutual information (MI) errors with the synthetic set A1;intermediate template strategy; the median error is shown with a circle, the boxesrepresent the 25th and 75th percentiles, and the whiskers extend to the most ex-treme values still considered as inliers. The outliers are plotted individually. [128]
(a) Set B1. (b) Set B4.
Figure 2.25: The mutual information (MI) errors with the semisynthetic set B;intermediate template strategy; the median error is shown with a circle, the boxesrepresent the 25th and 75th percentiles, and the whiskers extend to the most ex-treme values still considered as inliers. The outliers are plotted individually. [128]

2.6 Spectral image composition 65
Figure 2.26: The mutual information (MI) errors with the synthetic Set A1;shortest path strategy; the median error is shown with a circle, the boxes representthe 25th and 75th percentiles, and the whiskers extend to the most extreme valuesstill considered as inliers. The outliers are plotted individually. [128]
(a) Set A1. (b) Set A4.
Figure 2.27: The minimisation of residual complexity (RC) errors with thesynthetic set A; all images registered to a single base image captured at 540 nm;the median error is shown with a circle, the boxes represent the 25th and 75thpercentiles, and the whiskers extend to the most extreme values still consideredas inliers. The outliers are plotted individually. [128]

66 2. Spectral fundus imaging and spectral image composition
(a) Set A1. (b) Set A2.
(c) Set A3. (d) Set A4.
(e) Set A5.
Figure 2.28: The generalized dual-bootstrap iterative closest point (GDB-ICP)errors with the synthetic set A; all images registered to a single base image cap-tured at 540 nm; the median error is shown with a circle, the boxes represent the25th and 75th percentiles, and the whiskers extend to the most extreme valuesstill considered as inliers. The outliers are plotted individually. [128]

2.6 Spectral image composition 67
(a) Set B1. (b) Set B2.
(c) Set B3. (d) Set B4.
(e) Set B5.
Figure 2.29: The generalized dual-bootstrap iterative closest point (GDB-ICP)errors with the semisynthetic set B; all images registered to a single base imagecaptured at 540 nm; the median error is shown with a circle, the boxes representthe 25th and 75th percentiles, and the whiskers extend to the most extreme valuesstill considered as inliers. The outliers are plotted individually. [128]

68 2. Spectral fundus imaging and spectral image composition
complexity to quadratic, any combining of transformations or using intermediate imagesresulted in a notable decrease in performance.
The intermediate template strategy worked poorly for GDB-ICP. As any displacementdue to inaccurate registration accumulates in the template and the quadratic transfor-mation used by GDB-ICP could not fully compensate for the increasing complexity ofthe accumulated error, the template became blurry and caused further error in conse-quent registrations. The strategy of sequential registration did not work well with any ofthe evaluated methods. The large number of combined transformations lead to a rapidincrease in registration error. The results of the image registration performance com-parison on the synthetic and semisynthetic data are summarised in Tables 2.5 and 2.6,respectively.
Table 2.5: Median (Med.) and standard deviation (STD) of registration errorfor the synthetic set A. Init. stands for the initial error before registration, Basefor registration to a single base image, NN for sequential registration, T for inter-mediate template and SP for shortest path. Lowest error for each method/set isdisplayed in bold.
Method Init. GDB-ICP MI RCStrategy All Base NN T SP Base NN T SP Base NN T SP
Med. Set A1 6.1 1.1 1.2 5.5 1.0 2.1 9.1 2.4 3.5 1.3 1.2 1.6 1.4Set A2 11.9 1.1 2.0 8.5 1.7 2.3 18.9 6.0 4.4 1.5 3.0 1.7 1.9Set A3 18.0 1.2 5.2 11.5 1.4 20.4 186.2 25.0 4.3 2.2 10.5 3.0 2.3Set A4 22.7 1.2 4.6 22.3 2.4 8.0 141.1 18.0 7.1 3.0 7.7 3.9 3.9Set A5 31.1 1.2 8.2 47.3 2.2 47.5 275.9 42.7 58.3 4.6 35.1 7.1 5.3
STD Set A1 1.6 0.4 0.7 1.8 0.5 4.1 15.1 2.5 8.9 1.5 2.4 1.3 1.4Set A2 3.4 0.5 2.1 3.3 1.0 5.8 33.8 5.1 10.9 3.6 4.7 3.1 3.0Set A3 6.2 0.6 3.7 5.1 0.9 19.3 73.2 17.8 15.8 5.8 9.9 6.2 5.8Set A4 7.6 0.8 4.0 8.0 1.7 13.3 54.4 8.9 19.3 8.4 11.5 7.4 8.5Set A5 10.9 0.9 8.2 6.3 1.8 29.4 83.2 29.7 30.8 12.6 13.4 10.8 10.2
Table 2.6: Median (Med.) and standard deviation (STD) of registration errorfor the semisynthetic set B. Init. stands for the initial error before registration,Base for registration to a single base image, NN for sequential registration, T forintermediate template and SP for shortest path. Lowest error for each method/setis displayed in bold.
Method Init. GDB-ICP MI RCStrategy All Base NN T SP Base NN T SP Base NN T SP
Med. Set B1 4.1 0.0 0.0 0.0 0.0 4.8 4.6 0.0 4.6 2.6 4.0 3.3 2.6Set B2 6.4 0.0 0.0 0.0 0.0 0.0 0.0 0.0 0.0 0.0 0.0 0.0 0.0Set B3 7.7 0.0 0.0 0.0 0.0 3.0 4.2 0.0 3.5 0.0 0.0 11.0 0.0Set B4 5.7 0.0 0.0 0.0 0.0 0.0 0.0 0.0 0.0 0.0 0.0 0.0 0.0Set B5 15.7 0.0 2.4 7.3 2.3 2.1 3.2 10.2 3.1 2.5 3.6 5.4 2.9
STD Set B1 1.0 0.9 0.6 0.5 0.7 2.9 2.4 1.0 2.8 3.4 5.2 4.3 3.8Set B2 2.7 0.0 0.0 1.4 0.0 1.2 1.5 1.5 1.4 1.3 1.3 3.0 0.9Set B3 3.0 0.1 0.8 0.8 0.5 1.9 2.5 2.8 2.1 1.4 7.1 6.7 3.0Set B4 2.1 0.1 0.0 1.3 0.0 1.0 0.8 0.9 0.5 1.0 0.8 1.3 0.8Set B5 5.0 0.9 1.8 5.0 1.5 2.1 4.7 8.6 4.1 4.4 3.8 7.7 3.8
The deterioration of the spectral image quality of the composed image when registeringwith GDB-ICP was similar to the image with linear displacement of ≈ 1 pixels, de-
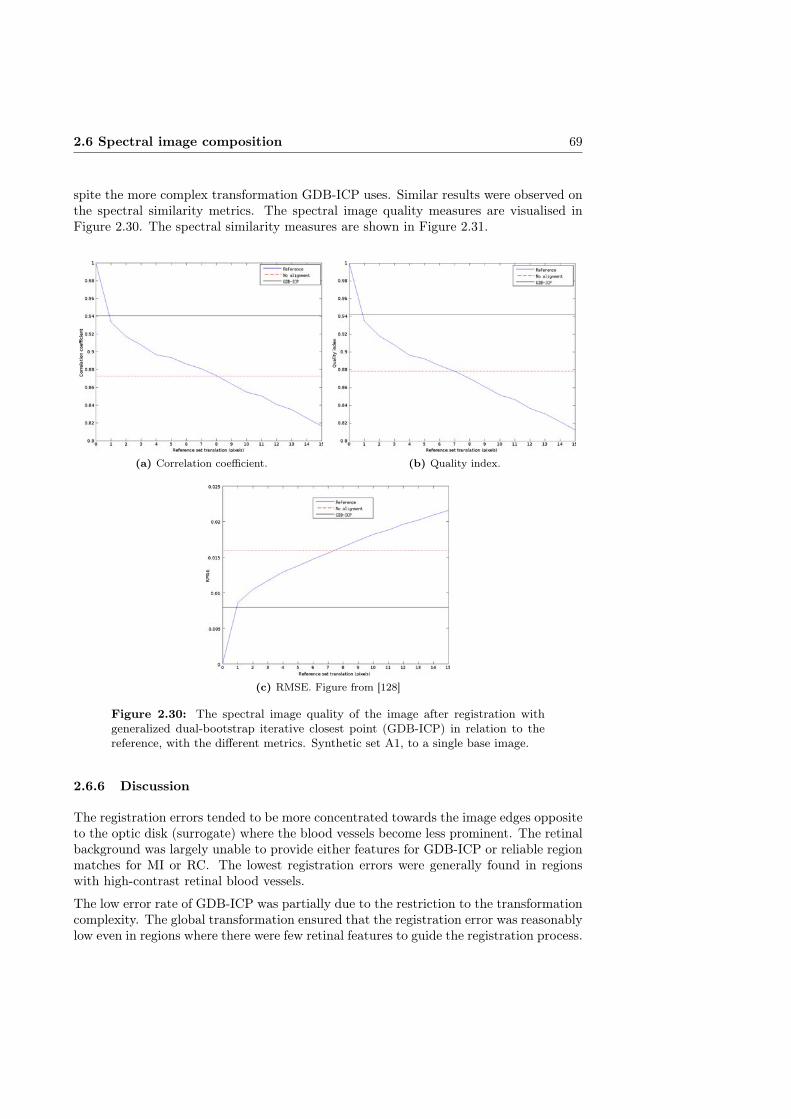
2.6 Spectral image composition 69
spite the more complex transformation GDB-ICP uses. Similar results were observed onthe spectral similarity metrics. The spectral image quality measures are visualised inFigure 2.30. The spectral similarity measures are shown in Figure 2.31.
(a) Correlation coefficient. (b) Quality index.
(c) RMSE. Figure from [128]
Figure 2.30: The spectral image quality of the image after registration withgeneralized dual-bootstrap iterative closest point (GDB-ICP) in relation to thereference, with the different metrics. Synthetic set A1, to a single base image.
2.6.6 Discussion
The registration errors tended to be more concentrated towards the image edges oppositeto the optic disk (surrogate) where the blood vessels become less prominent. The retinalbackground was largely unable to provide either features for GDB-ICP or reliable regionmatches for MI or RC. The lowest registration errors were generally found in regionswith high-contrast retinal blood vessels.
The low error rate of GDB-ICP was partially due to the restriction to the transformationcomplexity. The global transformation ensured that the registration error was reasonablylow even in regions where there were few retinal features to guide the registration process.
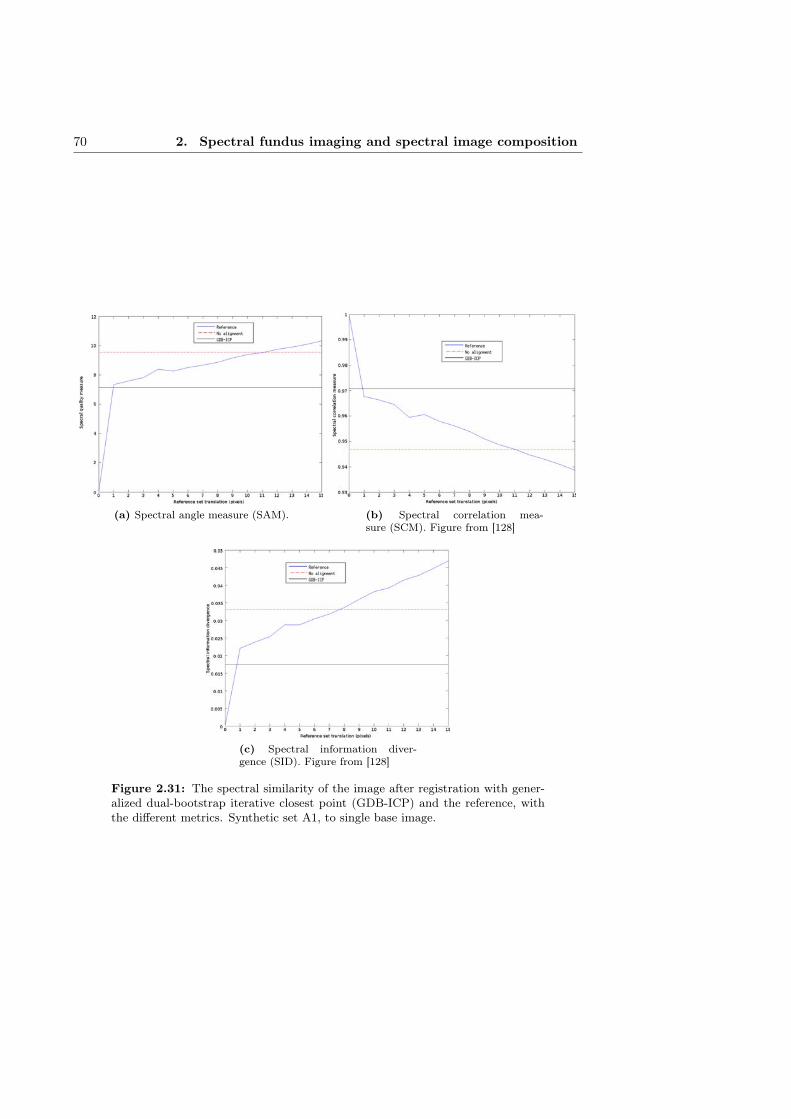
70 2. Spectral fundus imaging and spectral image composition
(a) Spectral angle measure (SAM). (b) Spectral correlation mea-sure (SCM). Figure from [128]
(c) Spectral information diver-gence (SID). Figure from [128]
Figure 2.31: The spectral similarity of the image after registration with gener-alized dual-bootstrap iterative closest point (GDB-ICP) and the reference, withthe different metrics. Synthetic set A1, to single base image.
2.6 Spectral image composition 71
In contrast, MI and RC generated, for some images, transformations where the parts ofan image containing well defined features were registered to sub-pixel accuracy and theregistration errors of tens of pixels could be found elsewhere.
The sequential registration strategy causes additional problems for non-deformable regis-tration approaches (i.e., approaches that limit the complexity of the transformation usedfor registration). Even if the transformation error is negligible, as a non-rigid transforma-tion is required to properly represent the deformation due to eye movement, combiningthe sequential registrations results in different channels being registered with transfor-mations of different complexities. In addition, complex transformations require multipletransformation steps as the combined transformation cannot be expressed as a multipli-cation of the transformation matrices. Quantitatively, the accumulation of registrationerror significantly outweighed any benefit gained by having less difference in the imagewavelengths.
Using the shortest path can help to avoid large wavelength dependent differences betweenimages and limit the accumulation of error due to combined intermediate transforms.However, unless the length of the shortest path is the same for all images, the imageswill be registered with transformations of different complexity when using non-deformableapproaches. The strategy is also sensitive to the choice of the similarity measure usedin constructing the cost matrix (i.e., how the distance between images is measured whendetermining the shortest path). Based on the results, the shortest path strategy is notan effective strategy for the joint registration of spectral channel images.
In general, with the exception of using intermediate templates with MI, the evaluatedregistration strategies showed limited benefit. The increase in registration error due toeven limited number of combined transformations outweighed the benefit of more similarimage content due to smaller difference in wavelength.
Unless a threshold below which the registration error cannot be distinguished from theerror inherent in the imaging system, such as in the case of the semisynthetic test set,can be determined, a clear distinction between a successful and a failed registration isapplication dependent and not trivial. In the case of spectral images, determining anerror threshold for a successful registration can be approached through the effect of theregistration inaccuracy on the spectra; a registration error of two pixels would requirethe spatial resolution of the spectral image to be downscaled by a factor of two to provideaccurate spectra at each pixel.
Using maximal resolution, the system by Fält et al. [55] is capable of acquiring imagesat 2048 × 2048 (at the cost of increased noise). Therefore, a registration error of twoor three pixels would still allow high-resolution images with accurate spectrum at eachpixel. GDB-ICP is capable of registering most images with the median error within thisaccuracy. For the first set RC achieves similar median error, but some images containregions with considerably higher errors. The large errors of MI in the blue wavelengthimages make the method unreliable in spectral image composition.
2.6.7 Summary
Of the compared methods, GDB-ICP outperformed the others in both number of suc-cessful registrations and the accuracy of registration. The experiments on synthetic and

72 2. Spectral fundus imaging and spectral image composition
semi-synthetic data showed that the registration error increases with increasing wave-length difference between the floating and the base image. The other well-performingmethods were CC, MI and RC, but they could not match the accuracy and success rateof GDB-ICP.
The non-rigid registration approaches performed poorly due to significant differences be-tween the channels. While locally accurate, the resulting transformations were unrealisticand inaccurate globally.
2.7 Illumination correction in spectral images
Due to the fundus camera optics, the curvature of the eye fundus and the limited aperture(pupil), the light used to illuminate the fundus is not evenly distributed onto the fundus.The uneven illumination field adds a low-frequency component to the intensity values ofan image, which reduces the visual quality of the image and can have significant effecton automatic segmentation and diagnostics.
The estimation and correction of an uneven illumination field in fundus images has beenstudied (e.g., [6,63,76,126,127,154]). Generally, the illumination field estimation includes(or is limited to) the background of the fundus image. In grayscale or RGB images thefundus background can be expected to form a reasonably uniform texture that does notintroduce a significant bias to the estimation of the illumination field.
A number of different parametric models for estimating the illumination field in an imagehave been proposed. A fourth-order polynomial model for the illumination field of afundus image is used in, e.g., [154]. A general bivariate polynomial field for location(x, y) is defined as
fill(x, y) =
n∑i=0
n∑j=0
βijxiyj , (2.32)
where n is the degree of the polynomial and β0 . . .βn are the estimated model parameters.
Grisan et al. [76] assume the main contributors of the uneven illumination field in fundusimages to be vignette and the possible luminosity glare at the image edges. They proposeto model the vignette by elliptic paraboloids, and the glare by a sigmoid function definedas
S(dr; p) =1
1 + e−(dr+s1)/s2, (2.33)
where dr is the radial distance of the point (x, y) to the image centre and p = (s1, s2) isthe vector of sigmoid function parameters. The elliptic paraboloid modelling the vignetteis defined as x
yLi
= Ry(p9)Rx(p8)Rz(p7)
x− p1
y − p2
p6
((x−p1)2
p4+ (y−p2)2
p5
)+ p3
, (2.34)
where Rx, Ry and Rz are rotation matrices and p1 . . . p9 are the estimated ellipsoidparameters.

2.7 Illumination correction in spectral images 73
Kang and Weiss [113] propose an illumination model that takes into account off-axisillumination, vignette and the tilt of the camera. The model is defined as
fill(u, v) = (1− α0r) cos γ
(1 +
tan γ
f(u sinϕx − v cosϕx)
)31
(1 + (r/f)2)2, (2.35)
where f is the camera focal length, α0 is a radial vignetting factor, γ is the cameratilt angle, ϕx is the rotation of the target around x-axis, (u, v) is the image point (x, y)relative to the image principal point, and r2 = u2 + v2.
All the presented models have been designed for grayscale or RGB images. Spectralfundus images have a number of qualities that affect illumination correction. A fundusbackground with a uniform texture is not a reasonable assumption for spectral fundusimages. Due to the wavelength-dependent absorption and scattering of different retinaland subretinal features, and the varying penetration depth of different wavelengths, theinformation content at what constitutes as the background in grayscale or RGB imageswill vary for different wavelengths.
In imaging systems where the channels of the spectral image are acquired individually(i.e., with a separate exposure for each channel), the resulting illumination fields of thechannel images are independent of each other. Any inter-channel movement of the eyeor the camera, or difference in exposure time can cause significant nonlinear changes inthe spectra of the spectral fundus image.
2.7.1 Illumination field estimation using the image spectra
The simplest approach to spectral image illumination correction is to individually esti-mate and correct the illumination field for each channel. However, the reflectance andscatter of retinal tissue is wavelength dependent, and longer exposure times are generallyrequired towards the shorter wavelengths (due to the increased absorption of the crys-talline lens at those wavelengths). Consequently, the range of illumination field shapesmay vary between channels (requiring different models for accurate estimation).
Furthermore, channel-wise individual approximation does not take into account the con-sistency of the image spectra. The (channel-wise) utilisation of any method that performscontrast enhancement or otherwise modifies the image intensities relative to other chan-nels will likewise result in incorrect spectra.
The consistency of the spectral information can be used to guide the channel-wise illu-mination field estimations. The reflectance from similar retinal tissues can be assumedto produce similar spectra. As the illumination fields are channel-wise independent, thereflectance spectra from a specific type of tissue contain information on different partsof the illumination fields depending on their spatial location in the image.
Reference spectra for guiding the illumination field estimation
If a set of image spectra that sufficiently represent the spectral variation of a specificretinal structure while containing uniform bias (i.e., the illumination field is flat at theirspatial locations) for all channels can be found, the spectra can be used as reference for the
74 2. Spectral fundus imaging and spectral image composition
other spectra where there is inter-channel difference in the bias. Subtracting the referencespectrum with similar underlying histological parameters (i.e., similar tissue structure),sref , from a spectrum si, the resulting residual vector resi = si − sref should consistonly of the illumination field bias and noise (from various sources). Fitting channel-wiseillumination fields to the residuals provides illumination field estimates where the imagespectra remain consistent after correction.
Retinal blood vessels have several characteristics that make them a good candidate forthe reference spectra. Due to the strong absorption of haemoglobin (excluding the longerwavelengths), the spectra of the retinal blood vessels can be expected to have a lowervariance than the background of the fundus, as the light reflected from the backgroundcan be the product of reflections from multiple tissue layers. In contrast, with theexception of smaller retinal vessels, the amount of light reaching the fundus cameraafter passing twice through a retinal vessel and interacting with the tissue below thevessel can be assumed to be negligible.
The main contributors to the reflectance spectra of retinal blood vessels are thereforeabsorption and scatter by haemoglobin and a low-frequency bias caused by the unevenillumination field. The haemoglobin absorbance depends on the oxygen saturation levelof the blood (the absorption spectrum is different for oxygenated and deoxygenatedhaemoglobin). It should be noted that, unless the acquisition time for the whole spectralimage is short, the oxygen saturation level at a specific region in a vessel will varybetween the channels due to natural flow of blood. Thus, directly using the haemoglobinabsorption spectra to guide the illumination field estimation is not applicable.
Furthermore, the retinal vasculature is relatively easy to segment. Numerous automaticsegmentation methods are available, e.g., [64, 134,158,189,208,213].
Extracting the reference spectra
As the set of reference spectra is defined by the uniformity of illumination, an initialestimation of the illumination field for each channel is required for the extraction ofthe reference spectra. A polynomial model is fitted to the blood vessel intensity valuesfor each channel using least-squares approximation. The resulting n illumination fieldestimates g1...n (where n is the number of wavelength channels) model the low-frequencyintensity component within the channels, but provide no consistency over the spectraldimension.
Based on the estimated channel-wise illumination fields, regions of the field with sim-ilar estimated illumination fall-off can be extracted. Selecting a set of linearly spacedthresholds t with values between [max gi,min gi], the set of regions with similar estimatedfall-off can be defined as
Swi= ti ≤ gw ≤ ti−1, (2.36)
where gw is the estimated illumination field of wavelength channel w.
As the amount of light projected onto the eye remains the same and the angle of rotationbetween the eye and the camera should be relatively small, regions of the same set levelat different channels have a similar relation to the peak illumination of that channel.Therefore, the effect of the illumination field on the spectra can be expected to be similarfor the region where the masks of specific level overlap for all channels.

2.7 Illumination correction in spectral images 75
The regions where the reference spectra can be extracted are defined as
Sref =⋃i
(Si ∩ Si+1 ∩ · · · ∩ Sn) . (2.37)
While the levels of bias due to the intensity fields in Sref vary, the bias can be expectedto remain relatively consistent for all the wavelength channels. The reference spectraused to calculated the residual vector are taken from the spatial locations in Sref thatcorrespond to a blood vessel position. With the set of reference blood vessel spectrawith mostly coherent wavelength dimensional illumination bias, residual vectors can becalculated for all the image spectra corresponding to a blood vessel location.
However, as the haemoglobin absorption is wavelength dependent and especially lowtowards the longer wavelengths, the amount of haemoglobin contribution to the imagespectra is different between the channels. As a consequence, the blood vessel intensitiesin the longer wavelength channels are influenced by the reflections from the retinal tissuesbelow the blood vessel. In practice, the blood vessel spectra can be expected to have ahigher variance in the longer wavelength component, which is likely to cause error in theselection of a corresponding reference spectrum for image spectrum s.
To reduce the influence of the longer wavelength channels in the selection of the referencespectrum, the distance between s and sref is weighted by the haemoglobin absorptionspectrum. The reference spectrum for the spectrum s corresponding to the location ona blood vessel (x, y) is selected based on a weighted distance
argmini
(∑ω√
(s− srefi)2), (2.38)
where srefi is the i:th reference spectrum and ω is a weighting factor based on thewavelength dependent haemoglobin absorption coefficient.
With a reference spectrum for each blood vessel spectrum in the spectral fundus image,the residuals for estimating the illumination field are defined
resi = si − srefi . (2.39)
The global illumination field is estimated by fitting n channel-wise independent illu-mination fields g1, . . . , gn to the channel-wise residual values. Dividing the wavelengthchannels using the calculated illumination field estimates reduces the bias due to unevenillumination while retaining the consistency of the image spectra.
2.7.2 Experiments and results
The performance of the proposed illumination correction method was evaluated usingsemisynthetic images based on six-channel spectral images acquired with the system byStyles et al. [216]. The system acquires all six channels in a quick succession using a singleexposure. Therefore, while the formation of an illumination bias field cannot be avoided,all six channels can be assumed to have an identical (or close to identical) illuminationfield.

76 2. Spectral fundus imaging and spectral image composition
Computing the mean over the spectral dimension of the spectral image, a good estimateof the illumination field can be achieved as channel-wise differences are averaged whilethe illumination field is retained. Estimating the illumination field of the mean imageI using a fourth-order bivariate polynomial, the illumination field bias can be correctedby dividing each channel of the spectral image with the estimated illumination field fill,resulting in reference image Iref with (close to) uniform illumination field on each channel.
A test set of 5 semisynthetic images were gained by corrupting each channel of each ofthe 5 reference images Iref using a different fourth-order bivariate polynomial (simulatinga biased illumination field) with randomly sampled parameters (normally distributedsamples with standard deviations based on parameters of estimation of fill).
The artificially corrupted semisynthetic images were corrected using both the proposedmethod and (fourth-order polynomial model) channel-wise correction for reference. Thedifference between the reference spectral image Iref (with no synthetic illumination fieldbias) and the corrected images was measured using spectral distance measures SAM andSID [230], defined as
SAM = cos−1
d∑i=1
xiyi√d∑i=1
x2i
√d∑i=1
y2i
(2.40)
SID =
d∑i=1
pi(log pi − log qi) +
d∑i=1
qi(log qi − log pi), (2.41)
wherepi =
xid∑j=1
xj
, qi =yid∑j=1
yj
, (2.42)
and d is the number of channels in the spectra. The results, visualised in Figure 2.32,show smaller spectral distance to the reference image after correction with the proposedmethod. The channel-wise correction does not retain the consistency of image spectra,and consequently the spectral distance to the reference image is increased. The resultsare consistent for the majority of the images in the test set.
For qualitative evaluation of the performance of the presented illumination correctionmethod, a set of 7 spectral fundus images with visually identifiable unevenness in theillumination field were chosen from the DiaRetDB2 data set. The selected spectral retinalimages were processed using the presented spectral image illumination correction method,and both the corrected channel images and RGB projections (gained by integrating theimage spectra with a set of virtual filters) were visually evaluated.
Visual examination of the results suggests that the method was able to reduce the illu-mination field bias in the spectral image while respecting the consistency of the spectraldimension. An example are shown in Figure 2.33, where the wavelength channels showreduction in the illumination field bias. Two RGB projections are shown in Figure 2.34.

2.7 Illumination correction in spectral images 77
(a) Spectral angle mapper (SAM). (b) Spectral information diver-gence (SID).
Figure 2.32: Spectral difference to the reference spectral image (without syn-thetic illumination field bias).
2.7.3 Discussion
As the method relies on retinal blood vessels to extract the reference spectra, the lackof blood vessels in locations critical to the illumination field estimation can limit theperformance of the method. An example of this can be seen in Figure 2.33b, where aregion of higher intensity (due to illumination field bias) remains after correction.
The consistency of the image spectra is difficult to evaluate without ground truth mea-surements. Indirect proof of the proposed method retaining the consistency of the imagespectra is presented in Section 4.4.2, where the image spectra are used to estimate his-tological parameters of the retina.
2.7.4 Summary
The fundus camera optics, the curvature of the eye fundus and the limited aperture causean uneven illumination field in fundus images, adding a low-frequency component to theintensity values of an image and reducing the quality of the image spectra. Channel-wise individual approximation and correction of the illumination field does not take intoaccount the consistency of the image spectra.
A method for correcting the uneven illumination field in spectral images while retainingthe spectral consistency, based on extracting reference haemoglobin spectra was pre-sented. A set of 7 spectral retinal images and 5 semisynthetic test images were processedusing the presented spectral image illumination correction method. The method was ableto reduce the illumination field bias in the spectral image while respecting the consistencyof the spectral dimension.

78 2. Spectral fundus imaging and spectral image composition
(a) Original channel image 1(458 nm).
(b) Corrected channel image 1(458 nm).
(c) Original channel image 1(600 nm).
(d) Corrected channel image 1(600 nm).
Figure 2.33: Channel images before and after correction with the presentedmethod.
2.8 3D-reconstruction of the retina from spectral images
The images from spectral fundus imaging systems that acquire each spectral channelusing separate exposures offer a unique possibility for image processing. As some eyemovement between the exposures is unavoidable, some disparity of spatial structureswill be present in the data. Using stereoscopic principles, the disparity in the spatiallocation between two (or more) images can be used to estimate depth information atthat spatial location.

2.8 3D-reconstruction of the retina from spectral images 79
(a) RGB image 1 (original). (b) RGB image 1 (corrected).
(c) RGB image 2 (original). (d) RGB image 2 (corrected).
Figure 2.34: RGB projection images before and after correction with the pre-sented method.
Stereoscopic reconstructions of the fundus have clinical value, as stereo fundus pho-tography is used to diagnose e.g., macular edema and glaucoma. Reconstructions of(parts of) the eye fundus from fundus images have been suggested for the diagno-sis of glaucoma [218], study of vasculature [140, 146], and other ophthalmic diagnos-tics [38,39,47,73].
Ideally, a stereoscopic reconstruction from fundus images has several benefits over OCTwhich can be considered as the de facto method for extracting structural information onthe retina. Firstly, the FOV of a fundus image is significantly larger than that of a typical
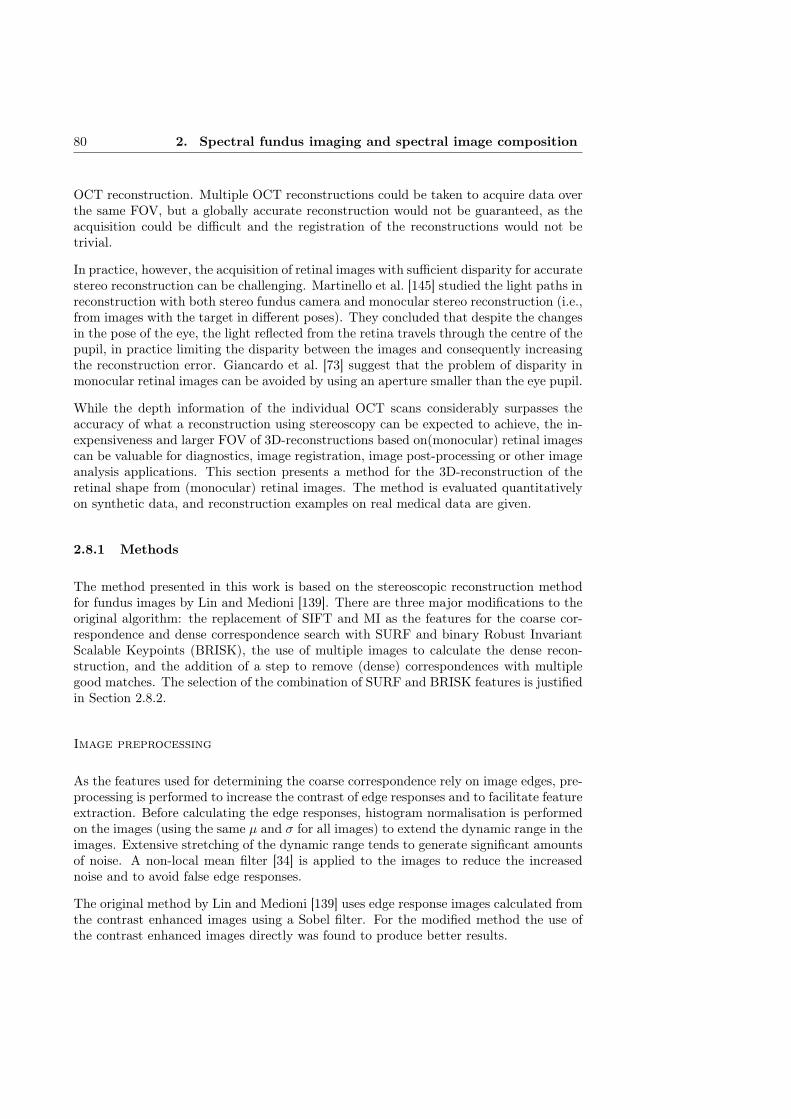
80 2. Spectral fundus imaging and spectral image composition
OCT reconstruction. Multiple OCT reconstructions could be taken to acquire data overthe same FOV, but a globally accurate reconstruction would not be guaranteed, as theacquisition could be difficult and the registration of the reconstructions would not betrivial.
In practice, however, the acquisition of retinal images with sufficient disparity for accuratestereo reconstruction can be challenging. Martinello et al. [145] studied the light paths inreconstruction with both stereo fundus camera and monocular stereo reconstruction (i.e.,from images with the target in different poses). They concluded that despite the changesin the pose of the eye, the light reflected from the retina travels through the centre of thepupil, in practice limiting the disparity between the images and consequently increasingthe reconstruction error. Giancardo et al. [73] suggest that the problem of disparity inmonocular retinal images can be avoided by using an aperture smaller than the eye pupil.
While the depth information of the individual OCT scans considerably surpasses theaccuracy of what a reconstruction using stereoscopy can be expected to achieve, the in-expensiveness and larger FOV of 3D-reconstructions based on(monocular) retinal imagescan be valuable for diagnostics, image registration, image post-processing or other imageanalysis applications. This section presents a method for the 3D-reconstruction of theretinal shape from (monocular) retinal images. The method is evaluated quantitativelyon synthetic data, and reconstruction examples on real medical data are given.
2.8.1 Methods
The method presented in this work is based on the stereoscopic reconstruction methodfor fundus images by Lin and Medioni [139]. There are three major modifications to theoriginal algorithm: the replacement of SIFT and MI as the features for the coarse cor-respondence and dense correspondence search with SURF and binary Robust InvariantScalable Keypoints (BRISK), the use of multiple images to calculate the dense recon-struction, and the addition of a step to remove (dense) correspondences with multiplegood matches. The selection of the combination of SURF and BRISK features is justifiedin Section 2.8.2.
Image preprocessing
As the features used for determining the coarse correspondence rely on image edges, pre-processing is performed to increase the contrast of edge responses and to facilitate featureextraction. Before calculating the edge responses, histogram normalisation is performedon the images (using the same µ and σ for all images) to extend the dynamic range in theimages. Extensive stretching of the dynamic range tends to generate significant amountsof noise. A non-local mean filter [34] is applied to the images to reduce the increasednoise and to avoid false edge responses.
The original method by Lin and Medioni [139] uses edge response images calculated fromthe contrast enhanced images using a Sobel filter. For the modified method the use ofthe contrast enhanced images directly was found to produce better results.
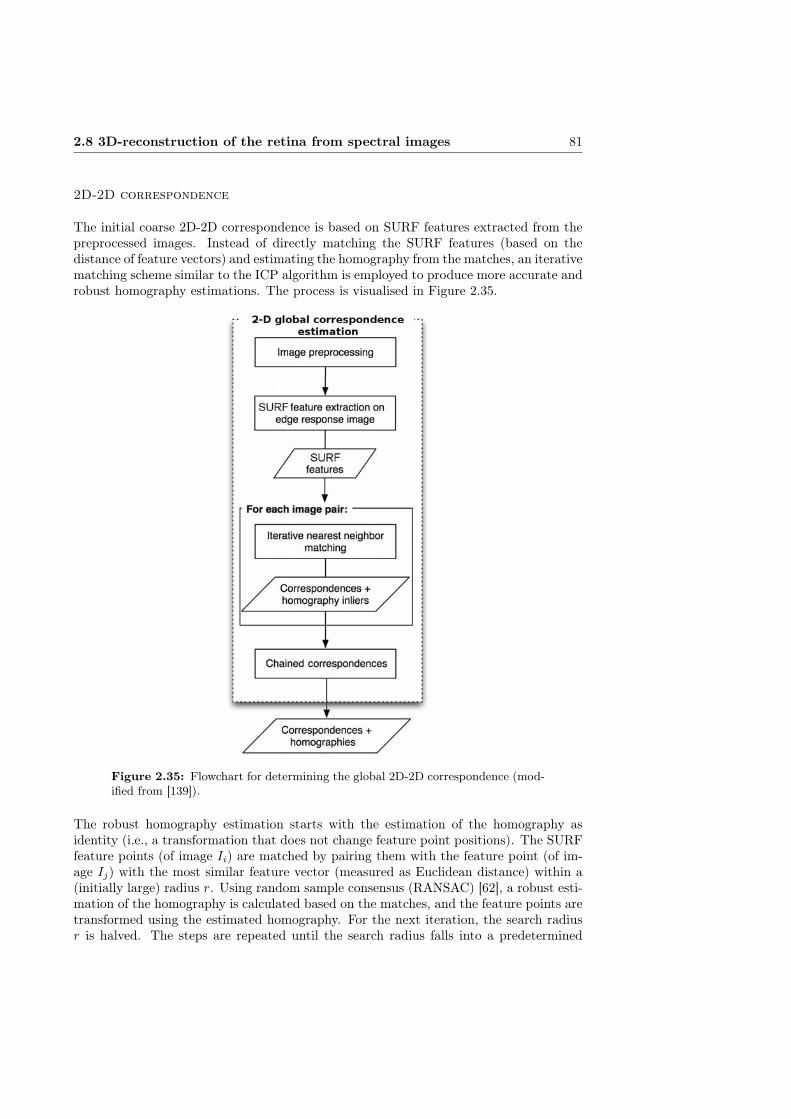
2.8 3D-reconstruction of the retina from spectral images 81
2D-2D correspondence
The initial coarse 2D-2D correspondence is based on SURF features extracted from thepreprocessed images. Instead of directly matching the SURF features (based on thedistance of feature vectors) and estimating the homography from the matches, an iterativematching scheme similar to the ICP algorithm is employed to produce more accurate androbust homography estimations. The process is visualised in Figure 2.35.
Figure 2.35: Flowchart for determining the global 2D-2D correspondence (mod-ified from [139]).
The robust homography estimation starts with the estimation of the homography asidentity (i.e., a transformation that does not change feature point positions). The SURFfeature points (of image Ii) are matched by pairing them with the feature point (of im-age Ij) with the most similar feature vector (measured as Euclidean distance) within a(initially large) radius r. Using random sample consensus (RANSAC) [62], a robust esti-mation of the homography is calculated based on the matches, and the feature points aretransformed using the estimated homography. For the next iteration, the search radiusr is halved. The steps are repeated until the search radius falls into a predetermined
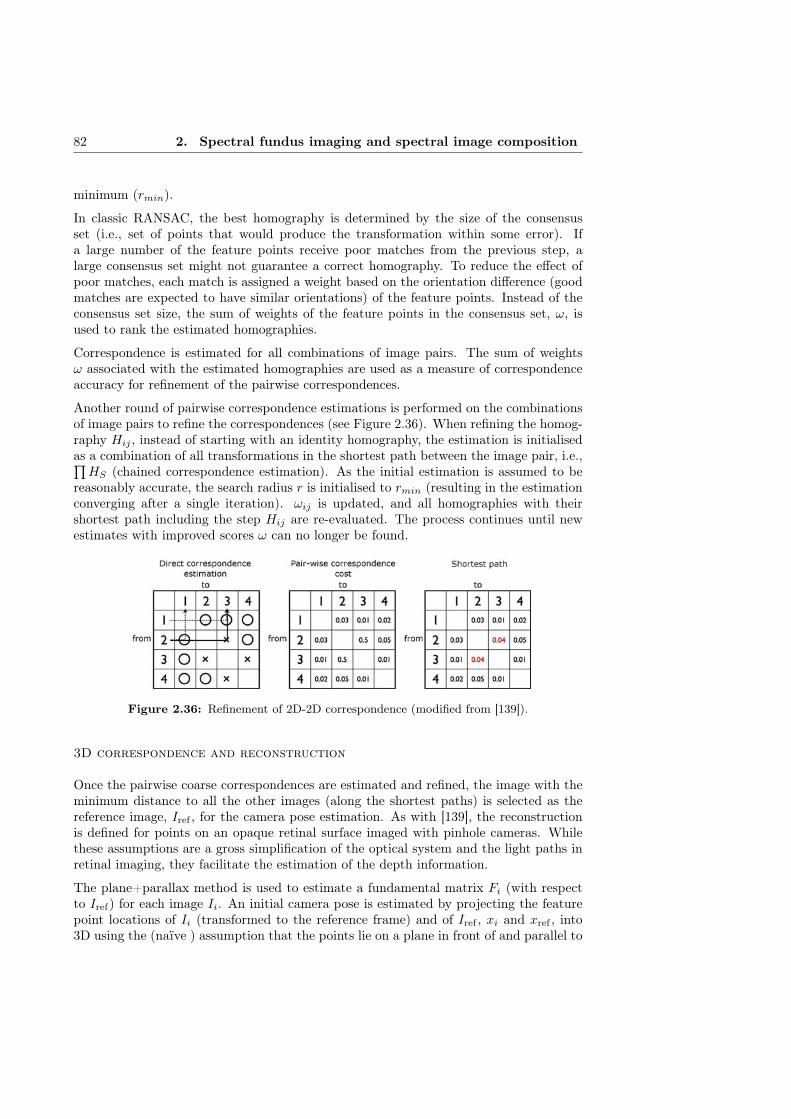
82 2. Spectral fundus imaging and spectral image composition
minimum (rmin).
In classic RANSAC, the best homography is determined by the size of the consensusset (i.e., set of points that would produce the transformation within some error). Ifa large number of the feature points receive poor matches from the previous step, alarge consensus set might not guarantee a correct homography. To reduce the effect ofpoor matches, each match is assigned a weight based on the orientation difference (goodmatches are expected to have similar orientations) of the feature points. Instead of theconsensus set size, the sum of weights of the feature points in the consensus set, ω, isused to rank the estimated homographies.
Correspondence is estimated for all combinations of image pairs. The sum of weightsω associated with the estimated homographies are used as a measure of correspondenceaccuracy for refinement of the pairwise correspondences.
Another round of pairwise correspondence estimations is performed on the combinationsof image pairs to refine the correspondences (see Figure 2.36). When refining the homog-raphy Hij , instead of starting with an identity homography, the estimation is initialisedas a combination of all transformations in the shortest path between the image pair, i.e.,∏
HS (chained correspondence estimation). As the initial estimation is assumed to bereasonably accurate, the search radius r is initialised to rmin (resulting in the estimationconverging after a single iteration). ωij is updated, and all homographies with theirshortest path including the step Hij are re-evaluated. The process continues until newestimates with improved scores ω can no longer be found.
Figure 2.36: Refinement of 2D-2D correspondence (modified from [139]).
3D correspondence and reconstruction
Once the pairwise coarse correspondences are estimated and refined, the image with theminimum distance to all the other images (along the shortest paths) is selected as thereference image, Iref , for the camera pose estimation. As with [139], the reconstructionis defined for points on an opaque retinal surface imaged with pinhole cameras. Whilethese assumptions are a gross simplification of the optical system and the light paths inretinal imaging, they facilitate the estimation of the depth information.
The plane+parallax method is used to estimate a fundamental matrix Fi (with respectto Iref) for each image Ii. An initial camera pose is estimated by projecting the featurepoint locations of Ii (transformed to the reference frame) and of Iref , xi and xref , into3D using the (naïve ) assumption that the points lie on a plane in front of and parallel to

2.8 3D-reconstruction of the retina from spectral images 83
the reference camera. Using the resulting set of 3D-points, Xi, the pose for the cameraassociated with the image Ii (with respect to the reference camera) is estimated byminimising the reprojection error:
ε(Pi) =∑‖xi − PiXi‖2 (2.43)
where Pi is the projection matrix associated with image Ii. The procedure is repeatedfor all the cameras (i.e., camera poses corresponding the individual images).
After the initial pose estimation for all cameras, Xi is re-estimated using triangulationbased on the camera position estimates. After the triangulation step, estimates for boththe camera pose and the 3D-structure exist.
Once the 3D-structure and camera parameters have been estimated, the images arerectified and dense BRISK features are extracted from the images. Based on the featurevectors, feature point correspondences are identified across the images (e.g., the pair ofmatched points aij in Ii and Ij corresponds to the point bkl in Ik and Il). The denseBRISK features are matched for each image pair. To reduce false matches, matcheswhere the relative distance to the second closest match candidate is below threshold tare discarded.
The dense matches are used to refine the estimates by bundle adjustment, i.e., boththe camera parameters and the 3D-point positions are adjusted simultaneously. The re-projection error is minimised again, this time allowing both the camera parameters andthe 3D-locations to vary,
ε(Pi, Xi) = Σ‖xi − PiXi‖2. (2.44)
2.8.2 Experiments and results
A number of features were considered for the dense point matching for the proposedmethod with SIFT and SURF for the 2D-2D correspondence. The features SURF,BRISK, MI and fast retina keypoint (FREAK) were evaluated in the framework of themethod using three synthetic data sets.
The method for generating synthetic images described in Section 2.6.4 was used to gen-erate a data set with simulated changes in eye pose with respect to the camera. Thesynthetic data consisted of retinal images projected onto a segment of a semi-sphere. Aset of images with artificial depth disparities was attained by rotating the semi-sphere andreprojecting the image points back onto a plane. An example of the resulting syntheticimages are shown in Figures 2.37.
The reconstruction was performed using different features for the dense matching. Theimplementations of both the original method by Medioni et al. and the proposed ex-tensions used in the evaluation were implemented by the author and co-workers JarmoIlonen and Antti Hannuksela.
As the underlying topology of the synthetic test images is known, the reconstructionerror can be calculated as the distance from the reconstructed points to the semi-spheresegment. The reconstruction error for reconstructed 3D-coordinates V is defined
e =∑i
√(Vzi − f(Vxi, Vyi))
2, (2.45)
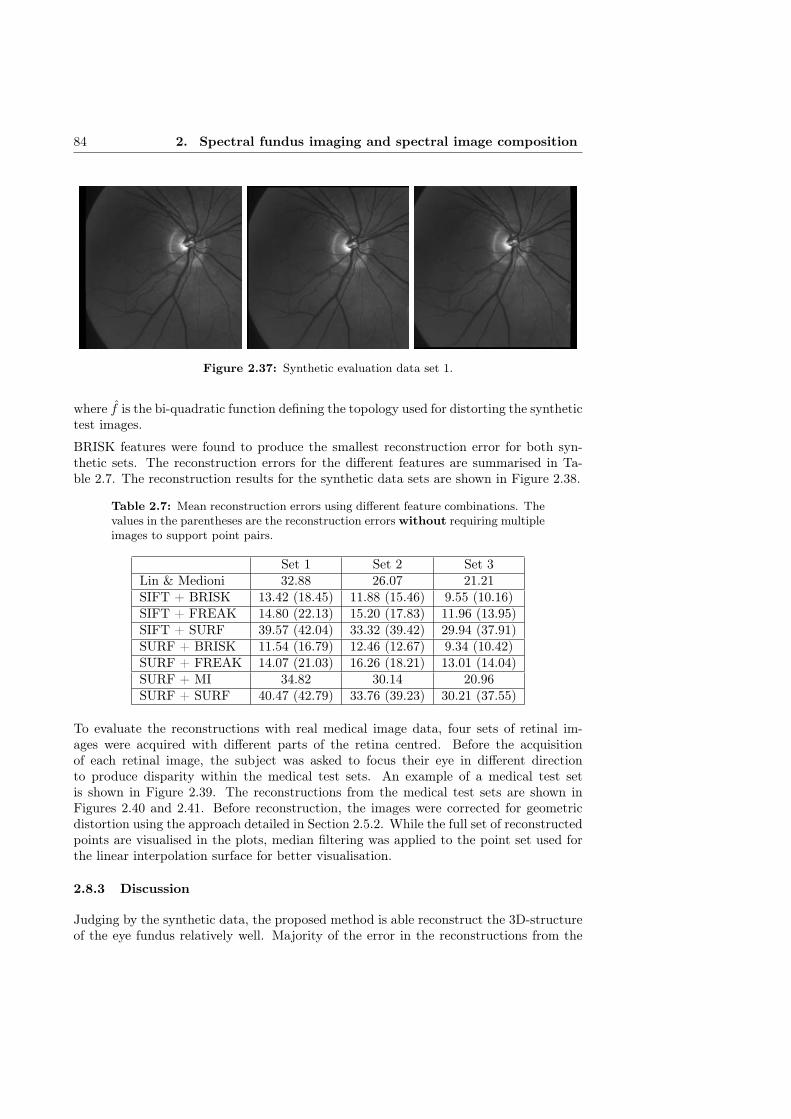
84 2. Spectral fundus imaging and spectral image composition
Figure 2.37: Synthetic evaluation data set 1.
where f is the bi-quadratic function defining the topology used for distorting the synthetictest images.
BRISK features were found to produce the smallest reconstruction error for both syn-thetic sets. The reconstruction errors for the different features are summarised in Ta-ble 2.7. The reconstruction results for the synthetic data sets are shown in Figure 2.38.
Table 2.7: Mean reconstruction errors using different feature combinations. Thevalues in the parentheses are the reconstruction errors without requiring multipleimages to support point pairs.
Set 1 Set 2 Set 3Lin & Medioni 32.88 26.07 21.21SIFT + BRISK 13.42 (18.45) 11.88 (15.46) 9.55 (10.16)SIFT + FREAK 14.80 (22.13) 15.20 (17.83) 11.96 (13.95)SIFT + SURF 39.57 (42.04) 33.32 (39.42) 29.94 (37.91)SURF + BRISK 11.54 (16.79) 12.46 (12.67) 9.34 (10.42)SURF + FREAK 14.07 (21.03) 16.26 (18.21) 13.01 (14.04)SURF + MI 34.82 30.14 20.96SURF + SURF 40.47 (42.79) 33.76 (39.23) 30.21 (37.55)
To evaluate the reconstructions with real medical image data, four sets of retinal im-ages were acquired with different parts of the retina centred. Before the acquisitionof each retinal image, the subject was asked to focus their eye in different directionto produce disparity within the medical test sets. An example of a medical test setis shown in Figure 2.39. The reconstructions from the medical test sets are shown inFigures 2.40 and 2.41. Before reconstruction, the images were corrected for geometricdistortion using the approach detailed in Section 2.5.2. While the full set of reconstructedpoints are visualised in the plots, median filtering was applied to the point set used forthe linear interpolation surface for better visualisation.
2.8.3 Discussion
Judging by the synthetic data, the proposed method is able reconstruct the 3D-structureof the eye fundus relatively well. Majority of the error in the reconstructions from the
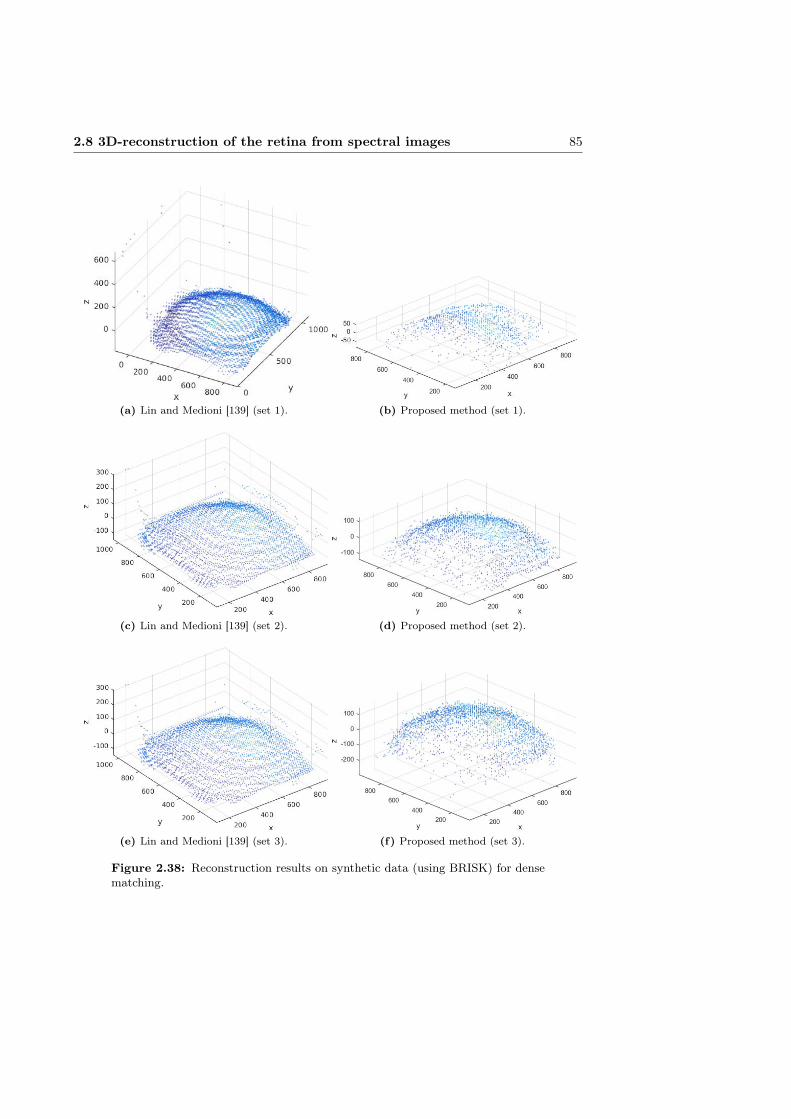
2.8 3D-reconstruction of the retina from spectral images 85
(a) Lin and Medioni [139] (set 1). (b) Proposed method (set 1).
(c) Lin and Medioni [139] (set 2). (d) Proposed method (set 2).
(e) Lin and Medioni [139] (set 3). (f) Proposed method (set 3).
Figure 2.38: Reconstruction results on synthetic data (using BRISK) for densematching.
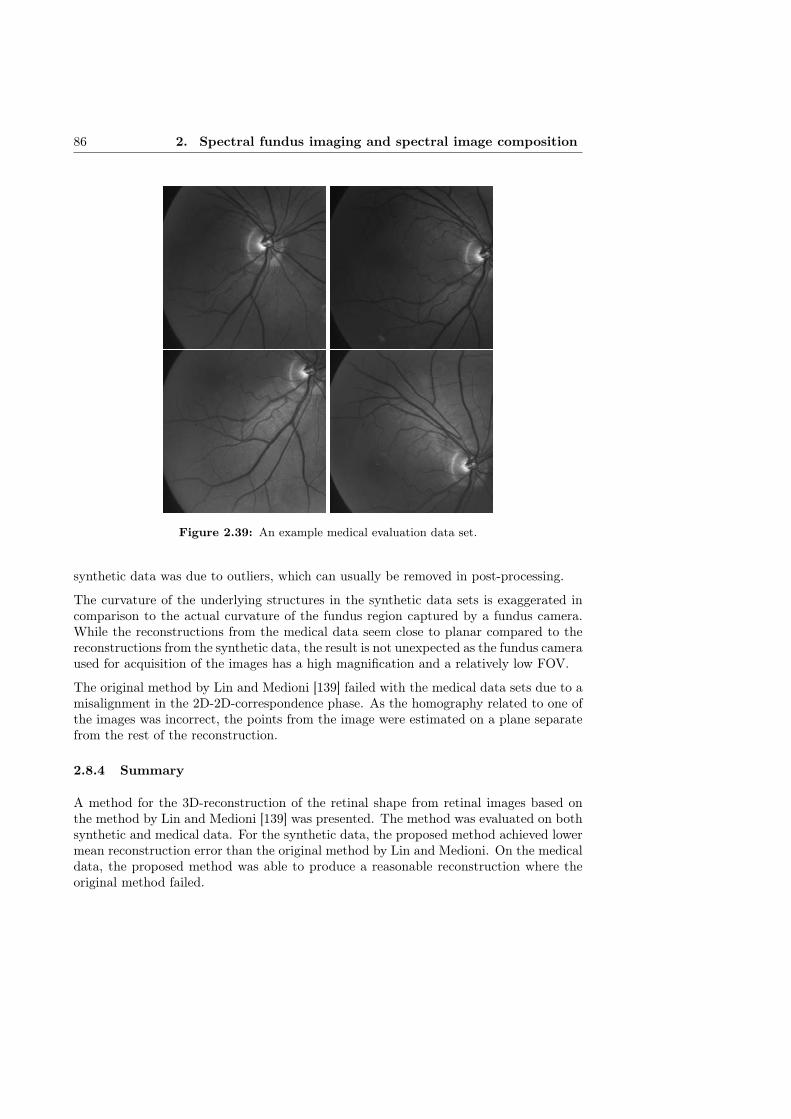
86 2. Spectral fundus imaging and spectral image composition
Figure 2.39: An example medical evaluation data set.
synthetic data was due to outliers, which can usually be removed in post-processing.
The curvature of the underlying structures in the synthetic data sets is exaggerated incomparison to the actual curvature of the fundus region captured by a fundus camera.While the reconstructions from the medical data seem close to planar compared to thereconstructions from the synthetic data, the result is not unexpected as the fundus cameraused for acquisition of the images has a high magnification and a relatively low FOV.
The original method by Lin and Medioni [139] failed with the medical data sets due to amisalignment in the 2D-2D-correspondence phase. As the homography related to one ofthe images was incorrect, the points from the image were estimated on a plane separatefrom the rest of the reconstruction.
2.8.4 Summary
A method for the 3D-reconstruction of the retinal shape from retinal images based onthe method by Lin and Medioni [139] was presented. The method was evaluated on bothsynthetic and medical data. For the synthetic data, the proposed method achieved lowermean reconstruction error than the original method by Lin and Medioni. On the medicaldata, the proposed method was able to produce a reasonable reconstruction where theoriginal method failed.
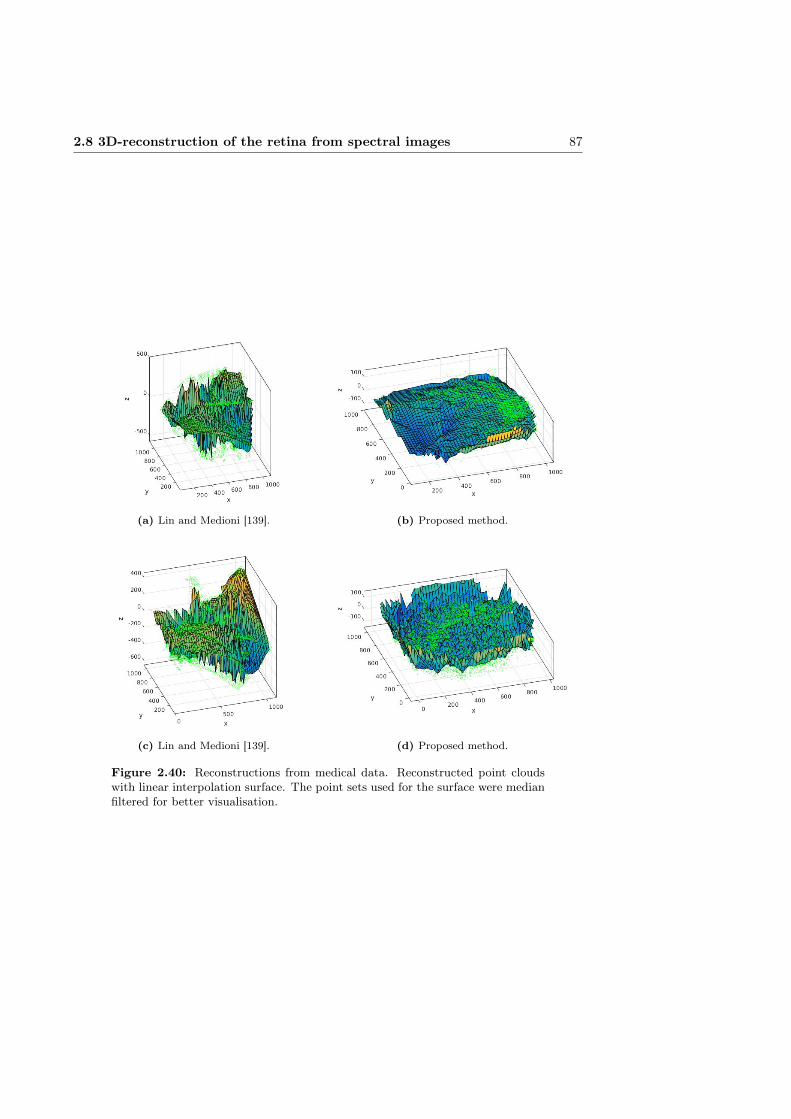
2.8 3D-reconstruction of the retina from spectral images 87
(a) Lin and Medioni [139]. (b) Proposed method.
(c) Lin and Medioni [139]. (d) Proposed method.
Figure 2.40: Reconstructions from medical data. Reconstructed point cloudswith linear interpolation surface. The point sets used for the surface were medianfiltered for better visualisation.
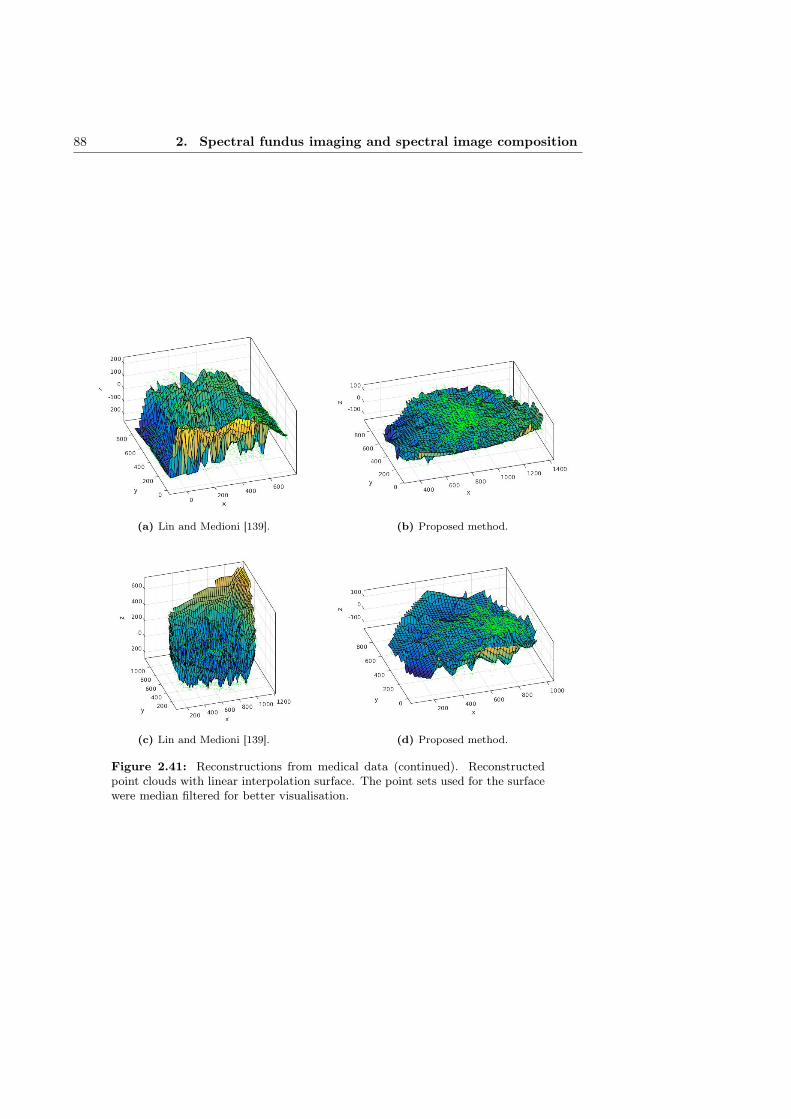
88 2. Spectral fundus imaging and spectral image composition
(a) Lin and Medioni [139]. (b) Proposed method.
(c) Lin and Medioni [139]. (d) Proposed method.
Figure 2.41: Reconstructions from medical data (continued). Reconstructedpoint clouds with linear interpolation surface. The point sets used for the surfacewere median filtered for better visualisation.

Chapter III
Spectral image database of diabetic retinopathy patients
3.1 Introduction
Publicly available benchmark databases with clearly defined evaluation protocols benefitthe development of, e.g., computer vision methods. The evaluation of the method per-formance is facilitated as the performance reported with descriptions of competing andthe state-of-the-art methods are directly comparable. Furthermore, publicly availabledatabases can usually be expected to contain more data for training and testing than anindividual research group would otherwise (easily) have access to.
Compared to typical computer vision benchmark databases, medical image databaseshave a number of important differences. Medical image databases typically concentrateon one organ imaged in a specific modality (e.g., MRI, ultrasound or positron emissiontomography (PET)). The number of images is often limited due to the number of avail-able subjects, the cost of image acquisition, and the ethical considerations related toimaging human subjects. Laws related to the privacy of medical information may alsolimit the publication of medical data.
Medical image databases often contain some relevant information on the images relatedto the purpose of the database. Typically at least the general diagnostic information ispublished with the images. A number of databases provide gold standards for structuralinformation such as the location of the optic disk and macula, and the blood vessel pro-files. Significantly fewer databases seem to offer gold standards for lesions or pathologicalregions.
This chapter discusses the acquisition of images and gold standards of lesion locations forthe spectral fundus image database DiaRetDB2. The spectral information coupled withgold standards for multiple lesion types provide a good basis for method development inautomatic detection and classification of retinal lesions.
89

90 3. Spectral image database of diabetic retinopathy patients
3.2 Public fundus image databases
A number of retinal image databases for various purposes exist, with representations ofdifferent pathologies. Fumero et al. [66] present a fundus image database with accurategold standards of the optic nerve head for the development and evaluation of automaticmethods for the detection of glaucoma.
Niemeijer et al. [159] provide a database of 100 fundus images. The database includesannotations of microaneurysms from four expert ophthalmologists. The data set is apart of the Retinopathy online challenge [187], a platform for standardised evaluation forautomatic microaneurysm detection methods.
Niemeijer et al. [158] compare a number of vessel segmentation methods on a databaseof 40 images with manually segmented vessel trees. In addition to the publication of thecomparison, the database has been made publicly available.
Zhang et al. [254] present an online depository of fundus images with 650 images contain-ing expert annotations focused on biomarkers related to glaucoma diagnosis. A quantita-tive benchmarking method focused on optic disk and cup segmentation and cup-to-diskratio is provided.
Budai et al. [35] have composed a database of 15 high-resolution images of healthy sub-jects with gold standards of the locations of vessels (including differentiation betweenveins and arteries), macula, and the optic disk. The database was later extended with15 images of patients with DR and another 15 of patients with glaucoma [167].
Al-Diri et al. [7] present a reference data set of 16 images for automatic segmentation andmeasurement of retinal vessels. A semi-automatic segmentation method is presented andthe resulting 193 vessel segments have been published along with the reference images.
Hoover et al. [97] have published a data set of 20 images (ten of healthy and ten of patho-logical retinas) with manually drawn reference for blood vessels. The ten pathologicalretinas were selected based on abnormalities or obstructions in the vessels.
Klein et al. [122] present a database for the evaluation of automatic methods for analysingthe severity of DR. The database consists of 1200 images with severity gradings fromthree ophthalmologic departments.
Owen et al. [176] validate a number of automatic methods for vessel tortuosity measure-ment on a data set of 28 fundus images from 14 young children. The vessel profiles fromtwo human observers are included in the data set.
Staal et al. [213] present a database of 40 images, 7 with pathology, for the evaluationof automatic vessel segmentation. Manual vessel segmentations by three non-expertstrained by an ophthalmologist are included.
Significantly fewer examples of databases of images including spectral information canbe found. Styles et al. offer the data set of 35 spectral fundus images described in [216]on request, but to the knowledge of the authors, no previous publicly available databaseof spectral retinal images with a gold standard for multiple region of interests (ROIs)exist.
3.3 DiaRetDB2 spectral retinal image database with gold standard 91
3.3 DiaRetDB2 spectral retinal image database with gold stan-dard
3.3.1 Human subjects and ethical considerations
The DiaRetDB2 database consists of the spectral fundus images of 72 subjects rangingfrom 21 to 81 years of age. 55 of the subjects were diagnosed with various stages of DR,while 17 control subjects had healthy retinas. Of the diabetic subjects 30 were femaleand 25 male. The control group consisted of 4 females and 13 males. Due to lengthyacquisition time (total of ∼ 30min for a single spectral image) only one eye of eachpatient was imaged.
The Declaration of Helsinki [12] was followed for all parts of the study involving humansubjects. The imaging of the patients was conducted by the Department of Ophthalmol-ogy in Kuopio University Hospital (Kuopio, Finland) with the permission of the researchethics committee of University Hospital District of Northern Savo. Written consent wasreceived from all patients prior to the study.
3.3.2 Imaging procedure
The process of acquiring images for the DiaRetDB2 database is described in [55]. Aspectral fundus camera capable of acquiring up to 30 wavelength channels, with centralwavelengths from 400nm to 700nm, was used to capture the spectral fundus images of thevoluntary subjects. The details of the acquisition system are discussed in Section 2.4.1.
Oftan Tropicamid (Santen Oy, Finland) eye drops were used to dilate the pupils of thesubjects before image acquisition. The head of the subject was supported by a foreheadand a chin rest to provide stability and to make the imaging process more comfortablefor the subject. A fixation target was used to reduce involuntary eye movements and toalign the eye of the subject so that optic nerve head was in the image periphery.
The initial camera focus was determined using a bandpass filter with central wavelengthat 550nm, where the retinal blood vessels are prominent. If necessary, manual adjust-ments to the initial focus were made during the acquisition with an individual filter.When the subject deemed it necessary, a moment was taken between the acquisition ofchannels for the subject to rest their eyes before continuing with the imaging.
Images were acquired using all 30 bandpass filters where possible. In practice, however,the low transmittance for the shorter wavelengths in cornea and the lens (see e.g., [28])resulted in very little information to be captured at the shortest wavelength channels.Channels where no significant information was observed were discarded.
3.3.3 Gold standard annotations
Two ophthalmologists were asked to annotate all abnormalities found in the images,and certain retinal structures such as the optic disk and macula. The ophthalmologistswere asked not to consult others during the annotation work to guarantee independentset of annotations. The annotators were given predetermined classes for a number ofmore common lesion types (e.g., haemorrhage and exudate), and general classes with

92 3. Spectral image database of diabetic retinopathy patients
mandatory description fields for other pathological and non-pathological abnormalities.Each annotation includes a confidence level on the scale uncertain - somewhat certain -certain.
Depending on the type of the ROI, the ROI was given either as a single point or a closedregion drawn freehand. For the freehand regions, the ophthalmologists were instructed todraw a boundary enclosing all the ROI of the same type in that area without intersectingthe boundary of the ROI. To provide representative spectra of the ROI, the annotatorswere asked to delineate a representative region where all the region pixels are inside theROI in question.
The motivation for requesting the annotators to include the representative regions comesfrom the requirements of automatic segmentation. Approximate delineation of a lesionor a group of lesions is usually sufficient for a human observer. For an automatic segmen-tation or classification method, however, coarse annotations may result in the trainingexamples of pathologies to contain a significant portion of background pixels. The lossof representativeness in the pathological training examples can significantly reduce theperformance of the automatic method trained or developed with that data. Pixel-wiseaccurate manual annotations are generally not feasible for more than a couple of imagesdue to the amount of work required.
The coarse manual annotations can be post-processed to produce annotations that followthe lesion boundaries more accurately. While the resulting post-processed annotationscan no longer be considered as expert annotations or gold standard, there is a significantpotential for the improvement of the quality of training data for automatic segmentationor classification. The refinement of manual annotations is discussed in Section 3.5.
All annotations by an ophthalmologist for a specific image are stored in a text file in anXML-style format:
<annotationBegin><id>77<id><title>New Hard exudate annotation<title><visible>true<visible><notes><notes><certainty>100<certainty><color>125,125,0<color><isChild>false<isChild><children>78,79,80<children><type>Hard exudate<type><boundaryType>general<boundaryType><coordinates>728.3,672.3,...<coordinates><annotationEnd>,
where id is a unique identifier, visible determines whether the annotation is visible in theview of the annotation tool (facilitates the annotation of closely grouped ROI of differenttype), certainty marks the confidence level, color determines the boundary color (inRGB), isChild determines whether the annotation is an enclosing boundary (parent)or a representative region (child), children contains the identifiers of the representative
3.4 Effect of ground truth inaccuracy on lesion classification 93
regions associated with the annotation, boundaryType (single point or freehand region)instructs the annotation tool how the region is to be drawn, and coordinates contain thexy-coordinate pairs that define the region boundary.
In addition to the spatial annotations, the ophthalmologists were asked to give a generaldiagnosis for each image (e.g., healthy, mild non-proliferative diabetic retinopathy, mildglaucoma, etc.). The diagnostic information is stored in the beginning of each annotationtext file in a similar format:
<diagnosis><isHealthy>false<isHealthy><certainty>100<certainty><diabetesClassification>3<diabetesClassification><AMDClassification>0<AMDClassification><glaucomaClassification>0<glaucomaClassification><maculopathyClassification>1<maculopathyClassification><notes><notes><diagnosis>,
where certainty is the confidence level of the diagnosis, diabetesClassification, AMDClas-sification, glaucomaClassification and maculopathyClassification are the diagnosed stateof diabetic retinopathy, AMD, glaucoma and diabetic maculopathy, respectively.
3.3.4 Summary
Publicly available benchmark databases benefit the development of computer visionmethods. Medical image databases typically concentrate on one organ imaged in a spe-cific modality with the number of images often limited due to the availability of subjects,the cost of acquisition and the ethical limitations.
The steps in the acquisition of images and gold standards of lesion locations for composingthe spectral fundus image database DiaRetDB2 were presented. The spectral informationcoupled with gold standards for multiple lesion types provide a good basis for methoddevelopment in automatic detection and classification of retinal lesions.
3.4 Effect of ground truth inaccuracy on lesion classification
A number of different approaches for the automatic and semi-automatic image segmenta-tion and detection of lesions in the retinal images have been proposed, e.g., [59,177,224].A large number of the automatic methods are supervised, i.e., detect abnormalities us-ing a pretrained model to classify regions of interest based on image features such ascolour [195], texture [4], or a combination of several features [74,163].
One of the main problems with supervised methods is the need for representative data ofthe regions of interest, preferably spatially accurate ground truth, to train the classifier.A common solution for composing the spatial ground truth of the abnormalities in reti-nal images is to ask medical experts to perform manual or semi-automatic segmentation.However, manual annotation of a set of images is time-consuming and tedious, and the

94 3. Spectral image database of diabetic retinopathy patients
time of medical professionals qualified to make the annotations is often limited. Conse-quently, while some retinal image databases contain approximate manual segmentationsor delineations of the lesions, spatially accurate ground truth is often unavailable.
When producing manual annotations, approximate delineations result in an inaccurateground truth. Inaccuracies in the ground truth may have a significant impact on theperformance of a supervised method as the classifier is trained with examples that arenot fully representative of the lesion class. Especially in the case where multiple smalllesions of the same type, such as exudates, are spread over a region, the delineated areamay consist predominantly of the background (an example is shown in Figure 3.1).
Figure 3.1: An example of spatially inaccurate ground truth of exudate loca-tions. [130]
Different image features are affected differently by the increase of non-representativepoints in the training data, a factor that should influence the generation of trainingdata and the selection of features for a supervised segmentation method. This sectionpresents a quantitative evaluation of the sensitivity of different image features (includingcolour, texture and edge features and higher level features) to inaccuracy in the groundtruth [130]. The feature sensitivity is evaluated as the classification error of pixel-wisesegmentation (i.e., if exudate or background pixels are correctly classified as such) ofexudates in retinal images. Separate instances of a classifier are trained using eachfeature individually to assess the sensitivity of the feature to the inaccuracy of trainingdata.
3.4.1 Related work
Sánchez et al. [196] propose the use of active learning to reduce the workload of theexpert annotating medical images. Starting from a small initial training set, a queryfunction selects the sample from an unlabelled set for manual labelling so that it mostlikely improves the classifier performance.
In [210], Sommer et al. present an interactive toolkit for medical image segmentation.The toolkit provides semi-automatic segmentation by a Random Forest classifier that isfine-tuned by interactive refinement of the segmentation results.
3.4 Effect of ground truth inaccuracy on lesion classification 95
Noronha and Nayak [165] review approaches for automatic detection of diabetic retinopa-thy. A quantitative evaluation of method performance is presented, with an emphasis onmethods for automatic segmentation of exudates.
To the knowledge of the author, no quantitative evaluation of the effect of ground truthinaccuracy on classifier performance exists in relation to fundus images. Furthermore, theliterature on supervised classification in the context of retinal images does not, generally,discuss the quality of the ground truth. However, there is awareness of the difficultyof obtaining representative ground truth in medical imaging context and its impact onalgorithm validation. The creation of common databases and performance measures forthe purpose of standardised performance evaluation has been proposed [103,224].
3.4.2 Methods
Local statistical features
Statistical measures can be used as simple descriptors of local neighbourhoods. Whilesimple statistical features are unlikely to provide enough distinction between exudatesand healthy tissue individually, they can be used in conjunction with other features toimprove the overall performance of a classifier. The features selected for the evaluationare intensity range, entropy and intensity standard deviation (σ). The features arecalculated using the following formulae:
Range = Imax − Imin (3.1)
Entropy = −L∑i=1
p(zi) log2 p(zi) (3.2)
Standard deviation =
√√√√ 1
N
N∑j=1
(xj − µ)2, (3.3)
where Imin and Imax are the maximum and minimum values, L is the number of differentgraylevels, p(zi) is the probability of i:th graylevel value, N is the pixel count, xj graylevelvalue of the j:th pixel, and µ is the mean of the neighbourhood.
Colour features
In retinal RGB images, colour is a simple feature with good discriminative properties fora number of retinal structures. The RGB triplets of pixel values can be directly used asfeature vectors for the classifier.
The CIE Lab (Lab) colour space is intended to simulate the colour differentiation of thehuman vision system (i.e., points close together in Lab correspond to visually similarcolours). As the transformation between RGB and Lab colour spaces is nonlinear, Labfeatures may produce different classification results than RGB features.
The transformation from RGB to Lab using CIE D65 illuminant is defined as [101]: XYZ
=
0.412453 0.357580 0.1804230.212671 0.715160 0.0721690.019334 0.119193 0.950227
RGB
(3.4)
96 3. Spectral image database of diabetic retinopathy patients
X =X
0.950456, Z =
Z
1.088754(3.5)
L∗ =
{116(Y/Yn)
13 − 16, Y
Yn≥ 0.008856
903(Y/Yn), YYn
< 0.008856
a∗ = 500[(X/Xn)
13 − (Y/Yn)
13
]b∗ = 200
[(Y/Yn)
13 − (Z/Zn)
13
],
(3.6)
where Xn, Yn and Zn are the tristimulus values of the reference illuminant.
Due to the colour variation of the retina between individuals, the colour features have tobe normalised before using them as training data. The approach to colour normalisationwas to calculate a colour histogram Hi for each image in the training set and performhistogram equalisation for the set with the mean histogram H as the target distribution.
Texture features
Graylevel co-occurrence matrix (GLCM) describes local texture by calculating the fre-quency of the pixel intensity value in a specific spatial relationship (e.g., horizontal neigh-bour) with a pixel of a specific intensity value. GLCM can be seen as a histogram ofintensities occurring in that relationship [86]. A number of features can be calculatedfrom the GLCM, e.g., contrast, correlation, energy and homogeneity. As the contrastmeasure produced the best results for GLCM in the initial evaluation, it was selected asthe GLCM feature. The feature is defined as
Contrast =∑i,j
(i− j)2p(i, j) (3.7)
where i and j are vertical and horizontal coordinates of the GLCM and p(i, j) is the(i, j):th entry of the normalised GLCM. Another approach to local texture representationare local binary patterns (LBPs) where the neighbourhood of each pixel is thresholded bythe pixel intensity value, and the thresholded neighbourhood is summed after weightingthe binary values in order with increasing powers of two. The original framework has beenextended by, e.g., Ahonen et al. [5], who propose a rotation invariant feature calculatedfrom Fourier transform of LBP histograms, local binary pattern histogram Fourier feature(LBPHF).
Higher-level features
The SURF [16] features are constructed by computing Haar wavelet responses fromsquare-shape sub-regions around the keypoint. Rotation invariance is achieved by rotat-ing the sampling region by the dominant orientation of the region gained from Gaussianweighted Haar wavelet responses within a sliding window inside a circular region aroundthe keypoint.
Leutenegger et al. [137] present BRISK, a keypoint descriptor based on brightness com-parisons from locations uniformly spaced on concentric circles around the keypoint. Prior

3.4 Effect of ground truth inaccuracy on lesion classification 97
to sampling, the descriptor orientation is normalised by rotating the sampling patternby the characteristic direction of the neighbourhood, to achieve rotation invariance.
The FREAK [8] describes keypoints by calculating a cascade of binary strings fromcomparisons of image intensities over a sampling pattern imitating the distribution ofretinal ganglion cells. An orientation normalisation similar to BRISK is applied. Inaddition, a keypoint matching approach inspired by human vision system is presented.
Classifiers
In random forest (RF), a number of tree classifiers are generated from independentrandom samples from the training data. The class of input data is determined by themost popular class assigned by the independent tree classifiers [32].
RF classifiers have been used in segmentation and classification of retinal images (e.g., [3,114,190]). Due to its successful application in [210] and good performance in initial exper-iments, RF was selected for the formal experimental evaluation of the feature sensitivity.
3.4.3 Experiments and results
Due to the amount of work involved in the manual annotation of retinal images, the anno-tations of lesion locations available for DiaRetDB2 are not pixel-wise accurate. However,pixel-wise annotations are required for reasonable evaluation of the effect of the inaccu-racy of ground truth on the feature performance.
Instead of using DiaRetDB2, the feature sensitivity was evaluated on a non-public eyefundus image database, Bristol retinal image data set (BristolDB), collected by the Bris-tol Eye Hospital, for which pixel-wise accurate ground truth of exudate locations isavailable. 147 images, of which 107 were used in the evaluation in this study (17 healthypatients and 90 with exudates), were captured using a 45 degree field-of-view CanonCR6-45 Non-Mydriatic fundus camera with a modified digital back-unit (Sony Power-HAD 3CCD colour video camera and Canon CR-TA). Pixel-wise accurate ground truthof exudate locations was manually annotated in the images by a consultant ophthalmol-ogist. [173]
To evaluate the feature performance at different levels of ground truth inaccuracy, an-other set of manual annotations was gathered. Using the pixel accurate ground truthas a reference for exudate locations, approximate delineations enclosing the accurateground truth were manually drawn to simulate expert annotations that are not spatiallyaccurate. Synthetic ground truth with intermediate accuracy was generated by itera-tively thresholding the distance transform image (i.e., image where each pixel value isthe distance of that pixel to the original binary mask) of the accurate ground truth withincreasing thresholds until expanded to the coarse annotations (pixels outside the coarseannotations were discarded at every iteration). An example is shown in Figure 3.2.
For each level of the “ground truth”, each feature was extracted from the pixels designatedby the simulated ground truth mask, with the same number of features extracted fromrandomly selected background pixels within the usable image area.
Initial experiments were run on support vector machine (SVM), Gaussian mixture model(GMM) and random forest (RF) classifiers. However, of the studied classifiers only RF

98 3. Spectral image database of diabetic retinopathy patients
(a) Coarse. (b) Intermediate. (c) Accurate.
Figure 3.2: Example manual (a, c) and synthetic (b) annotations. [130]
produced reasonable results (as opposed to all pixels being classified in the same orseemingly random class) for all of the features.
A separate RF classifier was trained for each feature and for each level of simulatedground truth accuracy. The classifier performance was cross-validated by using randomlyselected two thirds of the images in the database, with the remaining third reserved fortesting the classifier performance. Ten cross-validation steps were performed for eachclassifier.
The classifiers were used to classify each pixel of each image in the remaining one third ofthe image set into exudate or background class. The classification results were evaluatedagainst the (simulated) ground truth of the same level as used in training the classifier(the goal of a classifier can be seen to be the reproduction of classification defined by thetraining data on new input, even though more accurate ground truth was available).
To determine the classifier parameters (number of trees and number of samples for train-ing), classifiers with different parameters were trained using each of the features underevaluation. The classifiers were run on the same data sets used for training to determinethe learning rate with different parameters. The values selected were 3000 samples (forforeground and background, 6000 samples in total), approx. 5% of the training set, and100 trees. As increasing the number of samples beyond 3000, ∼ 5% of the training set,and the number of trees beyond 100 (see Figure 3.3) does not significantly improve thelearning rate while notably increasing the time required for training, these values wereselected for the experiments.
The two commonly utilised metrics that were used to quantify the classification perfor-mance, sensitivity (SN), specificity (SP), are defined as
SN =TP
TP + FN, SP =
TN
TN + FP(3.8)
where TP is the number of true positives (exudate classified as exudate), TN true nega-tives (background as background), FP is false positives (background as exudate) and FNis false negatives (exudate as background).
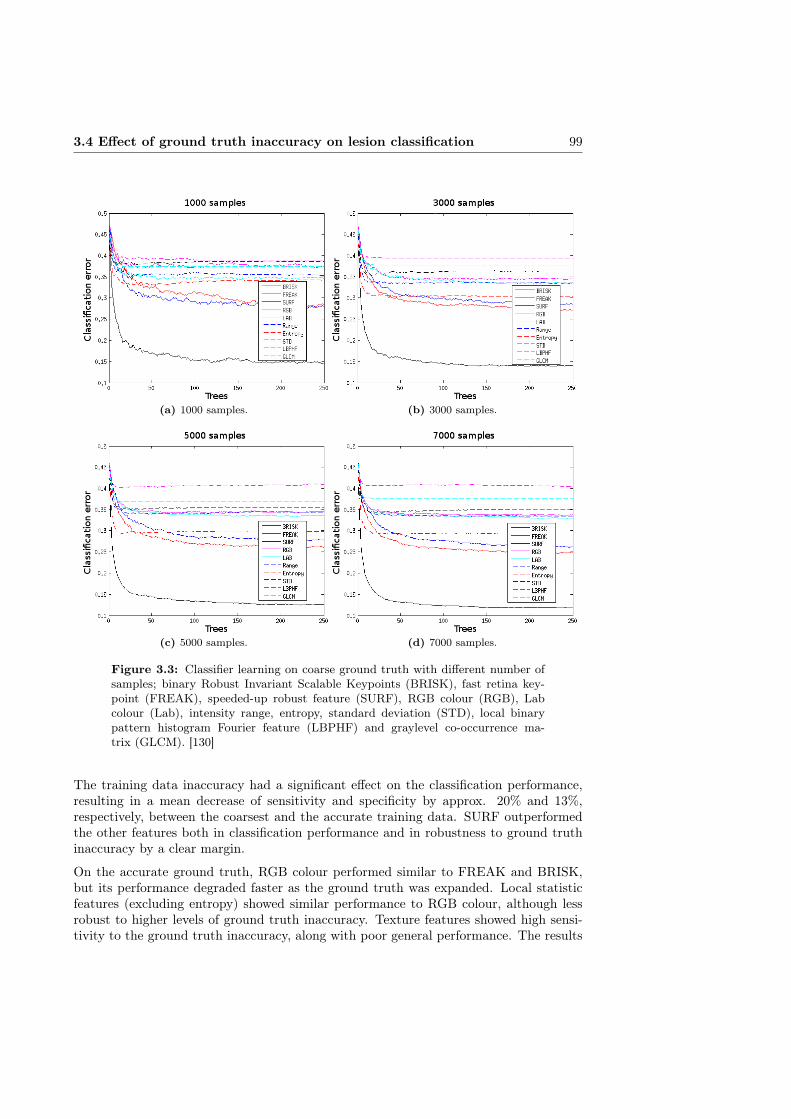
3.4 Effect of ground truth inaccuracy on lesion classification 99
(a) 1000 samples. (b) 3000 samples.
(c) 5000 samples. (d) 7000 samples.
Figure 3.3: Classifier learning on coarse ground truth with different number ofsamples; binary Robust Invariant Scalable Keypoints (BRISK), fast retina key-point (FREAK), speeded-up robust feature (SURF), RGB colour (RGB), Labcolour (Lab), intensity range, entropy, standard deviation (STD), local binarypattern histogram Fourier feature (LBPHF) and graylevel co-occurrence ma-trix (GLCM). [130]
The training data inaccuracy had a significant effect on the classification performance,resulting in a mean decrease of sensitivity and specificity by approx. 20% and 13%,respectively, between the coarsest and the accurate training data. SURF outperformedthe other features both in classification performance and in robustness to ground truthinaccuracy by a clear margin.
On the accurate ground truth, RGB colour performed similar to FREAK and BRISK,but its performance degraded faster as the ground truth was expanded. Local statisticfeatures (excluding entropy) showed similar performance to RGB colour, although lessrobust to higher levels of ground truth inaccuracy. Texture features showed high sensi-tivity to the ground truth inaccuracy, along with poor general performance. The results
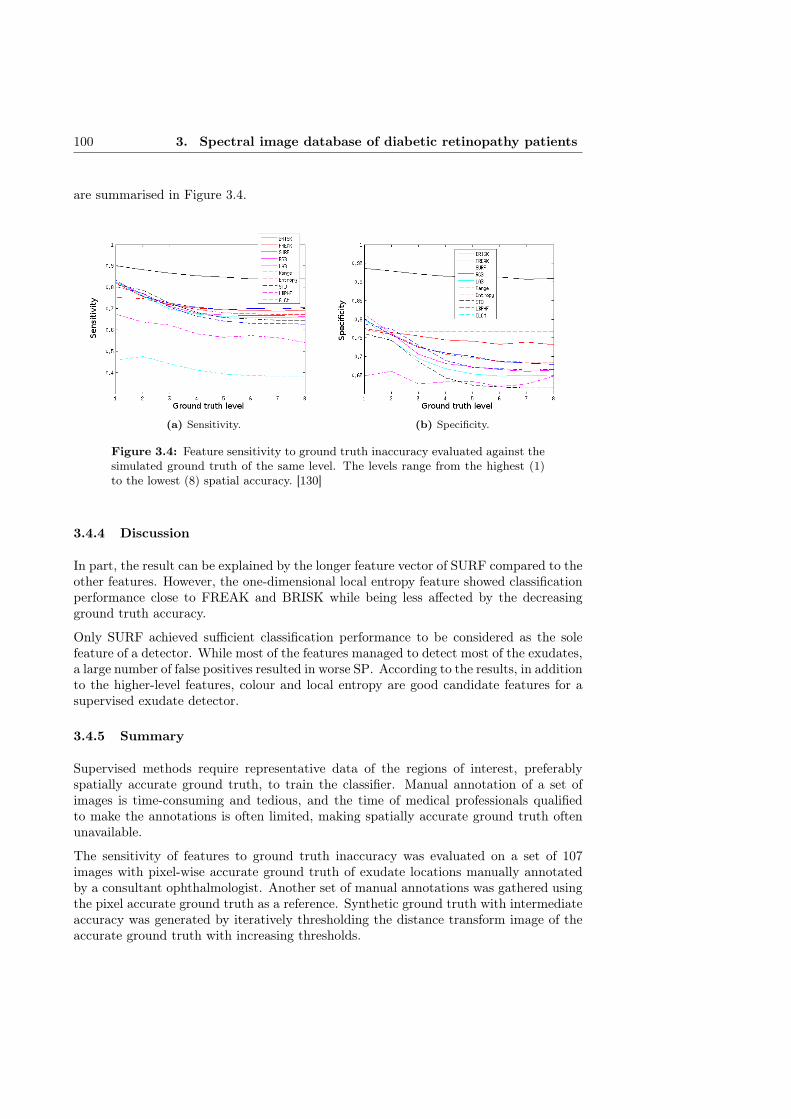
100 3. Spectral image database of diabetic retinopathy patients
are summarised in Figure 3.4.
(a) Sensitivity. (b) Specificity.
Figure 3.4: Feature sensitivity to ground truth inaccuracy evaluated against thesimulated ground truth of the same level. The levels range from the highest (1)to the lowest (8) spatial accuracy. [130]
3.4.4 Discussion
In part, the result can be explained by the longer feature vector of SURF compared to theother features. However, the one-dimensional local entropy feature showed classificationperformance close to FREAK and BRISK while being less affected by the decreasingground truth accuracy.
Only SURF achieved sufficient classification performance to be considered as the solefeature of a detector. While most of the features managed to detect most of the exudates,a large number of false positives resulted in worse SP. According to the results, in additionto the higher-level features, colour and local entropy are good candidate features for asupervised exudate detector.
3.4.5 Summary
Supervised methods require representative data of the regions of interest, preferablyspatially accurate ground truth, to train the classifier. Manual annotation of a set ofimages is time-consuming and tedious, and the time of medical professionals qualifiedto make the annotations is often limited, making spatially accurate ground truth oftenunavailable.
The sensitivity of features to ground truth inaccuracy was evaluated on a set of 107images with pixel-wise accurate ground truth of exudate locations manually annotatedby a consultant ophthalmologist. Another set of manual annotations was gathered usingthe pixel accurate ground truth as a reference. Synthetic ground truth with intermediateaccuracy was generated by iteratively thresholding the distance transform image of theaccurate ground truth with increasing thresholds.
3.5 Annotation refinement 101
A separate RF classifier was trained for a set of features on each level of simulated groundtruth accuracy. The training data inaccuracy had a significant effect on the classificationperformance, resulting in a mean decrease of sensitivity and specificity by approx. 20%and 13%, respectively, between the coarsest and the accurate training data. SURFoutperformed the other features both in classification performance and in robustness toground truth inaccuracy by a clear margin.
3.5 Annotation refinement
As discussed in Section 3.4, non-representative ground truth of lesion locations can have asignificant effect on the performance of automatic segmentation methods. This motivatesautomatic spatial refinement of manual segmentations to improve the representativenessof the coarse manual segmentation data either at the collection stage (semi-automaticsegmentation), or as a post-processing step.
The automatic refinement of manual annotations can be considered as a restricted seg-mentation problem. The purpose of an automatic refinement method is to provide pixel-wise segmentation while requiring only coarse initial segmentation or delineation of theROIs. In the case of medical image processing, the regions are typically anatomicalstructures or lesions related to a medical condition.
In this Section, a method utilising the colour feature and maximally stable extremal re-gions of lesion likelihoods is presented for the spatial refinement of manual segmentationsby experts [130]. The proposed method is compared to a set of methods by using thenon-public BristolDB (described in Section 3.4.3) containing spatially accurate segmen-tations of exudates. Exudates being yellowish lesions typically with a low contrast to thebackground and without clear borders make the segmentation task a challenging one.
3.5.1 Related work
Various approaches have been proposed for segmenting regions indicative of pathologiesand other ROIs in retinal images (e.g., [64,224]). A short review of different approachesfor automatic and semi-automatic segmentation, with the emphasis on retinal imagesegmentation is presented.
Sinthanayothin et al. [206] use a recursive region-growing segmentation (RRGS) and aneural network (NN) to separate blood vessels from red lesions. RRGS is used jointlywith the moat operator increasing the contrast of the edges of the lesions, followed bythresholding.
Hipwel et al. [94] use top-hat transformation on a shade corrected image to removeblood vessels. A Gaussian matched filter is applied to obtain candidate haemorrhageand microaneurysm (HMA) areas used in subsequent classification.
Niemeijer et al. [160] suggest a hybrid method for the detection of red lesions. Candidateregions were obtained by application of a top-hat based method and a pixel-based clas-sification. The true lesion regions were detected with k-nearest neighbour classification.
Ravishankar et al. [185] suppressed blood vessels using morphological operations. Thedetection of exudate boundaries was obtained from the difference between images di-lated at two separate scales. Dynamic thresholding and application of smoothing splines

102 3. Spectral image database of diabetic retinopathy patients
produced closed contours which, after morphological filling, represent the candidate ex-udates. Finally, the true exudates were determined using a linear classifier based on thebrightness and edge properties of the exudates.
Jafaar et al. [102] segment images with logical intersection of coarse segmentation basedon local variation, and the results of adaptive thresholding based on a combination ofpure splitting and histogram-based thresholding. The coarse segmentation assumes thathard exudates have clear boundaries, and is based on the automatic thresholding of astandard deviation image using Otsu’s method, followed by a classification of featuressuch as major axis length, minor axis length, area and solidity.
Walter et al. [237] proposed a segmentation technique based on morphological operations.During the first step, blood vessels were eliminated by closing. The regions with big localvariation were considered as candidate regions after the hole filling from their borders.Afterwards, dilation and optic disc removal were performed. To obtain the final result,the candidate regions were set to zero and reconstructed by successive geodesic dilation.The true exudate areas were produced by thresholding the difference between the originalimage and the reconstructed one.
Many authors have utilised fuzzy c-means clustering (FCM) and its modifications forcoarse and final image segmentation. FCM [24] minimises the distances between thesamples and iteratively updated cluster centres, with each sample belonging to eachcluster with degree of membership w. At each iteration the cluster centres are updatedbased on sample values weighted by their degree of membership for the given cluster.
Kande et al. [112] apply spatially weighted fuzzy c-means clustering (SWFCM) to thegraylevel histogram of the image after removing the optic disc. Maximum membershipprocedure produces the mask corresponding to the true HE regions. Chutatape [252]obtained candidate lesion regions using Improved FCM in Luv colour space after localcontrast enhancement. Classification is performed by SVM utilising region edge strength,colour difference between region and its surrounding area, and region size.
Another popular approach of image segmentation is based on the features extractedusing different filters. For instance, Osareh et al. [174] utilised a bank of Gabor filters tosegment candidate regions obtained by FCM clustering. To identify the best subset offeatures, a genetic optimisation algorithm was employed. Multilayer perceptron neuralnetwork with three layers was used to classify the extracted regions.
Region growing is another clustering technique applied in the detection of hard and softexudates. Sinthanayothin et al. [206] used a Recursive Region Growing Segmentation inorder to find similar pixels in detection of bright lesions. Thresholding was utilised toproduce an exudate mask after all pixels have merged into regions.
Reza et al. [188] applied watershed transform for bright lesion detection. They usedaverage filtering that blends the small objects with low intensity variations into thebackground, and contrast stretching transformation as preprocessing procedures. After-wards, bright parts of the image were isolated by thresholding. Morphological opening ofresulting binary image and the result of extended maxima operator applied to the initialimage gave regions with high intensity values, that were used for obtaining markers insubsequent watershed transform.

3.5 Annotation refinement 103
A significant body of work exists in automatic detection of regions of interest in retinalimages based on classifying pixels. In [173], Osareh et al. perform histogram specificationand local contrast enhancement followed by evaluation of Gaussian smoothed histogramsof each colour band of the image in order to produce initial classification of retinalexudates. FCM clustering is used to assign remaining pixels to the previously determinedclusters followed by neural network object classification.
Similar segmentation scheme was realised in [172]. The major difference is observedin the preprocessing step where colour normalisation instead of histogram specificationwas implemented. Osareh et al. [174] segment candidate regions from FCM using abank of Gabor filters and identify the best feature subset with genetic optimisation. Theextracted regions are classified by a multilayer perceptron NN. Xu and Luo [248] proposea combination of stationary wavelet transform and graylevel co-occurrence matrix as afeature for pixel-level classification by SVM. However, classifiers, such as NN and SVM,cannot be utilised in refinement of manual segmentations as no training data is availableas such.
In addition to medical image processing, various segmentation approaches have beenapplied in numerous other fields. The following short review of segmentation approachesoutside the medical field is limited to publications that are relevant to the methodsevaluated in Section 3.5.3.
Kakumanu et al. [110] present a review of methods for modelling and detection of skin-colour. The review includes the use of different colour spaces, modelling with Gaussiansand Gaussian mixtures, and classification with naïve Bayes classifier.
Donoser and Bischof [223] use colour likelihood maps with modified maximally stableextremal regions (MSER) tracking for robustly tracking a hand through a sequence ofimages. The likelihood map is based on Kullback-Leibler distance between Gaussiandistributions fit to the neighbourhood of a pixel and the background distribution.
Guo et al. [80] propose pixel-based hierarchical features for weak classifiers for handdetection. Adaboost is used to form a strong classifier of the combination of the proposedweak classifiers for skin-colour segmentation.
Wang et al. [240] use graph cuts to segment foreground objects in video frames to obtainmore precise colour histogram of the object for mean shift tracking. Graph-cuts (Graph)based segmentation methods [31] view labelled image areas as nodes of a connected graph,and rearrange the labels corresponding to a minimum cut on the graph.
Ning et al. [164] present an interactive image segmentation method. Unlabelled regionsare merged with initial regions from mean shift segmentation based on similarity (colourhistogram distance) until all regions have been labelled.
GrowCut algorithm (GrowCut) by Vezhnevets and Konouchine [235] is a cellular automa-ton based semi-automatic segmentation method. The image is labelled by interaction ofcellular automata containing different labels, mimicking the growth and competition ofbacteria.
Many of the proposed semi-automatic segmentation methods can be considered as suit-able for the refinement of manual segmentations. A selection of approaches are evaluatedin Section 3.5.3.

104 3. Spectral image database of diabetic retinopathy patients
3.5.2 Region refinement through stable probability regions
The DiaRetDB1 [116, 117] used as the case study (an example is shown in Figure 3.5)includes manual segmentations for the retinopathy lesions together with representativepoints inside each segment. To estimate the parameters of statistical models representingsets of pixels or image features, the values of a single pixel closest to that point (repre-sentative pixel) are not sufficient, however. Thus, small (area ∼ 5− 10 pixels) manuallydrawn representative regions were used.
Figure 3.5: An example image from DiaRetDB1 [117].
The proposed method for the refinement of manual segmentations is based on stableregions of a naïve Bayesian posterior probability map of lesion presence following the ap-proach in [223]. Empirical probability density functions (PDFs) are fit to the colour valuesof the background and lesions by kernel smoothing density estimate using a Gaussian ker-nel. The data samples representing the lesions arise from manually made representativeregions.
A probability map of each pixel belonging to the lesion is calculated as plesion(1 − pbg)where p is the Bayesian posterior probability of the pixel colour value in the lesion and thebackground model, respectively. The lesion mask is produced based on the MSER [147]of the resulting probability map.
MSER, can be seen as a systematic search for regions where local binarisation stays stableover a wide range of thresholds. Thus, the selection of an explicit probability thresholdcan be avoided and small spurious high-probability regions inconsistent with the pixelneighbourhood removed. Algorithm 3.1 presents the details of the proposed method.
3.5.3 Experiments and results
As explained in Section 3.4.3, as only coarse annotations of lesion locations are availablefor DiaRetDB1, another data set is used for quantitative evaluation of the segmenta-tion performance. The performance of the segmentation methods was evaluated on the

3.5 Annotation refinement 105
Algorithm 3.1 Stable probability regions based region refinement: kernel density esti-mate (KDE), maximally stable extremal regions (MSER).
Input: RGB image I, coarse segment set s, representative region set ROutput: Refined segmentation binary mask Mref
Mref ← 0for all segment si doFit KDE Gbg to boundary colour values of siFit KDE Glesion to colour values of region Rifor all pixel colour value vj of si do
pmapj ← p(vj |Glesion)(1− p(vj |Gbg))end forMref(MSER(pmap))← 1
end for
BristolDB, a non-public data set collected by Bristol Eye Hospital, consisting of 107 RGB-images of subjects with diabetic retinopathy and healthy control subjects. Exudates,when present, were marked with pixel-level accuracy by a consultant ophthalmologist.
The test set with coarse segmentations was produced by collecting coarse manual segmen-tations of exudate regions and representative regions (foreground for the segmentationmethods) for each segment. Possible representative region pixels outside the spatiallyaccurate ground truth were removed.
To implement the method comparison, the following methods were used: binary de-cision tree (BDT) based classification (with Gini’s diversity index optimisation crite-rion) [52], FCM clustering [24, 40], segmentation based on Graph-cuts [31], maximalsimilarity region merging (MSRM) [164], GrowCut [235], and the automatic threshold-ing by Otsu [175]. Publicly available third party implementations were used for methodsfor which the original implementation by the author was not available.
The performance of the methods was evaluated by using the Dice similarity criterionbetween the ground truth and the exudate mask refined by a given method, togetherwith the standard detection performance metrics. Dice coefficient is defined as [14]
DSC =2|A ∩B||A|+ |B|
, (3.9)
where A and B are region masks, and |·| is the number of pixels in the region.
In addition, the experiments on the effect of annotation inaccuracy on classifier perfor-mance were performed using the refined exudate masks as training data. The experimentsrelated to the classifier performance follow the framework described in Section 3.4.3, andthe performance is measured in sensitivity (SN) and positive predictive value (PPV),defined as
SN =TP
TP + FN(3.10)
andPPV =
TP
TP + FP, (3.11)
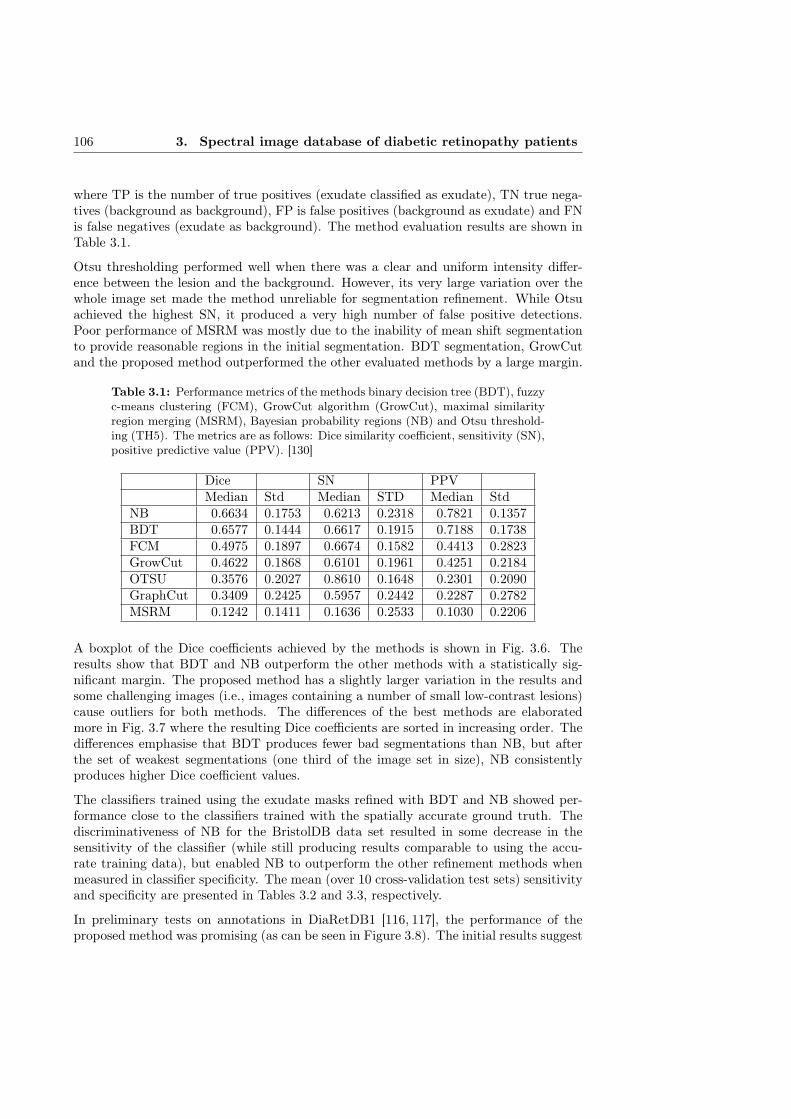
106 3. Spectral image database of diabetic retinopathy patients
where TP is the number of true positives (exudate classified as exudate), TN true nega-tives (background as background), FP is false positives (background as exudate) and FNis false negatives (exudate as background). The method evaluation results are shown inTable 3.1.
Otsu thresholding performed well when there was a clear and uniform intensity differ-ence between the lesion and the background. However, its very large variation over thewhole image set made the method unreliable for segmentation refinement. While Otsuachieved the highest SN, it produced a very high number of false positive detections.Poor performance of MSRM was mostly due to the inability of mean shift segmentationto provide reasonable regions in the initial segmentation. BDT segmentation, GrowCutand the proposed method outperformed the other evaluated methods by a large margin.
Table 3.1: Performance metrics of the methods binary decision tree (BDT), fuzzyc-means clustering (FCM), GrowCut algorithm (GrowCut), maximal similarityregion merging (MSRM), Bayesian probability regions (NB) and Otsu threshold-ing (TH5). The metrics are as follows: Dice similarity coefficient, sensitivity (SN),positive predictive value (PPV). [130]
Dice SN PPVMedian Std Median STD Median Std
NB 0.6634 0.1753 0.6213 0.2318 0.7821 0.1357BDT 0.6577 0.1444 0.6617 0.1915 0.7188 0.1738FCM 0.4975 0.1897 0.6674 0.1582 0.4413 0.2823GrowCut 0.4622 0.1868 0.6101 0.1961 0.4251 0.2184OTSU 0.3576 0.2027 0.8610 0.1648 0.2301 0.2090GraphCut 0.3409 0.2425 0.5957 0.2442 0.2287 0.2782MSRM 0.1242 0.1411 0.1636 0.2533 0.1030 0.2206
A boxplot of the Dice coefficients achieved by the methods is shown in Fig. 3.6. Theresults show that BDT and NB outperform the other methods with a statistically sig-nificant margin. The proposed method has a slightly larger variation in the results andsome challenging images (i.e., images containing a number of small low-contrast lesions)cause outliers for both methods. The differences of the best methods are elaboratedmore in Fig. 3.7 where the resulting Dice coefficients are sorted in increasing order. Thedifferences emphasise that BDT produces fewer bad segmentations than NB, but afterthe set of weakest segmentations (one third of the image set in size), NB consistentlyproduces higher Dice coefficient values.
The classifiers trained using the exudate masks refined with BDT and NB showed per-formance close to the classifiers trained with the spatially accurate ground truth. Thediscriminativeness of NB for the BristolDB data set resulted in some decrease in thesensitivity of the classifier (while still producing results comparable to using the accu-rate training data), but enabled NB to outperform the other refinement methods whenmeasured in classifier specificity. The mean (over 10 cross-validation test sets) sensitivityand specificity are presented in Tables 3.2 and 3.3, respectively.
In preliminary tests on annotations in DiaRetDB1 [116, 117], the performance of theproposed method was promising (as can be seen in Figure 3.8). The initial results suggest
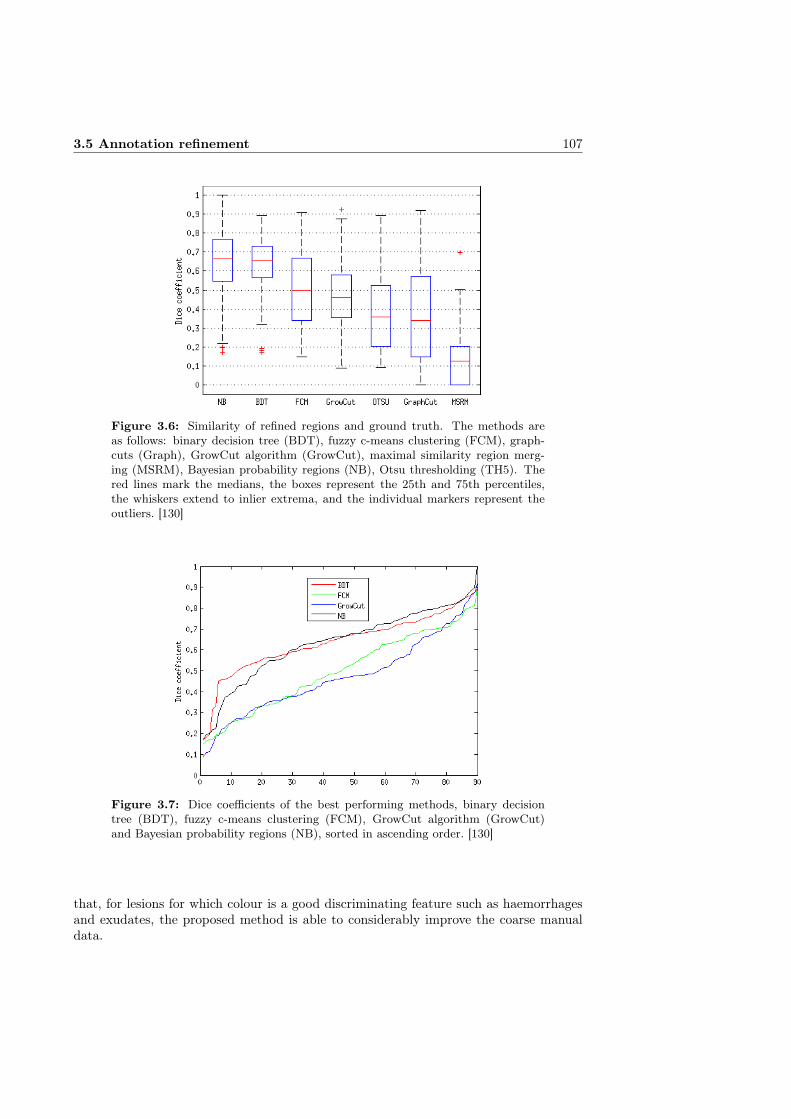
3.5 Annotation refinement 107
Figure 3.6: Similarity of refined regions and ground truth. The methods areas follows: binary decision tree (BDT), fuzzy c-means clustering (FCM), graph-cuts (Graph), GrowCut algorithm (GrowCut), maximal similarity region merg-ing (MSRM), Bayesian probability regions (NB), Otsu thresholding (TH5). Thered lines mark the medians, the boxes represent the 25th and 75th percentiles,the whiskers extend to inlier extrema, and the individual markers represent theoutliers. [130]
Figure 3.7: Dice coefficients of the best performing methods, binary decisiontree (BDT), fuzzy c-means clustering (FCM), GrowCut algorithm (GrowCut)and Bayesian probability regions (NB), sorted in ascending order. [130]
that, for lesions for which colour is a good discriminating feature such as haemorrhagesand exudates, the proposed method is able to considerably improve the coarse manualdata.

108 3. Spectral image database of diabetic retinopathy patients
Table 3.2: Classification result sensitivity using refined annotations as train-ing data. binary decision tree (BDT), fuzzy c-means clustering (FCM), graph-cuts (Graph), GrowCut algorithm (GrowCut), maximal similarity region merg-ing (MSRM), Bayesian probability regions (NB), Otsu thresholding (TH5).
BRISK FREAK SURF RGB LAB Range Entropy STD LBPHF GLCMBDT 0.8626 0.8294 0.9034 0.8003 0.8097 0.7875 0.7586 0.7883 0.6504 0.4991FCM 0.8757 0.8469 0.9325 0.7873 0.771 0.7392 0.7203 0.7395 0.7705 0.4988GraphCut 0.822 0.79 0.9098 0.7448 0.7246 0.7348 0.7293 0.7345 0.6804 0.4991GrowCut 0.786 0.7359 0.8742 0.8019 0.7858 0.7628 0.7554 0.7715 0.684 0.4991MSRM 0.7885 0.6897 0.9046 0.7261 0.6881 0.7225 0.7253 0.7287 0.7023 0.4991NB 0.8098 0.7876 0.87 0.7694 0.7778 0.7768 0.7416 0.7757 0.6605 0.4991TH5 0.8816 0.8443 0.9319 0.7866 0.764 0.7145 0.7048 0.7293 0.6612 0.4967
Table 3.3: Classification result specificity using refined annotations as train-ing data. binary decision tree (BDT), fuzzy c-means clustering (FCM), graph-cuts (Graph), GrowCut algorithm (GrowCut), maximal similarity region merg-ing (MSRM), Bayesian probability regions (NB), Otsu thresholding (TH5).
BRISK FREAK SURF RGB LAB Range Entropy STD LBPHF GLCMBDT 0.7428 0.7587 0.9202 0.815 0.8211 0.7298 0.7202 0.685 0.6629 0.7639FCM 0.6866 0.6837 0.8395 0.6979 0.6991 0.5894 0.5657 0.5517 0.528 0.7639GraphCut 0.6007 0.6215 0.8236 0.6375 0.6328 0.5742 0.5671 0.5407 0.6342 0.7639GrowCut 0.6442 0.6857 0.8815 0.6857 0.6817 0.6084 0.6121 0.5672 0.6272 0.7639MSRM 0.5797 0.6156 0.8269 0.6062 0.6293 0.5633 0.5892 0.5492 0.5987 0.7639NB 0.8091 0.7941 0.9496 0.8575 0.8526 0.7946 0.7863 0.7727 0.6463 0.7639TH5 0.6049 0.6284 0.8228 0.6206 0.6323 0.5643 0.5525 0.5324 0.6413 0.7641
3.5.4 Discussion
The proposed method performed well with most images of the set. The majority of thedifferences between the ground truth and refined mask were false negatives. Therefore,the refined segments can be considered to provide more robust training data also onimages with low contrast between the lesions and the background.
While the median results of BDT and the proposed method were very close, NB re-peatedly provided higher Dice coefficients. However, the larger variation in the resultsdecreased the median Dice value for the method. A plausible reason for larger Dicevariation with NB arises from the fact that for some larger segments, the data containsrepresentative regions of only a few of many small lesions, resulting in Gaussian mixturestoo limited to represent all the exudates within the segment. Nevertheless, the resultsshow that the proposed method has good overall performance in refining the syntheticinaccurate annotations for the BristolDB retinal image database.
3.5.5 Summary
Supervised methods require representative data of the regions of interest to train theclassifier. A common solution to composing the spatial ground truth of the abnormal-ities in retinal images is to ask medical experts to perform manual or semi-automaticsegmentation. When producing manual annotations, approximate delineations result ininaccurate ground truth. The training data inaccuracy was found to have a significant
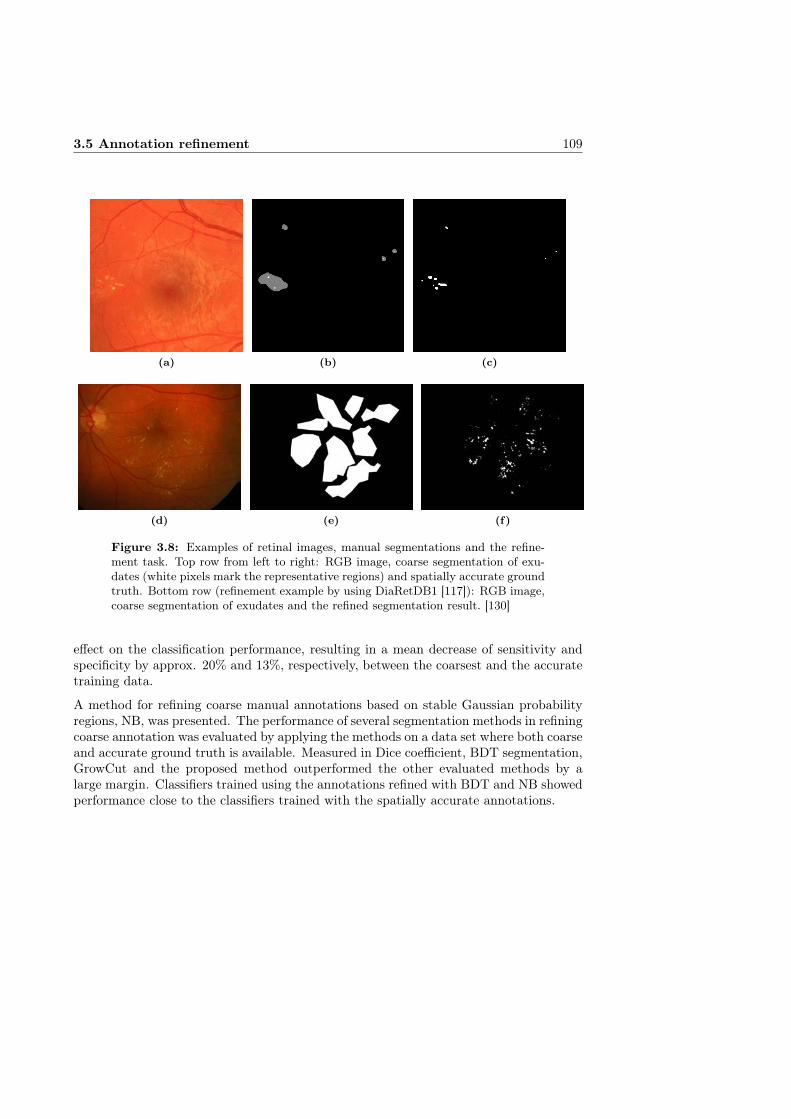
3.5 Annotation refinement 109
(a) (b) (c)
(d) (e) (f)
Figure 3.8: Examples of retinal images, manual segmentations and the refine-ment task. Top row from left to right: RGB image, coarse segmentation of exu-dates (white pixels mark the representative regions) and spatially accurate groundtruth. Bottom row (refinement example by using DiaRetDB1 [117]): RGB image,coarse segmentation of exudates and the refined segmentation result. [130]
effect on the classification performance, resulting in a mean decrease of sensitivity andspecificity by approx. 20% and 13%, respectively, between the coarsest and the accuratetraining data.
A method for refining coarse manual annotations based on stable Gaussian probabilityregions, NB, was presented. The performance of several segmentation methods in refiningcoarse annotation was evaluated by applying the methods on a data set where both coarseand accurate ground truth is available. Measured in Dice coefficient, BDT segmentation,GrowCut and the proposed method outperformed the other evaluated methods by alarge margin. Classifiers trained using the annotations refined with BDT and NB showedperformance close to the classifiers trained with the spatially accurate annotations.

Chapter IV
Medical applications of spectral fundus data
4.1 Introduction
Automatic diagnosis of diabetic retinopathy (DR) is typically based on the detectionof lesions in the eye fundus caused by the prolonged high blood glucose levels. Theearliest signs of DR visible in traditional retinal images are microaneurysms. They arecaused by ballooning of capillaries, and appear as small red dots in the retinal images.Larger red lesions with irregular outlines are caused by ruptured small blood vesselsin the deeper retinal layers, called blot haemorrhages. The weakening of the capillarywalls can result in excess leakage of plasma, manifesting in yellowish-white lesions withwell defined borders, called exudates. Furthermore, the increased vascular permeabilitycauses swelling and disruption of the macular structures, which is known as diabeticmacular edema. As the delivery of oxygen and nutrients is disrupted due to the failure ofand damage to capillaries, the resulting swelling of the retinal nerve fibres causes cottonwool spots, pale areas with poorly defined edges, to appear in the retinal images. [219]
The lack of oxygen and nutrients will stimulate the growth of new blood vessels in anattempt to circumvent the disrupted circulation. The increased growth rate of ves-sels can cause the dilation of small blood vessels (intra-retinal microvascular abnormali-ties (IRMA)), and the formation of new vessels. The newly formed vessels are generallyvery fragile and have a high risk of haemorrhaging, possibly causing a sudden and dras-tic deterioration of vision. [219] The neovascularisation process is known as proliferativediabetic retinopathy, that is in most cases a result of type 1 diabetes, causing increasedhealth care costs due to the necessity of increased follow-ups, laser treatments and vit-reoretinal surgeries, and visual impairment. As IRMA and neovascularisation appearas irregularities of the retinal vasculature, their automatic detection is generally moredifficult than that of some of the other retinal lesions. Consequently, they are not as wellrepresented in the (computerised) medical image analysis literature.
Another pathology causing visible changes to the retina is age-related macular degenera-tion (AMD). As the retina ages, extracellular material may start to accumulate, forminglocal deposits of the material. The deposits, called drusen, appear as yellowish or grey
110

4.1 Introduction 111
spots of various sizes and shapes, and are the earliest signs of AMD. In about 10-15% of eyes suffering from AMD the so called dry AMD progresses to development ofneovascularisation and, thus, to an exudative form of AMD commonly causing visualimpairment.
As the lesions can be identified from retinal images and are strong evidence of a pathology,the automatic diagnosis of these diseases by the segmentation or classification of retinalimages has been studied. When a sufficient number of images with lesions manuallyannotated by an ophthalmologist is available as training data, supervised classificationcan be used to classify image pixels to representations of healthy or pathological tissue.Supervised classification relies on training examples of healthy and pathological data todetermine rules for good separation of the training examples. The rules are then used todetermine classes for new input data.
Pixel-wise supervised classification of retinal images has been used for the segmentationof lesions related to DR (e.g., [161, 162, 211, 238]). Supervised classification has beenapplied to the detection of drusen [148] but, due to the variability in the appearance ofdrusen, has been less popular.
Although the reflectance spectra of a fundus image are results of a complicated set ofphoton interactions with layered tissue, traditional fundus images represent a single spec-trum using only up to three values (red, green and blue). As spectral images capture thecolour information of an image considerably more accurately than grayscale or RGB im-ages, there is significant potential for the improvement of lesion segmentation. However,as the spectral dimensionality increases, preprocessing and the extraction of meaningfulfeatures becomes less obvious.
One great benefit of supervised classification is that the often complicated relationship(especially in the case of spectral data) need not be known. The classifiers simply findsan optimal (for the given classifier) separation of the training examples, and uses thoseparameters to classify new data. Potentially, a good segmentation performance canbe achieved without completely understanding the characteristics of the spectra fromhealthy and pathological tissue. However, all pathological changes in the retina do notshow as salient lesions in the fundus images. It may not be possible for even a trainedophthalmologist to diagnose states such as changes in blood circulation or loss of macularpigment from typical fundus images. Still, the information of the pathological change isretained in the reflectance spectrum, and can be extracted if the spectral resolution ofthe measurement device is sufficient.
Prior knowledge of the formation of the reflectance spectra in spectral fundus imagescan be applied to the extraction of diagnostically interesting regions from the imagespectra. With sufficient understanding of the image formation process and the propertiesof tissues and histological parameters affecting the reflected spectrum, an estimation ofthe concentrations of the diagnostically interesting parameters can be derived from thereflectance spectra.
The distributions of certain histological parameters are of diagnostic interest and canindicate a forming pathology. The decrease in retinal circulation has been linked todiabetic retinopathy [125, 241] and glaucoma [183], and the loss of macular pigmenthas been (indirectly) linked with AMD [20]. Fundus spectra have been used for themeasurement of the histological parameters. This includes the estimation of melanin
112 4. Medical applications of spectral fundus data
concentrations [100], the quantitative analysis of retinal blood flow [48], and the detectionof changes indicative of retinal pathologies [121,123,201]. Methods for spectral reflectancemeasurements, especially spectral imaging of the retina, have been developed [22,55,69,107,120,216].
4.2 Lesion detection by supervised classification
The spectral fundus image data presented in Chapter 3 can be directly used for bothtraining and testing of supervised classifiers for the detection of lesions related to retinalpathologies. The ophthalmologists annotating the images were asked to mark a repre-sentative region of each annotated lesion (or group of lesions), which contains only pixelsthat represent the lesion (the gold standard annotations are discussed in detail in Sec-tion 3.3.3). The representative regions can be used as positive examples of lesion spectra,while negative examples can be extracted from random regions from the spectral imagebackground (with no lesion annotations).
Several well-known supervised classification schemes, with applications in the segmenta-tion or classification of retinal lesions, do not have restrictions on the dimensionality ofthe data and are, thus, directly applicable to spectral images. SVM has been used forthe classification of retinal lesion (e.g., [2, 27, 246]). Support vector machine (SVM) isgenerally used to classify candidate lesion regions (healthy vs. unhealthy or to a spe-cific lesion type) after a segmentation step. Neural networks (NNs) have been used toclassify retinal lesions in, e.g., [70, 71, 155]. Similar to SVM, NNs are usually appliedafter a separate segmentation step. Random forests (RFs) have been popular especiallyin the field of medical image analysis. RF classifiers have been used in segmentation andclassification of retinal images (e.g., [3, 114, 190, 210]). Kauppi [115] used GMMs as thebaseline retinal lesion detection method for the DiaRetDB1.
4.2.1 SVM
SVM is a linear machine classifier with the data preprocessed by mapping them into ahigher dimension where the existence of a hyperplane separating the two classes of datacan be ensured. Support vectors are the transformed training samples with distanceequally close to the separating hyperplane. The optimal separating hyperplane is onethat maximises the margin between the support vectors of the different classes. Theclass of new data is determined by which side of the hyperplane the transformed dataresides. [52]
4.2.2 Gaussian Mixture Models
A Gaussian mixture model (GMM) models data by a set of weighted Gaussian distribu-tions parametrised by corresponding mean µi and covariance matrix Σi. The GMM formultivariate data is defined
p(θ) =
n∑i=1
ωiN (µi,Σi), (4.1)
4.2 Lesion detection by supervised classification 113
where p(θ) is the likelihood of a sample with values θ, n is the number of components,and ωi, µi and Σi are the weight, mean and covariance matrix of the i:th component,respectively.
4.2.3 Neural Networks
A (feed-forward) NN consists of a set of computing nodes arranged in layers such that theoutput of each node in a layer is connected to the input of all nodes of the next layer. Theinput to a node is the weighted sum of the outputs from the previous layer adjusted by anactivation function. The architecture of individual interconnected nodes is reminiscentof the human brain, where a large number of interconnected simple neurons are capableof solving complicated tasks. [75].
4.2.4 Random Forests
In RF, a number of decision tree classifiers are generated from independent random sam-ples from the training data. The tree classifier Oi is trained using a vector Vi generatedby randomly sampling the training data. The vectors V1...n are independent but followthe same distribution. After the RF model is trained, new (input) samples are classifiedby the most popular class assigned by the independent tree classifiers [32].
4.2.5 Evaluation
To quantify the performance of each classifier, the receiver operating characteristic (ROC)curves were computed for the pixel-wise classification results for each method. ROCcurves have found frequent use in medical imaging in evaluating the performance ofcomputational methods for decision support, diagnosis, and prognosis [135]. The perfor-mance of a binary classifier can be characterised by sensitivity and specificity, definedas
SN =TP
TP + FN, (4.2)
SP =TN
TN + FP, (4.3)
where TP is true positive classification, TN is true negative, FP is false positive andFN is false negative, respectively. In a medical setting, SN can be seen as a measurefor how well a method is able to classify pathological data as pathological. Similarly, SPcan be seen as a measure of how likely the data contain pathologies when the methodclassifies them as such.
For a classifier returning continuous membership values, the calculation of the SN and SPvalues requires the selection of a threshold to produce a binary classification for the data.As a less discriminatory threshold value results in increased detection rate at the cost ofincorrect classifications, and vice versa, the threshold selection becomes a compromisebetween SN and SP. The resulting SN and SP values are valid only for that specificthreshold and consequently do not properly characterise the classifier performance as awhole.

114 4. Medical applications of spectral fundus data
ROC curve is the relationship of SN and SP estimated over linearly increasing thresh-olds. The shape of the curve, and area under the curve (AUC), gives a more completeunderstanding of the method performance.
4.3 Histological parameter maps from spectral images
Instead of classifying image spectra into representations of pathologies or healthy tissue,the model of fundus image formation (see Section 2.3.2) can be used, together with theresult spectra, to estimate the histological parameters that contribute to the formationof the spectra by the absorption and scatter of light.With a one-to-one mapping (or anapproximation of one) between the model and image data, the model of image formationcan be used to estimate what molecular concentrations formed the reflectance spectrumcaptured in the image.
4.3.1 Model generation
The model is characterised by the concentrations of retinal haemoglobin, RPE melanin,choroidal melanin, macular pigment and choroidal haemoglobin. The optical parameters,such as absorption and scatter, of the retinal tissues and the molecules they contain areconsidered constant between individuals. While the optical properties of the retinaltissues and molecules can be expected to be constant between individuals, the thicknessof the tissue layers can have a larger variance. However, the in vivo measurement ofthe layer thicknesses is difficult. The selection for the constant optical parameters of themodel is discussed in Section 2.3.2.
The model spectra were computed for a set of parameters, with 9 unique values forchoroidal haemoglobin, 7 for choroidal melanin, and 10 unique values for RPE melanin,macular pigment and retinal haemoglobin. As the number of unique parameter valuesis constrained by the increasing computational cost, the choice of limiting the numberof simulated choroidal layer values was influenced by the fact that no prior distributionsfor the choroidal parameters are known (i.e., the possibility to evaluate the choroidal pa-rameter maps extracted from the model is very limited). The combination of parametersresulted in a total of 63000 spectra. The parameters are shown in Table 4.1.
Table 4.1: Parameters for the model generation (arbitrary units).
Choroidal haemoglobin 0.95 1.90 2.85 3.80 4.75 5.70 6.65 7.60 8.55 -Choroidal melanin 0.0 0.165 0.33 0.495 0.66 0.83 1.0 - - -RPE melanin 0.80 1.22 1.64 2.375 3.11 3.845 4.58 5.07 5.56 6.05Macular pigment 0.0 0.025 0.05 0.0713 0.10 0.185 0.30 0.40 0.50 0.60Retinal haemoglobin 0.0 0.0588 0.12 0.1792 0.25 0.3651 0.50 0.625 0.75 0.875
4.3.2 Alignment of model and image data
Without proper calibration, no mapping between the image spectra and the spectragenerated by the model exists. As the concentrations of the molecules in the retina varybetween subjects, and in vivo measurements are not possible in practice, calibration is

4.3 Histological parameter maps from spectral images 115
generally not available. Styles et al. [216] propose the use of image quotients to allow themapping to be determined for uncalibrated data. Instead of using the absolute spectralintensities, the n spectral channels are divided by the longest wavelength channel toproduce an n− 1 channel vector of relative image quotient values.
The longest wavelength channel is used due to the optical properties of the eye towardsthe infrared. Haemoglobin, a strong absorber in short and middle wavelengths, is nearlytransparent in the longer wavelengths. With the strong scattering of long wavelengthsby water, the lack of strong absorption results in a near diffuse reflection with limitedinformation of individual retinal structures.
In addition, as the general reflectance of the eye fundus is highest in longer wave-lengths [51], the maximal reflectance values can generally be found in the channel withthe longest acquisition wavelength. Using that channel to produce the relative quotientsresults in quotient values in the range [0 1]. For spectral imaging systems acquiringall channels with a single exposure, the largely diffuse and strong reflection of the longwavelength channel is a relatively close estimate of the illumination field present in allthe channel images. Therefore, computing the quotients will remove much of the effectsof uneven illumination.
However, this approach assumes that all channels are acquired with the same exposure.In systems where the channels are acquired individually, the variance in exposure times(resulting in different levels of motion blur on different channels) and illumination fieldscan cause significant error in the computation of the quotients.
Prior knowledge of the histology of the retinal structures can be used to find a mappingbetween the model and the image data. The values of the foveal region form reasonablydistinct distributions in the histological parameter space. Additionally, the foveal regionis usually distinct in retinal images and can be segmented with reasonable accuracy.Running the MC simulation with parameters realistic for the foveal region (e.g., highconcentrations of macular pigment and no haemoglobin) provides quotient values thatcan be compared with the image quotients to align the model with the image data. Asa number of fovea detection methods have been presented [157, 203, 205], the process ofmodel alignment can be automated.
The transformation aligning the model values with the image data is estimated by align-ing the model and the image foveal region data clouds in principal component analy-sis (PCA) space. A scaling factor s is derived from the ratio of standard deviations ofthe image foveal region data PCA scores and the model foveal region values Q projectedinto the image data PCA space
s =Sσ
Sσ, (4.4)
where S is a matrix of image foveal region data principal component scores and S isdefined as
S = CQ, (4.5)
where C is a square matrix where each column is a principal component vector of theimage foveal region data.
The translation t is derived from the difference in the means of the foveal region valuesafter projecting the model data into the image foveal data PCA space. The translation

116 4. Medical applications of spectral fundus data
is definedt = Qimg − s(CQ)CT, (4.6)
where Qimg is a matrix of image foveal region values.
The aligning transformation is achieved by projecting the model data into the space de-fined by the image foveal region data principal components. Multiplying the projecteddata by the scaling factor s, projecting back to the original space, and adding the trans-lation vector t to the projected model data aligns the data clouds. The full alignment isdefined as
M = s(CQ)CT + t. (4.7)
The transformation parameters that align the foveal region data are used to align thefull model with the image data. Examples of the resulting alignments on the full modeland image data are shown in Figure 4.1. Some portion of the image data falls outsidethe model. This is in part explained by the illumination field bias in the channel images,and the spectra of the optic disk, which is not included in the model.
4.4 Experiments and results
4.4.1 Lesion detection by supervised classification
The performance of SVM, GMM, NN and RF in the pixel-wise detection of lesions wasevaluated using the 55 spectral images of diabetics from DiaRetDB2 presented in Chap-ter 3. The representative regions of exudates and haemorrhages, and random backgroundregions outside the full annotations where no lesions were present, were used to train thedifferent classifiers. For a reference to the performance of the spectral data, RGB projec-tions of the same images were used to train another set of classifiers, with the performanceevaluated using the (RGB projections of the) same test set. Matlab built-in functionswere used for the SVM, NN and RF classifiers, and the MVPRMATLAB-toolbox [111]implementation for GMM.
Due to the limited number of examples (not all images contained all lesion types andmany images contained only a few lesions), the classifier performance was evaluated byleave-one-out cross-validation. Each of the 55 images were in turn used as the test image,with the lesions in the remaining images providing the training examples.
As the representative regions amount to only a part of the complete set of lesion pixels,testing the classifier output against only the representative regions would cause signifi-cant bias to the classification result. Similarly, the full annotations contain a significantnumber of background pixels, again biasing the classification result as some of the targetclasses would be opposite of what the classifier was trained with. While pixel accurateannotations would be required for a completely unbiased evaluation, the bias can bereduced by classifying the representative regions as lesions and areas outside the full an-notations as healthy. As the true class for the regions inside the annotation but outsidethe representative region is not know, those areas are not included in the evaluation.While less biased than the other two approaches, some positive bias will be introducedto the results.

4.4 Experiments and results 117
Figure 4.1: Model and image data after alignment (image 1). The dimensionsof the five-dimensional data are plotted pairwise. The model values are plottedin red and the image data in blue.
Trained with the unprocessed image spectra, the SVM, RF and NN classifiers generallyproduced high scores for the true lesion locations. However, especially the classifierstrained with examples of soft exudates give high scores for the background spectra.Examples of the classifier scores are given in Figures 4.2, 4.3 and 4.3.
The inter-expert variation in the annotations was evaluated by considering, in turn,one set of annotations as ground truth and evaluating the performance (measured assensitivity and specificity) of the remaining set of annotations. The mean results of the

118 4. Medical applications of spectral fundus data
inter-expert evaluation over all annotations are presented in Table 4.2.
Table 4.2: Mean and standard deviation (in parentheses) inter-expert agreement.
Exudates Soft exudate Hard exudate HaemorrhageAnnotator 1
Sensitivity 0.4038 (0.3688) 0.5653 (0.4778) 0.3121 (0.3672) 0.4220 (0.3714)Specificity 1.0000 (0.0000) 1.0000 (0.0001) 1.0000 (0.0000) 1.0000 (0.0001)
Annotator 2Sensitivity 0.8757 (0.3232) 0.5691 (0.5324) 0.9711 (0.0744) 0.8637 (0.3378)Specificity 0.9997 (0.0017) 0.9998 (0.0010) 0.9999 (0.0004) 0.9997 (0.0009)
The ROC curves and the AUC for the different classifiers summarising the results areshown in Figure 4.5, Figure 4.7 and Figure 4.6, and Tables 4.3 and 4.4. It should benoted that due to the spatial coarseness of the ground truth, the pixels inside the lesionannotation but outside the representative region are not considered in the quantitativeevaluation. This will cause a positive bias to the classification results.
Likely due to the limited amount of training data compared to the dimensionality ofthe spectra, the GMM classifiers trained with the raw spectra consistently failed toproduce reasonable results (i.e., the construction of the GMM failed or the resultingGMM returned uniform class probabilities for the whole image). Therefore, the GMMresults are omitted. The SVM classifier trained with the RGB data exhibited similarbehaviour, explaining the linear shape of the ROC curve.
Table 4.3: Classifier performance with annotations from Annotator 1. Mean areaunder the curve (AUC) for support vector machine (SVM), random forest (RF)and neural network (NN) classifiers.
Exudates Soft exudate Hard exudate HaemorrhageSpectral data
SVM 0.8219 0.7721 0.8343 0.7924RF 0.8327 0.7543 0.8372 0.7892NN 0.8159 0.6396 0.8133 0.8096
RGB dataSVM 0.6286 0.4200 0.7250 0.5272RF 0.8118 0.7216 0.8263 0.7801NN 0.7879 0.6832 0.7790 0.7616
The inter-expert agreement between the annotators was relatively low. While the highspecificity of the annotations is explained in part by the ratio of background and fore-ground (i.e., the ratio of true negative (TN) and false positive (FP)), there was a signifi-cant difference in the sensitivity between the annotators. Annotator 2 generally markedmore area as containing lesions than Annotator 1. The annotators disagreed especiallyon the classification of soft exudates.
The classifiers trained with the spectral data showed similar performance. However,there was a significant difference between classifiers trained with data extracted from the

4.4 Experiments and results 119
Table 4.4: Classifier performance with annotations from Annotator 2. Mean areaunder the curve (AUC) for support vector machine (SVM), random forest (RF)and neural network (NN) classifiers.
Exudates Soft exudate Hard exudate HaemorrhageSpectral data
SVM 0.7836 0.5230 0.8178 0.7907RF 0.8103 0.6125 0.8213 0.7982NN 0.7965 0.7421 0.8143 0.8099
RGB dataSVM 0.5271 0.4214 0.5794 0.8055RF 0.8035 0.7167 0.8144 0.7979NN 0.7936 0.7221 0.8134 0.7996
(a) Soft exudate. (b) Hard exudate. (c) Haemorrhages.
Figure 4.2: Support vector machine (SVM) classifier scores for different lesions(trained with spectral data). Intensity value depicts the estimated likelihood ofthe pixel belonging to the lesion class.
annotations of Annotator 1 and Annotator 2. The classifiers provided best accuracy forhard exudates, while soft exudates were classified significantly more poorly.
Using the refined annotations did not significantly improve the performance of the NNand SVM classifiers using spectral data, but the performance of the classifiers trained withRGB data improved somewhat when using refined annotations (see Tables 4.5 and 4.6).Contrary to the coarse annotations, the SVM classifiers trained with RGB data usingthe refined annotations produced relatively good results. The results are visualised inFigures 4.8, 4.9 and 4.10 .
4.4.2 Histological parameter maps from spectral images
Quantitative evaluation of the histological parameter maps derived from image spectraby inverting the model is not possible as neither in vivo or in vitro measurement ofthe molecule concentrations in the target eye can be performed. Qualitative assessmentof the resulting parameter maps is also problematic to a degree. There is only some

120 4. Medical applications of spectral fundus data
Table 4.5: Classifier performance with annotations from Annotator 1. Mean areaunder the curve (AUC) for support vector machine (SVM), random forest (RF)and neural network (NN) classifiers using refined annotations.
Exudates Soft exudate Hard exudate HaemorrhageSpectral data
SVM 0.8140 0.7390 0.8358 0.8043RF 0.8279 0.7064 0.8373 0.7918NN 0.8213 0.7022 0.8266 0.7831
RGB dataSVM 0.7839 0.6774 0.8077 0.8133RF 0.8039 0.7151 0.7876 0.6877NN 0.7974 0.7161 0.8328 0.7974
Table 4.6: Classifier performance with annotations from Annotator 2. Mean areaunder the curve (AUC) for support vector machine (SVM), random forest (RF)and neural network (NN) classifiers using refined annotations.
Exudates Soft exudate Hard exudate HaemorrhageSpectral data
SVM 0.8203 0.5138 0.8165 0.7998RF 0.8060 0.6168 0.8148 0.8051NN 0.7966 0.8074 0.8159 0.8006
RGB dataSVM 0.7921 0.7190 0.5792 0.7821RF 0.8076 0.7207 0.8128 0.7890NN 0.8073 0.7313 0.8152 0.7795

4.4 Experiments and results 121
(a) Soft exudate. (b) Hard exudate. (c) Haemorrhages.
Figure 4.3: Neural network (NN) classifier scores for different lesions (trainedwith spectral data). Intensity value depicts the estimated likelihood of the pixelbelonging to the lesion class.
(a) Soft exudate. (b) Hard exudate. (c) Haemorrhages.
Figure 4.4: Random forest (RF) classifier scores for different lesions (trainedwith spectral data). Intensity value depicts the estimated likelihood of the pixelbelonging to the lesion class.
statistical knowledge of the retinal parameters, and for the choroidal parameters no priordistributions are available.
While the accuracy of the histological parameter maps is difficult to evaluate, someretinal structure provide reference for the evaluation. The significant majority of theretinal haemoglobin should be found in the retinal blood vessels. Furthermore, macularpigment should appear only in the macula, and the macula should show an increase in theamount of RPE melanin. These factors can be used to guide the qualitative evaluationof the derived parameter maps.
A set of parameter maps were derived from the image data of 7 spectral images usingk-nearest neighbour (kNN) to select the nearest quotient in the model for each imagequotient. The images were selected from DiaRetDB2 based on perceived health of theretina of the subject (the model is defined for healthy tissue) and image quality. The

122 4. Medical applications of spectral fundus data
(a) Haemorrhages. (b) Hard exudates.
(c) Soft exudates. (d) All exudates.
Figure 4.5: Support vector machine (SVM) classifier ROC curves.
number of suitable spectral images was limited by the fact that the majority of the sub-jects in DiaRetDB2 are diabetics. The maps were derived for the model after performingthe alignment described in Section 4.3.2.
For one of the images, the image foveal region data do not have the expected relationshipwith the rest of the image data. Figure 4.11 shows an example of a failed alignment dueto a strong illumination field bias affecting the image foveal region. Examples of thederived parameter maps are shown in Figures 4.12 and 4.13.
The illumination field bias present in the spectral images is assumed to affect the inversionresult. Straightforward channelwise correction of the illumination field bias drasticallychanges the shape of the point cloud of image data (see Figure 4.14), causing the align-ment approach to fail and the inversion to produce unrealistic parameter maps.
Applying the illumination correction approach proposed in Section 2.7 retains the shapeof the image data point cloud and parameter maps derived from the corrected data showimproved correspondence to the histological prior. The parameter maps derived from
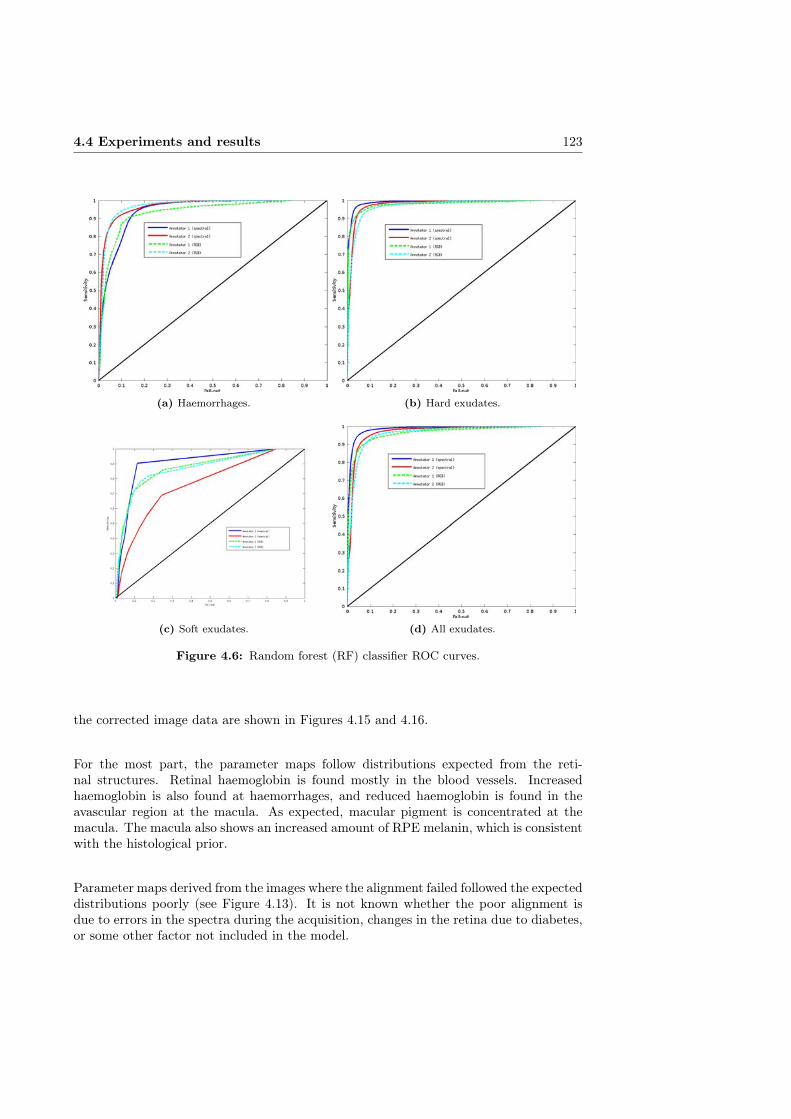
4.4 Experiments and results 123
(a) Haemorrhages. (b) Hard exudates.
(c) Soft exudates. (d) All exudates.
Figure 4.6: Random forest (RF) classifier ROC curves.
the corrected image data are shown in Figures 4.15 and 4.16.
For the most part, the parameter maps follow distributions expected from the reti-nal structures. Retinal haemoglobin is found mostly in the blood vessels. Increasedhaemoglobin is also found at haemorrhages, and reduced haemoglobin is found in theavascular region at the macula. As expected, macular pigment is concentrated at themacula. The macula also shows an increased amount of RPE melanin, which is consistentwith the histological prior.
Parameter maps derived from the images where the alignment failed followed the expecteddistributions poorly (see Figure 4.13). It is not known whether the poor alignment isdue to errors in the spectra during the acquisition, changes in the retina due to diabetes,or some other factor not included in the model.

124 4. Medical applications of spectral fundus data
(a) Haemorrhages. (b) Hard exudates.
(c) Soft exudates. (d) All exudates.
Figure 4.7: Neural network (NN) classifier ROC curves.
4.5 Discussion
Even with the direct use of unprocessed image spectra as training data, the performanceof the classifiers in the detection of retinal lesions was promising, especially for hardexudates. The lesion detection performance could likely be improved significantly byadding heuristics, optimising the acquisition wavelengths, normalising the inter-personvariance of the spectral data or applying dimensionality reduction.
A major challenge for the lesion detection method development is the lack of accurateground truth for the lesion locations. Annotation refinement can be an intermediate so-lution, but accurate annotations by medical experts would be required for proper methoddevelopment and evaluation. A possible approach would be to implement the annotationrefinement as a part of a semi-automatic annotation framework, where a medical expertwould verify and correct the results of the automatic refinement.
Based on the experiments on illumination correction, the uneven illumination fields in thechannel images can have a significant effect on the parameter map estimation. However,

4.5 Discussion 125
(a) Haemorrhages. (b) Hard exudates.
(c) Soft exudates. (d) All exudates.
Figure 4.8: Support vector machine (SVM) classifier ROC curves (refined an-notations).
the loss in the visual quality of an image due to moderate uneven illumination fieldsmay not be very significant. Especially if the quality of an acquired spectral image isestimated channel-wise (which is likely to be the case for systems requiring a separatealignment post-processing step), it can be difficult to avoid the channel-wise illuminationfield bias.
Channel-wise illumination correction is not a viable option as it can affect the consistencyof the spectra and consequently cause significant error in the inversion. If the illuminationfield cannot be compensated for in the imaging phase, the performance of the illuminationcorrection method proposed in Section 2.7 suggests that using the retinal structures toguide the illumination field estimation is a viable approach to spectral retinal imageillumination correction.
The development of the model of light interaction with the retinal tissue and the inversionmethod would benefit from a dedicated data set of healthy subjects with emphasis on thequality and consistency of the image spectra. With fewer sources of error, the evaluation

126 4. Medical applications of spectral fundus data
(a) Haemorrhages. (b) Hard exudates.
(c) Soft exudates. (d) All exudates.
Figure 4.9: Random forest (RF) classifier ROC curves (refined annotations).
of the effects of changes in the model or inversion would be facilitated.
In addition to more suitable data, a more sophisticated inversion method can potentiallyprovide significant improvement to the parameter map estimation. The kNN algorithmis simple, relatively fast, and guarantees the inversion result from the set of simulatedmodel parameters (instead of, e.g., interpolated parameter values). However, kNN has anumber of drawbacks. The nearest neighbour depends on the choice of distance measure,and while Euclidean distance is sufficient for many applications, it may give sub-optimalresults on the high-dimensional and non-linear model. The implementation of a morerefined inversion method would likely provide more accurate parameter maps.
4.6 Summary
The spectral fundus image data can directly be used for both training and testing ofsupervised classifiers for the detection of lesions related to retinal pathologies. Using

4.6 Summary 127
(a) Haemorrhages. (b) Hard exudates.
(c) Soft exudates. (d) All exudates.
Figure 4.10: Neural network (NN) classifier ROC curves (refined annotations).
the DiaRetDB2 database with coarse expert annotations for training and testing, theperformance of several supervised classifiers in the detection of lesions was evaluated.Of the exudates, the soft exudate class was more often misclassified. Excluding softexudates, the classifiers trained with the unprocessed image spectra outperformed theclassifiers trained with RGB features.
Another set of classifiers was trained using spectra and RGB values extracted from theROI defined by the expert annotations after refinement using the method proposed inSection 3.5. Using training data extracted from the refined regions did not improvethe performance of the classifiers using spectral data. For the RGB data, however, asignificant increase the performance of the SVM classifier and a slight improvement inthe NN classifier performance was observed.
An approach to the estimation of the molecular concentrations of retinal haemoglobin,RPE melanin, choroidal melanin, macular pigment and choroidal haemoglobin from theimage spectra using a model of light interaction with retinal tissue was presented. Thepresented approach to aligning the model and image data was able to find reasonable
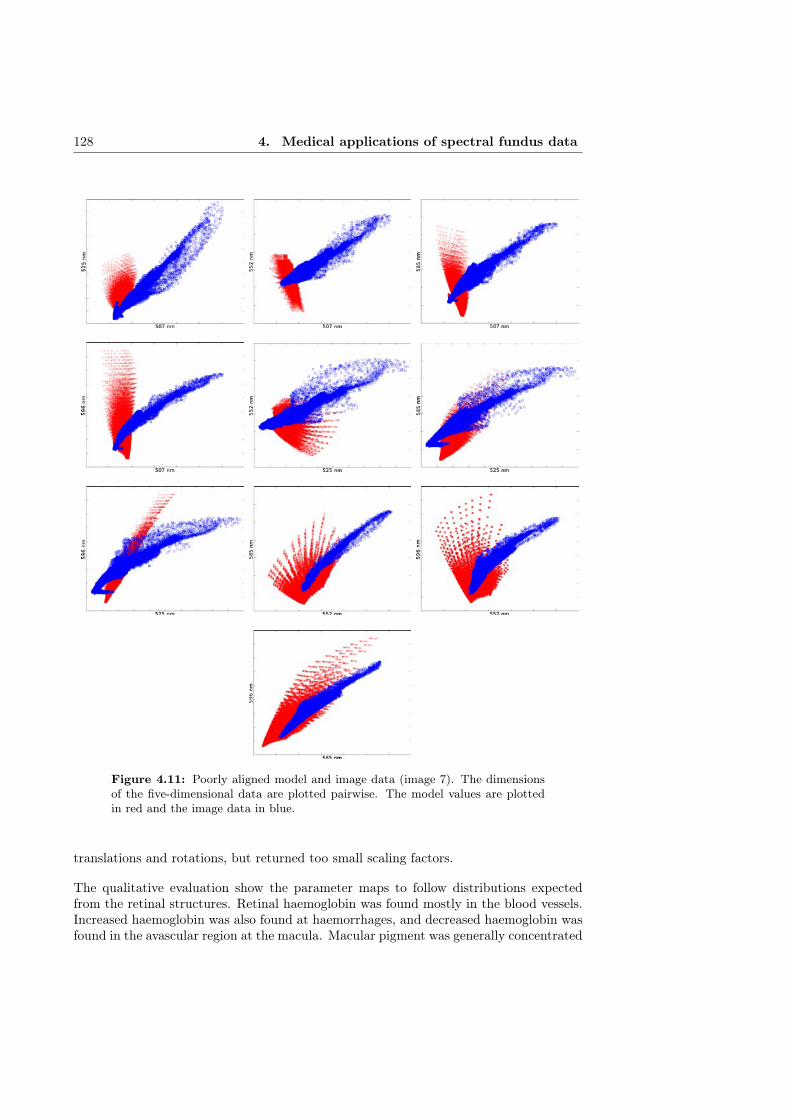
128 4. Medical applications of spectral fundus data
Figure 4.11: Poorly aligned model and image data (image 7). The dimensionsof the five-dimensional data are plotted pairwise. The model values are plottedin red and the image data in blue.
translations and rotations, but returned too small scaling factors.
The qualitative evaluation show the parameter maps to follow distributions expectedfrom the retinal structures. Retinal haemoglobin was found mostly in the blood vessels.Increased haemoglobin was also found at haemorrhages, and decreased haemoglobin wasfound in the avascular region at the macula. Macular pigment was generally concentrated
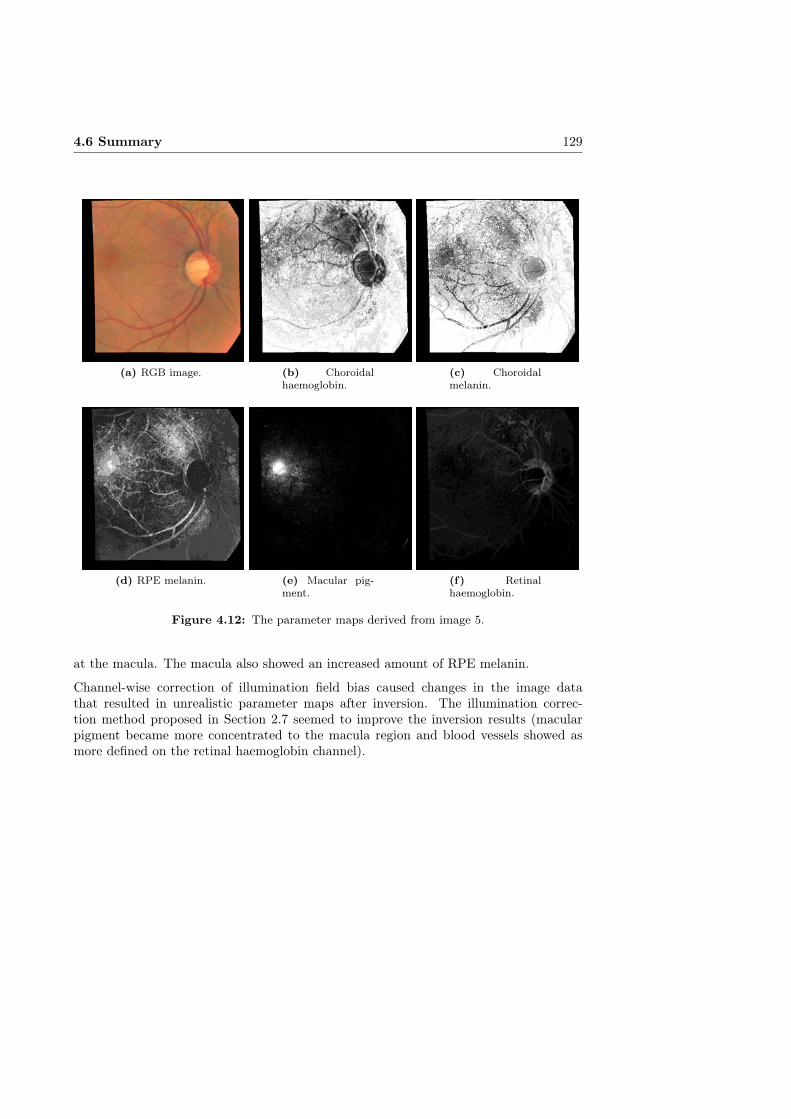
4.6 Summary 129
(a) RGB image. (b) Choroidalhaemoglobin.
(c) Choroidalmelanin.
(d) RPE melanin. (e) Macular pig-ment.
(f) Retinalhaemoglobin.
Figure 4.12: The parameter maps derived from image 5.
at the macula. The macula also showed an increased amount of RPE melanin.
Channel-wise correction of illumination field bias caused changes in the image datathat resulted in unrealistic parameter maps after inversion. The illumination correc-tion method proposed in Section 2.7 seemed to improve the inversion results (macularpigment became more concentrated to the macula region and blood vessels showed asmore defined on the retinal haemoglobin channel).
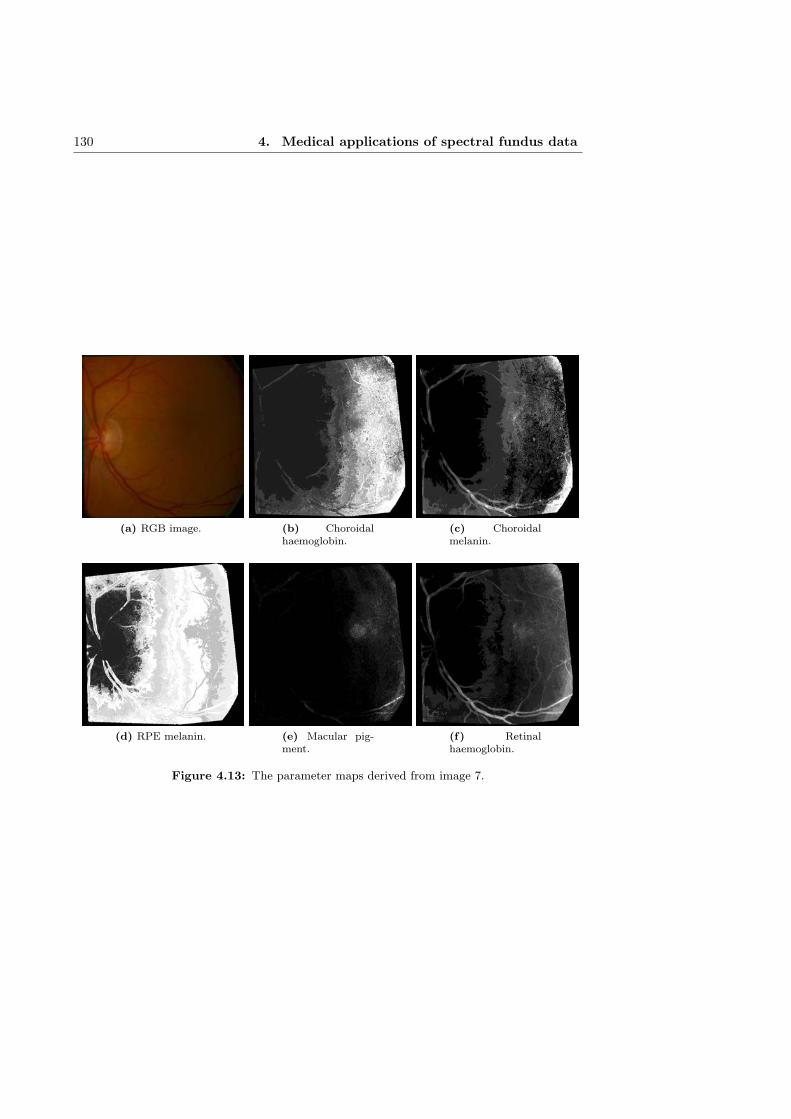
130 4. Medical applications of spectral fundus data
(a) RGB image. (b) Choroidalhaemoglobin.
(c) Choroidalmelanin.
(d) RPE melanin. (e) Macular pig-ment.
(f) Retinalhaemoglobin.
Figure 4.13: The parameter maps derived from image 7.

4.6 Summary 131
Figure 4.14: Aligned model and image data after channel-wise illumination fieldcorrection (image 5). The dimensions of the five-dimensional data are plottedpairwise. The model values are plotted in red and the image data in blue.
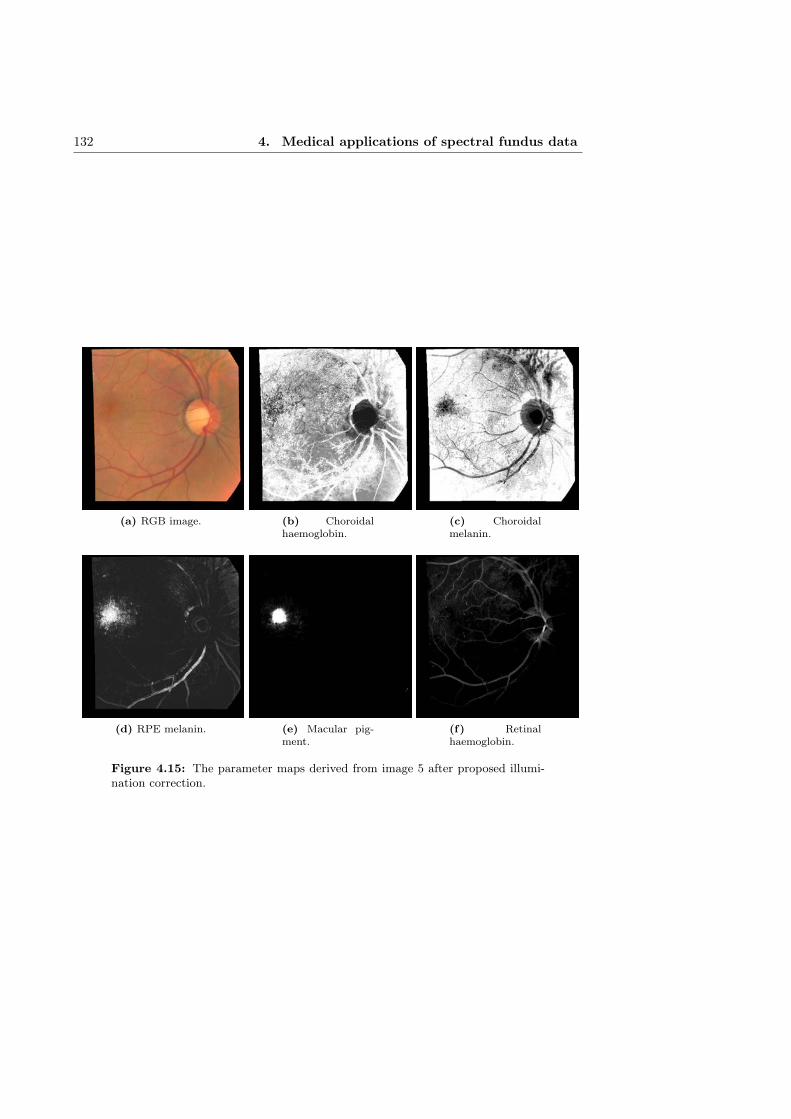
132 4. Medical applications of spectral fundus data
(a) RGB image. (b) Choroidalhaemoglobin.
(c) Choroidalmelanin.
(d) RPE melanin. (e) Macular pig-ment.
(f) Retinalhaemoglobin.
Figure 4.15: The parameter maps derived from image 5 after proposed illumi-nation correction.
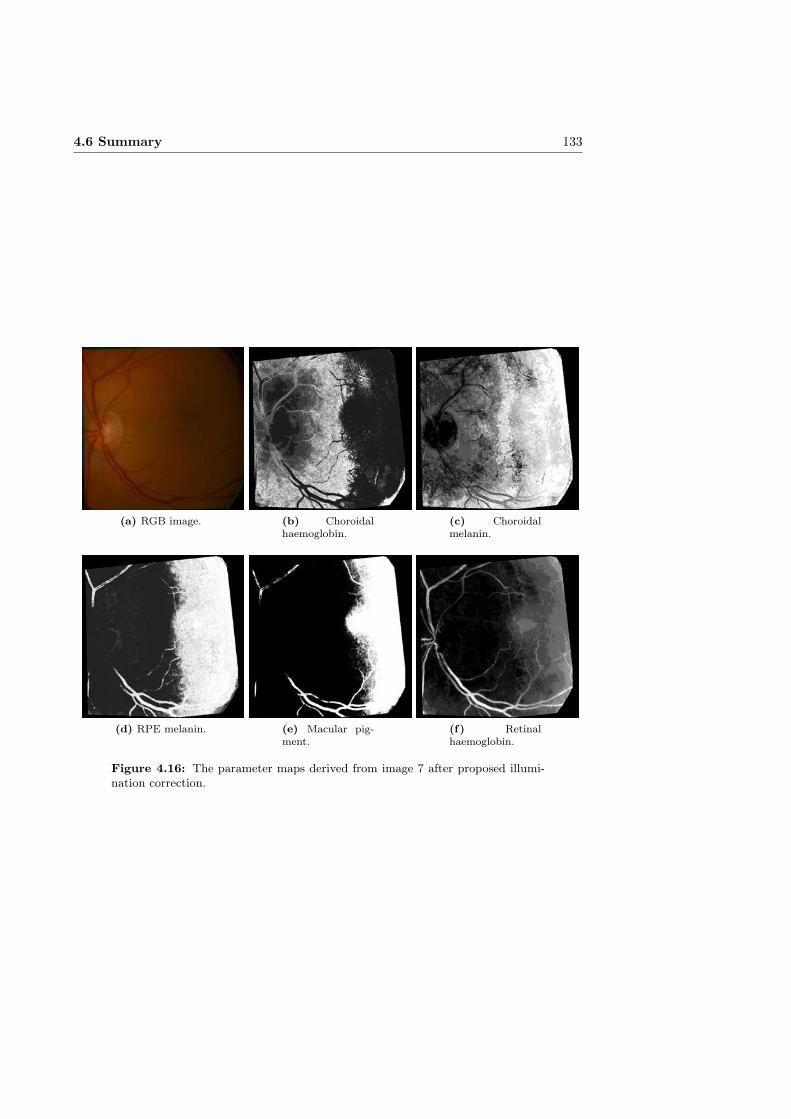
4.6 Summary 133
(a) RGB image. (b) Choroidalhaemoglobin.
(c) Choroidalmelanin.
(d) RPE melanin. (e) Macular pig-ment.
(f) Retinalhaemoglobin.
Figure 4.16: The parameter maps derived from image 7 after proposed illumi-nation correction.

Chapter V
Discussion
5.1 Main contributions
The methods for and considerations on composing and the post-processing of spectralretinal images presented in this thesis can potentially provide significant improvementsto the quality of spectral retinal image data. The geometric and spectral calibration,correcting of uneven illumination and accounting for dirt and dust in the optics can helpto remove multiple sources of errors in spectral retinal images, longitudinal data anddata combined from multiple sources.
With further development and evaluation, the maps of estimated molecular concentra-tions of retinal haemoglobin, RPE melanin, choroidal melanin, macular pigment andchoroidal haemoglobin from the image spectra may provide a useful modality for the earlydetection of changes in the retina or the formation of lesions. The 3D-reconstruction ofthe retinal shape from retinal images can be used to improve both the spectral imagecomposition and the model of light interaction in the retina (by using the estimated reti-nal shape instead of uniform layers). If evaluations with medical data suggest reasonableaccuracy, the reconstructions can have clinical value in the diagnosis of macular edema,glaucoma and other retinal conditions.
A supervised classifier trained with the unprocessed image spectra produced reasonabledetection results for haemorrhages and hard exudates. The performance of the classifierssuggests that a lesion detection method outperforming current state-of-the-art methodbased on RGB data could be developed using the spectral data. With the publication ofspectral retinal image database DiaRetDB2 with gold standard annotations, the develop-ment of methods relying on spectral retinal data becomes more viable, as every researchgroup does not need to collect their own spectral retinal images and expert annotationsfor the development, training and evaluation.
With the ageing population and changed living habits, retinal diseases such as diabeticretinopathy (DR) and age-related macular degeneration (AMD) will increasingly burdenthe health care systems of the developed countries. Early detection and personalised
134
5.2 Limitations of the study 135
diagnostics directing the limited resources to the patients in most need of and most ben-efiting from the therapeutic interventions will be paramount in the proper managementof these diseases.
Broadening the utilisation of spectral information could improve automatic and semi-automated diagnostics for large scale screening of retinal diseases and enable an earlyentry to a treatment program. With the improvement in the quality of the spectral data,and the development of image analysis methods based on retinal reflectance spectra,there is a potential for the improvement of the quantitative detection of retinal changesfor follow-up, clinically relevant end-points for clinical studies and development of newtherapeutic modalities.
5.2 Limitations of the study
One of the major challenges in developing and comparing methods for composing andprocessing spectral fundus images is the difficulty of obtaining meaningful reference mea-surements. Without a proper reference, method development becomes difficult as the per-formance of a method cannot be properly evaluated or compared to other approaches.In vitro measurements do not properly capture the characteristics of a living eye, andwhile techniques such as OCT and spectroscopy can be used to accurately measure theretinal structures and reflectance in vivo, the alignment and comparison with the fundusimage spectra is challenging.
The alignment of the retinal image data and the model of light interaction in tissueremains challenging. While the foveal region data of both the model and the images pro-duce similar distributions, the exact range of the parameter values that can be expectedto be present in the macular region of the image is not known.
After the alignment, a number of images showed a significant portion of the data outsidethe model. Some of the data outside the model is due to retinal structures that arenot included in the model, e.g., the optic disk. Another potential source for disparity ispathological changes in the retina. Problems with the image acquisition and illuminationfield bias can also affect the image data. Further studies are needed to determine thesource (or sources) of the disparities between the model and the image data.
5.3 Future work
While the GDB-ICP registration method showed good performance on the syntheticand semisynthetic test data, the composition of a spectral retinal image from a set ofchannel images remains a challenging problem. A method designed specifically for theregistration of spectral retinal data would likely be required for improved alignment. Asgeneral registration methods do not take into account the change in information contentbetween the channels, the space of transformations realistic to correct for the inter-channel eye movements, and the potentially large number of images to be registered,there is room for improvement in the registration of channel images.
The use of synthetic data can provide quantitative measurements on an approximationof the in vivo measurements. While complete correspondence to measurements from the

136 5. Discussion
true medical data should not be expected, results from quantitative evaluation usingsynthetic data can be more representative than comparisons derived from measurementsfrom other modalities (e.g., sparse spectroscopy measurements or mean values basedon patient information). With a sufficiently accurate synthetic data as a reference, thedevelopment and evaluation of the composition and processing of spectral fundus imageswould be significantly facilitated. A commonly accepted synthetic benchmark wouldenable proper comparison of methods by different researchers.
The stereoscopic reconstruction of the fundus can be improved by considering the spec-tral dimension of the data. As the depth of tissue penetration is dependent on thewavelength of the light entering the fundus, the information content of the individualchannels represents the structures at different levels of the fundus. Taking into accountthe possible light paths in the retinal interaction would very likely benefit the recon-struction. In theory, prior knowledge (e.g., from simulation) of the expected penetrationdepth could be used to refine the reconstruction. With proper characterisation of boththe reflectance spectra and the retinal tissue, possibly even (a number of) the individuallayers of the retina could be reconstructed. A reconstruction containing both spatialand spectral information of the retina open the possibility of a subject specific opticalmodel of the retina. Furthermore, replacing the very simplified pinhole camera modelused by the current reconstruction approach with a more sophisticated model based onthe fundus camera could significantly improve the reconstruction result.
While no histological ground truth for the distributions of the molecules in the retinacan be achieved, prior knowledge of average distributions could be used to guide thealignment of the model of light interaction with the retina with the spectral image data.In practice this could be implemented by iterating the transformation parameters aligningthe model and the image data, and computing a cost function based on the averagedistributions versus the inversion result. In addition, more sophisticated methods thankNN can be used for more reasonable inversion. As no histological ground truth isavailable for performance evaluation, the quantification of error in the intermediate steps(e.g., model generation, model alignment and inversion) becomes important in evaluatingthe uncertainty of the results. By estimating the error within the inversion process(e.g., by distance between image spectra and closest model reference spectra), someunderstanding of the uncertainty of the inversion process can be achieved.

Chapter VI
Conclusion
In this thesis, the image processing techniques required for composing spectral retinalimages with accurate reflection spectra were studied. A protocol for calibrating a funduscamera was presented, including geometric and spectral calibration, determining thespatial resolution, consideration for correcting uneven illumination and vignetting, andaccounting for dirt and dust in the optics. The qualitative evaluation results suggestthat significant improvements can be achieved related to the quality of spectral retinalimages, longitudinal data and data from multiple sources.
The wavelength channel image registration was quantitatively evaluated using syntheticand semisynthetic data. Of the compared methods, GDB-ICP outperformed the rest.The experiments on synthetic and semi-synthetic data showed that the registration errorincreases with increasing wavelength difference between the floating and base image.GDB-ICP outperformed the other evaluated methods in both the number of successfulregistrations and registration accuracy.
A method for the 3D-reconstruction of the retinal shape from retinal images based on themethod by Lin and Medioni [139] was presented. The proposed method achieved lowermean registration error than the original method, and was able to produce a reasonablereconstruction where the original method failed.
A method for correcting the uneven illumination field in spectral images was presented.The method was able to reduce the illumination field bias in the spectral image whileretaining the consistency of the spectral dimension.
The steps in the acquisition of images and gold standards of lesion locations for composingthe spectral fundus image database DiaRetDB2 were presented. The spectral informationcoupled with gold standards for multiple lesion types provide a good basis for methoddevelopment in automatic detection and classification of retinal lesions.
The feasibility of the spectral retinal image data for the detection of lesions relatedto retinal pathologies was studied using supervised classifiers trained with the spectraldata. Of the exudates, the soft exudate class was more often misclassified. While some of
137

138 6. Conclusion
the classifiers struggled with the high dimensionality of the spectral data, the classifierstrained with the unprocessed image spectra outperformed the classifiers trained withRGB features.
An approach to the estimation of the molecular concentrations of retinal haemoglobin,RPE melanin, choroidal melanin, macular pigment and choroidal haemoglobin from theimage spectra using a model of light interaction with retinal tissue was presented. Thedensity maps for retinal haemoglobin and macular pigment extracted from the imagespectra correspond to the histological prior (i.e., haemoglobin in the veins and a concen-tration of macular pigment in the macula).
The methods and experimental results presented in this thesis suggest that spectralretinal images can be a cost-effective and valuable addition to the diagnosis and screeningof eye diseases. The acquisition of accurate retinal spectra remains challenging, but withthe presented methods and further development of spectral imaging and spectral imageprocessing, the spectral retinal data can be significantly improved.

Bibliography
[1] Abràmoff, M., Garvin, M., and Sonka, M. Retinal imaging and image anal-ysis. IEEE Reviews in Biomedical Engineering 3 (2010), 169–208.
[2] Acharya, R., Chua, C., Ng, E., Yu, W., and Chee, C. Application ofhigher order spectra for the identification of diabetes retinopathy stages. Journalof Medical Systems 32, 6 (2008), 481–488.
[3] Acharya, U., Dua, S., Du, X., Sree, S., and Chua, C. Automated diagnosisof glaucoma using texture and higher order spectra features. IEEE Transactionson Information Technology in Biomedicine 15, 3 (2011), 449–455.
[4] Acharya, U., Ng, E.-K., Tan, J.-H., Sree, S., and Ng, K.-H. An integratedindex for the identification of diabetic retinopathy stages using texture parameters.Journal of Medical Systems 36, 3 (2012), 2011–2020.
[5] Ahonen, T., Matas, J., He, C., and Pietikäinen, M. Rotation invariantimage description with local binary pattern histogram fourier features. In ImageAnalysis. Springer, 2009, pp. 61–70.
[6] Aibinu, A., Iqbal, M., Nilsson, M., and Salami, M. A new method ofcorrecting uneven illumination problem in fundus images. In Proceedings of In-ternational Conference on Robotics, Vision, Information, and Signal Processing(Penang, Malaysia, November 2007), pp. 445–449.
[7] Al-Diri, B., Hunter, A., Steel, D., Habib, M., Hudaib, T., and Berry,S. Review-a reference data set for retinal vessel profiles. In Proceedings of In-ternational Conference of the IEEE Engineering in Medicine and Biology Society(Vancouver, Canada, August 2008), IEEE, pp. 2262–2265.
[8] Alahi, A., Ortiz, R., and Vandergheynst, P. Freak: Fast retina keypoint. InProceedings of Computer Vision and Pattern Recognition (2012), IEEE, pp. 510–517.
[9] Alm, A., and Bill, A. Ocular and optic nerve blood flow at normal and increasedintraocular pressures in monkeys (macaca irus): a study with radioactively labelledmicrospheres including flow determinations in brain and some other tissues. Ex-perimental Eye Research 15, 1 (1973), 15–29.
139
140 BIBLIOGRAPHY
[10] Anderson, R., and Parrish, J. The optics of human skin. Journal of Inves-tigative Dermatology 77, 1 (1981), 13–19.
[11] Aquino, A., Gegúndez-Arias, M., and Marin, D. Detecting the optic discboundary in digital fundus images using morphological, edge detection, and featureextraction techniques. IEEE Transactions on Medical Imaging 29, 11 (2010), 1860–1869.
[12] Association, W. M. World medical association declaration of helsinki. ethicalprinciples for medical research involving human subjects. Bulletin of the WorldHealth Organization 79, 4 (2001), 373.
[13] Balci, S., Golland, P., and Wells, W. Non-rigid groupwise registration usingb-spline deformation model. Open Source and Open Data for MICCAI (2007), 105–121.
[14] Bankman, I. Handbook of Medical Image Processing and Analysis, second ed.Academic Press, 2009.
[15] Bashkatov, A., Genina, E., Kochubey, V., and Tuchin, V. Estimation ofwavelength dependence of refractive index of collagen fibers of scleral tissue. InProceedings of EOS/SPIE European Biomedical Optics Week (2000), InternationalSociety for Optics and Photonics, pp. 265–268.
[16] Bay, H., Ess, A., Tuytelaars, T., and Gool, L. V. Speeded-up robustfeatures (surf). Computer Vision and Image Understanding 110, 3 (2008), 346–359.
[17] Beach, J., Schwenzer, K., Srinivas, S., Kim, D., and Tiedeman, J. Oxime-try of retinal vessels by dual-wavelength imaging: calibration and influence of pig-mentation. Journal of Applied Physiology 86, 2 (1999), 748–758.
[18] Beach, J., Tiedeman, J., Hopkins, M., and Sabharwal, Y. Multispectralfundus imaging for early detection of diabetic retinopathy. In Proceedings of In-ternational Biomedical Optics Symposium (1999), International Society for Opticsand Photonics, pp. 114–121.
[19] Berendschot, T., DeLint, P., and van Norren, D. Fundus re-flectanceâĂŤhistorical and present ideas. Progress in Retinal and Eye Research22, 2 (2003), 171–200.
[20] Berendschot, T., and van Norren, D. Objective determination of the mac-ular pigment optical density using fundus reflectance spectroscopy. Archives ofBiochemistry and Biophysics 430, 2 (2004), 149–155.
[21] Berendschot, T., Willemse-Assink, J., Bastiaanse, M., Jong, P. D., andvan Norren, D. Macular pigment and melanin in age-related maculopathy in ageneral population. Investigative Ophthalmology and Visual Science 43, 6 (2002),1928–1932.
BIBLIOGRAPHY 141
[22] Berendschot, T. T. J. M., DeLint, P. J., and van Norren, D. Fundusreflectance – historical and present ideas. Progress in Retinal and Eye Research 22(2003).
[23] Bernardes, R., Serranho, P., and Lobo, C. Digital ocular fundus imaging:a review. Ophthalmologica 226, 4 (2011), 161–181.
[24] Bezdek, J. Pattern Recognition with Fuzzy Objective Function Algorithms.Plenum Press, 1981.
[25] Bhatia, K., Aljabar, P., Boardman, J., Srinivasan, L., Murgasova, M.,Counsell, S., Rutherford, M., Hajnal, J., Edwards, A., and Rueck-ert, D. Groupwise combined segmentation and registration for atlas construction.In Proceedings of Medical Image Computing and Computer-Assisted Intervention.Springer, 2007, pp. 532–540.
[26] Bhatia, K., Hajnal, J., Hammers, A., and Rueckert, D. Similarity metricsfor groupwise non-rigid registration. In Proceedings of Medical Image Computingand Computer-Assisted Intervention. Springer, 2007, pp. 544–552.
[27] Bock, R., Meier, J., Michelson, G., Nyúl, L., and Hornegger, J. Clas-sifying glaucoma with image-based features from fundus photographs. PatternRecognition (2007), 355–364.
[28] Boettner, E., and Wolter, J. Transmission of the ocular media. InvestigativeOphthalmology and Visual Science 1, 6 (1962), 776–783.
[29] Bone, R. A., Brener, B., and Gibert, J. C. Macular pigment, photopigments,and melanin: Distributions in young subjects determined by four-wavelength re-flectometry. Vision Reserch 47 (2007), 3259–3268.
[30] Bouguet, J.-Y. Camera calibration toolbox for matlab. http://www.vision.caltech.edu/bouguetj/calib_doc/, 2013. Accessed: 2015-01-07.
[31] Boykov, Y., Veksler, O., and Zabih, R. Fast approximate energy mini-mization via graph cuts. IEEE Transactions on Pattern Analysis and MachineIntelligence 20, 12 (2001), 1222–1239.
[32] Breiman, L. Random forests. Machine Learning 45, 1 (2001), 5–32.
[33] Brown, D., Kaiser, P., Michels, M., Soubrane, G., Heier, J., Kim, R.,Sy, J., and Schneider, S. Ranibizumab versus verteporfin for neovascular age-related macular degeneration. New England Journal of Medicine 355, 14 (2006),1432–1444.
[34] Buades, A., Coll, B., and Morel, J.-M. A non-local algorithm for imagedenoising. In Proceedings of Computer Vision and Pattern Recognition (San Diego,California, USA, June 2005), vol. 2, IEEE, pp. 60–65.
[35] Budai, A., Odstrcilik, J., Kolar, R., Hornegger, J., Jan, J., Kubena,T., and Michelson, G. A public database for the evaluation of fundus imagesegmentation algorithms. Investigative Ophthalmology and Visual Science 52, 14(2011), 1345–1345.
142 BIBLIOGRAPHY
[36] Calcagni, A., Gibson, J. M., Styles, I. B., Claridge, E., and Orihuela-Espina, F. Multispectral retinal image analysis: a novel non-invasive tool forretinal imaging. Eye 25, 12 (2011).
[37] Chandraker, M., Agarwal, S., Kriegman, D., and Belongie, S. Globallyoptimal algorithms for stratified autocalibration. International Journal of Com-puter Vision 90, 2 (2010), 236–254.
[38] Chanwimaluang, T., Fan, G., Yen, G., and Fransen, S. 3-d retinal cur-vature estimation. IEEE Transactions on Information Technology in Biomedicine13, 6 (2009), 997–1005.
[39] Cheriyan, J., Menon, H., and Narayanankutty, K. 3d reconstruction ofhuman retina from fundus image–a survey. International Journal on Modern En-gineering Research 2 (2012), 3089–3092.
[40] Chiu, S. Fuzzy model identification based on cluster estimation. Journal of Intel-ligent and Fuzzy Systems 2, 3 (1994), 267–278.
[41] Choremis, J., and Chow, D. Use of telemedicine in screening for diabeticretinopathy. Canadian Journal of Ophthalmology 38, 7 (2003), 575–579.
[42] Choudhary, T., Ball, D., Fernandez-Ramos, J., McNaught, A., andHarvey, A. Assessment of acute mild hypoxia on retinal oxygen saturation usingsnapshot retinal oximetry. Investigative Ophthalmology and Visual Science 54, 12(2013), 7538–7543.
[43] Claridge, E. personal communication.
[44] Cohen, B., and Dinstein, I. New maximum likelihood motion estimationschemes for noisy ultrasound images. Pattern Recognition 35, 2 (2002), 455–463.
[45] Crum, W., Hartkens, T., and Hill, D. Non-rigid image registration: theoryand practice. The British Journal of Radiology 77 (2004), S140–S153.
[46] Deguchi, K., Kawamata, D., Mizutani, K., Hontani, H., and Wak-abayashi, K. 3d fundus shape reconstruction and display from stereo fundusimages. IEICE Transactions on Information and Systems 83, 7 (2000), 1408–1414.
[47] Deguchi, K., Noami, J., and Hontani, H. 3d fundus pattern reconstruction anddisplay from multiple fundus images. In Proceedings of International Conferenceon Pattern Recognition (2000), vol. 4, IEEE, pp. 94–97.
[48] Delori, F. Noninvasive technique for oximetry of blood in retinal vessels. AppliedOptics 27, 6 (1988), 1113–1125.
[49] Delori, F. Spectrophotometer for noninvasive measurement of intrinsic fluores-cence and reflectance of the ocular fundus. Applied Optics 33, 31 (1994), 7439–7452.
[50] Delori, F., and Burns, S. Fundus reflectance and the measurement of crystallinelens density. Journal of the Optical Society of America A 13, 2 (1996), 215–226.

BIBLIOGRAPHY 143
[51] Delori, F., and Pflibsen, K. Spectral reflectance of the human ocular fundus.Applied Optics 28, 6 (1989), 1061–1077.
[52] Duda, R., Hart, P., and Stork, D. Pattern Classification. John Wiley & Sons,2001.
[53] Duong, T. Magnetic resonance imaging of the retina: a brief historical and futureperspective. Saudi Journal of Ophthalmology 25, 2 (2011), 137–143.
[54] Everdell, N., Styles, I., Calcagni, A., Gibson, J., Hebden, J., and Clar-idge, E. Multispectral imaging of the ocular fundus using light emitting diodeillumination. Review of Scientific Instruments 81, 9 (2010), 093706.
[55] Fált, P., Hiltunen, J., Hauta-Kasari, M., Sorri, I., Kalesnykiene, V.,Pietilá, J., and Uusitalo, H. Spectral imaging of the human retina and compu-tationally determined optimal illuminants for diabetic retinopathy lesion detection.Journal of Imaging Science and Technology 55, 3 (2011), 030509–1–030509–10.
[56] Fält, P., Hiltunen, J., Hauta-Kasari, M., Sorri, I., Kalesnykiene, V.,and Uusitalo, H. Extending diabetic retinopathy imaging from color to spectra.In Proceedings of Scandinavian Conference on Image Analysis (Oslo, Norway, June2009), pp. 149–158.
[57] Fält, P., Yamaguchi, M., Murakami, Y., Laaksonen, L., Lensu, L., Clar-idge, E., Hauta-Kasari, M., and Uusitalo, H. Multichannel spectral imageenhancement for visualizing diabetic retinopathy lesions. In Image and Signal Pro-cessing. Springer, 2014, pp. 52–60.
[58] Faugeras, O., Luong, Q.-T., and Maybanks, S. Camera self-calibration:Theory and experiments. In Proceedings of European Conference on ComputerVision (Santa Margherita Ligure, Italy, May 1992), pp. 321–334.
[59] Faust, O., Acharya, R., Ng, E., Ng, K.-H., and Suri, J. Algorithms for theautomated detection of diabetic retinopathy using digital fundus images: a review.Journal of Medical Systems 36, 1 (2012), 145–147.
[60] Fawzi, A., Lee, N., Acton, J., Laine, A., and Smith, R. Recovery of macularpigment spectrum in vivo using hyperspectral image analysis. Journal of BiomedicalOptics 16, 10 (2011), 106008–106008.
[61] Ferrara, N., Damico, L., Shams, N., Lowman, H., and Kim, R. Develop-ment of ranibizumab, an anti–vascular endothelial growth factor antigen bindingfragment, as therapy for neovascular age-related macular degeneration. Retina 26,8 (2006), 859–870.
[62] Fischler, M., and Bolles, R. Random sample consensus: a paradigm for modelfitting with applications to image analysis and automated cartography. Communi-cations of the ACM 24, 6 (1981), 381–395.
[63] Foracchia, M., Grisan, E., and Ruggeri, A. Luminosity and contrast nor-malization in retinal images. Medical Image Analysis 9, 3 (2005), 179–190.

144 BIBLIOGRAPHY
[64] Fraz, M., Remagnino, P., Hoppe, A., Uyyanonvara, B., Rudnicka, A.,Owen, C., and Barman, S. Blood vessel segmentation methodologies in retinalimages âĂŞ a survey. Computer Methods and Programs in Biomedicine 108, 1(2012), 407–433.
[65] Frick, K., Gower, E., Kempen, J., and Wolff, J. Economic impact of visualimpairment and blindness in the united states. Archives of Ophthalmology 125, 4(2007), 544–550.
[66] Fumero, F., Alayón, S., Sanchez, J., Sigut, J., and Gonzalez-Hernandez, M. Rim-one: An open retinal image database for optic nerve eval-uation. In Proceedings of International Symposium on Computer-Based MedicalSystems (Porto, Portugal, June 2011), IEEE, pp. 1–6.
[67] Fusiello, A., Benedetti, A., Farenzena, M., and Busti, A. Globally con-vergent autocalibration using interval analysis. IEEE Transactions on PatternAnalysis and Machine Intelligence 26, 12 (2004), 1633–1638.
[68] F.W. Fitzke III, F. W. Refractive index of the human corneal epithelium andstroma. Journal of Refractive Surgery 11, 2 (1995), 100.
[69] Gao, L., Smith, R., and Tkaczyk, T. Snapshot hyperspectral retinal cam-era with the image mapping spectrometer (ims). Biomedical Optics Express 3, 1(January 2012), 48–54.
[70] García, M., López, M., Álvarez, D., and Hornero, R. Assessment of fourneural network based classifiers to automatically detect red lesions in retinal images.Medical Engineering and Physics 32, 10 (2010), 1085–1093.
[71] García, M., Sánchez, C., López, M., Abásolo, D., and Hornero, R.Neural network based detection of hard exudates in retinal images. ComputerMethods and Programs in Biomedicine 93, 1 (2009), 9–19.
[72] Gardner, G., Keating, D., Williamson, T., and Elliott, A. Automaticdetection of diabetic retinopathy using an artificial neural network: a screeningtool. The British Journal of Ophthalmology 80, 11 (1996), 940–944.
[73] Giancardo, L., Meriaudeau, F., Karnowski, T., Jr, K. T., Grisan, E.,Favaro, P., Ruggeri, A., and Chaum, E. Textureless macula swelling detectionwith multiple retinal fundus images. IEEE Transactions on Biomedical Engineering58, 3 (2011), 795–799.
[74] Giancardo, L., Meriaudeau, F., Karnowski, T., Li, Y., Garg, S., Tobin,K., and Chaum, E. Exudate-based diabetic macular edema detection in fundusimages using publicly available datasets. Medical Image Analysis 16, 1 (2012),216–226.
[75] Gonzalez, R., and Woods, R. Digital image processing, second ed. Prentice-Hall Inc., 2001.
BIBLIOGRAPHY 145
[76] Grisan, E., Giani, A., Ceseracciu, E., and Ruggeri, A. Model-based illu-mination correction in retinal images. In Proceedings of IEEE International Sym-posium on Biomedical Imaging: From Nano to Macro (2006), IEEE, pp. 984–987.
[77] Group, D. R. S. R. Photocoagulation treatment of proliferative diabetic retinopa-thy: the second report of diabetic retinopathy study findings. Ophthalmology 85,1 (1978), 82–106.
[78] Group, E. D. P. R. Causes and prevalence of visual impairment among adultsin the united states. Archives of Ophthalmology 122, 4 (2004), 477–485.
[79] Group, E. T. D. R. S. R. Treatment techniques and clinical guidelines forphotocoagulation of diabetic macular edema: Early treatment diabetic retinopathystudy report number 2. Ophthalmology 94, 7 (1987), 761–774.
[80] Guo, J.-M., Liu, Y.-F., Chang, C.-H., and Nguyen, H.-S. Improved handtracking system. IEEE Transactions on Circuits and Systems for Video Technology22, 5 (2012), 693–701.
[81] Guo, Y., Yao, G., Lei, B., and Tan, J. Monte carlo model for studying theeffects of melanin concentrations on retina light absorption. Journal of the OpticalSociety of America A 25, 2 (2008), 304–311.
[82] Hamm, J., Ye, D., Verma, R., and Davatzikos, C. Gram: A frameworkfor geodesic registration on anatomical manifolds. Medical Image Analysis 14, 5(2010), 633–642.
[83] Hammer, M., Roggan, A., Schweitzer, D., and Muller, G. Optical prop-erties of ocular fundus tissues-an in vitro study using the double-integrating-spheretechnique and inverse monte carlo simulation. Physics in Medicine and Biology 40,6 (1995), 963.
[84] Hammer, M., and Schweitzer, D. Quantitative reflection spectroscopy at thehuman ocular fundus. Physics in Medicine and Biology 47, 2 (2002), 179–191.
[85] Hammer, M., Schweitzer, D., Thamm, E., and Kolb, A. Optical proper-ties of ocular fundus tissues determined by optical coherence tomography. OpticsCommunications 186, 1 (2000), 149–153.
[86] Haralick, R., Shanmugam, K., and Dinstein, I. Textural features for imageclassification. IEEE Transactions on Systems, Man, and Cybernetics, 6 (1973),610–621.
[87] Hardarson, S., Harris, A., Karlsson, R., Halldorsson, G., Kage-mann, L., Rechtman, E., Zoega, G., Eysteinsson, T., Benediktsson, J.,Thorsteinsson, A., Thorsteinsson, A., Jensen, P., Beach, J., and Ste-fánsson, E. Automatic retinal oximetry. Investigative Ophthalmology and VisualScience 47, 11 (2006), 5011–5016.
[88] Harvey, A., Fletcher-Holmes, D., Gorman, A., Altenbach, K., Arlt,J., and Read, N. Spectral imaging in a snapshot. In Proceedings of BiomedicalOptics (Changchun, China, August 2005), International Society for Optics andPhotonics, pp. 110–119.

146 BIBLIOGRAPHY
[89] Hasan, M., Jia, X., Robles-Kelly, A., Zhou, J., and Pickering, M. R.Multi-spectral remote sensing image registration via spatial relationship analysison sift keypoints. In Proceedings of IEEE International Geoscience and RemoteSensing Symposium (2010), IEEE, pp. 1011–1014.
[90] Hayreh, S. Segmental nature of the choroidal vasculature. British Journal ofOphthalmology 59, 11 (1975), 631–648.
[91] Heikkiä, J., and Silvén, O. A four-step camera calibration procedure with im-plicit image correction. In Proceedings of Computer Vision and Pattern Recognition(San Juan, Puerto Rico, June 1997), pp. 1106–1112.
[92] Hemminki, V., Kähönen, M., Tuomisto, M. T., Turjanmaa, V., and Uusi-talo, H. Determination of retinal blood vessel diameters and arteriovenous ratiosin systemic hypertension: Comparison of different calculation formulae. Graefe’sArchive for Clinical and Experimental Ophthalmology 245, 1 (2007), 8–17.
[93] Hill, D., Batchelor, P., Holden, M., and Hawkes, D. Medical imageregistration. Physics in Medicine and Biology 46, 3 (2001), R1.
[94] Hipwell, J., Strachan, F., Olson, J., McHardy, K., Sharp, P., andForrester, J. Automated detection of microaneurysms in digital red-free pho-tographs: a diabetic retinopathy screening tool. Diabetic Medicine 17 (2000),588–594.
[95] Hirohara, Y., Okawa, Y., Mihashi, T., Yamaguchi, T., Nakazawa, N.,Tsuruga, Y., Aoki, H., Maeda, N., Uchida, I., and Fujikado, T. Validityof retinal oxygen saturation analysis: Hyperspectral imaging in visible wavelengthwith fundus camera and liquid crystal wavelength tunable filter. Optical Review14, 3 (2007), 151–158.
[96] Hoover, A., and Goldbaum, M. Locating the optic nerve in a retinal imageusing the fuzzy convergence of the blood vessels. IEEE Transactions on MedicalImaging 22, 8 (2003), 951–958.
[97] Hoover, A., Kouznetsova, V., and Goldbaum, M. Locating blood vessels inretinal images by piecewise threshold probing of a matched filter response. IEEETransactions on Medical Imaging 19, 3 (2000), 203–210.
[98] Horecker, B. The absorption spectra of hemoglobin and its derivatives in thevisible and near infra-red regions. Journal of Biological Chemistry 148, 1 (1943),173–183.
[99] Huang, D., Kaiser, P., Lowder, C., and Traboulsi, E. Retinal imaging,first ed. Elsevier Inc., 2006.
[100] Hunold, W., and Malessa, P. Spectrophotometric determination of themelanin pigmentation of the human ocular fundus in vivo. Ophthalmic Research 6,5-6 (1974), 355–362.
[101] Hunt, R. The Reproduction of Colour, sixth ed. John Wiley & Sons, 2008.

BIBLIOGRAPHY 147
[102] Jafaar, H., Nandi, A., and Al-Nuaimy, W. Detection of exudates in retinalimages using pure splitting technique. In Proceedings of International Conference ofthe IEEE Engineering in Medicine and Biology Society (Buenos Aires, Argentina,August 2010), pp. 6745–6748.
[103] Jannin, P., Krupinski, E., and Warfield, S. Validation in medical imageprocessing. IEEE Transactions on Medical Imaging 25, 11 (2006), 1405–1409.
[104] Javitt, J., Canner, J., and Sommer, A. Cost effectiveness of current ap-proaches to the control of retinopathy in type i diabetics. Ophthalmology 96, 2(1989), 255–264.
[105] Jia, H., Wu, G., Wang, Q., and Shen, D. Absorb: Atlas building by self-organized registration and bundling. NeuroImage 51, 3 (2010), 1057–1070.
[106] Johnson, W., Wilson, D., Fink, W., Humayun, M., and Bearman, G.Snapshot hyperspectral imaging in ophthalmology. Journal of Biomedical Optics12, 1 (2007), 014036–014036.
[107] Johnson, W. R., Wilson, D. W., Fink, W., Humayun, M., and Bearman,G. Snapshot hyperspectral imaging in ophthalmology. Journal Biomedical Optics12, 1 (2007), 014036.
[108] Joshi, S., Davis, B., Jomier, M., and Gerig, G. Unbiased diffeomorphic atlasconstruction for computational anatomy. NeuroImage 23 (2004), S151–S160.
[109] Kahn, H., and Hiller, R. Blindness caused by diabetic retinopathy. AmericanJournal of Ophthalmology 78, 1 (1974), 58–67.
[110] Kakumanu, P., Makrogiannis, S., and Bourbakis, N. A survey of skin-colormodeling and detection methods. Pattern Recognition 40, 3 (2007), 1106–1122.
[111] Kämäräinen, J. Mvprmatlab. http://www.optovue.com/ifusion://bitbucket.org/kamarain/mvprmatlab, 2015. Accessed: 2016-02-23.
[112] Kande, G., Subbaiah, V., and Savithri, S. Segmentation of exudates andoptic disc in retinal images. In Indian Conference on Computer Vision, Graphicsand Image Processing (Bhubaneswar, India, December 2008), pp. 535–542.
[113] Kang, S., and Weiss, R. Can we calibrate a camera using an image of a flat, tex-tureless lambertian surface? In Proceedings of European Conference on ComputerVision. Springer, 2000, pp. 640–653.
[114] Kankanahalli, S., Burlina, P., Wolfson, Y., Freund, D., and Bressler,N. Automated classification of severity of age-related macular degeneration fromfundus photographs. Investigative Ophthalmology and Visual Science 54, 3 (2013),1789–1796.
[115] Kauppi, T. Eye Fundus Image Analysis for Automatic Detection of DiabeticRetinopathy. PhD thesis, Lappeenranta University of Technology, 2010.

148 BIBLIOGRAPHY
[116] Kauppi, T., Kalesnykiene, V., Kämäräinen, J.-K., Lensu, L., Sorri, I.,Raninen, A., Voutilainen, R., Uusitalo, H., Kälviäinen, H., and Pietilä,J. The diaretdb1 diabetic retinopathy database and evaluation protocol. In Pro-ceedings of British Machine Vision Conference (Warwick, UK, September 2007),pp. 15.1–15.10.
[117] Kauppi, T., Kämäräinen, J.-K., Lensu, L., Kalesnykiene, V., Sorri, I.,Uusitalo, H., and Kälviäinen, H. Constructing benchmark databases andprotocols for medical image analysis: Diabetic retinopathy. Computational andMathematical Methods in Medicine 2013 (2013), 1–15.
[118] Kaya, S., Weigert, G., Pemp, B., Sacu, S., Werkmeister, R., Dragosti-noff, N., Garhöfer, G., Schmidt-Erfurth, U., and Schmetterer, L.Comparison of macular pigment in patients with age-related macular degenera-tion and healthy control subjects–a study using spectral fundus reflectance. ActaOphthalmologica 90, 5 (2012), e399–e403.
[119] Keane, P., and Sadda, S. Retinal imaging in the twenty-first century: state ofthe art and future directions. Ophthalmology 121, 12 (2014), 2489–2500.
[120] Khoobehi, B., Beach, J. M., and Kawano, H. Hyperspectral imaging for mea-surement of oxygen saturation in the optic nerve head. Investigative Ophthalmologyand Visual Science 45 (2004), 1464–1472.
[121] Kilbride, P., Alexander, K., Fishman, M., and Fishman, G. Human macu-lar pigment assessed by imaging fundus reflectometry. Vision Reserch 29, 6 (1989),663–674.
[122] Klein, J.-C., Menard, M., Cazuguel, G., Fernandez-Maloigne, C.,Schaefer, G., Gain, P., Cochener, B., Massin, P., Lay, B., and Char-ton, B. Methods to evaluate segmentation and indexing techniques in the fieldof retinal ophthalmology. http://messidor.crihan.fr/index-en.php. Accessed:2015-09-16.
[123] Knighton, R. Quantitative reflectometry of the ocular fundus. IEEE Engineeringin Medicine and Biology Magazine 14, 1 (1995), 43–51.
[124] Knighton, R., Jacobson, S., and Roman, M. Specular reflection from thesurface of the retina. In Proceedings of Optoelectronics and Laser Applications inScience and Engineering (Los Angeles, California, USA, January 1989), Interna-tional Society for Optics and Photonics, pp. 10–17.
[125] Kohner, E., Patel, V., and Rassam, S. Role of blood flow and impairedautoregulation in the pathogenesis of diabetic retinopathy. Diabetes 44, 6 (1995),603–607.
[126] Kolar, R., Odstrcilik, J., Jan, J., and Harabis, V. Illumination correctionand contrast equalization in colour fundus images. In Proceedings of EuropeanSignal Processing Conference (Barcelona, Spain, August 2011), IEEE, pp. 298–302.
BIBLIOGRAPHY 149
[127] Kubecka, L., Jan, J., and Kolar, R. Retrospective illumination correction ofretinal images. Journal of Biomedical Imaging 2010 (2010), 11.
[128] Laaksonen, L., Claridge, E., Fält, P., Hauta-Kasari, M., Uusitalo, H.,and Lensu, L. Comparison of image registration methods for composing spectralretinal images. Biomedical Signal Processing and Control . Submitted for review6.5.2016.
[129] Laaksonen, L., Claridge, E., Fält, P., Hauta-Kasari, M., Uusitalo, H.,and Lensu, L. Comparison of image registration methods for composing spectralretinal images. In Proceedings of International Workshop on Ophthalmic MedicalImage Analysis (Boston, Massachusetts, USA, September 2014), pp. 57–64.
[130] Laaksonen, L., Hannuksela, A., Claridge, E., Fält, P., Hauta-Kasari,M., Lensu, L., and Uusitalo, H. Significance and refinement of spatial accuracyof ground truth in the detection of retinal lesions. Computerized Medical Imagingand Graphics. Submitted for review 31.1.2016.
[131] Laaksonen, L., Herttuainen, J., Uusitalo, H., and Lensu, L. Refiningcoarse manual segmentations with stable probability regions. In Proceedings ofInternational Workshop on Ophthalmic Medical Image Analysis (Munich, Germany,October 2015).
[132] Labsphere. Labsphere: Spectralon targets. http://www.labsphere.com/products/reflectance-standards-and-targets/reflectance-targets/spectralon-targets.aspx. Accessed: 2015-01-10.
[133] Laliberté, F., Gagnon, L., and Sheng, Y. Registration and fusion of retinalimages - an evaluation study. IEEE Transactions on Medical Imaging 22, 5 (2003),661–673.
[134] Lam, B., and Yan, H. A novel vessel segmentation algorithm for pathologicalretina images based on the divergence of vector fields. IEEE Transactions onMedical Imaging 27, 2 (2008), 237–246.
[135] Lasko, T., Bhagwat, J., Zou, K., and Ohno-Machado, L. The use of receiveroperating characteristic curves in biomedical informatics. Journal of BiomedicalInformatics 38, 5 (2005), 404–415.
[136] Lee, S., Abràmoff, M., and Reinhardt, J. Feature-based pairwise retinalimage registration by radial distortion correction. In Medical Imaging (2007), In-ternational Society for Optics and Photonics, pp. 651220–651220.
[137] Leutenegger, S., Chli, M., and Siegwart, R. Brisk: Binary robust invariantscalable keypoints. In Proceedings of International Conference on Computer Vision(2011), IEEE, pp. 2548–2555.
[138] Liang, Z., Wong, D., Liu, J., Chan, K., and Wong, T. Towards automaticdetection of age-related macular degeneration in retinal fundus images. In Proceed-ings of International Conference of the IEEE Engineering in Medicine and BiologySociety (2010), IEEE, pp. 4100–4103.
150 BIBLIOGRAPHY
[139] Lin, Y., and Medioni, G. Retinal image registration from 2d to 3d. In Proceed-ings of Computer Vision and Pattern Recognition (2008), IEEE, pp. 1–8.
[140] Liu, D., Wood, N., Xu, X., Witt, N., Hughes, A., and Thom, S. 3dreconstruction of the retinal arterial tree using subject-specific fundus images. InAdvances in Computational Vision and Medical Image Processing. Springer, 2009,pp. 187–201.
[141] Lujan, B., Wang, F., Gregori, G., Rosenfeld, P., Knighton, R., Puli-afito, C., Danis, R., Hubbard, L., Chang, R., Budenz, D., Seider, M.,and Knight, O. Calibration of fundus images using spectral domain optical co-herence tomography. Ophthalmic Surgery, Lasers and Imaging 39, 4 (2008), 15–20.
[142] Maberley, D., Walker, H., Koushik, A., and Cruess, A. Screening fordiabetic retinopathy in james bay, ontario: a cost-effectiveness analysis. CanadianMedical Association Journal 168, 2 (2003), 160–164.
[143] Maintz, J., and Viergever, M. A survey of medical image registration. MedicalImage Analysis 2, 1 (1998), 1–36.
[144] Markelj, P., Tomaževič, D., Likar, B., and Pernuš, F. A review of 3d/2dregistration methods for image-guided interventions. Medical Image Analysis 16, 3(2012), 642–661.
[145] Martinello, M., Favaro, P., Nieto, G. M., Harvey, A., Grisan, E.,Scarpa, F., and Ruggeri, A. 3-d retinal surface inference: Stereo or monocularfundus camera? In Proceedings of International Conference of the IEEE Engineer-ing in Medicine and Biology Society (2007), IEEE, pp. 896–899.
[146] Martinez-Perez, M., and Espinosa-Romero, A. 3d reconstruction of retinalblood vessels from two views. In Proceedings of Indian Conference on ComputerVision, Graphics & Image Processing (Kolkata, India, December 2004), pp. 258–263.
[147] Matas, J., Chum, O., Urban, M., and Pajdla, T. Robust wide-baselinestereo from maximally stable extremal regions. Image and Vision Computing 22,10 (2002), 761–767.
[148] Mora, A., Vieira, P., Manivannan, A., and Fonseca, J. Automated drusendetection in retinal images using analytical modelling algorithms. Biomedical En-gineering Online 10, 1 (2011), 59.
[149] Mordant, D., Al-Abboud, I., Muyo, G., Gorman, A., Sallam, A.,Ritchie, P., Harvey, A., and McNaught, A. Spectral imaging of the retina.Eye 25, 3 (2011), 309–320.
[150] Mordant, D., Al-Abboud, I., Muyo, G., Gorman, A., Sallam, A., Rod-mell, P., Crowe, J., Morgan, S., Ritchie, P., Harvey, A., and Mc-Naught, A. Validation of human whole blood oximetry, using a hyperspectralfundus camera with a model eye. Investigative Ophthalmology and Visual Science52, 5 (2011), 2851–2859.

BIBLIOGRAPHY 151
[151] Mortensen, E., Deng, H., and Shapiro, L. A sift descriptor with globalcontext. In Proceedings of Computer Vision and Pattern Recognition (San Diego,California, USA, June 2005), pp. 184–190.
[152] Myronenko, A., and Song, X. Intensity-based image registration by minimizingresidual complexity. IEEE Transactions on Medical Imaging 29, 11 (2010), 1882–1891.
[153] Myronenko, A., Song, X., and Sahn, D. Maximum likelihood motion estima-tion in 3d echocardiography through non-rigid registration in spherical coordinates.Functional Imaging and Modeling of the Heart 5528 (2009), 427–436.
[154] Narasimha-Iyer, H., Can, A., Roysam, B., Stewart, C., Tanenbaum, H.,Majerovics, A., and Singh, H. Robust detection and classification of longitu-dinal changes in color retinal fundus images for monitoring diabetic retinopathy.IEEE Transactions on Biomedical Engineering 53, 6 (June 2006), 1084–1098.
[155] Nayak, J., Acharya, R., Bhat, P., Shetty, N., and Lim, T.-C. Automateddiagnosis of glaucoma using digital fundus images. Journal of Medical Systems 33,5 (2009), 337–346.
[156] Niemeijer, M., Abràmoff, M., and Ginneken, B. V. Segmentation of theoptic disc, macula and vascular arch in fundus photographs. IEEE Transactionson Medical Imaging 26, 1 (2007), 116–127.
[157] Niemeijer, M., Abràmoff, M., and van Ginneken, B. Fast detection of theoptic disc and fovea in color fundus photographs. Medical Image Analysis 13, 6(2009), 859–870.
[158] Niemeijer, M., Staal, J., van Ginneken, B., Loog, M., and Abramoff,M. Comparative study of retinal vessel segmentation methods on a new publiclyavailable database. In Proceedings of SPIE Medical Imaging (2004), InternationalSociety for Optics and Photonics, pp. 648–656.
[159] Niemeijer, M., van Ginneken, B., J, M. C., Mizutani, A., Quellec, G.,Sánchez, C., Zhang, B., Hornero, R., Lamard, M., Muramatsu, C.,et al. Retinopathy online challenge: automatic detection of microaneurysms indigital color fundus photographs. IEEE Transactions on Medical Imaging 29, 1(2010), 185–195.
[160] Niemeijer, M., van Ginneken, B., Russell, S., and Abràmoff, M. Auto-mated detection and differentation of drusen, exudates, and cotton-wool spots indigital color fundus photographs for diabetic retinopathy diagnosis. InvestigativeOphthalmology and Visual Science 48, 5 (2007), 2260–2267.
[161] Niemeijer, M., van Ginneken, B., Russell, S., Suttorp-Schulten, M.,and Abramoff, M. Automated detection and differentiation of drusen, exudates,and cotton-wool spots in digital color fundus photographs for early diagnosis ofdiabetic retinopathy. Investigative Ophthalmology and Visual Science 48, 5 (2007),2260–2267.
152 BIBLIOGRAPHY
[162] Niemeijer, M., van Ginneken, B., Staal, J., Suttorp-Schulten, M., andAbràmoff, M. Automatic detection of red lesions in digital color fundus pho-tographs. IEEE Transactions on Medical Imaging 24, 5 (2005), 584–592.
[163] Niemeijer, M., van Ginneken, B., Staal, J., Suttorp-Schulten, M., andAbràmoff, M. Automatic detection of red lesions in digital color fundus pho-tographs. IEEE Transactions on Medical Imaging 24, 5 (2005), 584–592.
[164] Ning, J., Zhang, L., Zhang, D., and Wu, C. Interactive image segmentationby maximal similarity based region merging. Pattern Recognition 43, 2 (2010),445–456.
[165] Noronha, K., and Nayak, K. A review of fundus image analysis for the auto-mated detection of diabetic retinopathy. Journal of Medical Imaging and HealthInformatics 2, 3 (2012), 258–265.
[166] Nourrit, V., Denniss, J., Muqit, M., Schiessl, I., Fenerty, C., Stanga,P., and Henson, D. High-resolution hyperspectral imaging of the retina with amodified fundus camera. Journal français d’ophtalmologie 33, 10 (2010), 686–692.
[167] Odstrcilik, J., Kolar, R., Budai, A., Hornegger, J., Jan, J., Gazarek,J., Kubena, T., Cernosek, P., Svoboda, O., and Angelopoulou, E. Reti-nal vessel segmentation by improved matched filtering: evaluation on a new high-resolution fundus image database. IET Image Processing 7, 4 (2013), 373–383.
[168] Ohkubo, Y., Kishikawa, H., Araki, E., Miyata, T., Isami, S., Motoyoshi,S., Kojima, Y., Furuyoshi, N., and Shichiri, M. Intensive insulin therapyprevents the progression of diabetic microvascular complications in japanese pa-tients with non-insulin-dependent diabetes mellitus: a randomized prospective 6-year study. Diabetes Research and Clinical Practice 28, 2 (1995), 103–117.
[169] Oliveira, F., and Tavares, J. Medical image registration: a review. ComputerMethods in Biomechanics and Biomedical Engineering 17, 2 (2014), 73–93.
[170] Optics, E. Edmund optics: Chrome on glass, 3 frequency grid distortiontarget. http://www.edmundoptics.com/testing-targets/test-targets/distortion-test-targets/multi-frequency-grid-distortion-targets/46250/. Accessed: 2015-05-21.
[171] Optovue. ifusion - sd-oct & digital fundus photography. http://www.optovue.com/ifusion/, 2016. Accessed: 2016-02-18.
[172] Osareh, A., Mirmehdi, M., Thomas, B., and Markham, R. Automaticrecognition of exudative maculopathy using fuzzy c-means clustering and neuralnetworks. In Proceedings of Medical Image Understanding and Analysis Conference(Birmingham, United Kindom, July 2001), pp. 49–52.
[173] Osareh, A., Mirmehdi, M., Thomas, B., and Markham, R. Automatedidentification of diabetic retinal exudates in digital colour images. The BritishJournal of Ophthalmology 87, 10 (2003), 1220–1223.

BIBLIOGRAPHY 153
[174] Osareh, A., Shadgar, B., and Markham, R. A computational-intelligence-based approach for detection of exudates in diabetic retinopathy images. IEEETransactions on Information Technology in Biomedicine 13, 4 (2009), 535–545.
[175] Otsu, N. A threshold selection method from gray-level histograms. IEEE Trans-actions on Systems, Man, and Cybernetics 9, 1 (1979), 62–66.
[176] Owen, C., Rudnicka, A., Mullen, R., Barman, S., Monekosso, D., Whin-cup, P., Ng, J., and Paterson, C. Measuring retinal vessel tortuosity in 10-year-old children: validation of the computer-assisted image analysis of the retina(caiar) program. Investigative Ophthalmology and Visual Science 50, 5 (2009),2004–2010.
[177] Patton, N., Aslam, T., MacGillivray, T., Deary, I., Dhillon, B., Eikel-boom, R., Yogesan, K., and Constable, I. Retinal image analysis: Concepts,applications and potential. Progress in Retinal and Eye Research 25, 1 (2006),99–127.
[178] Pfingsthorn, M., Birk, A., Schwertfeger, S., Bülow, H., and Pathak,K. Maximum likelihood mapping with spectral image registration. In Proceed-ings of IEEE International Conference on Robotics and Automation (2010), IEEE,pp. 4282–4287.
[179] Pokorny, J., Smith, V., and Lutze, M. Aging of the human lens. AppliedOptics 26, 8 (1987), 1437–1440.
[180] Pollefeys, M., and Gool, L. V. A stratified approach to metric self-calibration.In Proceedings of Computer Vision and Pattern Recognition (San Juan, PuertoRico, June 1997), IEEE, pp. 407–412.
[181] Preece, S., and Claridge, E. Monte carlo modelling of the spectral reflectanceof the human eye. Physics in Medicine and Biology 47, 16 (2002), 2863–2877.
[182] Ramella-Roman, J., Mathews, S., Kandimalla, H., Nabili, A., Duncan,D., D’Anna, S., Shah, S., and Nguyen, Q. Measurement of oxygen saturationin the retina with a spectroscopic sensitive multi aperture camera. Optics Express16, 9 (2008), 6170–6182.
[183] Rankin, S., Walman, B., Buckley, A., and Drance, S. Color doppler imag-ing and spectral analysis of the optic nerve vasculature in glaucoma. AmericanJournal of Ophthalmology 119, 6 (1995), 685–693.
[184] Rapantzikos, K., Zervakis, M., and Balas, K. Detection and segmentation ofdrusen deposits on human retina: Potential in the diagnosis of age-related maculardegeneration. Medical Image Analysis 7, 1 (2003), 95–108.
[185] Ravishankar, S., Jain, A., and Mittal, A. Automated feature extraction forearly detection of diabetic retinopathy in fundus images. In Proceedings of Com-puter Vision and Pattern Recognition (Miami, Florida, USA, June 2009), pp. 210–217.

154 BIBLIOGRAPHY
[186] Resnikoff, S., Pascolini, D., Etya’ale, D., Kocur, I., Pararajasegaram,R., Pokharelal, G., and Mariotti, S. Global data on visual impairment inthe year 2002. Bulletin of the World Health Organization 82, 11 (2004), 844–851.
[187] Retinopathy online challenge. http://webeye.ophth.uiowa.edu/ROC/. Accessed:2015-09-16.
[188] Reza, A., Eswaran, C., and Hati, S. Automatic tracing of optic disc andexudates from color fundus images using fixed and variable thresholds. Journal ofMedical Systems 33, 1 (2009), 73–80.
[189] Ricci, E., and Perfetti, R. Retinal blood vessel segmentation using line op-erators and support vector classification. IEEE Transactions on Medical Imaging26, 10 (2007), 1357–1365.
[190] Rigamonti, R., and Lepetit, V. Accurate and efficient linear structure segmen-tation by leveraging ad hoc features with learned filters. In Proceedings of MedicalImage Computing and Computer-Assisted Intervention. Springer, 2012, pp. 189–197.
[191] Rodmell, P., Crowe, J., Gorman, A., Harvey, A., Muyo, G., Mordant,D., McNaught, A., and Morgan, S. Light path-length distributions withinthe retina. Journal of Biomedical Optics 19, 3 (2014), 036008–036008.
[192] Rohen, J. Anatomie und embryologie. Augenheilkunde in Klinik und Praxis 1(1977), 1.1–1.5.
[193] Rosenfeld, P., Moshfeghi, A., and Puliafito, C. Optical coherence tomog-raphy findings after an intravitreal injection of bevacizumab (avastin) for neovas-cular age-related macular degeneration. Ophthalmic Surgery, Lasers and Imaging36, 4 (2004), 331–335.
[194] Salyer, D., Denninghoff, K., Beaudry, N., Basavanthappa, S., Park, R.,and Chipman, R. Diffuse spectral fundus reflectance measured using subretinallyplaced spectralon. Journal of Biomedical Optics 13, 4 (2008), 044004–044004.
[195] Sánchez, C., Hornero, R., López, M., Aboy, M., Poza, J., and Abásolo,D. A novel automatic image processing algorithm for detection of hard exudatesbased on retinal image analysis. Medical Engineering and Physics 30, 3 (2008),350–357.
[196] Sánchez, C., Niemeijer, M., Abràmoff, M., and van Ginneken, B. Ac-tive learning for an efficient training strategy of computer-aided diagnosis systems:Application to diabetic retinopathy screening. In Proceedings of Medical ImageComputing and Computer-Assisted Intervention. Springer, 2010, pp. 603–610.
[197] Savage, G., Johnson, C., and Howard, D. A comparison of noninvasive ob-jective and subjective measurements of the optical density of human ocular media.Optometry & Vision Science 78, 6 (2001), 386–395.
BIBLIOGRAPHY 155
[198] Sbeh, Z., Cohen, L., Mimoun, G., and Coscas, G. A new approach of geodesicreconstruction for drusen segmentation in eye fundus images. IEEE Transactionson Medical Imaging 20, 12 (2001), 1321–1333.
[199] Scanlon, P. The english national screening programme for sight-threateningdiabetic retinopathy. Journal of Medical Screening 15, 1 (2008), 1–4.
[200] Schweitzer, D., Hammer, M., Kraft, J., Thamm, E., Königsdörffer, E.,and Strobel, J. In vivo measurement of the oxygen saturation of retinal vesselsin healthy volunteers. IEEE Transactions on Biomedical Engineering 46, 12 (1999),1454–1465.
[201] Schweitzer, D., Klein, S., Guenther, S., and Hammer, M. Early diagnosisof glaucoma by means of fundus reflectometry. New Trends in Ophthalmology 7(1992), 241–241.
[202] Schweitzer, D., Leistritz, L., Hammer, M., Scibor, M., Bartsch, U.,and Strobel, J. Calibration-free measurement of the oxygen saturation in humanretinal vessels. In Proceedings of Ophthalmic Technologies V (San Jose, California,US, February 1995), International Society for Optics and Photonics, pp. 210–218.
[203] Sekhar, S., Al-Nuaimy, W., and Nandi, A. Automated localisation of op-tic disk and fovea in retinal fundus images. In Proceedings of European SignalProcessing Conference (2008), IEEE, pp. 1–5.
[204] Sharp, P., Olson, J., Strachan, F., Hipwell, J., Ludbrook, A.,O’Donnell, M., Wallace, S., Goatman, K., Grant, A., Waugh, N.,McHardy, K., and Forrester, J. The value of digital imaging in diabeticretinopathy. Health Technology Assessment 7, 30 (2003), 1–119.
[205] Sinthanayothin, C., Boyce, J., Cook, H., and Williamson, T. Automatedlocalisation of the optic disc, fovea, and retinal blood vessels from digital colourfundus images. British Journal of Ophthalmology 83, 8 (1999), 902–910.
[206] Sinthanayothin, C., Boyce, J., Williamson, T., Cook, H., Mensah, E.,Lal, S., and Usher, D. Automated detection of diabetic retinopathy on digitalfundus images. Diabetic Medicine 19 (2002), 105–112.
[207] Smith, R., Nagasaki, T., Sparrow, J., Barbazetto, I., Klaver, C., andChan, J. A method of drusen measurement based on the geometry of fundusreflectance. Biomedical Engineering Online 2, 1 (2003), 10.
[208] Soares, J., Leandro, J., Jr, R. C., Jelinek, H., and Cree, M. Retinalvessel segmentation using the 2-d gabor wavelet and supervised classification. IEEETransactions on Medical Imaging 25, 9 (2006), 1214–1222.
[209] Soille, P. Morphological Image Analysis: Principles and Applications. Springer-Verlag New York, Inc., 1999.
[210] Sommer, C., Straehle, C., Kothe, U., and Hamprecht, F. ilastik: Inter-active learning and segmentation toolkit. In Proceedings of IEEE InternationalSymposium on Biomedical Imaging: From Nano to Macro (2011), IEEE, pp. 230–233.
156 BIBLIOGRAPHY
[211] Sopharak, A., New, K., Moe, Y., Dailey, M., and Uyyanonvara, B. Auto-matic exudate detection with a naive bayes classifier. In International Conferenceon Embedded Systems and Intelligent Technology (Bangkok, Thailand, February2008), pp. 139–142.
[212] Sotiras, A., Davatzikos, C., and Paragios, N. Deformable medical imageregistration: A survey. IEEE Transactions on Medical Imaging 32, 7 (2013), 1153–1190.
[213] Staal, J., Abràmoff, M., Niemeijer, M., Viergever, M., and van Gin-neken, B. Ridge-based vessel segmentation in color images of the retina. IEEETransactions on Medical Imaging 23, 4 (2004), 501–509.
[214] Stewart, C., Tsai, C.-L., and Roysam, B. The dual-bootstrap iterative closestpoint algorithm with application to retinal image registration. IEEE Transactionson Medical Imaging 22, 11 (2003), 1379–1394.
[215] Stone, H., and Wolpov, R. Blind cross-spectral image registration using pre-filtering and fourier-based translation detection. IEEE Transactions on Geoscienceand Remote Sensing 40, 32 (2002), 637–650.
[216] Styles, I., Calcagni, A., Claridge, E., Orihuela-Espina, F., and Gibson,J. Quantitative analysis of multi-spectral fundus images. Medical Image Analysis10, 4 (August 2006), 578–597.
[217] Swaminathan, R., and Nayar, S. Nonmetric calibration of wide-angle lenses andpolycameras. IEEE Transactions on Pattern Analysis and Machine Intelligence 22,10 (2000), 1172–1178.
[218] Tang, L., Kwon, Y., Alward, W., Greenlee, E., Lee, K., Garvin, M.,and Abràmoff, M. 3d reconstruction of the optic nerve head using stereo fundusimages for computer-aided diagnosis of glaucoma. In SPIE Medical Imaging (2010),International Society for Optics and Photonics, pp. 76243D–76243D.
[219] Taylor, R. Handbook of Retinal Screening in Diabetes, first ed. John Wiley &Sons, 2006.
[220] Teng, T., Lefley, M., and Claremont, D. Progress towards automateddiabetic ocular screening: a review of image analysis and intelligent systems fordiabetic retinopathy. Medical and Biological Engineering and Computing 40, 1(2002), 2–13.
[221] Thirion, J.-P. Image matching as a diffusion process: an analogy with maxwell’sdemons. Medical Image Analysis 2 .
[222] TOPCON. 3d oct-2000, optical coherence tomog-raphy. http://www.topcon-medical.eu/eu/products/32-3d-oct-2000-optical-coherence-tomography.html#description, 2015.Accessed: 2016-02-18.
BIBLIOGRAPHY 157
[223] Tracking, R. T. A. B. H. M. donoser and h. bischof. In Proceedings of In-ternational Conference on Pattern Recognition (Tampa, Florida, December 2008),pp. 1–4.
[224] Trucco, E., Ruggeri, A., Karnowski, T., Giancarlo, L., Chaum, E.,Hubschman, J., Al-Diri, B., Cheung, C., Wong, D., Abramoff, M., Lim,G., Kumar, D., Burlina, P., Bressler, N., Jelinek, H., Maiaudeau, F.,Quellec, G., MacGillivray, T., and Dhillon, B. Validating retinal fundusimage analysis algorithms: Issues and a proposal. Investigative Ophthalmology andVisual Science (2013), 3546–3559.
[225] Tsai, C.-L., Li, C.-Y., Yang, G., and Lin, K.-S. The edge-driven dual-bootstrap iterative closest point algorithm for registration of multimodal fluoresceinangiogram sequence. IEEE Transactions on Medical Imaging 29, 3 (2010), 636 –649.
[226] Twining, C., Cootes, T., Marsland, S., Petrovic, V., Schestowitz, R.,and Taylor, C. A unified information-theoretic approach to groupwise non-rigidregistration and model building. In Information Processing in Medical Imaging(2005), Springer, pp. 1–14.
[227] Usher, D., Dumskyj, M., Himaga, M., Williamson, T., Nussey, S., andBoyce, J. Automated detection of diabetic retinopathy in digital retinal images:a tool for diabetic retinopathy screening. Diabetic Medicine 21, 1 (2004), 84–90.
[228] Vaiopoulos, A. Developing matlab scripts for image analysis and quality as-sessment. In SPIE Remote Sensing (2011), International Society for Optics andPhotonics, pp. 81810B–81810B.
[229] van de Kraats, J., Berendschot, T., and van Norren, D. The pathways oflight measured in fundus reflectometry. Vision Reserch 36, 15 (1996), 2229–2247.
[230] van der Meer, F. The effectiveness of spectral similarity measures for the analysisof hyperspectral imagery. International Journal of Applied Earth Observation andGeoinformation 8, 1 (2006), 3–17.
[231] van Norren, D., and Tiemeijer, L. Spectral reflectance of the human eye.Vision Reserch 26, 2 (1986), 313–320.
[232] van Norren, D., and van de Kraats, J. Retinal densitometer with the size ofa fundus camera. Vision Reserch 29, 3 (1989), 369–374.
[233] Vercauteren, T., Pennec, X., Perchant, A., and Ayache, N. Non-parametric diffeomorphic image registration with the demons algorithm. In Pro-ceedings of Medical Image Computing and Computer-Assisted Intervention (Bris-bane, Australia, October 2007), pp. 319–326.
[234] Vercauteren, T., Pennec, X., Perchant, A., and Ayache, N. Symmetriclog-domain diffeomorphic registration: a demons-based approach. In Proceedingsof Medical Image Computing and Computer-Assisted Intervention (New York, NewYork, USA, September 2008), pp. 754–761.
158 BIBLIOGRAPHY
[235] Vezhenevets, V., and Konouchine, V. Growcut: Interactive multi-label ndimage segmentation by cellular automata. In Proceedings of Graphicon (Novosi-birsk, Russia, June 2005), pp. 150–156.
[236] Viola, P., and Wells III, W. Alignment by maximization of mutual informa-tion. International Journal of Computer Vision 24, 2 (1997), 137–154.
[237] Walter, T., Klein, J.-C., Massin, P., and Erginay, A. A contribution ofimage processing to the diagnosis of diabetic retinopathy. IEEE Transactions onMedical Imaging 21, 10 (2002), 1236–1243.
[238] Wang, H., Hsu, W., Goh, K., and Lee, M. An effective approach to detectlesions in color retinal images. In Proceedings of Computer Vision and PatternRecognition (Columbus, Ohio, USA, June 2000), vol. 2, IEEE, pp. 181–186.
[239] Wang, L., Jacques, S., and Zheng, L. McmlâĂŤmonte carlo modeling of lighttransport in multi-layered tissues. Computer Methods and Programs in Biomedicine47, 2 (1995), 131–146.
[240] Wang, Y., Jiang, G., and Jiang, C. Mean shift tracking with graph cuts basedimage segmentation. In Proceedings of IEEE International Congress on Image andSignal Processing (Chongqing, China, October 2012), pp. 675–679.
[241] Wangsa-Wirawan, N., and Linsenmeier, R. Retinal oxygen: fundamental andclinical aspects. Archives of Ophthalmology 121, 4 (2003), 547–557.
[242] Welfer, D., Scharcanski, J., Kitamura, C., Pizzol, M. D., Ludwig, L.,and Marinho, D. Segmentation of the optic disk in color eye fundus imagesusing an adaptive morphological approach. Computers in Biology and Medicine40, 2 (February 2010), 124–137.
[243] Wong, I., Iu, L., Koizumi, H., and Lai, W. The inner segment/outer segmentjunction: what have we learnt so far? Current Opinion in Ophthalmology 23, 3(2012), 210–218.
[244] Wu, G., Wang, Q., Jia, H., and Shen, D. Feature-based groupwise registrationby hierarchical anatomical correspondence detection. Human Brain Mapping 33, 2(2012), 253–271.
[245] Wyawahare, M., Patil, P., and Abhyankar, H. Image registration tech-niques: An overview. Signal Processing, Image Processing and Pattern Recognition2, 3 (2009), 11–28.
[246] Xiaohui, Z., and Chutatape, O. Detection and classification of bright lesionsin color fundus images. In Proceedings of IEEE International Conference on ImageProcessing (Singapore, Singapore, October 2004), vol. 1, IEEE, pp. 139–142.
[247] Xu, J., and Chutatape, O. Comparative study of two calibration methods onfundus camera. In Proceedings of International Conference of the IEEE Engineeringin Medicine and Biology Society (2003), vol. 1, IEEE, pp. 576–579.

BIBLIOGRAPHY 159
[248] Xu, L., and Luo, S. Support vector machine based method for identifying hardexudates in retinal images. In IEEE Youth Conference on Information, Computingand Images (Beijing, China, September 2009), pp. 138–141.
[249] Xue, Z., Wong, K., and Wong, S. Joint registration and segmentation of seriallung ct images for image-guided lung cancer diagnosis and therapy. ComputerizedMedical Imaging and Graphics 34, 1 (2010), 55–60.
[250] Yang, G., Stewart, C., Sofka, M., and Tsai, C.-L. Registration of chal-lenging image pairs: Initialization, estimation and decision. IEEE Transactions onPattern Analysis and Machine Intelligence 29, 11 (2007), 1973 – 1989.
[251] Zagers, N., van de Kraats, J., Berendschot, T., and van Norren, D.Simultaneous measurement of foveal spectral reflectance and cone-photoreceptordirectionality. Applied Optics 41, 22 (2002), 4686–4696.
[252] Zhang, X., and Chutatape, O. Detection and classification of bright lesions incolor fundus images. In Proceedings of IEEE International Conference on ImageProcessing (Singapore, October 2004), pp. 139–142.
[253] Zhang, Z. Flexible camera calibration by viewing a plane from unknown orienta-tions. In Proceedings of International Conference on Computer Vision (Kerkyra,Greece, September 1999), vol. 1, pp. 666—673.
[254] Zhang, Z., Yin, F., Liu, J., Wong, W., Tan, N., Lee, B., Cheng, J., andWong, T. Origa-light: An online retinal fundus image database for glaucomaanalysis and research. In Proceedings of International Conference of the IEEEEngineering in Medicine and Biology Society (Buenos Aires, Argentina, August2010), IEEE, pp. 3065–3068.
[255] Zheng, J., Tian, J., Deng, K., Dai, X., Zhang, X., and Xu, M. Salientfeature region: a new method for retinal image registration. IEEE Transactionson Information Technology in Biomedicine 15, 2 (2011), 221–232.
[256] Zitova, B., and Flusser, J. Image registration methods: A survey. Image andVision Computing 21, 11 (2003), 977–1000.

160 BIBLIOGRAPHY

Appendix I
Spectral image composition
I.1 Registration method parameters
Table I.1: Method parameters for synthetic test set (RW= regularization weight,SW = similarity weight, C = correlation parameter, UFR = update field regular-ization, DFR = deformation field regularization)
Window size RW Scaling Alpha Corr BinsCC 50 0.01 - - - -CD2 50 0.01 0.01 - - -MI 50 0.01 - - - 90MS 50 0.1 0.01 - - -RC 50 0.1 - 1 0.38 -SAD 50 0.05 - - - -SSD 30 0.05 - - - -
Alpha UFR DFR SW Max stepDemons 9 45 - - -Log-demons - 45 45 5 5
Table I.2: Method parameters for semisynthetic test set (RW = regularizationweight, SW = similarity weight, C = correlation parameter, UFR = update fieldregularization, DFR = deformation field regularization)
Window size RW Scaling Alpha Corr BinsCC 50 0.05 - - - -CD2 50 0.05 1 - - -MI 15 0.1 - - - 15MS 50 0.1 1 - - -RC 10 0.01 - 1 0.38 -SAD 10 0.1 - - - -SSD 30 0.1 - - - -
Alpha UFR DFR SW Max stepDemons 5 20 - - -Log-demons - 10 5 10 5
161

162 I. Spectral image composition
I.2 Transformation parameter distributions used for sampling
(a) X2 coefficient. (b) Y 2 coefficient.
(c) X × Y coefficient. (d) X coefficient.
(e) Y coefficient. (f) Translation in X.
Figure I.1: Distributions for X-coordinate parameters.
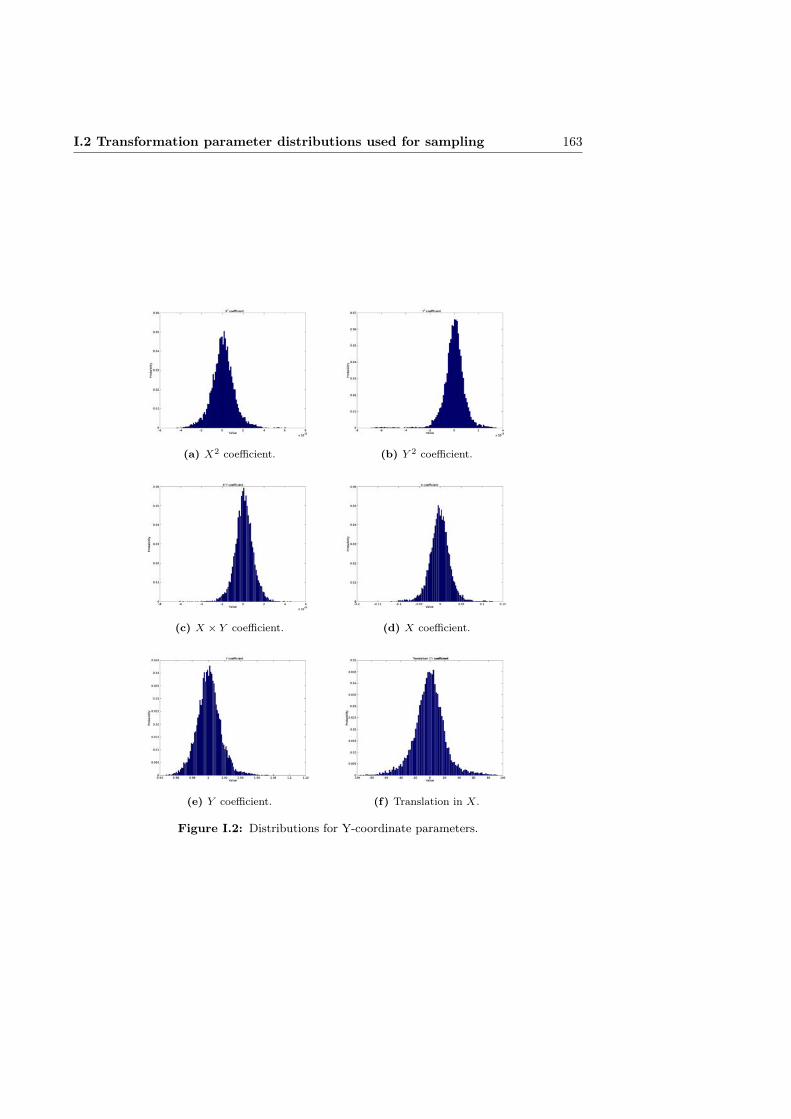
I.2 Transformation parameter distributions used for sampling 163
(a) X2 coefficient. (b) Y 2 coefficient.
(c) X × Y coefficient. (d) X coefficient.
(e) Y coefficient. (f) Translation in X.
Figure I.2: Distributions for Y-coordinate parameters.
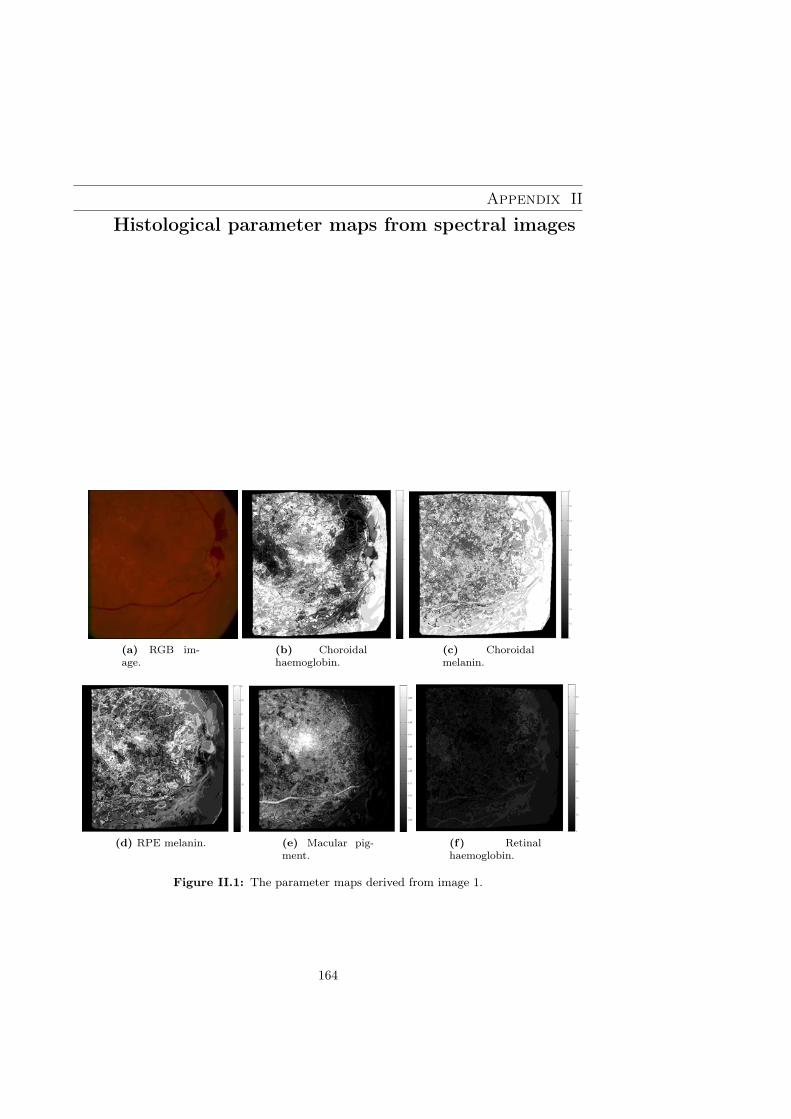
Appendix II
Histological parameter maps from spectral images
(a) RGB im-age.
(b) Choroidalhaemoglobin.
(c) Choroidalmelanin.
(d) RPE melanin. (e) Macular pig-ment.
(f) Retinalhaemoglobin.
Figure II.1: The parameter maps derived from image 1.
164

165
(a) RGB im-age.
(b) Choroidalhaemoglobin.
(c) Choroidalmelanin.
(d) RPE melanin. (e) Macular pig-ment.
(f) Retinalhaemoglobin.
Figure II.2: The parameter maps derived from image 1 after proposed illumi-nation correction.

166 II. Histological parameter maps from spectral images
(a) RGB im-age.
(b) Choroidalhaemoglobin.
(c) Choroidalmelanin.
(d) RPE melanin. (e) Macular pig-ment.
(f) Retinalhaemoglobin.
Figure II.3: The parameter maps derived from image 1 after channel-wise illu-mination correction.
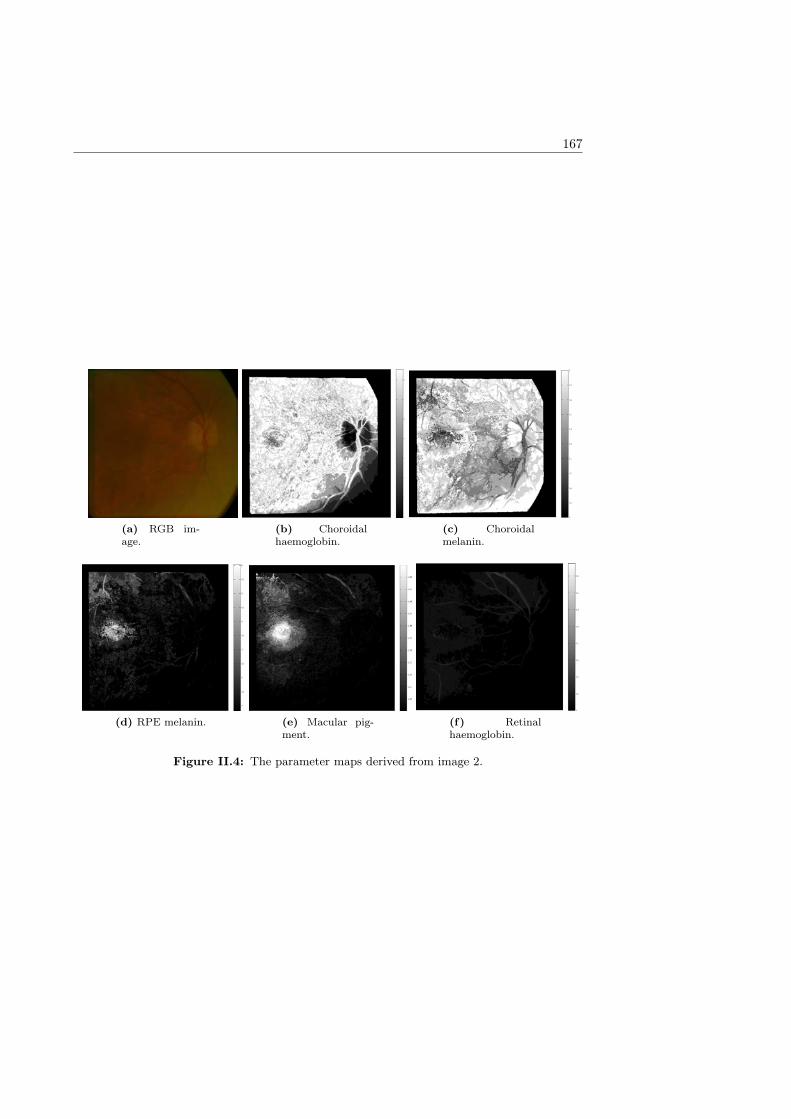
167
(a) RGB im-age.
(b) Choroidalhaemoglobin.
(c) Choroidalmelanin.
(d) RPE melanin. (e) Macular pig-ment.
(f) Retinalhaemoglobin.
Figure II.4: The parameter maps derived from image 2.
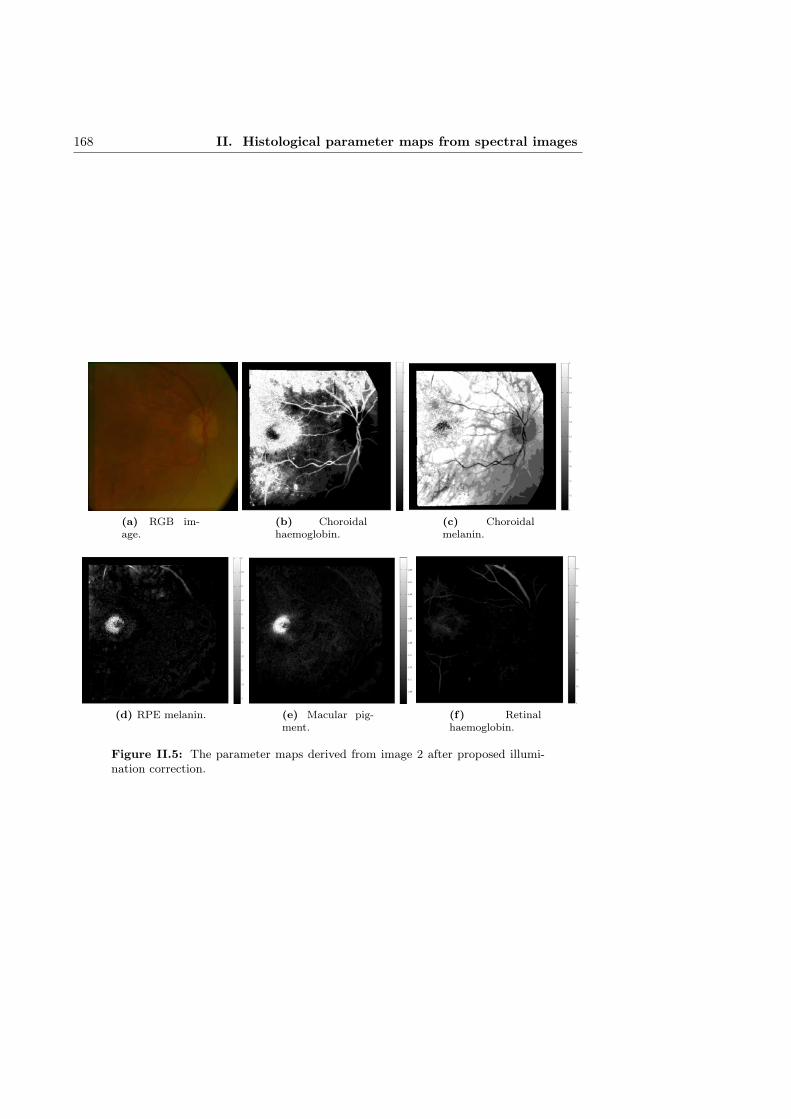
168 II. Histological parameter maps from spectral images
(a) RGB im-age.
(b) Choroidalhaemoglobin.
(c) Choroidalmelanin.
(d) RPE melanin. (e) Macular pig-ment.
(f) Retinalhaemoglobin.
Figure II.5: The parameter maps derived from image 2 after proposed illumi-nation correction.
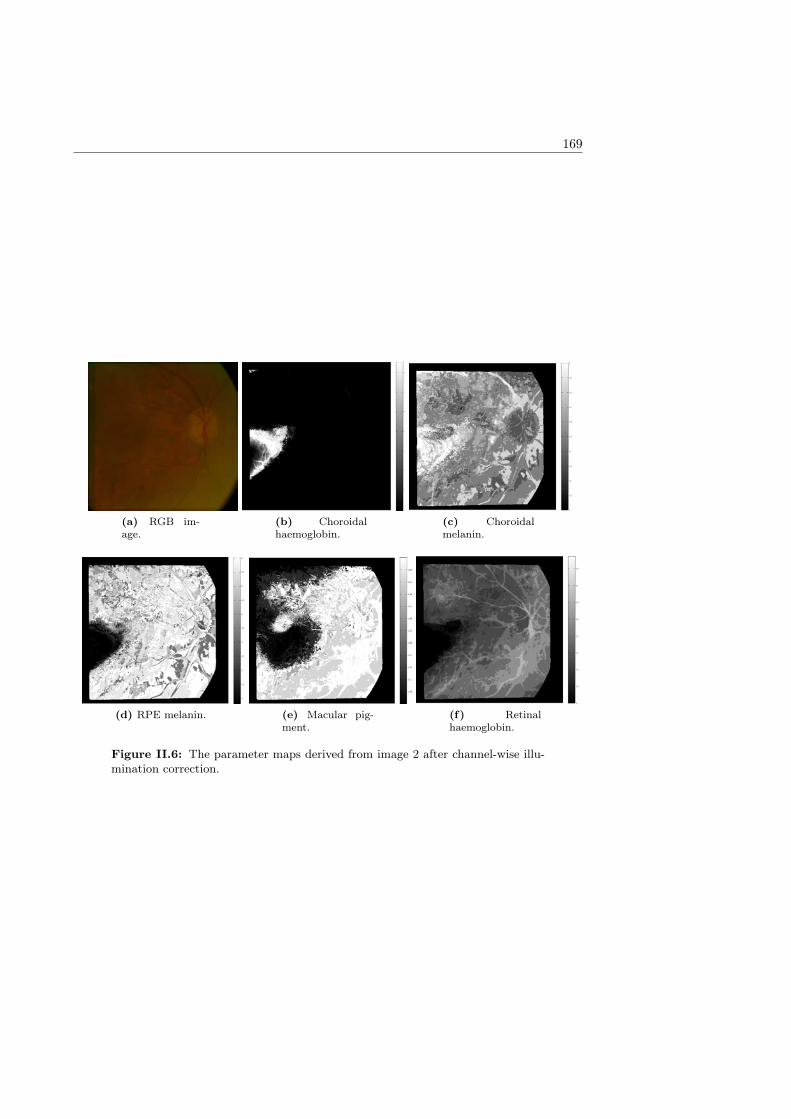
169
(a) RGB im-age.
(b) Choroidalhaemoglobin.
(c) Choroidalmelanin.
(d) RPE melanin. (e) Macular pig-ment.
(f) Retinalhaemoglobin.
Figure II.6: The parameter maps derived from image 2 after channel-wise illu-mination correction.

170 II. Histological parameter maps from spectral images
(a) RGB im-age.
(b) Choroidalhaemoglobin.
(c) Choroidalmelanin.
(d) RPE melanin. (e) Macular pig-ment.
(f) Retinalhaemoglobin.
Figure II.7: The parameter maps derived from image 3.
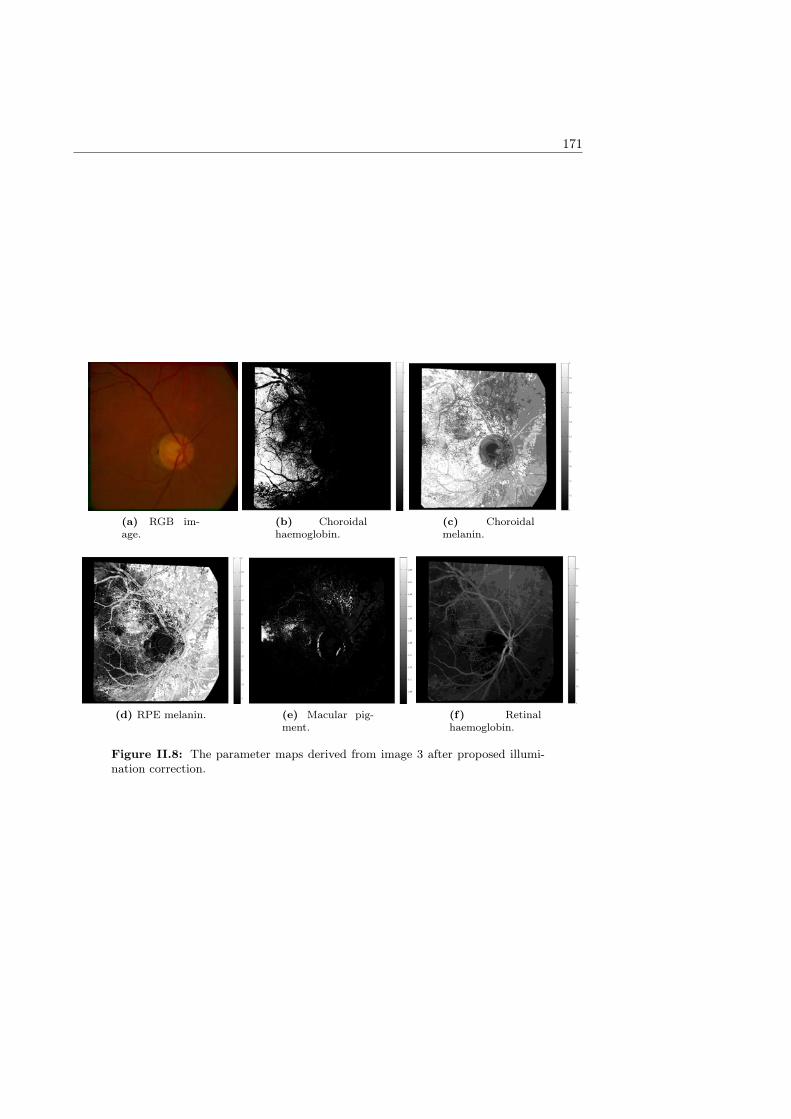
171
(a) RGB im-age.
(b) Choroidalhaemoglobin.
(c) Choroidalmelanin.
(d) RPE melanin. (e) Macular pig-ment.
(f) Retinalhaemoglobin.
Figure II.8: The parameter maps derived from image 3 after proposed illumi-nation correction.
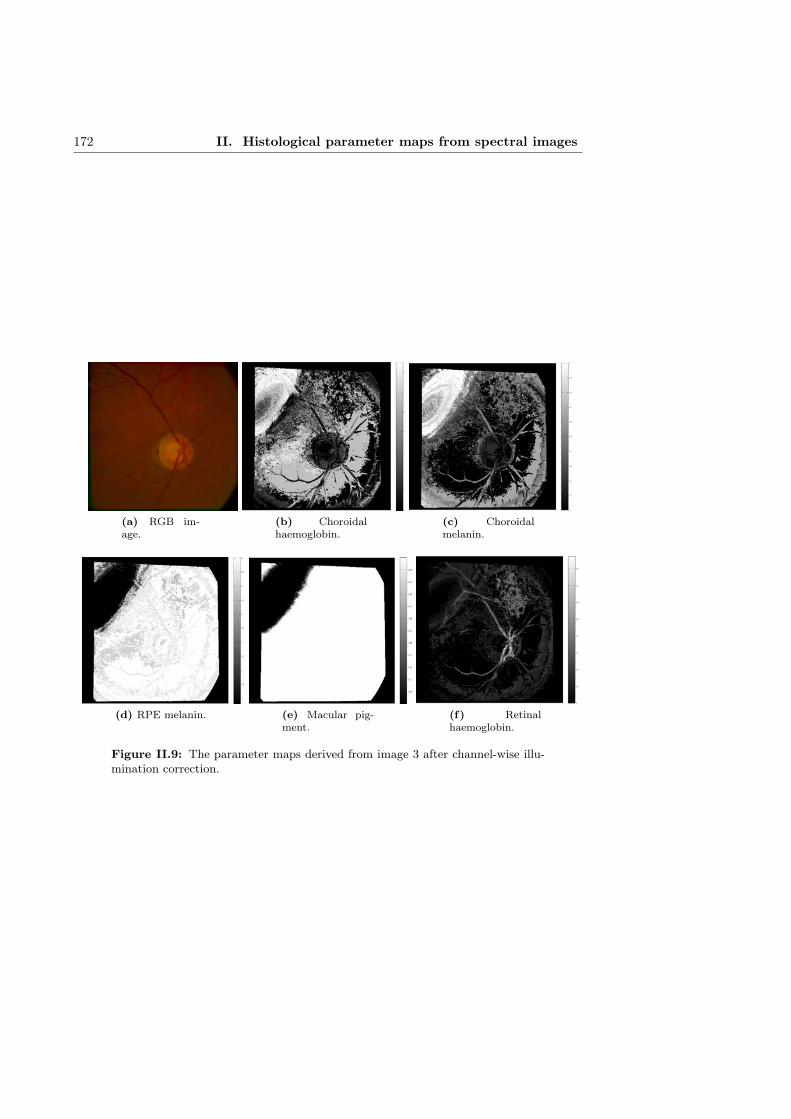
172 II. Histological parameter maps from spectral images
(a) RGB im-age.
(b) Choroidalhaemoglobin.
(c) Choroidalmelanin.
(d) RPE melanin. (e) Macular pig-ment.
(f) Retinalhaemoglobin.
Figure II.9: The parameter maps derived from image 3 after channel-wise illu-mination correction.

173
(a) RGB im-age.
(b) Choroidalhaemoglobin.
(c) Choroidalmelanin.
(d) RPE melanin. (e) Macular pig-ment.
(f) Retinalhaemoglobin.
Figure II.10: The parameter maps derived from image 13.

174 II. Histological parameter maps from spectral images
(a) RGB im-age.
(b) Choroidalhaemoglobin.
(c) Choroidalmelanin.
(d) RPE melanin. (e) Macular pig-ment.
(f) Retinalhaemoglobin.
Figure II.11: The parameter maps derived from image 13 after proposed illu-mination correction.

175
(a) RGB im-age.
(b) Choroidalhaemoglobin.
(c) Choroidalmelanin.
(d) RPE melanin. (e) Macular pig-ment.
(f) Retinalhaemoglobin.
Figure II.12: The parameter maps derived from image 13 after channel-wiseillumination correction.

176 II. Histological parameter maps from spectral images
(a) RGB im-age.
(b) Choroidalhaemoglobin.
(c) Choroidalmelanin.
(d) RPE melanin. (e) Macular pig-ment.
(f) Retinalhaemoglobin.
Figure II.13: The parameter maps derived from image 16.

177
(a) RGB im-age.
(b) Choroidalhaemoglobin.
(c) Choroidalmelanin.
(d) RPE melanin. (e) Macular pig-ment.
(f) Retinalhaemoglobin.
Figure II.14: The parameter maps derived from image 16 after proposed illu-mination correction.

178 II. Histological parameter maps from spectral images
(a) RGB im-age.
(b) Choroidalhaemoglobin.
(c) Choroidalmelanin.
(d) RPE melanin. (e) Macular pig-ment.
(f) Retinalhaemoglobin.
Figure II.15: The parameter maps derived from image 16 after channel-wiseillumination correction.

179
(a) RGB im-age.
(b) Choroidalhaemoglobin.
(c) Choroidalmelanin.
(d) RPE melanin. (e) Macular pig-ment.
(f) Retinalhaemoglobin.
Figure II.16: The parameter maps derived from image 20.

180 II. Histological parameter maps from spectral images
(a) RGB im-age.
(b) Choroidalhaemoglobin.
(c) Choroidalmelanin.
(d) RPE melanin. (e) Macular pig-ment.
(f) Retinalhaemoglobin.
Figure II.17: The parameter maps derived from image 20 after proposed illu-mination correction.
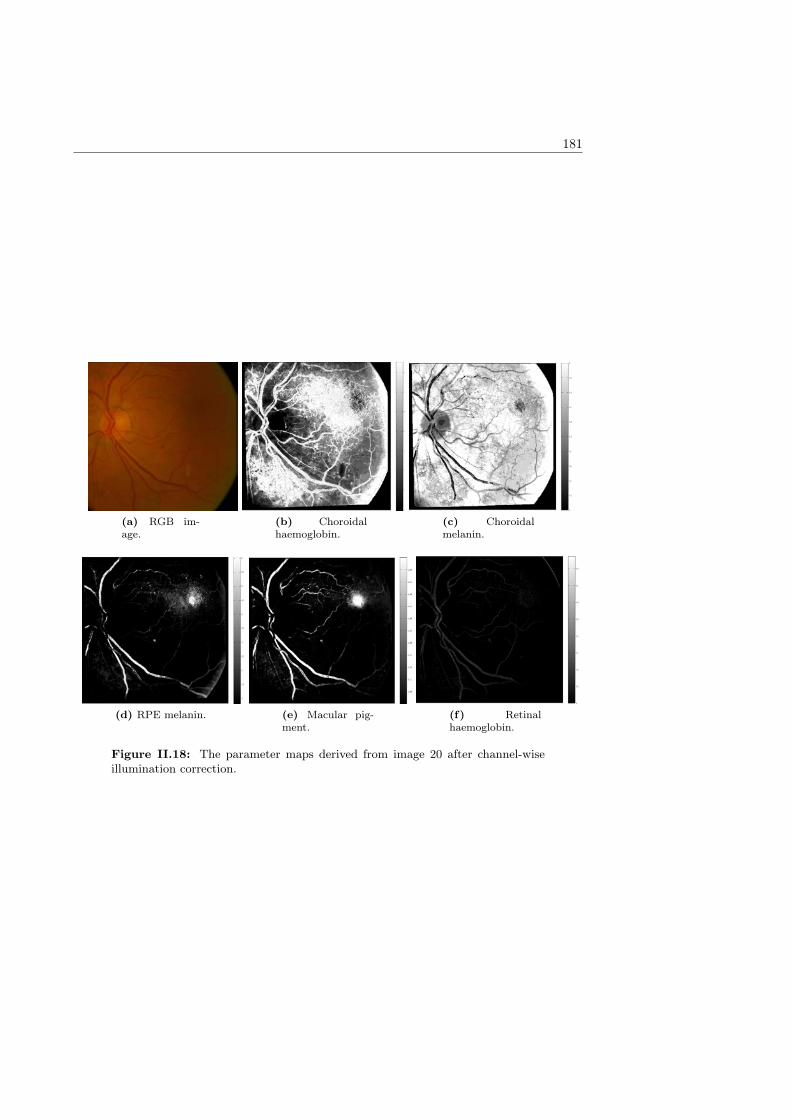
181
(a) RGB im-age.
(b) Choroidalhaemoglobin.
(c) Choroidalmelanin.
(d) RPE melanin. (e) Macular pig-ment.
(f) Retinalhaemoglobin.
Figure II.18: The parameter maps derived from image 20 after channel-wiseillumination correction.

182 II. Histological parameter maps from spectral images
(a) RGB im-age.
(b) Choroidalhaemoglobin.
(c) Choroidalmelanin.
(d) RPE melanin. (e) Macular pig-ment.
(f) Retinalhaemoglobin.
Figure II.19: The parameter maps derived from image 37.
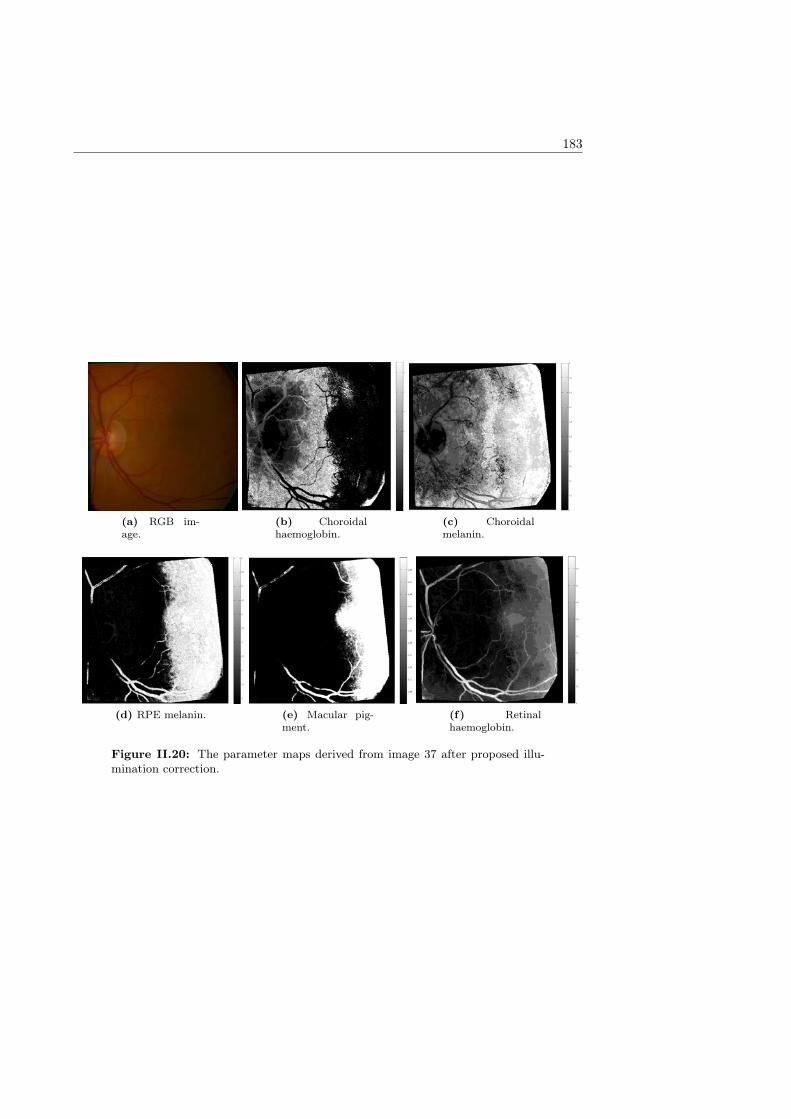
183
(a) RGB im-age.
(b) Choroidalhaemoglobin.
(c) Choroidalmelanin.
(d) RPE melanin. (e) Macular pig-ment.
(f) Retinalhaemoglobin.
Figure II.20: The parameter maps derived from image 37 after proposed illu-mination correction.


ACTA UNIVERSITATIS LAPPEENRANTAENSIS
661. RIABCHENKO, EKATERINA. Generative part-based Gabor object detector. 2015. Diss.
662. ALKKIOMÄKI, VILLE. Role of service and data reuse in enterprises. 2015. Diss.
663. VÄNTSI, OLLI. Utilization of recycled mineral wool as filler in wood plastic composites. 2015.Diss.
664. KLEMOLA, KATJA. Tuottavuuden, vaikuttavuuden ja kustannusvaikuttavuuden arviointialueellisesti integroiduissa sosiaali- ja terveyspalveluissa - palvelujen käyttöön perustuva mallija esimerkkejä. 2015. Diss.
665. HEROLD, KRISTIINA. Impact of Word-of-Mouth on consumer decision-making: An infor-mation processing perspective in the context of a high-involvement service. 2015. Diss.
666. OLABODE, MUYIWA. Weldability of high strength aluminium alloys. 2015. Diss.
667. VANHALA, ERNO. The role of business model in computer game development organizations.2015. Diss.
668. SALAMPASIS, DIMITRIOS. Trust-embedded open innovation: Towards a human-centric ap-proach in the financial industry. 2015. Diss.
669. DE SMET, DIETER. Innovation ecosystem perspectives on financial services innovation. 2015.Diss.
670. PORRAS, PÄIVI. Utilising student profiles in mathematics course arrangements. 2015. Diss.
671. SALMINEN, JUHO. The role of collective intelligence in crowdsourcing innovations. 2015.Diss.
672. ROSAS, SAILA. Co-operative acquisitions - the contextual factors and challenges for co-operatives when acquiring an investor-owned firm. 2015. Diss.
673. SINKKONEN, TIINA. Item-level life-cycle model for maintenance networks - from cost toadditional value. 2015. Diss.
674. TUUNANEN, JUSSI. Modelling of changes in electricity end-use and their impacts on elec-tricity distribution. 2015. Diss.
675. MIELONEN, KATRIINA. The effect of cationic-anionic polyelectrolyte multilayer surfacetreatment on inkjet ink spreading and print quality. 2015. Diss.
676. OMAJENE, JOSHUA. Underwater remote welding technology for offshore structures. 2015.Diss.
677. NUUTINEN, PASI. Power electronic converters in low-voltage direct current distribution -analysis and implementation. 2015. Diss.
678. RUSATSI, DENIS. Bayesian analysis of SEIR epidemic models. 2015. Diss.
679. STRAND, ELSI. Enhancement of ultrafiltration process by pretreatment in recovery of hemi-celluloses from wood extracts. 2016. Diss.

680. TANNINEN, PANU. Press forming of paperboard - advancement of converting tools and pro-cess control. 2015. Diss.
681. VALTONEN, PETRI. Distributed energy resources in an electricity retailer’s short-term profitoptimization. 2015. Diss.
682. FORSSTRÖM-TUOMINEN, HEIDI. Collectiveness within start up-teams - leading the wayto initiating and managing collective pursuit of opportunities in organizational contexts. 2015.Diss.
683. MAGUYA, ALMASI. Use of airborne laser scanner data in demanding forest conditions. 2015.Diss.
684. PEIPPO, JUHA. A modified nominal stress method for fatigue assessment of steel plates withthermally cut edges. 2015. Diss.
685. MURASHKO, KIRILL. Thermal modelling of commercial lithium-ion batteries. 2016. Diss.
686. KÄRKKÄINEN, TOMMI. Observations of acoustic emission in power semiconductors. 2016.Diss.
687. KURVINEN, EMIL. Design and simulation of high-speed rotating electrical machinery. 2016.Diss.
688. RANTAMÄKI, JUKKA. Utilization of statistical methods for management in the forest in-dustry. 2016. Diss.
689. PANOVA, YULIA. Public-private partnership investments in dry ports - Russian logisticsmarkets and risks. 2016. Diss.
690. BAHARUDIN, EZRAL. Real-time simulation of multibody systems with applications for work-ing mobile vehicles. 2016. Diss.
691. MARTIKAINEN, SOILI. Development and effect analysis of the Asteri consultative auditingprocess - safety and security management in educational institutions. 2016. Diss.
692. TORVINEN, PEKKA. Catching up with competitiveness in emerging markets - An analysisof the role of the firm’s technology management strategies. 2016. Diss.
693. NORONTAUS, ANNUKKA. Oppisopimuskoulutus yritysten tuottamana koulutuspalveluna:tavoitteista vaikutuksiin. 2016. Diss.
694. HALMINEN, OSKARI. Multibody models for examination of touchdown bearing systems.2016. Diss.
695. TALONPOIKA, ANNA-MARIA. Financial working capital - management and measurement.2016. Diss.
696. INKINEN, HENRI. Intellectual capital, knowledge management practices and firm perfor-mance. 2016. Diss.
697. YANG, XIAOCHEN. Development of a welding production quality control and managementsystem model for China. 2016. Diss.
698. LEMINEN, VILLE. Leak-proof heat sealing of press-formed paperboard trays. 2016. Diss.