Embed Size (px)
Citation preview
O B I T e c h n I c a l P a P e r n O . 3
SPECTRUM analySiS:
OPTIONS FOR BROADCAST SPECTRUMOBI TECHNICAL PAPER NO. 3
JUNE 2010
F e d e r a l c O m m u n I c a T I O n s c O m m I s s I O n | J u n e 2 0 1 0

F e d e r a l c O m m u n I c a T I O n s c O m m I s s I O n | s P e c T r u m a n a l y s I s 1
O B I T e c h n I c a l P a P e r n O . 3
ExECUTIvE SUMMARy Mobile broadband networks, devices and applications are a critical component of the overall broadband landscape and increasingly central to the productivity of American workers, the global leadership position of American innovation and the daily lives of tens of millions of American consumers. Spectrum is the nourishment for mobile broadband, and the FCC—as part of Connecting America: The National Broadband Plan (“the Plan”)—is seeking new sources of spectrum to feed the rapidly accelerating demand for mobile broadband services.
Among these potential sources are the broadcast television bands. The TV bands are particularly attractive for two reasons. First, they have technical characteristics that are well-suited for current and next generation mobile broadband services. TV bands comprise nearly 30% of the spectrum allocation between 225 MHz and 1 GHz, considered the most valuable “beach-front” property for mobile broadband due to the excellent propagation characteristics in that frequency range. Second, the TV bands in their current use have a substantially lower market value than similar spectrum recently auctioned primar-ily for mobile broadband use.
Of course, the FCC should not make spectrum allocation decisions based solely on market valuations. Broader public benefits resulting from a service using the public airwaves are also very important considerations. From this perspective, both over-the-air (OTA) TV and mobile broadband provide impor-tant services and benefits above those captured in a market valuation. Free, OTA TV has served longstanding policy goals including competition, diversity, localism and emergency com-munications. Elderly, rural, African American, Hispanic and other minority populations heavily rely upon free, OTA TV.1 Mobile broadband promises to deliver public benefits from applications that are unique to the mobile, two-way context—such as location-based services to target interactive emergency communications quickly and accurately, and health applica-tions to remove geography, time and access to information as impediments to quality healthcare delivery. These benefits also disproportionately reach under-represented populations. A higher percentage of African Americans and Hispanics use mobile devices for Internet activity relative to other groups.2
Because both free, OTA TV and mobile broadband are important components to our nation’s communications infrastructure, we seek to design a mechanism that would en-able repurposing of spectrum from the broadcast TV bands to mobile broadband use, while protecting longstanding policy goals and public interests served by OTA TV and further sup-porting those served by broadband use. Such a mechanism would be voluntary and market-based, using incentive auctions
to compensate broadcasters who choose to participate. If authorized by Congress, incentive auctions would create a cooperative process and enable a more timely and equitable reallocation from broadcast TV bands to mobile broadband use. Since a significant portion of the TV bands is not directly used for broadcasting, a limited number of stations in a limited number of markets choosing to participate voluntarily could recover a significant amount of spectrum. The FCC would, of course, seek to ensure that such auctions and other actions to enable reallocation do not significantly adversely affect par-ticular communities of American TV viewers.
There are several reasons why stations may choose to participate in an incentive auction. First, as demonstrated by the market value gap, some stations may realize that their spectrum license holds more value in an auction than they can achieve under their current business model and future broad-cast opportunities. Many others will likely value the current business and future options available through their spectrum license more than the value they could obtain from an auction, and will therefore choose not to participate. As noted industry analyst Marci Ryvicker stated,
“[An incentive auction] could be good for the business… Broadcasters who believe they will be better monetizing the spectrum on their own will do something with it. Those who figure they really don’t know what they are going to do with the extra spectrum will be the ones that are going to give it back. So, allowing the broadcasters to decide is probably the best part of the plan.”3
Second, the Plan recommends that the FCC establish a licensing framework that would enable stations to share six-megahertz channels while maintaining most, if not all, of their current revenue streams. Analysis published for the first time by the FCC in this paper demonstrates that stations could continue to broadcast in HD while sharing a channel. Stations choosing to share a channel could relinquish a portion of their bandwidth to an incentive auction and receive all or a portion of the proceeds. In other words, they could continue to deliver free, OTA television service while gaining access to much-needed capital to invest in local and diverse programming.
The combination of a voluntary, incentive auction followed by a repacking of channels could make great strides towards achieving the goal to which the Plan aspires, of recovering 120 megahertz from the broadcast TV bands. It is very difficult to predict such an outcome ex ante, however, because the very nature of a voluntary process implies choice and, therefore, uncertainty. The FCC is building a new tool, an Allotment Optimization Model, which will help bring more predict-ability to the process. Once its development is complete this
2 F e d e r a l c O m m u n I c a T I O n s c O m m I s s I O n | W W W . B r O a d B a n d . G O V
O B I T e c h n I c a l P a P e r n O . 3
model, introduced for the first time in the paper, will be able to indicate what range of actions would need to happen volun-tarily—i.e., what number of stations in which markets, making voluntary choices to relinquish some or all licensed spectrum—in order to achieve the target, and what would be the expected impact on consumer reception of OTA signals. This model is a work in progress, but we are making its initial results and tech-nical details available in this paper to provide transparency and enable continued refinement and improvement.
This paper, the Omnibus Broadband Initiative (OBI) paper referenced in the Plan, is the second step in a process begun by the Plan. It is not a conclusion but rather an important
contributor to the next steps, such as the upcoming Broadcast Engineering Forum and rulemaking proceedings. We encour-age feedback and comments throughout all of these steps to ensure we best serve the interests of the American public.
Though we recognize the uncertainty inherent in predicting the outcome of this process, we are confident that the analy-sis in this paper and the tools under development at the FCC could enable the FCC, with extensive public input throughout a rulemaking proceeding, to establish a voluntary process that recovers a significant amount of spectrum from the broadcast TV bands while preserving consumer reception of, and public interests served by, OTA television.
F e d e r a l c O m m u n I c a T I O n s c O m m I s s I O n | s P e c T r u m a n a l y s I s 3
O B I T e c h n I c a l P a P e r n O . 3
Executive Summary ........................................................................................................................................................................ 1
Introduction .....................................................................................................................................................................................4
What is New in This Technical Paper ........................................................................................................................................................... 5I. The Opportunity ...........................................................................................................................................................................6
Technical Characteristics................................................................................................................................................................................6Value Gap ........................................................................................................................................................................................................... 7Public Benefits from Broadcast Television and Mobile Broadband ..................................................................................................... 10
II. Analytical Methodologies .......................................................................................................................................................... 11
Simulated Annealing .......................................................................................................................................................................................11Allotment Optimization Model (AOM) ...................................................................................................................................................... 12Coverage and Service Analyses .................................................................................................................................................................... 12
III. Scenario Results ...................................................................................................................................................................... 14
Market-Wide Collocation of Transmission Facilities.............................................................................................................................. 14Channel Sharing ............................................................................................................................................................................................. 14Channel Repacking ........................................................................................................................................................................................ 16Viability of Channel Sharing for High Definition Programming .......................................................................................................... 18
IV. Reallocation Mechanism ..........................................................................................................................................................24
Update Rules on TV Service Areas and Revise the Table of Allotments ..............................................................................................24Conduct Auctions or Exchanges to Enable Voluntary Reallocation ....................................................................................................25Encourage Development of Other Approaches, Such as Cellular Architectures, That May Enable More Efficient Use of Broadcast TV Spectrum .................................................................................................................................................................. 26
V. Potential Impact from Reallocation Mechaisms ........................................................................................................................28
Consumers .......................................................................................................................................................................................................28Public Interest Goals .................................................................................................................................................................................... 30Broadcasters’ Current Revenue Streams ................................................................................................................................................. 30Broadcasters’ Future Evolution .................................................................................................................................................................. 31Low-Power Television (LPTV) Stations ....................................................................................................................................................32Other Users in the Broadcast TV Bands ....................................................................................................................................................33Coordination in the U.S.-Canada and U.S.-Mexico Border Areas .........................................................................................................33
Conclusion ....................................................................................................................................................................................34
Contributors .................................................................................................................................................................................. 35
Appendices ................................................................................................................................................................................... 40
TABLE OF CONTENTS
4 F e d e r a l c O m m u n I c a T I O n s c O m m I s s I O n | W W W . B r O a d B a n d . G O V
O B I T e c h n I c a l P a P e r n O . 3
INTRODUCTIONConnecting America: The National Broadband Plan (“the Plan”) identifies the impending need for the U.S. to dedicate more radio frequency spectrum to wireless broadband infrastructure in response to the expected rapid growth in wireless broadband demand over the next decade. Specifically, the Plan recom-mends that the FCC make 500 megahertz newly available for broadband use within the next 10 years, 300 megahertz of which should be made available between 225 MHz and 3.7 GHz for mobile use within the next 5 years. The Plan identifies a variety of spectrum bands for this purpose, including the bands currently used for broadcast television.4
The FCC has periodically examined the use of the televi-sion spectrum bands over the past decades.5 Building on this prior work, the FCC released a public notice on September 23, 2009, seeking comment on uses of radio spectrum for wire-less broadband purposes.6 Several commenters suggested that the FCC evaluate the broadcast TV bands as potential sources of spectrum.7
In response to the interest expressed in the TV bands, the FCC released another public notice on December 2, 2009, that focused on broadcast TV spectrum.8 Respondents were asked to comment on issues related to the benefits of broadcast TV and wireless broadband, the efficiency of spectrum used in the broadcast TV bands, and the potential mechanisms that could be used to increase spectrum availability and efficiency, among other questions. Various individuals and organizations filed more than 100 responses in total. Recurring themes in the responses include the existence of a value gap and the potential for improved efficiency, as well as the importance of over-the-air (OTA) television in general, and HD picture quality, mobile DTV and multicasting in particular.9 Based on this extensive public record, as well as the FCC’s previous work on television spectrum, we identified a set of scenarios that could be used to inform the Plan’s spectrum objectives. We then analyzed the impact of each scenario on broadcasters, consumers and spec-trum yield, and gathered feedback from a range of stakeholders including consumer interest groups, broadcasters, engineers, investors, industry analysts and legal advisors.
This Technical Paper (the “Paper”) is the Omnibus Broadband Initiative (OBI) paper referenced in the Plan and presents the analyses supporting the recommendations in the Plan related to broadcast TV spectrum realloca-tion, and proposed the groundwork for execution on those recommendations. First, the Paper discusses the rationale behind repurposing a portion of broadcast TV bands to flex-ible, broadband use, while recognizing the central role that free, OTA television plays in the American communications
infrastructure. Next, the Paper describes the analytical meth-odologies used to size the potential spectrum reclamation opportunity, along with estimated impacts on consumer recep-tion of OTA signals resulting from various scenarios. The Paper outlines the possible reallocation mechanisms in more detail than in the Plan, and supports the preference for a voluntary, market-based reallocation. Finally, the Paper recognizes that any reallocation of spectrum from broadcast TV will impact consumers, broadcasters and other occupants of the bands, and discusses the potential magnitude of, and mechanisms to mitigate, that impact. The Paper focuses on full-power TV li-censees, since they have primary interference protection rights and comprise the vast majority of economic activity in the
What Connecting America: The National Broadband Plan recommends:
• Recommendation 5.8.5: The FCC should initiate a rulemaking proceeding to reallocate 120 megahertz from the broadcast television (TV) bands, including:
• Update rules on TV service areas and distance separa-tions and revise the Table of Allotments to ensure the most efficient allotment of six-megahertz channel assignments as a starting point.
• Establish a licensing framework to permit two or more stations to share a six-megahertz channel.
• Determine rules for auctions of broadcast spectrum reclaimed through repacking and voluntary channel sharing.
• Explore alternatives—including changes in broadcast technical architecture, an overlay license auction or more extensive channel sharing—in the event the preceding recommendations do not yield a significant amount of spectrum.
• Take additional measures to increase efficiency of spectrum use in the broadcast TV bands.
With regard to timing, the Plan states that:• The FCC should complete rulemaking proceedings
on recommended steps for which it currently has authority as soon as practicable, but no later than 2011, and should conduct an auction of reallocated spectrum in 2012.
• If Congress grants the FCC the authority to do incen-tive auctions prior to the auction in 2012, then the FCC should delay any auction of reallocated broadcast TV spectrum until 2013. This delay would allow time to complete rulemaking proceedings on a voluntary, incentive auction.
• All reallocated spectrum should be cleared by 2015.
F e d e r a l c O m m u n I c a T I O n s c O m m I s s I O n | s P e c T r u m a n a l y s I s 5
O B I T e c h n I c a l P a P e r n O . 3
bands. We acknowledge, however, the need to take low-power TV licensees into account, which could have an impact on the spectrum recoverable for mobile broadband services. The rulemaking proceeding will seek to address potential consid-erations for all incumbent licensees in the bands. We conclude that the substantial benefits of more widespread and robust broadband services outweigh potential undesired impacts from a reallocation of spectrum from broadcast TV.
What is NeW iN this techNical PaPerThe Paper presents several new analyses and methodologies that provide unique insights into the discussion about potential reallocation of spectrum from broadcast TV. First, the Paper reveals the development of, and initial preliminary outputs from, a new methodology to determine the most efficient Table of Allotments for broadcast TV stations. This methodology, called the Allotment Optimization Model (AOM), will allow the FCC to optimize channel assignments for various objectives and to set constraints on those objectives, in a much faster, more ac-curate and more user-friendly way than is currently possible. For example, once development of this model is complete, the FCC will be able to determine how many stations in which markets could participate voluntarily in an incentive auction in order to make progress towards freeing 120 megahertz with the minimal possible impact on service areas and consumers, or potentially develop alternative scenarios to meet the spectrum objective. The alpha version of this tool, though it cannot yet provide that degree of insight, has already assisted in informing recommenda-tions in the Plan and, with other FCC analytical tools, assessing the potential impact on consumers and broadcasters from various scenarios. The model is a work in progress, but we are making its initial results, assumptions underlying those results,
and technical details available in this paper to provide transpar-ency and to enable continued refinement and improvement.
Second, the paper presents the first, in-depth analysis and publication by the FCC of actual bandwidth used by a sample of stations to broadcast standard and high definition (SD and HD) primary video streams, along with additional video streams multicast on digital side channels. This analysis is important because it substantiates the assertion, made in the Plan, that two broadcast TV stations could combine transmissions on a single six-megahertz channel and continue to broadcast primary video streams in HD.
Finally, the paper brings more clarity in the broadcast TV context to a critical recommendation in the Plan—i.e., that Congress should grant the FCC authority to conduct incentive auctions. The paper, equipped with preliminary results of the AOM and bolstered by the HD bandwidth analysis, provides examples of the number of stations that could participate in this voluntary and innovative market-based approach for it to result in meaningful amounts of spectrum reallocated from broadcast TV to flexible, mobile broadband use. The paper also describes alternative approaches to structure and conduct such an incen-tive auction to achieve the desired results.
Because the FCC is publishing these analyses and methodolo-gies for the first time, one objective of this paper is to refine them through public comment and feedback. This refinement will help the FCC improve their accuracy and usefulness as inputs to the forthcoming rulemaking proceeding on broadcast TV spectrum reallocation. In this paper’s Conclusion, we outline mechanisms by which readers can provide feedback. This paper is another step, not a conclusion, in a comprehensive process to engage the public on important considerations regarding spectrum alloca-tions for broadcast TV and broadband uses.
The Paper focuses on what is new and supplemental to what appears in the Plan. Each section will briefly recap the associated recommendations and discussion from the Plan, and then further substantiate or elaborate with additional analysis and commentary.
6 F e d e r a l c O m m u n I c a T I O n s c O m m I s s I O n | W W W . B r O a d B a n d . G O V
O B I T e c h n I c a l P a P e r n O . 3
I. THE OPPORTUNITyThe spectrum occupied by broadcast television stations, particularly in the UHF band, has excellent propagation char-acteristics that make it well-suited to the provision of mobile broadband services in both urban and rural areas. Enabling the reallocation of this spectrum to broadband use in a way that would not harm consumers overall has the potential to create new economic growth and investment opportunities with limited potential impact on broadcaster business mod-els. Most importantly, consumers would retain access to free, OTA television. Some television service disruptions would be unavoidable; however, the substantial benefits of more widespread and robust broadband services would outweigh these disruptions. The goal is to protect and retain the benefits consumers receive from free OTA television, while simultane-ously gaining all the opportunities associated with increased broadband services.
techNical characteristicsThe broadcast TV bands have attractive technical charac-teristics for a well-functioning mobile broadband network: excellent propagation and configurability into large contiguous blocks of spectrum.
The propagation characteristics of the TV bands, espe-cially in UHF ranges between 470 MHz and 698 MHz, are well-suited for wireless broadband applications. Unlike higher frequency ranges, which comprise the majority of spectrum licensed for mobile broadband use, the UHF frequency bands provide excellent coverage over wider areas, as well as bet-ter penetration into buildings and houses. These propagation characteristics reduce the capital required for network build-out, especially in less dense areas where cell sizes are largely limited by propagation rather than by clutter, terrain, or capac-ity needs. For example, a simple propagation analysis shows that approximately one third as many cell sites are required to cover the same rural area at 650 MHz as are required at 1900 MHz, assuming the same wireless technology is deployed at both frequencies.10
Furthermore, the broadcast TV bands are wide enough to re-configure into larger, contiguous blocks. Today, 3G technologies utilize channel bandwidths of 1.25 MHz and 5 MHz, which will continue to sustain a variety of robust uses, including those applicable to public safety, for example. Next generation wireless broadband technologies (e.g., WiMAX and LTE) will take advantage of even larger channel sizes. For heav-ily used commercial bands, wider channels may translate into more efficient use of spectrum, faster data rates and a better overall user experience.
The UHF bands are more appealing for mobile broadband use than the VHF bands, particularly the low VHF bands in channels 2 through 6 (54-72 MHz, 76-88 MHz). First, mo-bile devices operating in the VHF bands would require larger antennas that may not conform to consumer expectations regarding mobile handset form factors. Second, signals carried over radiofrequency waves tend to fade in and out. At lower frequency bands such as the low VHF, when the signal fades it stays that way for much longer than at higher bands. These “deep signal fades” would translate into dropped calls and poor service for mobile broadband users. Finally, mobile broadband services in the low VHF bands in particular may face out-of-band interference issues with adjacent channel operations in the Amateur band (50–54 MHz) and the aeronautical beacon band (72–76 MHz).
Currently, broadcast TV stations in the VHF bands are experiencing reception issues after the Digital Television (DTV) transition due to low antenna gain, fading, weak signal levels and environmental noise from other electronic devices in
What the Plan says about: The Opportunity
• The spectrum occupied by broadcast television stations has excellent propagation characteristics that make it well suited to the provision of mobile broadband services, in both urban and rural areas.
• Because of the continued importance of OTA television, the recommendations in the Plan seek to preserve it as a healthy, viable medium going forward, in a way that would not harm consumers overall, while establishing mechanisms to make available additional spectrum for flexible broadband uses.
• The need for such mechanisms is illustrated by the relative market values of spectrum for alternative uses. The market value for spectrum used for OTA broadcast TV and the market value for spectrum used for mobile broadband currently reveal a substantial gap.
Questions addressed in this chapter• What are the specific technical characteristics of the
broadcast TV bands that make them suited for broad-band deployment?
• What were the specific data points and analyses that led to the estimation of the market “value gap?” What relative market trends and other dynamics have con-tributed to this gap?
• On top of the economic value attributed to broadcast and broadband spectrum under their current use, what public benefits do OTA television and mobile broad-band provide?
F e d e r a l c O m m u n I c a T I O n s c O m m I s s I O n | s P e c T r u m a n a l y s I s 7
O B I T e c h n I c a l P a P e r n O . 3
homes. To ensure the most efficient use of the VHF bands, the FCC should first work to address these reception issues so that TV stations can continue broadcasting in the lower and upper VHF bands.
Value GaPWhen faced with hard choices as to how to allocate limited re-sources, market valuation is one useful indicator of appropriate resource allocation. Other indicators, such as public benefits to society, are also necessary, particularly when evaluating an asset that is publicly owned. In the following analysis, we look solely at market valuation, but in the section titled “Public Benefits from Broadcast Television and Mobile Broadband,” we also look at public benefits of both broadcast TV and mobile broadband.
The market value for spectrum used for OTA broadcast TV and the market value for spectrum used for mobile broadband reveal a substantial gap. The economic value of spectrum is esti-mated by industry convention in terms of dollars per megahertz of spectrum, per person reached (dollars per megahertz-pop). In 2008, the FCC held an auction of 52 megahertz of broadcast TV spectrum in the 700 MHz band recovered as part of the DTV transition. That auction resulted in winning bids totaling more than $19 billion, with an average spectrum valuation, primarily for mobile broadband use, of $1.28/megahertz–pop.11
The TV bands are located adjacent to the 700 MHz band, and therefore have similar propagation characteristics; how-ever, the estimated value of these bands ranges from $0.11 to $0.15 per megahertz-pop. The chart below explains this eco-nomic valuation12:
Total Broadcast TV Industry Enterprise Value $63.7BOTA audience as a % of total x 14–19%Value of OTA Broadcast TV $8.9-12.2BMegahertz 294Population 281.4 M$s/megahertz—pop $0.11–0.15
Alternative methods to estimate the current economic value of OTA television spectrum have resulted in similar valua-tions.13 While other possible valuation methods could result in further variations in these values, this analysis illustrates the order of magnitude of the gap.
This estimated ten-fold disparity in economic value between spectrum used for mobile broadband and spectrum used for OTA TV broadcasting is due to three primary factors:
1. Long-term market trends point to substantially higher growth in mobile broadband than in OTA broadcasting.
2. Since broadcast TV requires channel interference protections, only a fraction of the total spectrum al-located to broadcast TV is currently allotted directly to full-power stations.
3. As a universally available, free OTA medium, television broadcasting has long been required to fulfill certain pub-lic interest and technical requirements.
Long-Term Market TrendsDemand for mobile broadband services is growing rapidly with the introduction of new devices (e.g., smartphones, netbooks) and with 3G and 4G upgrades of mobile networks. This explo-sion in mobile data usage reflects a growing trend in consumer preferences toward wireless, Web-based content delivered on demand to any device at any time. Since 2005, subscribers to mobile services have grown 42% in total, revenues have grown 39% and industry employment has grown 16%.14 Growth in demand for mobile broadband services bolsters the expectation of future scarcity in spectrum allocated for its use and sustains high valuations for that spectrum.
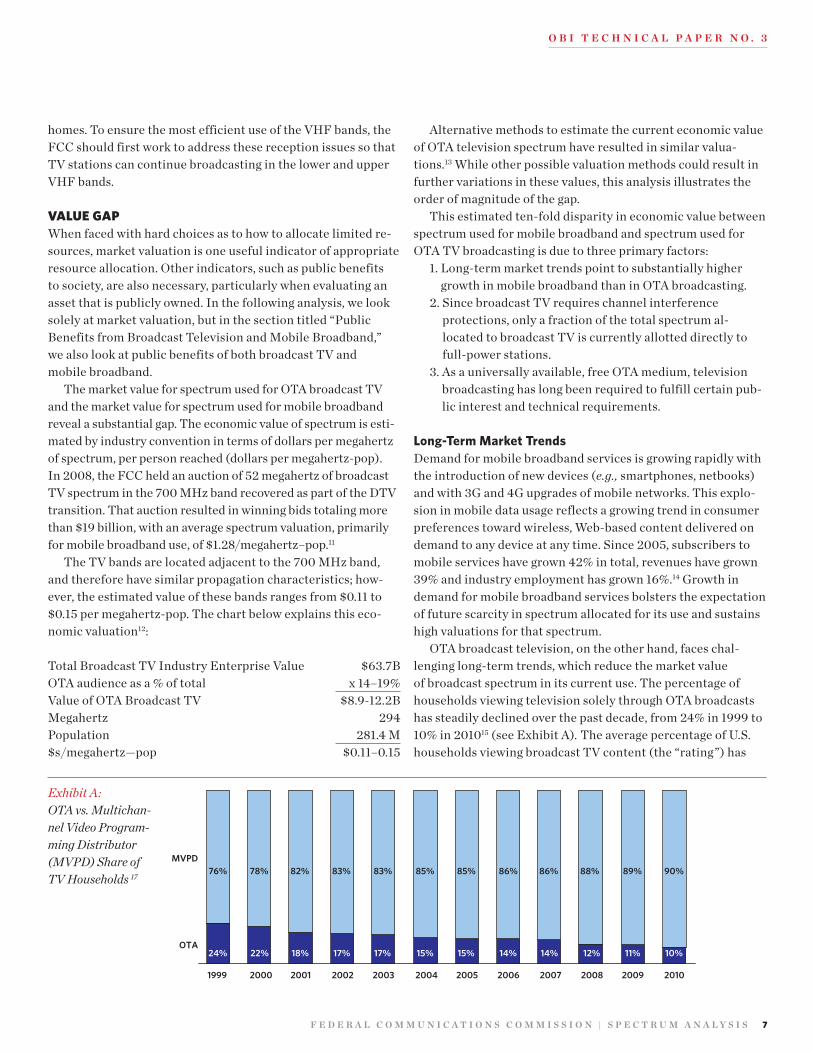
OTA broadcast television, on the other hand, faces chal-lenging long-term trends, which reduce the market value of broadcast spectrum in its current use. The percentage of households viewing television solely through OTA broadcasts has steadily declined over the past decade, from 24% in 1999 to 10% in 201015 (see Exhibit A). The average percentage of U.S. households viewing broadcast TV content (the “rating”) has
76% 78% 82% 83% 83% 85%
2009 2010
MVPD
OTA
2000 2001 2002 2003 20041999 2005 2006 2007 2008
85% 86% 86% 88% 89% 90%
24% 22% 18% 17% 17% 15% 15% 14% 14% 12% 11% 10%
Exhibit A: OTA vs. Multichan-nel Video Program-ming Distributor (MVPD) Share of TV Households 17
8 F e d e r a l c O m m u n I c a T I O n s c O m m I s s I O n | W W W . B r O a d B a n d . G O V
O B I T e c h n I c a l P a P e r n O . 3
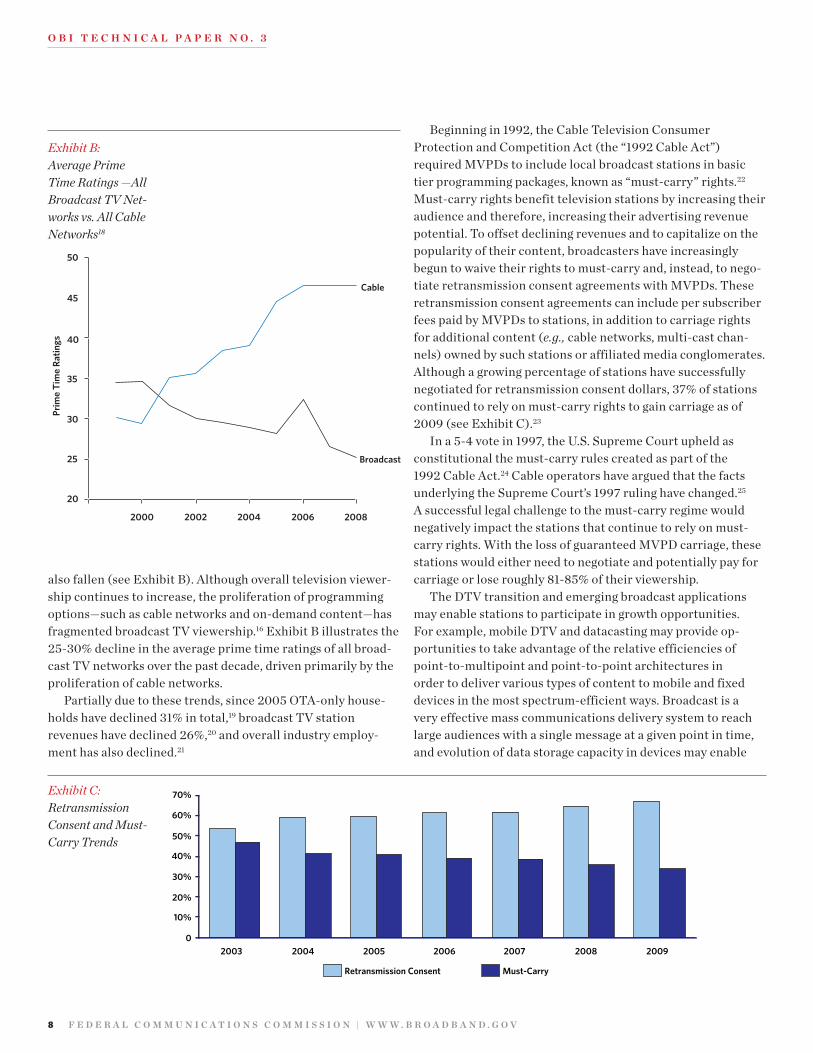
also fallen (see Exhibit B). Although overall television viewer-ship continues to increase, the proliferation of programming options—such as cable networks and on-demand content—has fragmented broadcast TV viewership.16 Exhibit B illustrates the 25-30% decline in the average prime time ratings of all broad-cast TV networks over the past decade, driven primarily by the proliferation of cable networks.
Partially due to these trends, since 2005 OTA-only house-holds have declined 31% in total,19 broadcast TV station revenues have declined 26%,20 and overall industry employ-ment has also declined.21
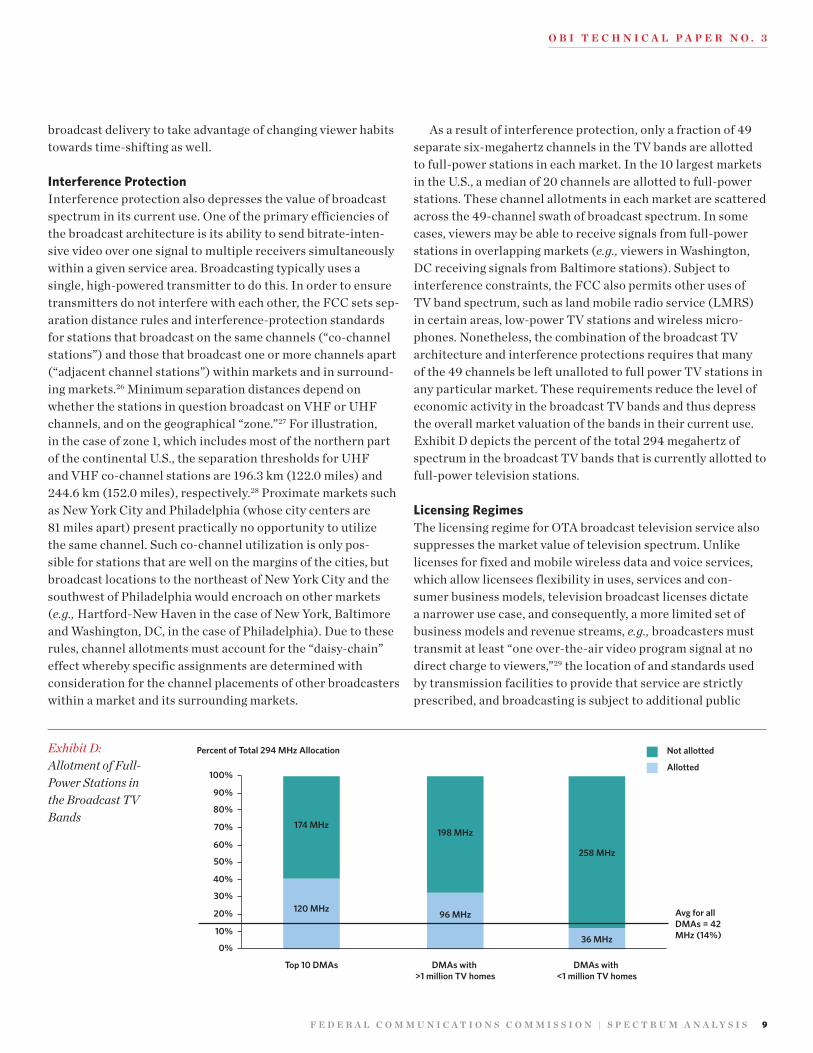
Beginning in 1992, the Cable Television Consumer Protection and Competition Act (the “1992 Cable Act”) required MVPDs to include local broadcast stations in basic tier programming packages, known as “must-carry” rights.22 Must-carry rights benefit television stations by increasing their audience and therefore, increasing their advertising revenue potential. To offset declining revenues and to capitalize on the popularity of their content, broadcasters have increasingly begun to waive their rights to must-carry and, instead, to nego-tiate retransmission consent agreements with MVPDs. These retransmission consent agreements can include per subscriber fees paid by MVPDs to stations, in addition to carriage rights for additional content (e.g., cable networks, multi-cast chan-nels) owned by such stations or affiliated media conglomerates. Although a growing percentage of stations have successfully negotiated for retransmission consent dollars, 37% of stations continued to rely on must-carry rights to gain carriage as of 2009 (see Exhibit C).23
In a 5-4 vote in 1997, the U.S. Supreme Court upheld as constitutional the must-carry rules created as part of the 1992 Cable Act.24 Cable operators have argued that the facts underlying the Supreme Court’s 1997 ruling have changed.25 A successful legal challenge to the must-carry regime would negatively impact the stations that continue to rely on must-carry rights. With the loss of guaranteed MVPD carriage, these stations would either need to negotiate and potentially pay for carriage or lose roughly 81-85% of their viewership.
The DTV transition and emerging broadcast applications may enable stations to participate in growth opportunities. For example, mobile DTV and datacasting may provide op-portunities to take advantage of the relative efficiencies of point-to-multipoint and point-to-point architectures in order to deliver various types of content to mobile and fixed devices in the most spectrum-efficient ways. Broadcast is a very effective mass communications delivery system to reach large audiences with a single message at a given point in time, and evolution of data storage capacity in devices may enable
Exhibit B: Average Prime Time Ratings —All Broadcast TV Net-works vs. All Cable Networks18
20
25
30
35
40
45
50
20082000
Prim
e Ti
me
Ratin
gs
Broadcast
Cable
200620042002
20092008200720062005200420030
10%
20%
30%
40%
50%
70%
60%
Retransmission Consent Must-Carry
Exhibit C: Retransmission Consent and Must-Carry Trends
F e d e r a l c O m m u n I c a T I O n s c O m m I s s I O n | s P e c T r u m a n a l y s I s 9
O B I T e c h n I c a l P a P e r n O . 3
broadcast delivery to take advantage of changing viewer habits towards time-shifting as well.
Interference ProtectionInterference protection also depresses the value of broadcast spectrum in its current use. One of the primary efficiencies of the broadcast architecture is its ability to send bitrate-inten-sive video over one signal to multiple receivers simultaneously within a given service area. Broadcasting typically uses a single, high-powered transmitter to do this. In order to ensure transmitters do not interfere with each other, the FCC sets sep-aration distance rules and interference-protection standards for stations that broadcast on the same channels (“co-channel stations”) and those that broadcast one or more channels apart (“adjacent channel stations”) within markets and in surround-ing markets.26 Minimum separation distances depend on whether the stations in question broadcast on VHF or UHF channels, and on the geographical “zone.”27 For illustration, in the case of zone 1, which includes most of the northern part of the continental U.S., the separation thresholds for UHF and VHF co-channel stations are 196.3 km (122.0 miles) and 244.6 km (152.0 miles), respectively.28 Proximate markets such as New York City and Philadelphia (whose city centers are 81 miles apart) present practically no opportunity to utilize the same channel. Such co-channel utilization is only pos-sible for stations that are well on the margins of the cities, but broadcast locations to the northeast of New York City and the southwest of Philadelphia would encroach on other markets (e.g., Hartford-New Haven in the case of New York, Baltimore and Washington, DC, in the case of Philadelphia). Due to these rules, channel allotments must account for the “daisy-chain” effect whereby specific assignments are determined with consideration for the channel placements of other broadcasters within a market and its surrounding markets.
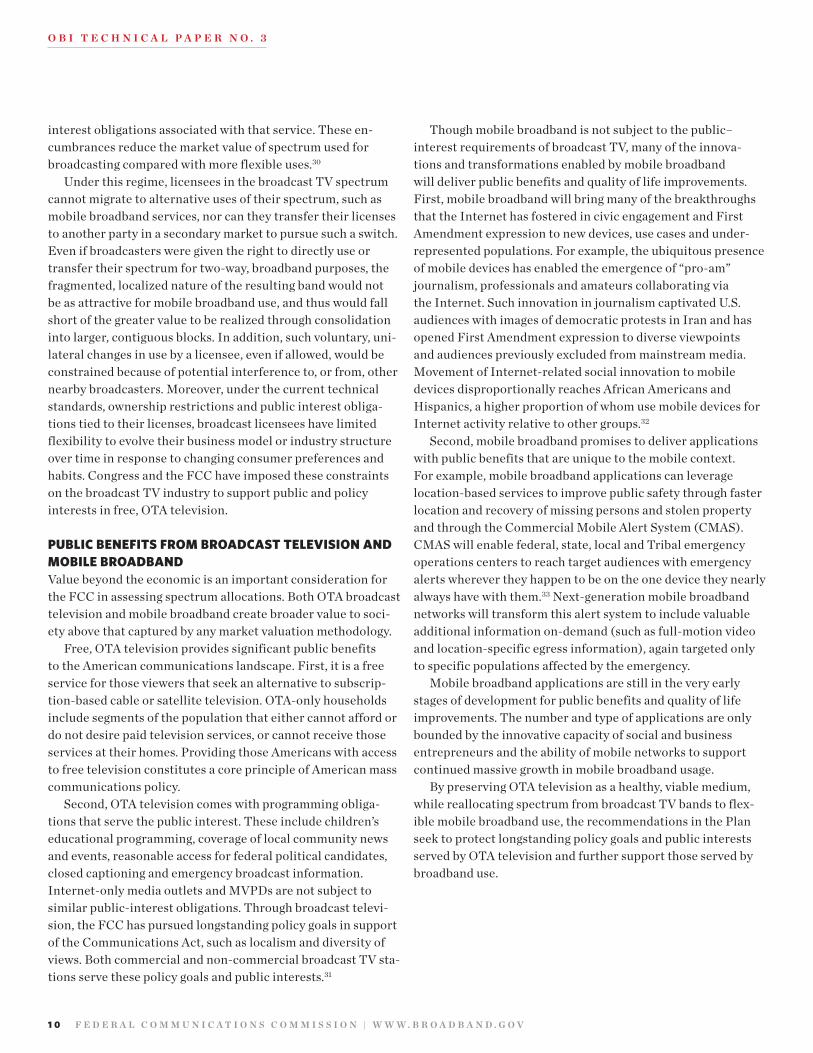
As a result of interference protection, only a fraction of 49 separate six-megahertz channels in the TV bands are allotted to full-power stations in each market. In the 10 largest markets in the U.S., a median of 20 channels are allotted to full-power stations. These channel allotments in each market are scattered across the 49-channel swath of broadcast spectrum. In some cases, viewers may be able to receive signals from full-power stations in overlapping markets (e.g., viewers in Washington, DC receiving signals from Baltimore stations). Subject to interference constraints, the FCC also permits other uses of TV band spectrum, such as land mobile radio service (LMRS) in certain areas, low-power TV stations and wireless micro-phones. Nonetheless, the combination of the broadcast TV architecture and interference protections requires that many of the 49 channels be left unalloted to full power TV stations in any particular market. These requirements reduce the level of economic activity in the broadcast TV bands and thus depress the overall market valuation of the bands in their current use. Exhibit D depicts the percent of the total 294 megahertz of spectrum in the broadcast TV bands that is currently allotted to full-power television stations.
Licensing RegimesThe licensing regime for OTA broadcast television service also suppresses the market value of television spectrum. Unlike licenses for fixed and mobile wireless data and voice services, which allow licensees flexibility in uses, services and con-sumer business models, television broadcast licenses dictate a narrower use case, and consequently, a more limited set of business models and revenue streams, e.g., broadcasters must transmit at least “one over-the-air video program signal at no direct charge to viewers,”29 the location of and standards used by transmission facilities to provide that service are strictly prescribed, and broadcasting is subject to additional public
Exhibit D: Allotment of Full-Power Stations in the Broadcast TV Bands
0%
10%
20%
30%
40%
50%
60%
70%
80%
90%
100%
Percent of Total 294 MHz Allocation Not allotted
Allotted
Avg for all DMAs = 42 MHz (14%)
Top 10 DMAs DMAs with >1 million TV homes
DMAs with <1 million TV homes
174 MHz198 MHz
258 MHz
120 MHz 96 MHz
36 MHz
1 “DMA” is Designated Market Area; top 10 includes NY, LA, Chicago, Philadelphia, Dallas-Ft. Worth, SF Bay Area, Boston, Atlanta, DC, and Houston2 Top 30 DMAs (out of 210)3 DMAs 31 through 210
1 0 F e d e r a l c O m m u n I c a T I O n s c O m m I s s I O n | W W W . B r O a d B a n d . G O V
O B I T e c h n I c a l P a P e r n O . 3
interest obligations associated with that service. These en-cumbrances reduce the market value of spectrum used for broadcasting compared with more flexible uses.30
Under this regime, licensees in the broadcast TV spectrum cannot migrate to alternative uses of their spectrum, such as mobile broadband services, nor can they transfer their licenses to another party in a secondary market to pursue such a switch. Even if broadcasters were given the right to directly use or transfer their spectrum for two-way, broadband purposes, the fragmented, localized nature of the resulting band would not be as attractive for mobile broadband use, and thus would fall short of the greater value to be realized through consolidation into larger, contiguous blocks. In addition, such voluntary, uni-lateral changes in use by a licensee, even if allowed, would be constrained because of potential interference to, or from, other nearby broadcasters. Moreover, under the current technical standards, ownership restrictions and public interest obliga-tions tied to their licenses, broadcast licensees have limited flexibility to evolve their business model or industry structure over time in response to changing consumer preferences and habits. Congress and the FCC have imposed these constraints on the broadcast TV industry to support public and policy interests in free, OTA television.
Public beNefits from broadcast teleVisioN aNd mobile broadbaNd Value beyond the economic is an important consideration for the FCC in assessing spectrum allocations. Both OTA broadcast television and mobile broadband create broader value to soci-ety above that captured by any market valuation methodology.
Free, OTA television provides significant public benefits to the American communications landscape. First, it is a free service for those viewers that seek an alternative to subscrip-tion-based cable or satellite television. OTA-only households include segments of the population that either cannot afford or do not desire paid television services, or cannot receive those services at their homes. Providing those Americans with access to free television constitutes a core principle of American mass communications policy.
Second, OTA television comes with programming obliga-tions that serve the public interest. These include children’s educational programming, coverage of local community news and events, reasonable access for federal political candidates, closed captioning and emergency broadcast information. Internet-only media outlets and MVPDs are not subject to similar public-interest obligations. Through broadcast televi-sion, the FCC has pursued longstanding policy goals in support of the Communications Act, such as localism and diversity of views. Both commercial and non-commercial broadcast TV sta-tions serve these policy goals and public interests.31
Though mobile broadband is not subject to the public– interest requirements of broadcast TV, many of the innova-tions and transformations enabled by mobile broadband will deliver public benefits and quality of life improvements. First, mobile broadband will bring many of the breakthroughs that the Internet has fostered in civic engagement and First Amendment expression to new devices, use cases and under-represented populations. For example, the ubiquitous presence of mobile devices has enabled the emergence of “pro-am” journalism, professionals and amateurs collaborating via the Internet. Such innovation in journalism captivated U.S. audiences with images of democratic protests in Iran and has opened First Amendment expression to diverse viewpoints and audiences previously excluded from mainstream media. Movement of Internet-related social innovation to mobile devices disproportionally reaches African Americans and Hispanics, a higher proportion of whom use mobile devices for Internet activity relative to other groups.32
Second, mobile broadband promises to deliver applications with public benefits that are unique to the mobile context. For example, mobile broadband applications can leverage location-based services to improve public safety through faster location and recovery of missing persons and stolen property and through the Commercial Mobile Alert System (CMAS). CMAS will enable federal, state, local and Tribal emergency operations centers to reach target audiences with emergency alerts wherever they happen to be on the one device they nearly always have with them.33 Next-generation mobile broadband networks will transform this alert system to include valuable additional information on-demand (such as full-motion video and location-specific egress information), again targeted only to specific populations affected by the emergency.
Mobile broadband applications are still in the very early stages of development for public benefits and quality of life improvements. The number and type of applications are only bounded by the innovative capacity of social and business entrepreneurs and the ability of mobile networks to support continued massive growth in mobile broadband usage.
By preserving OTA television as a healthy, viable medium, while reallocating spectrum from broadcast TV bands to flex-ible mobile broadband use, the recommendations in the Plan seek to protect longstanding policy goals and public interests served by OTA television and further support those served by broadband use.
F e d e r a l c O m m u n I c a T I O n s c O m m I s s I O n | s P e c T r u m a n a l y s I s 1 1
O B I T e c h n I c a l P a P e r n O . 3
II. ANALyTICAL METHODOLOgIESWe have used two analytical methodologies to produce models of channel allotments that help inform spectrum reclamation recommendations. The first is a simulated annealing model, a methodology that helped shape the DTV transition and finds more efficient solutions than the current state. The second is a constrained optimization model that is being developed to pro-vide more flexibility across a broader set of inputs and to find the most efficient solution under given constraints. These two approaches create spectrum-efficient channel allotments based on approximate distances required to minimize co-channel and adjacent-channel interference. The generated allotment plan is then run through a separate analysis that predicts service areas based on radiofrequency field strengths—derived from broad-cast stations’ respective locations and transmission parameters (antenna height and pattern, and transmission power)—and on resulting interference between stations.
Both of these methodologies have limitations, which we will describe below. The production version of the optimization model will incorporate protected coverage contours and cal-culated interfering contours, in addition to required distance spacings. However, this future production version may continue to require a two-step approach in which allotments are generat-ed, then predicted service area impacts are separately measured and calibrated against acceptable thresholds until a solution that meets all objectives and constraints is found.34
We would like to emphasize that the results of our analy-ses are “directional” at the current time, and do not intend to predict or prescribe how a reallocation would actually affect specific stations on specific channels. The goal has been to design and conduct analyses that can size the spectrum real-location opportunity and associated tradeoffs based on several different scenarios with underlying assumptions. We have not attempted to determine how specific broadcast stations might actually modify their spectral or geographic footprint. At this point, there are too many unknown variables to be able to analyze with any precision how station-by-station changes may unfold—primarily, as we will detail later, because we recom-mend that voluntary market actions on the part of individual broadcasters would ultimately drive decisions on bandwidth needs. However, the illustrative analyses contained in this and the following chapters are valuable in sizing the potential spectrum reallocation opportunity and understanding impacts and tradeoffs.
simulated aNNealiNGSimulated annealing is a methodology that seeks through trial and error to identify progressively more efficient “repacking” solutions by applying penalties to results that fall short of spec-ified objectives or constraints and then minimizing the sum of those penalties (see Appendix B for a more detailed explana-tion and history of simulated annealing). The FCC’s Office of Engineering and Technology (OET) created an application us-ing simulated annealing to inform the DTV transition’s initial DTV Table of Allotments, i.e., the channels used by stations for their digital signals during the DTV transition. Channel selec-tion for the transitional DTV channel table was also severely constrained by allotments in the long-standing analog TV allot-ment table. The final DTV Table of Allotments was a product of broadcast stations choosing between their analog and DTV channel assignments or, in some cases, selecting a channel from those available in their local area.35
Simulated annealing was useful to the FCC as an in-house approach for establishing the initial DTV Table of Allotments. However, the optimization criteria used in the FCC’s simulated annealing application are limited, and therefore do not neces-sarily lead to “the best” solution with respect to broader sets of desired characteristics. This limitation has to be addressed by multiple runs in which the weights used in the optimization criteria are varied. Hence, the FCC’s simulated annealing pro-gram is very much a research tool that must be complemented by expert interpretation of the various solutions. Consequently, simulated annealing is slow in producing solutions, because in addition to computing time, it requires considerable human management to iteratively interpret outputs and modify inputs.
Moreover, simulated annealing only indirectly considers ex-pected co- and adjacent-channel interference effects on service received by consumers through minimum spacing parameters. Simulated annealing outputs must be run through an indepen-dent interference analysis, which then provides feedback for iterative simulated annealing runs, until a desired solution set
What the Plan says about: Analytical Methodologies
The Plan does not detail the methodologies that underpinned staff analysis.
Questions addressed in this chapter• What specific methodologies have been used to
estimate the amount of spectrum that may be repurposed?
• What are the relative benefits and limitations of each methodology?
• What methodologies and tools are at the FCC’s disposal moving forward?
1 2 F e d e r a l c O m m u n I c a T I O n s c O m m I s s I O n | W W W . B r O a d B a n d . G O V
O B I T e c h n I c a l P a P e r n O . 3
is found. This iterative process is time consuming and inef-ficient, as it does not allow the user of the simulated annealing model to understand the tradeoffs of any given “solution” until the separate interference analysis is complete.
The limitations of simulated annealing have generated an FCC initiative to create a new optimization application that can more quickly and comprehensively model the most ef-ficient channel allotments.
allotmeNt oPtimizatioN model (aom)In simplest terms, optimization models choose the best solu-tion from a set of available alternatives. With constrained optimization, those alternatives are limited by certain constraints, or cost functions, that need to be satisfied. As opti-mization science continues to evolve through use in operations research, economics, engineering and other purposes, applica-tions are now available that are better suited to the FCC’s needs than the simulation annealing method. FCC staff and con-tractors have been developing a new Allotment Optimization Model (AOM) to identify best solutions given inputted con-straints, which will allow greater ease of use and transparency (see Appendix C for a more detailed description of the AOM).
The model is still in a developmental alpha version and, in its current form, can perform optimizations based on a subset of the constraints that it should ultimately be able to consider. Notably, a future production version of the model will be able to incorporate protected service contours and calculated interfering contours. These contours are abstractions of actual coverage and interference and do not represent “household level” granularity. Actual coverage and interference calcula-tions approaching that level will most likely continue to be done separately from the AOM.
An illustrative case study demonstrates a potential applica-tion of this model once the production version is complete. In a case where the FCC has a clear objective of spectrum to re-allocate from broadcast TV, it could run the optimization model to clear the desired number of channels, all from UHF or from a combination of UHF and VHF, subject to a maximum acceptable threshold of service loss equivalent to that estab-lished during the DTV transition.36 The model would output the minimum number of channels that could be recovered and reassigned (e.g., through channel sharing and repacking) in order to achieve that objective under those constraints. The FCC could then, in this illustrative case, design the incentive auction and the Table of Allotments in an attempt to achieve the desired objective. Alternatively, the model might reveal that such a solution is not possible under the given constraints, in which case the FCC could either lower the objective or reevalu-ate the constraints.
One of the objectives of this paper is to be transparent about the development of this model—its assumptions, capabilities and limitations—to ensure that it ultimately serves as a useful tool to inform decisions in the upcoming rulemaking proceed-ing regarding reallocation of spectrum from broadcast TV bands. Once development of the model is complete, the FCC will make the necessary instructions, problem models and information about access to the data publicly available.
coVeraGe aNd serVice aNalysesWhen broadcast stations change transmission location or change the radiofrequency channel from which they transmit, the change may affect viewer reception of their signals. Both the physical propagation of a station’s signal pattern and the extent that co-channel and adjacent channel signals interfere with its signal determine whether a particular viewer will receive that station’s signal. (There are other factors as well, a principal one being the size, type and positioning of a viewer’s antenna.) To model propagation of broadcast television signals, the FCC relies on the Longley-Rice (LR) model.37 Coupled with data on population and terrain, FCC models can predict which population pockets will receive which broadcast signals. To model interference, a separate analytical program predicts how, and where, LR-modeled signals interfere with each other, and where this interference translates into service loss for the local population. With these current tools, the FCC can predict both how many households should receive service of a given station’s signals, considering coverage areas and interference on a station-by-station basis, and how many stations a given household should be able to receive.
If a station were to receive a new channel assignment or move the location of its transmission facilities, the current tools at the FCC’s disposal could estimate the impact on that station’s service area across multiple dimensions: the number of people who currently receive that station’s signal but would no longer be able to after the change (“gross service loss”); the number of people who currently cannot receive that station’s signal but would be able to after the change (“gross service gain”); and, the total number of people who receive a station’s signal after the change minus the total number who received it before the change (“net service gain (loss)”). In the case where a station solely changes channel assignment but does not move physical location of its transmission facilities, net service gain or loss generally is equivalent or close to gross service gain or loss.38
* * * Although the models and tools described in this section
reflect current optimization science, propagation prediction and service area calculations, they cannot replicate all of the
F e d e r a l c O m m u n I c a T I O n s c O m m I s s I O n | s P e c T r u m a n a l y s I s 1 3
O B I T e c h n I c a l P a P e r n O . 3
conditions and considerations of the real world. Furthermore, stations and consumers can employ many techniques to over-come predicted service area impacts, such as boosting power, repositioning antennas on towers and employing directional gain techniques (for stations), and repositioning or purchas-ing more capable antennas (for consumers). As a result, we may overestimate service area impacts with our coverage and interference analyses, but have purposefully chosen to be conservative.
1 4 F e d e r a l c O m m u n I c a T I O n s c O m m I s s I O n | W W W . B r O a d B a n d . G O V
O B I T e c h n I c a l P a P e r n O . 3
III. SCENARIO RESULTS To arrive at recommendations, we explored scenarios utilizing the analytical methodologies described in the previous chapter to size the impact and tradeoffs. The results outlined in the fol-lowing sections are preliminary, the first steps in what will be a continuing, transparent process with multiple opportunities for public input. The FCC will continue to refine the analy-ses in order to strike appropriate balances between various policy objectives.
We ran scenarios based on three complementary variables: collocation of transmission facilities, channel sharing and channel repacking.
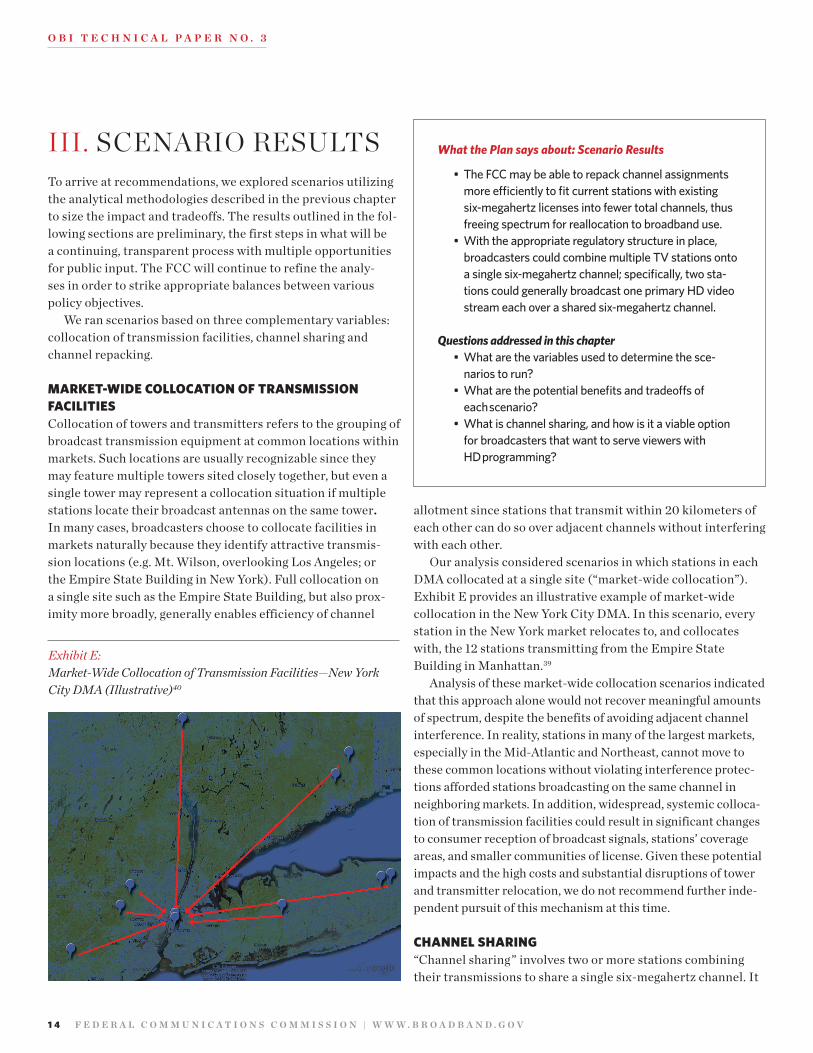
market-Wide collocatioN of traNsmissioN facilitiesCollocation of towers and transmitters refers to the grouping of broadcast transmission equipment at common locations within markets. Such locations are usually recognizable since they may feature multiple towers sited closely together, but even a single tower may represent a collocation situation if multiple stations locate their broadcast antennas on the same tower. In many cases, broadcasters choose to collocate facilities in markets naturally because they identify attractive transmis-sion locations (e.g. Mt. Wilson, overlooking Los Angeles; or the Empire State Building in New York). Full collocation on a single site such as the Empire State Building, but also prox-imity more broadly, generally enables efficiency of channel
allotment since stations that transmit within 20 kilometers of each other can do so over adjacent channels without interfering with each other.
Our analysis considered scenarios in which stations in each DMA collocated at a single site (“market-wide collocation”). Exhibit E provides an illustrative example of market-wide collocation in the New York City DMA. In this scenario, every station in the New York market relocates to, and collocates with, the 12 stations transmitting from the Empire State Building in Manhattan.39
Analysis of these market-wide collocation scenarios indicated that this approach alone would not recover meaningful amounts of spectrum, despite the benefits of avoiding adjacent channel interference. In reality, stations in many of the largest markets, especially in the Mid-Atlantic and Northeast, cannot move to these common locations without violating interference protec-tions afforded stations broadcasting on the same channel in neighboring markets. In addition, widespread, systemic colloca-tion of transmission facilities could result in significant changes to consumer reception of broadcast signals, stations’ coverage areas, and smaller communities of license. Given these potential impacts and the high costs and substantial disruptions of tower and transmitter relocation, we do not recommend further inde-pendent pursuit of this mechanism at this time.
chaNNel shariNG“Channel sharing” involves two or more stations combining their transmissions to share a single six-megahertz channel. It
What the Plan says about: Scenario Results
• The FCC may be able to repack channel assignments more efficiently to fit current stations with existing six-megahertz licenses into fewer total channels, thus freeing spectrum for reallocation to broadband use.
• With the appropriate regulatory structure in place, broadcasters could combine multiple TV stations onto a single six-megahertz channel; specifically, two sta-tions could generally broadcast one primary HD video stream each over a shared six-megahertz channel.
Questions addressed in this chapter• What are the variables used to determine the sce-
narios to run?• What are the potential benefits and tradeoffs of
each scenario? • What is channel sharing, and how is it a viable option
for broadcasters that want to serve viewers with HD programming?
Exhibit E: Market-Wide Collocation of Transmission Facilities—New York City DMA (Illustrative)40
F e d e r a l c O m m u n I c a T I O n s c O m m I s s I O n | s P e c T r u m a n a l y s I s 1 5
O B I T e c h n I c a l P a P e r n O . 3
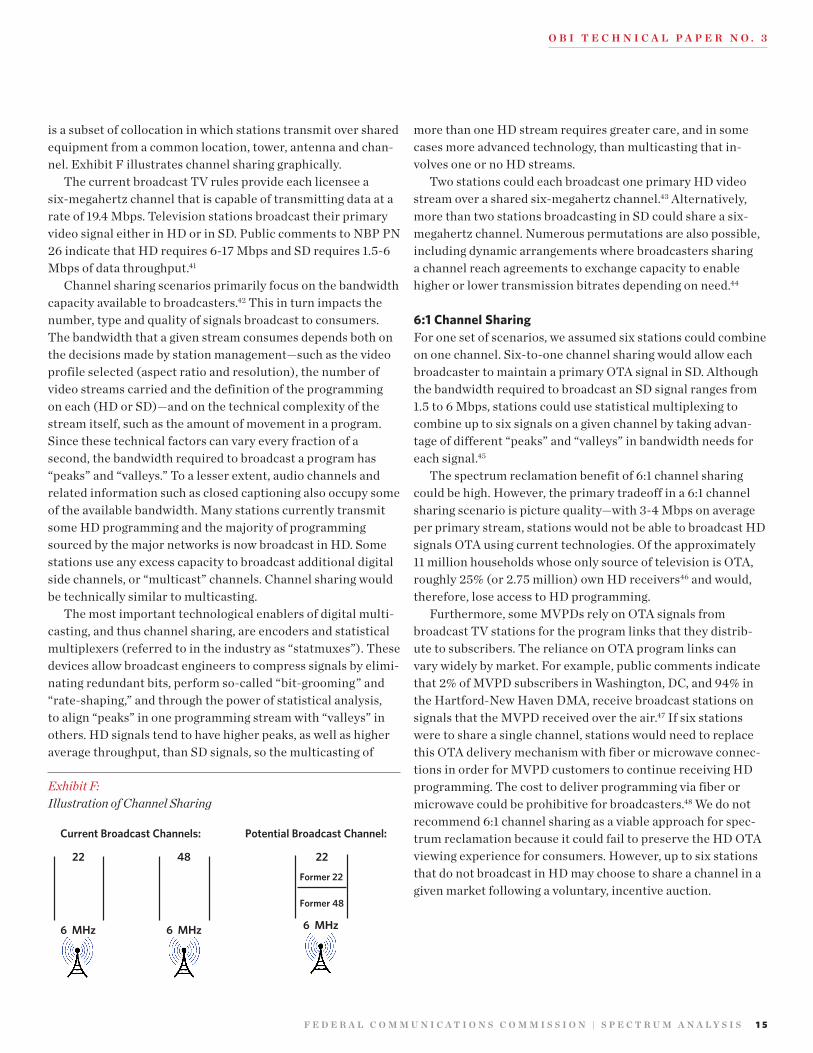
is a subset of collocation in which stations transmit over shared equipment from a common location, tower, antenna and chan-nel. Exhibit F illustrates channel sharing graphically.
The current broadcast TV rules provide each licensee a six-megahertz channel that is capable of transmitting data at a rate of 19.4 Mbps. Television stations broadcast their primary video signal either in HD or in SD. Public comments to NBP PN 26 indicate that HD requires 6-17 Mbps and SD requires 1.5-6 Mbps of data throughput.41
Channel sharing scenarios primarily focus on the bandwidth capacity available to broadcasters.42 This in turn impacts the number, type and quality of signals broadcast to consumers. The bandwidth that a given stream consumes depends both on the decisions made by station management—such as the video profile selected (aspect ratio and resolution), the number of video streams carried and the definition of the programming on each (HD or SD)—and on the technical complexity of the stream itself, such as the amount of movement in a program. Since these technical factors can vary every fraction of a second, the bandwidth required to broadcast a program has “peaks” and “valleys.” To a lesser extent, audio channels and related information such as closed captioning also occupy some of the available bandwidth. Many stations currently transmit some HD programming and the majority of programming sourced by the major networks is now broadcast in HD. Some stations use any excess capacity to broadcast additional digital side channels, or “multicast” channels. Channel sharing would be technically similar to multicasting.
The most important technological enablers of digital multi-casting, and thus channel sharing, are encoders and statistical multiplexers (referred to in the industry as “statmuxes”). These devices allow broadcast engineers to compress signals by elimi-nating redundant bits, perform so-called “bit-grooming” and “rate-shaping,” and through the power of statistical analysis, to align “peaks” in one programming stream with “valleys” in others. HD signals tend to have higher peaks, as well as higher average throughput, than SD signals, so the multicasting of
more than one HD stream requires greater care, and in some cases more advanced technology, than multicasting that in-volves one or no HD streams.
Two stations could each broadcast one primary HD video stream over a shared six-megahertz channel.43 Alternatively, more than two stations broadcasting in SD could share a six-megahertz channel. Numerous permutations are also possible, including dynamic arrangements where broadcasters sharing a channel reach agreements to exchange capacity to enable higher or lower transmission bitrates depending on need.44
6:1 Channel Sharing For one set of scenarios, we assumed six stations could combine on one channel. Six-to-one channel sharing would allow each broadcaster to maintain a primary OTA signal in SD. Although the bandwidth required to broadcast an SD signal ranges from 1.5 to 6 Mbps, stations could use statistical multiplexing to combine up to six signals on a given channel by taking advan-tage of different “peaks” and “valleys” in bandwidth needs for each signal.45
The spectrum reclamation benefit of 6:1 channel sharing could be high. However, the primary tradeoff in a 6:1 channel sharing scenario is picture quality—with 3-4 Mbps on average per primary stream, stations would not be able to broadcast HD signals OTA using current technologies. Of the approximately 11 million households whose only source of television is OTA, roughly 25% (or 2.75 million) own HD receivers46 and would, therefore, lose access to HD programming.
Furthermore, some MVPDs rely on OTA signals from broadcast TV stations for the program links that they distrib-ute to subscribers. The reliance on OTA program links can vary widely by market. For example, public comments indicate that 2% of MVPD subscribers in Washington, DC, and 94% in the Hartford-New Haven DMA, receive broadcast stations on signals that the MVPD received over the air.47 If six stations were to share a single channel, stations would need to replace this OTA delivery mechanism with fiber or microwave connec-tions in order for MVPD customers to continue receiving HD programming. The cost to deliver programming via fiber or microwave could be prohibitive for broadcasters.48 We do not recommend 6:1 channel sharing as a viable approach for spec-trum reclamation because it could fail to preserve the HD OTA viewing experience for consumers. However, up to six stations that do not broadcast in HD may choose to share a channel in a given market following a voluntary, incentive auction.
Current Broadcast Channels:
6 MHz
22
6 MHz
22
Former 22
Former 48
6 MHz
48
Potential Broadcast Channel:
Exhibit F: Illustration of Channel Sharing
1 6 F e d e r a l c O m m u n I c a T I O n s c O m m I s s I O n | W W W . B r O a d B a n d . G O V
O B I T e c h n I c a l P a P e r n O . 3
2:1 Channel Sharing We developed another set of channel sharing scenarios to estimate the impact on spectrum reclamation, consumers and broadcasters if pairs of stations were to share single six-mega-hertz channels in select markets. Such sharing can produce spectrum efficiency benefits while allowing transmission of HD programming (see “Viability of Channel Sharing for High Definition Programming,” in this section). This assumption is important because consumer demand for HD televisions and programming is growing rapidly, and broadcasters have indi-cated that the ability to broadcast in HD OTA is critical to their business models.49
Using simulated annealing to model 2:1 channel sharing, we assumed that two stations would share a channel at pre-determined clusters throughout the country. In the remaining markets, all stations were modeled to be collocated at a single transmission site within a given market—although we were not interested in pursuing DMA-wide collocation per se, this approach was helpful to simplify the annealing. While models based on simulated annealing suggest generally that spectrum can be reallocated from broadcast TV, a simulated annealing approach has not yet found an illustrative solution that we con-sider viable based on impact to service areas. First, simulated annealing does not enable a minimization of channel reassign-ments, and generally produces more such frequency changes than would actually be required. Additionally, its iterative na-ture translates into slow generation of solution sets. The effort has reinforced the drive towards completing the development of the new Allotment Optimization Model (AOM).
The alpha version of the AOM was run assuming that two stations could pair up to share a single transmitter and six-megahertz channel if their current transmitters are located within five kilometers of each other. We chose five kilometers as the maximum separation to minimize the potential impact to service areas of stations relocating in order to share chan-nels. This limitation would not necessarily apply to channel sharing opportunities arising from a voluntary incentive auction. Three separate scenarios were run: the first included only stations in the contiguous U.S. (the “Without Border Restrictions” scenario).50 The other two scenarios factored in the impact of channel restrictions based on agreements with Canada and Mexico to protect stations’ signals on their side of the border. One of these scenarios included all channel allot-ments in Canada and Mexico (the “With Border Restrictions” scenario), and the other only factored in currently used chan-nel allotments in those countries (the “Active Allotments” scenario). Approximately two-thirds of channel allotments in Canada are not currently occupied by active stations. As part of the effort to reallocate spectrum from broadcast TV to broad-band use, the FCC should collaborate with Canada and Mexico
to seek solutions that enable more efficient allotments across all countries (see Chapter V, Coordination in the U.S.-Canada and U.S.-Mexico Border Areas).
Channel sharing scenarios using the alpha version of the AOM generated channel lineups that would recover 60–120 megahertz, depending on the inclusion or exclusion of border restrictions (see Exhibit G for results). Three factors make the output for each scenario more conservative. First, we placed a five kilometer restriction on channel sharing. We cannot pre-dict ahead of time how far a station may be willing to relocate as part of a voluntary incentive auction, but we chose to be conservative to minimize impact on service area from reloca-tion. Second, we assumed that all stations that are currently broadcasting OTA would continue to do so. Third, we did not allow stations with current channel assignments in the UHF bands to move to the VHF bands or to share channels with VHF stations, or vice versa. Future versions of the AOM will enable such movement and channel sharing activity, and will allow the FCC to run scenarios with objectives to recover just UHF spectrum or both UHF and VHF spectrum.
The results of these scenarios were run through the exist-ing FCC interference model. Exhibit G illustrates the service impact of these scenarios. In the service analysis below, “gross” gain or loss refers to the number of people who are predicted to gain or lose a station’s signal by virtue of a channel change or station relocation; net gain or loss refers to the number of people who receive a station’s signal after a channel change or station relocation minus the number who received it previously (see Appendix E for more detail on these and other terms).
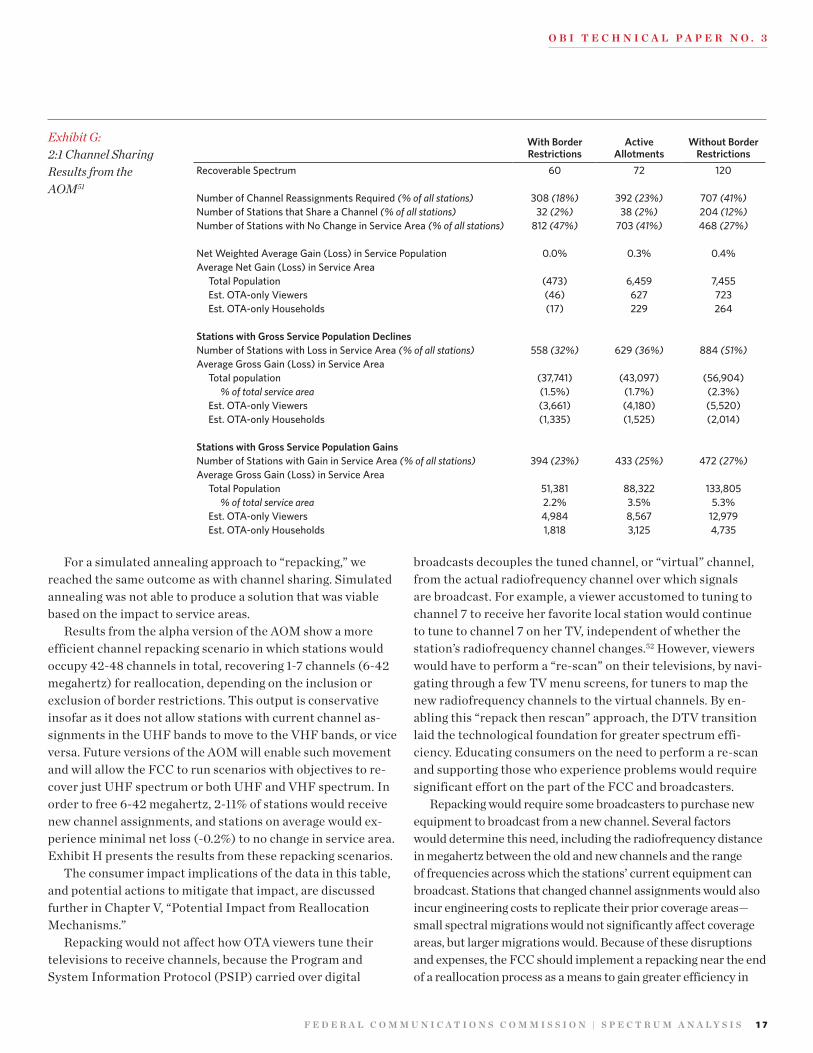
In order to clear 60–120 megahertz of contiguous spectrum, 2–12% of stations would need to share channels voluntarily, 18–41% of stations would receive channel reassignments, and stations on average would experience a net gain in service area of 0.0–0.4%.
The consumer impact implications of the data in this exhibit, and potential actions to mitigate that impact, are discussed in Chapter V, “Potential Impact from Reallocation Mechanisms.”
chaNNel rePackiNGIndependent of any actions to enable channel sharing, the FCC may be able to “repack” channel assignments to fit current stations with existing six-megahertz licenses into fewer total channels, thus recovering spectrum for reallocation to broad-band use. Channel repacking could result in reduced distance spacing between some stations on adjacent and the same chan-nels. Reducing the spacing between stations would increase the potential for interference, resulting in a possible loss of service for some viewers or increased cost for interference mitigation. The FCC would need to balance such costs against the benefits of additional spectrum for broadband use.
F e d e r a l c O m m u n I c a T I O n s c O m m I s s I O n | s P e c T r u m a n a l y s I s 1 7
O B I T e c h n I c a l P a P e r n O . 3
For a simulated annealing approach to “repacking,” we reached the same outcome as with channel sharing. Simulated annealing was not able to produce a solution that was viable based on the impact to service areas.
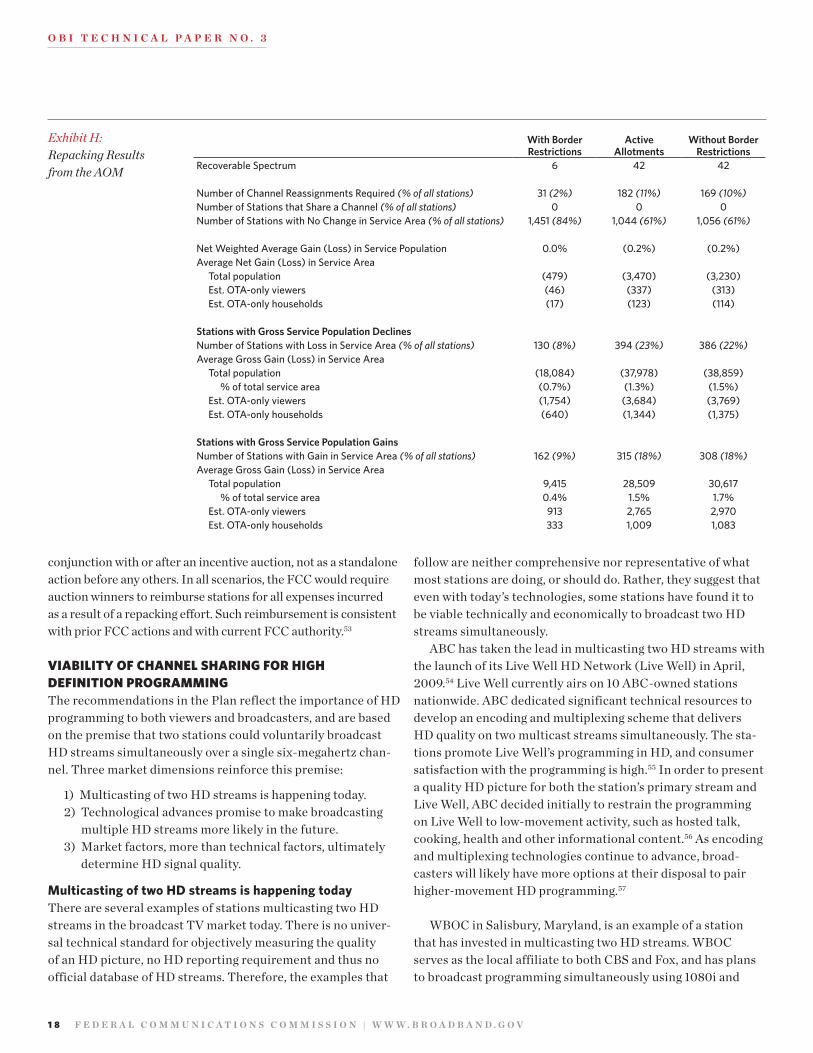
Results from the alpha version of the AOM show a more efficient channel repacking scenario in which stations would occupy 42-48 channels in total, recovering 1-7 channels (6-42 megahertz) for reallocation, depending on the inclusion or exclusion of border restrictions. This output is conservative insofar as it does not allow stations with current channel as-signments in the UHF bands to move to the VHF bands, or vice versa. Future versions of the AOM will enable such movement and will allow the FCC to run scenarios with objectives to re-cover just UHF spectrum or both UHF and VHF spectrum. In order to free 6-42 megahertz, 2-11% of stations would receive new channel assignments, and stations on average would ex-perience minimal net loss (-0.2%) to no change in service area. Exhibit H presents the results from these repacking scenarios.
The consumer impact implications of the data in this table, and potential actions to mitigate that impact, are discussed further in Chapter V, “Potential Impact from Reallocation Mechanisms.”
Repacking would not affect how OTA viewers tune their televisions to receive channels, because the Program and System Information Protocol (PSIP) carried over digital
broadcasts decouples the tuned channel, or “virtual” channel, from the actual radiofrequency channel over which signals are broadcast. For example, a viewer accustomed to tuning to channel 7 to receive her favorite local station would continue to tune to channel 7 on her TV, independent of whether the station’s radiofrequency channel changes.52 However, viewers would have to perform a “re-scan” on their televisions, by navi-gating through a few TV menu screens, for tuners to map the new radiofrequency channels to the virtual channels. By en-abling this “repack then rescan” approach, the DTV transition laid the technological foundation for greater spectrum effi-ciency. Educating consumers on the need to perform a re-scan and supporting those who experience problems would require significant effort on the part of the FCC and broadcasters.
Repacking would require some broadcasters to purchase new equipment to broadcast from a new channel. Several factors would determine this need, including the radiofrequency distance in megahertz between the old and new channels and the range of frequencies across which the stations’ current equipment can broadcast. Stations that changed channel assignments would also incur engineering costs to replicate their prior coverage areas—small spectral migrations would not significantly affect coverage areas, but larger migrations would. Because of these disruptions and expenses, the FCC should implement a repacking near the end of a reallocation process as a means to gain greater efficiency in
Exhibit G: 2:1 Channel Sharing Results from the AOM51
With Border Restrictions
Active Allotments
Without Border Restrictions
Recoverable Spectrum 60 72 120
Number of Channel Reassignments Required (% of all stations) 308 (18%) 392 (23%) 707 (41%)Number of Stations that Share a Channel (% of all stations) 32 (2%) 38 (2%) 204 (12%)Number of Stations with No Change in Service Area (% of all stations) 812 (47%) 703 (41%) 468 (27%)
Net Weighted Average Gain (Loss) in Service Population 0.0% 0.3% 0.4%Average Net Gain (Loss) in Service Area
Total Population (473) 6,459 7,455 Est. OTA-only Viewers (46) 627 723 Est. OTA-only Households (17) 229 264
Stations with Gross Service Population DeclinesNumber of Stations with Loss in Service Area (% of all stations) 558 (32%) 629 (36%) 884 (51%)Average Gross Gain (Loss) in Service Area
Total population (37,741) (43,097) (56,904)% of total service area (1.5%) (1.7%) (2.3%)
Est. OTA-only Viewers (3,661) (4,180) (5,520)Est. OTA-only Households (1,335) (1,525) (2,014)
Stations with Gross Service Population GainsNumber of Stations with Gain in Service Area (% of all stations) 394 (23%) 433 (25%) 472 (27%)Average Gross Gain (Loss) in Service Area
Total Population 51,381 88,322 133,805% of total service area 2.2% 3.5% 5.3%
Est. OTA-only Viewers 4,984 8,567 12,979Est. OTA-only Households 1,818 3,125 4,735
1 8 F e d e r a l c O m m u n I c a T I O n s c O m m I s s I O n | W W W . B r O a d B a n d . G O V
O B I T e c h n I c a l P a P e r n O . 3
conjunction with or after an incentive auction, not as a standalone action before any others. In all scenarios, the FCC would require auction winners to reimburse stations for all expenses incurred as a result of a repacking effort. Such reimbursement is consistent with prior FCC actions and with current FCC authority.53
Viability of chaNNel shariNG for hiGh defiNitioN ProGrammiNG The recommendations in the Plan reflect the importance of HD programming to both viewers and broadcasters, and are based on the premise that two stations could voluntarily broadcast HD streams simultaneously over a single six-megahertz chan-nel. Three market dimensions reinforce this premise:
1) Multicasting of two HD streams is happening today. 2) Technological advances promise to make broadcasting
multiple HD streams more likely in the future. 3) Market factors, more than technical factors, ultimately
determine HD signal quality.
Multicasting of two HD streams is happening todayThere are several examples of stations multicasting two HD streams in the broadcast TV market today. There is no univer-sal technical standard for objectively measuring the quality of an HD picture, no HD reporting requirement and thus no official database of HD streams. Therefore, the examples that
follow are neither comprehensive nor representative of what most stations are doing, or should do. Rather, they suggest that even with today’s technologies, some stations have found it to be viable technically and economically to broadcast two HD streams simultaneously.
ABC has taken the lead in multicasting two HD streams with the launch of its Live Well HD Network (Live Well) in April, 2009.54 Live Well currently airs on 10 ABC-owned stations nationwide. ABC dedicated significant technical resources to develop an encoding and multiplexing scheme that delivers HD quality on two multicast streams simultaneously. The sta-tions promote Live Well’s programming in HD, and consumer satisfaction with the programming is high.55 In order to present a quality HD picture for both the station’s primary stream and Live Well, ABC decided initially to restrain the programming on Live Well to low-movement activity, such as hosted talk, cooking, health and other informational content.56 As encoding and multiplexing technologies continue to advance, broad-casters will likely have more options at their disposal to pair higher-movement HD programming.57
WBOC in Salisbury, Maryland, is an example of a station that has invested in multicasting two HD streams. WBOC serves as the local affiliate to both CBS and Fox, and has plans to broadcast programming simultaneously using 1080i and
Exhibit H: Repacking Results from the AOM
With Border Restrictions
Active Allotments
Without Border Restrictions
Recoverable Spectrum 6 42 42
Number of Channel Reassignments Required (% of all stations) 31 (2%) 182 (11%) 169 (10%)Number of Stations that Share a Channel (% of all stations) 0 0 0Number of Stations with No Change in Service Area (% of all stations) 1,451 (84%) 1,044 (61%) 1,056 (61%)
Net Weighted Average Gain (Loss) in Service Population 0.0% (0.2%) (0.2%)Average Net Gain (Loss) in Service Area
Total population (479) (3,470) (3,230)Est. OTA-only viewers (46) (337) (313)Est. OTA-only households (17) (123) (114)
Stations with Gross Service Population DeclinesNumber of Stations with Loss in Service Area (% of all stations) 130 (8%) 394 (23%) 386 (22%)Average Gross Gain (Loss) in Service Area
Total population (18,084) (37,978) (38,859)% of total service area (0.7%) (1.3%) (1.5%)
Est. OTA-only viewers (1,754) (3,684) (3,769)Est. OTA-only households (640) (1,344) (1,375)
Stations with Gross Service Population GainsNumber of Stations with Gain in Service Area (% of all stations) 162 (9%) 315 (18%) 308 (18%)Average Gross Gain (Loss) in Service Area
Total population 9,415 28,509 30,617% of total service area 0.4% 1.5% 1.7%
Est. OTA-only viewers 913 2,765 2,970Est. OTA-only households 333 1,009 1,083
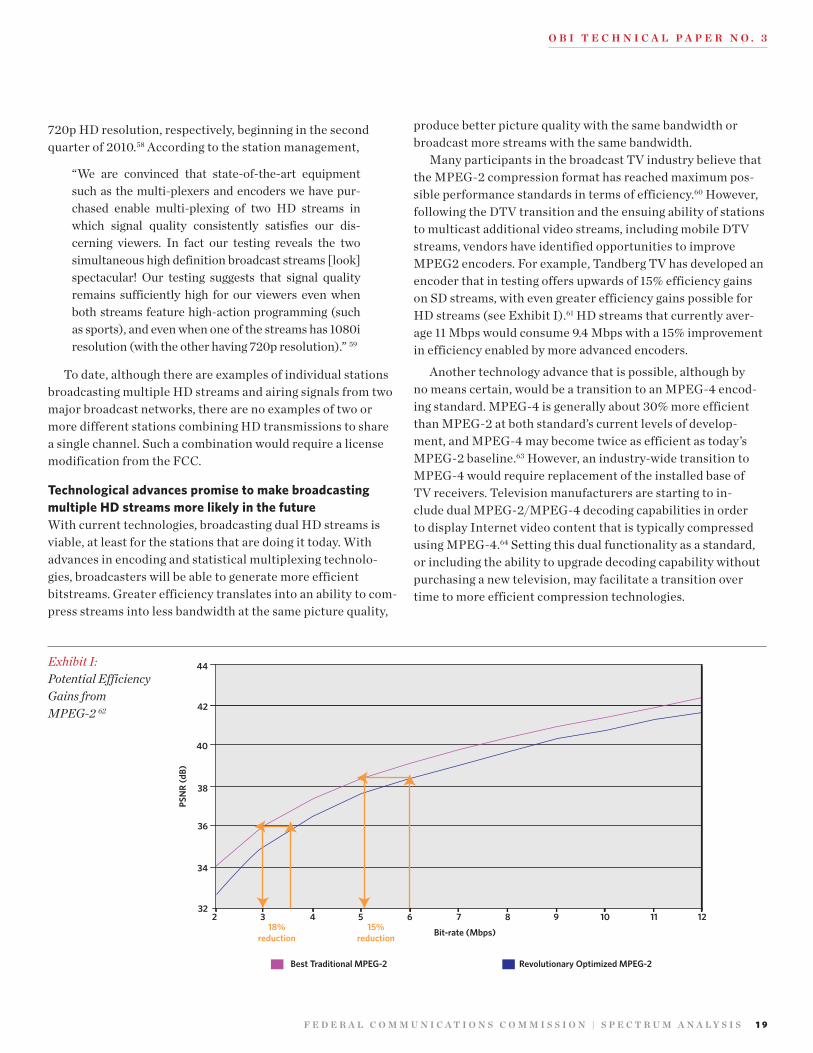
F e d e r a l c O m m u n I c a T I O n s c O m m I s s I O n | s P e c T r u m a n a l y s I s 1 9
O B I T e c h n I c a l P a P e r n O . 3
720p HD resolution, respectively, beginning in the second quarter of 2010.58 According to the station management,
“We are convinced that state-of-the-art equipment such as the multi-plexers and encoders we have pur-chased enable multi-plexing of two HD streams in which signal quality consistently satisfies our dis-cerning viewers. In fact our testing reveals the two simultaneous high definition broadcast streams [look] spectacular! Our testing suggests that signal quality remains sufficiently high for our viewers even when both streams feature high-action programming (such as sports), and even when one of the streams has 1080i resolution (with the other having 720p resolution).” 59
To date, although there are examples of individual stations broadcasting multiple HD streams and airing signals from two major broadcast networks, there are no examples of two or more different stations combining HD transmissions to share a single channel. Such a combination would require a license modification from the FCC.
Technological advances promise to make broadcasting multiple HD streams more likely in the futureWith current technologies, broadcasting dual HD streams is viable, at least for the stations that are doing it today. With advances in encoding and statistical multiplexing technolo-gies, broadcasters will be able to generate more efficient bitstreams. Greater efficiency translates into an ability to com-press streams into less bandwidth at the same picture quality,
produce better picture quality with the same bandwidth or broadcast more streams with the same bandwidth.
Many participants in the broadcast TV industry believe that the MPEG-2 compression format has reached maximum pos-sible performance standards in terms of efficiency.60 However, following the DTV transition and the ensuing ability of stations to multicast additional video streams, including mobile DTV streams, vendors have identified opportunities to improve MPEG2 encoders. For example, Tandberg TV has developed an encoder that in testing offers upwards of 15% efficiency gains on SD streams, with even greater efficiency gains possible for HD streams (see Exhibit I).61 HD streams that currently aver-age 11 Mbps would consume 9.4 Mbps with a 15% improvement in efficiency enabled by more advanced encoders.
Another technology advance that is possible, although by no means certain, would be a transition to an MPEG-4 encod-ing standard. MPEG-4 is generally about 30% more efficient than MPEG-2 at both standard’s current levels of develop-ment, and MPEG-4 may become twice as efficient as today’s MPEG-2 baseline.63 However, an industry-wide transition to MPEG-4 would require replacement of the installed base of TV receivers. Television manufacturers are starting to in-clude dual MPEG-2/MPEG-4 decoding capabilities in order to display Internet video content that is typically compressed using MPEG-4.64 Setting this dual functionality as a standard, or including the ability to upgrade decoding capability without purchasing a new television, may facilitate a transition over time to more efficient compression technologies.
Exhibit I: Potential Efficiency Gains from MPEG-2 62 42
40
38
36
34
322 3 4 5 6 7 8 9 10 11 12
44
Bit-rate (Mbps)
Best Traditional MPEG-2
PSN
R (d
B)
Revolutionary Optimized MPEG-2
18%reduction
15%reduction
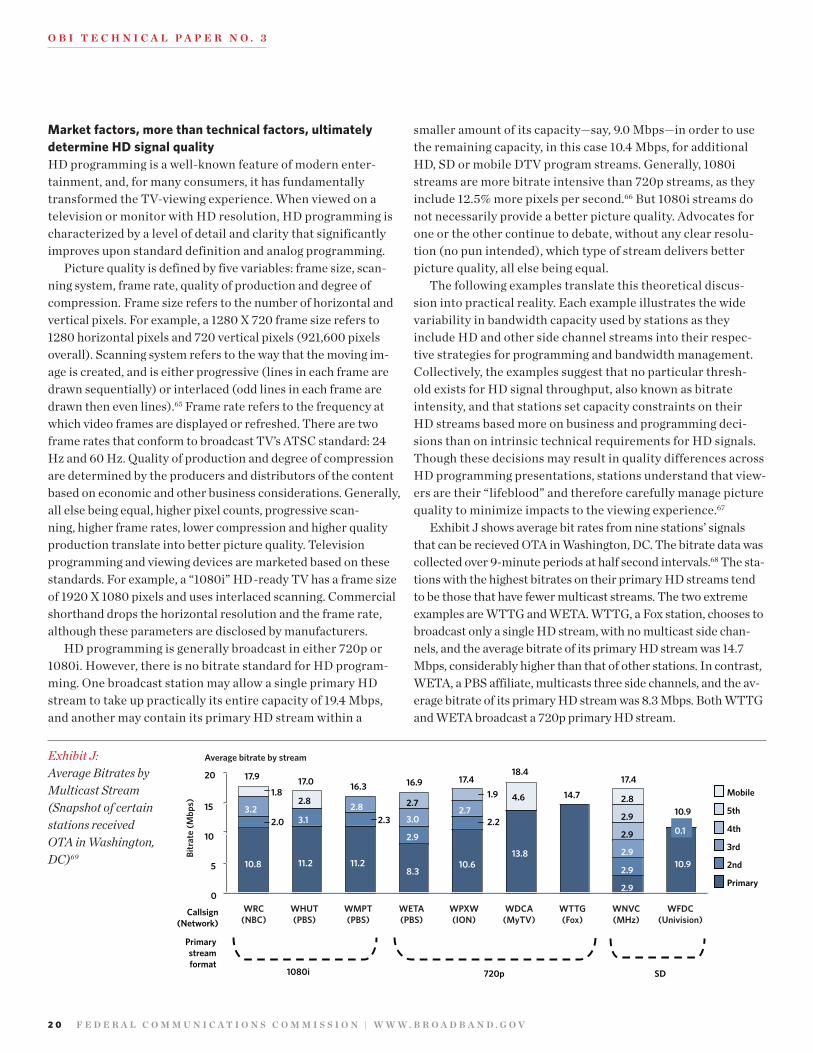
2 0 F e d e r a l c O m m u n I c a T I O n s c O m m I s s I O n | W W W . B r O a d B a n d . G O V
O B I T e c h n I c a l P a P e r n O . 3
Market factors, more than technical factors, ultimately determine HD signal qualityHD programming is a well-known feature of modern enter-tainment, and, for many consumers, it has fundamentally transformed the TV-viewing experience. When viewed on a television or monitor with HD resolution, HD programming is characterized by a level of detail and clarity that significantly improves upon standard definition and analog programming.
Picture quality is defined by five variables: frame size, scan-ning system, frame rate, quality of production and degree of compression. Frame size refers to the number of horizontal and vertical pixels. For example, a 1280 X 720 frame size refers to 1280 horizontal pixels and 720 vertical pixels (921,600 pixels overall). Scanning system refers to the way that the moving im-age is created, and is either progressive (lines in each frame are drawn sequentially) or interlaced (odd lines in each frame are drawn then even lines).65 Frame rate refers to the frequency at which video frames are displayed or refreshed. There are two frame rates that conform to broadcast TV’s ATSC standard: 24 Hz and 60 Hz. Quality of production and degree of compression are determined by the producers and distributors of the content based on economic and other business considerations. Generally, all else being equal, higher pixel counts, progressive scan-ning, higher frame rates, lower compression and higher quality production translate into better picture quality. Television programming and viewing devices are marketed based on these standards. For example, a “1080i” HD-ready TV has a frame size of 1920 X 1080 pixels and uses interlaced scanning. Commercial shorthand drops the horizontal resolution and the frame rate, although these parameters are disclosed by manufacturers.
HD programming is generally broadcast in either 720p or 1080i. However, there is no bitrate standard for HD program-ming. One broadcast station may allow a single primary HD stream to take up practically its entire capacity of 19.4 Mbps, and another may contain its primary HD stream within a
smaller amount of its capacity—say, 9.0 Mbps—in order to use the remaining capacity, in this case 10.4 Mbps, for additional HD, SD or mobile DTV program streams. Generally, 1080i streams are more bitrate intensive than 720p streams, as they include 12.5% more pixels per second.66 But 1080i streams do not necessarily provide a better picture quality. Advocates for one or the other continue to debate, without any clear resolu-tion (no pun intended), which type of stream delivers better picture quality, all else being equal.
The following examples translate this theoretical discus-sion into practical reality. Each example illustrates the wide variability in bandwidth capacity used by stations as they include HD and other side channel streams into their respec-tive strategies for programming and bandwidth management. Collectively, the examples suggest that no particular thresh-old exists for HD signal throughput, also known as bitrate intensity, and that stations set capacity constraints on their HD streams based more on business and programming deci-sions than on intrinsic technical requirements for HD signals. Though these decisions may result in quality differences across HD programming presentations, stations understand that view-ers are their “lifeblood” and therefore carefully manage picture quality to minimize impacts to the viewing experience.67
Exhibit J shows average bit rates from nine stations’ signals that can be recieved OTA in Washington, DC. The bitrate data was collected over 9-minute periods at half second intervals.68 The sta-tions with the highest bitrates on their primary HD streams tend to be those that have fewer multicast streams. The two extreme examples are WTTG and WETA. WTTG, a Fox station, chooses to broadcast only a single HD stream, with no multicast side chan-nels, and the average bitrate of its primary HD stream was 14.7 Mbps, considerably higher than that of other stations. In contrast, WETA, a PBS affiliate, multicasts three side channels, and the av-erage bitrate of its primary HD stream was 8.3 Mbps. Both WTTG and WETA broadcast a 720p primary HD stream.
14.7
2.0 2.3
1.8
0
5
10
15
20
Primary
2nd
3rd
4th
5th
Mobile
Callsign(Network)
Primarystreamformat
1080i 720p SD
Average bitrate by stream
Bitr
ate
(Mbp
s)
WRC(NBC)
WHUT(PBS)
WMPT(PBS)
WETA(PBS)
WPXW(ION)
WDCA(MyTV)
WTTG(Fox)
WNVC(MHz)
WFDC(Univision)
2.9
2.9
2.8
17.4
2.9
2.9
2.9
4.6
18.4
13.8
2.7
10.6
17.4
2.7
16.9
3.0
2.9
8.3
2.8
11.2
16.32.8
3.1
11.2
17.017.9
10.8
3.22.2
1.9
0.1
10.9
10.9
Exhibit J: Average Bitrates by Multicast Stream (Snapshot of certain stations received OTA in Washington, DC)69
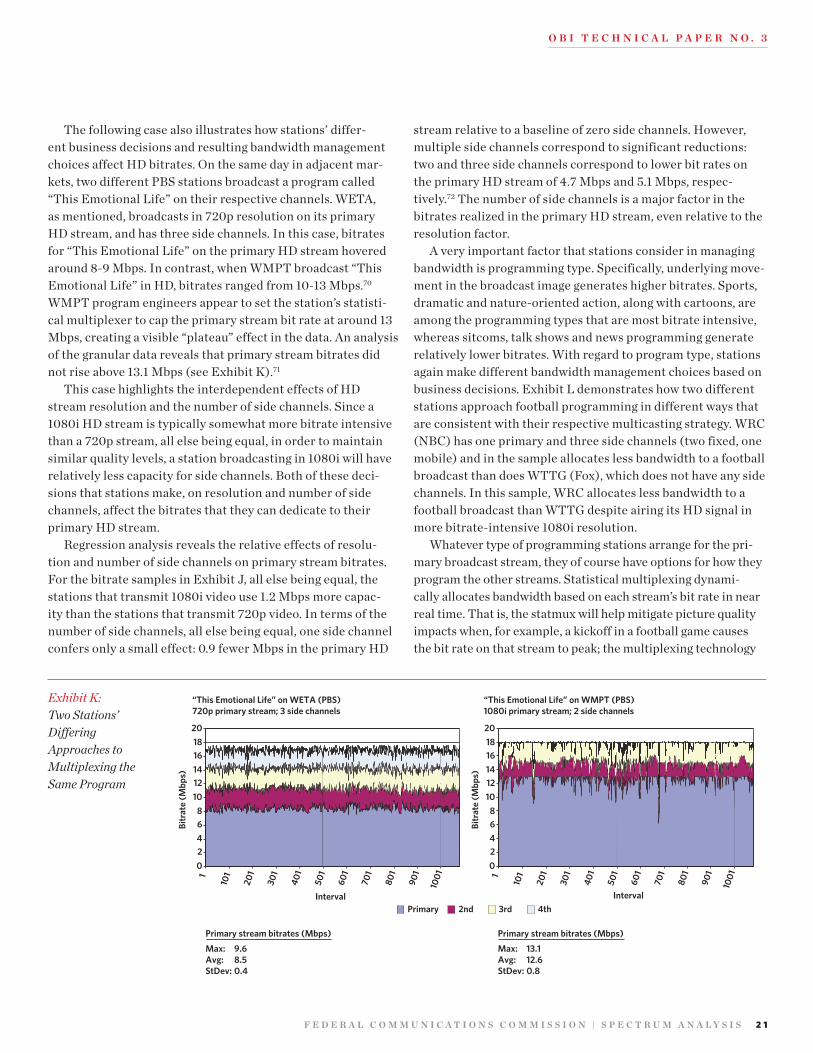
F e d e r a l c O m m u n I c a T I O n s c O m m I s s I O n | s P e c T r u m a n a l y s I s 2 1
O B I T e c h n I c a l P a P e r n O . 3
The following case also illustrates how stations’ differ-ent business decisions and resulting bandwidth management choices affect HD bitrates. On the same day in adjacent mar-kets, two different PBS stations broadcast a program called “This Emotional Life” on their respective channels. WETA, as mentioned, broadcasts in 720p resolution on its primary HD stream, and has three side channels. In this case, bitrates for “This Emotional Life” on the primary HD stream hovered around 8-9 Mbps. In contrast, when WMPT broadcast “This Emotional Life” in HD, bitrates ranged from 10-13 Mbps.70 WMPT program engineers appear to set the station’s statisti-cal multiplexer to cap the primary stream bit rate at around 13 Mbps, creating a visible “plateau” effect in the data. An analysis of the granular data reveals that primary stream bitrates did not rise above 13.1 Mbps (see Exhibit K).71
This case highlights the interdependent effects of HD stream resolution and the number of side channels. Since a 1080i HD stream is typically somewhat more bitrate intensive than a 720p stream, all else being equal, in order to maintain similar quality levels, a station broadcasting in 1080i will have relatively less capacity for side channels. Both of these deci-sions that stations make, on resolution and number of side channels, affect the bitrates that they can dedicate to their primary HD stream.
Regression analysis reveals the relative effects of resolu-tion and number of side channels on primary stream bitrates. For the bitrate samples in Exhibit J, all else being equal, the stations that transmit 1080i video use 1.2 Mbps more capac-ity than the stations that transmit 720p video. In terms of the number of side channels, all else being equal, one side channel confers only a small effect: 0.9 fewer Mbps in the primary HD
stream relative to a baseline of zero side channels. However, multiple side channels correspond to significant reductions: two and three side channels correspond to lower bit rates on the primary HD stream of 4.7 Mbps and 5.1 Mbps, respec-tively.72 The number of side channels is a major factor in the bitrates realized in the primary HD stream, even relative to the resolution factor.
A very important factor that stations consider in managing bandwidth is programming type. Specifically, underlying move-ment in the broadcast image generates higher bitrates. Sports, dramatic and nature-oriented action, along with cartoons, are among the programming types that are most bitrate intensive, whereas sitcoms, talk shows and news programming generate relatively lower bitrates. With regard to program type, stations again make different bandwidth management choices based on business decisions. Exhibit L demonstrates how two different stations approach football programming in different ways that are consistent with their respective multicasting strategy. WRC (NBC) has one primary and three side channels (two fixed, one mobile) and in the sample allocates less bandwidth to a football broadcast than does WTTG (Fox), which does not have any side channels. In this sample, WRC allocates less bandwidth to a football broadcast than WTTG despite airing its HD signal in more bitrate-intensive 1080i resolution.
Whatever type of programming stations arrange for the pri-mary broadcast stream, they of course have options for how they program the other streams. Statistical multiplexing dynami-cally allocates bandwidth based on each stream’s bit rate in near real time. That is, the statmux will help mitigate picture quality impacts when, for example, a kickoff in a football game causes the bit rate on that stream to peak; the multiplexing technology
Exhibit K: Two Stations’ Differing Approaches to Multiplexing the Same Program
02468
101214161820
1
101
201
301
401
501
601
701
801
901
1001
Interval
Bitr
ate
(Mbp
s)
02468
101214161820
1
101
201
301
401
501
601
701
801
901
1001
Bitr
ate
(Mbp
s)
IntervalPrimary 3rd 4th2nd
“This Emotional Life” on WETA (PBS)720p primary stream; 3 side channels
“This Emotional Life” on WMPT (PBS)1080i primary stream; 2 side channels
Primary stream bitrates (Mbps)
Max: 9.6Avg: 8.5StDev: 0.4
Primary stream bitrates (Mbps)
Max: 13.1Avg: 12.6StDev: 0.8
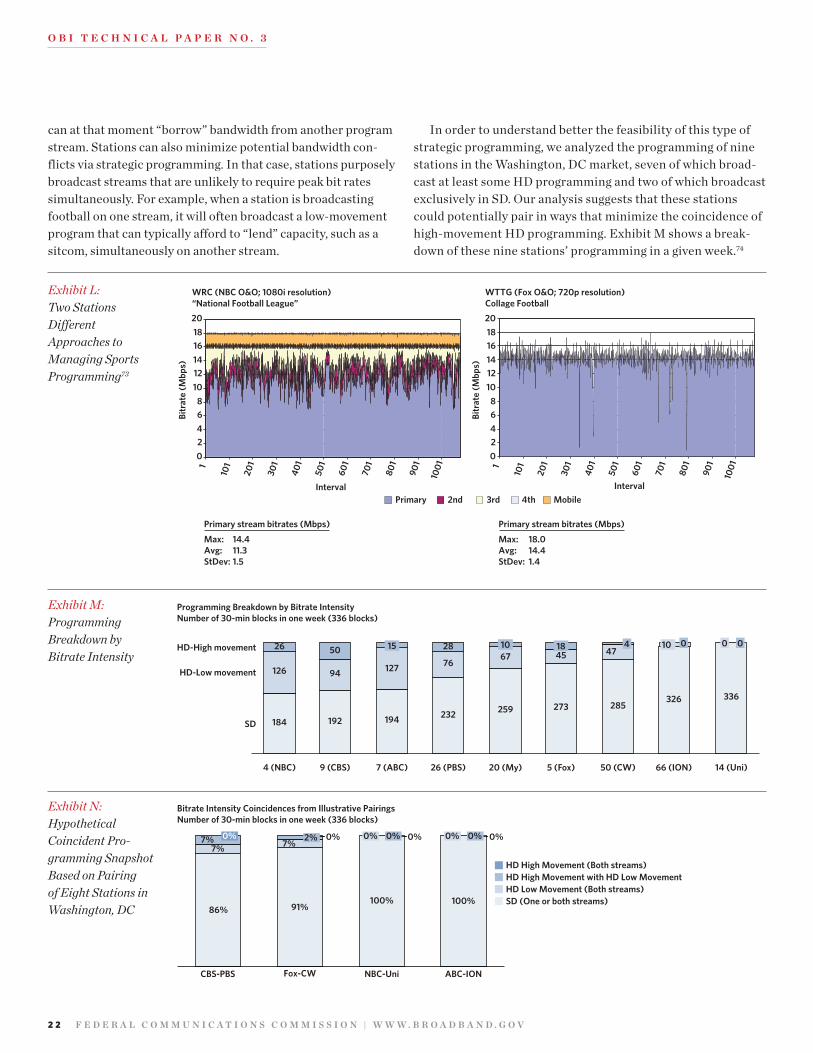
2 2 F e d e r a l c O m m u n I c a T I O n s c O m m I s s I O n | W W W . B r O a d B a n d . G O V
O B I T e c h n I c a l P a P e r n O . 3
can at that moment “borrow” bandwidth from another program stream. Stations can also minimize potential bandwidth con-flicts via strategic programming. In that case, stations purposely broadcast streams that are unlikely to require peak bit rates simultaneously. For example, when a station is broadcasting football on one stream, it will often broadcast a low-movement program that can typically afford to “lend” capacity, such as a sitcom, simultaneously on another stream.
In order to understand better the feasibility of this type of strategic programming, we analyzed the programming of nine stations in the Washington, DC market, seven of which broad-cast at least some HD programming and two of which broadcast exclusively in SD. Our analysis suggests that these stations could potentially pair in ways that minimize the coincidence of high-movement HD programming. Exhibit M shows a break-down of these nine stations’ programming in a given week.74
Exhibit N: Hypothetical Coincident Pro-gramming Snapshot Based on Pairing of Eight Stations in Washington, DC
Exhibit M: Programming Breakdown by Bitrate Intensity
4 (NBC) 9 (CBS) 7 (ABC) 26 (PBS) 66 (ION)20 (My) 5 (Fox) 50 (CW) 14 (Uni)
326285273259232194192184
336
6776127126
4745
94
26 2850
SD
0 010 041815 10
• Stations’ HD programming ranged from 152 half-hour blocks (46%; NBC) to none (Univision)•Of stations with HD programs, “high movement” HD ranged from 4-50 half-hour blocks (2-25 hrs); average of 19 blocks (9.5 hrs)a
Notes: Wednesday, Dec. 9 – Tuesday, Dec 15, 2009. Programming information including HD/SD classification from zap2it.comPrimary signal programming only (no side channel programming)
HD-Low movement
HD-High movement
Programming Breakdown by Bitrate IntensityNumber of 30-min blocks in one week (336 blocks)
l In two station pairs, HD programs never coincided with other HD programsl In the station pair with the most coincident HD programming (CBS-PBS), coincidence occurred in 46 half-hour blocks
• Two low-movement programs coincided in just over half (24/46) of these block• High- and low-movement programs coincided in just under half (22/46)• Two high-movement programs never coincided
l Strategic pairing based on programming matches complementary bandwidth utilization
l Statmux technology dynamically aligns intra-program bitrate peaks and valleys
Notes: l Wednesday, Dec. 9 – Tuesday, Dec 15, 2009. Programming information including HD/SD classification from zap2it.coml Primary signal programming only (no side channel programming)
0%0%0%
NBC-Uni ABC-IONCBS-PBS
86% 91%100%
7% 7%7% 0%0% 0%
Fox-CW
0% 0%2%
100%
Bitrate Intensity Coincidences from Illustrative PairingsNumber of 30-min blocks in one week (336 blocks)
HD High Movement (Both streams)HD High Movement with HD Low MovementHD Low Movement (Both streams)SD (One or both streams)
02468
101214161820
1
101
201
301
401
501
601
701
801
901
1001
IntervalPrimary 3rd 4th Mobile
Bitr
ate
(Mbp
s)
02468
101214161820
1
101
201
301
401
501
601
701
801
901
1001
Bitr
ate
(Mbp
s)Interval
2nd
Primary stream bitrates (Mbps)
Max: 14.4Avg: 11.3StDev: 1.5
Primary stream bitrates (Mbps)
Max: 18.0Avg: 14.4StDev: 1.4
WRC (NBC O&O; 1080i resolution)“National Football League”
WTTG (Fox O&O; 720p resolution)Collage Football
Exhibit L: Two Stations Different Approaches to Managing Sports Programming73
F e d e r a l c O m m u n I c a T I O n s c O m m I s s I O n | s P e c T r u m a n a l y s I s 2 3
O B I T e c h n I c a l P a P e r n O . 3
In this analysis, stations’ HD programming ranged from 152 half-hour blocks (46% of the total programming time; NBC’s WRC 4) to none (WFDC 14 (Univision)). Of stations with HD programs, “high movement” HD ranged from 4-50 half-hour blocks (2–25 hours), with an average of 19 blocks (9.5 hours, or 6% of the total programming time).
Exhibit N shows how programming would overlap if stations with more HD programming paired up with stations airing less HD programming in a hypothetical channel sharing arrange-ment. In this pairing scenario, in the week of programming studied, there were no instances of coincident high-movement HD programming among the hypothetical channel sharing partners. In fact, because so much programming is in SD—even on networks that broadcast some HD content—and because so much HD programming is relatively low movement, high-movement HD programming coincides very rarely with other HD content. In each of the four pairs, no high-movement HD programming overlapped, and high-and-low movement HD programming overlapped only 7%, 2%, 0% and 0% of the time, respectively, in the sampled week of programming.75
These pairings are hypothetical only. In a real channel shar-ing situation, broadcasters who voluntarily choose to share channels could negotiate arrangements to exchange capacity to enable higher or lower transmission bit rates depending on need. These arrangements could be pre-determined or dynamically adjusted in real-time. For example, a station that broadcasts sports in HD during a weekend day may negoti-ate with a channel sharing partner that broadcasts talk shows during those times with lower bandwidth requirements. The two stations could agree on the best mechanisms to share their bandwidth dynamically to enable each to broadcast signals at
certain quality levels. These arrangements could further miti-gate any risk to HD signal degradation resulting from reduced bandwidth capacity per station.
Channel sharing partnerships raise legal and regulatory questions that the FCC would have to address in establishing the necessary licensing framework. These questions include the impact on must-carry rights, on multiple station ownership limits, which are designed to promote competition and diversi-ty by limiting the number of stations any one entity may own or control, and on control of stations’ transmission facilities. The FCC reviews broadcast ownership rules in a quadrennial re-view process and considers license applications, renewals and modifications in the context of the public interest, encompass-ing diversity, localism, competition and other considerations. The FCC would continue to play this role in a future in which channel sharing could be prevalent, and would modify its cur-rent licensing framework specifically to maintain must-carry rights and to ensure that channel sharing would conform to ownership rules, competition norms and public interests con-cerning diversity and localism.
* * * Because channel sharing is a new concept in broadcast-
ing, we have gone to some lengths to explore its feasibility and communicate supporting analyses. We are not suggesting that channel sharing would be the right approach for all broadcast stations, but rather that it could be a valuable mechanism to enable voluntary, market-based decisions on the part of some broadcast stations that wish to utilize smaller amounts of bandwidth highly efficiently, and in the process facilitate the spectrum reallocation recommended in the Plan.
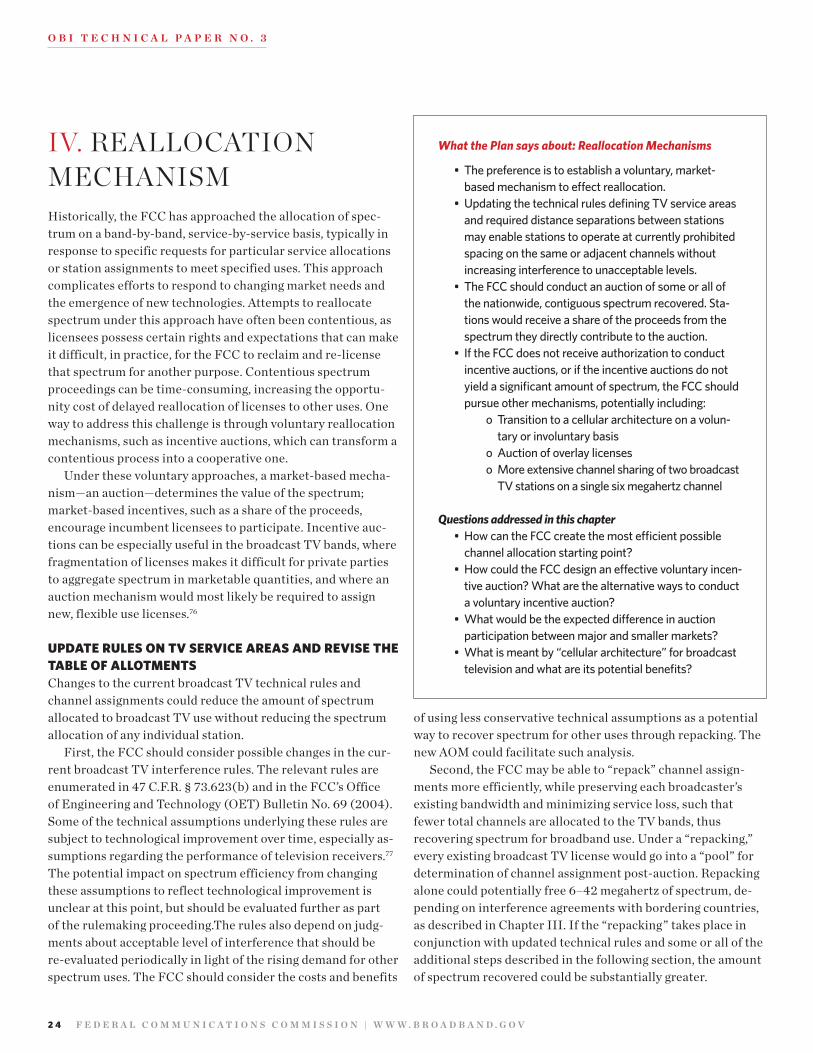
2 4 F e d e r a l c O m m u n I c a T I O n s c O m m I s s I O n | W W W . B r O a d B a n d . G O V
O B I T e c h n I c a l P a P e r n O . 3
Iv. REALLOCATION MECHANISMHistorically, the FCC has approached the allocation of spec-trum on a band-by-band, service-by-service basis, typically in response to specific requests for particular service allocations or station assignments to meet specified uses. This approach complicates efforts to respond to changing market needs and the emergence of new technologies. Attempts to reallocate spectrum under this approach have often been contentious, as licensees possess certain rights and expectations that can make it difficult, in practice, for the FCC to reclaim and re-license that spectrum for another purpose. Contentious spectrum proceedings can be time-consuming, increasing the opportu-nity cost of delayed reallocation of licenses to other uses. One way to address this challenge is through voluntary reallocation mechanisms, such as incentive auctions, which can transform a contentious process into a cooperative one.
Under these voluntary approaches, a market-based mecha-nism—an auction—determines the value of the spectrum; market-based incentives, such as a share of the proceeds, encourage incumbent licensees to participate. Incentive auc-tions can be especially useful in the broadcast TV bands, where fragmentation of licenses makes it difficult for private parties to aggregate spectrum in marketable quantities, and where an auction mechanism would most likely be required to assign new, flexible use licenses.76
uPdate rules oN tV serVice areas aNd reVise the table of allotmeNts Changes to the current broadcast TV technical rules and channel assignments could reduce the amount of spectrum allocated to broadcast TV use without reducing the spectrum allocation of any individual station.
First, the FCC should consider possible changes in the cur-rent broadcast TV interference rules. The relevant rules are enumerated in 47 C.F.R. § 73.623(b) and in the FCC’s Office of Engineering and Technology (OET) Bulletin No. 69 (2004). Some of the technical assumptions underlying these rules are subject to technological improvement over time, especially as-sumptions regarding the performance of television receivers.77 The potential impact on spectrum efficiency from changing these assumptions to reflect technological improvement is unclear at this point, but should be evaluated further as part of the rulemaking proceeding.The rules also depend on judg-ments about acceptable level of interference that should be re-evaluated periodically in light of the rising demand for other spectrum uses. The FCC should consider the costs and benefits
of using less conservative technical assumptions as a potential way to recover spectrum for other uses through repacking. The new AOM could facilitate such analysis.
Second, the FCC may be able to “repack” channel assign-ments more efficiently, while preserving each broadcaster’s existing bandwidth and minimizing service loss, such that fewer total channels are allocated to the TV bands, thus recovering spectrum for broadband use. Under a “repacking,” every existing broadcast TV license would go into a “pool” for determination of channel assignment post-auction. Repacking alone could potentially free 6–42 megahertz of spectrum, de-pending on interference agreements with bordering countries, as described in Chapter III. If the “repacking” takes place in conjunction with updated technical rules and some or all of the additional steps described in the following section, the amount of spectrum recovered could be substantially greater.
What the Plan says about: Reallocation Mechanisms
• The preference is to establish a voluntary, market-based mechanism to effect reallocation.
• Updating the technical rules defining TV service areas and required distance separations between stations may enable stations to operate at currently prohibited spacing on the same or adjacent channels without increasing interference to unacceptable levels.
• The FCC should conduct an auction of some or all of the nationwide, contiguous spectrum recovered. Sta-tions would receive a share of the proceeds from the spectrum they directly contribute to the auction.
• If the FCC does not receive authorization to conduct incentive auctions, or if the incentive auctions do not yield a significant amount of spectrum, the FCC should pursue other mechanisms, potentially including:
o Transition to a cellular architecture on a volun-tary or involuntary basis
o Auction of overlay licenses o More extensive channel sharing of two broadcast
TV stations on a single six megahertz channel
Questions addressed in this chapter• How can the FCC create the most efficient possible
channel allocation starting point?• How could the FCC design an effective voluntary incen-
tive auction? What are the alternative ways to conduct a voluntary incentive auction?
• What would be the expected difference in auction participation between major and smaller markets?
• What is meant by “cellular architecture” for broadcast television and what are its potential benefits?
F e d e r a l c O m m u n I c a T I O n s c O m m I s s I O n | s P e c T r u m a n a l y s I s 2 5
O B I T e c h n I c a l P a P e r n O . 3
coNduct auctioNs or exchaNGes to eNable VoluNtary reallocatioN There are three options for voluntary reallocation of more broadcast spectrum through incentive auctions than could be recovered through repacking alone. For all of these options, the FCC would implement safeguards, determined as part of the rulemaking proceeding, to maintain its longstanding goals of competition, diversity and localism. The FCC could conduct a two-step auction during which incumbents commit to release spectrum at a given price, which is then assigned through a con-ventional auction. Alternatively, it could conduct an exchange (two-sided auction) to simultaneously clear incumbents and sell cleared spectrum. Both of these options would require ad-ditional Congressional authority for the FCC to share proceeds from an auction with broadcasters. Finally, the FCC could con-duct an overlay auction of licenses encumbered by broadcasters and let the new licensees negotiate clearing. This option would not require additional Congressional authority.
The two-step auction would, as its name implies, proceed in two steps. In the first step, individual broadcasters would be given an opportunity to commit, through a bidding process, the minimum price at which they would voluntarily return their license to the FCC. A possible variant of the first stage would permit individual broadcasters to offer fractional channels by agreeing to share a channel with other licensees in the same market. In this case, the auction would match broadcasters making such offers to share channels in the same market so as to clear whole channels. The FCC should ensure that the li-censing framework it adopts to support channel sharing retains carriage rights for the primary signal of each station.78 Upon the conclusion of the first step, the FCC would conduct a repack-ing analysis using the optimization model. The model could determine the minimum cost of clearing alternative amounts of contiguous (paired) spectrum nationwide. The FCC could use this information to determine the amount of cleared spectrum that would be available in the second step. Or it might design the second-step auction to permit the amount of spectrum cleared to depend on both the bid prices for cleared spectrum and the cost of clearing. This methodology would be spelled out in advance. After the conclusion of the second auction, broad-casters that are requested to clear would be compensated as established in the first-step auction.
An exchange would combine the separate two-step incen-tive auction for cleared spectrum into a single market. In an exchange broadcasters would simultaneously offer spectrum (a full six-megahertz channel or a share of their bitstream capacity) while those seeking cleared spectrum would bid on unencumbered licenses. In contrast to a two-step auction, the amount of spectrum cleared would be determined simultaneously.
Congress would need to authorize the FCC to conduct a two-step auction or an exchange, since both options entail sharing auction proceeds with broadcasters. Stations could choose to share channels voluntarily under the regulatory framework established as part of the rulemaking proceeding in order to participate in the incentive auction. Following the auction and repacking, stations continuing to broadcast over the air would receive channel assignments according to a new Table of Allotment, modified licenses if they are sharing a channel with other stations, and reimbursement from auction winners or auction proceeds for any expenses incurred as a result of repacking.
The third voluntary method that could be used to reclaim additional TV spectrum is auctioning overlay licenses in the broadcast TV bands. Under this alternative, the FCC would divide the broadcast TV bands into large, contiguous blocks and auction all or a portion of those blocks as overlay licenses with flexible use.79 Overlay licensees would have co-primary rights with DTV stations. They would have primary rights in any part of the license area that is not served by DTV licensees, but would have to protect any DTV broadcast stations in their service area.
The overlay license holders could negotiate directly with broadcast TV stations to clear the spectrum either by discon-tinuing OTA signals or by relocating to another block. One overlay license holder could pay another overlay license holder to accept the relocated station or pay a broadcast TV station to share its bandwidth with that relocated station. As part of these negotiations, the overlay license holder could also pay for relocation and other forms of compensation to the incumbent user. Either the broadcast TV station or the overlay licensee could negotiate ongoing carriage rights for the station through private contractual agreements with MVPDs.
One advantage of the overlay license approach is that no additional statutory authority is needed. The FCC has used this approach with the Educational Broadband Service (EBS)/Broadband Radio Service (BRS) (formerly ITFS/MDS) and other bands.80
The downside of this type of auction is that incumbents may choose never to clear the band or may take a very long time to negotiate a clearing. Additionally, although all the proceeds from the overlay auction would go to the U.S. Treasury, they could be significantly lower than proceeds of an incentive auc-tion, primarily due to greater uncertainty over the amount and timing of spectrum recovered. The substantial value difference between the price of spectrum in an overlay auction and its un-derlying value would be shared by the overlay and incumbent licensees based on their respective negotiating position.
For example, Auctions 44, 49 and 60 of licenses in the 700 MHz band generated proceeds of $0.03–0.05 per
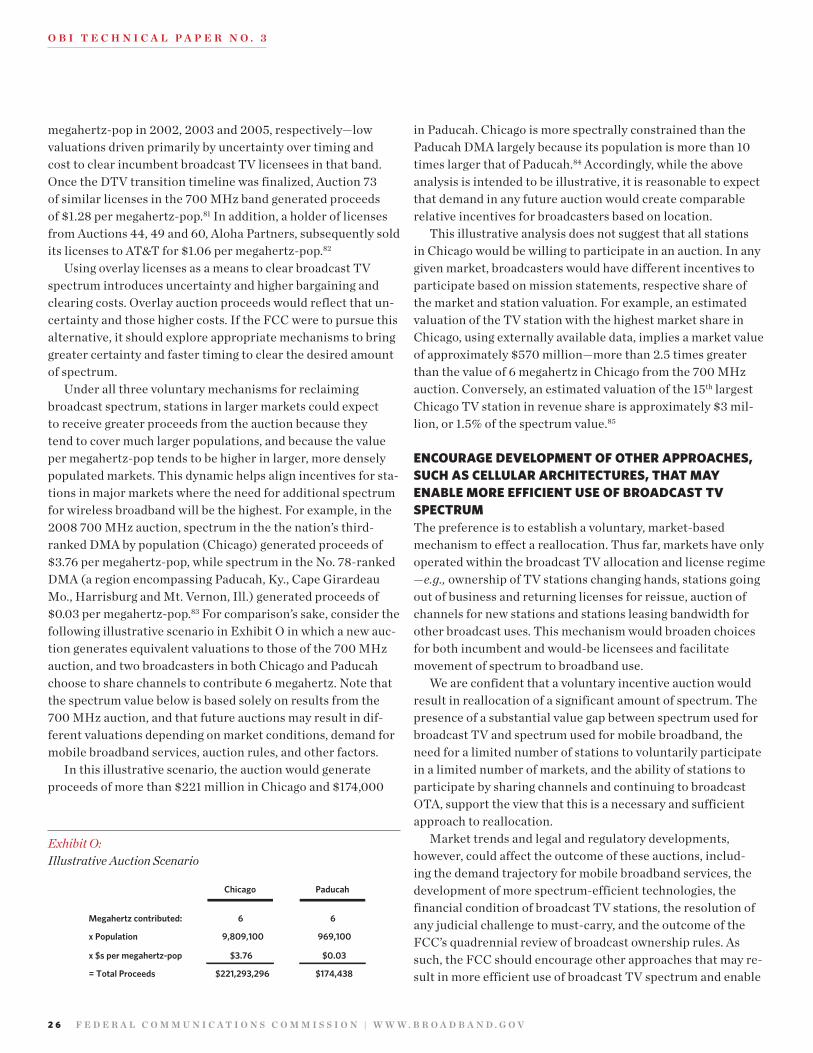
2 6 F e d e r a l c O m m u n I c a T I O n s c O m m I s s I O n | W W W . B r O a d B a n d . G O V
O B I T e c h n I c a l P a P e r n O . 3
megahertz-pop in 2002, 2003 and 2005, respectively—low valuations driven primarily by uncertainty over timing and cost to clear incumbent broadcast TV licensees in that band. Once the DTV transition timeline was finalized, Auction 73 of similar licenses in the 700 MHz band generated proceeds of $1.28 per megahertz-pop.81 In addition, a holder of licenses from Auctions 44, 49 and 60, Aloha Partners, subsequently sold its licenses to AT&T for $1.06 per megahertz-pop.82
Using overlay licenses as a means to clear broadcast TV spectrum introduces uncertainty and higher bargaining and clearing costs. Overlay auction proceeds would reflect that un-certainty and those higher costs. If the FCC were to pursue this alternative, it should explore appropriate mechanisms to bring greater certainty and faster timing to clear the desired amount of spectrum.
Under all three voluntary mechanisms for reclaiming broadcast spectrum, stations in larger markets could expect to receive greater proceeds from the auction because they tend to cover much larger populations, and because the value per megahertz-pop tends to be higher in larger, more densely populated markets. This dynamic helps align incentives for sta-tions in major markets where the need for additional spectrum for wireless broadband will be the highest. For example, in the 2008 700 MHz auction, spectrum in the the nation’s third-ranked DMA by population (Chicago) generated proceeds of $3.76 per megahertz-pop, while spectrum in the No. 78-ranked DMA (a region encompassing Paducah, Ky., Cape Girardeau Mo., Harrisburg and Mt. Vernon, Ill.) generated proceeds of $0.03 per megahertz-pop.83 For comparison’s sake, consider the following illustrative scenario in Exhibit O in which a new auc-tion generates equivalent valuations to those of the 700 MHz auction, and two broadcasters in both Chicago and Paducah choose to share channels to contribute 6 megahertz. Note that the spectrum value below is based solely on results from the 700 MHz auction, and that future auctions may result in dif-ferent valuations depending on market conditions, demand for mobile broadband services, auction rules, and other factors.
In this illustrative scenario, the auction would generate proceeds of more than $221 million in Chicago and $174,000
in Paducah. Chicago is more spectrally constrained than the Paducah DMA largely because its population is more than 10 times larger that of Paducah.84 Accordingly, while the above analysis is intended to be illustrative, it is reasonable to expect that demand in any future auction would create comparable relative incentives for broadcasters based on location.
This illustrative analysis does not suggest that all stations in Chicago would be willing to participate in an auction. In any given market, broadcasters would have different incentives to participate based on mission statements, respective share of the market and station valuation. For example, an estimated valuation of the TV station with the highest market share in Chicago, using externally available data, implies a market value of approximately $570 million—more than 2.5 times greater than the value of 6 megahertz in Chicago from the 700 MHz auction. Conversely, an estimated valuation of the 15th largest Chicago TV station in revenue share is approximately $3 mil-lion, or 1.5% of the spectrum value.85
eNcouraGe deVeloPmeNt of other aPProaches, such as cellular architectures, that may eNable more efficieNt use of broadcast tV sPectrum The preference is to establish a voluntary, market-based mechanism to effect a reallocation. Thus far, markets have only operated within the broadcast TV allocation and license regime —e.g., ownership of TV stations changing hands, stations going out of business and returning licenses for reissue, auction of channels for new stations and stations leasing bandwidth for other broadcast uses. This mechanism would broaden choices for both incumbent and would-be licensees and facilitate movement of spectrum to broadband use.
We are confident that a voluntary incentive auction would result in reallocation of a significant amount of spectrum. The presence of a substantial value gap between spectrum used for broadcast TV and spectrum used for mobile broadband, the need for a limited number of stations to voluntarily participate in a limited number of markets, and the ability of stations to participate by sharing channels and continuing to broadcast OTA, support the view that this is a necessary and sufficient approach to reallocation.
Market trends and legal and regulatory developments, however, could affect the outcome of these auctions, includ-ing the demand trajectory for mobile broadband services, the development of more spectrum-efficient technologies, the financial condition of broadcast TV stations, the resolution of any judicial challenge to must-carry, and the outcome of the FCC’s quadrennial review of broadcast ownership rules. As such, the FCC should encourage other approaches that may re-sult in more efficient use of broadcast TV spectrum and enable
Chicago Paducah
Megahertz contributed: 6 6
x Population 9,809,100 969,100
x $s per megahertz-pop $3.76 $0.03
= Total Proceeds $221,293,296 $174,438
Exhibit O: Illustrative Auction Scenario
F e d e r a l c O m m u n I c a T I O n s c O m m I s s I O n | s P e c T r u m a n a l y s I s 2 7
O B I T e c h n I c a l P a P e r n O . 3
reallocation to broadband use. One such approach could be a transition to a cellular architecture.
In a cellular architecture, stations would broadcast tele-vision service over many low-powered transmitters that collectively provide similar coverage to the current architec-ture with one high-powered transmitter. Cellularizing the architecture could reduce or eliminate the need for channel interference protections that result in only a fraction of the total spectrum allocated to broadcast TV being used directly by stations.86 A cellularized architecture could also facilitate broadcasters’ offerings of converged broadcast/ broadband and fixed/mobile services. The FCC has approved Distributed Transmission Systems/Single Frequency Networks (DTS/SFN), using multiple transmitters operating on a single chan-nel, as one type of cellular architecture.87 Other alternatives are possible, such as a Multi-Frequency Network (MFN). In an MFN, multiple stations consolidate their capacity and broad-cast over different channels at different sites and times, similar to a frequency re-use pattern employed by mobile operators to avoid interference between cell sites.88
Moving to a cellular architecture would cost a significant amount of money, take a long time and introduce substantial
operational challenges for broadcasters.89 In addition, if new towers were needed to house the distributed broadcasting transmitters, such a move would likely face environmental and zoning challenges. The potential spectrum dividend from cel-lularization is uncertain at this point, but could be very high.90 In the 2008 DTS Report and Order, the FCC found that, among other benefits, the advantages of a DTS/SFN architecture include improved coverage areas, higher-quality signals and spectral efficiency.91
Though stations could voluntarily move to a cellular archi-tecture on individual bases, such moves would achieve greater overall spectrum efficiency if they are conducted in a coordi-nated manner by all stations in major markets. DTS/SFN and MFN are cutting edge technologies that need to be developed further to evaluate their viability and the various trade-offs. We recommend the Commission encourage and closely monitor their development.
2 8 F e d e r a l c O m m u n I c a T I O n s c O m m I s s I O n | W W W . B r O a d B a n d . G O V
O B I T e c h n I c a l P a P e r n O . 3
v. POTENTIAL IMPACT FROM REALLOCATION MECHAISMSThe reallocation of spectrum from broadcast TV does not come without challenges, but we believe these challenges can be overcome as part of America’s collective effort to drive universal availability and adoption of broadband, develop a world-leading broadband infrastructure and advance the public interests associated with such achievements. All key stakehold-ers are likely to be impacted as described in this section.
coNsumersIn each of our recommended scenarios, consumers would continue to receive OTA television. If particular stations voluntarily choose to go off the air as a result of an incentive or overlay auction, all consumers in their respective service areas would no longer receive their signals, unless those stations signed private carriage agreements with MVPDs. In addition, some OTA consumers would lose reception from one or more stations as a result of stations choosing to share channels with other stations (and thus change their service area) or experienc-ing loss in service area due to increased interference following a “repacking.” Others may gain reception from one or more stations as a result of changes to service areas. In addition, OTA consumers would need to reorient antennas or rescan their TVs, as they did following the DTV transition in June 2009. Even a reallocation strategy that relies primarily on voluntary actions on the part of market participants must seriously consider these downstream impacts on consumers, and strive to mitigate nega-tive effects. But it bears repeating: OTA TV would continue to deliver the services and benefits that it does today.
Actual impacts would differ considerably across differ-ent types of markets. Losses of stations by consumers would most likely occur in densely populated metro markets, where consumers already have more viewing alternatives, for two reasons: these markets tend to have the highest concentration of broadcast stations; and, stations in these markets would have the strongest incentives to relinquish spectrum voluntarily.
Exhibit P illustrates this proposition in the With Border Restrictions and Without Border Restrictions scenarios for a channel repacking. The illustration does not account for any regulatory interventions that the FCC might take to mitigate negative consumer impact on a case by case basis. The Exhibit compares the impact to consumers from a channel repacking in markets ranked 100+ to that of consumers in markets ranked 1-99 from the alpha version of the AOM.
What the Plan says about: Potential Impact from Reallocation Mechanisms
• OTA television would continue as a healthy medium, delivering the same entertainment and public interest benefits that it does today
• There are several actions the FCC should take to miti-gate the impact on OTA consumers:
o The FCC should ensure that consumers in rural areas and smaller markets retain service and are not significantly impacted by these changes.
o The FCC should ensure that longstanding policy goals under the Communications Act continue to be met, such as localism, viewpoint diversity, competition and opportunities for new entrants to participate in the industry, including women and members of minority groups.
o While most consumers would continue to receive all or most of the stations that they currently do, the FCC should explore through rulemaking pro-ceedings appropriate compensation mechanisms to retain free television service for those consum-ers who meet the criteria established.
• The substantial benefits of more widespread and robust broadband services can help to offset any unde-sirable consumer impacts.
• The impact of a voluntary reallocation on current rev-enue streams for stations that continue broadcasting OTA would be minimal
• The incentive auction would give stations another vari-able to consider in choosing the type of primary video signal to broadcast OTA, HD or SD, and in pursuing new business models enabled by the Digital Transition: multicasting and mobile DTV
• No recommendations would directly affect other current or future occupants of the broadcast TV bands, notably land mobile radio system (LMRS) operators, wireless microphone users, and “TV White Spaces” devices
Questions addressed in this chapter• What is the expected impact on consumers from the
voluntary reallocation mechanisms, and how might the expected impact differ in major markets vs. smaller markets and rural areas?
• How might a consumer compensation program work?• How would the public interest—as defined and rein-
forced by policy initiatives over time—be affected?• What impact on broadcasters’ current and potential future
revenue streams and business models can be expected?• How would spectrum reallocation affect the other licensed
and unlicensed occupants of the broadcast TV bands?
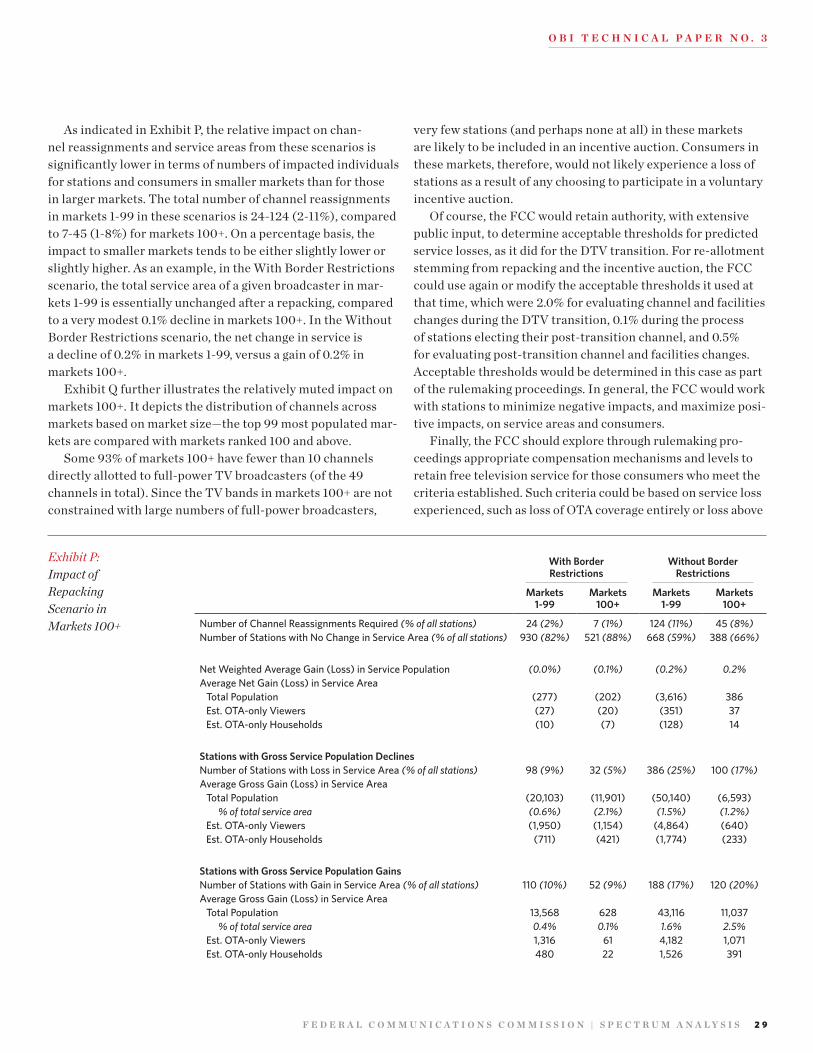
F e d e r a l c O m m u n I c a T I O n s c O m m I s s I O n | s P e c T r u m a n a l y s I s 2 9
O B I T e c h n I c a l P a P e r n O . 3
As indicated in Exhibit P, the relative impact on chan-nel reassignments and service areas from these scenarios is significantly lower in terms of numbers of impacted individuals for stations and consumers in smaller markets than for those in larger markets. The total number of channel reassignments in markets 1-99 in these scenarios is 24-124 (2-11%), compared to 7-45 (1-8%) for markets 100+. On a percentage basis, the impact to smaller markets tends to be either slightly lower or slightly higher. As an example, in the With Border Restrictions scenario, the total service area of a given broadcaster in mar-kets 1-99 is essentially unchanged after a repacking, compared to a very modest 0.1% decline in markets 100+. In the Without Border Restrictions scenario, the net change in service is a decline of 0.2% in markets 1-99, versus a gain of 0.2% in markets 100+.
Exhibit Q further illustrates the relatively muted impact on markets 100+. It depicts the distribution of channels across markets based on market size—the top 99 most populated mar-kets are compared with markets ranked 100 and above.
Some 93% of markets 100+ have fewer than 10 channels directly allotted to full-power TV broadcasters (of the 49 channels in total). Since the TV bands in markets 100+ are not constrained with large numbers of full-power broadcasters,
very few stations (and perhaps none at all) in these markets are likely to be included in an incentive auction. Consumers in these markets, therefore, would not likely experience a loss of stations as a result of any choosing to participate in a voluntary incentive auction.
Of course, the FCC would retain authority, with extensive public input, to determine acceptable thresholds for predicted service losses, as it did for the DTV transition. For re-allotment stemming from repacking and the incentive auction, the FCC could use again or modify the acceptable thresholds it used at that time, which were 2.0% for evaluating channel and facilities changes during the DTV transition, 0.1% during the process of stations electing their post-transition channel, and 0.5% for evaluating post-transition channel and facilities changes. Acceptable thresholds would be determined in this case as part of the rulemaking proceedings. In general, the FCC would work with stations to minimize negative impacts, and maximize posi-tive impacts, on service areas and consumers.
Finally, the FCC should explore through rulemaking pro-ceedings appropriate compensation mechanisms and levels to retain free television service for those consumers who meet the criteria established. Such criteria could be based on service loss experienced, such as loss of OTA coverage entirely or loss above
Exhibit P: Impact of Repacking Scenario in Markets 100+
With Border Restrictions
Without Border Restrictions
Markets 1-99
Markets 100+
Markets 1-99
Markets 100+
Number of Channel Reassignments Required (% of all stations) 24 (2%) 7 (1%) 124 (11%) 45 (8%)Number of Stations with No Change in Service Area (% of all stations) 930 (82%) 521 (88%) 668 (59%) 388 (66%)
Net Weighted Average Gain (Loss) in Service Population (0.0%) (0.1%) (0.2%) 0.2%Average Net Gain (Loss) in Service Area
Total Population (277) (202) (3,616) 386 Est. OTA-only Viewers (27) (20) (351) 37 Est. OTA-only Households (10) (7) (128) 14
Stations with Gross Service Population DeclinesNumber of Stations with Loss in Service Area (% of all stations) 98 (9%) 32 (5%) 386 (25%) 100 (17%)Average Gross Gain (Loss) in Service Area
Total Population (20,103) (11,901) (50,140) (6,593)% of total service area (0.6%) (2.1%) (1.5%) (1.2%)
Est. OTA-only Viewers (1,950) (1,154) (4,864) (640)Est. OTA-only Households (711) (421) (1,774) (233)
Stations with Gross Service Population GainsNumber of Stations with Gain in Service Area (% of all stations) 110 (10%) 52 (9%) 188 (17%) 120 (20%)Average Gross Gain (Loss) in Service Area
Total Population 13,568 628 43,116 11,037% of total service area 0.4% 0.1% 1.6% 2.5%
Est. OTA-only Viewers 1,316 61 4,182 1,071Est. OTA-only Households 480 22 1,526 391
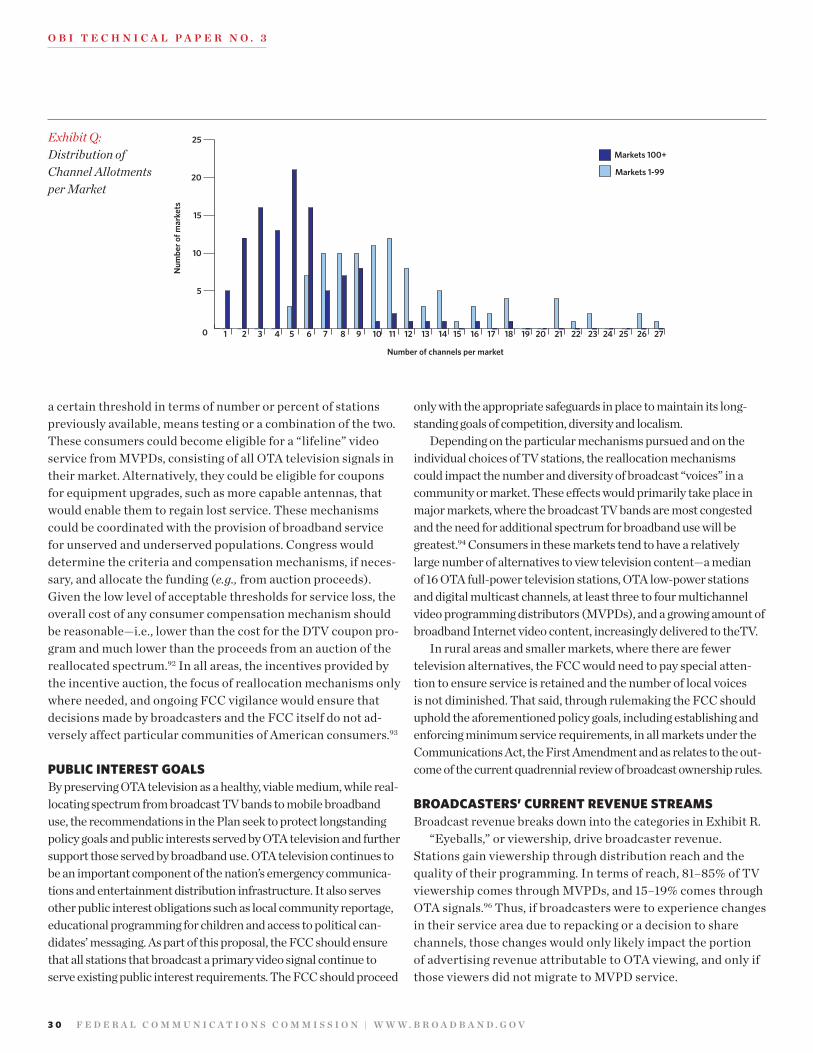
3 0 F e d e r a l c O m m u n I c a T I O n s c O m m I s s I O n | W W W . B r O a d B a n d . G O V
O B I T e c h n I c a l P a P e r n O . 3
a certain threshold in terms of number or percent of stations previously available, means testing or a combination of the two. These consumers could become eligible for a “lifeline” video service from MVPDs, consisting of all OTA television signals in their market. Alternatively, they could be eligible for coupons for equipment upgrades, such as more capable antennas, that would enable them to regain lost service. These mechanisms could be coordinated with the provision of broadband service for unserved and underserved populations. Congress would determine the criteria and compensation mechanisms, if neces-sary, and allocate the funding (e.g., from auction proceeds). Given the low level of acceptable thresholds for service loss, the overall cost of any consumer compensation mechanism should be reasonable—i.e., lower than the cost for the DTV coupon pro-gram and much lower than the proceeds from an auction of the reallocated spectrum.92 In all areas, the incentives provided by the incentive auction, the focus of reallocation mechanisms only where needed, and ongoing FCC vigilance would ensure that decisions made by broadcasters and the FCC itself do not ad-versely affect particular communities of American consumers.93
Public iNterest Goals By preserving OTA television as a healthy, viable medium, while real-locating spectrum from broadcast TV bands to mobile broadband use, the recommendations in the Plan seek to protect longstanding policy goals and public interests served by OTA television and further support those served by broadband use. OTA television continues to be an important component of the nation’s emergency communica-tions and entertainment distribution infrastructure. It also serves other public interest obligations such as local community reportage, educational programming for children and access to political can-didates’ messaging. As part of this proposal, the FCC should ensure that all stations that broadcast a primary video signal continue to serve existing public interest requirements. The FCC should proceed
only with the appropriate safeguards in place to maintain its long-standing goals of competition, diversity and localism.
Depending on the particular mechanisms pursued and on the individual choices of TV stations, the reallocation mechanisms could impact the number and diversity of broadcast “voices” in a community or market. These effects would primarily take place in major markets, where the broadcast TV bands are most congested and the need for additional spectrum for broadband use will be greatest.94 Consumers in these markets tend to have a relatively large number of alternatives to view television content—a median of 16 OTA full-power television stations, OTA low-power stations and digital multicast channels, at least three to four multichannel video programming distributors (MVPDs), and a growing amount of broadband Internet video content, increasingly delivered to theTV.
In rural areas and smaller markets, where there are fewer television alternatives, the FCC would need to pay special atten-tion to ensure service is retained and the number of local voices is not diminished. That said, through rulemaking the FCC should uphold the aforementioned policy goals, including establishing and enforcing minimum service requirements, in all markets under the Communications Act, the First Amendment and as relates to the out-come of the current quadrennial review of broadcast ownership rules.
broadcasters’ curreNt reVeNue streams Broadcast revenue breaks down into the categories in Exhibit R.
“Eyeballs,” or viewership, drive broadcaster revenue. Stations gain viewership through distribution reach and the quality of their programming. In terms of reach, 81–85% of TV viewership comes through MVPDs, and 15–19% comes through OTA signals.96 Thus, if broadcasters were to experience changes in their service area due to repacking or a decision to share channels, those changes would only likely impact the portion of advertising revenue attributable to OTA viewing, and only if those viewers did not migrate to MVPD service.
Exhibit Q: Distribution of Channel Allotments per Market
0
5
10
15
20
25
Markets 100+
Markets 1-99
1 2 3 4 5 6 7 8 9 10 11 12 13 14 15 16 17 18 19 20 21 22 23 24 25 26 27
Number of channels per market
Num
ber o
f mar
kets
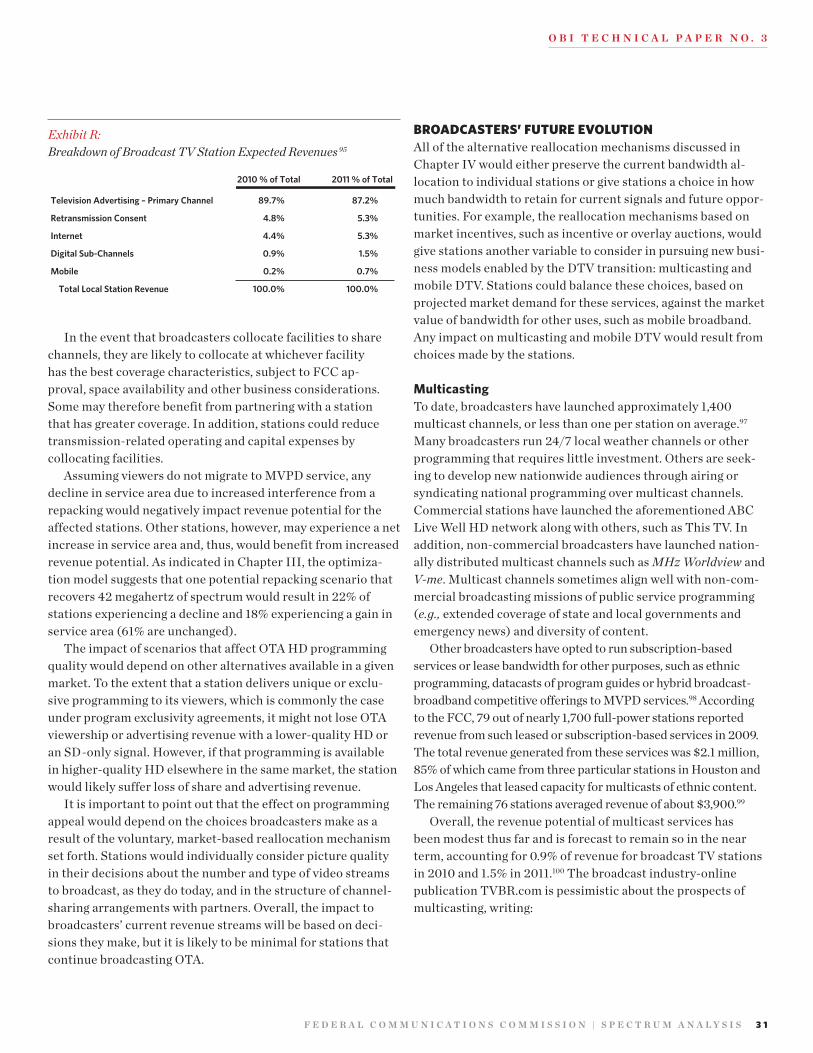
F e d e r a l c O m m u n I c a T I O n s c O m m I s s I O n | s P e c T r u m a n a l y s I s 3 1
O B I T e c h n I c a l P a P e r n O . 3
In the event that broadcasters collocate facilities to share channels, they are likely to collocate at whichever facility has the best coverage characteristics, subject to FCC ap-proval, space availability and other business considerations. Some may therefore benefit from partnering with a station that has greater coverage. In addition, stations could reduce transmission-related operating and capital expenses by collocating facilities.
Assuming viewers do not migrate to MVPD service, any decline in service area due to increased interference from a repacking would negatively impact revenue potential for the affected stations. Other stations, however, may experience a net increase in service area and, thus, would benefit from increased revenue potential. As indicated in Chapter III, the optimiza-tion model suggests that one potential repacking scenario that recovers 42 megahertz of spectrum would result in 22% of stations experiencing a decline and 18% experiencing a gain in service area (61% are unchanged).
The impact of scenarios that affect OTA HD programming quality would depend on other alternatives available in a given market. To the extent that a station delivers unique or exclu-sive programming to its viewers, which is commonly the case under program exclusivity agreements, it might not lose OTA viewership or advertising revenue with a lower-quality HD or an SD-only signal. However, if that programming is available in higher-quality HD elsewhere in the same market, the station would likely suffer loss of share and advertising revenue.
It is important to point out that the effect on programming appeal would depend on the choices broadcasters make as a result of the voluntary, market-based reallocation mechanism set forth. Stations would individually consider picture quality in their decisions about the number and type of video streams to broadcast, as they do today, and in the structure of channel-sharing arrangements with partners. Overall, the impact to broadcasters’ current revenue streams will be based on deci-sions they make, but it is likely to be minimal for stations that continue broadcasting OTA.
broadcasters’ future eVolutioN All of the alternative reallocation mechanisms discussed in Chapter IV would either preserve the current bandwidth al-location to individual stations or give stations a choice in how much bandwidth to retain for current signals and future oppor-tunities. For example, the reallocation mechanisms based on market incentives, such as incentive or overlay auctions, would give stations another variable to consider in pursuing new busi-ness models enabled by the DTV transition: multicasting and mobile DTV. Stations could balance these choices, based on projected market demand for these services, against the market value of bandwidth for other uses, such as mobile broadband. Any impact on multicasting and mobile DTV would result from choices made by the stations.
MulticastingTo date, broadcasters have launched approximately 1,400 multicast channels, or less than one per station on average.97 Many broadcasters run 24/7 local weather channels or other programming that requires little investment. Others are seek-ing to develop new nationwide audiences through airing or syndicating national programming over multicast channels. Commercial stations have launched the aforementioned ABC Live Well HD network along with others, such as This TV. In addition, non-commercial broadcasters have launched nation-ally distributed multicast channels such as MHz Worldview and V-me. Multicast channels sometimes align well with non-com-mercial broadcasting missions of public service programming (e.g., extended coverage of state and local governments and emergency news) and diversity of content.
Other broadcasters have opted to run subscription-based services or lease bandwidth for other purposes, such as ethnic programming, datacasts of program guides or hybrid broadcast-broadband competitive offerings to MVPD services.98 According to the FCC, 79 out of nearly 1,700 full-power stations reported revenue from such leased or subscription-based services in 2009. The total revenue generated from these services was $2.1 million, 85% of which came from three particular stations in Houston and Los Angeles that leased capacity for multicasts of ethnic content. The remaining 76 stations averaged revenue of about $3,900.99
Overall, the revenue potential of multicast services has been modest thus far and is forecast to remain so in the near term, accounting for 0.9% of revenue for broadcast TV stations in 2010 and 1.5% in 2011.100 The broadcast industry-online publication TVBR.com is pessimistic about the prospects of multicasting, writing:
Exhibit R: Breakdown of Broadcast TV Station Expected Revenues 95
2010 % of Total 2011 % of Total
Television Advertising – Primary Channel 89.7% 87.2%
Retransmission Consent 4.8% 5.3%
Internet 4.4% 5.3%
Digital Sub-Channels 0.9% 1.5%
Mobile 0.2% 0.7%
Total Local Station Revenue 100.0% 100.0%
3 2 F e d e r a l c O m m u n I c a T I O n s c O m m I s s I O n | W W W . B r O a d B a n d . G O V
O B I T e c h n I c a l P a P e r n O . 3
“So far, nobody’s been able to figure out what can go on a digital side channel and pay for its own presence there. Mostly it’s been used as a revenue-neutral or money-losing place to put 24-hour weather... Nobody watches these things in strong enough num-bers to generate any advertising revenue.” 101
Stations that voluntarily choose to share channels would likely retain the ability to multicast two to four program-ming streams if they broadcast entirely in SD. However, if these broadcasters choose other priorities instead (e.g., HD, mobile TV), the potential for multicasting would be limited. Viewership of these multicast channels is likely very low, though difficult to size, since Nielsen and other rating services do not make their measurements readily available.
Mobile Digital Television (Mobile DTV)Many broadcasters view mobile DTV as their evolution
path to fixed/mobile and broadcast/broadband convergence. In particular, broadcasting popular video content to mobile devices may help offload growing video-streaming traffic from mobile point-to-point broadband networks.102 In April 2007, television broadcasters formed the Open Mobile Video Coalition (OMVC) to accelerate the development of mobile digital broadcast television in the United States. Today, the OMVC’s membership represents more than 800 broadcast stations (commercial and public) across the U.S., along with chipset manufacturers, and infrastructure and consumer device manufacturers. Together this group has developed and adopted a mobile/handheld version of the ATSC technical standard.
As of April 2010, 45 broadcast stations were on the air and 70 stations in 28 markets had previously announced plans to begin broadcasting using the mobile DTV standard.103 These stations plan to experiment with a variety of services and business mod-els, including traditional and interactive video, and ad-supported and subscription services. A consumer-facing trial is launching in the Washington, DC metropolitan area in the second quarter of 2010, piloting the service using a variety of consumer devices.
The business model for Mobile DTV is still nascent, but the industry has outlined numerous potential use cases. Mobile DTV broadcast businesses are most advanced in Japan and South Korea, where nine out of 10 mobile TV users worldwide reside. Despite combined viewers of more than 69 million, neither country’s services have succeeded financially yet. High build-out and maintenance commitments have driven sig-nificant costs, and broadcasters in those countries have yet to leverage their millions of viewers into sustainable, incremental ad revenue to support a free-to-air mobile service.104 In the U.S., many entities are pursuing the delivery of television con-tent to mobile devices, including Qualcomm with its MediaFLO
service, but the method of delivery and business model that will be favored by consumers and successful in the market has yet to be determined.105
While the OMVC itself has not published formal revenue projections, the National Association of Broadcasters (NAB) has issued its own base case projections for the service: Advertising on mobile DTV would generate $2 billion in revenues, of which $1.1 billion would accrue to broadcasters, generating an esti-mated $9.1 billion in incremental market value.106 These figures include only cash flows from advertising-supported services and do not quantify the value of subscription-based services. To the extent that financial analysts assign credibility to these and other projections, they should already embed them in their valuations of broadcast TV companies (based on present value of future expected cash flows).
Broadcasters have stated that they need approximately 2 Mbps to broadcast each mobile DTV stream to mobile or small-screen portable devices.107 Stations voluntarily choosing to share channels would either not be able to launch mobile DTV on their channel, if they choose to broadcast their primary video stream in HD, or would be constrained in the number of mobile streams they could broadcast if they air their primary video stream in SD. These stations could, however, choose to lease capacity from other stations in market if they wanted to launch a mobile DTV service and retain their primary broad-cast stream in HD. Further technological advances in encoding and statistical multiplexing could also enable a station to broadcast a primary HD stream and a mobile DTV service over a shared channel in the not-too-distant future.
Within the proposed timeline of 2-3 years to complete the rulemaking and to auction spectrum reallocated from broadcast TV, some of the questions about delivery platform, business model and market acceptance of mobile DTV may have been resolved. At that point, the FCC could make specific decisions about the allocation of spectrum reclaimed and about service and technical rules to accommodate mobile DTV service.
loW-PoWer teleVisioN (lPtV) statioNsThe FCC has licensed more than 7,000 low-power TV broad-casters: about 7% are Class A stations, entitled to greater interference protection than other LPTV stations in exchange for minimum programming requirements;108 about 60% are translators, rebroadcasting the programming of a full-power broadcast TV station on another channel to fill coverage gaps; and the remaining 33% are traditional LPTV stations.109 About 9% of non-translator low-power TV stations are currently broadcasting in digital; the remainder has either received ap-proval for a digital companion channel or a digital flash cut but not completed the transition, or awaits approval of their appli-cation by the FCC.110 Congress did not set a digital conversion
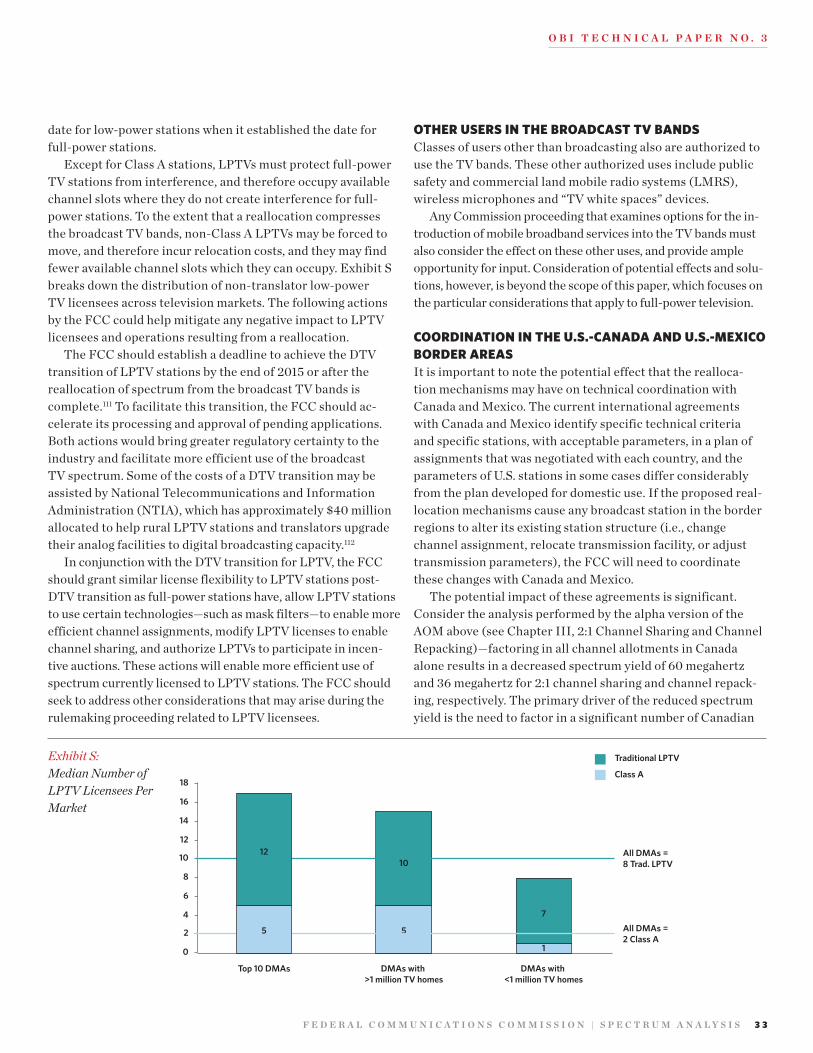
F e d e r a l c O m m u n I c a T I O n s c O m m I s s I O n | s P e c T r u m a n a l y s I s 3 3
O B I T e c h n I c a l P a P e r n O . 3
date for low-power stations when it established the date for full-power stations.
Except for Class A stations, LPTVs must protect full-power TV stations from interference, and therefore occupy available channel slots where they do not create interference for full-power stations. To the extent that a reallocation compresses the broadcast TV bands, non-Class A LPTVs may be forced to move, and therefore incur relocation costs, and they may find fewer available channel slots which they can occupy. Exhibit S breaks down the distribution of non-translator low-power TV licensees across television markets. The following actions by the FCC could help mitigate any negative impact to LPTV licensees and operations resulting from a reallocation.
The FCC should establish a deadline to achieve the DTV transition of LPTV stations by the end of 2015 or after the reallocation of spectrum from the broadcast TV bands is complete.111 To facilitate this transition, the FCC should ac-celerate its processing and approval of pending applications. Both actions would bring greater regulatory certainty to the industry and facilitate more efficient use of the broadcast TV spectrum. Some of the costs of a DTV transition may be assisted by National Telecommunications and Information Administration (NTIA), which has approximately $40 million allocated to help rural LPTV stations and translators upgrade their analog facilities to digital broadcasting capacity.112
In conjunction with the DTV transition for LPTV, the FCC should grant similar license flexibility to LPTV stations post-DTV transition as full-power stations have, allow LPTV stations to use certain technologies—such as mask filters—to enable more efficient channel assignments, modify LPTV licenses to enable channel sharing, and authorize LPTVs to participate in incen-tive auctions. These actions will enable more efficient use of spectrum currently licensed to LPTV stations. The FCC should seek to address other considerations that may arise during the rulemaking proceeding related to LPTV licensees.
other users iN the broadcast tV baNds Classes of users other than broadcasting also are authorized to use the TV bands. These other authorized uses include public safety and commercial land mobile radio systems (LMRS), wireless microphones and “TV white spaces” devices.
Any Commission proceeding that examines options for the in-troduction of mobile broadband services into the TV bands must also consider the effect on these other uses, and provide ample opportunity for input. Consideration of potential effects and solu-tions, however, is beyond the scope of this paper, which focuses on the particular considerations that apply to full-power television.
coordiNatioN iN the u.s.-caNada aNd u.s.-mexico border areasIt is important to note the potential effect that the realloca-tion mechanisms may have on technical coordination with Canada and Mexico. The current international agreements with Canada and Mexico identify specific technical criteria and specific stations, with acceptable parameters, in a plan of assignments that was negotiated with each country, and the parameters of U.S. stations in some cases differ considerably from the plan developed for domestic use. If the proposed real-location mechanisms cause any broadcast station in the border regions to alter its existing station structure (i.e., change channel assignment, relocate transmission facility, or adjust transmission parameters), the FCC will need to coordinate these changes with Canada and Mexico.
The potential impact of these agreements is significant. Consider the analysis performed by the alpha version of the AOM above (see Chapter III, 2:1 Channel Sharing and Channel Repacking)—factoring in all channel allotments in Canada alone results in a decreased spectrum yield of 60 megahertz and 36 megahertz for 2:1 channel sharing and channel repack-ing, respectively. The primary driver of the reduced spectrum yield is the need to factor in a significant number of Canadian
Exhibit S: Median Number of LPTV Licensees Per Market
Traditional LPTV
Class A
All DMAs = 2 Class A
All DMAs = 8 Trad. LPTV
0
2
4
6
8
10
12
14
16
18
DMAs with >1 million TV homes
10
5
DMAs with <1 million TV homes
7
1
Top 10 DMAs
5
12
3 4 F e d e r a l c O m m u n I c a T I O n s c O m m I s s I O n | W W W . B r O a d B a n d . G O V
O B I T e c h n I c a l P a P e r n O . 3
channel allotments that are not licensed to, or currently occu-pied by, television stations.
In addition, the current agreements in place only offer protection for the existing primary services in the TV bands. The FCC would need to reach new coordination agreements with Canada and Mexico to cover implementation of new wire-less broadband services in this spectrum. The FCC should be mindful of cross-border coordination and factor this into the rulemaking proceeding accordingly.
CONCLUSION Spectrum policy is not easy. Technology changes. Consumer preferences and habits change. Business models change. Allocation priorities change. And this change can be daunting.
This paper has gone to some length to explain why the bene-fits of a voluntary approach to broadcast spectrum reallocation may have more upside for all stakeholders—broadcasters, mobile broadband providers and especially consumers—than one might initially expect. It has taken a fact-based, data-driven approach, focusing on market analyses, technical details, analytical methodologies and impact assessments. In assess-ing impact, it has sought to confront the potential negative impacts in order to show policy makers, industry stakehold-ers and the American public with TVs and mobile phones that favorable outcomes are achievable with reasonable costs and inconveniences.
This fact-based, data-driven approach is important. The Plan made recommendations on broadcast TV spectrum policy that it did not have the space to fully substantiate, and this paper pro-vides support to plug that gap. In explaining a few new analyses, we have noted that they are, in some cases, still preliminary. We purposely share these analyses publicly at this stage for com-ment, feedback and refinement, so that the FCC can improve their accuracy and usefulness as inputs to the forthcoming rule-making proceeding on broadcast TV spectrum reallocation.
The natural tendency can be to seize on uncertainties and potential negative impacts and thereby marginalize the posi-tive impacts. With this in mind, in concluding we return to the Plan’s principles with regard to utilization of the nation’s
spectrum asset. Specifically, the Plan recommends the follow-ing goal for the country to adopt: “The United States should lead the world in mobile innovation, with the fastest and most extensive wireless networks of any nation.” A widespread and robust wireless broadband future will represent a remarkable advance for our country, and spectrum is a critical element of that future. Without a doubt, reallocating spectrum currently used for broadcast TV will involve challenges, but the benefits to innovation, productivity and America’s continued leadership in mobile broadband could be tremendous. Moreover, by lever-aging technological advances—toward more efficiently allotting TV channels and sharing channel capacity—and by unleashing market forces, the FCC can take this opportunity to transform spectrum policy in a way that allows multiple stakeholders to pursue their interests while achieving both longstanding and contemporary FCC goals. In the end, American consumers can be provided with both the broadband and broadcast services they most desire.
FeedbackAs noted above, we explicitly seek feedback on the range of issues discussed in this paper. Specific feedback channels include:
➤ Blogband (http://blog.broadband.gov/): We will issue a blog post that announces publication of this paper and links to it. Please comment through replies to this blog posting.
➤ Broadcast Engineering Forum: The FCC will host an upcoming Engineering Forum as announced by Chairman Genachowski at NAB 2010. Participation is welcome in person or via webcast. Specific date, location, and time will be announced shortly. Please check the FCC home page at www.fcc.gov as more details will be posted shortly.
➤ Public Comment: In the third quarter of this year, a Notice of Proposed Rule Making (NPRM) on broadcast spectrum will begin, at which point formal public com-ment will be sought. Information on the NPRM will be available through www.broadband.gov and www.fcc.gov. Public comments can be filed through the ECFS system: http://fjallfoss.fcc.gov/ecfs/upload/display?z=5akem
F e d e r a l c O m m u n I c a T I O n s c O m m I s s I O n | s P e c T r u m a n a l y s I s 3 5
O B I T e c h n I c a l P a P e r n O . 3
CONTRIBUTORSPrimary contributors to the Technical Paper: Phil Bellaria, Adam Gerson and Brian Weeks.
The primary contributors are grateful to their colleagues in the Omnibus Broadband Initiative and throughout the FCC for their professional support as well as specific feedback that informed the development of this Technical Paper. They would like to call out in particular the following individuals for having provided noteworthy input and support:
➤ FCC Omnibus Broadband Initiative ➤ Blair Levin ➤ Rebecca Hanson ➤ Tom Peters ➤ Ellen Satterwhite
➤ FCC Office of Engineering and Technology ➤ Julius Knapp ➤ Nam Pham ➤ Alan Stillwell ➤ Robert Weller
➤ FCC Office of General Counsel ➤ William Scher
➤ FCC Office of Strategy and Policy Analysis ➤ Evan Kwerel
➤ FCC Media Bureau ➤ Jessica Almond ➤ John Gabrysch ➤ Eloise Gore ➤ Hossein Hashemzadeh ➤ Thomas Horan ➤ William Lake ➤ Kris Monteith ➤ Robert Ratcliffe ➤ Scott Roberts ➤ Dana Scherer ➤ John Wong
➤ FCC Wireless Bureau ➤ John Leibovitz ➤ Ruth Milkman
➤ Other FCC Staff and Contractors ➤ Anthony Coubert ➤ Robert Eckert ➤ Dinesh Menon ➤ John Williams
Additionally, several TV broadcast stations hospitably opened the doors of their studios and transmission facilities and provided information and perspectives with regard to the themes of this Technical Paper. We are grateful for their collaboration.
3 6 F e d e r a l c O m m u n I c a T I O n s c O m m I s s I O n | W W W . B r O a d B a n d . G O V
E N D N O T E S
O B I T e c h n I c a l P a P e r n O . 3
1 MSTV and NAB Comments in re NBP PN #26 (Data Sought on Uses of Spectrum—NBP Public Notice #26, GN Docket Nos. 09-47, 09-51, 09-137, Public Notice, 24 FCC Rcd 14275 (WCB Dec. 2, 2009) (NBP PN #26)), filed Dec. 23, 2009, at 24.
2 John B. Horrigan, “Broadband Adoption and Use in America,” OBI Working Paper Series No. 1, February 2010, at 22 (Exhibit 14).
3 TVNewsCheck, Cautious Optimism Over State Of Stations, http://www.tvnewscheck.com/articles/2010/03/16/daily.4/?page=3 (last visited Apr. 29, 2010).
4 Other bands identified in the Plan include the upper 700 MHz D Block, the Advanced Wireless Service (AWS), Wireless Communications Service (WCS), and Mobile Satellite Service (MSS) bands. Broadcast TV bands include 54-72 MHz, 76-88 MHz, and 174-216 MHz in VHF, and 470-608 MHz and 614-698 MHz in UHF.
5 See, e.g., Evan R. Kwerel and John R. Williams, FCC Working Paper Series 27, Changing Channels: Voluntary Reallocation of UHF Television Spectrum, November 1992, available at http://www.fcc.gov/Bureaus/OPP/working_papers/oppwp27.pdf; FCC, Spectrum Policy Task Force Report, ET Docket No. 02-135, November 2002, available at http://hraunfoss.fcc.gov/edocs_public/attachmatch/DOC-228542A1.pdf; Advanced Television Systems and Their Impact Upon the Existing Television Broadcast Service, MM Docket No. 87-268, Fourth Report and Order, 11 FCC Rcd 17111 (1996).
6 Comment Sought on Spectrum for Broadband—NBP Public Notice #6, GN Docket Nos. 09-47, 09-51, 09-137, Public Notice, 24 FCC Rcd 12032 (WCB Sept. 23, 2009) (NBP PN #6).
7 CTIA Comments in re NBP PN #6, filed Nov. 6, 2009, at 31; Fibertower et al. Comments in re NBP PN #6, filed Nov. 6, 2009, at 2; CEA Comments in re NBP PN #6, filed Oct. 23, 2009, Attach, “The Need for Additional Spectrum for Wireless Broadband: The Economic Benefits and Costs of Reallocations,” at 4-10, 12-16.
8 NBP PN #26 supra note 1.9 CTIA Comments in re NBP PN #26, filed Dec. 22, 2009,
at 10; Local Television Broadcasters Comments in re NBP PN #26 filed Dec. 22, 2009, at 9; MSTV and NAB Comments in re NBP PN #26, filed Dec. 23, 2009, at 3.
10 See Appendix A for the propagation analysis using the Okumura-Hata model.
11 See generally FCC, Summary for Auction 73 (700 MHz Band), available at: http://wireless.fcc.gov/auctions/default. htm?job=auction_summary&id=73 (last visited Feb. 20, 2010). Dollars per megahertz of spectrum, per person reached ($ per megahertz-pop) is the convention used to estimate the market value of spectrum. In the 700 MHz auction, $ per megahertz-pop values ranged from $0.03 in Paducah, Ken., Cape Girardeau, Mo., and Harrisburg-Mt. Vernon, Ill. to $3.86 in Philadelphia. Value also differs as frequency changes. Notably, the VHF frequencies, and particularly “lower VHF” (54-72 MHz and 76-88 MHz), are considerably less attractive than UHF for mobile broadband. Future auctions may result in different valuations depending on market
conditions, demand for mobile broadband services, auction rules, technical license rules, and other factors.
12 This valuation assumes (1) that the total broadcast television industry enterprise value is $63.7B; (2) that the OTA audience is 14–19% of total TV viewership; (3) that the value of OTA broadcast television is $8.9–$12.2 billion; (4) that there is 294 megahertz of TV spectrum; and (5) that the United States has a population of 281.4 million people. These figures were calculated as follows. The total broadcast television industry’s enterprise value equals industry revenue multiplied by average operating margin and by average EBITDA multiple. See BIA/Kelsey, BIA/Kelsey Expects TV Station Revenues to End Year Lower Than Anticipated; Levels Last Seen in 1990s Predicted Through 2013 (press release), Dec. 22, 2009, http://www.bia.com/pr091222-IITV4.asp (BIA/Kelsey, TV Station Revenues) (estimating average broadcast television industry revenue to be $17.9 billion (2008 actual and 2009 estimate)). The average operating margin equals 35%, based on the average operating margin from company reports and the SEC filings of Belo Corp., Entravision Communications Corporation, Fischer Communications, Inc., Gannett Company, Gray Television, Hearst Corporation, LIN TV Corp., Nexstar Broadcasting Group, Sinclair Broadcast Group, Univision Communications, Inc., and Young Broadcasting, Inc. See United States Securities & Exchange Comm’n, EDGAR: Filings & Forms, http://www.sec.gov/edgar.shtml (last visited Mar. 5, 2010) (SEC EDGAR) (providing access to the filings of publicly held companies). The average EBITDA multiple equals 10.2, based on 2000–2009 monthly averages from the SEC filings of Gray Television, Inc., LIN TV Corp., Nexstar Broadcasting Group, and Sinclair Broadcast Group. See SEC EDGAR; Yahoo! Finance, http://finance.yahoo.com (last visited Mar. 5, 2010). Yahoo Finance was used to identify year-end stock share prices. The OTA TV audience is based on a range of estimates. See Nielsen Co., National Media Universe Estimate database (accessed Feb. 2010) (estimating 9.7% of viewers are OTA only); GAO, Digital Television Transition: Broadcasters’ Transition Status, Low -Power Station Issues, and Information on Consumer Awareness of the DTV Transition 11, GAO-08-881T (2008) available at http://www.gao.gov/new.items/d0888H.pdf (estimating 15% of viewers are OTA only and finding that ~21% of MVPD households have secondary TV sets that receive signals OTA). Assuming secondary TV sets are viewed 20% as often as primary sets, the overall OTA TV audience equals 9.7–15% plus 4.2%, or 14–19%. The value of OTA broadcast television equals the total enterprise value of the broadcast television industry times the OTA audience. The amount of TV spectrum equals 294 MHz, as allocated by the FCC. See Off. of Eng. & Tech., FCC Online Table of Frequency Allocations 17–18, 22, 26 (rev. Jan. 25, 2010) (updating 47 C.F.R. § 2.106), available at http://www.fcc.gov/oet/spectrum/table/fcctable.pdf. The U.S. population comes from the 2000 census. See United States Census Bureau, Fact Sheet: Census 2000 Demographic Profile Highlights, available
at http://factfinder.census.gov/servlet/SAFFFacts?geo_id=01000US&_geoContext=01000US (last visited Mar. 5, 2010).
13 Economist Coleman Bazelon calculated value at $0.15 per megahertz-pop. See CEA Comments in re NBP PN #6, filed Oct. 23, 2009, Attach. at 19.
14 CTIA, Semi-Annual Wireless Industry Survey, available at http://files.ctia.org/pdf/CTIA_Survey_Midyear_2009_Graphics.pdf.
15 Nielsen Co., National Media Universe Estimates, Nov. 1998–Feb. 2010 (2010).
16 The Nielsen Company, “Television, Internet and Mobile Usage in the U.S.” A2/M2 Three Screen Report, Volume 5, Second Quarter 2009, September 2, 2009. The Nielsen Company, Television Audience 2008 at 17, June 2009.
17 Nielsen Co., National Media Universe Estimates, Nov. 1998–Feb. 2010 (2010).
18 SNL Kagen, TV Network Summary (change parameters for different data sets), http://www.snl.com/interactivex/tv_NetworksSummary.aspx?Apply=Apply&Restore=&networktype=2&financialitemoperator=39917&summaryyearfromvalue=1999&summaryyeartovalue=2008 (last visited Feb. 16, 2010). While total ratings for all broadcast TV networks are less than those for all cable networks, the four major broadcast TV networks still receive the highest ratings of all individual networks.
19 Nielsen Co., National Media Universe Estimates, Nov. 1998–Feb. 2010 (2010).
20 BIA/Kelsey, TV Station Revenues.21 The latest employment figures from the U.S. Census
Bureau for broadcast TV show a 0.3% decline in total from 2002 to 2007. Compare U.S. Census Bureau, 2002 Economic Census Television Broadcasting Industry Statistics, http://factfinder.census.gov/servlet/IBQTable?-NAICS1997=513120&-ds_name=EC0251I2 (last visited Mar. 5, 2010), with U.S. Census Bureau, 2007 Economic Census Television Broadcasting Industry Statistics, http://factfinder.census.gov/servlet/IBQTable?-NAICS2007=515120&-ds_name=EC0751I1 (last visited Jan. 21, 2010). Data are not yet available for 2008 or 2009, when the most meaningful declines are likely to have occurred. NAB data indicates a 4.5% decline in industry employment in 2008. See NAB, NAB Television Financial Report 2 (2008); NAB, NAB Television Financial Report 2 (2009). The RTDNA-Hofstra Annual Survey indicated an additional 1.5% decline in local TV news employment in 2009. See RTDNA, http://www.rtdna.org/pages/posts/rtdnahofstra-survey-finds-tv-doing-more-with-less-optimism-on-staffing920.php?g=160 (last visited Apr. 15, 2010).
22 Cable Television Consumer Protection Act of 1992, Pub. Law 102-385, October 5, 1992.
23 Form 325 data collected from surveys conducted by the FCC Media Bureau. As any given station may successfully negotiate for retransmission consent fees with one MVPD and use must-carry with another, a station was identified in the retransmission consent bucket only if it successfully negotiated for fees with more than half of all relevant MVPDs in its market. Data
F e d e r a l c O m m u n I c a T I O n s c O m m I s s I O n | n a T I O n a l B r O a d B a n d P l a n 3 7
E N D N O T E S
O B I T e c h n I c a l P a P e r n O . 3
is available at http://www.fcc.gov/mb/engineering/325_raw_data.zip (last visited Apr. 30 2010)
24 Turner B’casting System, Inc. v. FCC, 520 U.S. 180 (1997).25 See, e.g,, Cablevision Sys. Corp. v. FCC, petition for cert.
filed (U.S. Jan. 27, 2010) (No. 09-901).26 See 47 C.F.R. §§ 73.623 (c) and (d). Stations may also
receive waivers to violate minimum separation distances by securing negotiated agreement with affected stations. See 47 C.F.R. § 73.623(g).
27 See 47 C.F.R. § 73.609 (a) (definition of zones).28 Separation distances for adjacent channel stations
reflect the fact that adjacent channels may interfere with each other if their transmitters are located within a certain distance from each other. For example, adjacent DTV channels in the UHF band can operate without interference if their transmitters are located within 24 km of each other, or beyond 110 km of each other. If transmitters for adjacent channels are located between 24 km and 110 km of each other, interference may occur. See 47 C.F.R. § 73.623 (d).
29 See 47 C.F.R. § 73.624 (b).30 Where the FCC has heavily constrained the use of
spectrum, as with the public/private partnership requirements for the 700 MHz D block, those significant restrictions have tended to lower the market value of that spectrum. The FCC did not meet the reserve price for the D block (best offer was $0.17 per MHz-pop vs. $1.28 per MHz-pop on average for the other blocks).
31 MSTV and NAB Comments in re NBP PN #26, filed Dec. 23, 2009, at 3, 4, and 5; Belo Corp. Comments in re NBP PN #26, filed Dec. 21, 2009, at 3-7; The Walt Disney Company Comments in re NBP PN #26, filed Dec. 22, 2009, at 4, and 5.
32 John B. Horrigan, “Broadband Adoption and Use in America,” OBI Working Paper Series No. 1, February 2010, at 22 (Exhibit 14).
33 See The Commercial Mobile Alert System, PS Docket No. 07-287, First Report and Order, 23 FCC Rcd 6144 (2008); The Commercial Mobile Alert System, PS Docket No. 07-287, Second Report and Order and Further Notice of Proposed Rulemaking, 23 FCC Rcd 10765 (2008); The Commercial Mobile Alert System, PS Docket 07-287, Third Report and Order, 23 FCC Rcd 12561 (2008).
34 Acceptable thresholds for service loss were 2.0% for evaluating channel and facilities changes during the DTV transition, 0.1% during the process of stations electing their post-transition channel, and 0.5% for evaluating post-transition channel and facilities changes. Acceptable thresholds will be determined in this case as part of the rulemaking proceedings.
35 The FCC assigned all broadcast stations interim channels to broadcast in digital before they had to shut off analog transmissions in June 2009. To complete the digital transition, stations could choose if they wanted to remain on their interim channel or, alternatively, move to another channel. Stations whose original analog channel was “core” (that is, in the bands that remained allocated to broadcast TV after the transition) could choose to return to their original channel. Stations whose original analog channel was “non-core” (no longer
allocated to broadcast TV post-transition) could choose from among remaining available digital channels.
36 See supra note 34. 37 See Appendix D for further description.38 See Appendix E for further explanation of the differences
between gross and net service gains (losses).39 This illustrative scenario assumes that there is space on
existing towers on the Empire State building to collocate transmission facilities from the remaining stations in the DMA.
40 See FCC, DTV Station Search, http://licensing.fcc.gov/cdbs/cdbs_docs/pa/dtvsearch/dtv_search.cfm (last visited Jan. 21, 2010). Station locations plotted in Google Earth using Earth Point “Excel to KML” tool, available at http://www.earthpoint.us/ExcelToKml.aspx.
41 Data ranges represent upper and lower bounds from public filings and assume current technology; future technologies could reduce the bandwidth required. See Hampton Roads Educational Telecommunications Association, Inc. Comments in re NBP PN #26, filed Dec. 22, 2009, at 4; WITF, Inc. Comments in re NBP PN #26, filed Dec. 22, 2009, at 4; Iowa Public Broadcasting Board Comments in re NBP PN #26, filed Dec. 22, 2009, at 4.
42 Channel sharing could also impact coverage and service areas for one or both stations that combine transmissions on to a single channel. See Chapter V infra, “Consumers” and “Broadcasters’ Current Revenue Streams” section for more details.
43 See “Viability of Channel Sharing for HD Programming” section infra for more details.
44 Id.45 Iowa Public Broadcasting Board Comments in re NBP
PN #26, filed Dec. 22, 2009, at 4.46 Letter from Bruce Leichtman, President, Leichtman
Research Group (LRG), to Marlene H. Dortch, Secretary, FCC, GN Docket Nos. 09-47, 09-51, 09-137 (Jan. 4, 2010) at 1.
47 Local Television Broadcasters Comments in re NBP PN #26, filed Dec. 23, 2009, at 4. Overall, approximately 50 percent of cable headends and 73 percent of DirecTV local collection facilities rely on OTA signals from broadcast TV stations. Letter from Jane E. Mago, Executive Vice President and General Counsel, Legal and Regulatory Affairs, National Association of Broadcasters, to Blair Levin, Executive Director, OBI, FCC, GN Docket Nos. 09-47, 09-51, 09-137 (Dec. 23, 2009) at 1.
48 The cost of fiber links may range from $1,500 to $12,000 per month per connection. Using fiber to reach cable head ends alone could cost $400 million to billions per year. See MSTV and NAB Comments in re NBP PN #26, filed Dec.22, 2009, at 20-22.
49 Id. at 40.50 The results presented for the Without Border
Restrictions channel sharing scenario do not represent the optimal scenario—a scenario that would result in fewer stations sharing channels and changing channel assignments could be achieved that would recover the same amount of spectrum.
51 All of the scenario results presented in this paper are on a per station basis, and do not suggest total loss of OTA television service by any individual or market. Also, note that in some cases the combined total number of stations with no change in service area and the number of stations with gross gains and losses in service area is greater than the total number of full-power stations in the country, as some stations experience both gross gains and gross losses.
52 Incidentally, in this case, the viewer’s “channel 7” may not currently be broadcasting over radiofrequency channel 7 (174-180 MHz). PSIP and the DTV transition led to widespread decoupling of virtual and radiofrequency channels.
53 For example, the FCC authorized the prospective “emerging technology” licensees, which ended up being the PCS operators, to compensate incumbent point-to-point microwave licensees to vacate spectrum sooner than they were entitled under the established transition period. See Redevelopment of Spectrum to Encourage Innovation in the Use of New Telecommunications Technologies, ET Docket No. 92-9, First Report and Order and Third Notice of Proposed Rulemaking, 7 FCC Rcd 6886, 6886-87 ¶¶ 4-5 (1992) (“Redevelopment of Spectrum First R&O”)
54 The Walt Disney Company Comments in re NBP PN #26, filed Dec. 22, 2009, at 1.
55 Letter from William J. Bailey, The Walt Disney Company, to Marlene H. Dortch, Secretary, FCC, GN Docket Nos. 09-47, 09-51, 09-137 (Feb. 16, 2010) (Disney Feb. 16, 2010 Ex Parte) at 1.
56 Disney Feb. 16, 2010 Ex Parte at 1.57 For example, at the NAB 2010 Convention (April 11-15,
2010), Grass Valley demonstrated the simultaneous broadcast of two sporting events in 720p HD resolution.
58 WBOC broadcasts network, syndicated, and local news programming in HD on the CBS affiliate; it plans to broadcast syndicated and local news, but not network programming, in HD on the Fox affiliate.
59 Letter from Craig Jahelka, Vice President and General Manager, WBOC 16, to Marlene H. Dortch, Secretary, FCC, GN Docket Nos. 09-47, 09-51, 09-137 (Jan. 15, 2010) at 1. In a follow-up filing, Jahelka points out that multicasting HD channels is made possible through statistical multiplexing equipment and the station’s ability to control simultaneous programming such that primary and secondary streams can be allocated more or less bandwidth at certain times. In essence, license flexibility to control the full bandwidth allocation of a 6 megahertz channel allows WBOC to operate most efficiently. Letter from Craig Jahelka, Vice President and General Manager, WBOC 16, to Marlene H. Dortch, Secretary, FCC, GN Docket Nos. 09-47, 09-51, 09-137 (Jan. 29, 2010) at 1-2.
60 See Matthew S. GoldMan, “It’S not dead Yet!”—MPeG-2 VIdeo CodInG effICIenCY IMProVeMentS (2009), attached to Letter from Matthew Goldman, Vice President of Technology, TANDBERG Television, part of the Ericsson Group, to Marlene H. Dortch, Secretary, FCC (Jan. 22, 2010) at 1 (“TANDBERG Jan. 22, 2010 Ex Parte”).
3 8 F e d e r a l c O m m u n I c a T I O n s c O m m I s s I O n | W W W . B r O a d B a n d . G O V
E N D N O T E S
O B I T e c h n I c a l P a P e r n O . 3
61 TANDBERG Jan. 22, 2010 Ex Parte at 1. In estimating potential efficiency gains for HD streams, Tandberg’s Matthew Goldman was specifically referring to 720p streams.
62 Id. at 4. Chart represents a study of bitrate efficiency gains in SD streams by Tandberg Television. Tandberg technologists expect efficiency gains in HD streams to exceed the 15% gains in SD. PSNR stands for Peak Signal to Noise ratio and is a commonly used measure of video quality. See Alan Clark, “Clarifying Video Quality Metrics,” TMCnet.com, April 11, 2006 (http://www.tmcnet.com/news/2006/04/11/1561303.htm).
63 U.K. Office of Communications (Ofcom), The Future of Digital Terrestrial Television (2007) at 5, available at http://www.ofcom.org.uk/consult/condocs/dttfuture/dttfuture.pdf.
64 There are at least 85 Internet-Enabled TV models (IETVs) on the market. 2009 sales exceeded 14M and by 2013 sales are projected to exceed 87M, at which point 60% of TVs shipped in the US will be IETVs. See iSuppli, “Internet Sales to Rise Sixfold by 2013,” http://www.isuppli.com/News/Pages/Internet-TV-Sales-to-Rise-Six-fold-by-2013.aspx (last visited March 22, 2010); and Lance Whitney, CNET, “More TVs hopping onto the Internet,” http://news.cnet.com/crave/?keyword=TVs, (last visited March 22, 2010).
65 In progressive scanning, each frame is displayed in its entirety on-screen for 1/60th of a second. The quality is like watching 60 full images per second on TV. In interlaced scanning, all the lines are not displayed on-screen simultaneously. Instead, every other line is displayed for 1/60th of a second and then the alternate lines are displayed for 1/60th of a second. The quality is like watching 60 images per second on TV, but each image only contains half of the full picture. The brain cannot perceive the alternating effect of interlacing, but the eyes may notice blurred picture quality in certain circumstances of high-movement programming.
66 Pixels/second = pixels per frame * fields per sec * frames per field. For 1080i streams, this equates to 62,208,000 pixels/second (1080 * 1920 * 60 * 0.5); for 720p streams, this equates to 55,296,000 pixels/second (720 * 1280 * 60 * 1.0).
67 Other factors outside the control of broadcasters—such as size and quality of the television display, distance to the television, quality of viewers’ vision, and the ability of the eyes to perceive and the brain to process picture quality differences—impact the HD viewing experience and tend to smooth out quality differences somewhat between signals. Consumers rarely compare OTA HD signals side-by-side under exactly the same conditions, and review sites and enthusiasts tend to compare HD signal quality across all video platforms rather than across individual OTA stations (see example at http://www.cnet.com/1990-7874_1-5108854-1.html)
68 For a full description of the data capture methodology, see Appendix F. Note that eight of the nine stations in Exhibit L are licensed to the Washington DC DMA. WMPT, a PBS affiliate, is licensed to Annapolis, MD (Baltimore DMA), but its signal can be received in certain areas within the Washingon DC DMA.
69 The Open Mobile Video Coalition (OMVC) has not formally launched mobile DTV service; however, at the time of data capture there was a trial program underway in Washington, DC.
70 “This Emotional Life” is a feature program that includes both “talking head” interviews as well as candid, documentary-style footage of subjects engaged in a variety of day-to-day activities.
71 Bitrate capture methodology averages bitrates across -second intervals. It is therefore plausible that bitrates may exceed cited figures in shorter intervals. For more information on bitrate capture methodology see Appendix F.
72 Both mobile DTV channels and fixed multicast channels are considered side channels in this analysis. See Appendix G for more details on outputs from the regression analysis.
73 The process captured a second 9-minute segment of “College Football” on WTTG. The summary bitstream data from that segment was in Mbps: Max, 17.4; Avg, 14.4; StDev, 1.3.
74 Analysis captures 24/7 programming for one week from Wednesday, Dec 9 to Tuesday, Dec 15, 2009. Program listings and HD and SD program classifications taken from zap2ittv.com. High vs. low movement classification determined using methodology described in Appendix H.
75 The particular pairing combination here is the most advantageous among the possible combinations of the eight stations in question.
76 47 U.S.C. § 309( j)(1) requires the FCC to use auctions to select between mutually exclusive applications for initial licenses or construction permits. That requirement most likely would apply to spectrum in the broadcast TV bands that the FCC reallocates for flexible use.
77 See Tests of ATSC 8-VSB Reception Performance of Consumer Digital Television Receivers Available in 2005, OET Report, FCC/OET TR 05-1017 (Nov. 2, 2005) available at http://www.fcc.gov/oet/info/documents/reports/TR-05-1017-ATSC-reception-testing.pdf; Interference Rejection Thresholds of Consumer Digital Television Receivers Available in 2005 and 2006, OET Report, FCC/OET 07-TR-1003, (Mar. 30, 2007) available at http://www.fcc.gov/oet/info/documents/reports/DTV_Interference_Rejection_Thresholds-03-30-07.pdf; and DTV Converter Box Test Program—Results and Lessons Learned, OET Report, FCC/OET 9TR 1003, (Oct. 9, 2009) available at http://www.fcc.gov/oet/info/documents/reports/9TR1003-ConverterBoxTestReport.pdf.
78 See 47 U.S.C. § 534.79 Thomas W. Hazlett Comments in re NBP PN #26, filed
Dec. 18, 2009, at 9.80 See Amendment of Parts 21 and 74 of the Commission’s
Rules with regard to Filing Procedures in the Multipoint Distribution Service and in the Instructional Television Fixed Service; Implementation of Section 309( j) of the Communications Act-Competitive Bidding, MM Docket No. 94-131, PP Docket No.93-253, Report and Order, 10 FCC Rcd 9589, 9612 (1995); Amendment of the Commission’s Rules Regarding Multiple Address Systems, WT Docket No.97-81, Report and Order, 15 FCC Rcd
11956, 11984 (2000); Amendment of the Commission’s Rules Regarding the 37.0-38.6 GHz and 38.6-40.0 GHz Bands; Implementation of Section 309( j) of the Communications Act-Competitive Bidding. 37.0-38.6 GHz and 38.6-40.0 GHz, ET Docket No. 95-183, PP Docket 93-253, Report and Order and Second Notice of Proposed Rulemaking, 12 FCC Rcd 18600,18637-38(1997); Auction of Broadband Radio Service (BRS) Licenses Scheduled for October, AU Docket No.09-56, Public Notice, 24 FCC Rcd 8277, 8288 (WTB 2009).
81 Auction data available on FCC auction website: http://wireless.fcc.gov/auctions/default.htm?job=auctions_home (last visited Feb. 18, 2010).
82 See Om Malik, AT&T Buys 700 MHz Spectrum Licenses, GigaOm, Oct. 9, 2007, http://gigaom.com/2007/10/09/att-buys-700-mhz-spectrumlicenses/.
83 See generally FCC, Summary for Auction 73 (700 MHz Band), http://wireless.fcc.gov/auctions/default.htm?job=auction_summary&id=73 (last visited Feb. 20, 2010). Dollars per megahertz-pop metric for Chicago calculated using auction proceeds for the A, B, and E blocks. Paducah metric calculated using the A and E blocks.
84 This analysis is not intended to imply that Chicago has been predetermined to be a market where additional spectrum will be needed or where a future auction will be conducted.
85 This valuation estimates are based on (1) average 2008/2009 estimated revenue for the Chicago market of $734.9 million; (2) market revenue share of 19.8% and 0.1% for the top-rated and 15th rated station, respectively; (3) 2007/2008 average cash flow margin of 39% for stations in the top 10 DMAs; and (4) an industry trading multiple of 10.2x cash flow. These figures were calculated as follows. The average 2008/2009 Chicago market revenue was multiplied by each station’s market revenue share. See BIA Advisory Services, Investing in Television Market Report: 2009 First Edition, TV Mkt Rank: 3 (2009). Each product was multiplied by the average cash flow margin. See NAB, NAB Television Financial Report at 4 and 5 (2008); NAB, NAB Television Financial Report at 4 and 5 (2009). Each product was then deemed to be the station’s cash flow and was multiplied by the industry trading multiple (See supra note 12 on derivation of trading multiple) to calculate the two valuations.
86 For example, full-power stations directly use a median of 120 megahertz (20 channels) out of 294 megahertz total in the top 10 DMAs; full-power stations in the most congested DMA, Los Angeles, directly use 156 megahertz (26 channels); across all 210 DMAs, full-power stations directly use a median of 42 megahertz (7 channels). FCC, DTV Station Search, http://licensing.fcc.gov/cdbs/cdbs_docs/pa/dtvsearch/dtv_search.cfm (last visited Jan. 21, 2010).
87 Digital Television Distributed Transmission System Technologies, MB Docket No. 05-312, Report and Order, 23 FCC Rcd 16731, 16732,¶ 1 (2008) (DTS Report and Order). See also CTIA & CEA Comments in re NBP PN #26, filed Dec. 22, 2009, at 9–17.
88 CTB Group, Inc. Comments in re NBP PN #26, filed Dec. 22, 2009, at 4. Letter from Peter Tannenwald, Counsel for
F e d e r a l c O m m u n I c a T I O n s c O m m I s s I O n | n a T I O n a l B r O a d B a n d P l a n 3 9
E N D N O T E S
O B I T e c h n I c a l P a P e r n O . 3
CTB Group, Inc., to Marlene H. Dortch, Secretary, FCC, GN Docket No. 09-51, MB Docket No. 05-312, RM 11574 (Jan. 15, 2010) (CTB Group, Inc. Jan. 15, 2010 Ex Parte) at 10. An MFN would require the FCC to grant additional licenses and/or modify existing licenses.
89 CTIA and CEA estimate the cost to implement this type of architecture at $1.4–$1.8 billion. CTIA & CEA Comments in re NBP PN #26, filed Dec. 22, 2009, at 3.
90 CTIA and CEA estimate the amount of spectrum that could be freed at 100–180 megahertz. Id.
91 DTS Report and Order at 16732, ¶1.92 NTIA disbursed $1.4B on the converter box program.
See http://www.ntia.doc.gov/dtvcoupon/reports/NTIA_DTVWeekly_120909.pdf. With an illustrative budget of $1.4B, the FCC could compensate 1.5M-7M households, based on the scale of the subsidy. $1.4B covers up to 1.5M HH assuming a lifetime subsidy of present value $930. See Coleman Bazelon attachment to CEA Comments “The Need for Additional Spectrum for Wireless Broadband: The Economic Benefits and Costs of Reallocations,” at 17. $1.4B covers up to 7M HH with a 5-10 year subsidy of present value $200, which Hazlett posits as reasonable, and 4.7M HH with a subsidy of $300, which Hazlett suggests be considered the upper bound for subsidization. See Hazlett Comments in re NBP PN #26, filed Dec. 18, 2009, at 11-12. This paper does not attempt to model potential auction proceeds based on price elasticity or other factors; however, given the broadband spectrum value ($1.28/megahertz-pop) and US population (281.4M) figures cited above from the 700 MHz auction in 2008, a single 6 megahertz channel could yield gross proceeds of $2.2B at auction, 54 megahertz could yield $19.5B and 120 megahertz could yield $43B. None of these figures net out potentially reimbursable relocation costs to broadcast stations.
93 The FCC should continue to recognize that “Congress intended [47 U.S.C. § 307(b)] to check the inevitable economic pressure to concentrate broadcast service in urban areas at the expense of service to smaller communities and rural areas.” Educational Information Corporation For Modification of Noncommercial
Educational Station WCPE (FM) Raleigh, North Carolina, Memorandum Opinion and Order, 12 FCC Rcd 6917, 6920 (1997) (citing Pasadena Broad. Co. v. FCC, 555 F.2d 1046, 1049–50 (D.C. Cir. 1975)).
94 For example, DMAs with more than 1 million TV homes have a median of 16 full-power stations, while DMAs with fewer than 1 million TV homes have a median of 6. FCC, DTV Station Search, http://licensing.fcc.gov/cdbs/cdbs_docs/pa/dtvsearch/dtv_search.cfm (last visited Jan. 21, 2010). The FCC is required to allocate channels among States and communities so as to provide a “fair, efficient, and equitable distribution” of service, 47 U.S.C. § 307(b), and should ensure minimum service levels in each market as determined by the rule-making proceeding and pursuant to its § 307(b) mandate.
95 Television Bureau of Advertising, A Look at 2010, at 34 (2009).
96 See supra note 12 (for OTA-only viewer proportion). 97 MSTV and NAB Comments in re NBP PN #26, filed
Dec. 23, 2009, at 10. 98 Sezmi Corporation Comments in re NBP PN #26, filed
Dec. 23, 2009, at 1–2.99 FCC Form 317 Reports. Commercial and
noncommercial educational DTV broadcast station licensees report annually whether they have provided ancillary or supplementary services during the 12-month period preceding September 30. The stations providing feeable ancillary or supplementary services must pay 5% of the revenues received from such services to the FCC.
100 Television Bureau of Advertising: A Look at 2010, 34 (2009).
101 “Copps eyeing DTV side channels,” TVBR.com (http://www.rbr.com/tv-cable/17248.html )
102 Harris Corporation Comments in re NBP PN #26, filed Dec. 22, 2009, at 4.
103 OMVC, Mobile Digital TV Gains Momentum with Broadcasters, http://www.openmobilevideo.com/_assets/docs/press-releases/2010/OMVC-at-NAB-Overview-FINAL.pdf (last visited Apr. 29, 2010); and Open Mobile Video Coalition Comments in re NBP PN #26, filed Dec. 22, 2009, at 8.
104 See John Fletcher, SNL Kagen (a division of SNL Financial LLC), Comparing Broadcast Mobile TV Services: Japan, South Korea, Italy, U.S. (2009).
105 MediaFLO service delivers mobile video over spectrum that Qualcomm bought at auction. See results from Auction 73 (700 MHz Band): http://wireless.fcc.gov/auctions/default.htm?job=release&id=72&y=2008.
106 See Broadcast Engineering, OMVC Concurs with NAB Study; Mobile Digital TV Service Could Generate Billions (2008).
107 Colby M. May Comments on behalf of Trinity Broadcasting Network in re NBP PN #26, filed Dec. 22, 2009, at 1; PBS, CPB and APTS Comments in re NBP PN #26, filed Dec. 21, 2009, at 17. Note that PBS et al. point out that bit rate needs for mobile DTV can range up to 4-5 Mbps.
108 Consolidated Appropriations Act of 2000, § 5008 (Community Broadcasters Protection Act of 1999), Pub. L. No. 106-113, 113 Stat. 1501 (1999) (codified at 47 U.S.C. § 336 (2009)) (“Community Broadcasters Protection Act of 1999”). FCC, Broadcast Station Totals as of December 2009, available at: http://www.fcc.gov/mb/audio/totals/index.html
109 Data aggregated from FCC’s Media Bureau, CDBS Station Search, http://licensing.fcc.gov/prod/cdbs/pubacc/prod/sta_sear.htm (last visited Mar. 2, 2010). The data represents results for service parameters “TV translator or LPTV station”, “Class A station”, “Digital TV translator or LPTV station”, and “digital Class A station” and station status parameters “licensed” and “licensed and silent.”
110 Including translators, about 14% of low power TV stations are currently broadcasting in digital. See id.
111 The FCC concluded that it has authority to establish a DTV Transition data for LPTV stations in Amendment of Parts 73 and 74 of the Commission’s Rules to Establish Rules for Digital Low Power Television, Television Translator, and Television Booster Stations and to Amend the Rules for Digital Class A Television Stations, Report & Order, 19 FCC Rcd 19331, 19336-39 ¶¶ 11-19 (2004).
112 NTIA, Low Power Television and Translator Digital Upgrade Program, http://www.ntia.doc.gov/lptv/index.html (last visited Feb, 12, 2010)
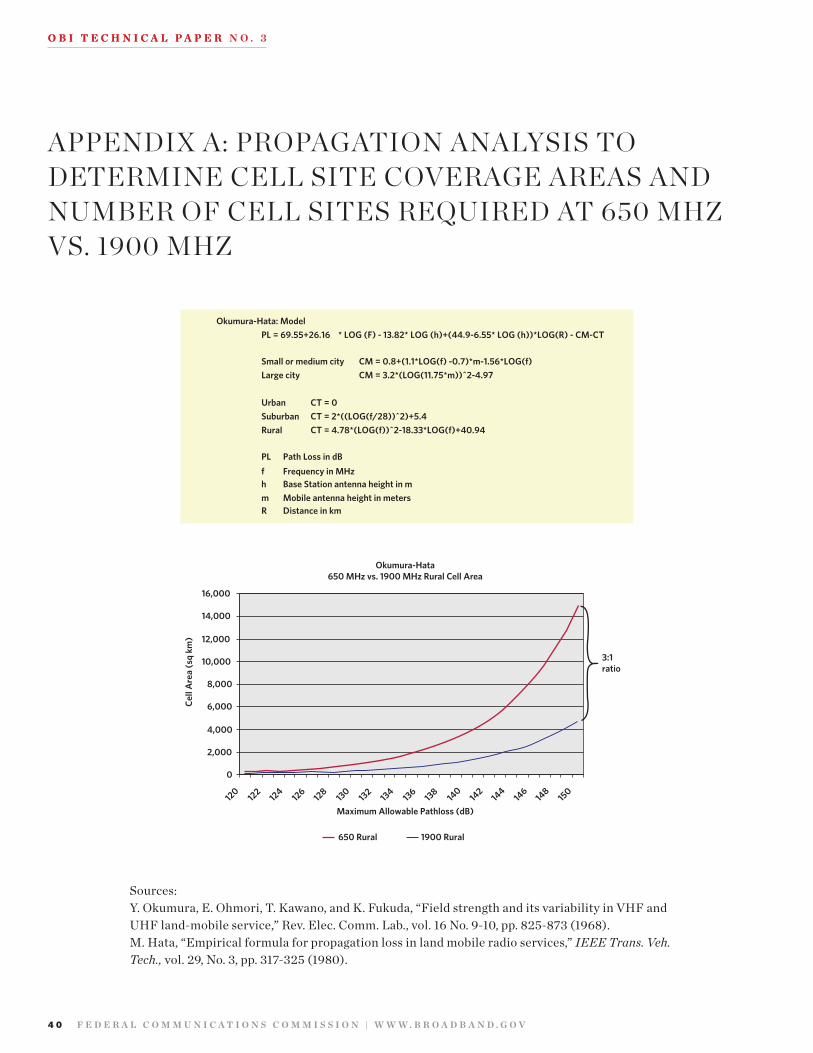
4 0 F e d e r a l c O m m u n I c a T I O n s c O m m I s s I O n | W W W . B r O a d B a n d . G O V
O B I T e c h n I c a l P a P e r n O . 3O B I T e c h n I c a l P a P e r
APPENDIx A: PROPAgATION ANALySIS TO DETERMINE CELL SITE COvERAgE AREAS AND NUMBER OF CELL SITES REqUIRED AT 650 MHz vS. 1900 MHz
Sources:Y. Okumura, E. Ohmori, T. Kawano, and K. Fukuda, “Field strength and its variability in VHF and UHF land-mobile service,” Rev. Elec. Comm. Lab., vol. 16 No. 9-10, pp. 825-873 (1968).M. Hata, “Empirical formula for propagation loss in land mobile radio services,” IEEE Trans. Veh. Tech., vol. 29, No. 3, pp. 317-325 (1980).
PL = 69.55+26.16 * LOG (F) - 13.82* LOG (h)+(44.9-6.55* LOG (h))*LOG(R) - CM-CT
Small or medium city CM = 0.8+(1.1*LOG(f) -0.7)*m-1.56*LOG(f) Large city CM = 3.2*(LOG(11.75*m))^2-4.97
Urban CT = 0Suburban CT = 2*((LOG(f/28))^2)+5.4Rural CT = 4.78*(LOG(f))^2-18.33*LOG(f)+40.94
PL Path Loss in dBf Frequency in MHzh Base Station antenna height in mm Mobile antenna height in metersR Distance in km
Okumura-Hata: Model
120
122
124
126
128
130 132 134 136 138 140
142
144
146
148
150
Cell
Are
a (s
q km
)
3:1ratio
Okumura-Hata650 MHz vs. 1900 MHz Rural Cell Area
0
2,000
4,000
6,000
8,000
10,000
12,000
14,000
16,000
650 Rural 1900 Rural
Maximum Allowable Pathloss (dB)
F e d e r a l c O m m u n I c a T I O n s c O m m I s s I O n | s P e c T r u m a n a l y s I s 4 1
O B I T e c h n I c a l P a P e r n O . 3
APPENDIx B: SIMULATED ANNEALINg
The following description of the simulated annealing method-ology and its original role in channel allocations for the DTV comes from Advanced Television Systems and Their Impact on the Existing Television Broadcast Service, MM Docket 87-268, Sixth Report and Order, 12 FCC Rcd 14588 (1997).
197. The development of a table of digital TV allotments is an ex-tremely difficult and complex engineering and computational task. To handle this task, the staff of the Commission’s Office of Engineering and Technology has developed sophisticated operations research methodology and computer software for optimizing the allotment of DTV channels. In addition, our staff and industry have worked together to incorporate methodologies for calculating the service area and interference considerations that are required under a service replication allotment approach. We used the allotment capabilities provided by this methodology and computer software in preparing both the draft and final versions of the DTV Table of Allotments.
198. The computer model developed by the FCC staff generates DTV allotments that optimize and balance the various policy objec-tives and proposals discussed above. The computer software incor-porates an operations research optimization methodology known as “simulated annealing.”1 This methodology employs a system of penalties that attach to conditions that fall short of specified objec-
1 See David S. Johnson, Cecilia R. Aragon, Lyle McGeoch and Catherine Schevon, “Opti-mization by Simulated Annealing: An Experimental Evaluation, Part II (Graph Coloring and Number Partitioning),” Operations Research, Vol. 39, (May-June 1991).
tives. The simulated annealing method seeks to minimize the sum of these penalties, or “costs,” to achieve an optimum condition.
199. The computer model permits the rapid computation and analysis of service area coverage provided by the NTSC and DTV systems, both on an overall cumulative basis and for individual sta-tions. The service area of an individual NTSC station is defined as the area within the station’s Grade B service contour, reduced by any interference; and is computed based upon the actual transmitter lo-cation, power, and antenna height. The service area of a DTV station is defined as the area contained within the station’s noise-limited service contour, reduced by the interference within that contour. DTV coverage calculations assume locations and antenna heights identical to those of the replicated companion NTSC station and power generally sufficient to achieve noise-limited coverage equal to the companion station’s Grade B coverage.
200. We also recognized that there may be instances where the al-lotment of channels in specific local situations can best be resolved on a case-by-case basis. Our allotment software therefore is able to merge specific local designs into complete tables and, where neces-sary, make changes in other allotments to preserve a balance of the specified policy considerations. This capability allows us to incor-porate, where feasible, allotment/pairing agreements reached by broadcasters in negotiated settlements. In evaluating the feasibility of local agreements, we considered whether incorporation of given agreements would still allow us to meet our specified policy criteria.
4 2 F e d e r a l c O m m u n I c a T I O n s c O m m I s s I O n | W W W . B r O a d B a n d . G O V
O B I T e c h n I c a l P a P e r n O . 3
APPENDIx C: OPTIMIzATION MODEL FORMULATION
Technical Details ➤ Utilization of Integer Programming model, and the commercial CPLEX software by Ilog (an IBM company). ➤ The CPLEX software implements well-tested algorithms to solve very large-scale optimization problems and can provide a clear measure of the quality (optimality) of the solution achieved at user-specified intervals during the execution of the model.
➤ Full formulation and notation definitions are included below.
Scope and Assumptions ➤ The model seeks to clear a contiguous block of channels, starting at the top of the UHF band (Channel 51) and, if the option to include VHF channels is selected, the bottom of the VHF bands (Channel 2). Note that this parameter can be adjusted: The model can be run to clear from the top or bottom of any block of channels (not just extremes of the UHF and VHF bands).
➤ Phase I of the model does not consider the impact on the viewers (OTA households) due to station reassignment, relocation, channel sharing or relaxation of the interference constraints. The Phase II enhancement will consider these cost/benefit tradeoffs due to co-location or relaxation of interference restrictions.
➤ The model assumes that current channel assignments to stations that violate the co-channel or adjacent channel spacing restrictions are feasible for the violating station pair. The model can allow the user to extend these allowable violations to other station pairs currently located on those same towers.
➤ The model does not incorporate terrain conditions in order to determine the minimum allowable spacing between stations. However, the model allows users to selectively relax the spacing restrictions between pairs of station facilities in a DMA based on an assessment of terrain or other considerations.
➤ The model allows users to include or exclude land mobile radio system (LMRS) and Class A low-power TV station allot-ments, and to relax the LMRS assignments to pack them into fewer channels near the bottom of channels 14 –20, if possible.
➤ The model gives the option of allowing or not allowing channel reassignments between VHF and UHF bands. For example, if the option to allow re-assignments across bands is chosen, a station using channel 22 in the UHF band may be assigned channel 12 in the upper VHF band.
➤ The model allows users to include or exclude consideration of the channel allotments and related restrictions along the Canadian and Mexican borders; in addition, if the user opts to include these allotments and restrictions in Canada, the user will have the option to limit such allotments to include only those currently occupied by operational stations.
ObjectivesThe model can be executed to solve for any of the following five objectives: 1) Maximize the number of channels cleared at the top of the UHF band and the bottom of the VHF bands, if option to
include VHF channels is selected. 2) Minimize the number of stations moved to a different tower. 3) Minimize the number of stations sharing channels. 4) Minimize the number of stations sharing channels, where each station is weighted by DMA station count, i.e. the cost
of channel sharing between stations will be higher in markets with fewer stations. 5) Minimize the total number of station channel reassignments and relocations.
All objectives use the set of constraints concerning minimum distance spacing, border restrictions, land mobile channels, maxi-mum number of stations that can be moved or consolidated on channels through channel sharing, and the basic set of assignment constraints (every station is assigned a channel and a tower facility). These are discussed in detail in the Constraints section.
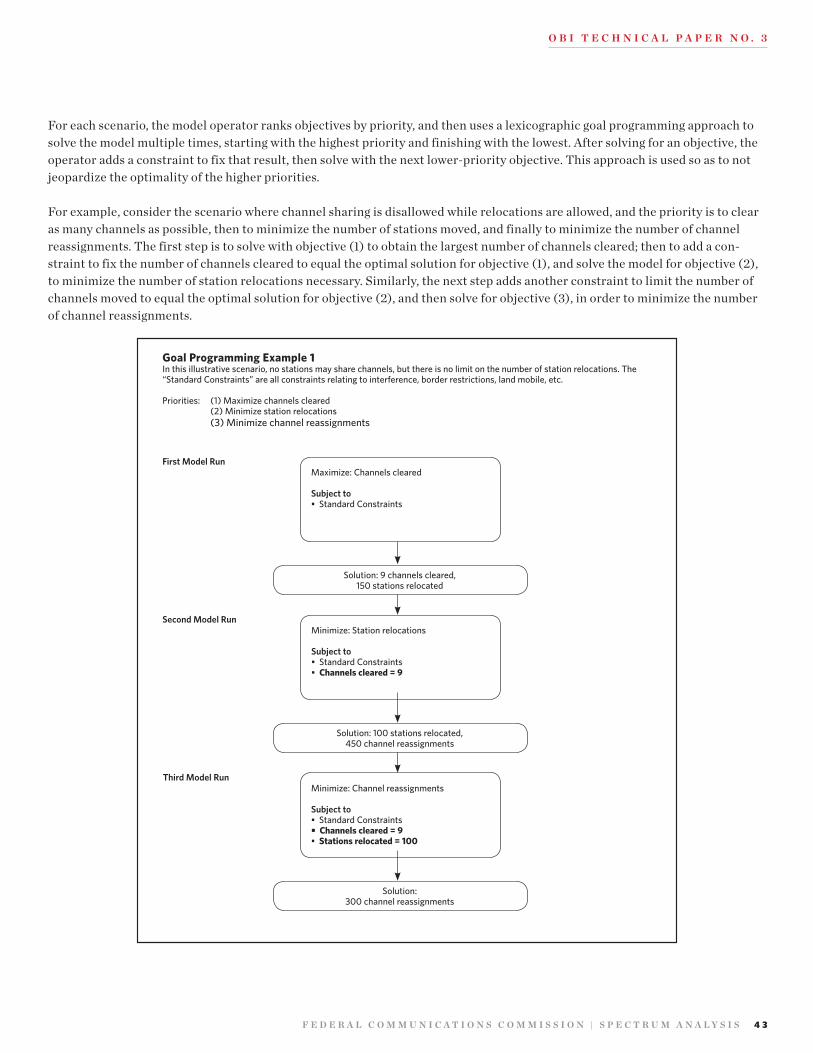
F e d e r a l c O m m u n I c a T I O n s c O m m I s s I O n | s P e c T r u m a n a l y s I s 4 3
O B I T e c h n I c a l P a P e r n O . 3
For each scenario, the model operator ranks objectives by priority, and then uses a lexicographic goal programming approach to solve the model multiple times, starting with the highest priority and finishing with the lowest. After solving for an objective, the operator adds a constraint to fix that result, then solve with the next lower-priority objective. This approach is used so as to not jeopardize the optimality of the higher priorities.
For example, consider the scenario where channel sharing is disallowed while relocations are allowed, and the priority is to clear as many channels as possible, then to minimize the number of stations moved, and finally to minimize the number of channel reassignments. The first step is to solve with objective (1) to obtain the largest number of channels cleared; then to add a con-straint to fix the number of channels cleared to equal the optimal solution for objective (1), and solve the model for objective (2), to minimize the number of station relocations necessary. Similarly, the next step adds another constraint to limit the number of channels moved to equal the optimal solution for objective (2), and then solve for objective (3), in order to minimize the number of channel reassignments.
First Model Run
Second Model Run
Third Model Run
Goal Programming Example 1In this illustrative scenario, no stations may share channels, but there is no limit on the number of station relocations. The “Standard Constraints” are all constraints relating to interference, border restrictions, land mobile, etc.
Priorities: (1) Maximize channels cleared (2) Minimize station relocations (3) Minimize channel reassignments
Maximize: Channels cleared
Subject to• Standard Constraints
Solution: 9 channels cleared, 150 stations relocated
Minimize: Station relocations
Subject to• Standard Constraints• Channels cleared = 9
Solution: 100 stations relocated, 450 channel reassignments
Minimize: Channel reassignments
Subject to• Standard Constraints• Channels cleared = 9• Stations relocated = 100
Solution: 300 channel reassignments
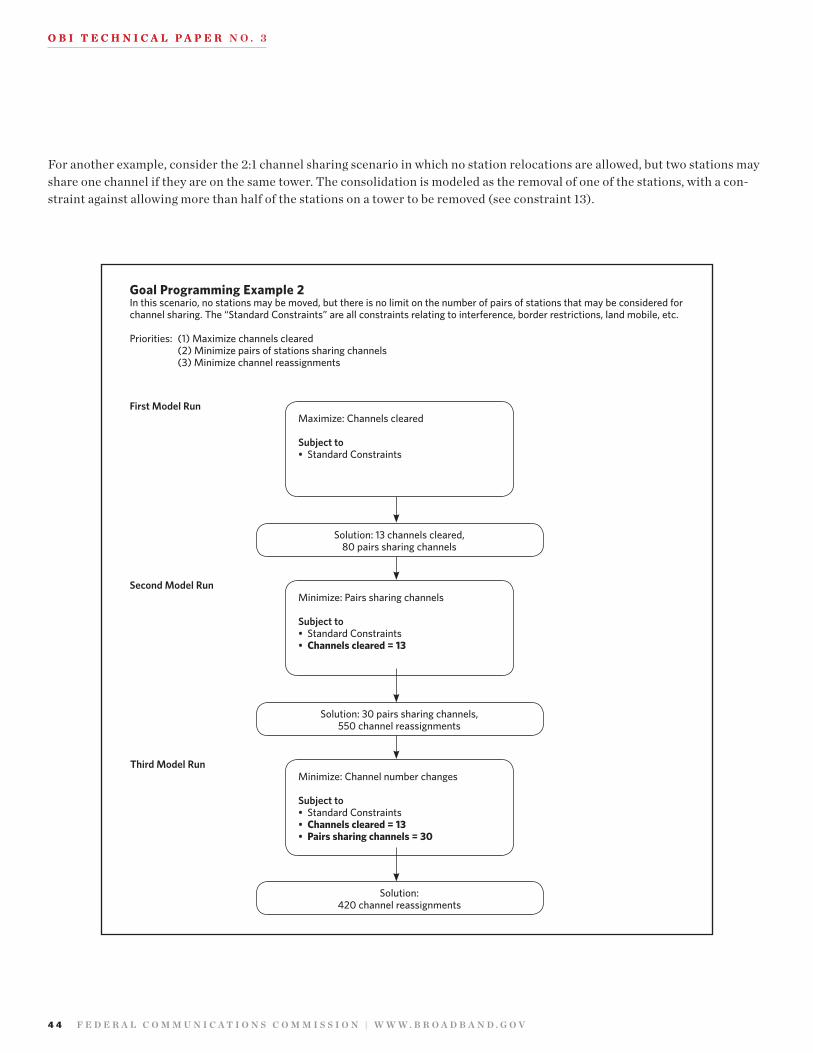
4 4 F e d e r a l c O m m u n I c a T I O n s c O m m I s s I O n | W W W . B r O a d B a n d . G O V
O B I T e c h n I c a l P a P e r n O . 3O B I T e c h n I c a l P a P e r
For another example, consider the 2:1 channel sharing scenario in which no station relocations are allowed, but two stations may share one channel if they are on the same tower. The consolidation is modeled as the removal of one of the stations, with a con-straint against allowing more than half of the stations on a tower to be removed (see constraint 13).
First Model Run
Second Model Run
Third Model Run
Goal Programming Example 2In this scenario, no stations may be moved, but there is no limit on the number of pairs of stations that may be considered for channel sharing. The “Standard Constraints” are all constraints relating to interference, border restrictions, land mobile, etc.
Priorities: (1) Maximize channels cleared (2) Minimize pairs of stations sharing channels (3) Minimize channel reassignments
Maximize: Channels cleared
Subject to• Standard Constraints
Solution: 13 channels cleared, 80 pairs sharing channels
Minimize: Pairs sharing channels
Subject to• Standard Constraints• Channels cleared = 13
Solution: 30 pairs sharing channels, 550 channel reassignments
Minimize: Channel number changes
Subject to• Standard Constraints• Channels cleared = 13• Pairs sharing channels = 30
Solution: 420 channel reassignments
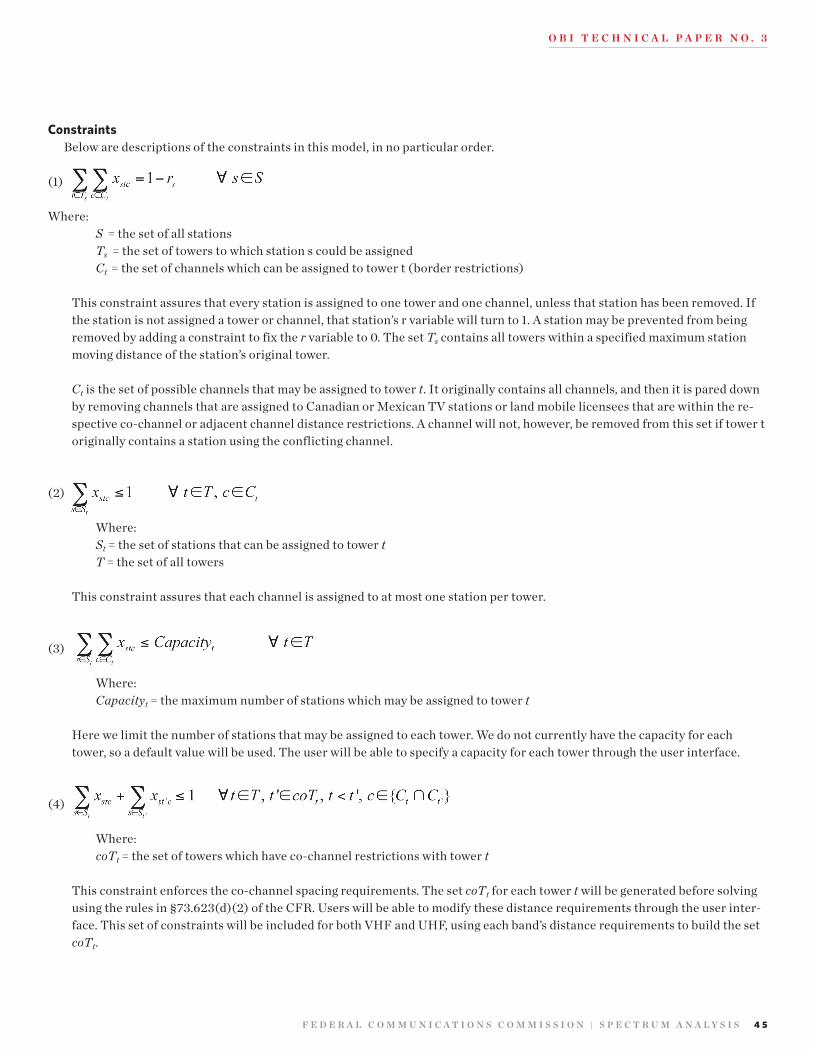
O B I T e c h n I c a l P a P e r n O . 3
F e d e r a l c O m m u n I c a T I O n s c O m m I s s I O n | s P e c T r u m a n a l y s I s 4 5
ConstraintsBelow are descriptions of the constraints in this model, in no particular order.
(1)
Where: S = the set of all stations Ts = the set of towers to which station s could be assigned Ct = the set of channels which can be assigned to tower t (border restrictions)
This constraint assures that every station is assigned to one tower and one channel, unless that station has been removed. If the station is not assigned a tower or channel, that station’s r variable will turn to 1. A station may be prevented from being removed by adding a constraint to fix the r variable to 0. The set Ts contains all towers within a specified maximum station moving distance of the station’s original tower.
Ct is the set of possible channels that may be assigned to tower t. It originally contains all channels, and then it is pared down by removing channels that are assigned to Canadian or Mexican TV stations or land mobile licensees that are within the re-spective co-channel or adjacent channel distance restrictions. A channel will not, however, be removed from this set if tower t originally contains a station using the conflicting channel.
(2)
Where: St = the set of stations that can be assigned to tower t T = the set of all towers
This constraint assures that each channel is assigned to at most one station per tower.
(3)
Where: Capacityt = the maximum number of stations which may be assigned to tower t
Here we limit the number of stations that may be assigned to each tower. We do not currently have the capacity for each tower, so a default value will be used. The user will be able to specify a capacity for each tower through the user interface.
(4)
Where: coTt = the set of towers which have co-channel restrictions with tower t
This constraint enforces the co-channel spacing requirements. The set coTt for each tower t will be generated before solving using the rules in §73.623(d)(2) of the CFR. Users will be able to modify these distance requirements through the user inter-face. This set of constraints will be included for both VHF and UHF, using each band’s distance requirements to build the set coTt.
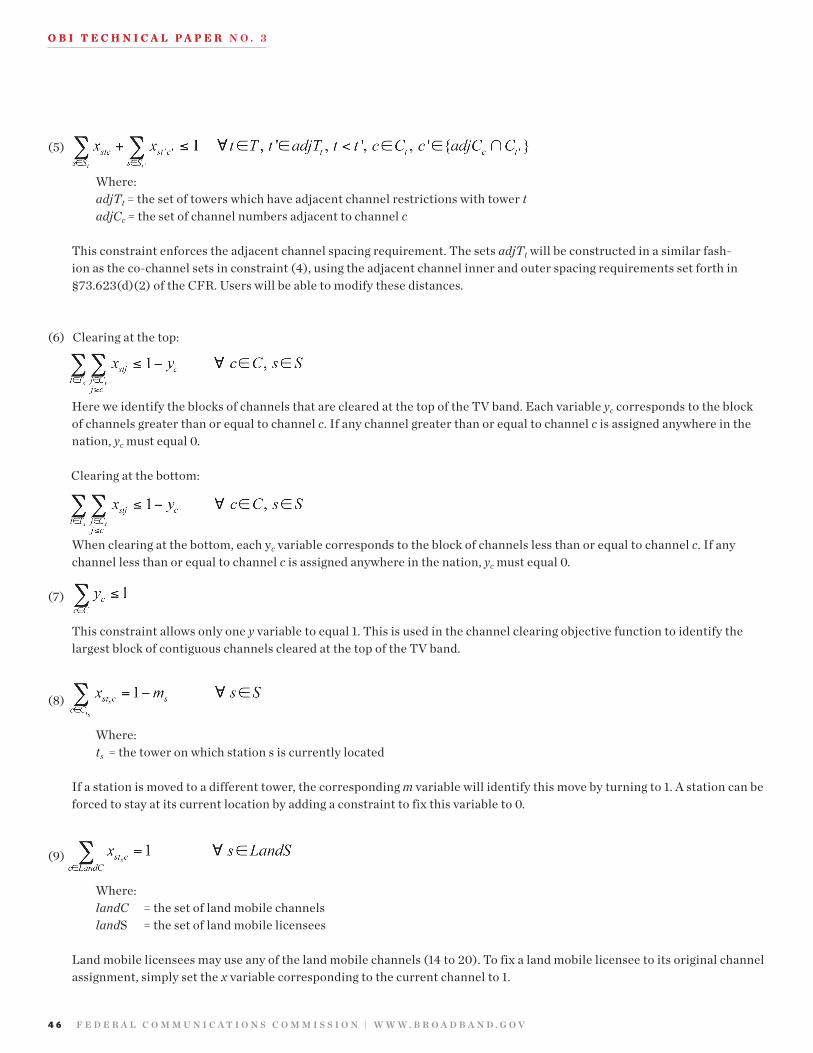
4 6 F e d e r a l c O m m u n I c a T I O n s c O m m I s s I O n | W W W . B r O a d B a n d . G O V
O B I T e c h n I c a l P a P e r n O . 3O B I T e c h n I c a l P a P e r
(5)
Where: adjTt = the set of towers which have adjacent channel restrictions with tower t adjCc = the set of channel numbers adjacent to channel c
This constraint enforces the adjacent channel spacing requirement. The sets adjTt will be constructed in a similar fash-ion as the co-channel sets in constraint (4), using the adjacent channel inner and outer spacing requirements set forth in §73.623(d)(2) of the CFR. Users will be able to modify these distances.
(6) Clearing at the top:
Here we identify the blocks of channels that are cleared at the top of the TV band. Each variable yc corresponds to the block of channels greater than or equal to channel c. If any channel greater than or equal to channel c is assigned anywhere in the nation, yc must equal 0.
Clearing at the bottom:
When clearing at the bottom, each yc variable corresponds to the block of channels less than or equal to channel c. If any channel less than or equal to channel c is assigned anywhere in the nation, yc must equal 0.
(7)
This constraint allows only one y variable to equal 1. This is used in the channel clearing objective function to identify the largest block of contiguous channels cleared at the top of the TV band.
(8)
Where: ts = the tower on which station s is currently located
If a station is moved to a different tower, the corresponding m variable will identify this move by turning to 1. A station can be forced to stay at its current location by adding a constraint to fix this variable to 0.
(9)
Where: landC = the set of land mobile channels landS = the set of land mobile licensees
Land mobile licensees may use any of the land mobile channels (14 to 20). To fix a land mobile licensee to its original channel assignment, simply set the x variable corresponding to the current channel to 1.
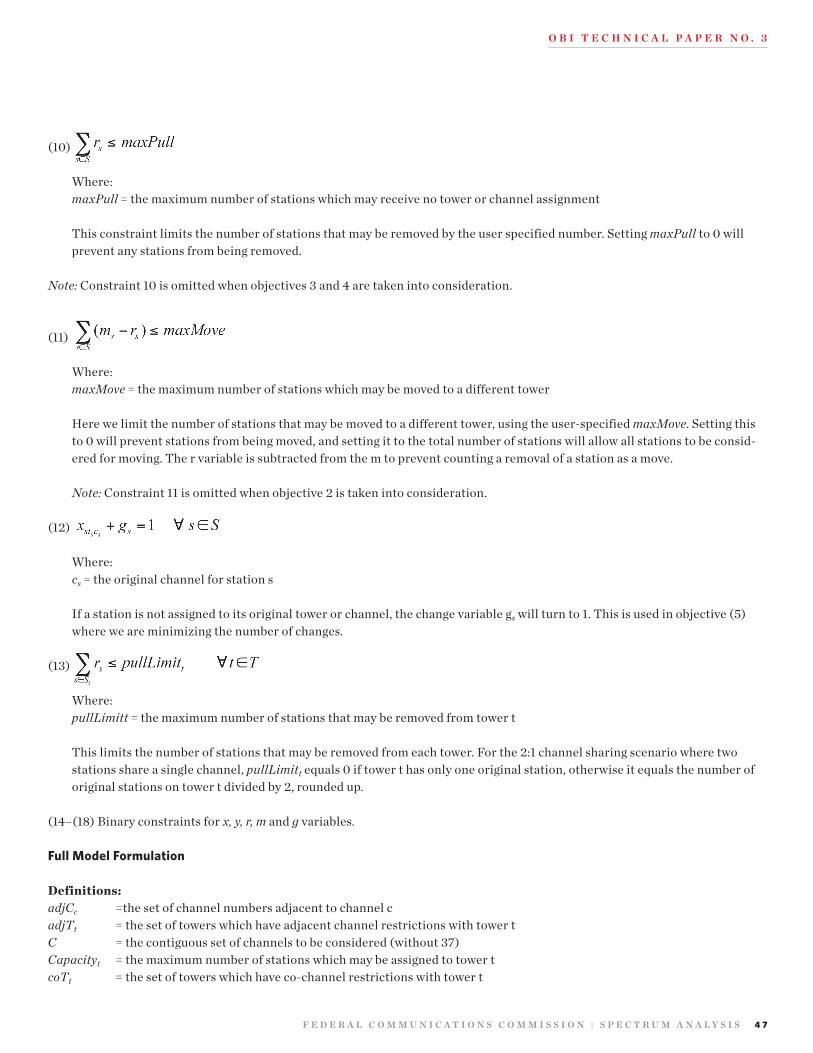
O B I T e c h n I c a l P a P e r n O . 3
F e d e r a l c O m m u n I c a T I O n s c O m m I s s I O n | s P e c T r u m a n a l y s I s 4 7
(10)
Where: maxPull = the maximum number of stations which may receive no tower or channel assignment
This constraint limits the number of stations that may be removed by the user specified number. Setting maxPull to 0 will prevent any stations from being removed.
Note: Constraint 10 is omitted when objectives 3 and 4 are taken into consideration.
(11)
Where: maxMove = the maximum number of stations which may be moved to a different tower
Here we limit the number of stations that may be moved to a different tower, using the user-specified maxMove. Setting this to 0 will prevent stations from being moved, and setting it to the total number of stations will allow all stations to be consid-ered for moving. The r variable is subtracted from the m to prevent counting a removal of a station as a move.
Note: Constraint 11 is omitted when objective 2 is taken into consideration.
(12)
Where:cs = the original channel for station s
If a station is not assigned to its original tower or channel, the change variable gs will turn to 1. This is used in objective (5) where we are minimizing the number of changes.
(13)
Where:pullLimitt = the maximum number of stations that may be removed from tower t
This limits the number of stations that may be removed from each tower. For the 2:1 channel sharing scenario where two stations share a single channel, pullLimitt equals 0 if tower t has only one original station, otherwise it equals the number of original stations on tower t divided by 2, rounded up.
(14–(18) Binary constraints for x, y, r, m and g variables.
Full Model Formulation
Definitions:adjCc = the set of channel numbers adjacent to channel cadjTt = the set of towers which have adjacent channel restrictions with tower tC = the contiguous set of channels to be considered (without 37)Capacityt = the maximum number of stations which may be assigned to tower tcoTt = the set of towers which have co-channel restrictions with tower t
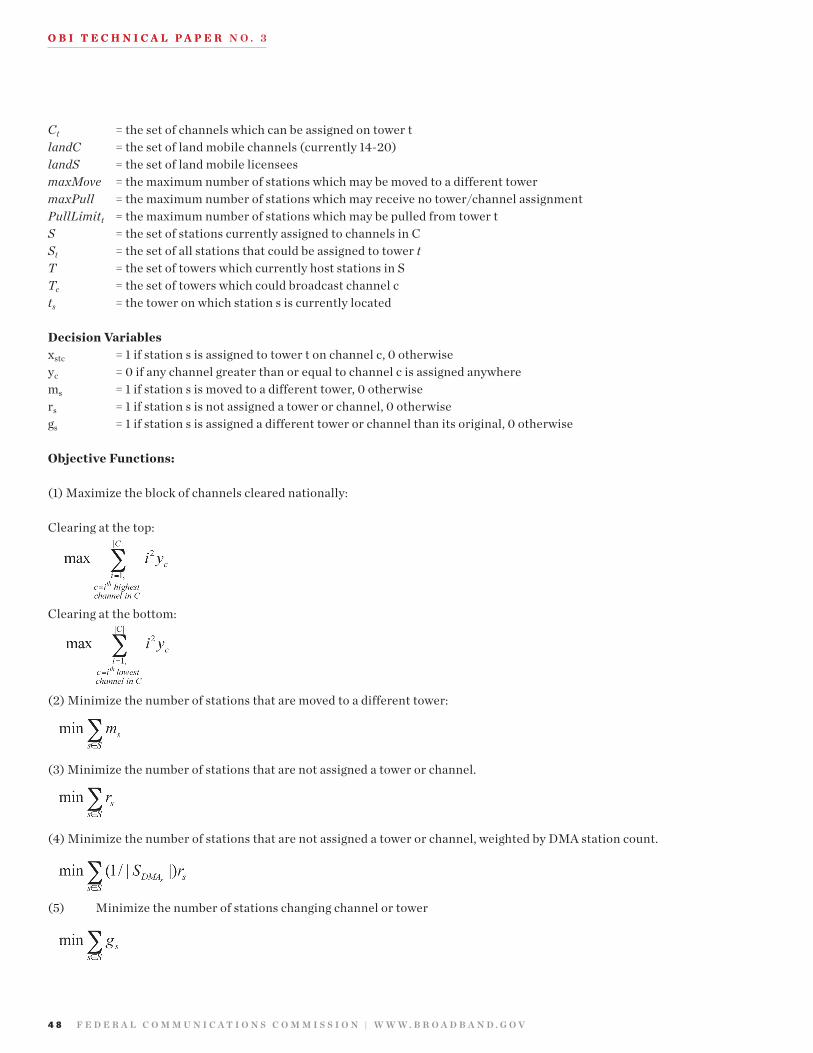
4 8 F e d e r a l c O m m u n I c a T I O n s c O m m I s s I O n | W W W . B r O a d B a n d . G O V
O B I T e c h n I c a l P a P e r n O . 3O B I T e c h n I c a l P a P e r
Ct = the set of channels which can be assigned on tower tlandC = the set of land mobile channels (currently 14-20)landS = the set of land mobile licenseesmaxMove = the maximum number of stations which may be moved to a different towermaxPull = the maximum number of stations which may receive no tower/channel assignmentPullLimitt = the maximum number of stations which may be pulled from tower tS = the set of stations currently assigned to channels in CSt = the set of all stations that could be assigned to tower tT = the set of towers which currently host stations in STc = the set of towers which could broadcast channel c ts = the tower on which station s is currently located
Decision Variablesxstc = 1 if station s is assigned to tower t on channel c, 0 otherwiseyc = 0 if any channel greater than or equal to channel c is assigned anywherems = 1 if station s is moved to a different tower, 0 otherwisers = 1 if station s is not assigned a tower or channel, 0 otherwisegs = 1 if station s is assigned a different tower or channel than its original, 0 otherwise
Objective Functions:
(1) Maximize the block of channels cleared nationally:
Clearing at the top:
Clearing at the bottom:
(2) Minimize the number of stations that are moved to a different tower:
(3) Minimize the number of stations that are not assigned a tower or channel.
(4) Minimize the number of stations that are not assigned a tower or channel, weighted by DMA station count.
(5) Minimize the number of stations changing channel or tower
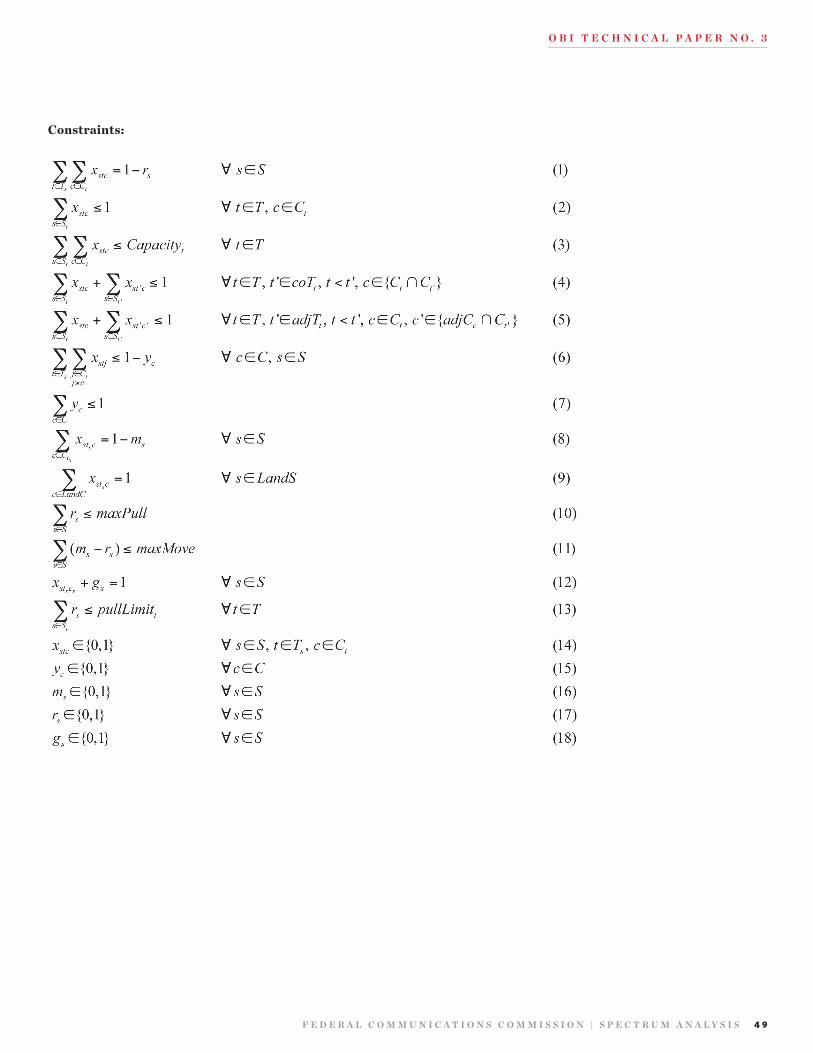
O B I T e c h n I c a l P a P e r n O . 3
F e d e r a l c O m m u n I c a T I O n s c O m m I s s I O n | s P e c T r u m a n a l y s I s 4 9
Constraints:
5 0 F e d e r a l c O m m u n I c a T I O n s c O m m I s s I O n | W W W . B r O a d B a n d . G O V
O B I T e c h n I c a l P a P e r n O . 3O B I T e c h n I c a l P a P e r
APPENDIx D: LONgLEy RICE ExPLANATION AND ILLUSTRATION OF COvERAgE AND INTERFERENCE IMPACTS
the fcc loNGley-rice comPuter ProGram1
The FCC computer program is available as Fortran code. It is complex, and many of its options are available only by recom-pilation for each case of interest. The individual installing it should have computer programming skills and experience as a system administrator of the computer system on which it is to be installed because linking the data files, which occupy 1.6 gigabytes of disk space, will be a site-specific task. The FCC compiles and runs the program on Sun Microsystem Enterprise 3500 and UltraSPARC computers. The Fortran code currently used by the Media Bureau to evaluate new proposals is avail-able for downloading from the FCC Internet site at http://www.fcc.gov/oet/dtv, and the code used to produce the infor-mation presented in Appendix B of the Sixth Report and Order is also available there.
Outline of Evaluation ProcedureThe examination of each station proceeds as follows: 1) The area subject to calculation is boxed in latitude and longitude. This is performed by proceeding around the compass and find-ing the latitude and longitude of points at 5 degree azimuth increments on the bounding contour. The maxima and minima
1 Excerpted from Off. of Eng. & Tech., FCC, Longley-Rice Methodology for Evaluating TV Cover-age and Interference (OET Bulletin No. 69, 2004).
of the resulting list of latitudes and longitudes determine a coordinate box. 2) The coordinate box is divided into square cells of a chosen size which should be 2 km on a side or smaller, adjusting the coordinate box to be slightly larger if necessary to accommodate an integer number of cells. The cells must be an integer number of latitude seconds high and an integer number of longitude seconds wide. 3) The coordinates of census blocks falling inside each cell are retrieved along with the population of each block. From this information the total population and the coordinates of the cell centroid are determined for each cell. 4) The Longley-Rice propagation model is then applied as in Part 1, Evaluation of Service, and Part 2, Evaluation of Interference. The output information is organized as shown in Figure 1.
Identification of Potentially Interfering StationsStations that may be a source of interference are identified as a function of distance and channel relationships. This is per-formed independently for each cell. Only those stations whose distance from the cell of interest is less than the value given in Table 7 are considered as potential sources of interference.
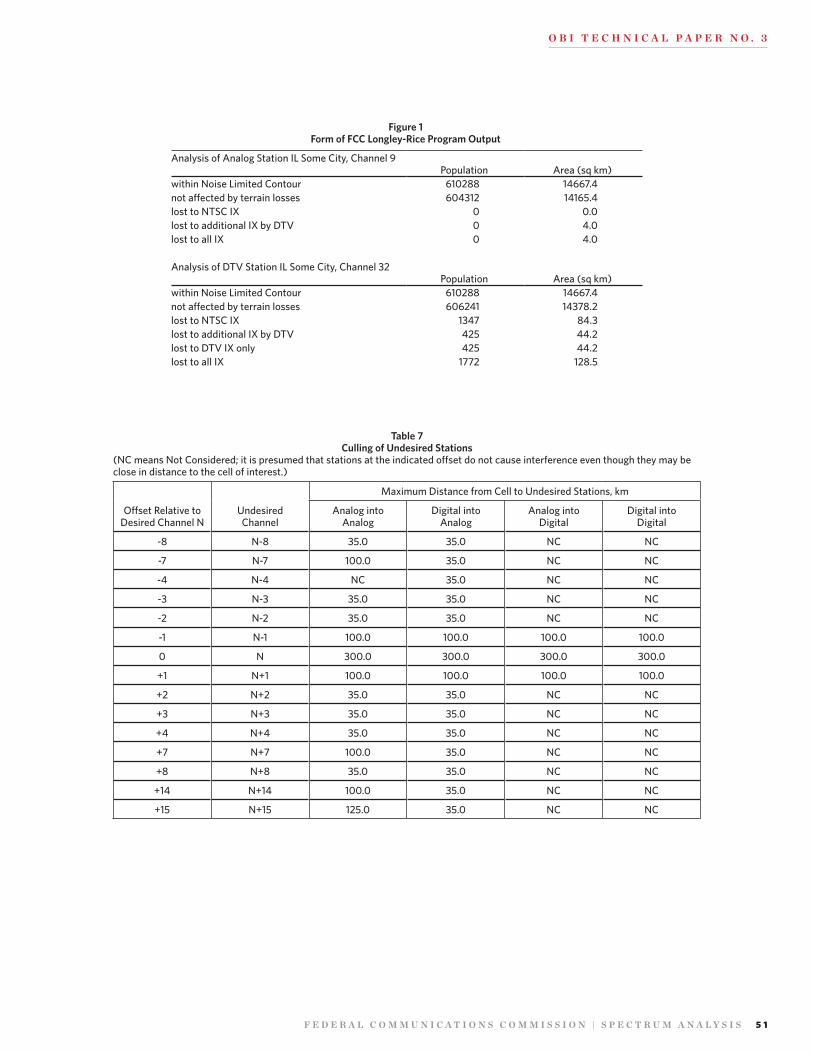
O B I T e c h n I c a l P a P e r n O . 3
F e d e r a l c O m m u n I c a T I O n s c O m m I s s I O n | s P e c T r u m a n a l y s I s 5 1
Figure 1 Form of FCC Longley-Rice Program Output
Analysis of Analog Station IL Some City, Channel 9 Population Area (sq km)
within Noise Limited Contour 610288 14667.4not affected by terrain losses 604312 14165.4lost to NTSC IX 0 0.0lost to additional IX by DTV 0 4.0lost to all IX 0 4.0
Analysis of DTV Station IL Some City, Channel 32Population Area (sq km)
within Noise Limited Contour 610288 14667.4not affected by terrain losses 606241 14378.2lost to NTSC IX 1347 84.3lost to additional IX by DTV 425 44.2lost to DTV IX only 425 44.2lost to all IX 1772 128.5
Table 7 Culling of Undesired Stations
(NC means Not Considered; it is presumed that stations at the indicated offset do not cause interference even though they may be close in distance to the cell of interest.)
Offset Relative to Desired Channel N
Undesired Channel
Maximum Distance from Cell to Undesired Stations, km
Analog into Analog
Digital into Analog
Analog into Digital
Digital into Digital
-8 N-8 35.0 35.0 NC NC
-7 N-7 100.0 35.0 NC NC
-4 N-4 NC 35.0 NC NC
-3 N-3 35.0 35.0 NC NC
-2 N-2 35.0 35.0 NC NC
-1 N-1 100.0 100.0 100.0 100.0
0 N 300.0 300.0 300.0 300.0
+1 N+1 100.0 100.0 100.0 100.0
+2 N+2 35.0 35.0 NC NC
+3 N+3 35.0 35.0 NC NC
+4 N+4 35.0 35.0 NC NC
+7 N+7 100.0 35.0 NC NC
+8 N+8 35.0 35.0 NC NC
+14 N+14 100.0 35.0 NC NC
+15 N+15 125.0 35.0 NC NC
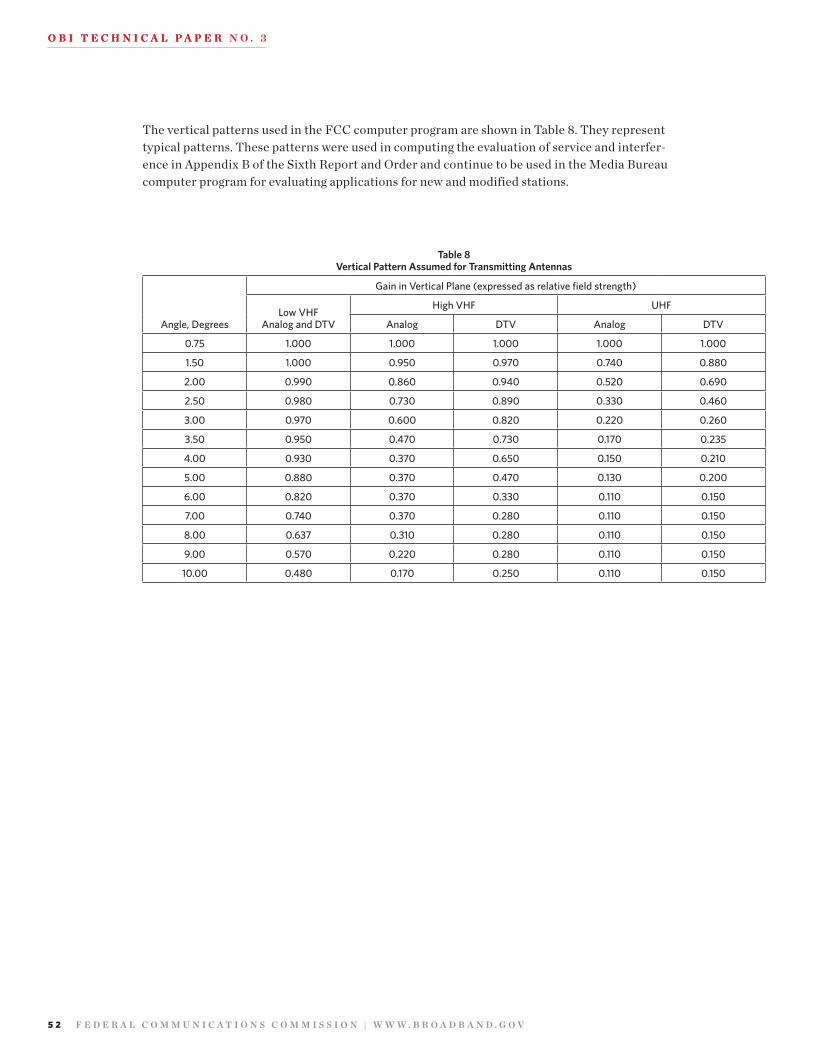
5 2 F e d e r a l c O m m u n I c a T I O n s c O m m I s s I O n | W W W . B r O a d B a n d . G O V
O B I T e c h n I c a l P a P e r n O . 3O B I T e c h n I c a l P a P e r
The vertical patterns used in the FCC computer program are shown in Table 8. They represent typical patterns. These patterns were used in computing the evaluation of service and interfer-ence in Appendix B of the Sixth Report and Order and continue to be used in the Media Bureau computer program for evaluating applications for new and modified stations.
Table 8 Vertical Pattern Assumed for Transmitting Antennas
Angle, Degrees
Gain in Vertical Plane (expressed as relative field strength)
Low VHF Analog and DTV
High VHF UHF
Analog DTV Analog DTV
0.75 1.000 1.000 1.000 1.000 1.000
1.50 1.000 0.950 0.970 0.740 0.880
2.00 0.990 0.860 0.940 0.520 0.690
2.50 0.980 0.730 0.890 0.330 0.460
3.00 0.970 0.600 0.820 0.220 0.260
3.50 0.950 0.470 0.730 0.170 0.235
4.00 0.930 0.370 0.650 0.150 0.210
5.00 0.880 0.370 0.470 0.130 0.200
6.00 0.820 0.370 0.330 0.110 0.150
7.00 0.740 0.370 0.280 0.110 0.150
8.00 0.637 0.310 0.280 0.110 0.150
9.00 0.570 0.220 0.280 0.110 0.150
10.00 0.480 0.170 0.250 0.110 0.150
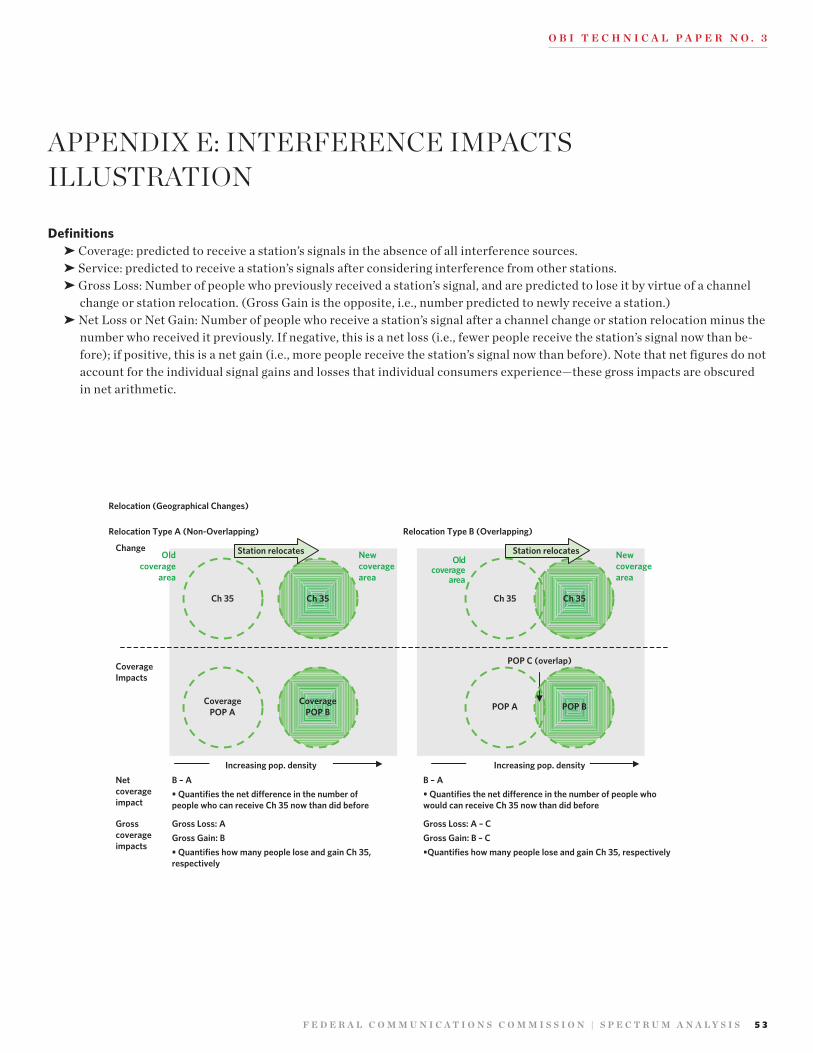
O B I T e c h n I c a l P a P e r n O . 3
F e d e r a l c O m m u n I c a T I O n s c O m m I s s I O n | s P e c T r u m a n a l y s I s 5 3
APPENDIx E: INTERFERENCE IMPACTS ILLUSTRATION
Definitions ➤ Coverage: predicted to receive a station’s signals in the absence of all interference sources. ➤ Service: predicted to receive a station’s signals after considering interference from other stations. ➤ Gross Loss: Number of people who previously received a station’s signal, and are predicted to lose it by virtue of a channel change or station relocation. (Gross Gain is the opposite, i.e., number predicted to newly receive a station.)
➤ Net Loss or Net Gain: Number of people who receive a station’s signal after a channel change or station relocation minus the number who received it previously. If negative, this is a net loss (i.e., fewer people receive the station’s signal now than be-fore); if positive, this is a net gain (i.e., more people receive the station’s signal now than before). Note that net figures do not account for the individual signal gains and losses that individual consumers experience—these gross impacts are obscured in net arithmetic.
Station relocates
POP C (overlap)
Ch 35
Station relocates
Increasing pop. density
CoveragePOP A
Gross Loss: AGross Gain: B• Quantifies how many people lose and gain Ch 35, respectively
B – A B – A
Change
CoverageImpacts
Increasing pop. density
Oldcoverage
area
New coverage area
Oldcoverage
area
New coverage area
• Quantifies the net difference in the number ofpeople who can receive Ch 35 now than did before
Relocation Type B (Overlapping)
Relocation (Geographical Changes)
Relocation Type A (Non-Overlapping)
Ch 35 Ch 35Ch 35
CoveragePOP B POP A POP B
Gross Loss: A – C Gross Gain: B – C •Quantifies how many people lose and gain Ch 35, respectively
• Quantifies the net difference in the number of people whowould can receive Ch 35 now than did before
Grosscoverageimpacts
Netcoverageimpact
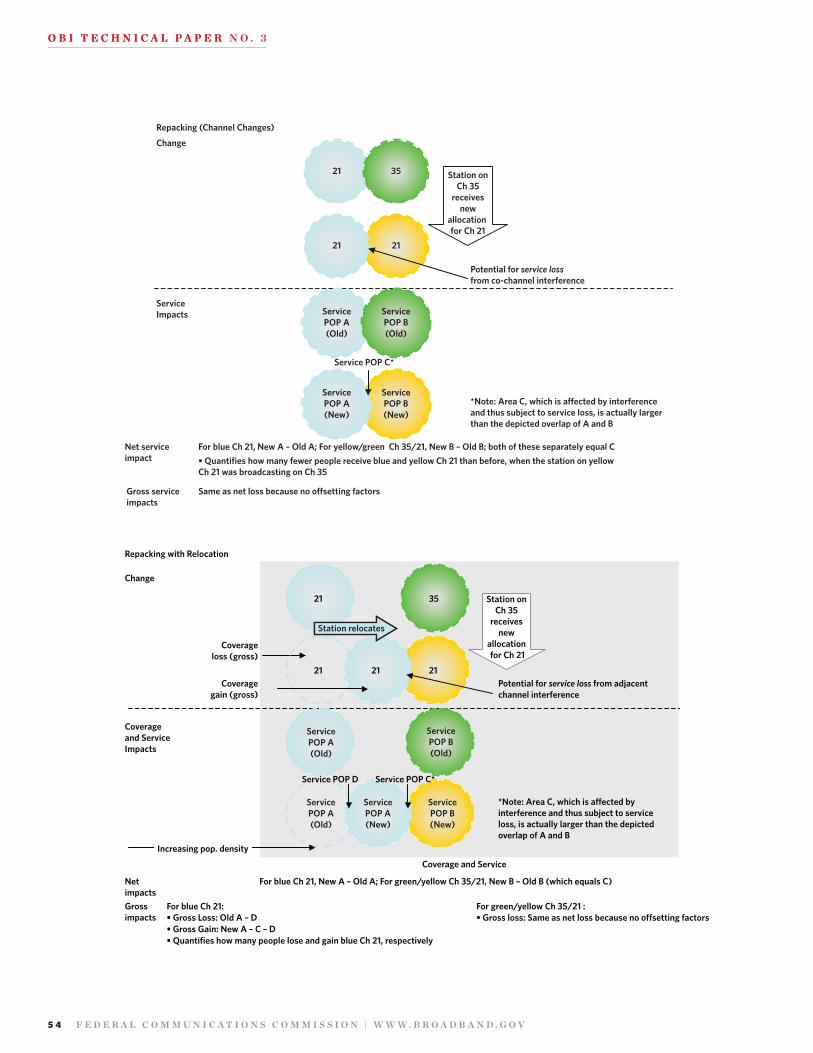
5 4 F e d e r a l c O m m u n I c a T I O n s c O m m I s s I O n | W W W . B r O a d B a n d . G O V
O B I T e c h n I c a l P a P e r n O . 3O B I T e c h n I c a l P a P e r
21
Repacking (Channel Changes)
21 35
Potential for service loss from co-channel interference
21
ServicePOP B(New)
ServicePOP A(New)
Station onCh 35
receivesnew
allocation for Ch 21
Change
ServiceImpacts
Same as net loss because no o�setting factorsGross service impacts
Service POP C*
*Note: Area C, which is a�ected by interferenceand thus subject to service loss, is actually larger than the depicted overlap of A and B
ServicePOP B(Old)
ServicePOP A(Old)
Net service impact • Quantifies how many fewer people receive blue and yellow Ch 21 than before, when the station on yellow
Ch 21 was broadcasting on Ch 35
For blue Ch 21, New A – Old A; For yellow/green Ch 35/21, New B – Old B; both of these separately equal C
21
Repacking with Relocation
Coverage and Service
21 35
21
Service POP C*
Station on Ch 35
receives new
allocation for Ch 21
Change
Coverage and Service Impacts
For blue Ch 21: • Gross Loss: Old A – D• Gross Gain: New A – C – D • Quantifies how many people lose and gain blue Ch 21, respectively
For blue Ch 21, New A – Old A; For green/yellow Ch 35/21, New B – Old B (which equals C)
For green/yellow Ch 35/21 : • Gross loss: Same as net loss because no offsetting factors
Gross impacts
Net impacts
21
Coverageloss (gross)
Coveragegain (gross)
Service POP D
Station relocates
ServicePOP B(New)
ServicePOP A(New)
ServicePOP B(Old)
ServicePOP A(Old)
ServicePOP A(Old)
Potential for service loss from adjacentchannel interference
*Note: Area C, which is affected byinterference and thus subject to serviceloss, is actually larger than the depictedoverlap of A and B
Increasing pop. density
O B I T e c h n I c a l P a P e r n O . 3
F e d e r a l c O m m u n I c a T I O n s c O m m I s s I O n | s P e c T r u m a n a l y s I s 5 5
➤ Programming captured from nine stations whose OTA signals were receivable by standard antenna at personal residence of FCC Media Bureau engineer (eight stations are licensed to the Washington DC DMA, one is licensed to the Baltimore DMA). The transport stream captures were made using off-the-shelf software (dvico FusionTV) and a macro to change the channel and control recording automatically.
➤ Nine-minute samples of programs, captured in 1080i 1/2-second intervals. ➤ Bitrates captured average more granular bitrates across interval.
➤ 41 nine-minute samples captured (four to five per station). ➤ Samples in succession from 5:00 pm through 11:07 pm on Jan. 4, 2010.
➤ Nine stations’ signals captured in rotation. ➤ Frictional delay of a few seconds at each sample switch.
➤ For football program comparison (Exhibit L), additional nine-minute capture from 9:07–9:16 pm on Jan. 3, 2010, was used—not counted in overall tally or other analyses.
➤ Program streams (e.g., primary, secondary, mobile) are identified based on PID, or packet identifier.
APPENDIx F: BITRATE CAPTURE METHODOLOgy
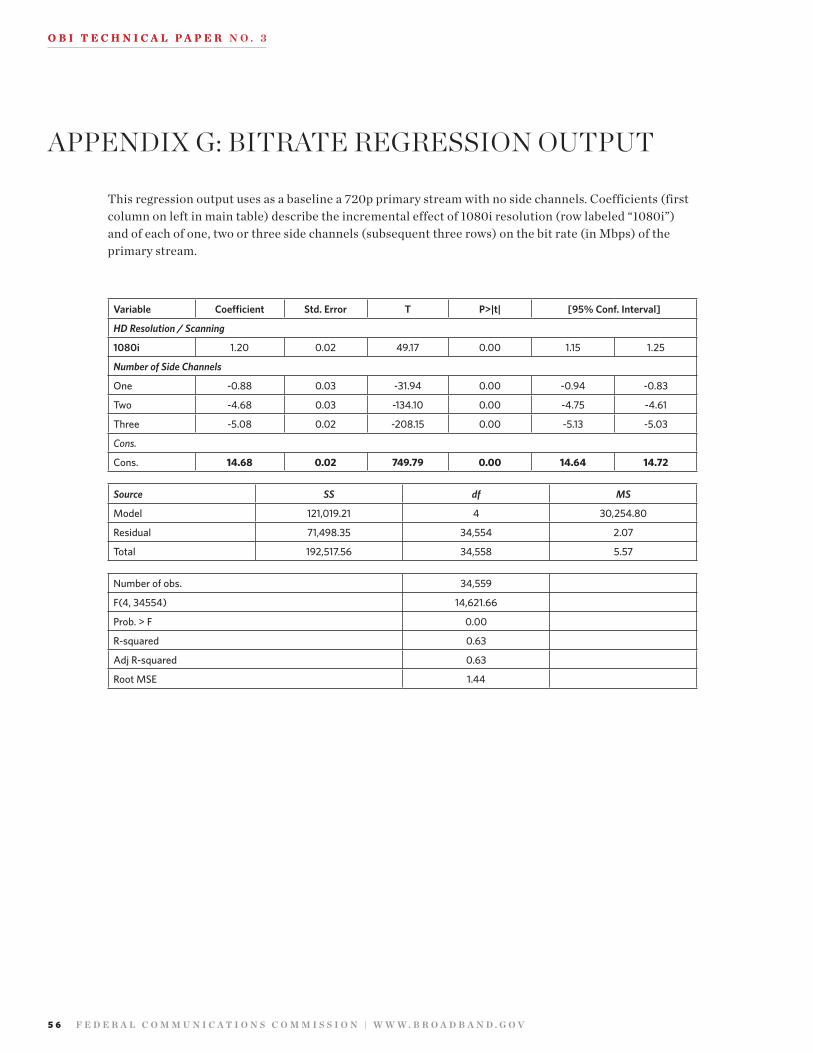
5 6 F e d e r a l c O m m u n I c a T I O n s c O m m I s s I O n | W W W . B r O a d B a n d . G O V
O B I T e c h n I c a l P a P e r n O . 3O B I T e c h n I c a l P a P e r
APPENDIx g: BITRATE REgRESSION OUTPUT
This regression output uses as a baseline a 720p primary stream with no side channels. Coefficients (first column on left in main table) describe the incremental effect of 1080i resolution (row labeled “1080i”) and of each of one, two or three side channels (subsequent three rows) on the bit rate (in Mbps) of the primary stream.
Variable Coefficient Std. Error T P>|t| [95% Conf. Interval]
HD Resolution / Scanning
1080i 1.20 0.02 49.17 0.00 1.15 1.25
Number of Side Channels
One -0.88 0.03 -31.94 0.00 -0.94 -0.83
Two -4.68 0.03 -134.10 0.00 -4.75 -4.61
Three -5.08 0.02 -208.15 0.00 -5.13 -5.03
Cons.
Cons. 14.68 0.02 749.79 0.00 14.64 14.72
Source SS df MS
Model 121,019.21 4 30,254.80
Residual 71,498.35 34,554 2.07
Total 192,517.56 34,558 5.57
Number of obs. 34,559
F(4, 34554) 14,621.66
Prob. > F 0.00
R-squared 0.63
Adj R-squared 0.63
Root MSE 1.44
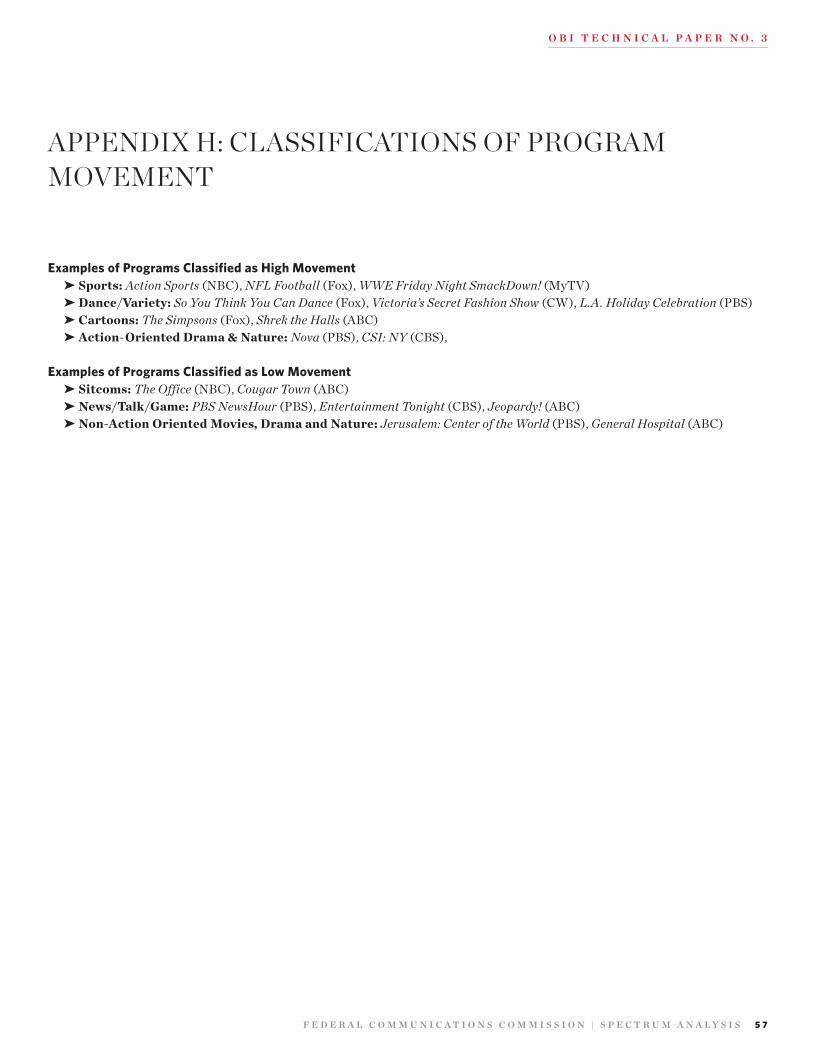
O B I T e c h n I c a l P a P e r n O . 3
F e d e r a l c O m m u n I c a T I O n s c O m m I s s I O n | s P e c T r u m a n a l y s I s 5 7
APPENDIx H: CLASSIFICATIONS OF PROgRAM MOvEMENT
Examples of Programs Classified as High Movement ➤ Sports: Action Sports (NBC), NFL Football (Fox), WWE Friday Night SmackDown! (MyTV) ➤ Dance/Variety: So You Think You Can Dance (Fox), Victoria’s Secret Fashion Show (CW), L.A. Holiday Celebration (PBS) ➤ Cartoons: The Simpsons (Fox), Shrek the Halls (ABC) ➤ Action-Oriented Drama & Nature: Nova (PBS), CSI: NY (CBS),
Examples of Programs Classified as Low Movement ➤ Sitcoms: The Office (NBC), Cougar Town (ABC) ➤ News/Talk/Game: PBS NewsHour (PBS), Entertainment Tonight (CBS), Jeopardy! (ABC) ➤ Non-Action Oriented Movies, Drama and Nature: Jerusalem: Center of the World (PBS), General Hospital (ABC)