Embed Size (px)
Citation preview
Technical Report Documentation Page 1. Report No. FHWA/TX-09/0-5470-1
2. Government Accession No.
3. Recipient’s Catalog No.
4. Title and Subtitle SPEEDS IN SCHOOL ZONES
5. Report Date September 2008 Published: February 2009
6. Performing Organization Code
7. Author(s) Kay Fitzpatrick, Marcus Brewer, Kwaku Obeng-Boampong, Eun Sug Park, Nada Trout
8. Performing Organization Report No. Report 0-5470-1
9. Performing Organization Name and Address Texas Transportation Institute The Texas A&M University System College Station, Texas 77843-3135
10. Work Unit No. (TRAIS) 11. Contract or Grant No. Project 0-5470
12. Sponsoring Agency Name and Address Texas Department of Transportation Research and Technology Implementation Office P. O. Box 5080 Austin, Texas 78763-5080
13. Type of Report and Period Covered Technical Report: September 2006-August 2008 14. Sponsoring Agency Code
15. Supplementary Notes Project performed in cooperation with the Texas Department of Transportation and the Federal Highway Administration. Project Title: Comprehensive Guide to Traffic Control Near Schools URL: http://tti.tamu.edu/documents/0-5470-1.pdf 16. Abstract School speed zones are frequently requested traffic controls for school areas, based on the common belief that if the transportation agency would only install a reduced speed limit, then drivers would no longer speed through the area. This research project was tasked with reviewing existing practices and developing guidelines regarding the establishment of school zones. Researchers documented existing knowledge on traffic control devices in school zones using a review of previous research that examined effectiveness of devices, a survey of practitioners on signing and marking, a review of state and city school zone guidelines and warrants, and a telephone survey of law enforcement officers. Researchers also collected field data at 24 school zones across Texas and analyzed the data for findings on speed-distance relationships, speed-time relationships, influences of various site characteristics on speeds, and special characteristics of school zones with buffer zones. The findings from these analyses were used in developing suggested guidelines for traffic control devices, including school speed zones, near schools in Texas. The Guidelines are designed to serve as a supplement to the Texas Manual on Uniform Traffic Control Devices and the manual on Procedures for Establishing Speed Zones. They are included in this report as Appendix A. Major topics in the Guidelines include: definitions, school location, school speed zone characteristics, pavement markings, crosswalks, school entrances, and conditions for removing a school speed zone. 17. Key Words School Zones, Speeds, School Traffic Control Devices
18. Distribution Statement No restrictions. This document is available to the public through NTIS: National Technical Information Service Springfield, Virginia 22161 http://www.ntis.gov
19. Security Classif.(of this report) Unclassified
20. Security Classif.(of this page) Unclassified
21. No. of Pages 196
22. Price
Form DOT F 1700.7 (8-72) Reproduction of completed page authorized


SPEEDS IN SCHOOL ZONES
by
Kay Fitzpatrick, Ph.D., P.E. Senior Research Engineer
Texas Transportation Institute
Marcus Brewer, P.E. Assistant Research Engineer
Texas Transportation Institute
Kwaku Obeng-Boampong, P.E. Assistant Research Engineer
Texas Transportation Institute
Eun Sug Park, Ph.D. Associate Research Scientist
Texas Transportation Institute
and
Nada Trout Assistant Research Scientist
Texas Transportation Institute
Report 0-5470-1 Project 0-5470
Project Title: Comprehensive Guide to Traffic Control Near Schools
Performed in cooperation with the Texas Department of Transportation
and the Federal Highway Administration
September 2008
Published: February 2009
TEXAS TRANSPORTATION INSTITUTE The Texas A&M University System College Station, Texas 77843-3135


v
DISCLAIMER The contents of this report reflect the views of the authors, who are responsible for the facts and the accuracy of the data presented herein. The contents do not necessarily reflect the official view or policies of the Federal Highway Administration (FHWA) or the Texas Department of Transportation (TxDOT). This report does not constitute a standard, specification, or regulation. The engineer in charge was Kay Fitzpatrick, P.E. (TX-86762).
vi
ACKNOWLEDGMENTS This project was conducted in cooperation with TxDOT and FHWA. The authors thank the members of TxDOT’s Project Monitoring Committee: Omar Madrid, P.E. – TxDOT El Paso District, Project Director Tom Beeman, P.E. – TxDOT Design Division, Program Coordinator Carlos Chavez, P.E. – TxDOT El Paso District, Program Coordinator (retired) Linden Burgess – TxDOT Dallas District, Project Advisor Scott Cunningham, P.E. – TxDOT Austin District, Project Advisor Ismael Soto, P.E. – TxDOT Corpus Christi District, Project Advisor Flor Tamez, P.E. – TxDOT Traffic Operations Division, Project Advisor Wade Odell, P.E. – TxDOT Research and Technology Implementation Office, Research Engineer Loretta Brown – TxDOT Research and Technology Implementation Office, Contract Specialist In addition, the authors would like to thank the numerous school administrators, principals, and other officials who agreed to allow the research team to collect data at schools and answer other questions about their schools’ characteristics and their observations on traffic patterns near their schools: Paula Barbaroux – Operations Manager Chad Bartee – City Engineer Kimberly Baxter – Principal Todd Bloomer – Assistant Principal Dolores Chaparro – Principal Hugh Ellison – Principal Diane Innis – Superintendent David Jones – Principal David Kinney – Principal Walter Key – Principal James Lamonica – Principal Carmen Moran – Principal Denise Morgan – Principal Megan Overman – Public Information Director Boyd Rice – Principal Loretta Ross – Principal Grady Slaydon – Director of Maintenance and Operations Sylvia Swayne – Principal Charlie Thomas – Superintendent Luis Villalobos – Executive Director of Public Relations Yvonne Walker – Principal
vii
Finally, the authors would like to thank the following Texas Transportation Institute (TTI) employees who provided general guidance during the study, assisted with data collection, or performed data reduction for the field studies on this project: General Guidance Joan Hudson – Assistant Research Engineer Tony Voigt – Research Engineer Scott Cooner – Research Engineer Data Collection Jeremy Johnson – Engineering Research Associate Dan Walker – Assistant Research Specialist Diana Wallace – Programmer/Analyst Robert McLain – Research Associate Gary Barricklow – Research Technician Liang Ding – Assistant Transportation Researcher Arturo Bujanda – Assistant Research Specialist Noel Chavez – Student Worker III Rodrigo Torres – Student Worker III Albertico Montes – Student Worker IV Data Reduction Katherine Green – Student Worker III Curtis White – Student Worker IV Sara Roby – Student Worker II Josh Robertson – Student Worker III Kristen Wallin – Student Worker IV Derek Ladd – Student Worker I Bria Whitmire – Student Worker III


ix
TABLE OF CONTENTS
Page
LIST OF FIGURES ................................................................................................................... xiii LIST OF TABLES .................................................................................................................... xvii CHAPTER 1 INTRODUCTION ................................................................................................ 1
RESEARCH OBJECTIVES ....................................................................................................... 1 RESEARCH APPROACH ......................................................................................................... 1 REPORT ORGANIZATION ...................................................................................................... 2
CHAPTER 2 LITERATURE REVIEW ON VEHICLE SPEEDS IN SCHOOL ZONES ... 3
SIGNS AND MARKINGS ......................................................................................................... 3 SPEED MONITORING DISPLAY ............................................................................................ 8
CHAPTER 3 SURVEY OF PRACTICE FOR SIGNING AND MARKINGS NEAR SCHOOLS ................................................................................................................................... 11
TxDOT: STATE-OF-THE-PRACTICE FOR SCHOOL SPEED ZONES .............................. 11 TxDOT: OTHER SIGNING AND MARKINGS FOR SCHOOLS ......................................... 12 TxDOT: ENGINEERING JUDGMENT .................................................................................. 12 TxDOT: POTENTIAL STUDY SITES .................................................................................... 12 TxDOT: COMMENTS ............................................................................................................. 13 TxDOT: QUESTION-BY-QUESTION RESPONSES ............................................................ 13
School Speed Zones .............................................................................................................. 13 Other Signs/Markings ........................................................................................................... 17 Engineering Judgment .......................................................................................................... 18
CITY/COUNTY: SUMMARY OF WEB-BASED SURVEY ................................................. 19 CHAPTER 4 REVIEW OF STATE GUIDELINES AND WARRANTS FOR SCHOOL ZONES ......................................................................................................................................... 21
VALUE OF SCHOOL SPEED LIMITS .................................................................................. 22 USE OF SCHOOL SPEED LIMITS IN RURAL OR URBAN AREAS ................................. 22 RESTRICTIONS ON THE USE OF A SCHOOL SPEED ZONE .......................................... 23 TIMES OF OPERATION ......................................................................................................... 23 WHEN TO INSTALL? ............................................................................................................. 24 LENGTH AND LOCATION OF SCHOOL ZONE ................................................................. 24 PROXIMITY TO OTHER TRAFFIC CONTROL .................................................................. 25 OTHER CRITERIA USED IN WARRANTS OR GUIDELINES .......................................... 25 OTHER TREATMENTS .......................................................................................................... 29 HOW ABOUT ONLY A SIGN WITH NO SPEED CHANGE? ............................................. 29 STUDENT NUMBERS ............................................................................................................ 29
x
CHAPTER 5 PHONE SURVEY OF LAW ENFORCEMENT OFFICERS CONCERNING VEHICLE SPEEDS IN SCHOOL ZONES .............................................................................. 31
INTRODUCTION .................................................................................................................... 31 STUDY DESIGN ..................................................................................................................... 31
Phone Contacts...................................................................................................................... 31 RESULTS ................................................................................................................................. 32
Question 1—Are drivers in your area generally in compliance with reduced school speed limits? .................................................................................................................................... 32 Question 2—What factors affect compliance with drivers in a reduced-speed school zone?............................................................................................................................................... 33 Question 3—What would you estimate the compliance level is at reduced school speed zones when enforcement is not obvious versus when enforcement is obvious? .................. 33 Question 4—Is compliance better when the solid white pavement marking line is used to indicate the end of the reduced-speed zone? ......................................................................... 34 Question 5—Is compliance better when the End of School Zone sign is used to indicate the end of the speed zone? .................................................................................................... 35 Question 6—To indicate the end of a school speed zone, do you prefer an End of School Zone sign, a posted speed limit sign, a posted speed limit sign with an End of School Zone plaque on top, a white pavement marking line, or some combination? Why? ........... 35 Question 7—Where do you think school speed zones should be installed? ......................... 36 Question 8—Does your agency have a specific program for school speed zones? .............. 37 Question 9—Do you have any suggestions on ways to improve compliance in school speed zones?.......................................................................................................................... 38
CHAPTER 6 FIELD STUDIES AT SCHOOL CAMPUSES ................................................ 41
STUDY METHODOLOGY ..................................................................................................... 45 Speed Data ............................................................................................................................ 45
Laser .................................................................................................................................. 45 Portable On-Pavement Traffic Analyzer .......................................................................... 47 Pneumatic Tube Counters (Automatic) ............................................................................ 48
Video Data ............................................................................................................................ 49 SITE CHARACTERISTICS ..................................................................................................... 50 STUDY SITES ......................................................................................................................... 51
CHAPTER 7 FINDINGS FROM FIELD STUDIES .............................................................. 75
GENERAL FINDINGS ............................................................................................................ 75 Site Characteristics ................................................................................................................ 75 Operating Speed Characteristics ........................................................................................... 77
SPOT SPEED FINDINGS ........................................................................................................ 80 Active/Inactive School Zone Mean Speed ............................................................................ 80
Analysis Considering All Sites Together .......................................................................... 82 Separate Analysis by Site.................................................................................................. 83
Active/Inactive Buffer School Zone Speeds ......................................................................... 83 Analysis by Considering All Sites Together ..................................................................... 84 Separate Analysis by Site.................................................................................................. 86
Compliance with Speed Limit .............................................................................................. 86

xi
Compliance with School Buffer Speed Limit ....................................................................... 89 VARIABLES INFLUENCING SPEEDS IN SCHOOL ZONES ............................................. 90
Variables Affecting Speeds in an Active School Zone ......................................................... 90 Analysis Based on Average Speeds .................................................................................. 90 Analysis Based on Spot-Speed data .................................................................................. 93 Analysis Based on Speed-Distance Data .......................................................................... 95
FINDINGS FOR INDIVIDUAL SITES USING SPEED-DISTANCE LASER DATA ......... 98 Minimum Speed within School Zone ................................................................................... 98
By Percentage of School Zone Length ............................................................................. 99 By Distance Downstream of Start of School Zone ......................................................... 101 By Location of Minimum Speed for Individual Vehicles .............................................. 101
Speed Change Behavior ...................................................................................................... 105 By Percentage of School Zone Length ........................................................................... 105 By Distance Downstream of Start of School Zone ......................................................... 107 By Deceleration for Individual Vehicles ........................................................................ 108
Summary ............................................................................................................................. 111 BEFORE-AND-AFTER STUDY OF BUFFER ZONE SITES ............................................. 111
Site AU-1 ............................................................................................................................ 113 Findings for AU-1 ............................................................................................................... 114 Site WI-1 ............................................................................................................................. 116 Findings for WI-1 ............................................................................................................... 117
CHAPTER 8 DEVELOPMENT OF GUIDELINES FOR TRAFFIC CONTROL FOR SCHOOL AREAS ...................................................................................................................... 119
INTRODUCTION .................................................................................................................. 119 SCHOOL LOCATION ........................................................................................................... 119 DEFINITIONS ........................................................................................................................ 119 SCHOOL AREA ..................................................................................................................... 119 SCHOOL SPEED LIMIT ZONE ........................................................................................... 119 SCHOOL SPEED LIMIT ZONE CHARACTERISTICS ...................................................... 120
School Speed Limit Value .................................................................................................. 120 School Speed Limit Zone Beginning Location ................................................................... 120 School Speed Limit Zone Length ....................................................................................... 121 School Buffer Zone ............................................................................................................. 123 Active Times ....................................................................................................................... 123 School Speed Limit Zone Marking ..................................................................................... 124
SCHOOL PAVEMENT MARKINGS ................................................................................... 124 SCHOOL MARKED CROSSWALK .................................................................................... 124 SCHOOL ENTRANCE WARNING ASSEMBLY ............................................................... 125 CONDITIONS FOR REMOVING A SCHOOL SPEED ZONE ........................................... 125
CHAPTER 9 SUMMARY AND FINDINGS ........................................................................ 127
SUMMARY OF RESEARCH ................................................................................................ 127 Literature ............................................................................................................................. 127 Survey of Practice ............................................................................................................... 128 Review of State Guidelines ................................................................................................. 129
xii
Law Enforcement Survey ................................................................................................... 130 Field Studies........................................................................................................................ 130 Guidelines Development ..................................................................................................... 131
FIELD STUDY FINDINGS ................................................................................................... 131 Operating Speed Characteristics ......................................................................................... 131 Spot Speed Findings ........................................................................................................... 132 Individual Sites ................................................................................................................... 132
CONCLUSIONS .................................................................................................................... 133 REFERENCES .......................................................................................................................... 135 APPENDIX A GUIDELINES FOR TRAFFIC CONTROL FOR SCHOOL AREAS......APP-A APPENDIX B SUGGESTED CHANGES TO TXDOT DOCUMENTS.............................APP-B
xiii
LIST OF FIGURES
Page Figure 2-1. Average Speed or Percent Exceeding in School Zones by Approach Speed and
Sign Type for Washington Study (7). ...................................................................... 6 Figure 2-2. Examples of Rear-Facing Beacons. ............................................................................ 8 Figure 2-3. Example of a Driver Feedback Sign (15). ................................................................. 10 Figure 3-1. Example of Supplemental Plaques. ........................................................................... 14 Figure 3-2. Example of School Speed Limit Assembly for Over Roadway. ............................... 15 Figure 3-3. Examples of End of School Zone Signs. ................................................................... 16 Figure 3-4. Examples of SCHOOL markings. ............................................................................. 17 Figure 3-5. Example of School Crosswalk Warning Assembly. ................................................. 18 Figure 6-1. Speed/Distance Reading from Laser Gun. ................................................................ 46 Figure 6-2. Portable On-Pavement Traffic Analyzer with Cover and Sensor. ............................ 48 Figure 6-3. Installation of Pneumatic Tubes with Portable Counter. .......................................... 48 Figure 6-4. VCR Video Trailer Used in Site Video Data Collection. ......................................... 49 Figure 6-5. Video Trailer Positioned on Side of Road at a Site. ................................................. 50 Figure 6-6. Aerial Photograph of Study Site AL-1 (Base Map from Google Earth). .................. 51 Figure 6-7. Approaches to School Zone at Site AL-1. ................................................................ 51 Figure 6-8. Aerial Photograph of Study Site AU-1 (Base Map from Google Maps). ................. 52 Figure 6-9. Northbound Approach to AU-1. ............................................................................... 52 Figure 6-10. Aerial Photograph of Study Site AU-2 (Base Map from Google Earth). ............... 53 Figure 6-11. Approach to AU-2. .................................................................................................. 53 Figure 6-12. Aerial Photograph of Study Site BR-1 (Base Map from Google Maps). ................ 54 Figure 6-13. Driver’s View of Approach to Study Site BR-1. .................................................... 54 Figure 6-14. Aerial Photograph of Study Site BR-2 (Base Map from Google Maps). ................ 55 Figure 6-15. Driver’s View of Approach to Study Site BR-2. .................................................... 55 Figure 6-16. Aerial Photograph of Study Site BR-3 (Base Map from Google Maps). ................ 56 Figure 6-17. Driver’s View of Approach to Study Site BR-3. .................................................... 56 Figure 6-18. Aerial Photograph of Study Site CO-1 (Base Map from Google Maps). ............... 57 Figure 6-19. Driver’s View of Approach to Study Site CO-1. .................................................... 57 Figure 6-20. Aerial Photograph of Study Site CO-2 (Base Map from Google Maps). ............... 58 Figure 6-21. Driver’s View of Approach to Crosswalk at Study Site CO-2. .............................. 58 Figure 6-22. Aerial Photograph of Study Site CV-1 (Base Map from Google Maps). ............... 59 Figure 6-23. Close-up Aerial Photograph of Study Site CV-1 (Base Map from Google Maps). 59 Figure 6-24. Driver’s View of Approach to Study Site CV-1. .................................................... 59 Figure 6-25. Aerial Photograph of Study Site EL-1 (Base Map from Google Maps). ................ 60 Figure 6-26. Driver’s View of Approach to Study Site EL-1. ..................................................... 60 Figure 6-27. Aerial Photograph of Study Site EL-2 (Base Map from Google Maps). ................ 61 Figure 6-28. Driver’s View of Approach to Study Site EL-2. ..................................................... 61 Figure 6-29. Aerial Photograph of Study Site EL-3 (Base Map from Google Maps). ................ 62 Figure 6-30. Driver’s View of Approach to Study Site EL-3. ..................................................... 62 Figure 6-31. West Boundary of Westbound School Zone at Study Site EL-3. ........................... 62 Figure 6-32. Aerial Photograph of Study Site JE-1 (Base Map from Google Maps). ................. 63 Figure 6-33. Driver’s View of Approach to Study Site JE-1. ...................................................... 63

xiv
Figure 6-34. Aerial Photograph of Study Site LE-1 (Base Map from Google Earth). ................ 64 Figure 6-35. Pedestrian Crosswalk on LE-1. ............................................................................... 64 Figure 6-36. Aerial Photograph of Study Site RO-1 (Base Map from Google Maps). ............... 65 Figure 6-37. Driver’s View of Approach to Study Site RO-1. .................................................... 65 Figure 6-38. Aerial Photograph of Study Site RO-2 (Base Map from Google Maps). ............... 66 Figure 6-39. Signs at RO-2. ......................................................................................................... 66 Figure 6-40. Southbound Driver’s View of Approach to Study Site RO-2. ................................ 66 Figure 6-41. Aerial Photograph of Study Site SA-1 (Base Map from Google Earth). ................ 67 Figure 6-42. Westbound Driver’s View of Approach to Study Site SA-1. ................................. 67 Figure 6-43. Eastbound Driver’s View Approaching School Speed Limit Sign. ........................ 67 Figure 6-44. Aerial Photograph of Study Site SA-2 (Base Map from Google Maps). ................ 68 Figure 6-45. Driver’s View of Approaches to Study Site SA-2. ................................................. 68 Figure 6-46. Aerial Photograph of Study Site SA-3 (Base Map from Google Maps). ................ 69 Figure 6-47. Driver’s View of Northbound Approach to Study Site SA-3. ................................ 69 Figure 6-48. Driver’s View of Southbound Approach to Crosswalk. ......................................... 69 Figure 6-49. Aerial Photograph of Study Site SA-4 (Base Map from Google Maps). ................ 70 Figure 6-50. Advance Warning Sign on Eastbound Approach to SA-4. ..................................... 70 Figure 6-51. Aerial Photograph of Study Site ST-1 (Base Map from Google Maps). ................ 71 Figure 6-52. Driver’s View of Approach to Study Site ST-1. ..................................................... 71 Figure 6-53. Aerial Photograph of Study Site SW-1 (Base Map from Google Earth). ............... 72 Figure 6-54. Driver’s View on Eastbound Approach to SW-1. ................................................... 72 Figure 6-55. Driveway Leading to SW-1. ................................................................................... 72 Figure 6-56. Aerial Photograph of Study Site TE-1 (Base Map from Google Maps). ................ 73 Figure 6-57. Driver’s View of Approach to Study Site TE-1. ..................................................... 73 Figure 6-58. Aerial Photograph of Study Site WI-1 (Base Map from Google Earth). ................ 74 Figure 6-59. Location of Tube Detectors on Northbound Approach to WI-1. ............................ 74 Figure 6-60. Southbound Approach to WI-1. .............................................................................. 74 Figure 7-1. School Speed Limit Zone Length for Sites with Buffer Zones. ................................ 76 Figure 7-2. School Speed Limit Zone Length by School Speed Limit. ....................................... 76 Figure 7-3. Regulatory Speed Limit vs. School Speed Limit. ..................................................... 77 Figure 7-4. Average Speed Measured During Active School Zone for Selected Variables. ....... 78 Figure 7-5. Average Speed Measured During Active School Zone for Additional Variables. ... 79 Figure 7-6. Observed Speed versus Speed Limits. ...................................................................... 81 Figure 7-7. Interaction Plot for Beacon*AM/PM for School Zone Data. ................................... 83 Figure 7-8. Least Squares Means Plot for Beacon for Buffer Zone Data. ................................... 85 Figure 7-9. Histogram of Proportion of Compliance (Not Exceeding Speed Limit) in School
Zone by Site. ........................................................................................................... 88 Figure 7-10. Histogram of Proportion of Vehicles within 5 mph of Speed Limit in School
Zone by Site. ........................................................................................................... 88 Figure 7-11. Histogram of Proportion of Compliance (Not Exceeding Speed Limit) in
Buffer Zone by Site. ............................................................................................... 89 Figure 7-12. Illustration of Predicted Speed by Time Relative to Start or End of School
(Example Uses 30 mph as Minimum Speed). ........................................................ 95 Figure 7-13. Illustration of Relationship Between Predicted Speed and School Zone Length
(Example Uses 30 mph as Minimum Speed). ........................................................ 98
xv
Figure 7-14. Generalized Ideal Speed-Distance Profile within School Zone (without a Buffer Zone). .......................................................................................................... 99
Figure 7-15. Cumulative Distribution of Individual Vehicle Minimum Speed Location within School Zone. ............................................................................................. 104
Figure 7-16. Minimum Speed Location Compared to School Zone Length. ........................... 104 Figure 7-17. Average Change in Speed, Active School Zone, 5-Percent Increments. .............. 106 Figure 7-18. Cumulative Distribution of Decelerations for 19 Sites. ........................................ 110 Figure 7-19. Generalized Ideal and Field Data Speed-Distance Profiles. ................................. 112 Figure 7-20. Typical Layout of School Speed Zone with Buffer Zone (1). .............................. 112 Figure 7-21. New 55-mph School Speed Limit Sign Assembly at Site AU-1. ......................... 113 Figure 7-22. 85th Percentile Speeds at Site AU-1. .................................................................... 115 Figure 7-23. Northbound Driver’s View of Buffer Zone at Site WI-1. ..................................... 116 Figure 7-24. 85th Percentile Speeds at Site WI-1. ..................................................................... 118


xvii
LIST OF TABLES
Page Table 2-1. Criteria for Establishing School Speed Limits from a West Virginia Study As
Reported by McCoy and Heiman (3). ........................................................................ 3 Table 2-2. Findings from Springfield, Illinois Study (8) of Five Treatments (One Site Each). ... 7 Table 2-3. Sample of Findings from Texas Study of Rear-Facing Beacon (10). .......................... 8 Table 2-4. Results from Maine DOT Study (11). .......................................................................... 9 Table 4-1. State Status per MUTCD Web Site (19). ................................................................... 21 Table 4-2. Suggested School Speed Limit Based on 85th Percentile Speed from Texas’
Procedures for Establishing Speed Zones (1). ......................................................... 23 Table 4-3. Arizona DOT School Crossing Warrants (30). .......................................................... 27 Table 4-4. Supporting Material for Arizona DOT School Crossing Warrants (30). ................... 28 Table 5-1. Location and Agency of Phone Survey. ..................................................................... 32 Table 5-2. Factors that Affect Drivers’ Compliance in Reduced School Zones by Location. .... 33 Table 5-3. Percentage of Compliance Level at Reduced School Speed Zones with
Enforcement NOT Obvious versus Obvious by Location. ...................................... 34 Table 5-4. Traffic Control Device Preference to Indicate the End of a School Speed Zone
by Location. ............................................................................................................. 36 Table 5-5. Where School Speed Zones Should be Installed by Location. ................................... 37 Table 5-6. Specific Programs for School Speed Zones by Location. .......................................... 38 Table 6-1. General Characteristics of Schools Where Observations Were Performed. .............. 42 Table 6-2. General Characteristics of Primary Roadway Near Schools. ..................................... 43 Table 6-3. General Characteristics of School Zones. .................................................................. 44 Table 6-4. Data Collection Techniques Used in Observational Studies. ..................................... 45 Table 7-1. JMP Output for the Spot Speeds In a School Zone Measured by Laser. ................... 82 Table 7-2. Tukey’s Multiple Comparison Test for Beacon*AM/PM for School Zone Data. .... 82 Table 7-3. Analysis by Site for Testing Equality of the Mean Speeds in a School Zone
Before and After the Beacon is Active. ................................................................... 84 Table 7-4. JMP Output for the Spot Speeds in a Buffer Zone Measured by Laser. .................... 85 Table 7-5. Least Squares Means Table for Beacon for Buffer Zone Data. ................................. 86 Table 7-6. Oneway Analysis by Site for Testing Equality of the Mean Speeds in a Buffer
Zone Before and After the Beacon Is Active. .......................................................... 86 Table 7-7. Compliance with Speed Limits. ................................................................................. 87 Table 7-8. Compliance Rates for Buffer Speed Limit When Buffer Zone is Active. .................. 89 Table 7-9. Variables Considered in Analyses. ............................................................................. 90 Table 7-10. Subset of Models Explored To Assess the Effects of School Characteristic
Variables on Average Speed in Active School Zone Using Average Speed at Each Site. ................................................................................................................. 91
Table 7-11. JMP Output for Average Speeds within an Active School Zone Under Model 7. ... 92 Table 7-12. Tukey’s Multiple Comparison Test for Area. .......................................................... 93 Table 7-13. Tukey’s Multiple Comparison Test for Num Lanes................................................. 93 Table 7-14. Results of Spot Speed Analysis. ............................................................................... 94 Table 7-15. JMP Output for Speeds within a School Zone When Beacon Is on Under
Split-Split-Plot Model Based on the Laser Only Data. ............................................ 96

xviii
Table 7-16. JMP Output for Speeds within a School Zone When Beacon Is on Under Split-Split-Plot Model Based on the Laser Only Data. ............................................ 97
Table 7-17. Average Speed Profiles by Percent of Distance through Reduced-Speed School Zone (Active School Zone). ....................................................................... 100
Table 7-18. Average Speed Profiles by Distance through Reduced-Speed School Zone (Active School Zone). ............................................................................................ 102
Table 7-19. Location of Minimum Speed Relative to Start of School Zone. ............................ 103 Table 7-20. Summary of Changes in Speed at Active School Zones by Percent of Distance
and School Speed Limit. ........................................................................................ 105 Table 7-21. Summary of Changes in Speed at Active School Zones by Percent of Distance
and School Zone Length. ....................................................................................... 107 Table 7-22. Summary of Speed Changes at Active School Zones by Distance and School
Speed Limit. ........................................................................................................... 107 Table 7-23. Summary of Speed Changes at Active School Zones by Distance and School
Zone Length. .......................................................................................................... 108 Table 7-24. Deceleration Rates for Each Site. ........................................................................... 109 Table 7-25. Distance to Decelerate for Selected Deceleration Rates. ....................................... 111 Table 7-26. Summary Statistics for Before-and-After Study at Site AU-1. .............................. 114 Table 7-27. Summary Statistics for Before-and-After Study at Site WI-1. ............................... 117 Table 8-1. Suggested Distances Between School Speed Limit Sign and School Driveway or
Marked Crosswalk. ................................................................................................ 120 Table 8-2. Deceleration Distances. ............................................................................................ 122 Table 8-3. Duration of Active Period Before and After School Start or End. ........................... 124
1
CHAPTER 1
INTRODUCTION The state of Texas, particularly in the large urban areas, has experienced considerable population growth in recent years. This growth has produced new schools in areas near highways originally designed for low volume and relatively high speeds. Another trend is the higher proportion of children being transported to and from schools in automobiles. These realities, and many other issues associated with traffic around schools, make it important to aggressively consider the traffic control on roadways near schools to ensure the safest possible traffic environment. Reduced-speed school zones are frequently requested traffic controls for school areas, based on the common belief that if the transportation agency would only install a reduced speed limit, then drivers would no longer speed through the area. Unfortunately, there are many situations where a reduced-speed school zone is not the appropriate solution. This research project has been tasked with reviewing existing practices and developing guidelines regarding the establishment of school zones. The current policy for setting school speed limits in Texas is primarily contained within two documents: Procedures for Establishing Speed Zones (1), and the Texas Manual on Uniform Traffic Control Devices (TMUTCD) (2). These documents state that speed zones should be confined to hours when children are going to and from school, and they should be based on pedestrian activity, though traffic may also be a consideration. The use of a school speed zone should be based on an engineering study. RESEARCH OBJECTIVES The purpose of Texas Department of Transportation (TxDOT) Project 0-5470, Comprehensive Guide to Traffic Control Near Schools, was to examine traffic control treatments in use near schools, especially those associated with reduced-speed school zones. As a result of the investigation, the research project developed recommended guidelines for school zone traffic control devices. This research report is a product of that project. The objective of the report is to discuss issues and concerns about vehicle speeds in school zones and to present recommendations on the use of appropriate traffic control devices, including speed school zones. RESEARCH APPROACH Researchers began by documenting existing knowledge on traffic control devices in school zones. This effort took several forms: a review of previous research studies examining effectiveness of devices, a survey of practitioners on signing and marking, a review of state and city school zone guidelines and warrants, and a telephone survey of law enforcement officers. Using this information, the research team identified several areas of emphasis, including characteristics of buffer zone sites and suggested guidelines for traffic control at rural school zones. Researchers collected field data at school zones across Texas and analyzed the data for
2
findings on speed-distance relationships, speed-time relationships, influences of various site characteristics on speeds, and special characteristics of school zones with buffer zones. The findings from these analyses guided development of guidelines for the installation of school zones in Texas. REPORT ORGANIZATION This report has nine chapters and two appendices. Their topics are: Chapter 1 Introduction—includes the objective of the project and the report organization. Chapter 2 Literature Review—includes a summary of previous research relevant to the subject of school zone traffic control. Chapter 3 Survey of Practice for Signing and Marking near Schools—includes the findings from a TxDOT survey and a nationwide survey of practitioners on the state-of-the-practice for school zone signing and marking. Chapter 4 Review of State Guidelines and Warrants for School Zones—provides a summary of the notable guidelines and warrants used in other states for installing school zones. Chapter 5 Phone Survey of Law Enforcement Officers—presents findings from a telephone survey of law enforcement officers in 12 Texas cities to assess vehicle compliance of speed reductions in school zones. Chapter 6 Field Studies at School Campuses—includes a description of the methodology used in the field studies in this project along with photographs of each school used as a field study site. Chapter 7 Findings from Field Studies—includes an explanation of the analyses of the field study data and related findings. Chapter 8 Development of Guidelines for Traffic Control for School Areas—includes a description of the process used by researchers to develop guidelines for use in installing future school zones. Chapter 9 Summary and Findings—provides the summary, key findings from the field studies, and conclusions for the research. Appendix A—contains the Guidelines for Traffic Control for School Areas. Appendix B—shows suggested revisions to key TxDOT documents.

3
CHAPTER 2
LITERATURE REVIEW ON VEHICLE SPEEDS IN SCHOOL ZONES Several studies have examined the effectiveness of various traffic control devices on vehicle speeds in school zones. Following is a summary of those studies. SIGNS AND MARKINGS A 1990 Transportation Research Board (TRB) paper (3) by McCoy and Heiman summarized previous studies with the observation that driver compliance with school speed limits is poor (less than 20 percent) and that attempts to increase driver compliance by improved signing and stepped-up enforcement have provided only slight increases in compliance and modest reduction in speed. Therefore, they noted, school zones require not only the use of effective signing and strict enforcement, but also the establishment of reasonable school zone speed limits. They reported that a study in West Virginia recommended the criteria shown in Table 2-1. The 1990 paper also reported on a study of speeds within 12 school speed zones that were considered to be representative of the variety of school speed limits used on urban streets in Nebraska. Based upon their findings, they concluded:
• Speeds in school zones are influenced more by the normal speed limits and speed characteristics of the streets on which the zones were located than by the school speed limits. They noted that this finding was consistent with the findings from the West Virginia study.
• School speed limits of 25 mph were more effective than 15- or 20-mph school speed limits on streets with a normal speed limit of 35 mph. Therefore, school speed limits lower than 25 mph should probably not be used on such streets.
• Some studies have found that school speed limits signed with flashing beacons were more effective than passive forms of school speed limit signing. This finding was supported in the Nebraska study because most of the 25-mph school speed zones (which had lower speeds) were signed with flashing beacons while the 15- and 20-mph school speed zones were not.
Table 2-1. Criteria for Establishing School Speed Limits from a West Virginia Study As Reported by McCoy and Heiman (3).
Distance of School Building from Roadway (ft)
School Speed Limits (mph) When Approach Speed Limit (mph)
25 35-45 55 0-55
56-100 Over 100
20 25 25
20 25 30
30 30 35
4
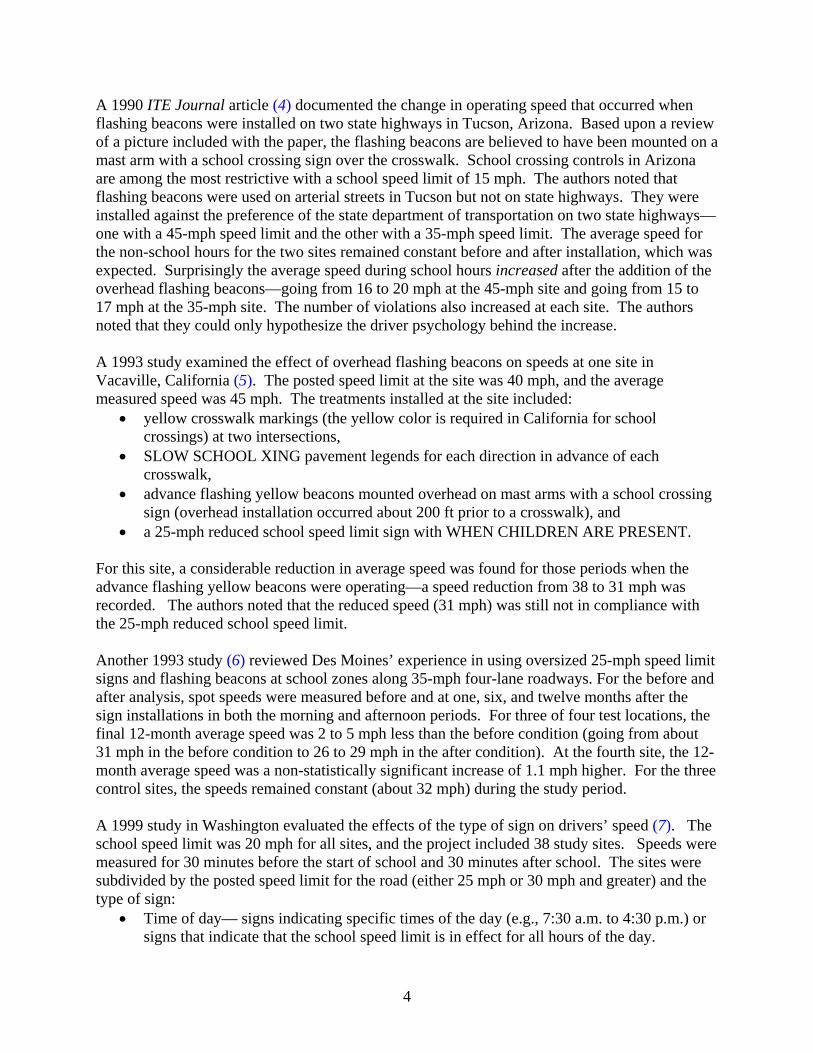
A 1990 ITE Journal article (4) documented the change in operating speed that occurred when flashing beacons were installed on two state highways in Tucson, Arizona. Based upon a review of a picture included with the paper, the flashing beacons are believed to have been mounted on a mast arm with a school crossing sign over the crosswalk. School crossing controls in Arizona are among the most restrictive with a school speed limit of 15 mph. The authors noted that flashing beacons were used on arterial streets in Tucson but not on state highways. They were installed against the preference of the state department of transportation on two state highways—one with a 45-mph speed limit and the other with a 35-mph speed limit. The average speed for the non-school hours for the two sites remained constant before and after installation, which was expected. Surprisingly the average speed during school hours increased after the addition of the overhead flashing beacons—going from 16 to 20 mph at the 45-mph site and going from 15 to 17 mph at the 35-mph site. The number of violations also increased at each site. The authors noted that they could only hypothesize the driver psychology behind the increase. A 1993 study examined the effect of overhead flashing beacons on speeds at one site in Vacaville, California (5). The posted speed limit at the site was 40 mph, and the average measured speed was 45 mph. The treatments installed at the site included:
• yellow crosswalk markings (the yellow color is required in California for school crossings) at two intersections,
• SLOW SCHOOL XING pavement legends for each direction in advance of each crosswalk,
• advance flashing yellow beacons mounted overhead on mast arms with a school crossing sign (overhead installation occurred about 200 ft prior to a crosswalk), and
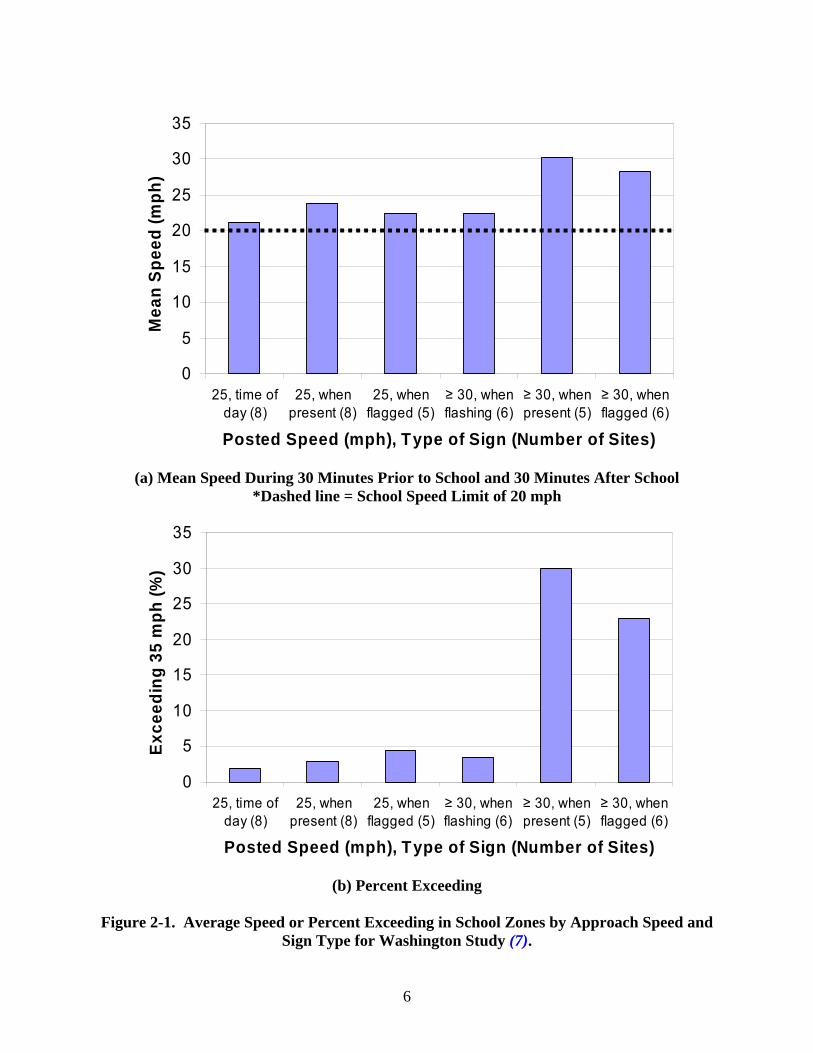
• a 25-mph reduced school speed limit sign with WHEN CHILDREN ARE PRESENT. For this site, a considerable reduction in average speed was found for those periods when the advance flashing yellow beacons were operating—a speed reduction from 38 to 31 mph was recorded. The authors noted that the reduced speed (31 mph) was still not in compliance with the 25-mph reduced school speed limit. Another 1993 study (6) reviewed Des Moines’ experience in using oversized 25-mph speed limit signs and flashing beacons at school zones along 35-mph four-lane roadways. For the before and after analysis, spot speeds were measured before and at one, six, and twelve months after the sign installations in both the morning and afternoon periods. For three of four test locations, the final 12-month average speed was 2 to 5 mph less than the before condition (going from about 31 mph in the before condition to 26 to 29 mph in the after condition). At the fourth site, the 12-month average speed was a non-statistically significant increase of 1.1 mph higher. For the three control sites, the speeds remained constant (about 32 mph) during the study period. A 1999 study in Washington evaluated the effects of the type of sign on drivers’ speed (7). The school speed limit was 20 mph for all sites, and the project included 38 study sites. Speeds were measured for 30 minutes before the start of school and 30 minutes after school. The sites were subdivided by the posted speed limit for the road (either 25 mph or 30 mph and greater) and the type of sign:
• Time of day— signs indicating specific times of the day (e.g., 7:30 a.m. to 4:30 p.m.) or signs that indicate that the school speed limit is in effect for all hours of the day.

5
• Flashing beacon—signs with yellow beacons on the sign posted that indicate the 20-mph limit is in effect when the beacons are flashing.
• When present—signs indicating the 20-mph limit is in effect when children are present. • When flagged—signs indicating that the reduced speed limit is in effect when orange
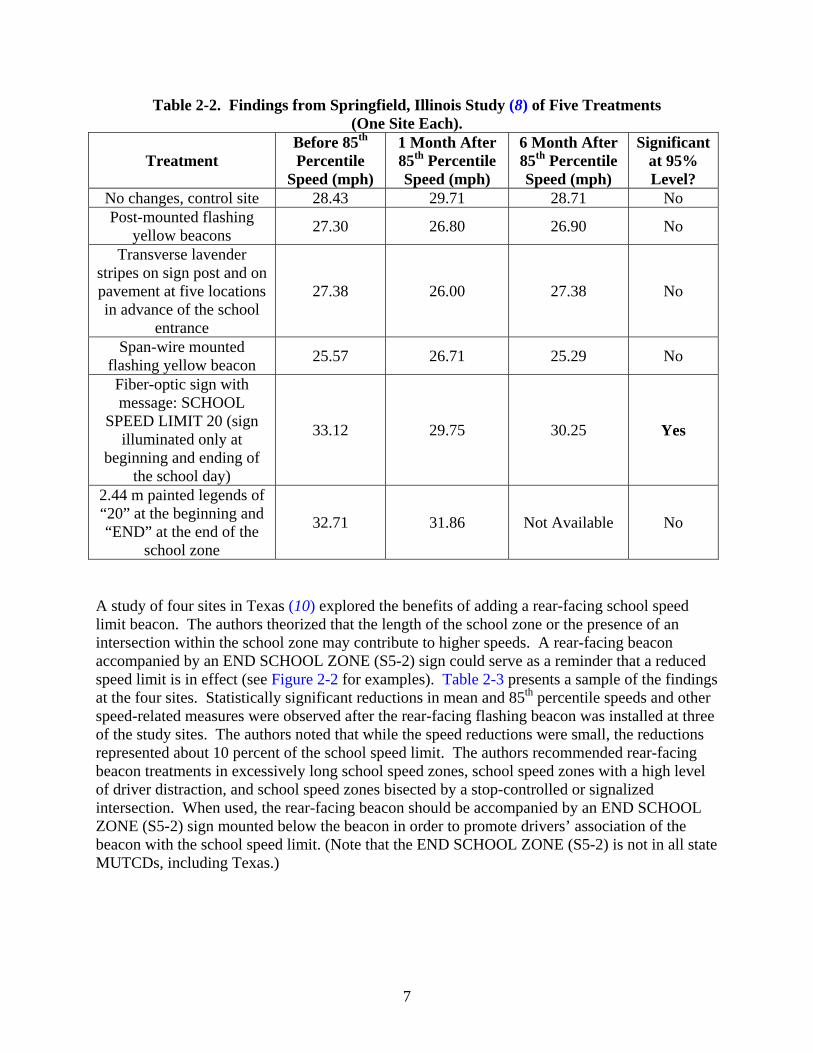
flags are attached to the sign post. The findings from the study are shown in Figure 2-1. For those roads with a posted speed limit of 25 mph, no statistically significant difference was found for the various signs. For those roads with posted speed limits of 30 mph or greater, vehicles were measured at significant higher average speeds with the WHEN CHILDREN ARE PRESENT or WHEN FLAGGED signs. In contrast, flashing beacons signs were associated with significantly slower average speeds of 22.5 mph—a 5- to 7-mph slower speed when compared to the speeds at the other signs. A 1999 study in Springfield, Illinois (8) evaluated five different school zone traffic control devices. Each device was installed at a unique site. A before-after study approach was used with speed data being collected before and one and six months after installation. Each site had a school speed limit of 20 mph; however, the posted speed limit at the sites was not provided in the paper. Table 2-2 summarizes the findings. Several treatments showed a reduction in speed; however, only the site with the fiber-optic sign experienced a statistically significant speed reduction. Lazic (9) conducted a before-and-after study on school speed zones in the city of Saskatoon, Saskatchewan. In 2002, the city of Saskatoon reduced speed limits in school zones from 50 km/h [31 mph] to 30 km/h [19 mph] and conducted a comprehensive study to monitor and determine the resulting change in drivers’ behavior and general compliance. In general, the study found:
• Street use and prevailing traffic conditions influenced motorists’ behavior and speed compliance.
• During the active school hours, 85th percentile speed was reduced by 10 km/h (from 54.5 to 44.5 km/h) [by 6.3 mph (from 33.9 mph to 27.6 mph)] and only 23 percent of motorists complied with the speed limit.
• No significant change in speed was observed when the school zone was inactive. • Average weekday traffic volume dropped by approximately 13 percent, suggesting that
some drivers may have avoided school zones and used alternate routes.
6
0
5
10
15
20
25
30
35
25, time ofday (8)
25, whenpresent (8)
25, whenflagged (5)
≥ 30, whenflashing (6)
≥ 30, whenpresent (5)
≥ 30, whenflagged (6)
Posted Speed (mph), Type of Sign (Number of Sites)
Mea
n Sp
eed
(mph
)
(a) Mean Speed During 30 Minutes Prior to School and 30 Minutes After School *Dashed line = School Speed Limit of 20 mph
0
5
10
15
20
25
30
35
25, time ofday (8)
25, whenpresent (8)
25, whenflagged (5)
≥ 30, whenflashing (6)
≥ 30, whenpresent (5)
≥ 30, whenflagged (6)
Posted Speed (mph), Type of Sign (Number of Sites)
Exce
edin
g 35
mph
(%)
(b) Percent Exceeding
Figure 2-1. Average Speed or Percent Exceeding in School Zones by Approach Speed and Sign Type for Washington Study (7).
7
Table 2-2. Findings from Springfield, Illinois Study (8) of Five Treatments (One Site Each).
Treatment Before 85th Percentile
Speed (mph)
1 Month After 85th Percentile Speed (mph)
6 Month After 85th Percentile Speed (mph)
Significant at 95% Level?
No changes, control site 28.43 29.71 28.71 No Post-mounted flashing
yellow beacons 27.30 26.80 26.90 No
Transverse lavender stripes on sign post and on pavement at five locations in advance of the school
entrance
27.38 26.00 27.38 No
Span-wire mounted flashing yellow beacon 25.57 26.71 25.29 No
Fiber-optic sign with message: SCHOOL
SPEED LIMIT 20 (sign illuminated only at
beginning and ending of the school day)
33.12 29.75 30.25 Yes
2.44 m painted legends of “20” at the beginning and “END” at the end of the
school zone
32.71 31.86 Not Available No
A study of four sites in Texas (10) explored the benefits of adding a rear-facing school speed limit beacon. The authors theorized that the length of the school zone or the presence of an intersection within the school zone may contribute to higher speeds. A rear-facing beacon accompanied by an END SCHOOL ZONE (S5-2) sign could serve as a reminder that a reduced speed limit is in effect (see Figure 2-2 for examples). Table 2-3 presents a sample of the findings at the four sites. Statistically significant reductions in mean and 85th percentile speeds and other speed-related measures were observed after the rear-facing flashing beacon was installed at three of the study sites. The authors noted that while the speed reductions were small, the reductions represented about 10 percent of the school speed limit. The authors recommended rear-facing beacon treatments in excessively long school speed zones, school speed zones with a high level of driver distraction, and school speed zones bisected by a stop-controlled or signalized intersection. When used, the rear-facing beacon should be accompanied by an END SCHOOL ZONE (S5-2) sign mounted below the beacon in order to promote drivers’ association of the beacon with the school speed limit. (Note that the END SCHOOL ZONE (S5-2) is not in all state MUTCDs, including Texas.)

8
Table 2-3. Sample of Findings from Texas Study of Rear-Facing Beacon (10). Site School
Zone Length
(ft)
Posted Speed Limit (mph)
School Speed Limit (mph)
Cross Section
Intermediate Traffic Control
85th Percentile Speed (mph) at 200 ft Prior to Sign Before After
C1 1265 35 20 4+TWLTL Stop Sign 25.1 23.0 TH 2675 45 30 4+TWLTL Signal 42.0 39.0 HU 1750 50 30 4+TWLTL None 44.0 43.0 C2 1000 35 20 2+TWLTL None 23.0 22.0
Note: TWLTL = two-way left turn lane.
Figure 2-2. Examples of Rear-Facing Beacons.
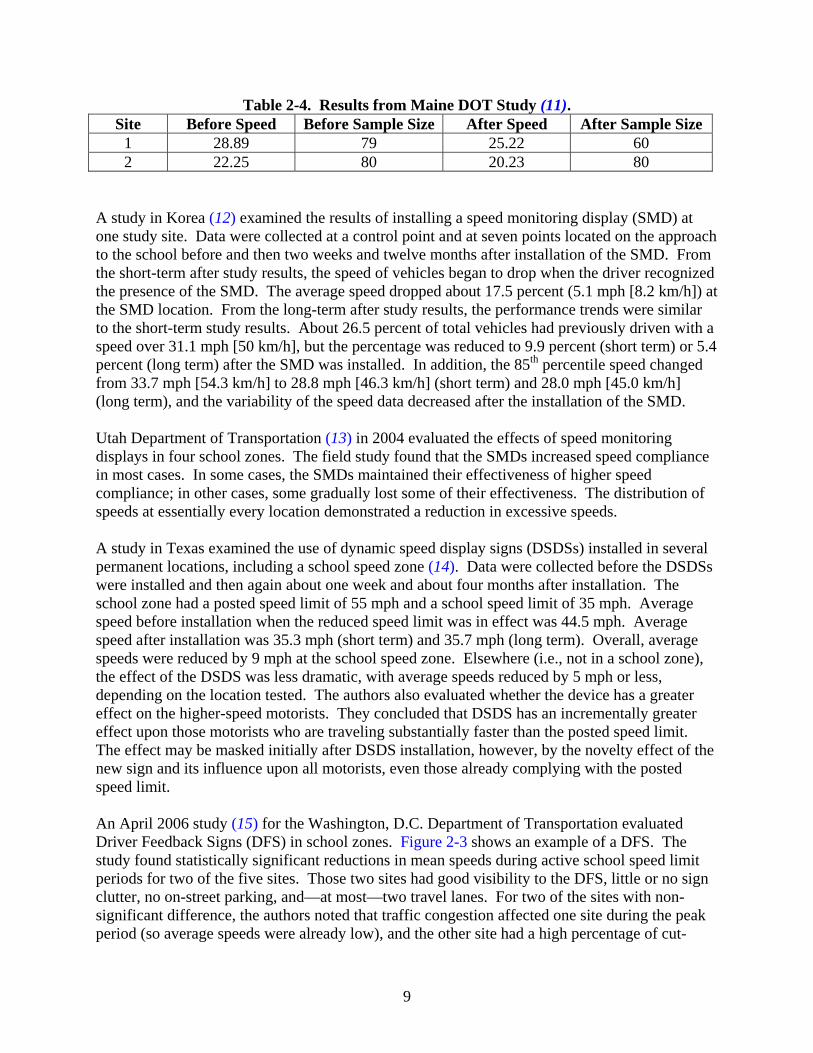
SPEED MONITORING DISPLAY Maine Department of Transportation (DOT) (11) evaluated a radar-activated speed warning sign at two locations in 2003. After the installation of the signs, the average speed decreased (see Table 2-4). While the speeds did decrease about 2 to 3 mph, more than 70 percent of the vehicles still exceeded the 15-mph school speed limit.
9
Table 2-4. Results from Maine DOT Study (11). Site Before Speed Before Sample Size After Speed After Sample Size
1 28.89 79 25.22 60 2 22.25 80 20.23 80
A study in Korea (12) examined the results of installing a speed monitoring display (SMD) at one study site. Data were collected at a control point and at seven points located on the approach to the school before and then two weeks and twelve months after installation of the SMD. From the short-term after study results, the speed of vehicles began to drop when the driver recognized the presence of the SMD. The average speed dropped about 17.5 percent (5.1 mph [8.2 km/h]) at the SMD location. From the long-term after study results, the performance trends were similar to the short-term study results. About 26.5 percent of total vehicles had previously driven with a speed over 31.1 mph [50 km/h], but the percentage was reduced to 9.9 percent (short term) or 5.4 percent (long term) after the SMD was installed. In addition, the 85th percentile speed changed from 33.7 mph [54.3 km/h] to 28.8 mph [46.3 km/h] (short term) and 28.0 mph [45.0 km/h] (long term), and the variability of the speed data decreased after the installation of the SMD. Utah Department of Transportation (13) in 2004 evaluated the effects of speed monitoring displays in four school zones. The field study found that the SMDs increased speed compliance in most cases. In some cases, the SMDs maintained their effectiveness of higher speed compliance; in other cases, some gradually lost some of their effectiveness. The distribution of speeds at essentially every location demonstrated a reduction in excessive speeds. A study in Texas examined the use of dynamic speed display signs (DSDSs) installed in several permanent locations, including a school speed zone (14). Data were collected before the DSDSs were installed and then again about one week and about four months after installation. The school zone had a posted speed limit of 55 mph and a school speed limit of 35 mph. Average speed before installation when the reduced speed limit was in effect was 44.5 mph. Average speed after installation was 35.3 mph (short term) and 35.7 mph (long term). Overall, average speeds were reduced by 9 mph at the school speed zone. Elsewhere (i.e., not in a school zone), the effect of the DSDS was less dramatic, with average speeds reduced by 5 mph or less, depending on the location tested. The authors also evaluated whether the device has a greater effect on the higher-speed motorists. They concluded that DSDS has an incrementally greater effect upon those motorists who are traveling substantially faster than the posted speed limit. The effect may be masked initially after DSDS installation, however, by the novelty effect of the new sign and its influence upon all motorists, even those already complying with the posted speed limit. An April 2006 study (15) for the Washington, D.C. Department of Transportation evaluated Driver Feedback Signs (DFS) in school zones. Figure 2-3 shows an example of a DFS. The study found statistically significant reductions in mean speeds during active school speed limit periods for two of the five sites. Those two sites had good visibility to the DFS, little or no sign clutter, no on-street parking, and—at most—two travel lanes. For two of the sites with non-significant difference, the authors noted that traffic congestion affected one site during the peak period (so average speeds were already low), and the other site had a high percentage of cut-

10
through, work-related trips, which meant that drivers were “by their very nature…less observant of any type of speed reduction signs.” The report recommended that the DFS be deployed in school zones where a speed study indicates that the mean vehicle speeds are 35 mph or greater and the following conditions are also present:
Locations where the visibility of the DFS is at least 150 to 200 ft and not blocked by trees, utility poles, or other obstacles.
Locations with two-lane roads, one travel lane in each direction.
Locations with more than one travel lane in each direction. (At these locations, the DFS should be located over each lane. If this is not practical, increase the DFS size to 36 inches by 48 inches.)
Locations with no on-street parking. (When on-street parking exists, increase the DFS size to 36 inches by 48 inches.)
Locations where the DFS conveys a clear and real need for the drivers to reduce speed. Similarly, the DFS may be less effective at locations with an overabundance of driver information for a driver to process or too much sign clutter.
Figure 2-3. Example of a Driver Feedback
Sign (15).
11
CHAPTER 3
SURVEY OF PRACTICE FOR SIGNING AND MARKINGS NEAR SCHOOLS
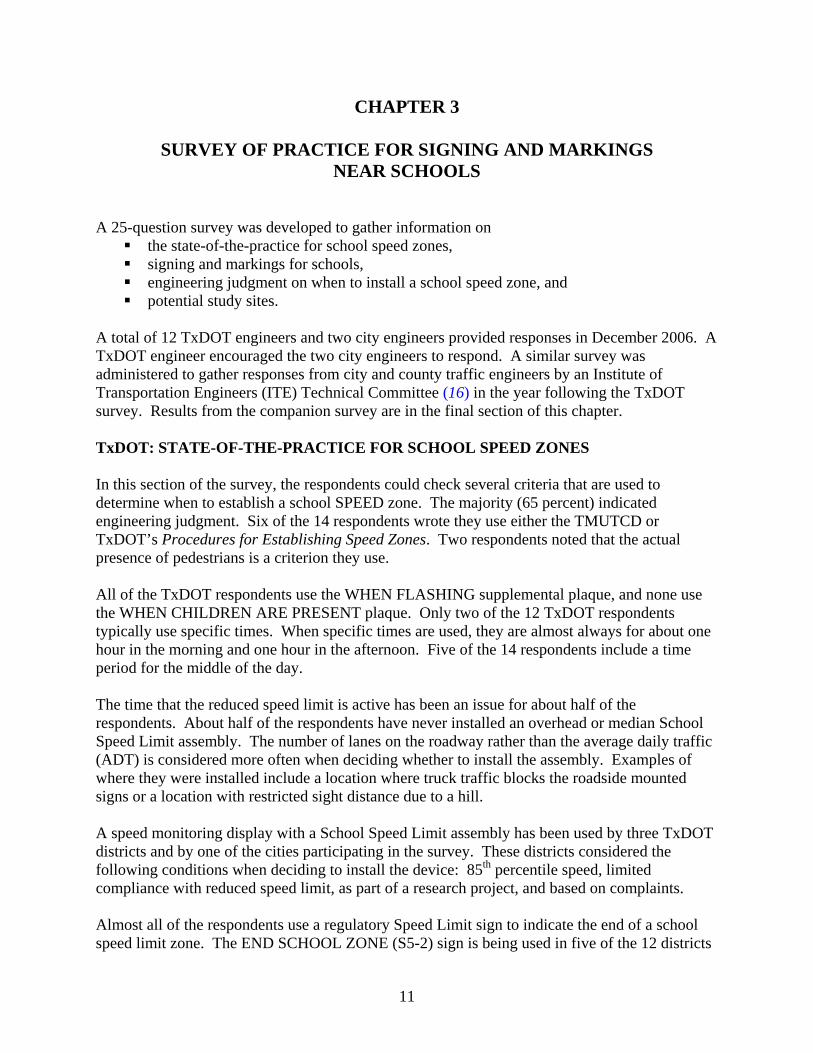
A 25-question survey was developed to gather information on
the state-of-the-practice for school speed zones, signing and markings for schools, engineering judgment on when to install a school speed zone, and potential study sites.
A total of 12 TxDOT engineers and two city engineers provided responses in December 2006. A TxDOT engineer encouraged the two city engineers to respond. A similar survey was administered to gather responses from city and county traffic engineers by an Institute of Transportation Engineers (ITE) Technical Committee (16) in the year following the TxDOT survey. Results from the companion survey are in the final section of this chapter. TxDOT: STATE-OF-THE-PRACTICE FOR SCHOOL SPEED ZONES In this section of the survey, the respondents could check several criteria that are used to determine when to establish a school SPEED zone. The majority (65 percent) indicated engineering judgment. Six of the 14 respondents wrote they use either the TMUTCD or TxDOT’s Procedures for Establishing Speed Zones. Two respondents noted that the actual presence of pedestrians is a criterion they use. All of the TxDOT respondents use the WHEN FLASHING supplemental plaque, and none use the WHEN CHILDREN ARE PRESENT plaque. Only two of the 12 TxDOT respondents typically use specific times. When specific times are used, they are almost always for about one hour in the morning and one hour in the afternoon. Five of the 14 respondents include a time period for the middle of the day. The time that the reduced speed limit is active has been an issue for about half of the respondents. About half of the respondents have never installed an overhead or median School Speed Limit assembly. The number of lanes on the roadway rather than the average daily traffic (ADT) is considered more often when deciding whether to install the assembly. Examples of where they were installed include a location where truck traffic blocks the roadside mounted signs or a location with restricted sight distance due to a hill. A speed monitoring display with a School Speed Limit assembly has been used by three TxDOT districts and by one of the cities participating in the survey. These districts considered the following conditions when deciding to install the device: 85th percentile speed, limited compliance with reduced speed limit, as part of a research project, and based on complaints. Almost all of the respondents use a regulatory Speed Limit sign to indicate the end of a school speed limit zone. The END SCHOOL ZONE (S5-2) sign is being used in five of the 12 districts
12
with one district and one city noting they combine a smaller version of the END SCHOOL ZONE (S5-2) sign with a normal regulatory Speed Limit (R2-1) sign. A solid white line always marks the beginning and ending of a school zone for 11 of 14 of the respondents. The remaining three respondents noted that most times a solid white line is used. School zone limits are determined using the property line of the school for about half of the respondents. About half of the respondents have removed a school speed zone in the past five years. The reasons for the removal included the following: a signal was added to the area, a review indicated it was no longer necessary, or the school closed. TxDOT: OTHER SIGNING AND MARKINGS FOR SCHOOLS The results of this section of the survey reveal that the SCHOOL markings on the pavement are never installed for 11 of 14 respondents. The remaining three have considered them for multilane roads and roads with high ADTs. About half of the respondents do not install beacons with a School Crosswalk Warning (S1-1) assembly. The decision to use a beacon is based on engineering judgment and is also considered for multilane roads and roads with high ADTs. They have been used at locations where the reduced speed is not warranted but the school is adjacent to the roadway. TxDOT: ENGINEERING JUDGMENT This section of the survey asked for the respondents’ engineering judgment on when to install a school speed zone. Almost all of the respondents indicated that the school speed zone should be used when school-aged pedestrians are crossing the road. About half felt that the school speed zone should be installed (and stated in another manner, about half felt it should not be installed) when school-age pedestrians are walking along but not crossing the road. Two of the 12 TxDOT respondents felt that a school speed zone should be used when school bus traffic is expected. Two of the 12 respondents also noted that school speed zones should be used when the school traffic affects the operation of the highway or at high schools “because of the large number of rookie drivers.” Slightly more than half of the respondents felt the criteria for a school speed zone should be different based on the rural/urban classification or on the speed of the roadway. Most felt that the volume of the roadway should influence the decision. Most of the respondents felt that the school zone should be placed at major crossing points on roads not adjacent to but on major pathways to and from the school. TxDOT: POTENTIAL STUDY SITES The survey requested the participants to provide suggested locations for the field studies. Participants suggested several potential study sites for the following school speed zone conditions:
locations greater than 0.25 mile in length, locations that need an additional School Speed Limit assembly because of an
intermediate intersection, and
13
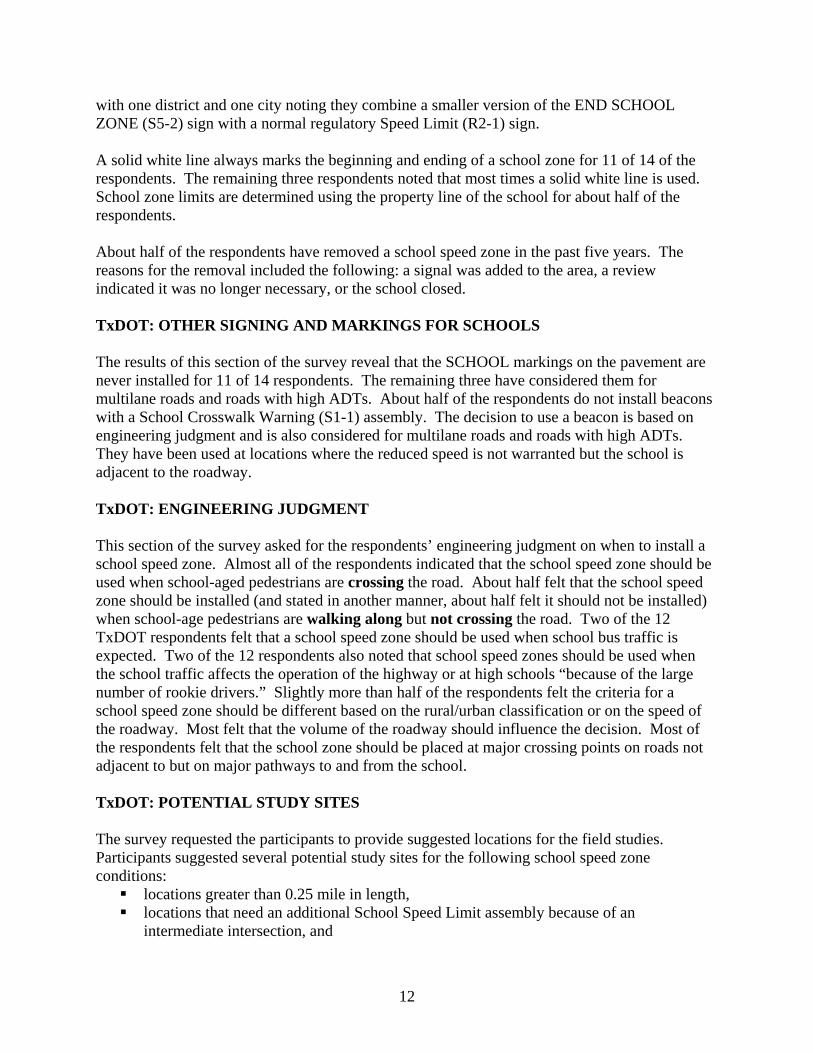
locations that include a flashing buffer zone. TxDOT: COMMENTS Several respondents provided general comments including:
Times flashers are active is dependent upon the school district. In some cases, times are rather lengthy and no pedestrian traffic or increased vehicle traffic is visible.
Would like to see guidelines as to how many pedestrians are required to install a school zone.
We have several schools that I feel do not require reduced speeds due to no pedestrians. I would still like to install a sign with flashers for some of these schools. The only sign available is S1-1. Could you look at another sign design for school areas where pedestrians may not be present but there is a large volume of school traffic at certain times of the day. I personally like the old “School” (text) warning sign.
I also do not feel the white marking pavement is necessary for marking the limits of the school zones.
Would like guidance/further study on driver confusion resulting from school zone flashers located next to traffic signals. Does yellow flash [from the beacon affect the message from the] yellow signal?
Would like to change reduced school zone concept into reduced pedestrian zone for use at other locations and to emphasize pedestrian nature of school zones.
Would like guidance on use of advisory speed plaque rather than regulatory speed reduction. We could give 10-mph advisory reduction with a flashing beacon instead of the ordinance based regulatory reduction in areas without any pedestrian crossings.
TxDOT: QUESTION-BY-QUESTION RESPONSES Following are the number of responses (shown in brackets and bold and italics) for the check boxes on the survey. School Speed Zones
1. Which of the following criteria does your district use to determine when to install reduced school speed zones (check all that apply)?
A. [8 responses] Guidelines/warrants (please send us a copy or let us know how to obtain) TMUTCD [3 responses], TxDOT's Procedures for Establishing Speed Zones [4 responses], and Procedures, state pedestrian crossing primary basis.
B. [9 responses] Engineering judgment. C. [4 responses] City council, county commission, and/or school board designation. D. [4 responses] Other (please specify):
The actual presence of pedestrians, Pedestrians, Political pressure, and We remove them when we install a signal.
14
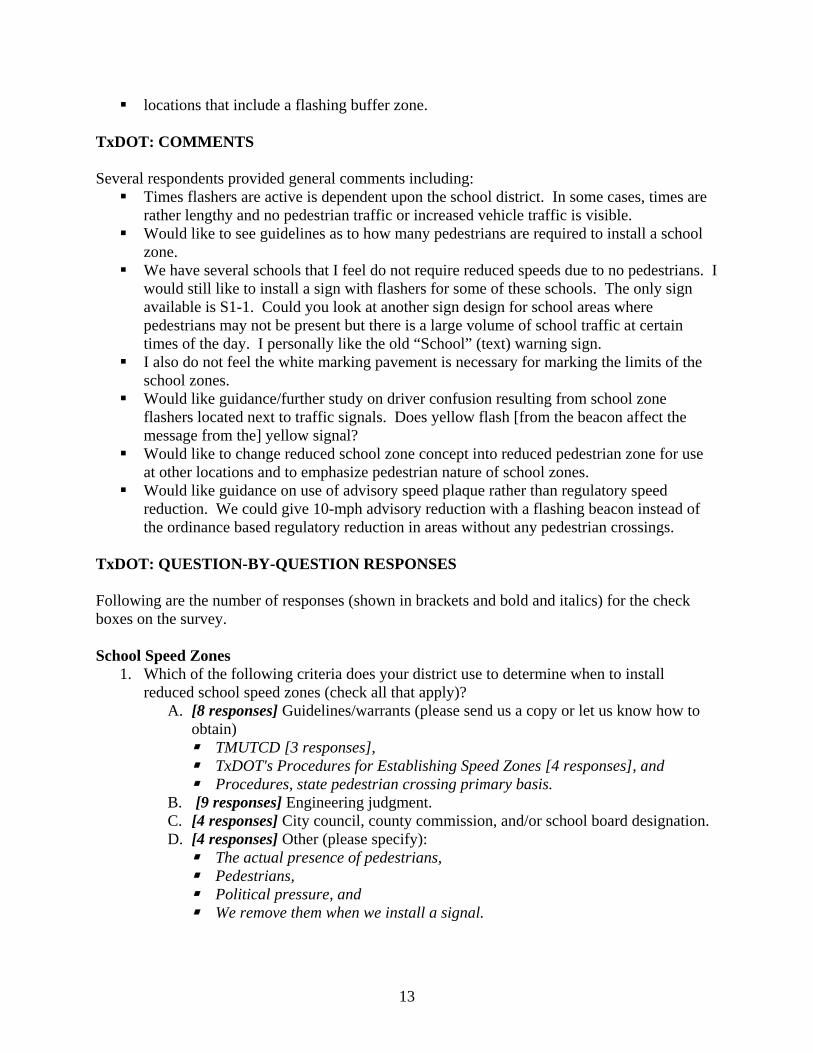
2. Which of the following supplemental plaques do you typically use on the School Speed Limit assembly (check all that apply) (see Figure 3-1 for examples)?
A. [4 responses] Specific times (S4-1, S4-6). B. [0 responses] WHEN CHILDREN ARE PRESENT (S4-2). C. [13 responses] WHEN FLASHING (S4-4 or S5-1). D. [2 responses] Other (please specify):
Have one location where law enforcement requested times, and Some cities use S4-1 on our roadways, but we restrict them to the hours
specified in the Procedures, not the illegal 8:30 to 5:30 sign.
Figure 3-1. Example of Supplemental Plaques.
3. If specific times or flashing beacons are used, what is the time the reduced school speed zone is generally active (check all that apply)?
A. [12 responses] About one hour in the morning and one hour in the afternoon, B. [5 responses] Includes a time period in the middle of the day, C. [1 responses] Has a longer afternoon period to accommodate after school
programs, D. [2 responses] All day (e.g., 7 a.m. to 4 p.m.), E. [5 responses] Varies depending upon school district, and F. [1 responses] Specific times or flashing beacons are not used.
4. Has the time that the reduced speed limit is active been an issue within your district? [6 responses] No, and [8 responses] Yes.
5. When do you install the School Speed Limit (S6-1) assembly over the roadway (see Figure 3-2) (check all that apply)?
A. [6 responses] Never install an overhead School Speed Limit assembly, B. [4 responses] Based on engineering judgment, C. [5 responses] Multilane roads, D. [1 responses] High ADTs, and E. [3 responses] Other (please specify):
When truck traffic blocks sign, High-speed road with hill prior to school speed zone, and

15
Politically driven at one location, and after a truck accident knocked over the previous pole.
Figure 3-2. Example of School Speed Limit Assembly for Over Roadway.
6. When do you install the School Speed Limit (S5-1) assembly in a median (check all that apply)?
A. [7 responses] Never install a School Speed Limit assembly in a median, B. [2 responses] As an alternative to a more costly overhead installation, C. [2 responses] Based on engineering judgment, D. [4 responses] Multilane roads, E. [1 responses] High ADTs, and F. [2 responses] Other (please specify):
No installations in median and Currently, we do not have any in medians.
7. Have you used a speed monitoring display with a School Speed Limit assembly? A. [10 responses] No, B. [3 responses] Yes (in 3 locations or less), and C. [1 responses] Yes (in more than 3 locations).
8. If you have used a speed monitoring display, what conditions were considered when deciding to install the device?
A. [1 responses] 85th percentile speed, B. [2 responses] Limited compliance with reduced speed limit, C. [0 responses] Crashes, D. [0 responses] Vehicle volume, E. [0 responses] Pedestrian volume, F. [0 responses] Age of pedestrians crossing the roadway, G. [2 responses] Other:
Research Project, Based on complaints, and
H. [7 responses] Have not used a speed monitoring display with a School Speed Limit assembly.
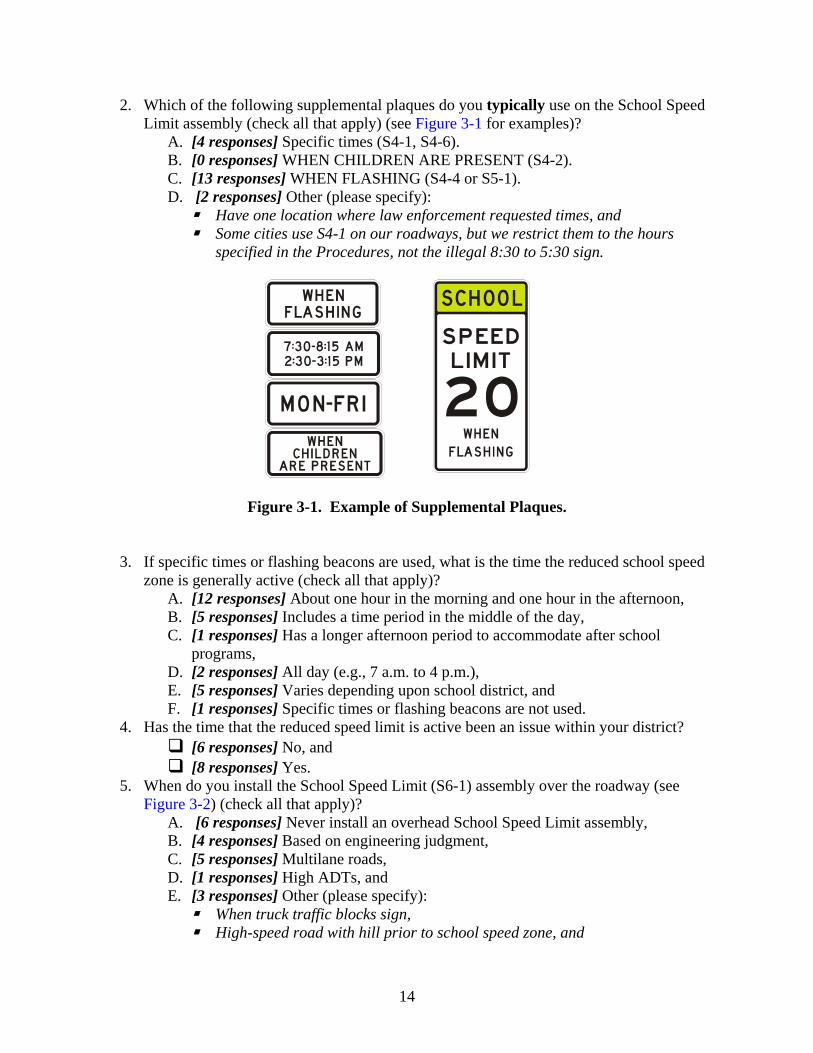
9. What sign(s) do you typically use to indicate the end of a school speed limit zone (check all that apply) (see Figure 3-3 for examples)?
A. [12 responses] Regulatory Speed Limit (R2-1) sign, B. [6 responses] END SCHOOL ZONE (S5-2) sign, C. [2 responses] Other:
We use a smaller version of S5-2 with the normal regulatory Speed Limit sign, and
16
Use together.
Figure 3-3. Examples of End of School Zone Signs.
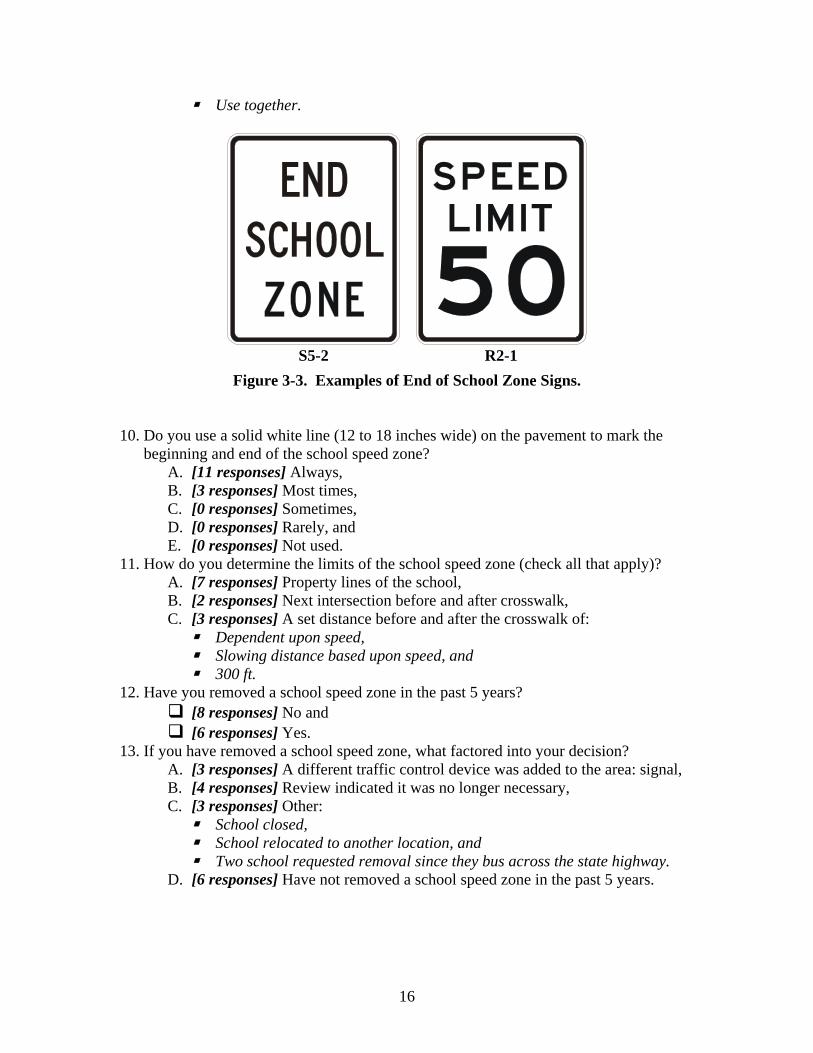
10. Do you use a solid white line (12 to 18 inches wide) on the pavement to mark the beginning and end of the school speed zone?
A. [11 responses] Always, B. [3 responses] Most times, C. [0 responses] Sometimes, D. [0 responses] Rarely, and E. [0 responses] Not used.
11. How do you determine the limits of the school speed zone (check all that apply)? A. [7 responses] Property lines of the school, B. [2 responses] Next intersection before and after crosswalk, C. [3 responses] A set distance before and after the crosswalk of:
Dependent upon speed, Slowing distance based upon speed, and 300 ft.
12. Have you removed a school speed zone in the past 5 years? [8 responses] No and [6 responses] Yes.
13. If you have removed a school speed zone, what factored into your decision? A. [3 responses] A different traffic control device was added to the area: signal, B. [4 responses] Review indicated it was no longer necessary, C. [3 responses] Other:
School closed, School relocated to another location, and Two school requested removal since they bus across the state highway.
D. [6 responses] Have not removed a school speed zone in the past 5 years.
S5-2 R2-1

17
Other Signs/Markings 14. When do you install SCHOOL markings (see Figure 3-4) on the pavement (check all that
apply)? A. [0 responses] Always install the markings, B. [11 responses] Never install the markings, C. [0 responses] Upon request from the school, D. [3 responses] Based on engineering judgment, E. [0 responses] When the posted or 85th percentile speed is 20 mph or more than the
school zone speed limit, F. [1 responses] Multilane roads, G. [1 responses] High ADTs, and H. [1 responses] Other (please specify): Politics
Figure 3-4. Examples of SCHOOL markings.
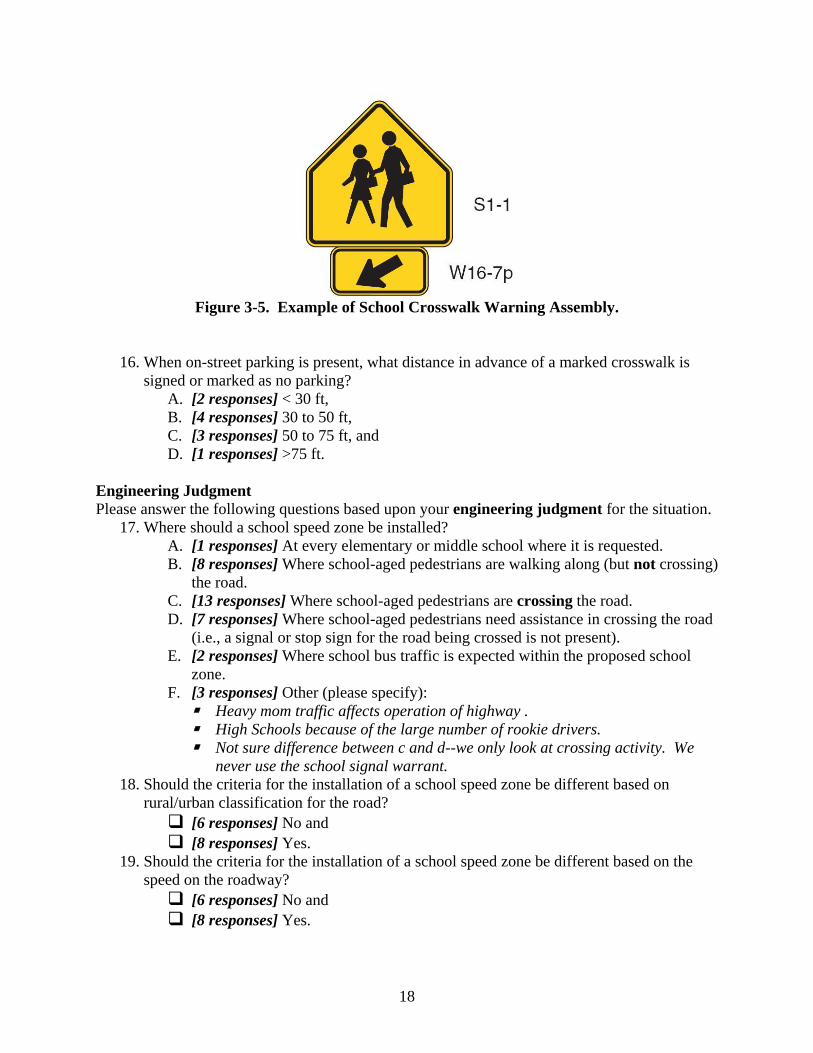
15. When do you install a beacon with a School Crosswalk Warning (S1-1) assembly (see Figure 3-5) (check all that apply)?
A. [1 responses] Always install beacons with a School Crosswalk Warning assembly,
B. [7 responses] Never install beacons with a School Crosswalk Warning assembly, C. [4 responses] Based on engineering judgment, D. [0 responses] When the posted or 85th percentile speed is 20 mph or more than the
school zone speed limit, E. [1 responses] Multilane roads, F. [1 responses] High ADTs, G. [2 responses] Other (please specify):
When reduced speed is not warranted but school is adjacent to roadway, and Near schools that do not qualify for a school zone we will use the S1-1 with
advisory speed plaque.
18
Figure 3-5. Example of School Crosswalk Warning Assembly.
16. When on-street parking is present, what distance in advance of a marked crosswalk is signed or marked as no parking?
A. [2 responses] < 30 ft, B. [4 responses] 30 to 50 ft, C. [3 responses] 50 to 75 ft, and D. [1 responses] >75 ft.
Engineering Judgment Please answer the following questions based upon your engineering judgment for the situation.
17. Where should a school speed zone be installed? A. [1 responses] At every elementary or middle school where it is requested. B. [8 responses] Where school-aged pedestrians are walking along (but not crossing)
the road. C. [13 responses] Where school-aged pedestrians are crossing the road. D. [7 responses] Where school-aged pedestrians need assistance in crossing the road
(i.e., a signal or stop sign for the road being crossed is not present). E. [2 responses] Where school bus traffic is expected within the proposed school
zone. F. [3 responses] Other (please specify):
Heavy mom traffic affects operation of highway . High Schools because of the large number of rookie drivers. Not sure difference between c and d--we only look at crossing activity. We
never use the school signal warrant. 18. Should the criteria for the installation of a school speed zone be different based on
rural/urban classification for the road? [6 responses] No and [8 responses] Yes.
19. Should the criteria for the installation of a school speed zone be different based on the speed on the roadway?
[6 responses] No and [8 responses] Yes.

19
20. Should the criteria for the installation of a school speed zone be different based on the roadway traffic volume?
[4 responses] No and [10 responses] Yes.
21. How far away from a school should a school zone be placed (check all that apply)? A. [7 responses] Should only be placed on roads adjacent to the school. B. [10 responses] At major crossing points on roads not adjacent to but on major
pathways to and from the school. C. At all crossing points on major roadways within:
1. [1 responses] 2 blocks, 2. [1 responses] 3 blocks, or 3. [1 responses] 4 blocks of the school.
D. [3 responses] Other (please specify): This will vary depending on the school location and pedestrian routes. Where students cross at uncontrolled intersections. Other states use a zone around the school concept where the State provides
all of the signing. There is need for uniformity in the signing. CITY/COUNTY: SUMMARY OF WEB-BASED SURVEY In Fall 2006, the Institute of Transportation Engineers (ITE) Traffic Engineering Council (TENC) Committee 106-01 conducted a Web-based survey on school-related traffic control devices (16). The Web-based survey built on the mail-out survey conducted by the Texas Transportation Institute for this Texas Department of Transportation study and on previous ITE surveys conducted in the mid-1990s and Spring 1997 (17,18). The 37-question Web-based survey gathered information on the state-of-the-practice for school speed zones, signing and markings for schools, and engineering judgment on when to install a school speed zone. A total of 168 participants provided responses. Following is an overview of selected findings. The initial question asked respondents to identify criteria used to determine when to establish a school zone. Respondents could select more than one answer, so the following percentages represent the proportion of those responding. The majority (61 percent) indicated that they use engineering judgment; one-third selected guidelines and warrants. Approximately 29 percent selected city council, county commission, and/or school board, which reflects that traffic engineers are frequently interacting with the public regarding traffic control decisions. A slight majority of the respondents use the WHEN FLASHING plaque (52 percent), 43 percent use specific times (S4-1, S4-6), and 32 percent use WHEN CHILDREN ARE PRESENT (S4-2). The sign most typically used to indicate the end of a school speed limit zone is the END SCHOOL ZONE (S5-2) sign (56 percent). The regulatory Speed Limit (R2-1) sign is also used by nearly one-half (46 percent) of the respondents. The combination of END SCHOOL ZONE (S5-2) and regulatory Speed Limit (R2-1) sign is used by 18 percent of the respondents. Most of
20
the respondents (87 percent, or 144 respondents) do not use a solid white line (12 to 18 inches wide) on the pavement to mark the beginning and ending of the school speed zone. The response to the question of how to determine the limits of a school speed zone clearly indicated that many different techniques along with many different lengths are used. The middle portion of the survey focused on signs and markings used near a school other than those used for school speed zones. The initial four questions in this portion of the survey focused on in-street, reduced-size signs, which have received growing interest. The next question in the survey covered the SCHOOL pavement marking. About 60 percent of the respondents have experience using the markings. In the engineering judgment section of the survey, the participants could indicate where they think a school zone should be used. Most of the participants selected “where school-age pedestrians are crossing the road.” The next five questions explored whether the criteria for installing a school speed zone should be different based upon selected characteristics of a site. For the participants, the operating speed on the roadway was clearly a variable that should affect the decision to install a school speed zone. While not as clear, there was a preference to consider pedestrian volume, roadway traffic volume, and number of lanes being crossed. The results of whether to consider urban versus rural classification when setting criteria for school speed zones was divided with nearly as many respondents stating that classification should or should not be considered. Finally, the survey included questions that explored the participants’ opinions on the perceived or known effectiveness of a device on compliance with a reduced speed limit. The approach that was viewed as very effective was police presence in a school zone. Other measures viewed as being effective but less effective than police presence were flashing beacons with school speed limit, speed monitoring displays, and double-fine zones.

21
CHAPTER 4
REVIEW OF STATE GUIDELINES AND WARRANTS FOR SCHOOL ZONES
Other states have established warrants and/or guidelines for installing a school zone using various combinations of vehicle and pedestrian volumes, posted or operating speeds, and rural/urban setting to define their criteria. A review of existing practices (16) revealed guidance ranging from no material to detailed numerical warrants. Table 4-1 lists states included in the review by their November 2006 status (19) with respect to adoption of the 2003 Manual on Uniform Traffic Control Devices (MUTCD) (20). The ITE review showed that most states specify that school zones with reduced speeds have speed limits of 15 or 20 mph in urban and suburban areas, but few specifically mention school zones in rural areas. Common among states’ descriptions of school zones are definitions of the time periods allowed, the appropriate distances from the school and/or associated crosswalk, and the restrictions for use at high schools or near signalized or stop-controlled intersections. Following is a summary of guidance by topic of interest.
Table 4-1. State Status per MUTCD Web Site (19). States (24) that have adopted the national MUTCD (2003 edition) and have no state supplement Alabama Iowa Mississippi North Dakota South Carolina Arkansas Kansas Missouri Nevada South Dakota Florida Kentucky Montana Oklahoma Vermont Georgia Louisiana New Hampshire Puerto Rico Wyoming Hawaii Maine New Jersey Rhode Island States (22) that have adopted the national MUTCD (2003 edition) and have a state supplement Alaska Idaho Nebraska Pennsylvania West Virginia Arizona Illinois New Mexico Tennessee Wisconsin Colorado Maryland New York Utah Connecticut Massachusetts North Carolina Virginia Delaware Michigan Oregon Washington States (4) that have a state MUTCD in conformance with the national MUTCD (2003 edition) California Minnesota Ohio Texas States (2) that have not yet identified adoption of the national MUTCD (2003 edition) Washington, DC Indiana (w/supplement) NOTE: Information for states shown in italics is included in the ITE Informational Report (16). For the remaining states, either the ITE committee could not find the information or guidance material on school zones does not exist in the state. Source of state’s status with respect to adoption of the 2003 MUTCD: “Adoption Status of National MUTCD by States and Federal Agencies.” Federal Highway Administration, November 28, 2006. Accessible via mutcd.fhwa.dot.gov/knowledge/natl_adopt_2000_2003.htm.
22
VALUE OF SCHOOL SPEED LIMITS The most common value for a school speed limit in state manuals that specify a value is 20 mph, as either the required value or the minimum value. The states using 20 mph include:
Alaska (21), Georgia, 20 mph typically; however, can be lower if traffic engineering study determines
it is warranted (22), Illinois (23), Massachusetts (24), North Carolina (25), Ohio (26), Oregon (27), Utah (28), and Washington (29).
The following states in the review use 15 mph:
Arizona (30), California, selected regions (31), Florida (32), Minnesota (33), New York (34), Pennsylvania (35), and West Virginia (36).
The following three states use 25 mph as a minimum:
California (37), Kentucky (38), Michigan (39), and Oklahoma (40).
The remaining states allow for varying school speed limit values, often depending on the regulatory speed limit and/or the 85th percentile speed. USE OF SCHOOL SPEED LIMITS IN RURAL OR URBAN AREAS Some states provide guidelines for school speed limits in both rural (or high speed) and urban/suburban areas, for example, Alaska (21), Florida (32), Illinois (23), Massachusetts (24), and Texas (1). Alaska’s traffic manual supplement (21) includes a table showing rural school zone traffic control. When the speed limit is 40 mph or more, the Advance School (S1-1) sign can include a beacon. Florida’s “Topic Memo” (32) discusses that in rural areas, where approach speeds are higher, flashing beacons should be used to increase the conspicuity of school zones. Massachusetts amendments to the MUTCD (24) comments that a school speed zone shall be not less than 850 ft in advance of the school grounds in rural areas. Illinois supplement (23) notes that the smaller school speed limit sign “should be used on conventional highways with approach speeds less than 45 mph,” and the larger sign “should be used with higher approach speeds….” Texas’ Procedures for Establishing Speed Zones (1) states that “it is

23
not advisable to set a school speed limit above 35 mph in either rural or urban areas.” Table 4-2 lists the numeric values suggested.
Table 4-2. Suggested School Speed Limit Based on 85th Percentile Speed from Texas’ Procedures for Establishing Speed Zones (1).
85th Percentile Speed Suggested School Speed Limit Below 50 mph Not more than 15 mph below 85th percentile speed
or posted speed 55 mph 20 mph below the 85th percentile speed Greater than 55 mph Use buffer zone to transition to a 35-mph school
speed limit Others commented that school speed limits may not be installed at locations with a posted speed limit above a certain value, which could be interpreted as a surrogate for prohibiting school zones in rural areas.
Arizona guidelines (30): “No School Crossings shall be installed on state highways having 85th percentile operating speeds in excess of 45 mph.” A school crossing includes the placing of 15-mph portable speed limit signs.
Utah manual (28): Manual includes detailed procedure for determining if a reduced-speed school zone is warranted similar to Arizona’s. Utah limits the installation on roads with posted speeds of 50 mph or less (while Arizona limits to 45 mph or less).
Oregon guide (27): School speed zones are discouraged on roadways with posted speed of 45 mph and above.
RESTRICTIONS ON THE USE OF A SCHOOL SPEED ZONE Several states provide cautions on where to use (or not use) a school speed zone:
Utah manual (28): “A Reduced Speed School Zone shall not be installed on an approach to an intersection controlled by a roundabout, a traffic signal, or a Stop sign unless it is a mitigation measure for concerns relating to sight distance, grade, or other critical issue as determined by an engineering study.”
Arizona guidelines (30): “Experience within Arizona has showed school crossings should: • Not be used at high schools, • Not be used within 600 ft of a Stop sign, traffic signal, or another school crossing on
the same street, and • Not be used in conjunction with Stop signs or traffic signals.”
Florida report (32): School speed zones can be used at school crossings at signalized intersections if justified by an engineering study.
TIMES OF OPERATION A somewhat common criterion in states’ manuals is that a reduced school speed limit cannot be in operation outside of certain periods in the day. Three states—Florida (32), Michigan (39), and New York (34)—specify either a time of day or a given duration before and after the beginning
24
and end of the school day. Other states, such as California, based operations on whether children are present rather than on a specific time of day. WHEN TO INSTALL? The MUTCD states that school reduced-speed zones are based on engineering study or specified by statute. The following states have additional guidance:
Arizona guidelines (30) have a point system for their School Crossing Warrants that considers gaps, pedestrian volume, 85th percentile speed, and demand/gap. Features of a School Crossing include placing 15-mph portable speed limit signs in roadway and using yellow markings.
Utah’s detailed procedure (28) for determining if a Reduced-Speed School Zone is warranted is similar to Arizona’s procedure. Examples of differences include 85th percentile speeds (Arizona 45 mph or less, Utah 50 mph or less) and pedestrian walking speeds (Utah 3 ft/sec, Arizona 3.5 ft/sec).
Illinois’ supplement (23) states: “The speed zone should be limited to those locations where elementary through high school buildings or grounds devoted primarily to normal school day activities are adjacent to the highway or where groups of children cross the highway in route to and from a school not adjacent to the highway.”
Massachusetts’ amendment to the MUTCD (24) has specifics for when a school zone is warranted (e.g., children have direct access to street, marked crosswalk is present, school involves a grade below 9th grade, etc.) and not warranted (e.g., children are not required to cross the street or property is fenced).
New York’s supplement (34) has several conditions that must be met, including a school that has grades below 12 and where “some of the children walk….”
Oregon’s guide (27) provides advice on when to consider a school speed zone, such as when there is at least one marked school crosswalk not protected by a signal or stop sign. They provide advice on when further justification is needed, such as when the marked school crosswalk is at a signalized intersection, etc.
In the Kentucky manual (38) school speed limits may be established for public or private schools if both of the following criteria are satisfied:
o The school property is adjacent to a state-maintained facility. o The student enrollment is equal to or greater than 100 in kindergarten through 12th
grade. LENGTH AND LOCATION OF SCHOOL ZONE The national MUTCD (20) states that reduced-speed zone begins either 200 ft from crosswalk or 100 ft from school property line, whichever is encountered first as traffic approaches the school. In January 2008, the Notice of Proposed Amendments to the MUTCD was released (41). Several changes were suggested for the school part of the MUTCD; however, no changes were proposed regarding the location of the start of the reduced-speed zone. Several states define minimum or maximum distances to school property lines and/or crosswalks, ranging between 150 ft to 1000 ft from school property.
25
Alaska’s supplement (21) states that “the reduced school zone shall begin at a point 300 ft or more from the school crosswalk.”
California’s state MUTCD (37) states, “If used, the School Speed Limit assembly may be posted up to 500 ft in advance of the school boundary.”
Georgia’s toolkit (22) states: “…speed limit is usually required to extend 300 ft in either direction from the school and from marked crosswalks near the school.”
Massachusetts’ amendment (24) includes advice on speed zone length for rural (start of zone at least 850 ft in advance of grounds) and urban (either 500 ft or one block).
For Michigan (39), school zones are established only for elementary and middle schools and are generally defined as the portion of the road “1,000 ft from the property line of the school in each direction.”
The TMUTCD (2) states that the zone begins either 200 ft from crosswalk or from first driveway on school property, whichever traffic encounters first as it approaches the school.
The Washington manual (29) states the speed zone is 300 ft in either direction from the marked crosswalk.
West Virginia’s directive (36) comments that a school speed limit of 15 mph is located a maximum of 125 ft from school property line.
New York specifies a maximum length of 1320 ft, and Pennsylvania caps the distance at 1600 ft.
New York law states that school speed zones shall not be greater than 1320 ft. Its supplement (34) gives a minimum length of 400 ft, and the zone begins either 200 ft from crosswalk or 300 ft from school property line, whichever is encountered first.
For Pennsylvania (35), “the limits of a school zone may extend beyond the school property lines to improve the sight distance or to encompass a school crosswalk, except that the length of the zone may not be greater than 1,600 feet.”
Florida and Illinois provide general advice on school zone lengths.
Florida’s manual (32) states school speed zones “should be kept as short as practical and should not necessarily extend along the entire highway frontage of the school property.”
Illinois’ supplement (23) states: “The location of the beginning and end of a 20-mph school speed zone should be based on engineering judgment rather than the exact location of the school property line.”
PROXIMITY TO OTHER TRAFFIC CONTROL Several states discourage or prohibit the installation of school speed zones within a specified distance of locations with other traffic control. Two states—Arizona (30) and Utah (28)—specifically either prohibit (“shall not”) or discourage (“should not”) use at signalized intersections and/or stop signs. OTHER CRITERIA USED IN WARRANTS OR GUIDELINES Selected states have more specific criteria for the installation of school speed limits; some of these states have formal installation warrants rather than guidelines. Arizona (30) has detailed numeric criteria for when to install a marked school crossing (see Tables 4-3 and 4-4). A marked
26
school crossing includes school reduced speed limits. Utah (28) also has a detailed procedure for determining if a Reduced-Speed School Zone is warranted that is similar to the procedure used by Arizona for warranting a school crossing. Considerations included in Texas’ Procedures (1) are general in nature. They include:
children are going to and from school, school is adjacent to highway or visible from highway, pedestrian crossing activity is primary basis, and irregular traffic and pedestrian movements must also be considered.
Key criteria included in several manuals are:
presence of children walking along or crossing the roadway, presence of fence around school property, determination of appropriate gaps for school-age pedestrians to cross the street, presence of crossing guards, determination of average pedestrian demand per appropriate gap, amount of student enrollment at the school, location of school property (i.e., abutting the right-of-way of the street or highway or
visible from street or highway), and presence of sidewalks.
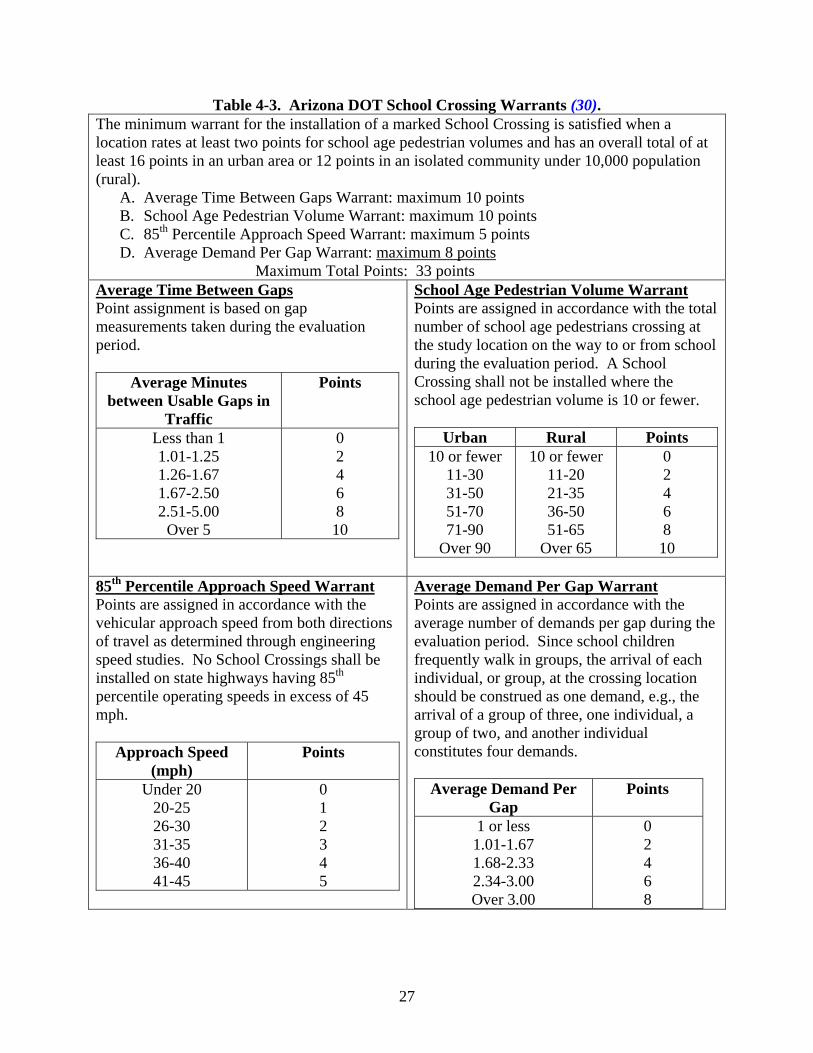
27
Table 4-3. Arizona DOT School Crossing Warrants (30). The minimum warrant for the installation of a marked School Crossing is satisfied when a location rates at least two points for school age pedestrian volumes and has an overall total of at least 16 points in an urban area or 12 points in an isolated community under 10,000 population (rural).
A. Average Time Between Gaps Warrant: maximum 10 points B. School Age Pedestrian Volume Warrant: maximum 10 points C. 85th Percentile Approach Speed Warrant: maximum 5 points D. Average Demand Per Gap Warrant: maximum 8 points Maximum Total Points: 33 points
Average Time Between Gaps Point assignment is based on gap measurements taken during the evaluation period.
Average Minutes between Usable Gaps in
Traffic
Points
Less than 1 1.01-1.25 1.26-1.67 1.67-2.50 2.51-5.00
Over 5
0 2 4 6 8 10
School Age Pedestrian Volume Warrant Points are assigned in accordance with the total number of school age pedestrians crossing at the study location on the way to or from school during the evaluation period. A School Crossing shall not be installed where the school age pedestrian volume is 10 or fewer.
Urban Rural Points 10 or fewer
11-30 31-50 51-70 71-90
Over 90
10 or fewer 11-20 21-35 36-50 51-65
Over 65
0 2 4 6 8 10
85th Percentile Approach Speed Warrant Points are assigned in accordance with the vehicular approach speed from both directions of travel as determined through engineering speed studies. No School Crossings shall be installed on state highways having 85th percentile operating speeds in excess of 45 mph.
Approach Speed (mph)
Points
Under 20 20-25 26-30 31-35 36-40 41-45
0 1 2 3 4 5
Average Demand Per Gap Warrant Points are assigned in accordance with the average number of demands per gap during the evaluation period. Since school children frequently walk in groups, the arrival of each individual, or group, at the crossing location should be construed as one demand, e.g., the arrival of a group of three, one individual, a group of two, and another individual constitutes four demands.
Average Demand Per Gap
Points
1 or less 1.01-1.67 1.68-2.33 2.34-3.00 Over 3.00
0 2 4 6 8
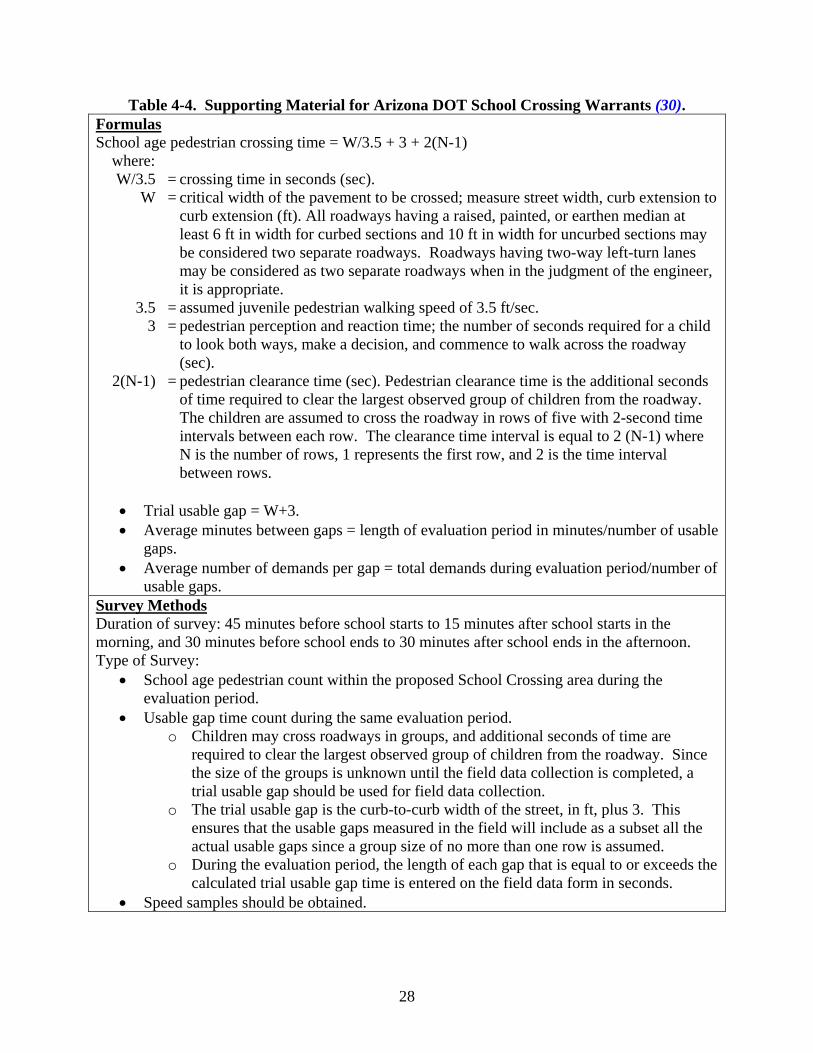
28
Table 4-4. Supporting Material for Arizona DOT School Crossing Warrants (30). Formulas School age pedestrian crossing time = W/3.5 + 3 + 2(N-1) where: W/3.5 = crossing time in seconds (sec). W = critical width of the pavement to be crossed; measure street width, curb extension to
curb extension (ft). All roadways having a raised, painted, or earthen median at least 6 ft in width for curbed sections and 10 ft in width for uncurbed sections may be considered two separate roadways. Roadways having two-way left-turn lanes may be considered as two separate roadways when in the judgment of the engineer, it is appropriate.
3.5 = assumed juvenile pedestrian walking speed of 3.5 ft/sec. 3 = pedestrian perception and reaction time; the number of seconds required for a child
to look both ways, make a decision, and commence to walk across the roadway (sec).
2(N-1) = pedestrian clearance time (sec). Pedestrian clearance time is the additional seconds of time required to clear the largest observed group of children from the roadway. The children are assumed to cross the roadway in rows of five with 2-second time intervals between each row. The clearance time interval is equal to 2 (N-1) where N is the number of rows, 1 represents the first row, and 2 is the time interval between rows.
• Trial usable gap = W+3. • Average minutes between gaps = length of evaluation period in minutes/number of usable
gaps. • Average number of demands per gap = total demands during evaluation period/number of
usable gaps. Survey Methods Duration of survey: 45 minutes before school starts to 15 minutes after school starts in the morning, and 30 minutes before school ends to 30 minutes after school ends in the afternoon. Type of Survey:
• School age pedestrian count within the proposed School Crossing area during the evaluation period.
• Usable gap time count during the same evaluation period. o Children may cross roadways in groups, and additional seconds of time are
required to clear the largest observed group of children from the roadway. Since the size of the groups is unknown until the field data collection is completed, a trial usable gap should be used for field data collection.
o The trial usable gap is the curb-to-curb width of the street, in ft, plus 3. This ensures that the usable gaps measured in the field will include as a subset all the actual usable gaps since a group size of no more than one row is assumed.
o During the evaluation period, the length of each gap that is equal to or exceeds the calculated trial usable gap time is entered on the field data form in seconds.
• Speed samples should be obtained.

29
OTHER TREATMENTS A few of the state documents discuss potential treatments for schools other than the common treatments, such as school speed limits or school crossings.
Missouri (42) has a midblock school crossing signal warrant. The less-than-40-ft pavement width requirements include 250 ped/hr for 2 hours along with 800 veh/hr for same 2 hours.
Missouri (42) also has warrants for school signals at driveways that are based on MUTCD Warrant 1, Condition A or B. The mainline volume must meet or exceed MUTCD values, while there is no side street volume requirements for elementary and secondary schools.
Illinois’ supplement (23) has a “School Entrance Speed Limit Signs.” The school entrance speed zone should only be established based on engineering judgment where crash records involving vehicles entering or leaving the school entrance during normal school hours indicate a need for reduction in speed, or where all the following conditions are met:
o The students are transported to and from school by bus and/or private vehicles. o No provisions are made for students to walk to and from school. o There are no left or right turn lanes on the highway at the entrance. o The entrance is not controlled by traffic signals.
HOW ABOUT ONLY A SIGN WITH NO SPEED CHANGE? A question that has been asked is, “Can a School Ahead sign be used and not include a reduced speed zone?” The question is frequently associated with schools where students do not walk to the school or where almost all students arrive either in a school bus or by personal automobile. Utah’s manual (28) has an “Abutting School Zone” as “…an area of the roadway adjacent to school buildings or grounds, including the approach to such areas, with no associated school crosswalk.” The use of the zone is decided based on engineering judgment. Signing shall include School Advance Warning (S1-1) sign without supplemented AHEAD plaque. The January 2, 2008, proposed change to MUTCD (41) includes a new section on a school area or zone that uses the School Sign (S1-1). The school zone “will advise road users that they are approaching a school that is adjacent to a highway, where additional care is needed, even though no school crossing is involved and the speed limit remains unchanged.” For some jurisdictions the designated school zone has unique legal standing in that fines may be increased. STUDENT NUMBERS Several state documents note that pedestrian activity is needed to justify the use of various treatments. Most just include the general guidance of children crossing the roadway or children being present. A few of the documents discuss specific numbers, including the following:
Arizona’s guideline (30) assigns 0 points for 10 or fewer school age pedestrians. It also states that “a School Crossing shall not be installed where the school age pedestrian volume is 10 or fewer.”
30
Utah’s manual (28) includes the following warrants for a school crosswalk zone: o > 10 students in morning hour or afternoon hour o 500 ADT or 50 veh/hr
31
CHAPTER 5
PHONE SURVEY OF LAW ENFORCEMENT OFFICERS CONCERNING VEHICLE SPEEDS IN SCHOOL ZONES
INTRODUCTION As part of this research project, researchers conducted a telephone survey of law enforcement officers to assess vehicle compliance with speed reductions in school zones. This chapter is a summary of the activities and results related to that survey. STUDY DESIGN The phone survey consisted of nine questions on speed reduction compliance in school zones. A copy of the survey is located in Appendix A. The topics of the questions were centered on the following:
• Questions 1, 2, and 3—compliance rate and factors that affected the compliance rate with drivers;
• Questions 4, 5, and 6—traffic control devices used to indicate the end of a speed zone in a school area;
• Question 7—where to install school speed zones; • Question 8—specific programs used for school speed zone areas; and • Question 9—overall suggestions to improve school speed compliance rate.
Law enforcement officers interviewed included individuals who worked in a traffic patrol section during peak school hours. It was the goal of the researchers to survey individuals who worked in the field and were familiar with the motorists driving behavior in school zones. The individuals surveyed told that the questions should be answered based on their personal experience and their observations of the driving behavior of motorists in their school areas. They were told that the survey would be confidential and that their names would not be used in any reports. Phone Contacts A total of 12 cities were contacted to participate in the survey. The cities were randomly selected based on their geographic location and types of traffic control devices they were currently using in their school zones. Table 5-1 shows the location and agencies that participated in the survey. “Yes” is used to indicate those agencies that participated in the survey for each of the cities. In addition, if an agency did not participate, there is a brief explanation as to why they did not participate. Amarillo was the only city where both the independent school district (ISD) and city police department participated, giving a total of 13 agencies interviewed. In total, there were six ISD police agencies and seven city police agencies surveyed. In Bryan, Corpus Christi, Dallas, and Galveston, the ISD law enforcement officers were primarily used for the control of inside school activities, while Laredo and Magnolia had no patrol officers employed by their ISDs. The researchers made an effort to contact both agencies at each study location; however,
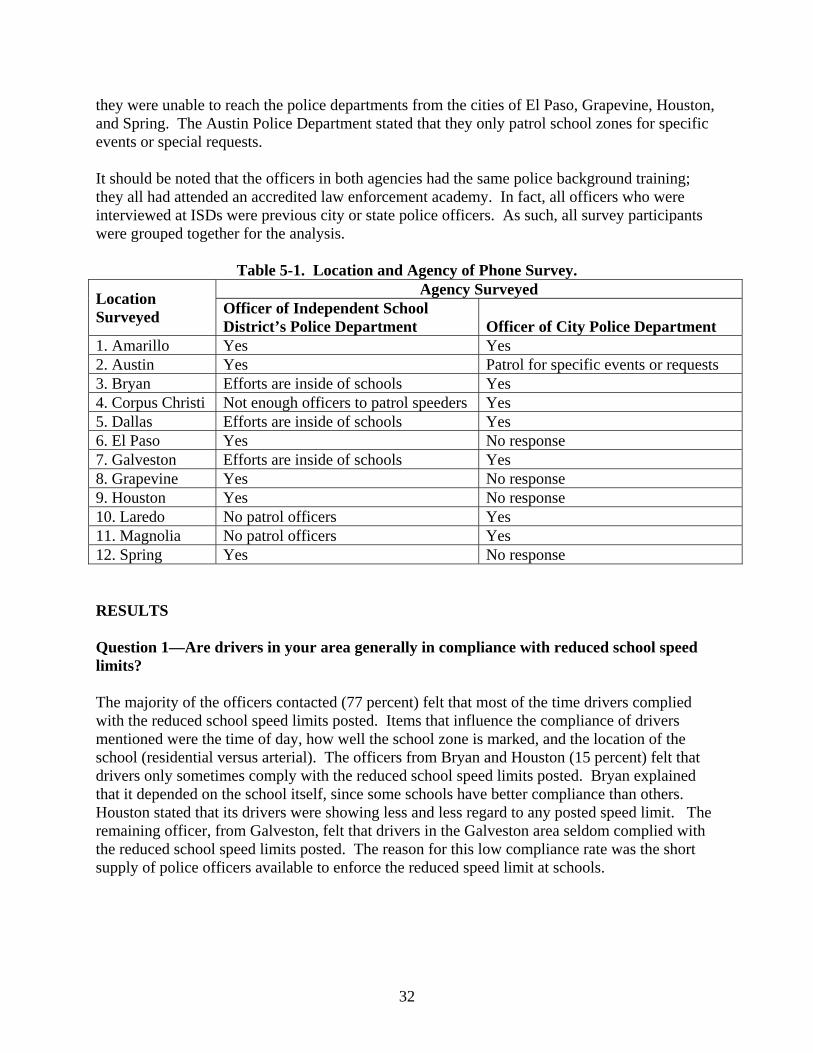
32
they were unable to reach the police departments from the cities of El Paso, Grapevine, Houston, and Spring. The Austin Police Department stated that they only patrol school zones for specific events or special requests. It should be noted that the officers in both agencies had the same police background training; they all had attended an accredited law enforcement academy. In fact, all officers who were interviewed at ISDs were previous city or state police officers. As such, all survey participants were grouped together for the analysis.
Table 5-1. Location and Agency of Phone Survey.
Location Surveyed
Agency Surveyed Officer of Independent School District’s Police Department Officer of City Police Department
1. Amarillo Yes Yes 2. Austin Yes Patrol for specific events or requests 3. Bryan Efforts are inside of schools Yes 4. Corpus Christi Not enough officers to patrol speeders Yes 5. Dallas Efforts are inside of schools Yes 6. El Paso Yes No response 7. Galveston Efforts are inside of schools Yes 8. Grapevine Yes No response 9. Houston Yes No response 10. Laredo No patrol officers Yes 11. Magnolia No patrol officers Yes 12. Spring Yes No response RESULTS Question 1—Are drivers in your area generally in compliance with reduced school speed limits? The majority of the officers contacted (77 percent) felt that most of the time drivers complied with the reduced school speed limits posted. Items that influence the compliance of drivers mentioned were the time of day, how well the school zone is marked, and the location of the school (residential versus arterial). The officers from Bryan and Houston (15 percent) felt that drivers only sometimes comply with the reduced school speed limits posted. Bryan explained that it depended on the school itself, since some schools have better compliance than others. Houston stated that its drivers were showing less and less regard to any posted speed limit. The remaining officer, from Galveston, felt that drivers in the Galveston area seldom complied with the reduced school speed limits posted. The reason for this low compliance rate was the short supply of police officers available to enforce the reduced speed limit at schools.
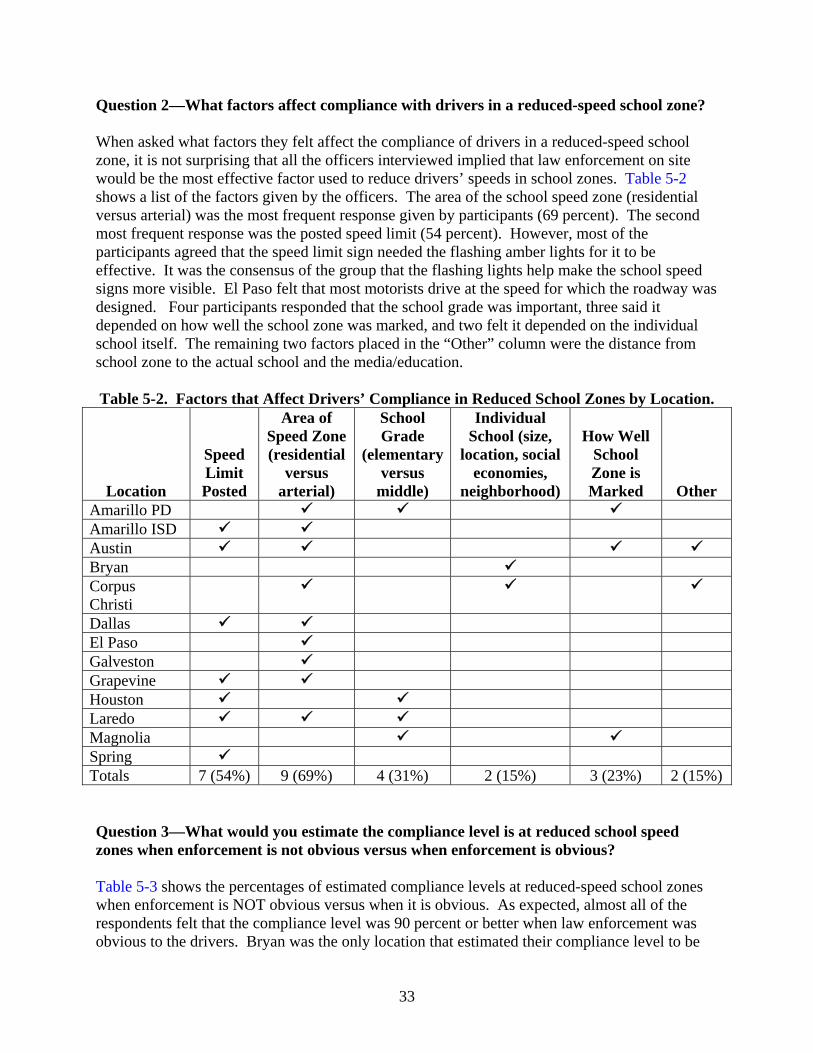
33
Question 2—What factors affect compliance with drivers in a reduced-speed school zone? When asked what factors they felt affect the compliance of drivers in a reduced-speed school zone, it is not surprising that all the officers interviewed implied that law enforcement on site would be the most effective factor used to reduce drivers’ speeds in school zones. Table 5-2 shows a list of the factors given by the officers. The area of the school speed zone (residential versus arterial) was the most frequent response given by participants (69 percent). The second most frequent response was the posted speed limit (54 percent). However, most of the participants agreed that the speed limit sign needed the flashing amber lights for it to be effective. It was the consensus of the group that the flashing lights help make the school speed signs more visible. El Paso felt that most motorists drive at the speed for which the roadway was designed. Four participants responded that the school grade was important, three said it depended on how well the school zone was marked, and two felt it depended on the individual school itself. The remaining two factors placed in the “Other” column were the distance from school zone to the actual school and the media/education. Table 5-2. Factors that Affect Drivers’ Compliance in Reduced School Zones by Location.
Location
Speed Limit Posted
Area of Speed Zone (residential
versus arterial)
School Grade
(elementary versus
middle)
Individual School (size,
location, social economies,
neighborhood)
How Well School Zone is Marked Other
Amarillo PD Amarillo ISD Austin Bryan Corpus Christi
Dallas El Paso Galveston Grapevine Houston Laredo Magnolia Spring Totals 7 (54%) 9 (69%) 4 (31%) 2 (15%) 3 (23%) 2 (15%) Question 3—What would you estimate the compliance level is at reduced school speed zones when enforcement is not obvious versus when enforcement is obvious? Table 5-3 shows the percentages of estimated compliance levels at reduced-speed school zones when enforcement is NOT obvious versus when it is obvious. As expected, almost all of the respondents felt that the compliance level was 90 percent or better when law enforcement was obvious to the drivers. Bryan was the only location that estimated their compliance level to be
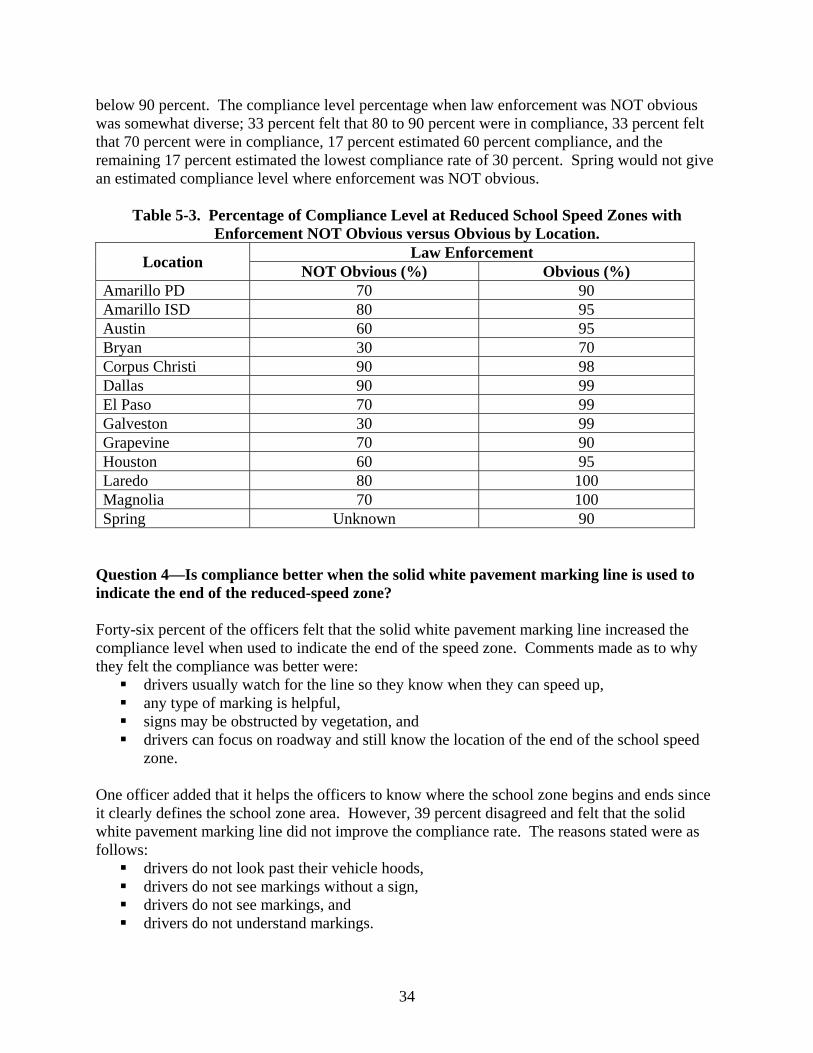
34
below 90 percent. The compliance level percentage when law enforcement was NOT obvious was somewhat diverse; 33 percent felt that 80 to 90 percent were in compliance, 33 percent felt that 70 percent were in compliance, 17 percent estimated 60 percent compliance, and the remaining 17 percent estimated the lowest compliance rate of 30 percent. Spring would not give an estimated compliance level where enforcement was NOT obvious.
Table 5-3. Percentage of Compliance Level at Reduced School Speed Zones with Enforcement NOT Obvious versus Obvious by Location.
Location Law Enforcement NOT Obvious (%) Obvious (%)
Amarillo PD 70 90 Amarillo ISD 80 95 Austin 60 95 Bryan 30 70 Corpus Christi 90 98 Dallas 90 99 El Paso 70 99 Galveston 30 99 Grapevine 70 90 Houston 60 95 Laredo 80 100 Magnolia 70 100 Spring Unknown 90
Question 4—Is compliance better when the solid white pavement marking line is used to indicate the end of the reduced-speed zone? Forty-six percent of the officers felt that the solid white pavement marking line increased the compliance level when used to indicate the end of the speed zone. Comments made as to why they felt the compliance was better were:
drivers usually watch for the line so they know when they can speed up, any type of marking is helpful, signs may be obstructed by vegetation, and drivers can focus on roadway and still know the location of the end of the school speed
zone. One officer added that it helps the officers to know where the school zone begins and ends since it clearly defines the school zone area. However, 39 percent disagreed and felt that the solid white pavement marking line did not improve the compliance rate. The reasons stated were as follows:
drivers do not look past their vehicle hoods, drivers do not see markings without a sign, drivers do not see markings, and drivers do not understand markings.

35
The remaining 15 percent did not respond. Houston explained they were not sure since they had never noticed them, and Magnolia replied that they did not know since they do not have any in their city limits. Question 5—Is compliance better when the End of School Zone sign is used to indicate the end of the speed zone? Eight-five percent of the officers agreed that the End of School Zone sign increased compliance when used to indicate the end of the speed zone. Two of the reasons noted were drivers watch for the sign so they know when they can speed up, and the sign defines the end of the school zone. The remaining 15 percent did not feel that the signs would increase the compliance rate when used to indicate the end of the speed zone. The Bryan officer felt that motorists do not pay attention to signs unless they have flashing lights, while the officer from Galveston felt that the white solid line was easier to see. Question 6—To indicate the end of a school speed zone, do you prefer an End of School Zone sign, a posted speed limit sign, a posted speed limit sign with an End of School Zone plaque on top, a white pavement marking line, or some combination? Why? Table 5-4 shows the traffic control device preference by each officer. The shaded area shows that nine (69 percent) of the officers interviewed preferred some type of combination of traffic control devices to indicate the end of a school speed zone. Five officers selected the posted speed limit sign with an End of School Zone plaque, as well as a white pavement marking line. Corpus Christi preferred either the End of School Zone sign or the posted speed limit sign with the white pavement marking line. Most officers (77 percent) preferred the white pavement marking with some other traffic control device, while Galveston preferred the white pavement marking by itself. The preference of the white pavement marking was based on the assumption that drivers do not read the signs; instead, they focus on the road and will see the white pavement markings. However, one officer felt that the white marking should not be used by itself and that a sign was necessary to explain the meaning of the white marking. Several officers agreed that the pavement marking line helped law enforcement, as well as the drivers, to know where the school zone ends. Others stated it helped in court where drivers would state they were watching for children in the road and didn’t see the sign. If they were watching in the road, they should have seen the white markings.

36
Table 5-4. Traffic Control Device Preference to Indicate the End of a School Speed Zone by Location.
Location
Traffic Control Device Preference
End of School Zone Sign
Posted Speed Limit Sign
Posted Speed Limit w/ End School Plaque
White Pavement Marking Line
Amarillo PD Amarillo ISD Austin Bryan Corpus Christi Dallas El Paso Galveston Grapevine Houston Laredo Magnolia Spring Totals 2 (15%) 3 (23%) 8 (62%) 10 (77%) Gray highlight = officers who preferred a combination of traffic control devices.
The second most frequent device selected was the posted speed limit with End of School Zone plaque; 62 percent selected this as one of their preferred traffic control devices with several commenting that it was helpful to have the speed limit. Question 7—Where do you think school speed zones should be installed? Table 5-5 shows that 85 percent felt that school speed zones should be located at every school; 62 percent indicated that they should be at every related crosswalk adjacent to the school. However, there were 62 percent who felt that the decision on where and how much to reduce the speed should be based on each individual school’s characteristics. These characteristics included sight distance, volume of pedestrians, bike riders and traffic, direction of pedestrians, residential versus thoroughfare, times of campus, and school bus usage. The other two categories included uncontrolled intersections near schools, at 31 percent, and at every crosswalk one block away from the school, with 15 percent.
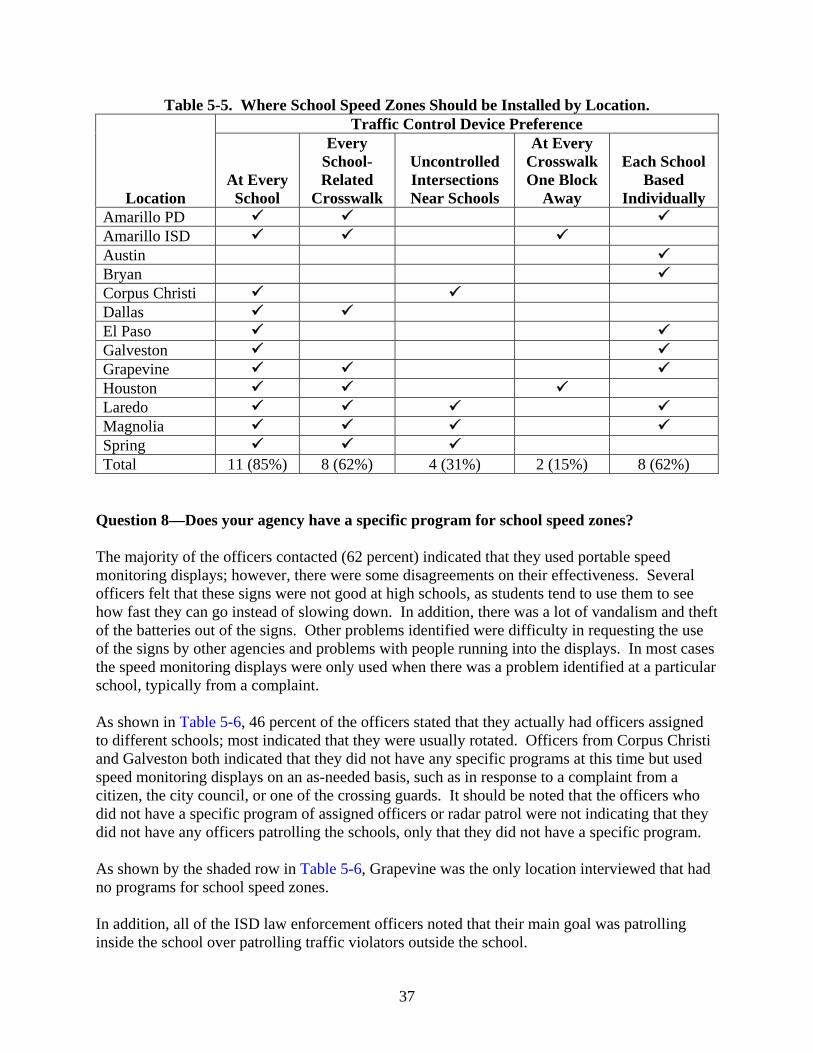
37
Table 5-5. Where School Speed Zones Should be Installed by Location.
Location
Traffic Control Device Preference
At Every School
Every School-Related
Crosswalk
Uncontrolled Intersections Near Schools
At Every Crosswalk One Block
Away
Each School Based
Individually Amarillo PD Amarillo ISD Austin Bryan Corpus Christi Dallas El Paso Galveston Grapevine Houston Laredo Magnolia Spring Total 11 (85%) 8 (62%) 4 (31%) 2 (15%) 8 (62%)
Question 8—Does your agency have a specific program for school speed zones? The majority of the officers contacted (62 percent) indicated that they used portable speed monitoring displays; however, there were some disagreements on their effectiveness. Several officers felt that these signs were not good at high schools, as students tend to use them to see how fast they can go instead of slowing down. In addition, there was a lot of vandalism and theft of the batteries out of the signs. Other problems identified were difficulty in requesting the use of the signs by other agencies and problems with people running into the displays. In most cases the speed monitoring displays were only used when there was a problem identified at a particular school, typically from a complaint. As shown in Table 5-6, 46 percent of the officers stated that they actually had officers assigned to different schools; most indicated that they were usually rotated. Officers from Corpus Christi and Galveston both indicated that they did not have any specific programs at this time but used speed monitoring displays on an as-needed basis, such as in response to a complaint from a citizen, the city council, or one of the crossing guards. It should be noted that the officers who did not have a specific program of assigned officers or radar patrol were not indicating that they did not have any officers patrolling the schools, only that they did not have a specific program. As shown by the shaded row in Table 5-6, Grapevine was the only location interviewed that had no programs for school speed zones. In addition, all of the ISD law enforcement officers noted that their main goal was patrolling inside the school over patrolling traffic violators outside the school.
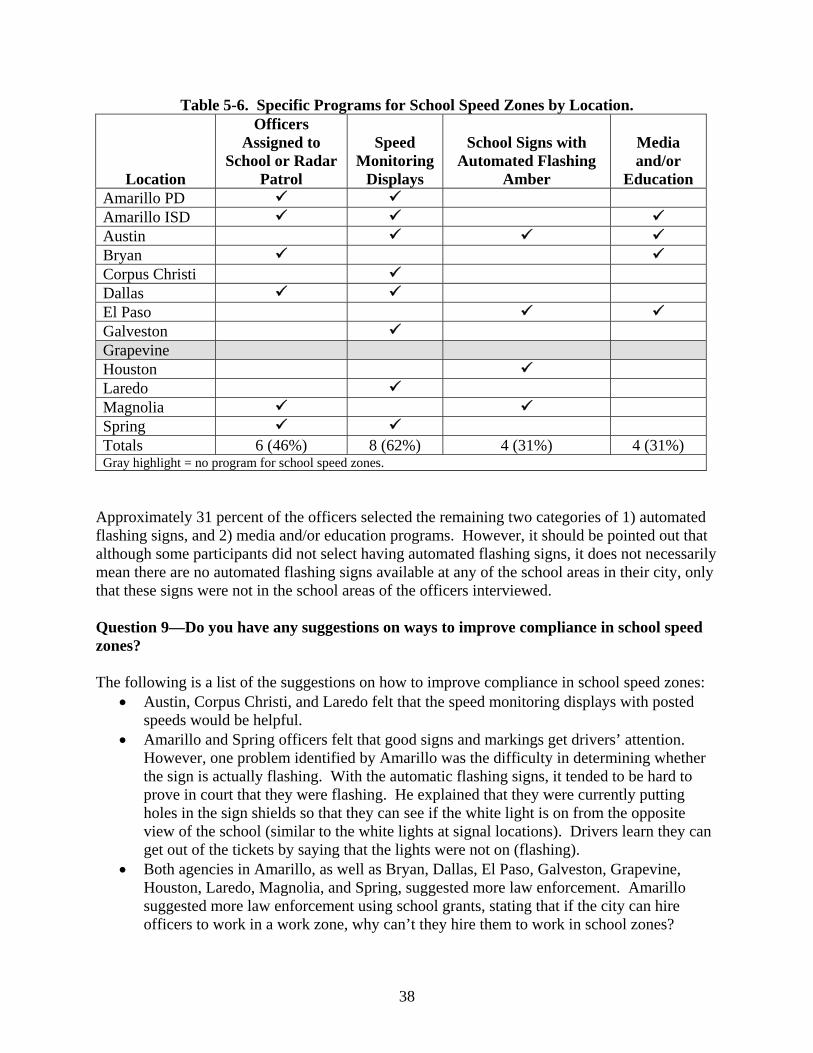
38
Table 5-6. Specific Programs for School Speed Zones by Location.
Location
Officers Assigned to
School or Radar Patrol
Speed Monitoring
Displays
School Signs with Automated Flashing
Amber
Media and/or
Education Amarillo PD Amarillo ISD Austin Bryan Corpus Christi Dallas El Paso Galveston Grapevine Houston Laredo Magnolia Spring Totals 6 (46%) 8 (62%) 4 (31%) 4 (31%) Gray highlight = no program for school speed zones.
Approximately 31 percent of the officers selected the remaining two categories of 1) automated flashing signs, and 2) media and/or education programs. However, it should be pointed out that although some participants did not select having automated flashing signs, it does not necessarily mean there are no automated flashing signs available at any of the school areas in their city, only that these signs were not in the school areas of the officers interviewed. Question 9—Do you have any suggestions on ways to improve compliance in school speed zones? The following is a list of the suggestions on how to improve compliance in school speed zones:
• Austin, Corpus Christi, and Laredo felt that the speed monitoring displays with posted speeds would be helpful.
• Amarillo and Spring officers felt that good signs and markings get drivers’ attention. However, one problem identified by Amarillo was the difficulty in determining whether the sign is actually flashing. With the automatic flashing signs, it tended to be hard to prove in court that they were flashing. He explained that they were currently putting holes in the sign shields so that they can see if the white light is on from the opposite view of the school (similar to the white lights at signal locations). Drivers learn they can get out of the tickets by saying that the lights were not on (flashing).
• Both agencies in Amarillo, as well as Bryan, Dallas, El Paso, Galveston, Grapevine, Houston, Laredo, Magnolia, and Spring, suggested more law enforcement. Amarillo suggested more law enforcement using school grants, stating that if the city can hire officers to work in a work zone, why can’t they hire them to work in school zones?

39
• Galveston felt the school time allocated was too long, since it only takes about 30 minutes in the morning and one and a half hours in the afternoon for children to arrive and depart from school. Lengthy speed reduction times result in the reduced school speed limit still being in effect when no students are in sight.
• Amarillo and Bryan suggested more public service announcements, while Dallas suggested using something like the “Click it or Ticket” campaign.
• In order to prepare motorists to slow down, Dallas suggested using rumble strips just before the school zone begins (similar to what is being used at toll booths).
• El Paso suggested painting the curbs in school zones, since signs are hard to see at some locations. El Paso also felt that it would be helpful if everything was uniform, such as school hours, speed limit, etc.
• Galveston recommended the use of portable photo radar, explaining that if drivers knew they might get a ticket, they would slow down.
• Houston suggested adding “School Zone 20 MPH” to the solid white pavement marking line at the beginning of the school zone. Magnolia suggested painting “School Zone” elongated on the pavement at the entrance to the school zone.
• Austin and Laredo suggested the use of solar radar panels on school flashing signs. They would last longer and have less maintenance.

40

41
CHAPTER 6
FIELD STUDIES AT SCHOOL CAMPUSES In order to gain a better understanding of traffic characteristics around schools, the research team conducted a number of observational studies at school facilities throughout the state. Studies were conducted at a total of 24 school sites. The schools were either classified as elementary, middle, or high schools, or were given the designation of “ALL” if the school included kindergarten through 12th grade. Elementary and middle schools were emphasized in the selection of study sites. Elementary schools typically ranged from pre-kindergarten or kindergarten to 5th grade. The middle schools included students from 6th to 8th grades. Characteristics of the schools are listed in Table 6-1. Characteristics of the roadway are provided in Table 6-2. Table 6-3 has the characteristics of the school zones. Researchers contacted each school district and/or visited each school prior to collecting data. These initial contacts were made to inform school officials of our intentions and purpose of data collection, obtain any necessary permissions, and learn from officials what traffic issues, if any, they have experienced at those schools. In consideration of privacy concerns, the names of the schools were removed from the final version of this report.
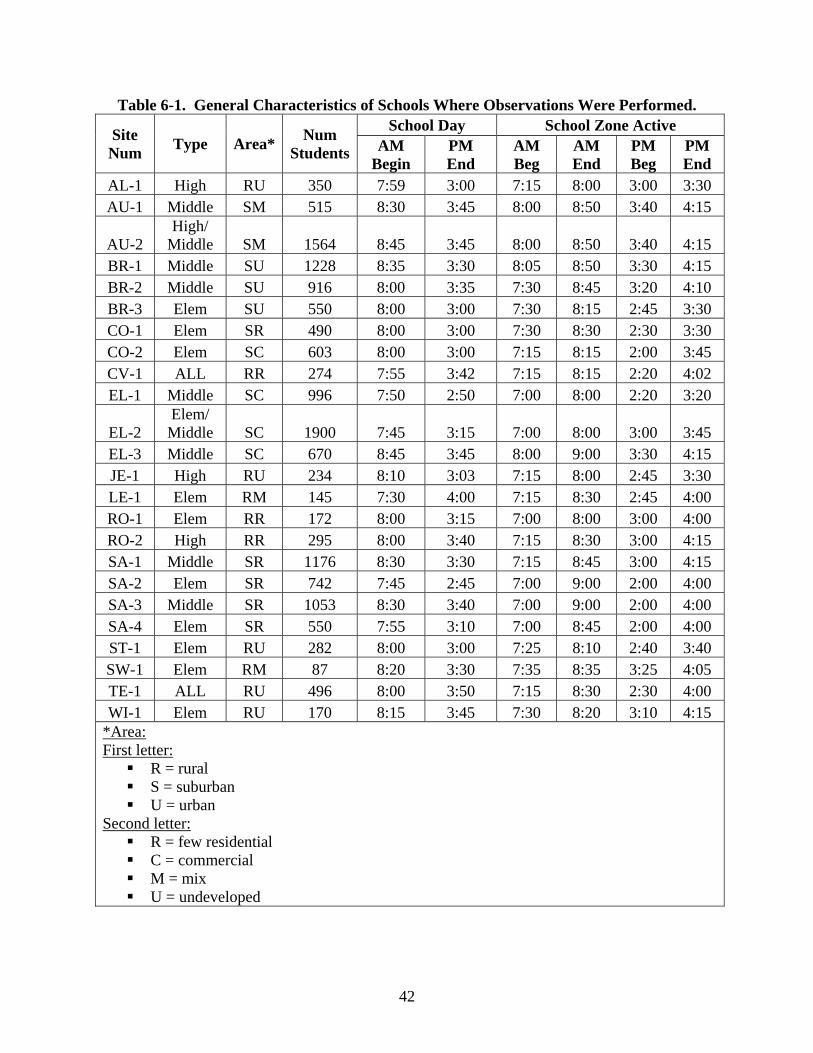
42
Table 6-1. General Characteristics of Schools Where Observations Were Performed.
Site Num Type Area* Num
Students
School Day School Zone Active AM
Begin PM End
AM Beg
AM End
PM Beg
PM End
AL-1 High RU 350 7:59 3:00 7:15 8:00 3:00 3:30 AU-1 Middle SM 515 8:30 3:45 8:00 8:50 3:40 4:15
AU-2 High/
Middle SM 1564 8:45 3:45 8:00 8:50 3:40 4:15 BR-1 Middle SU 1228 8:35 3:30 8:05 8:50 3:30 4:15 BR-2 Middle SU 916 8:00 3:35 7:30 8:45 3:20 4:10 BR-3 Elem SU 550 8:00 3:00 7:30 8:15 2:45 3:30 CO-1 Elem SR 490 8:00 3:00 7:30 8:30 2:30 3:30 CO-2 Elem SC 603 8:00 3:00 7:15 8:15 2:00 3:45 CV-1 ALL RR 274 7:55 3:42 7:15 8:15 2:20 4:02 EL-1 Middle SC 996 7:50 2:50 7:00 8:00 2:20 3:20
EL-2 Elem/
Middle SC 1900 7:45 3:15 7:00 8:00 3:00 3:45 EL-3 Middle SC 670 8:45 3:45 8:00 9:00 3:30 4:15 JE-1 High RU 234 8:10 3:03 7:15 8:00 2:45 3:30 LE-1 Elem RM 145 7:30 4:00 7:15 8:30 2:45 4:00 RO-1 Elem RR 172 8:00 3:15 7:00 8:00 3:00 4:00 RO-2 High RR 295 8:00 3:40 7:15 8:30 3:00 4:15 SA-1 Middle SR 1176 8:30 3:30 7:15 8:45 3:00 4:15 SA-2 Elem SR 742 7:45 2:45 7:00 9:00 2:00 4:00 SA-3 Middle SR 1053 8:30 3:40 7:00 9:00 2:00 4:00 SA-4 Elem SR 550 7:55 3:10 7:00 8:45 2:00 4:00 ST-1 Elem RU 282 8:00 3:00 7:25 8:10 2:40 3:40 SW-1 Elem RM 87 8:20 3:30 7:35 8:35 3:25 4:05 TE-1 ALL RU 496 8:00 3:50 7:15 8:30 2:30 4:00 WI-1 Elem RU 170 8:15 3:45 7:30 8:20 3:10 4:15
*Area: First letter:
R = rural S = suburban U = urban
Second letter: R = few residential C = commercial M = mix U = undeveloped
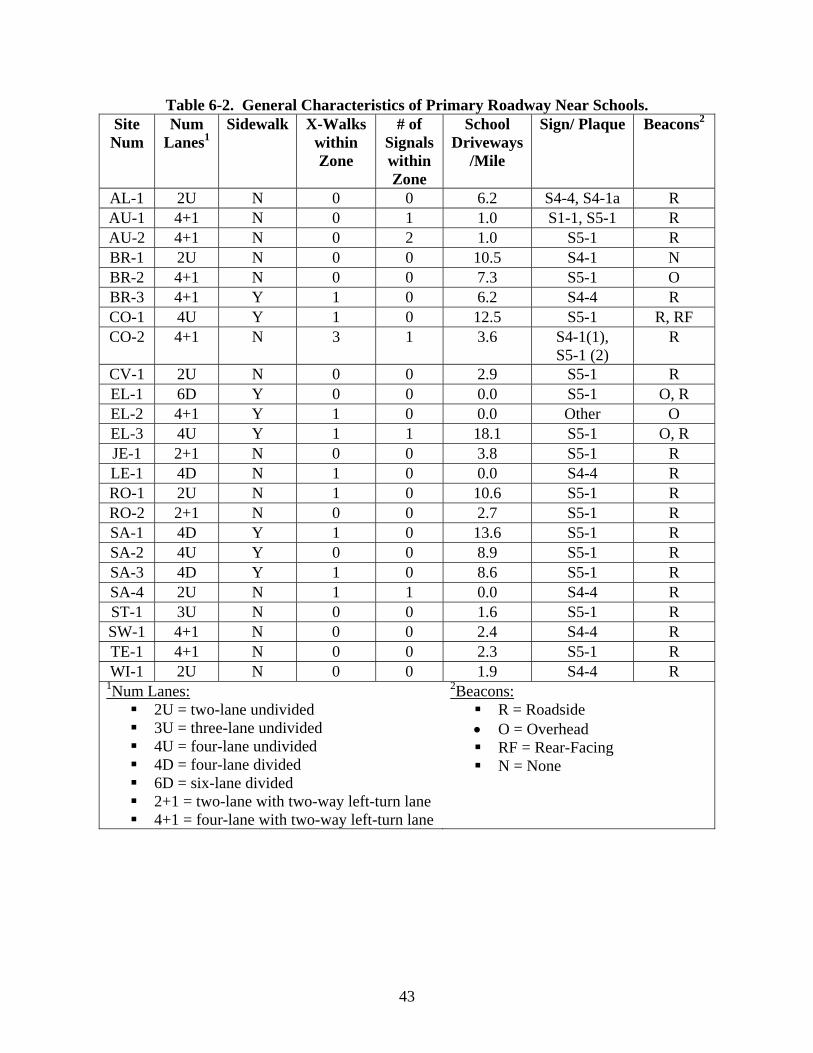
43
Table 6-2. General Characteristics of Primary Roadway Near Schools. Site Num
Num Lanes1
Sidewalk X-Walks within Zone
# of Signals within Zone
School Driveways
/Mile
Sign/ Plaque Beacons2
AL-1 2U N 0 0 6.2 S4-4, S4-1a R AU-1 4+1 N 0 1 1.0 S1-1, S5-1 R AU-2 4+1 N 0 2 1.0 S5-1 R BR-1 2U N 0 0 10.5 S4-1 N BR-2 4+1 N 0 0 7.3 S5-1 O BR-3 4+1 Y 1 0 6.2 S4-4 R CO-1 4U Y 1 0 12.5 S5-1 R, RF CO-2 4+1 N 3 1 3.6 S4-1(1),
S5-1 (2) R
CV-1 2U N 0 0 2.9 S5-1 R EL-1 6D Y 0 0 0.0 S5-1 O, R EL-2 4+1 Y 1 0 0.0 Other O EL-3 4U Y 1 1 18.1 S5-1 O, R JE-1 2+1 N 0 0 3.8 S5-1 R LE-1 4D N 1 0 0.0 S4-4 R RO-1 2U N 1 0 10.6 S5-1 R RO-2 2+1 N 0 0 2.7 S5-1 R SA-1 4D Y 1 0 13.6 S5-1 R SA-2 4U Y 0 0 8.9 S5-1 R SA-3 4D Y 1 0 8.6 S5-1 R SA-4 2U N 1 1 0.0 S4-4 R ST-1 3U N 0 0 1.6 S5-1 R SW-1 4+1 N 0 0 2.4 S4-4 R TE-1 4+1 N 0 0 2.3 S5-1 R WI-1 2U N 0 0 1.9 S4-4 R
1Num Lanes: 2U = two-lane undivided 3U = three-lane undivided 4U = four-lane undivided 4D = four-lane divided 6D = six-lane divided 2+1 = two-lane with two-way left-turn lane 4+1 = four-lane with two-way left-turn lane
2Beacons: R = Roadside • O = Overhead RF = Rear-Facing N = None
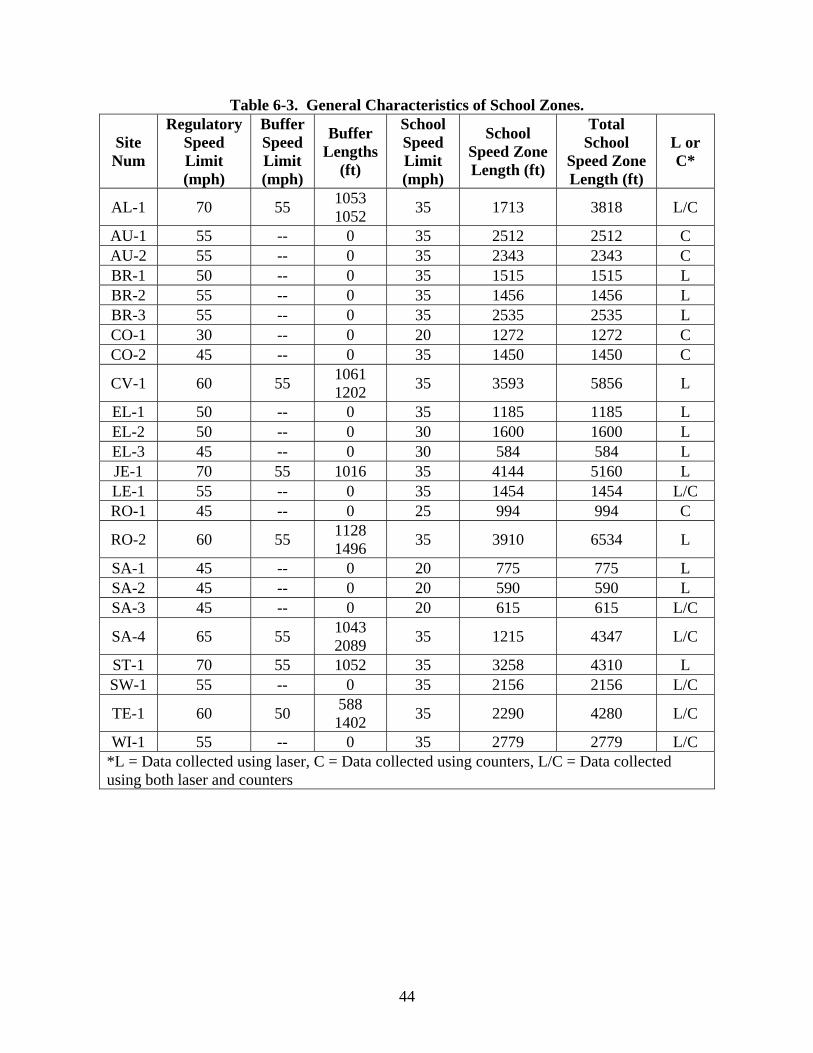
44
Table 6-3. General Characteristics of School Zones.
Site Num
Regulatory Speed Limit (mph)
Buffer Speed Limit (mph)
Buffer Lengths
(ft)
School Speed Limit (mph)
School Speed Zone Length (ft)
Total School
Speed Zone Length (ft)
L or C*
AL-1 70 55 1053 1052 35 1713 3818 L/C
AU-1 55 -- 0 35 2512 2512 C AU-2 55 -- 0 35 2343 2343 C BR-1 50 -- 0 35 1515 1515 L BR-2 55 -- 0 35 1456 1456 L BR-3 55 -- 0 35 2535 2535 L CO-1 30 -- 0 20 1272 1272 C CO-2 45 -- 0 35 1450 1450 C
CV-1 60 55 1061 1202 35 3593 5856 L
EL-1 50 -- 0 35 1185 1185 L EL-2 50 -- 0 30 1600 1600 L EL-3 45 -- 0 30 584 584 L JE-1 70 55 1016 35 4144 5160 L LE-1 55 -- 0 35 1454 1454 L/C RO-1 45 -- 0 25 994 994 C
RO-2 60 55 1128 1496 35 3910 6534 L
SA-1 45 -- 0 20 775 775 L SA-2 45 -- 0 20 590 590 L SA-3 45 -- 0 20 615 615 L/C
SA-4 65 55 1043 2089 35 1215 4347 L/C
ST-1 70 55 1052 35 3258 4310 L SW-1 55 -- 0 35 2156 2156 L/C
TE-1 60 50 588 1402 35 2290 4280 L/C
WI-1 55 -- 0 35 2779 2779 L/C *L = Data collected using laser, C = Data collected using counters, L/C = Data collected using both laser and counters
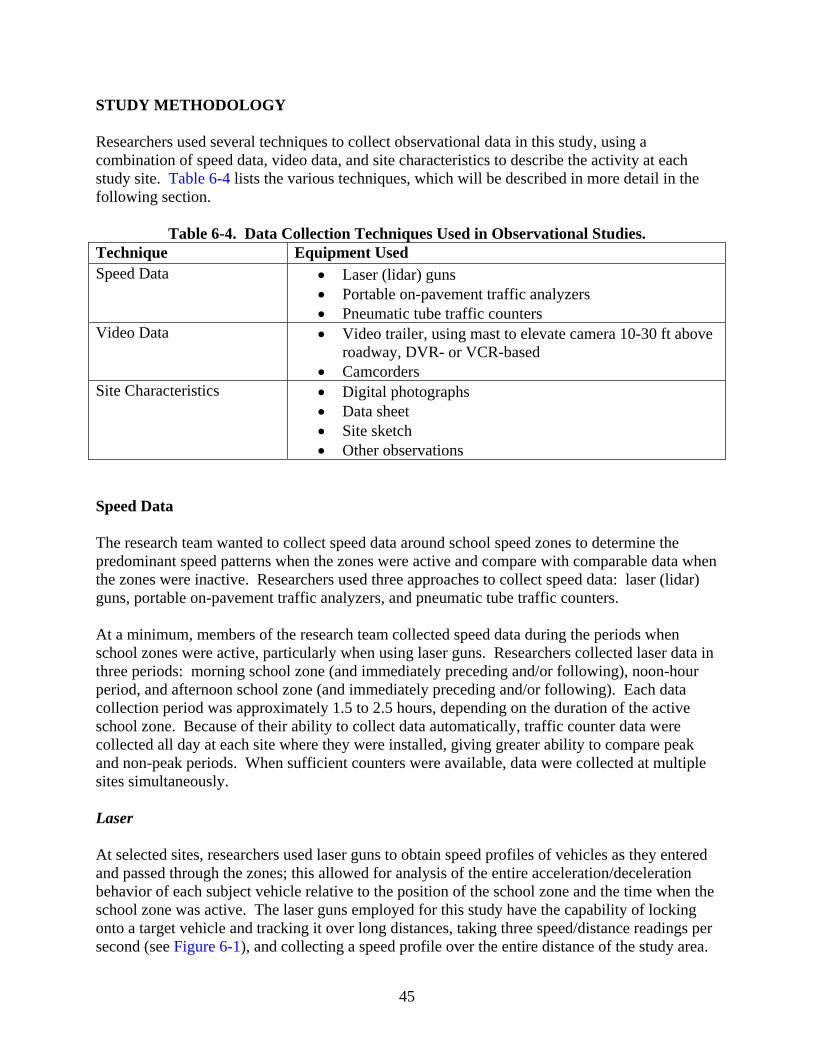
45
STUDY METHODOLOGY Researchers used several techniques to collect observational data in this study, using a combination of speed data, video data, and site characteristics to describe the activity at each study site. Table 6-4 lists the various techniques, which will be described in more detail in the following section.
Table 6-4. Data Collection Techniques Used in Observational Studies. Technique Equipment Used Speed Data • Laser (lidar) guns
• Portable on-pavement traffic analyzers • Pneumatic tube traffic counters
Video Data • Video trailer, using mast to elevate camera 10-30 ft above roadway, DVR- or VCR-based
• Camcorders Site Characteristics • Digital photographs
• Data sheet • Site sketch • Other observations
Speed Data The research team wanted to collect speed data around school speed zones to determine the predominant speed patterns when the zones were active and compare with comparable data when the zones were inactive. Researchers used three approaches to collect speed data: laser (lidar) guns, portable on-pavement traffic analyzers, and pneumatic tube traffic counters. At a minimum, members of the research team collected speed data during the periods when school zones were active, particularly when using laser guns. Researchers collected laser data in three periods: morning school zone (and immediately preceding and/or following), noon-hour period, and afternoon school zone (and immediately preceding and/or following). Each data collection period was approximately 1.5 to 2.5 hours, depending on the duration of the active school zone. Because of their ability to collect data automatically, traffic counter data were collected all day at each site where they were installed, giving greater ability to compare peak and non-peak periods. When sufficient counters were available, data were collected at multiple sites simultaneously. Laser At selected sites, researchers used laser guns to obtain speed profiles of vehicles as they entered and passed through the zones; this allowed for analysis of the entire acceleration/deceleration behavior of each subject vehicle relative to the position of the school zone and the time when the school zone was active. The laser guns employed for this study have the capability of locking onto a target vehicle and tracking it over long distances, taking three speed/distance readings per second (see Figure 6-1), and collecting a speed profile over the entire distance of the study area.

46
The gun sends those readings through a data cable to a laptop computer, where each time-stamped reading is stored in a text file that is available for downloading into a spreadsheet for data reduction and analysis. The end result is a data file composed of speed/distance profiles for each individual target vehicle during the study period.
Figure 6-1. Speed/Distance Reading from Laser Gun. Researchers initially used laser guns in teams of two; one observer was positioned upstream of the school zone, and the second was near the midpoint of the school zone. This enabled the observers to cover the entire length of long school zones by dividing the coverage into two parts. The upstream observer selected a target vehicle and, via walkie-talkie or mobile phone, described the vehicle to the midpoint observer. The upstream observer then locked onto the target vehicle and tracked it as far as possible through the speed zone; the midpoint observer locked onto the same vehicle at the earliest point possible and also tracked the vehicle as far as possible. Subsequently, during data reduction, the two profiles were merged together to create one overall speed profile for the target vehicle for the entire length of the school zone. After using the team-coverage method at several study sites, researchers were able to use single observers at other sites with shorter school zones, thus improving the efficiency of data reduction efforts by eliminating the need to merge profiles of target vehicles. In order to collect the data, researchers identified locations near the selected schools with clear lines of sight to the school zone portion of the roadway. Generally, these locations were off the shoulder of the roadway, preferably behind trees or other roadside objects, to hide the observer from oncoming drivers’ field of view. Observers parked vehicles in these locations and collected speeds from inside the vehicle, using the vehicle’s power supply to operate the laser gun and laptop. Observers took several steps to minimize any effects of their presence on approaching drivers. First of all, observers used SUVs, minivans, and/or pickup trucks to minimize the possibility that drivers would mistake the observer for an enforcement officer. Second, observers parked as far

47
off of the roadway as possible while still maintaining a clear line of sight through the study area. Third, observers did not raise their laser guns into position until the target vehicle had passed, eliminating the possibility of the driver recognizing the use of an active speed-measuring device. The use of laser guns has several advantages over other speed collection methods. First, because it uses lidar technology instead of radar, it is not recognized by traditional detectors. The practice of not activating the gun until the target vehicle had passed further minimized the exposure of the active lidar. Second, the use of laser guns is safer for observers than automated traffic counters because it does not require the installation of hardware in the travel lane and eliminates that exposure to traffic. Third, laser guns allow for a continuous speed/distance profile that cannot be obtained with traffic counters; the profile illustrates the exact acceleration/deceleration behavior of each driver over time and distance. Portable On-Pavement Traffic Analyzer For some sites, laser guns were not practical because of line-of-sight issues or lack of appropriate observation locations. For these sites, one of two kinds of automated traffic data collectors was used: portable on-pavement traffic analyzers or pneumatic tube counters. The portable on-pavement traffic analyzers are designed to provide accurate count, speed, and vehicle classification data. The sensor is lightweight and has a rectangular shape measuring about 4.5 inches × 7.25 inches. It is self-contained in an aluminum housing (see Figure 6-2) that is constructed to withstand the impact of heavy vehicles and damage from most chemicals, such as oil or fuel. Placed over the sensor, the cover is installed on the pavement using a drill, and the device is typically placed in the middle of the traffic lane. The sensor determines vehicle count, speed, and classification data using Vehicle Magnetic Imaging technology. The data are exported to the computer through proprietary software, which allows the user to generate charts, reports, graphs, or histograms. The software offers the ability to handle 13 length classification bins, which is comparable to many Federal Highway Administration studies. An advantage of the software is that it has the ability to re-bin data. This allows the user to compare recent data to previous studies (by re-sorting the data), and thus compare old and new studies. Once the traffic study is complete, the cover and the counter are removed and can be used in another installation. The particular type of sensor used in this study has the capacity to record up to 300,000 vehicles per study and can detect vehicles moving as slowly as 8 mph (13 km/h). A major advantage of this type of unit is that it is portable and does not require the installation of tubes, loops, or chains to detect vehicles, thus reducing the potential for them being detected by drivers and thus preventing artificial driver behavior changes. Because of their lower profile, the portable on-pavement traffic sensors were preferred, but they were not always available, so pneumatic tube counters were used where necessary.
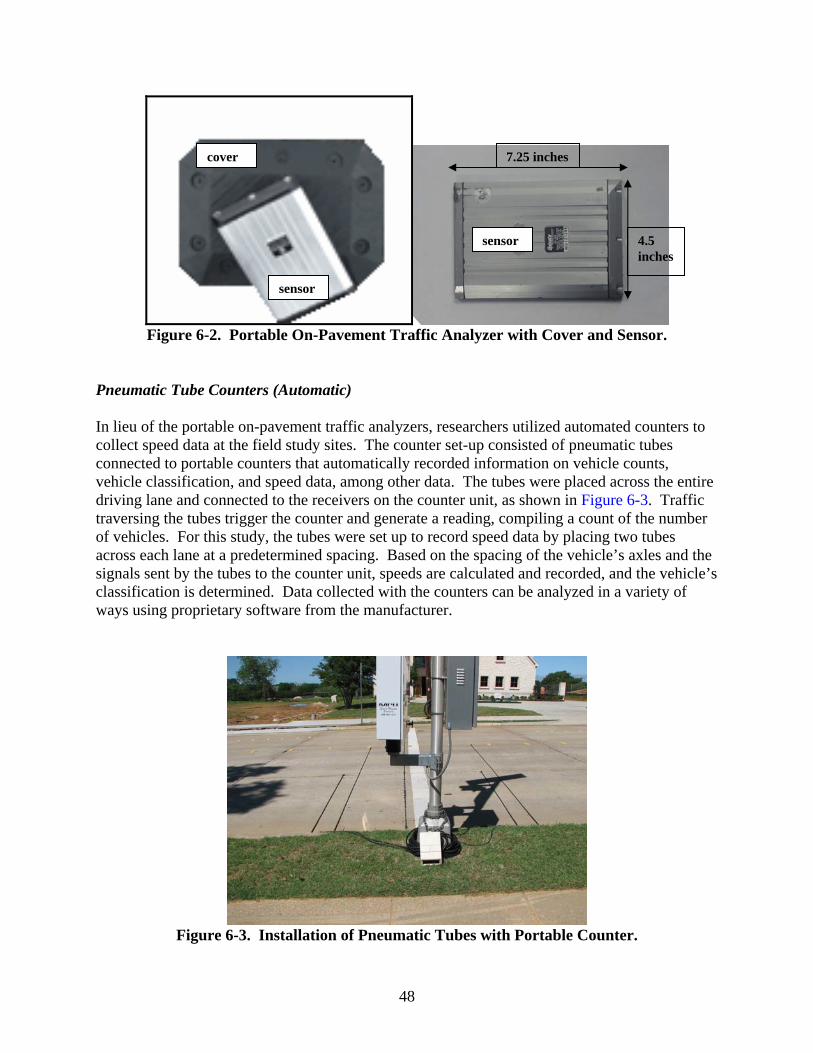
48
Figure 6-2. Portable On-Pavement Traffic Analyzer with Cover and Sensor.
Pneumatic Tube Counters (Automatic) In lieu of the portable on-pavement traffic analyzers, researchers utilized automated counters to collect speed data at the field study sites. The counter set-up consisted of pneumatic tubes connected to portable counters that automatically recorded information on vehicle counts, vehicle classification, and speed data, among other data. The tubes were placed across the entire driving lane and connected to the receivers on the counter unit, as shown in Figure 6-3. Traffic traversing the tubes trigger the counter and generate a reading, compiling a count of the number of vehicles. For this study, the tubes were set up to record speed data by placing two tubes across each lane at a predetermined spacing. Based on the spacing of the vehicle’s axles and the signals sent by the tubes to the counter unit, speeds are calculated and recorded, and the vehicle’s classification is determined. Data collected with the counters can be analyzed in a variety of ways using proprietary software from the manufacturer.
Figure 6-3. Installation of Pneumatic Tubes with Portable Counter.
7.25 inches
4.5 inches
cover
sensor
sensor
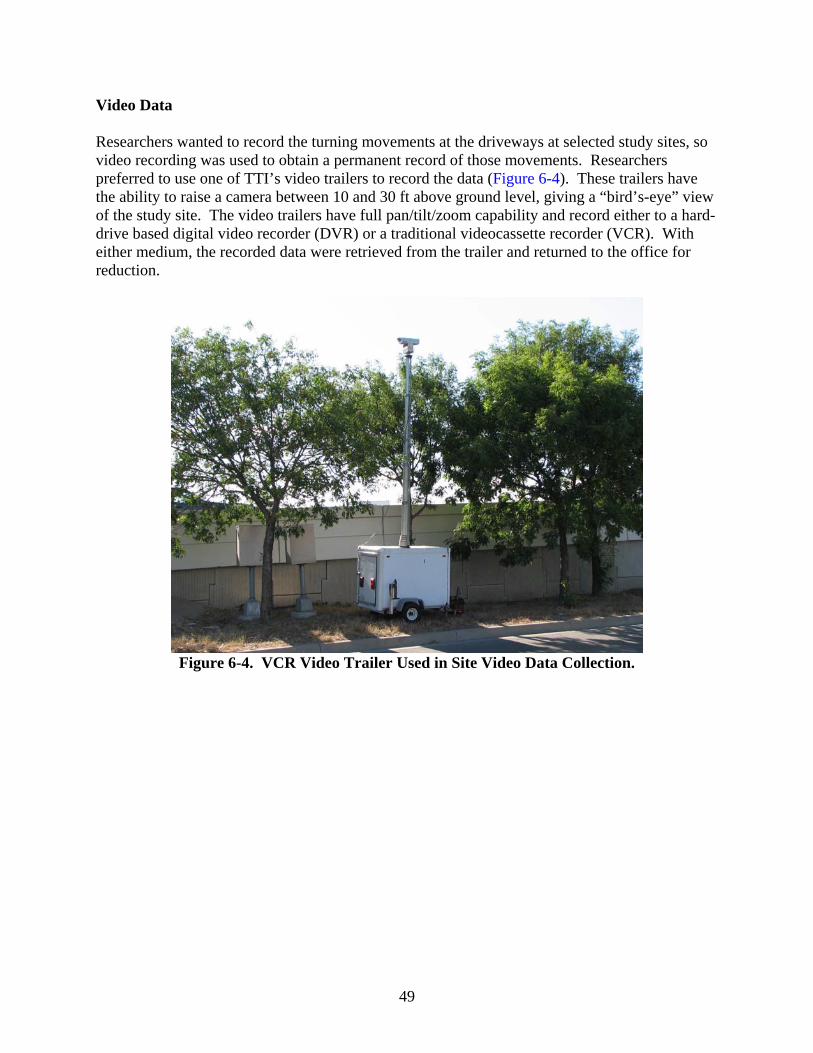
49
Video Data Researchers wanted to record the turning movements at the driveways at selected study sites, so video recording was used to obtain a permanent record of those movements. Researchers preferred to use one of TTI’s video trailers to record the data (Figure 6-4). These trailers have the ability to raise a camera between 10 and 30 ft above ground level, giving a “bird’s-eye” view of the study site. The video trailers have full pan/tilt/zoom capability and record either to a hard-drive based digital video recorder (DVR) or a traditional videocassette recorder (VCR). With either medium, the recorded data were retrieved from the trailer and returned to the office for reduction.
Figure 6-4. VCR Video Trailer Used in Site Video Data Collection.

50
Figure 6-5. Video Trailer Positioned on Side of Road at a Site.
SITE CHARACTERISTICS Between the morning and afternoon peak periods, members of the research team observed and took photographs of operations and existing conditions on adjacent roadways and at the school driveways. Observation information was recorded on a worksheet. Specific tasks included the following:
• Take pictures of site with camera. • Document the signs and markings in and adjacent to the school zone. • Document prominent school zone features and observations. • Measure widths of travel lanes, median (if applicable), bicycle and parking lanes (if
applicable), and sidewalks. • Draw sketch of school zone noting the following items:
o signs, o markings, o other traffic control devices, o location and length of school zone, o turn bays and other geometric features, o number of lanes on surrounding streets, o driveway locations and purposes, o distance between driveways and cross streets, o nearest intersections (signalized or stop-controlled), and o locations of data collection equipment.

51
STUDY SITES Figure 6-6 to Figure 6-60 show photographs of each of the study sites.
Figure 6-6. Aerial Photograph of Study Site AL-1 (Base Map from Google Earth).
(a) Eastbound (b) Westbound
Figure 6-7. Approaches to School Zone at Site AL-1.
Begin 55 mph School Zone
School Driveway
Begin 35 mph School Zone
Begin 55 mph School Zone
Unsignalized Intersection
Begin 70 mph Speed Limit
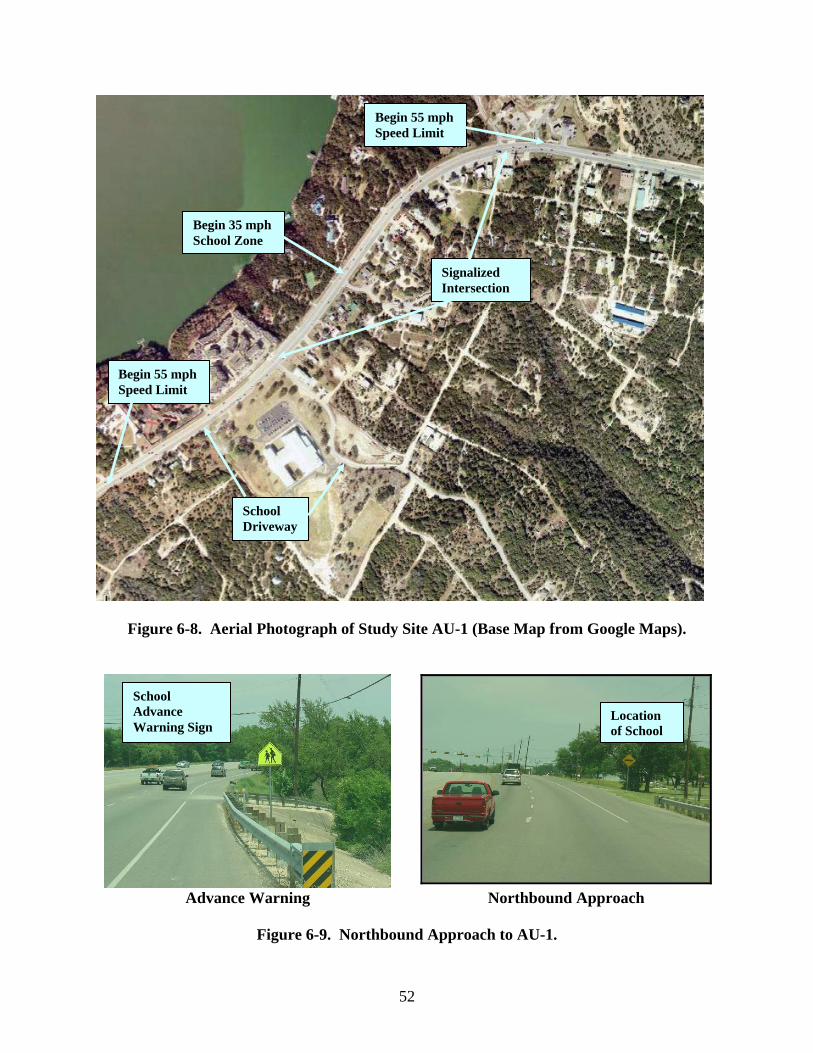
52
Figure 6-8. Aerial Photograph of Study Site AU-1 (Base Map from Google Maps).
Advance Warning Northbound Approach
Figure 6-9. Northbound Approach to AU-1.
Location of School
School Advance Warning Sign
Begin 55 mph Speed Limit
School Driveway
Signalized Intersection
Begin 35 mph School Zone
Begin 55 mph Speed Limit
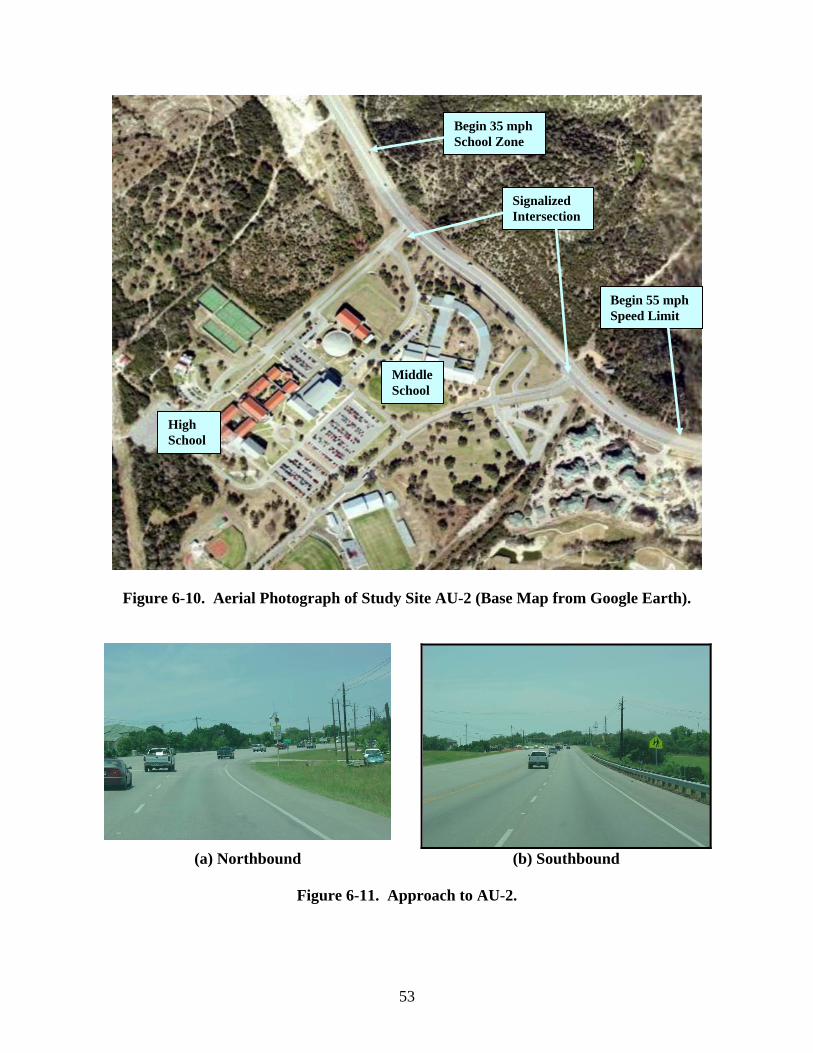
53
Figure 6-10. Aerial Photograph of Study Site AU-2 (Base Map from Google Earth).
(a) Northbound (b) Southbound
Figure 6-11. Approach to AU-2.
Signalized Intersection
Begin 55 mph Speed Limit
Begin 35 mph School Zone
Middle School
High School

54
Figure 6-12. Aerial Photograph of Study Site BR-1 (Base Map from Google Maps).
Figure 6-13. Driver’s View of Approach to Study Site BR-1.
END SCHOOL ZONE sign
Begin 35 mph School Zone
Entry/Exit Driveway
Exit Driveway
Entry Driveway

55
Figure 6-14. Aerial Photograph of Study Site BR-2 (Base Map from Google Maps).
Figure 6-15. Driver’s View of Approach to Study Site BR-2.
END SCHOOL ZONE sign
Begin 35 mph School Zone
Entry/Exit Driveway
Exit Driveway
Unsignalized Intersection

56
Figure 6-16. Aerial Photograph of Study Site BR-3 (Base Map from Google Maps).
Figure 6-17. Driver’s View of Approach to Study Site BR-3.
END SCHOOL ZONE sign
Begin 35 mph School Zone
Unsignalized Intersection with Crosswalk
Unsignalized Intersection
Entry/Exit Driveway
Entry Driveway
Exit Driveway
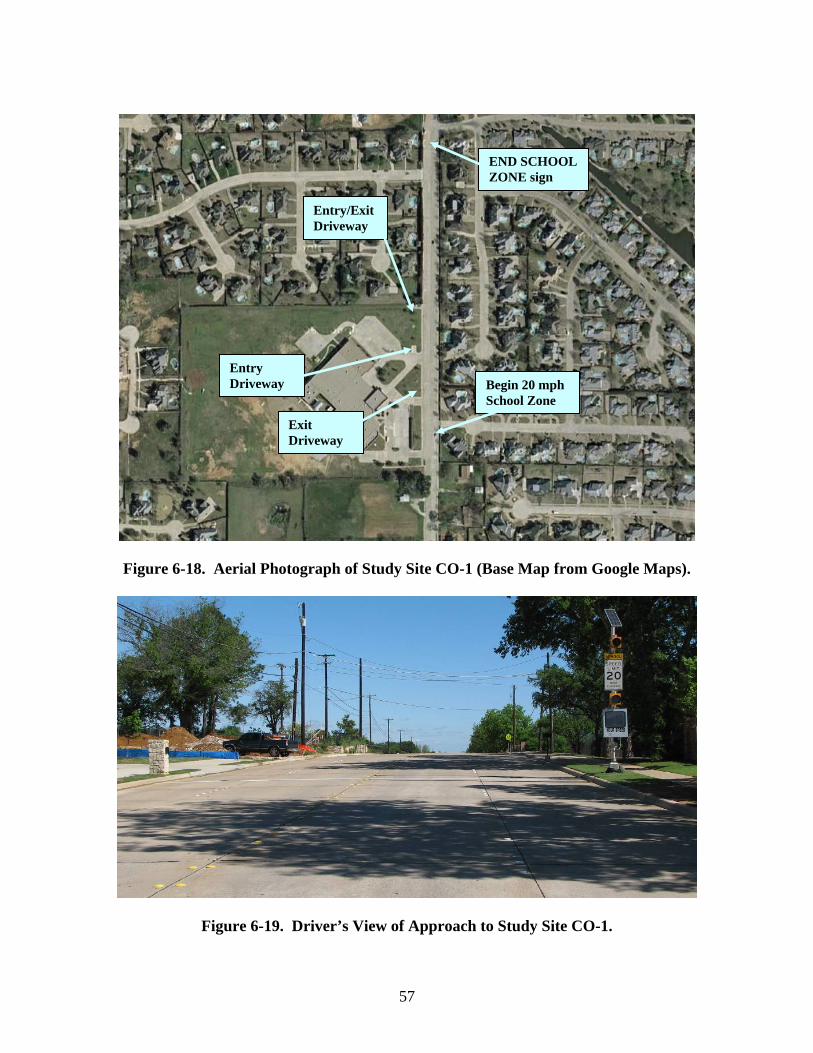
57
Figure 6-18. Aerial Photograph of Study Site CO-1 (Base Map from Google Maps).
Figure 6-19. Driver’s View of Approach to Study Site CO-1.
END SCHOOL ZONE sign
Begin 20 mph School Zone
Entry/Exit Driveway
Entry Driveway
Exit Driveway

58
Figure 6-20. Aerial Photograph of Study Site CO-2 (Base Map from Google Maps).
Figure 6-21. Driver’s View of Approach to Crosswalk at Study Site CO-2.
Begin 45 mph Speed Limit
Begin 35 mph School Zone
35 mph School Speed Limit Sign
Marked Crosswalk
35 mph School Speed Limit Sign
Marked Crosswalk
Signalized Intersection with Crosswalk
Entry/Exit Driveway
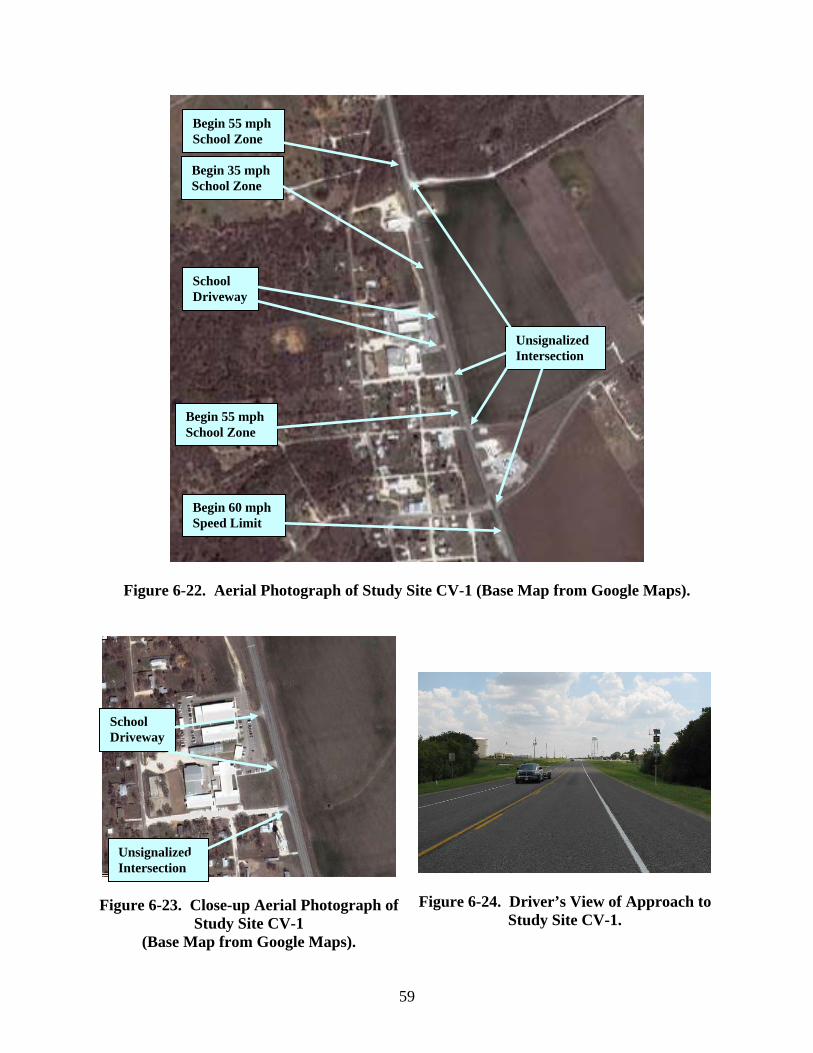
59
Figure 6-22. Aerial Photograph of Study Site CV-1 (Base Map from Google Maps).
Figure 6-23. Close-up Aerial Photograph of Study Site CV-1
(Base Map from Google Maps).
Figure 6-24. Driver’s View of Approach to Study Site CV-1.
Begin 55 mph School Zone
School Driveway
Begin 35 mph School Zone
Begin 60 mph Speed Limit
Begin 55 mph School Zone
Unsignalized Intersection
School Driveway
Unsignalized Intersection

60
Figure 6-25. Aerial Photograph of Study Site EL-1 (Base Map from Google Maps).
Figure 6-26. Driver’s View of Approach to Study Site EL-1.
Begin 50 mph Speed Limit; END SCHOOL ZONE sign
Begin 35 mph School Zone
School
Unsignalized Intersection
Unsignalized Intersection
Signalized Intersection with Crosswalk
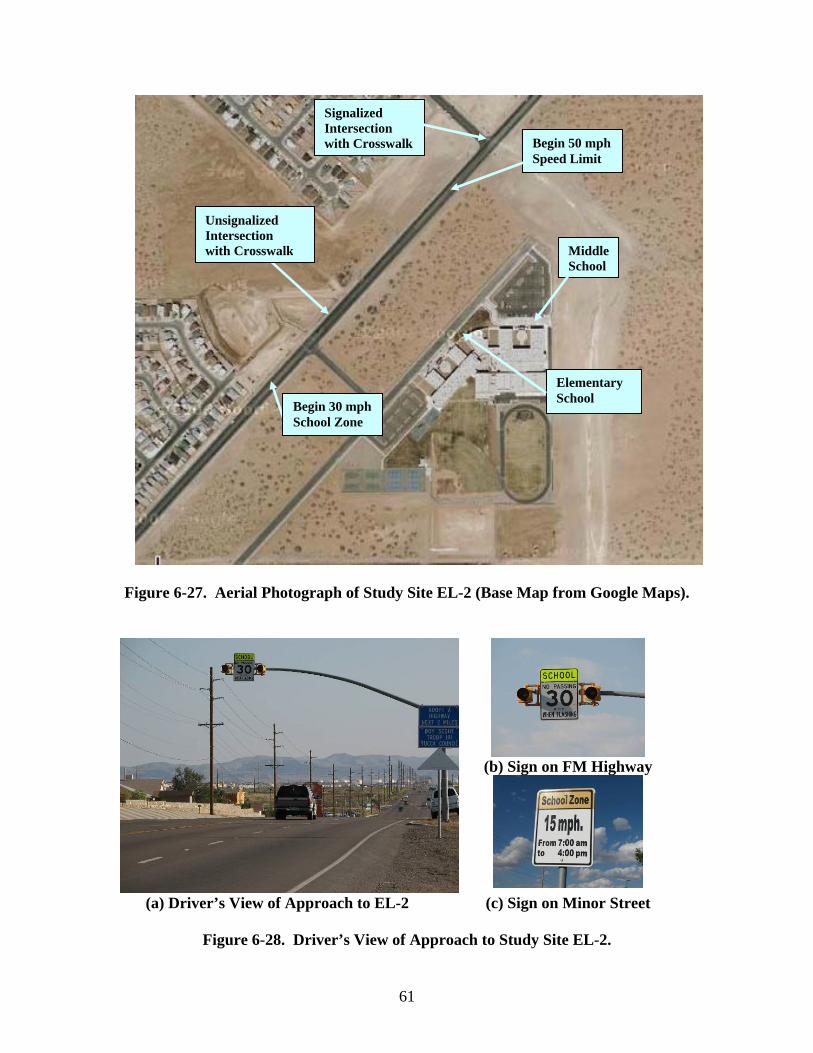
61
Figure 6-27. Aerial Photograph of Study Site EL-2 (Base Map from Google Maps).
(b) Sign on FM Highway
(a) Driver’s View of Approach to EL-2 (c) Sign on Minor Street
Figure 6-28. Driver’s View of Approach to Study Site EL-2.
Elementary School
Middle School
Begin 30 mph School Zone
Begin 50 mph Speed Limit
Unsignalized Intersection with Crosswalk
Signalized Intersection with Crosswalk
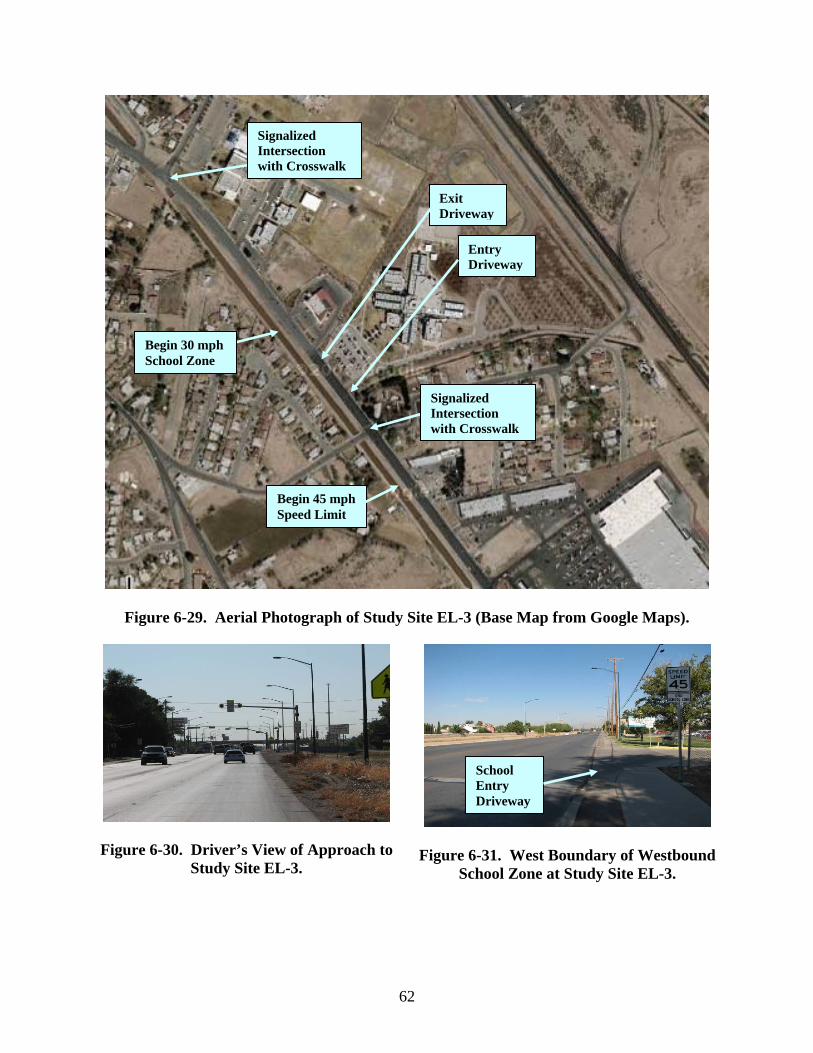
62
Figure 6-29. Aerial Photograph of Study Site EL-3 (Base Map from Google Maps).
Figure 6-30. Driver’s View of Approach to Study Site EL-3.
Figure 6-31. West Boundary of Westbound School Zone at Study Site EL-3.
Entry Driveway
Begin 30 mph School Zone
Begin 45 mph Speed Limit
Signalized Intersection with Crosswalk
Exit Driveway
Signalized Intersection with Crosswalk
School Entry Driveway
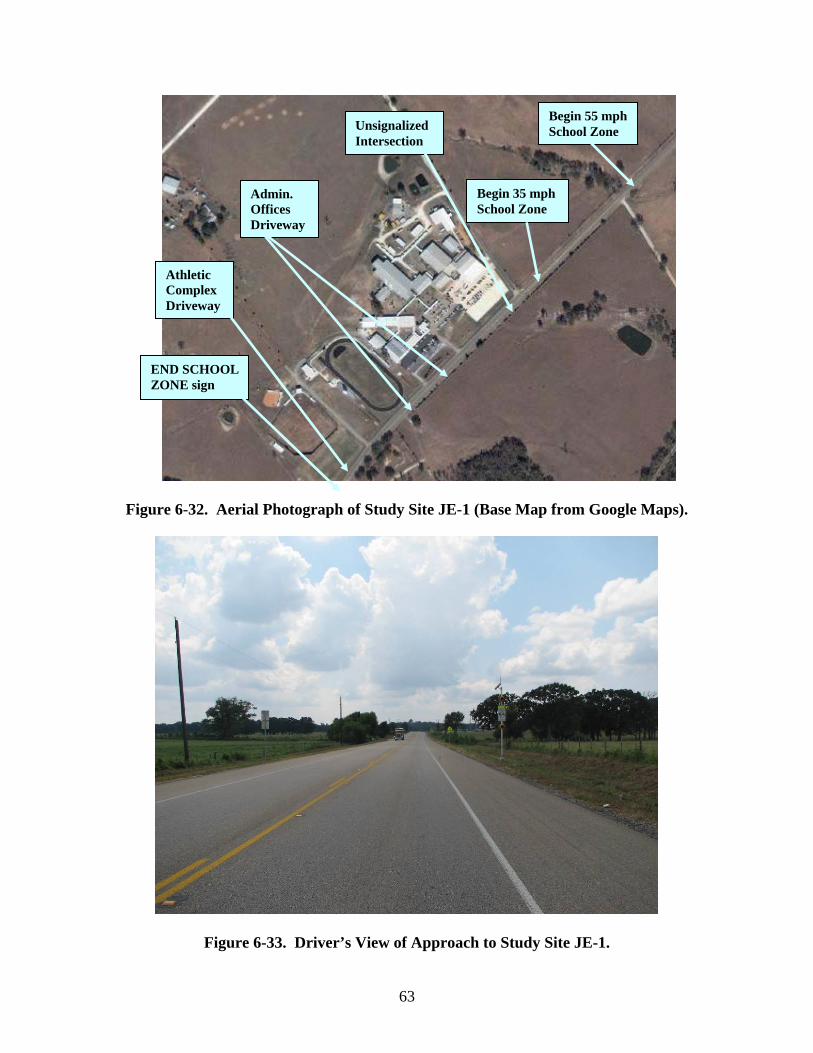
63
Figure 6-32. Aerial Photograph of Study Site JE-1 (Base Map from Google Maps).
Figure 6-33. Driver’s View of Approach to Study Site JE-1.
Begin 55 mph School Zone
Begin 35 mph School Zone
END SCHOOL ZONE sign
Unsignalized Intersection
Admin. Offices Driveway
Athletic Complex Driveway
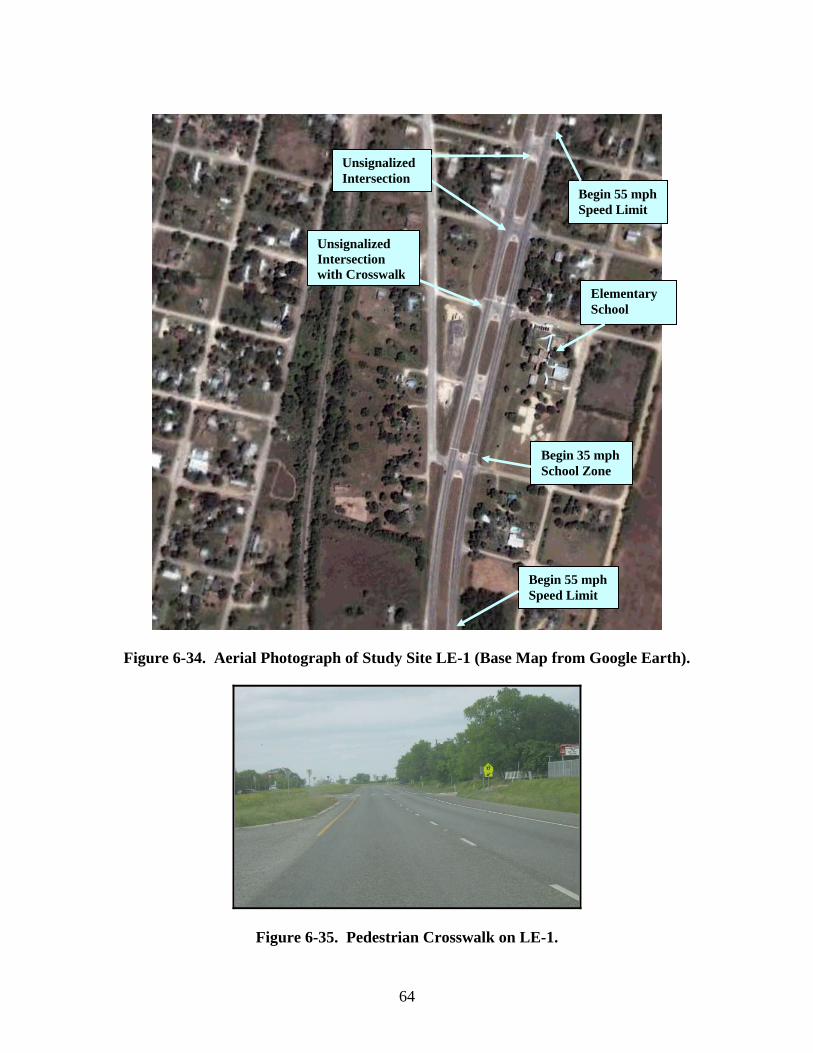
64
Figure 6-34. Aerial Photograph of Study Site LE-1 (Base Map from Google Earth).
Figure 6-35. Pedestrian Crosswalk on LE-1.
Elementary School
Begin 55 mph Speed Limit
Unsignalized Intersection with Crosswalk
Unsignalized Intersection
Begin 35 mph School Zone
Begin 55 mph Speed Limit
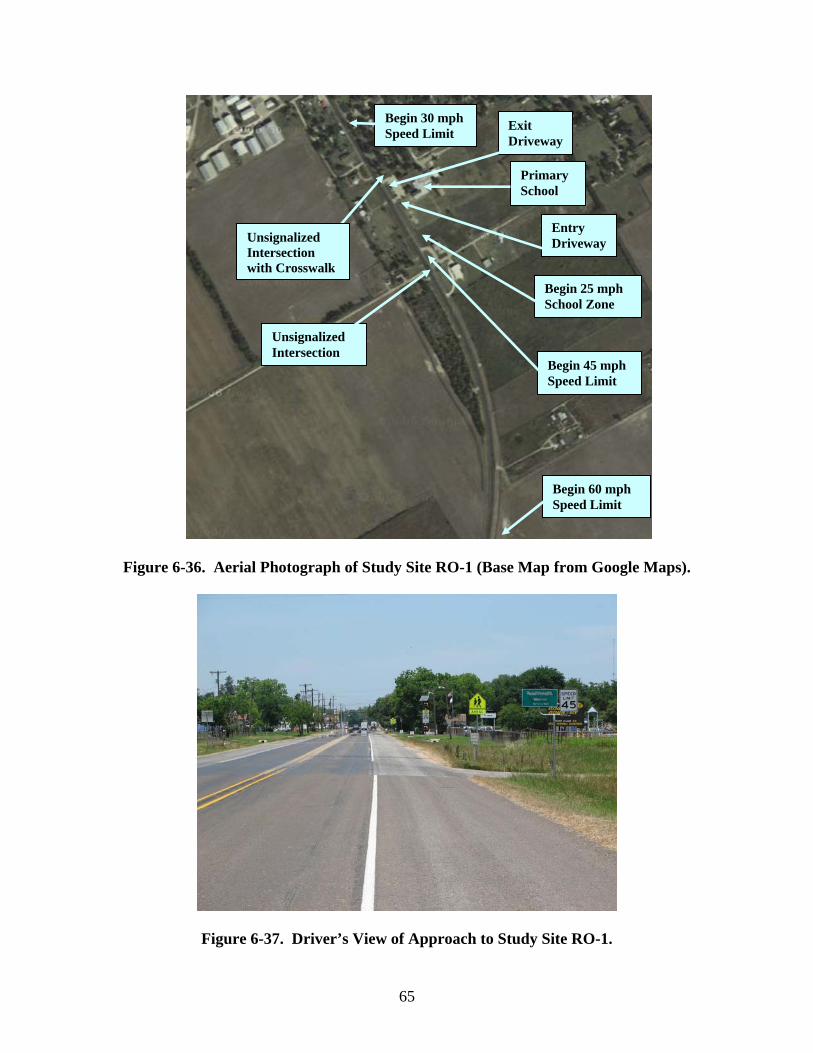
65
Figure 6-36. Aerial Photograph of Study Site RO-1 (Base Map from Google Maps).
Figure 6-37. Driver’s View of Approach to Study Site RO-1.
Begin 25 mph School Zone
Begin 45 mph Speed Limit
Begin 60 mph Speed Limit
Entry Driveway
Begin 30 mph Speed Limit Exit
Driveway
Unsignalized Intersection
Unsignalized Intersection with Crosswalk
Primary School
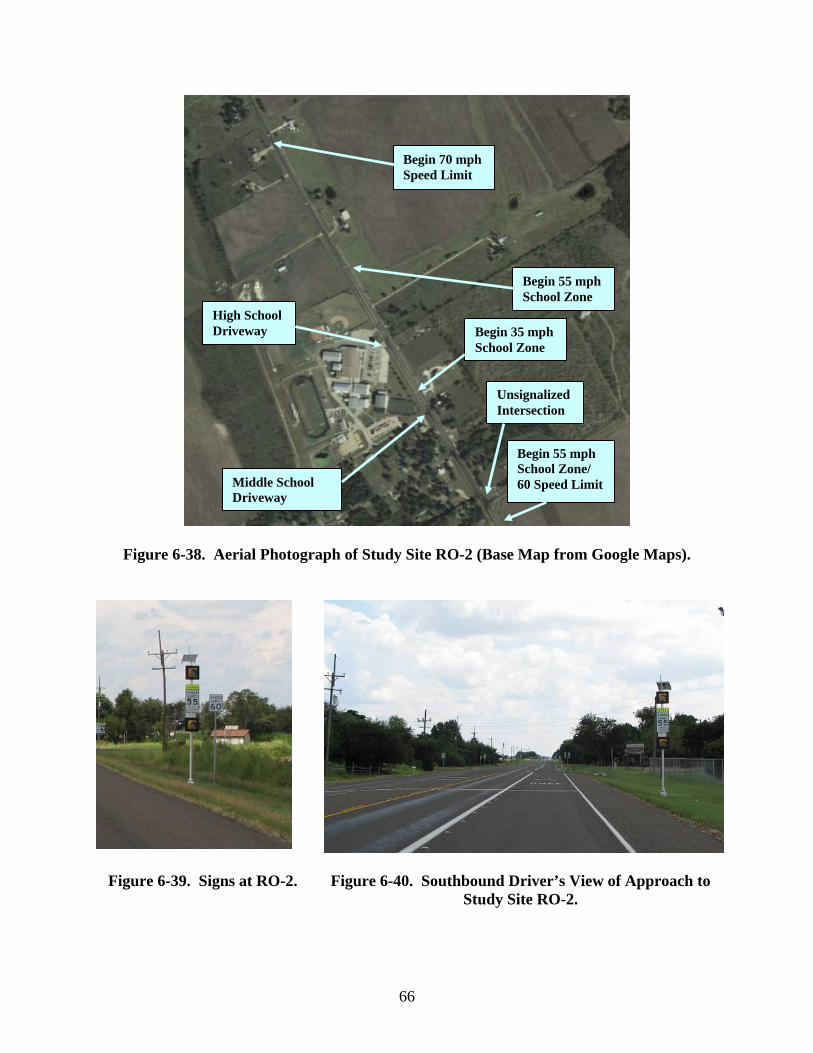
66
Figure 6-38. Aerial Photograph of Study Site RO-2 (Base Map from Google Maps).
Figure 6-39. Signs at RO-2.
Figure 6-40. Southbound Driver’s View of Approach to Study Site RO-2.
Begin 55 mph School Zone/ 60 Speed Limit
Begin 35 mph School Zone
Begin 55 mph School Zone
Begin 70 mph Speed Limit
Unsignalized Intersection
High School Driveway
Middle School Driveway
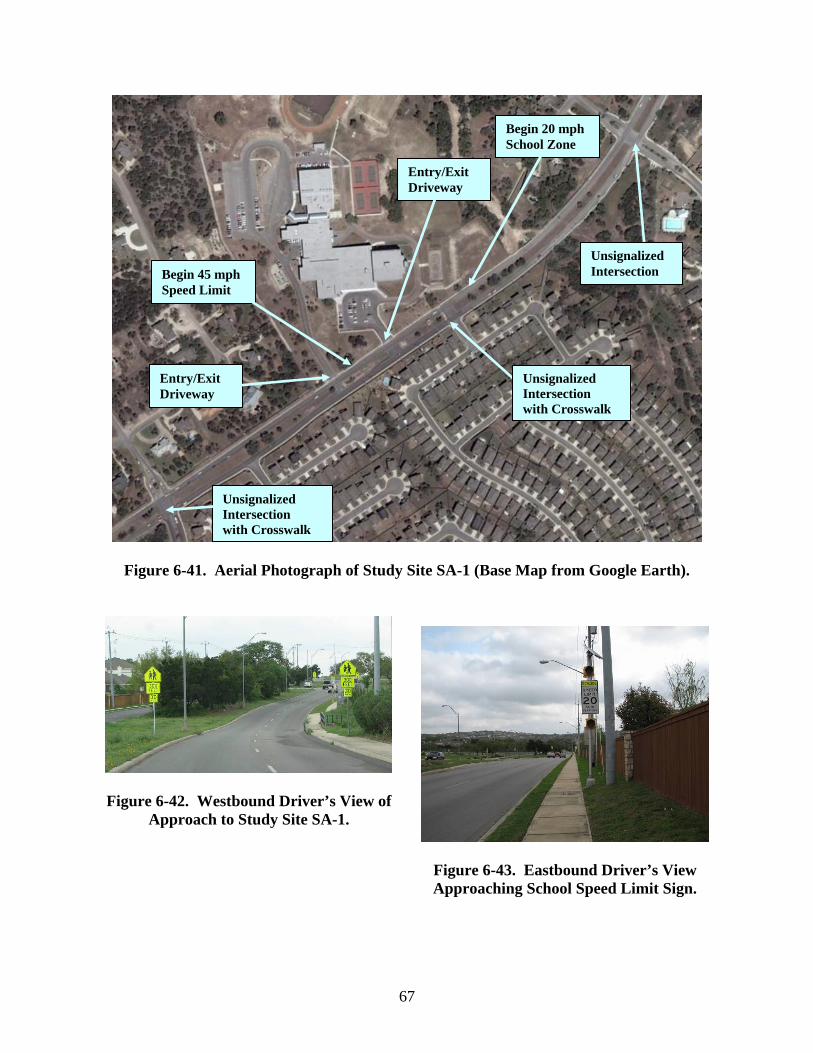
67
Figure 6-41. Aerial Photograph of Study Site SA-1 (Base Map from Google Earth).
Figure 6-42. Westbound Driver’s View of Approach to Study Site SA-1.
Figure 6-43. Eastbound Driver’s View Approaching School Speed Limit Sign.
Begin 20 mph School Zone
Begin 45 mph Speed Limit
Unsignalized Intersection
Unsignalized Intersection with Crosswalk
Unsignalized Intersection with Crosswalk
Entry/Exit Driveway
Entry/Exit Driveway
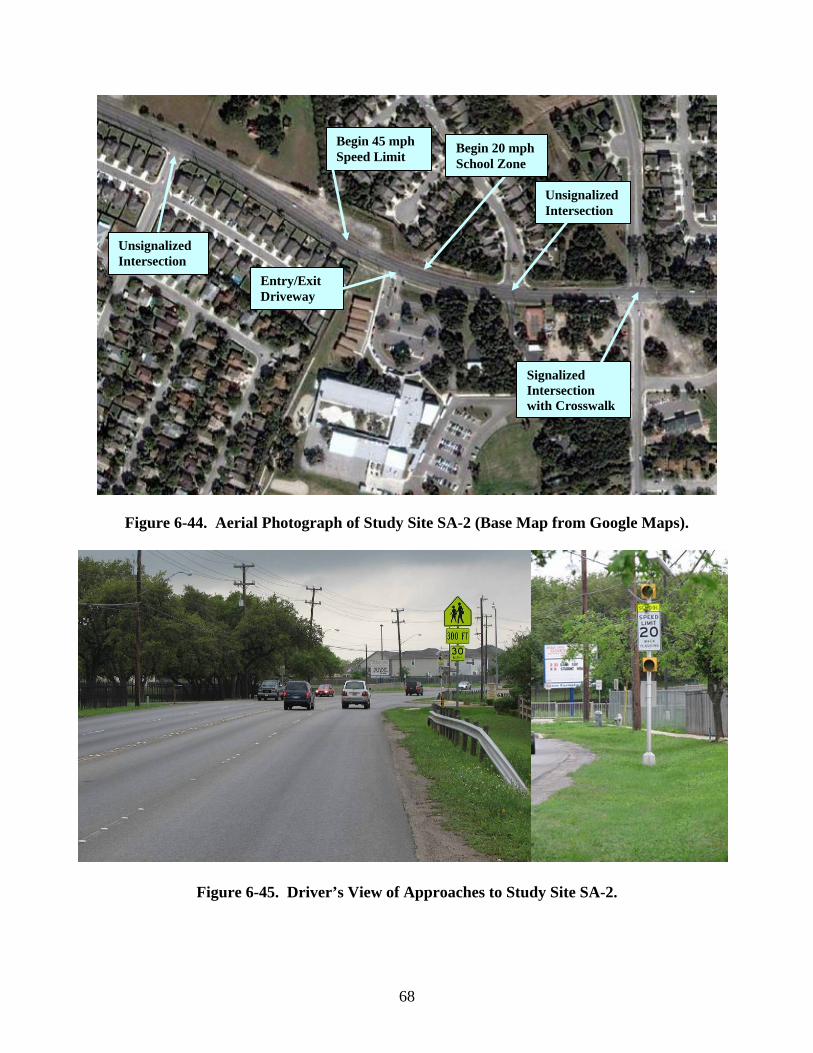
68
Figure 6-44. Aerial Photograph of Study Site SA-2 (Base Map from Google Maps).
Figure 6-45. Driver’s View of Approaches to Study Site SA-2.
Begin 45 mph Speed Limit Begin 20 mph
School Zone
Unsignalized Intersection
Signalized Intersection with Crosswalk
Entry/Exit Driveway
Unsignalized Intersection
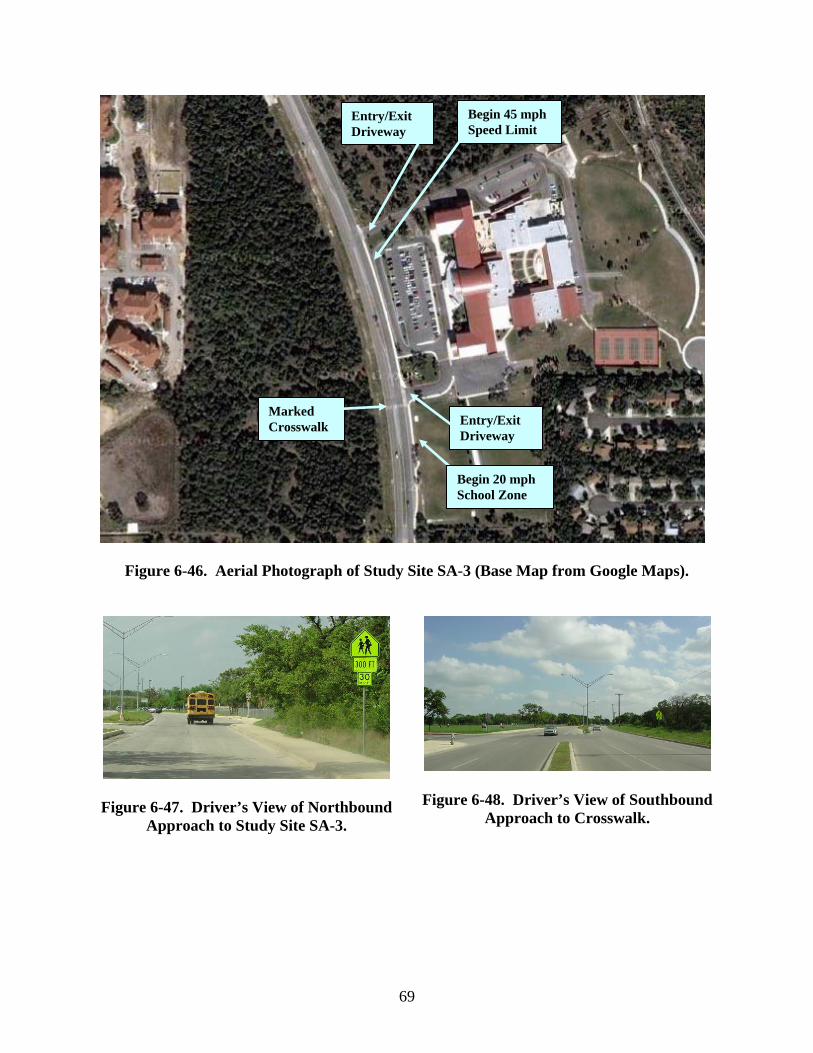
69
Figure 6-46. Aerial Photograph of Study Site SA-3 (Base Map from Google Maps).
Figure 6-47. Driver’s View of Northbound Approach to Study Site SA-3.
Figure 6-48. Driver’s View of Southbound Approach to Crosswalk.
Begin 45 mph Speed Limit
Begin 20 mph School Zone
Entry/Exit Driveway
Entry/Exit Driveway
Marked Crosswalk

70
Figure 6-49. Aerial Photograph of Study Site SA-4 (Base Map from Google Maps).
Figure 6-50. Advance Warning Sign on Eastbound Approach to SA-4.
Signalized Intersection with Crosswalk
Elementary School
Begin 35 mph School Zone
Begin 55 mph School Zone
Begin 65 mph Speed Limit
Begin 55 mph School Zone

71
Figure 6-51. Aerial Photograph of Study Site ST-1 (Base Map from Google Maps).
Figure 6-52. Driver’s View of Approach to Study Site ST-1.
Begin 35 mph School Zone
Begin 55 mph School Zone
END SCHOOL ZONE sign
Unsignalized Intersection
Entry/Exit Driveway
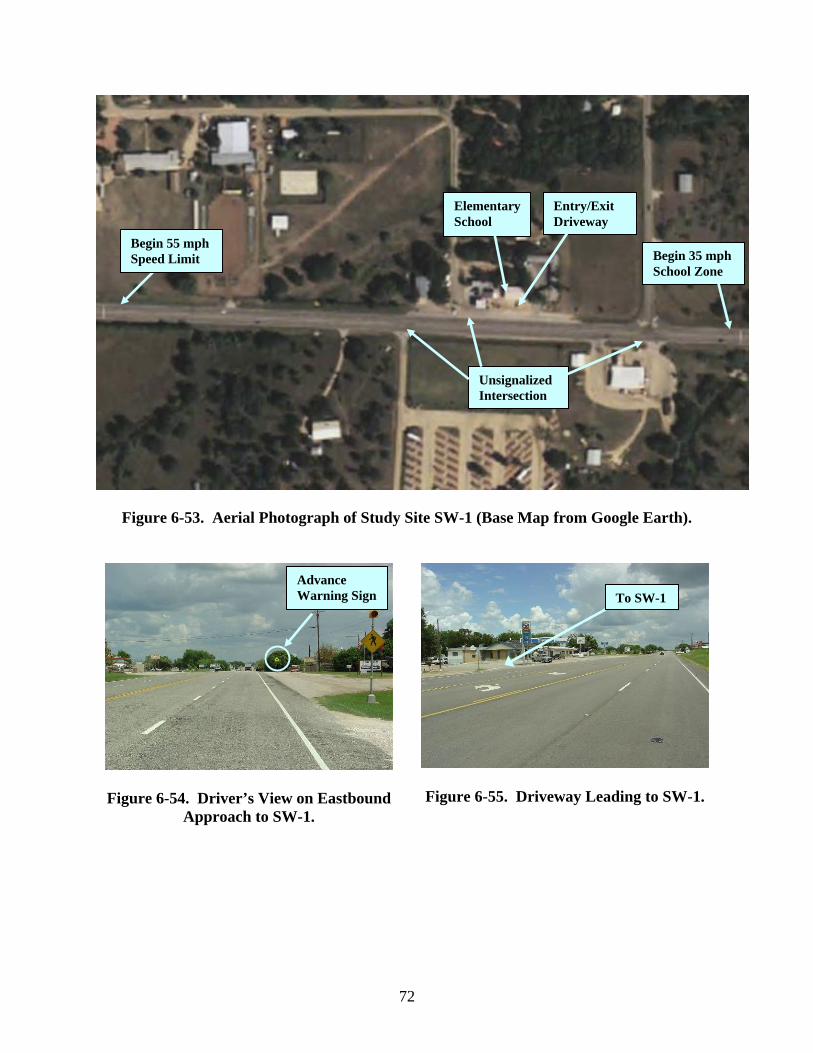
72
Figure 6-53. Aerial Photograph of Study Site SW-1 (Base Map from Google Earth).
Figure 6-54. Driver’s View on Eastbound Approach to SW-1.
Figure 6-55. Driveway Leading to SW-1.
To SW-1Advance Warning Sign
Elementary School
Begin 35 mph School Zone
Begin 55 mph Speed Limit
Entry/Exit Driveway
Unsignalized Intersection

73
Figure 6-56. Aerial Photograph of Study Site TE-1 (Base Map from Google Maps).
Figure 6-57. Driver’s View of Approach to Study Site TE-1.
Begin 50 mph School Zone
Begin 35 mph School Zone
Begin 50 mph School Zone
Begin 50 mph School Zone (activated)
Begin 35 mph School Zone (not activated)
Begin 60 mph Speed Limit
Entry/Exit Driveway
Unsignalized Intersection
Unsignalized Intersection
Unsignalized Intersection

74
Figure 6-58. Aerial Photograph of Study Site WI-1 (Base Map from Google Earth).
Figure 6-59. Location of Tube Detectors on Northbound Approach to WI-1.
Figure 6-60. Southbound Approach to WI-1.
School
Begin 35 mph School Zone
Entry/Exit Driveway
Unsignalized Intersection
Unsignalized Intersection
Begin 55 mph Speed Limit

75
CHAPTER 7
FINDINGS FROM FIELD STUDIES
This chapter contains findings from analysis of the speed data collected in various school zone sites across Texas. Data were collected using laser and counters, as discussed in Chapter 6. Researchers sought to answer several questions regarding the relationships between operating speed and reduced-speed school zones. These questions were intended to focus the analysis on unique characteristics of reduced-speed school zones, such as the length and duration of those zones and the time of day relative to the start and end of school. The following sections will describe the findings from those analyses. GENERAL FINDINGS Site Characteristics Researchers collected speed data at 24 different sites. Data were collected using laser, counters, or both. For selected analyses, data from speed-distance profiles collected with laser were converted to spot-speed data and combined with the counter data. The laser data were also examined and evaluated as continuous speed-distance data. For some analyses, sites were not included if the sample size of vehicle speeds was small. Within each section, the findings will refer to the number of study sites or datasets used within the evaluation. The number of datasets varied depending upon whether spot-speed data or continuous speed-distance or speed-time data were used. A summary of site characteristics are provided in Tables 6-1, 6-2, and 6-3. A review of Table 6-3 shows that 16 of the 24 study sites had a posted school speed limit of 35 mph, which is reflective of the rural and suburban nature of the sites selected. In addition, seven of the sites with a 35-mph school speed limit had a buffer speed limit, which is used for sites with regulatory speed limits above 55 mph. All of the sites with buffer zones had a total reduced speed length greater than 1200 ft for the 35-mph portion and greater than 3800 ft for the entire reduced-speed sections (see Figure 7-1). By comparison, 11 of the 17 sites without buffer zones had reduced-speed school zone lengths equal to or greater than 1200 ft with five of the sites being longer than 2100 ft (see Figure 7-2).
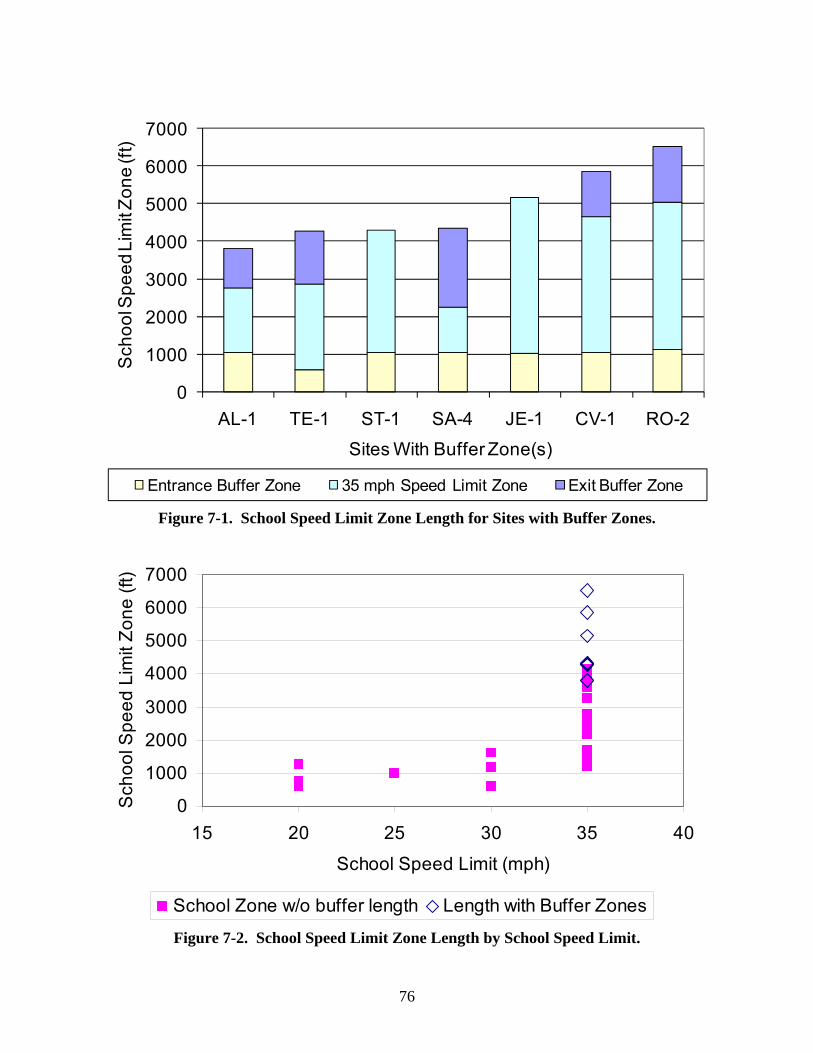
76
0
1000
2000
3000
4000
5000
6000
7000
AL-1 TE-1 ST-1 SA-4 JE-1 CV-1 RO-2
Sch
ool S
peed
Lim
it Zon
e (ft
)
Sites With Buffer Zone(s)
Entrance Buffer Zone 35 mph Speed Limit Zone Exit Buffer Zone
Figure 7-1. School Speed Limit Zone Length for Sites with Buffer Zones.
0
1000
2000
3000
4000
5000
6000
7000
15 20 25 30 35 40
School Speed Limit (mph)
Sch
ool S
peed
Lim
it Zo
ne (f
t)
School Zone w/o buffer length Length with Buffer Zones
Figure 7-2. School Speed Limit Zone Length by School Speed Limit.
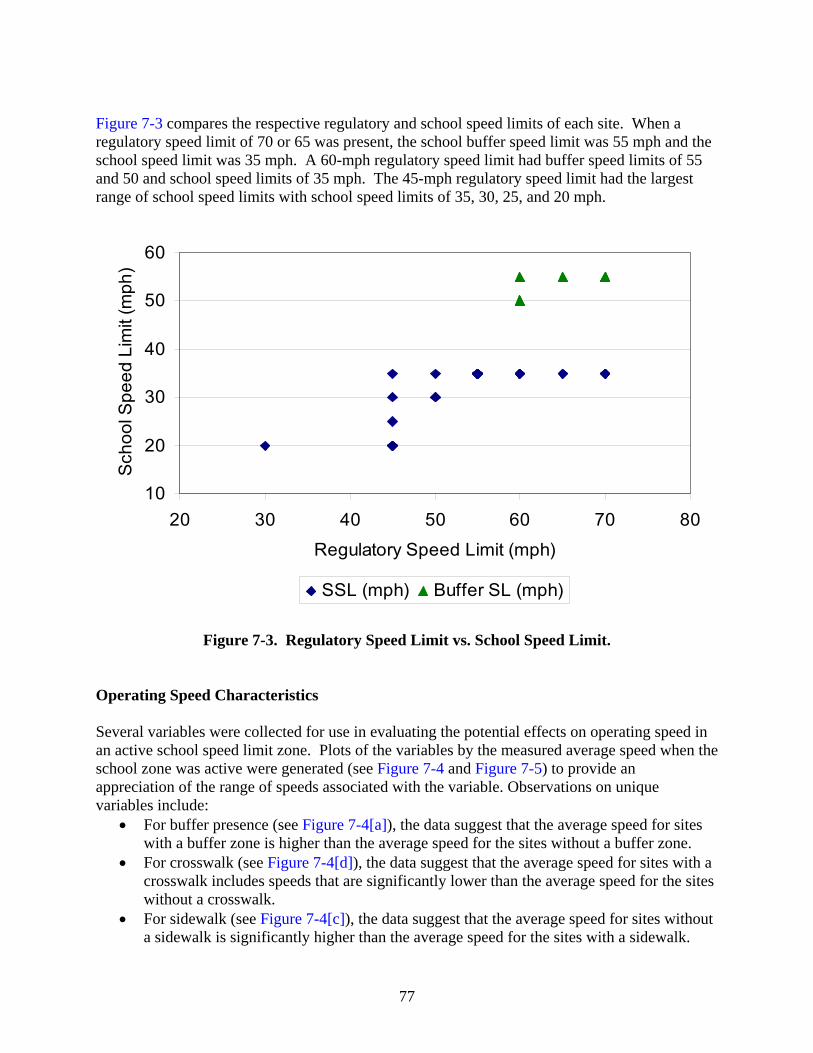
77
Figure 7-3 compares the respective regulatory and school speed limits of each site. When a regulatory speed limit of 70 or 65 was present, the school buffer speed limit was 55 mph and the school speed limit was 35 mph. A 60-mph regulatory speed limit had buffer speed limits of 55 and 50 and school speed limits of 35 mph. The 45-mph regulatory speed limit had the largest range of school speed limits with school speed limits of 35, 30, 25, and 20 mph.
10
20
30
40
50
60
20 30 40 50 60 70 80
Regulatory Speed Limit (mph)
Sch
ool S
peed
Lim
it (m
ph)
SSL (mph) Buffer SL (mph)
Figure 7-3. Regulatory Speed Limit vs. School Speed Limit.
Operating Speed Characteristics Several variables were collected for use in evaluating the potential effects on operating speed in an active school speed limit zone. Plots of the variables by the measured average speed when the school zone was active were generated (see Figure 7-4 and Figure 7-5) to provide an appreciation of the range of speeds associated with the variable. Observations on unique variables include:
• For buffer presence (see Figure 7-4[a]), the data suggest that the average speed for sites with a buffer zone is higher than the average speed for the sites without a buffer zone.
• For crosswalk (see Figure 7-4[d]), the data suggest that the average speed for sites with a crosswalk includes speeds that are significantly lower than the average speed for the sites without a crosswalk.
• For sidewalk (see Figure 7-4[c]), the data suggest that the average speed for sites without a sidewalk is significantly higher than the average speed for the sites with a sidewalk.

78
15
20
25
30
35
40
45
-0.5 0 0.5 1 1.5Buffer Presence
(0=no buffer, 1=buffer present)
Mea
sure
d A
vera
ge S
peed
(mph
)
15
20
25
30
35
40
45
-0.5 0 0.5 1 1.5 2 2.5Parking Lane Presence
(0=no parking lane, 1=parking lane present, 2=shoulder)
Mea
sure
d A
vera
ge S
peed
(mph
)
(a) Buffer Presence (b) Parking Lane Presence
50
60
70
80
90
100
-0.5 0 0.5 1 1.5Sidewalk Presence
(0=no sidewalk, 1=sidewalk present)
Com
plia
nce
(%)
152535455565758595
105
-0.5 0 0.5 1 1.5Crosswalk Presence
(0=no crosswalk, 1=crosswalk present)
Com
plia
nce
(c) Sidewalk Presence (d) Crosswalk Presence
15
20
25
30
35
40
45
0 1 2 3 4School Size
(1=small, 2=medium, 3=large)
Mea
sure
d A
vera
ge S
peed
(mph
)
15
20
25
30
35
40
45
-0.5 0 0.5 1 1.5 2 2.5 3 3.5Beacon Type
(0=Roadside, 1=Overhead, 2=Both Roadside+Overhead, 3=No Beacon)
Mea
sure
d A
vera
ge S
peed
(mph
)
(e) School Size (f) Beacon Type
Figure 7-4. Average Speed Measured During Active School Zone for Selected Variables.

79
15
20
25
30
35
40
45
0 1000 2000 3000 4000 5000School Zone Length (ft)
Mea
sure
d A
vera
ge S
peed
(mph
)
15
20
25
30
35
40
45
0 10 20 30Access Density (access/mi)
Mea
sure
d A
vera
ge S
peed
(mph
)
(a) Zone Length (b) Access Density
15
20
25
30
35
40
45
1 2 3 4 5 6 7Number of Lanes
(2=2U, 3=2+TWLTL, 4=4U, 4.5=4D, 5=4+TWLTL, 6.5=6D)
Mea
sure
d A
vera
ge S
peed
(mph
)
15
20
25
30
35
40
45
0 5 10 15 20School Driveay Density (driveways/mi)
Mea
sure
d A
vera
ge S
peed
(mph
)
(c) Number of Lanes (d) School Driveway Density
1520
253035
4045
1 2 3 4 5 6 7Area Type
(2=Rural Mix, 3=Rural Residential, 4=Rural Undeveloped, 5=Suburban Commercial, 6=Suburban Residential)
Mea
sure
d A
vera
ge S
peed
(m
ph)
(e) Area Type
Figure 7-5. Average Speed Measured During Active School Zone for Additional Variables.
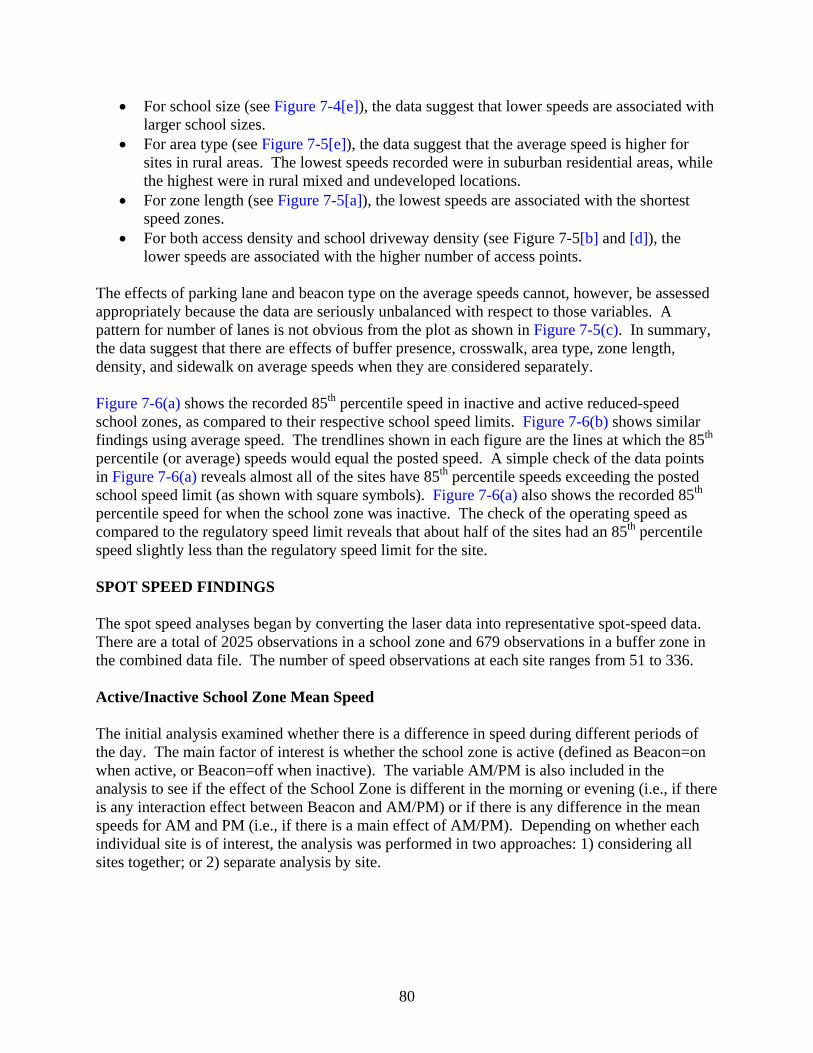
80
• For school size (see Figure 7-4[e]), the data suggest that lower speeds are associated with larger school sizes.
• For area type (see Figure 7-5[e]), the data suggest that the average speed is higher for sites in rural areas. The lowest speeds recorded were in suburban residential areas, while the highest were in rural mixed and undeveloped locations.
• For zone length (see Figure 7-5[a]), the lowest speeds are associated with the shortest speed zones.
• For both access density and school driveway density (see Figure 7-5[b] and [d]), the lower speeds are associated with the higher number of access points.
The effects of parking lane and beacon type on the average speeds cannot, however, be assessed appropriately because the data are seriously unbalanced with respect to those variables. A pattern for number of lanes is not obvious from the plot as shown in Figure 7-5(c). In summary, the data suggest that there are effects of buffer presence, crosswalk, area type, zone length, density, and sidewalk on average speeds when they are considered separately. Figure 7-6(a) shows the recorded 85th percentile speed in inactive and active reduced-speed school zones, as compared to their respective school speed limits. Figure 7-6(b) shows similar findings using average speed. The trendlines shown in each figure are the lines at which the 85th percentile (or average) speeds would equal the posted speed. A simple check of the data points in Figure 7-6(a) reveals almost all of the sites have 85th percentile speeds exceeding the posted school speed limit (as shown with square symbols). Figure 7-6(a) also shows the recorded 85th percentile speed for when the school zone was inactive. The check of the operating speed as compared to the regulatory speed limit reveals that about half of the sites had an 85th percentile speed slightly less than the regulatory speed limit for the site. SPOT SPEED FINDINGS The spot speed analyses began by converting the laser data into representative spot-speed data. There are a total of 2025 observations in a school zone and 679 observations in a buffer zone in the combined data file. The number of speed observations at each site ranges from 51 to 336. Active/Inactive School Zone Mean Speed The initial analysis examined whether there is a difference in speed during different periods of the day. The main factor of interest is whether the school zone is active (defined as Beacon=on when active, or Beacon=off when inactive). The variable AM/PM is also included in the analysis to see if the effect of the School Zone is different in the morning or evening (i.e., if there is any interaction effect between Beacon and AM/PM) or if there is any difference in the mean speeds for AM and PM (i.e., if there is a main effect of AM/PM). Depending on whether each individual site is of interest, the analysis was performed in two approaches: 1) considering all sites together; or 2) separate analysis by site.

81
0
20
40
60
80
0 20 40 60 80
Speed Limit (mph)
85th
Per
cent
ile S
peed
(mph
)
85th Percentile Speed when Regulatory Speed Limit Apply85th Percentile Speed when School Speed Limit Apply85th Percentile Speed Matches Posted Speed Limit
(a) 85th Percentile Speed
0
20
40
60
80
0 20 40 60 80
Speed Limit (mph)
Ave
rage
Spe
ed (m
ph)
Average Speed when Regulatory Speed Limit ApplyAverage Speed when School Speed Limit ApplyAverage Speed Matches Posted Speed Limit
(b) Average Speed
Figure 7-6. Observed Speed versus Speed Limits.

82
Analysis Considering All Sites Together The site variable is treated as a blocking factor assuming that it has been used to provide replication over a selection of different conditions, and it is included in the analysis to account for site-to-site variability. Researchers analyzed the speed data in a school zone by employing the Analysis of Variance (ANOVA) with speed as a response variable, and Beacon, AM/PM, and Site as factors, along with a two-way interaction effect Beacon*AM/PM. Table 7-1 contains the analysis output obtained by ANOVA implemented in the JMP statistical package which is a software product of the Statistical Analysis Software (SAS). It can be observed from the Effect Tests table (see Table 7-1) that the interaction effect between Beacon and AM/PM is statistically significant at α=0.05, suggesting that the effect of Beacon needs to be assessed conditional on each level of AM/PM, and vice versa. Figure 7-7 and Table 7-2 contain the interaction plot for Beacon*AM/PM and the corresponding multiple comparison test results, respectively.
Table 7-1. JMP Output for the Spot Speeds In a School Zone Measured by Laser. Response Abs Speed Zone=Sch SL Summary of Fit RSquare 0.698352RSquare Adj 0.695037Root Mean Square Error 6.678339Mean of Response 40.01086Observations (or Sum Wgts) 2025 Analysis of Variance Source DF Sum of
Squares Mean Square F Ratio
Model 22 206716.15 9396.19 210.6759 Error 2002 89289.61 44.60 Prob > F C. Total 2024 296005.76 0.0000 Effect Tests Source Nparm DF Sum of Squares F Ratio Prob > F Beacon (On/Off) 1 1 96321.886 2159.674 <.0001 AM/PM 1 1 56.019 1.2560 0.2625 Beacon (On/Off)*AM/PM 1 1 405.469 9.0912 0.0026 Site 19 19 73627.063 86.8854 <.0001
Table 7-2. Tukey’s Multiple Comparison Test for
Beacon*AM/PM for School Zone Data. Level Least Sq Mean Std Error
off, AM A 48.60 0.33894995 off, PM A 48.00 0.32694812 on, PM B 33.92 0.34381918 on, AM C 32.65 0.31181186
Levels not connected by same letter are significantly different.
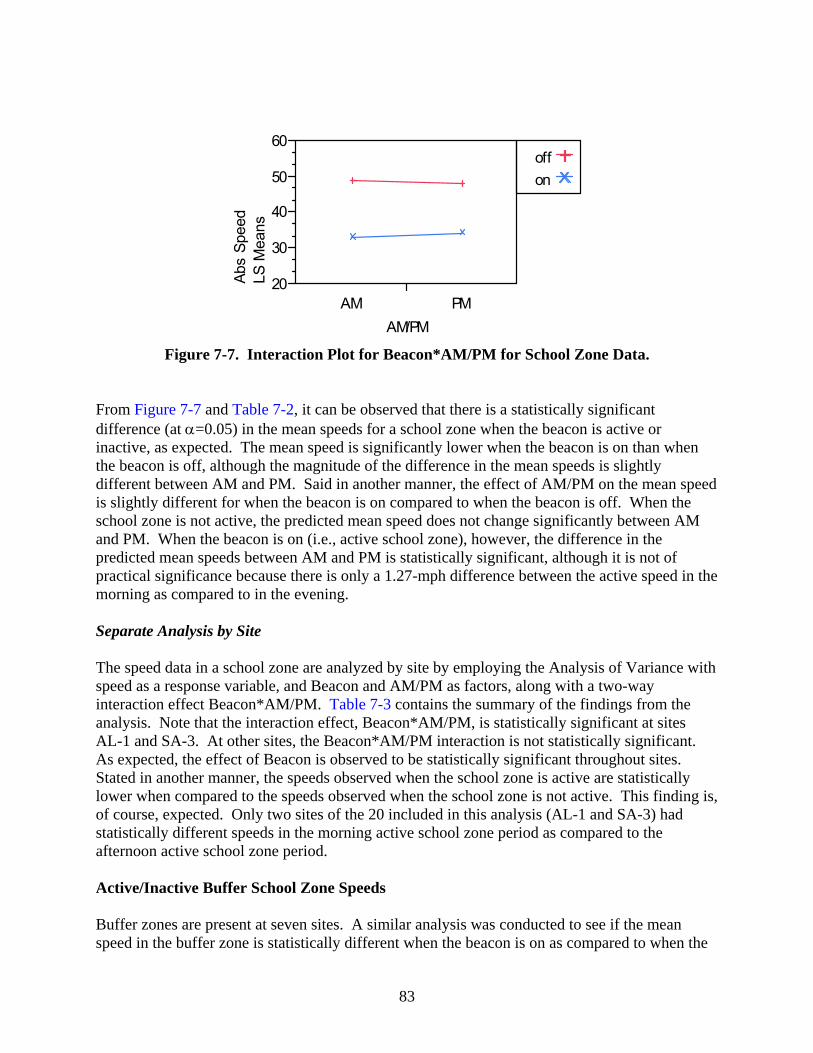
83
20
30
40
50
60
Abs
Spee
dLS
Mea
ns
AM PMAM/PM
offon
Figure 7-7. Interaction Plot for Beacon*AM/PM for School Zone Data.
From Figure 7-7 and Table 7-2, it can be observed that there is a statistically significant difference (at α=0.05) in the mean speeds for a school zone when the beacon is active or inactive, as expected. The mean speed is significantly lower when the beacon is on than when the beacon is off, although the magnitude of the difference in the mean speeds is slightly different between AM and PM. Said in another manner, the effect of AM/PM on the mean speed is slightly different for when the beacon is on compared to when the beacon is off. When the school zone is not active, the predicted mean speed does not change significantly between AM and PM. When the beacon is on (i.e., active school zone), however, the difference in the predicted mean speeds between AM and PM is statistically significant, although it is not of practical significance because there is only a 1.27-mph difference between the active speed in the morning as compared to in the evening. Separate Analysis by Site The speed data in a school zone are analyzed by site by employing the Analysis of Variance with speed as a response variable, and Beacon and AM/PM as factors, along with a two-way interaction effect Beacon*AM/PM. Table 7-3 contains the summary of the findings from the analysis. Note that the interaction effect, Beacon*AM/PM, is statistically significant at sites AL-1 and SA-3. At other sites, the Beacon*AM/PM interaction is not statistically significant. As expected, the effect of Beacon is observed to be statistically significant throughout sites. Stated in another manner, the speeds observed when the school zone is active are statistically lower when compared to the speeds observed when the school zone is not active. This finding is, of course, expected. Only two sites of the 20 included in this analysis (AL-1 and SA-3) had statistically different speeds in the morning active school zone period as compared to the afternoon active school zone period. Active/Inactive Buffer School Zone Speeds Buffer zones are present at seven sites. A similar analysis was conducted to see if the mean speed in the buffer zone is statistically different when the beacon is on as compared to when the

84
beacon is off. The variable AM/PM is also included in the analysis to see if the effect of Beacon changes for AM and PM (i.e., if there is any interaction effect between Beacon and AM/PM) or if there is any difference in the mean speeds for AM and PM (i.e., if there is a main effect of AM/PM). Depending on whether each individual site is of interest or not, the analysis can be carried out in two different ways: 1) considering all sites together; or 2) separate analysis by site. Analysis by Considering All Sites Together The variable site is treated as a blocking factor assuming that it has been used to provide replication over a selection of different conditions, and it is included in the analysis to account for site-to-site variability. The speed data in a buffer zone are analyzed by employing ANOVA with speed as a response variable, and Beacon, AM/PM, and Site as factors, along with a two-way interaction effect Beacon*AM/PM. Table 7-4 contains the analysis output obtained by ANOVA implemented in JMP.
Table 7-3. Analysis by Site for Testing Equality of the Mean Speeds in a School Zone Before and After the Beacon is Active.
Site # of obs Beacon*AM/PM significant?
Beacon significant?
AM or PM
Predicted mean speed
(mph) when
Beacon=Off
Predicted mean speed
(mph) when
Beacon=On
AL-1 54 Yes NA AM 54.47 35.71 PM 52.63 40.83
BR-1 122 No Yes Both 45.48 39.64 BR-2a 97 No Yes Both 50.28 33.52 BR-2b 97 NA Yes Both 53.14 34.30 BR-3 95 No Yes Both 45.38 34.23 CV-1 139 No Yes Both 50.89 33.45 EL-1 97 No Yes Both 42.29 32.25 EL-2 92 No Yes Both 48.79 30.39 EL-3 117 No Yes Both 38.99 32.04 JE-1 88 No Yes Both 56.52 35.73 LE-1 127 No Yes Both 53.70 38.37 RO-2 145 No Yes Both 52.62 38.29
SA-1(1) 15 NA Yes Both 35.99 17.41 SA-1(2) 197 No Yes Both 32.58 21.32
SA-3 177 Yes NA AM 41.35 22.19 PM 39.62 25.45
SA-4 97 No Yes Both 53.04 36.23 ST-1 111 No Yes Both 61.13 40.26 SW-1 80 No Yes Both 51.38 36.41 TE-1 14 NA NA Both NA1 34.29 WI-1 64 No Yes Both 51.38 36.36
1Note: For site TE-1, there were no speed measurements when the beacon was off.
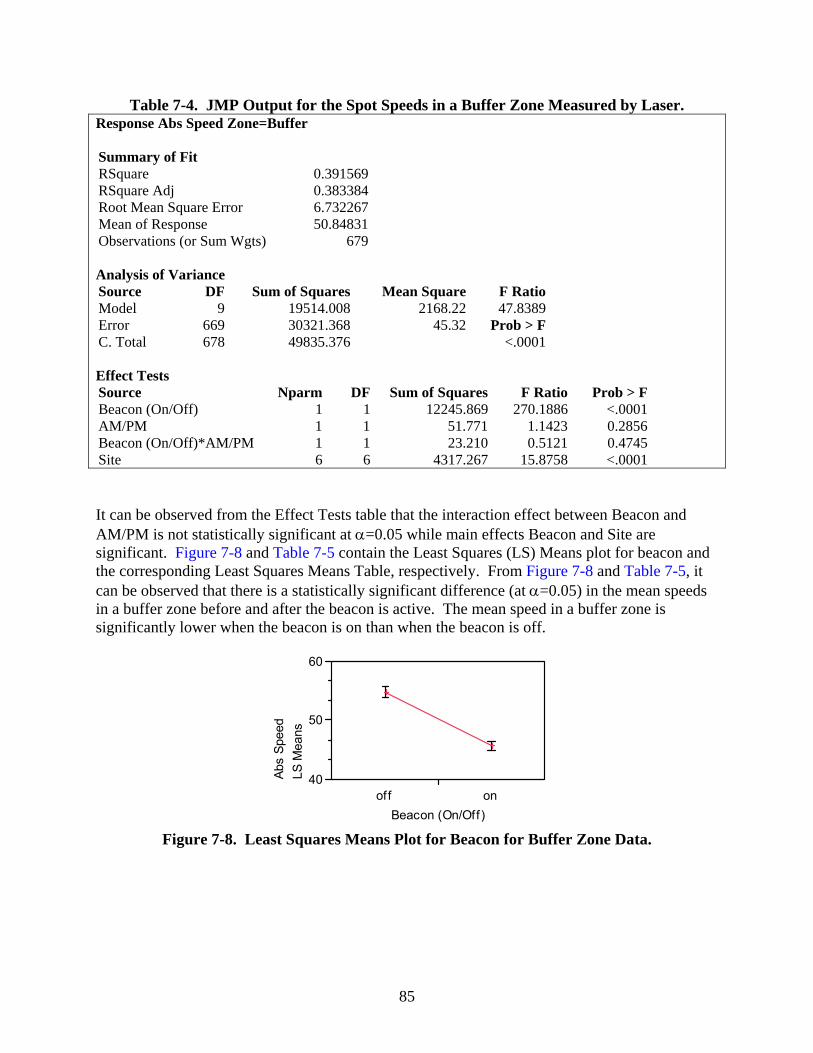
85
Table 7-4. JMP Output for the Spot Speeds in a Buffer Zone Measured by Laser. Response Abs Speed Zone=Buffer Summary of Fit RSquare 0.391569RSquare Adj 0.383384Root Mean Square Error 6.732267Mean of Response 50.84831Observations (or Sum Wgts) 679 Analysis of Variance Source DF Sum of Squares Mean Square F RatioModel 9 19514.008 2168.22 47.8389Error 669 30321.368 45.32 Prob > FC. Total 678 49835.376 <.0001 Effect Tests Source Nparm DF Sum of Squares F Ratio Prob > F Beacon (On/Off) 1 1 12245.869 270.1886 <.0001 AM/PM 1 1 51.771 1.1423 0.2856 Beacon (On/Off)*AM/PM 1 1 23.210 0.5121 0.4745 Site 6 6 4317.267 15.8758 <.0001
It can be observed from the Effect Tests table that the interaction effect between Beacon and AM/PM is not statistically significant at α=0.05 while main effects Beacon and Site are significant. Figure 7-8 and Table 7-5 contain the Least Squares (LS) Means plot for beacon and the corresponding Least Squares Means Table, respectively. From Figure 7-8 and Table 7-5, it can be observed that there is a statistically significant difference (at α=0.05) in the mean speeds in a buffer zone before and after the beacon is active. The mean speed in a buffer zone is significantly lower when the beacon is on than when the beacon is off.
40
50
60
Abs
Spee
dLS
Mea
ns
of f onBeacon (On/Off)
Figure 7-8. Least Squares Means Plot for Beacon for Buffer Zone Data.
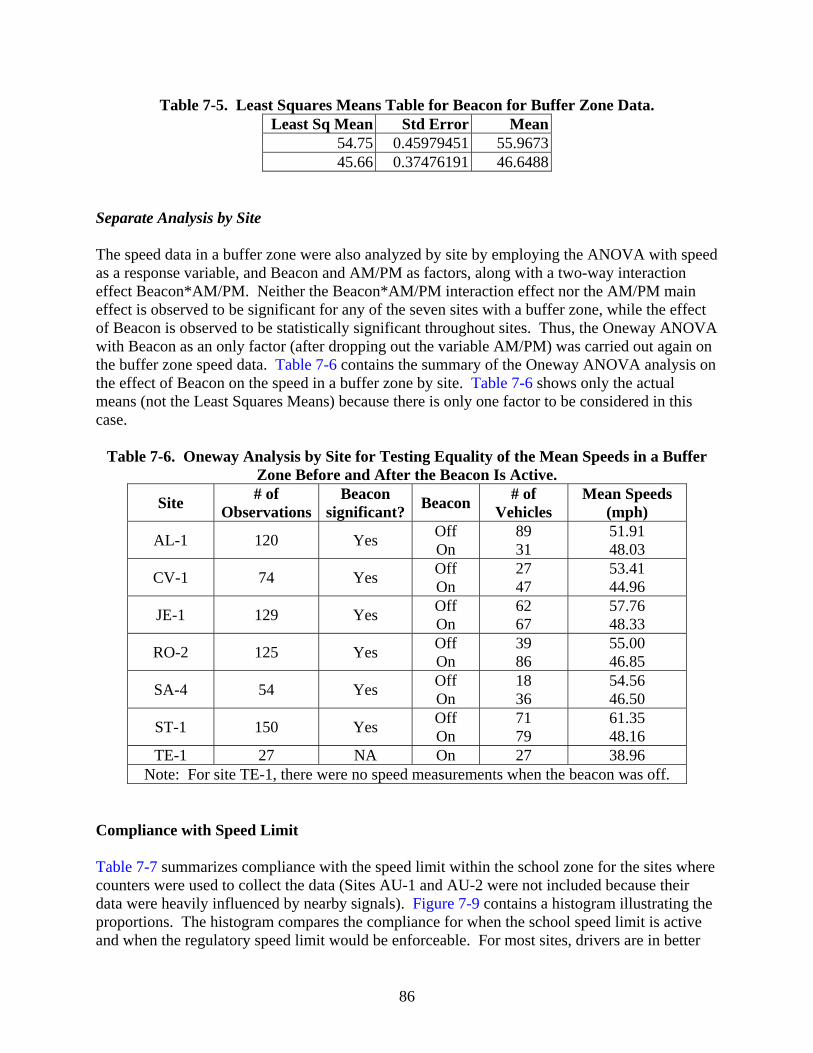
86
Table 7-5. Least Squares Means Table for Beacon for Buffer Zone Data. Least Sq Mean Std Error Mean
54.75 0.45979451 55.967345.66 0.37476191 46.6488
Separate Analysis by Site The speed data in a buffer zone were also analyzed by site by employing the ANOVA with speed as a response variable, and Beacon and AM/PM as factors, along with a two-way interaction effect Beacon*AM/PM. Neither the Beacon*AM/PM interaction effect nor the AM/PM main effect is observed to be significant for any of the seven sites with a buffer zone, while the effect of Beacon is observed to be statistically significant throughout sites. Thus, the Oneway ANOVA with Beacon as an only factor (after dropping out the variable AM/PM) was carried out again on the buffer zone speed data. Table 7-6 contains the summary of the Oneway ANOVA analysis on the effect of Beacon on the speed in a buffer zone by site. Table 7-6 shows only the actual means (not the Least Squares Means) because there is only one factor to be considered in this case.
Table 7-6. Oneway Analysis by Site for Testing Equality of the Mean Speeds in a Buffer Zone Before and After the Beacon Is Active.
Site # of Observations
Beacon significant? Beacon # of
Vehicles Mean Speeds
(mph)
AL-1 120 Yes Off On
89 31
51.91 48.03
CV-1 74 Yes Off On
27 47
53.41 44.96
JE-1 129 Yes Off On
62 67
57.76 48.33
RO-2 125 Yes Off On
39 86
55.00 46.85
SA-4 54 Yes Off On
18 36
54.56 46.50
ST-1 150 Yes Off On
71 79
61.35 48.16
TE-1 27 NA On 27 38.96 Note: For site TE-1, there were no speed measurements when the beacon was off.
Compliance with Speed Limit Table 7-7 summarizes compliance with the speed limit within the school zone for the sites where counters were used to collect the data (Sites AU-1 and AU-2 were not included because their data were heavily influenced by nearby signals). Figure 7-9 contains a histogram illustrating the proportions. The histogram compares the compliance for when the school speed limit is active and when the regulatory speed limit would be enforceable. For most sites, drivers are in better
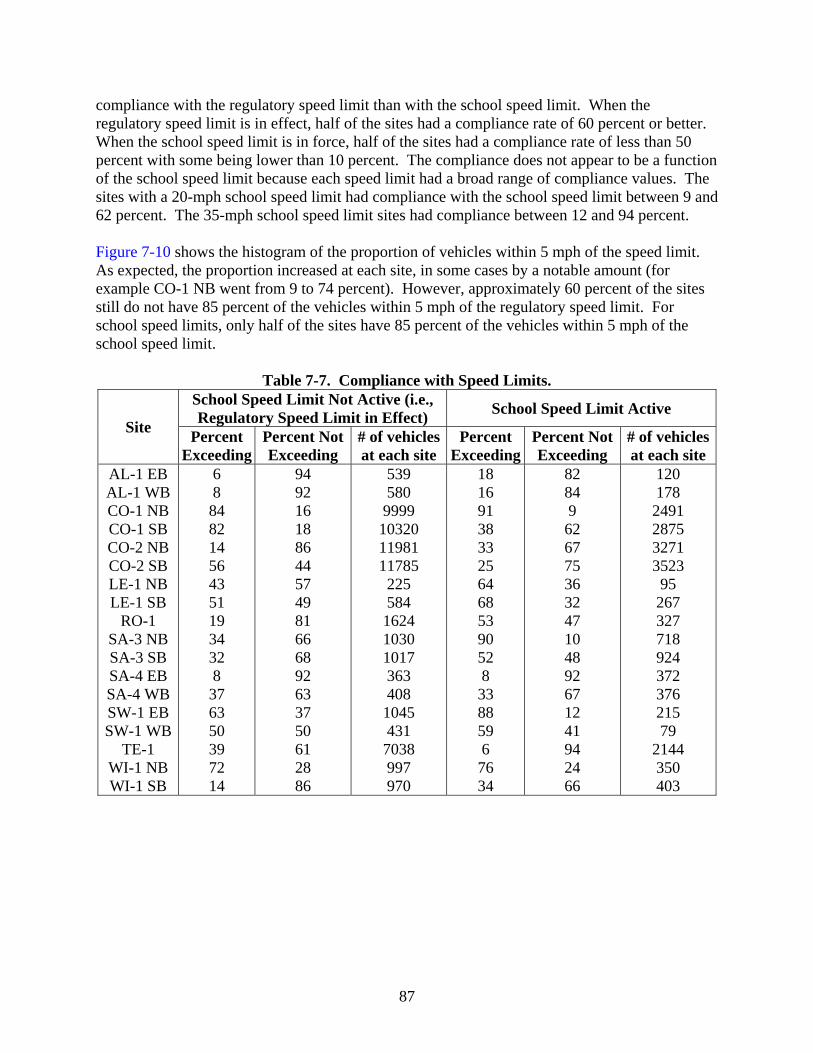
87
compliance with the regulatory speed limit than with the school speed limit. When the regulatory speed limit is in effect, half of the sites had a compliance rate of 60 percent or better. When the school speed limit is in force, half of the sites had a compliance rate of less than 50 percent with some being lower than 10 percent. The compliance does not appear to be a function of the school speed limit because each speed limit had a broad range of compliance values. The sites with a 20-mph school speed limit had compliance with the school speed limit between 9 and 62 percent. The 35-mph school speed limit sites had compliance between 12 and 94 percent. Figure 7-10 shows the histogram of the proportion of vehicles within 5 mph of the speed limit. As expected, the proportion increased at each site, in some cases by a notable amount (for example CO-1 NB went from 9 to 74 percent). However, approximately 60 percent of the sites still do not have 85 percent of the vehicles within 5 mph of the regulatory speed limit. For school speed limits, only half of the sites have 85 percent of the vehicles within 5 mph of the school speed limit.
Table 7-7. Compliance with Speed Limits.
Site
School Speed Limit Not Active (i.e., Regulatory Speed Limit in Effect) School Speed Limit Active
Percent Exceeding
Percent Not Exceeding
# of vehicles at each site
Percent Exceeding
Percent Not Exceeding
# of vehicles at each site
AL-1 EB AL-1 WB CO-1 NB CO-1 SB CO-2 NB CO-2 SB LE-1 NB LE-1 SB
RO-1 SA-3 NB SA-3 SB SA-4 EB SA-4 WB SW-1 EB SW-1 WB
TE-1 WI-1 NB WI-1 SB
6 8 84 82 14 56 43 51 19 34 32 8 37 63 50 39 72 14
94 92 16 18 86 44 57 49 81 66 68 92 63 37 50 61 28 86
539 580 9999 10320 11981 11785 225 584 1624 1030 1017 363 408 1045 431 7038 997 970
18 16 91 38 33 25 64 68 53 90 52 8 33 88 59 6 76 34
82 84 9 62 67 75 36 32 47 10 48 92 67 12 41 94 24 66
120 178 2491 2875 3271 3523 95 267 327 718 924 372 376 215 79
2144 350 403
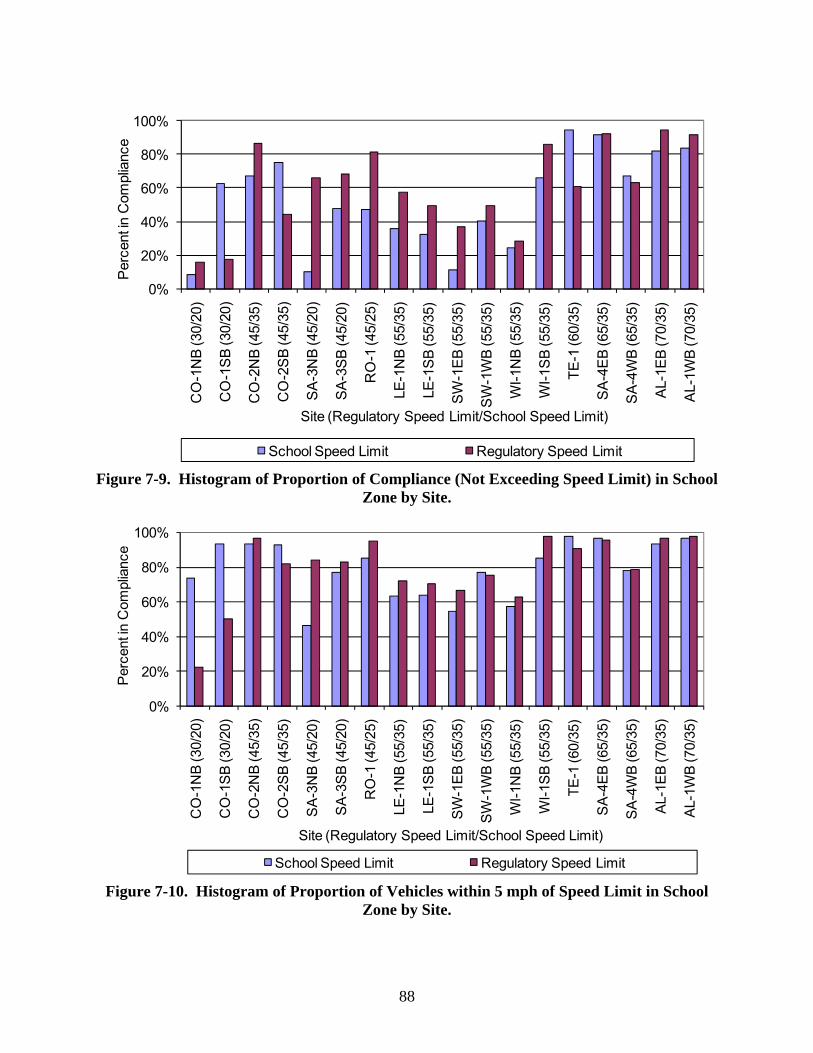
88
0%
20%
40%
60%
80%
100%
CO
-1N
B (3
0/20
)
CO
-1S
B (3
0/20
)
CO
-2N
B (4
5/35
)
CO
-2S
B (4
5/35
)
SA
-3N
B (4
5/20
)
SA
-3S
B (4
5/20
)
RO
-1 (4
5/25
)
LE-1
NB
(55/
35)
LE-1
SB
(55/
35)
SW
-1E
B (5
5/35
)
SW
-1W
B (5
5/35
)
WI-1
NB
(55/
35)
WI-1
SB
(55/
35)
TE-1
(60/
35)
SA
-4E
B (6
5/35
)
SA
-4W
B (6
5/35
)
AL-
1EB
(70/
35)
AL-
1WB
(70/
35)
Per
cent
in C
ompl
ianc
e
Site (Regulatory Speed Limit/School Speed Limit)
School Speed Limit Regulatory Speed Limit
Figure 7-9. Histogram of Proportion of Compliance (Not Exceeding Speed Limit) in School Zone by Site.
0%
20%
40%
60%
80%
100%
CO
-1N
B (3
0/20
)
CO
-1S
B (3
0/20
)
CO
-2N
B (4
5/35
)
CO
-2S
B (4
5/35
)
SA
-3N
B (4
5/20
)
SA
-3S
B (4
5/20
)
RO
-1 (4
5/25
)
LE-1
NB
(55/
35)
LE-1
SB
(55/
35)
SW
-1E
B (5
5/35
)
SW-1
WB
(55/
35)
WI-1
NB
(55/
35)
WI-1
SB
(55/
35)
TE-1
(60/
35)
SA
-4E
B (6
5/35
)
SA
-4W
B (6
5/35
)
AL-1
EB
(70/
35)
AL-1
WB
(70/
35)
Per
cent
in C
ompl
ianc
e
Site (Regulatory Speed Limit/School Speed Limit)
School Speed Limit Regulatory Speed Limit
Figure 7-10. Histogram of Proportion of Vehicles within 5 mph of Speed Limit in School Zone by Site.

89
Compliance with School Buffer Speed Limit Figure 7-11 contains a histogram illustrating the proportion of vehicles not exceeding the speed limit within the buffer zone for the three buffer zone sites where counters were used to collect data. All of the sites had a compliance rate of at least 80 percent when the buffer speed limit was active. When the buffer speed limit was not active (i.e., regulatory speed limit was in effect), the three sites had compliance rates from 72 to 94 percent. Table 7-8 summarizes the proportions for each site.
0%
10%
20%
30%
40%
50%
60%
70%
80%
90%
100%
AL-1 SA-4 TE-1Site Number
Per
cent
in C
ompl
ianc
e (%
) .
Buffer Speed Limit Regulatory Speed Limit
Figure 7-11. Histogram of Proportion of Compliance (Not Exceeding Speed Limit) in Buffer Zone by Site.
Table 7-8. Compliance Rates for Buffer Speed Limit When Buffer Zone is Active.
Site Buffer Speed Limit Active Buffer Speed Limit Not Active (i.e.,
Regulatory Speed Limit in Effect) Percent Not Exceeding
Percent Exceeding
# of vehicles at each site
Percent Not Exceeding
Percent Exceeding
# of vehicles at each site
AL-1 86% 14% 298 94% 6% 1119 SA-4 82% 18% 748 79% 21% 771 TE-1 88% 12% 3640 72% 28% 11413

90
VARIABLES INFLUENCING SPEEDS IN SCHOOL ZONES The objective of this effort was to determine how school-zone characteristics affect vehicle speeds when the beacon is on. Table 7-9 lists the variables considered in the analysis, along with the name used for the variable in parentheses. The variables “Access Density” and “School Driveway Density” were obtained by the following equations:
• Access Density = 5280×(Num Access Pts) / (SSL Zone Len) • School Driveway Density = 5280×(Num Driveways) / (SSL Zone Len)
Table 7-9. Variables Considered in Analyses.
School Variables Car Variables • School Speed Limit (SSL) • Area (Area) • Number of Lanes (Num Lanes) • Length of School Speed Limit Zone (SSL Zone Len)
or Log SSL Zone Len • School Size • Type of School (Type) • Access Density (Num Access Pts) • School Driveway Density (Num Driveways)
• Time to start of school or dismissal of school (Rel Min School)
• Distance from beginning of school speed limit zone (Rel Dist SZ)
School Variables Removed From Analysis Car Variables Removed • Parking Lane • Buffer Zone Present • Crosswalk • Sidewalk • Beacon Type
• None
Note: Names given in parentheses are the actual names of the variables used in the database. Variables Affecting Speeds in an Active School Zone The question of how variables affect speeds within an active school zone was answered in three ways based on three different datasets.
• Average Speeds—used the average speeds for vehicles within a school zone when beacon is on obtained from 30 datasets (laser data sites and counter data sites subdivided by direction of travel, when available), n (number of observations)=30.
• Spot-Speed Data—used the individual vehicle speeds for vehicles within a school zone at a spot location when beacon is on, n=24,829.
• Speed-Distance Data—used the individual vehicle speeds along the entire active school zone distance measured when beacon is on, n=59,966.
Analysis Based on Average Speeds In this analysis, the dependent variable is the average speed for each site obtained as the average of the speeds measured in a school zone when the beacon is on. The variables of interest are the
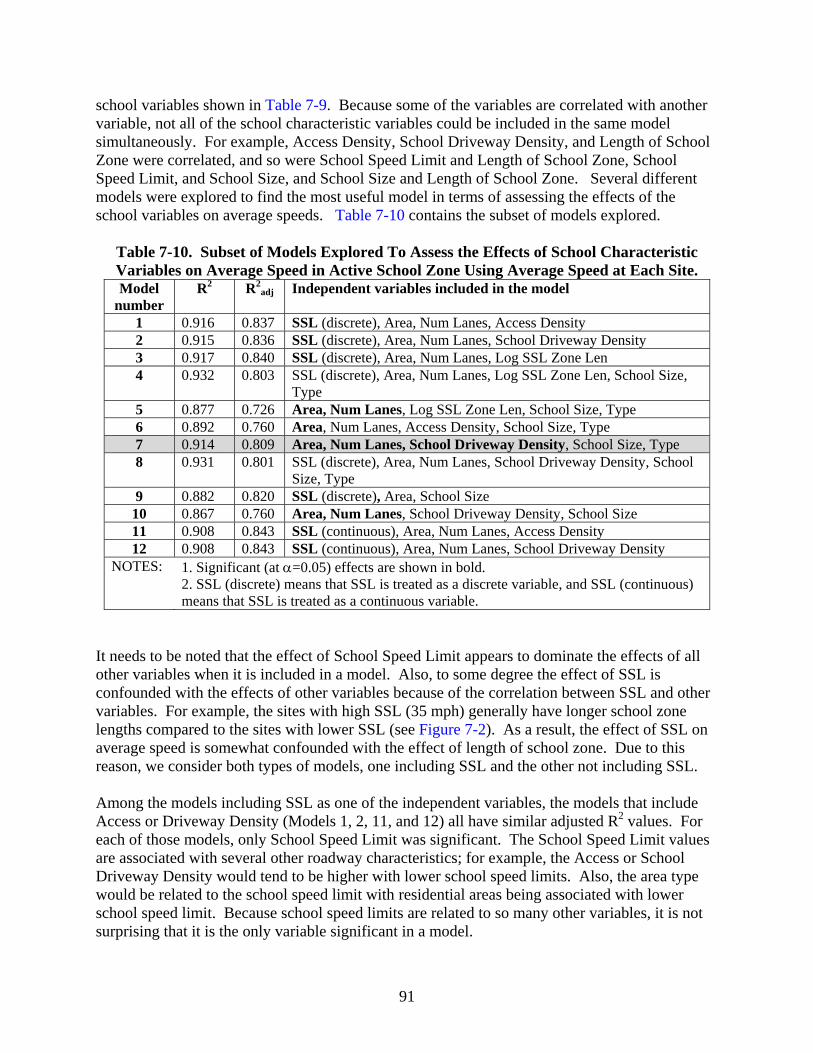
91
school variables shown in Table 7-9. Because some of the variables are correlated with another variable, not all of the school characteristic variables could be included in the same model simultaneously. For example, Access Density, School Driveway Density, and Length of School Zone were correlated, and so were School Speed Limit and Length of School Zone, School Speed Limit, and School Size, and School Size and Length of School Zone. Several different models were explored to find the most useful model in terms of assessing the effects of the school variables on average speeds. Table 7-10 contains the subset of models explored.
Table 7-10. Subset of Models Explored To Assess the Effects of School Characteristic Variables on Average Speed in Active School Zone Using Average Speed at Each Site. Model
number R2 R2
adj Independent variables included in the model
1 0.916 0.837 SSL (discrete), Area, Num Lanes, Access Density 2 0.915 0.836 SSL (discrete), Area, Num Lanes, School Driveway Density 3 0.917 0.840 SSL (discrete), Area, Num Lanes, Log SSL Zone Len 4 0.932 0.803 SSL (discrete), Area, Num Lanes, Log SSL Zone Len, School Size,
Type 5 0.877 0.726 Area, Num Lanes, Log SSL Zone Len, School Size, Type 6 0.892 0.760 Area, Num Lanes, Access Density, School Size, Type 7 0.914 0.809 Area, Num Lanes, School Driveway Density, School Size, Type 8 0.931 0.801 SSL (discrete), Area, Num Lanes, School Driveway Density, School
Size, Type 9 0.882 0.820 SSL (discrete), Area, School Size
10 0.867 0.760 Area, Num Lanes, School Driveway Density, School Size 11 0.908 0.843 SSL (continuous), Area, Num Lanes, Access Density 12 0.908 0.843 SSL (continuous), Area, Num Lanes, School Driveway Density
NOTES: 1. Significant (at α=0.05) effects are shown in bold. 2. SSL (discrete) means that SSL is treated as a discrete variable, and SSL (continuous) means that SSL is treated as a continuous variable.
It needs to be noted that the effect of School Speed Limit appears to dominate the effects of all other variables when it is included in a model. Also, to some degree the effect of SSL is confounded with the effects of other variables because of the correlation between SSL and other variables. For example, the sites with high SSL (35 mph) generally have longer school zone lengths compared to the sites with lower SSL (see Figure 7-2). As a result, the effect of SSL on average speed is somewhat confounded with the effect of length of school zone. Due to this reason, we consider both types of models, one including SSL and the other not including SSL. Among the models including SSL as one of the independent variables, the models that include Access or Driveway Density (Models 1, 2, 11, and 12) all have similar adjusted R2 values. For each of those models, only School Speed Limit was significant. The School Speed Limit values are associated with several other roadway characteristics; for example, the Access or School Driveway Density would tend to be higher with lower school speed limits. Also, the area type would be related to the school speed limit with residential areas being associated with lower school speed limit. Because school speed limits are related to so many other variables, it is not surprising that it is the only variable significant in a model.
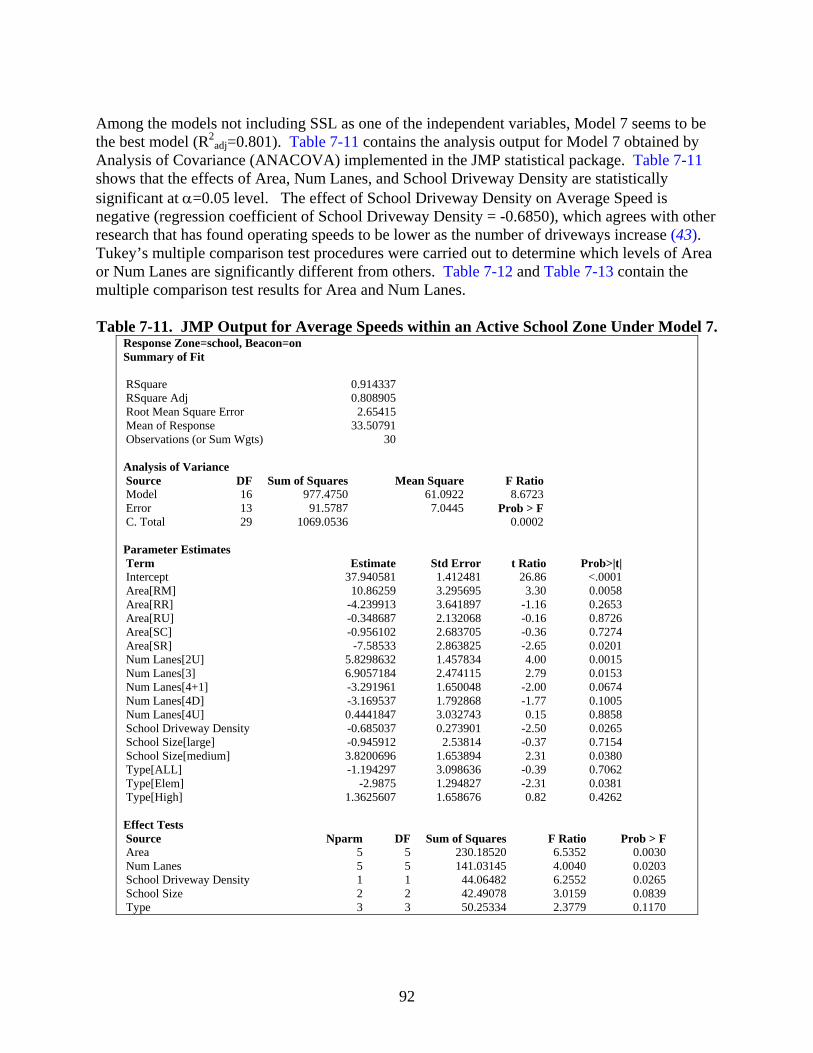
92
Among the models not including SSL as one of the independent variables, Model 7 seems to be the best model (R2
adj=0.801). Table 7-11 contains the analysis output for Model 7 obtained by Analysis of Covariance (ANACOVA) implemented in the JMP statistical package. Table 7-11 shows that the effects of Area, Num Lanes, and School Driveway Density are statistically significant at α=0.05 level. The effect of School Driveway Density on Average Speed is negative (regression coefficient of School Driveway Density = -0.6850), which agrees with other research that has found operating speeds to be lower as the number of driveways increase (43). Tukey’s multiple comparison test procedures were carried out to determine which levels of Area or Num Lanes are significantly different from others. Table 7-12 and Table 7-13 contain the multiple comparison test results for Area and Num Lanes. Table 7-11. JMP Output for Average Speeds within an Active School Zone Under Model 7.
Response Zone=school, Beacon=on Summary of Fit RSquare 0.914337RSquare Adj 0.808905Root Mean Square Error 2.65415Mean of Response 33.50791Observations (or Sum Wgts) 30 Analysis of Variance Source DF Sum of Squares Mean Square F RatioModel 16 977.4750 61.0922 8.6723Error 13 91.5787 7.0445 Prob > FC. Total 29 1069.0536 0.0002 Parameter Estimates Term Estimate Std Error t Ratio Prob>|t| Intercept 37.940581 1.412481 26.86 <.0001 Area[RM] 10.86259 3.295695 3.30 0.0058 Area[RR] -4.239913 3.641897 -1.16 0.2653 Area[RU] -0.348687 2.132068 -0.16 0.8726 Area[SC] -0.956102 2.683705 -0.36 0.7274 Area[SR] -7.58533 2.863825 -2.65 0.0201 Num Lanes[2U] 5.8298632 1.457834 4.00 0.0015 Num Lanes[3] 6.9057184 2.474115 2.79 0.0153 Num Lanes[4+1] -3.291961 1.650048 -2.00 0.0674 Num Lanes[4D] -3.169537 1.792868 -1.77 0.1005 Num Lanes[4U] 0.4441847 3.032743 0.15 0.8858 School Driveway Density -0.685037 0.273901 -2.50 0.0265 School Size[large] -0.945912 2.53814 -0.37 0.7154 School Size[medium] 3.8200696 1.653894 2.31 0.0380 Type[ALL] -1.194297 3.098636 -0.39 0.7062 Type[Elem] -2.9875 1.294827 -2.31 0.0381 Type[High] 1.3625607 1.658676 0.82 0.4262 Effect Tests Source Nparm DF Sum of Squares F Ratio Prob > F Area 5 5 230.18520 6.5352 0.0030 Num Lanes 5 5 141.03145 4.0040 0.0203 School Driveway Density 1 1 44.06482 6.2552 0.0265 School Size 2 2 42.49078 3.0159 0.0839 Type 3 3 50.25334 2.3779 0.1170
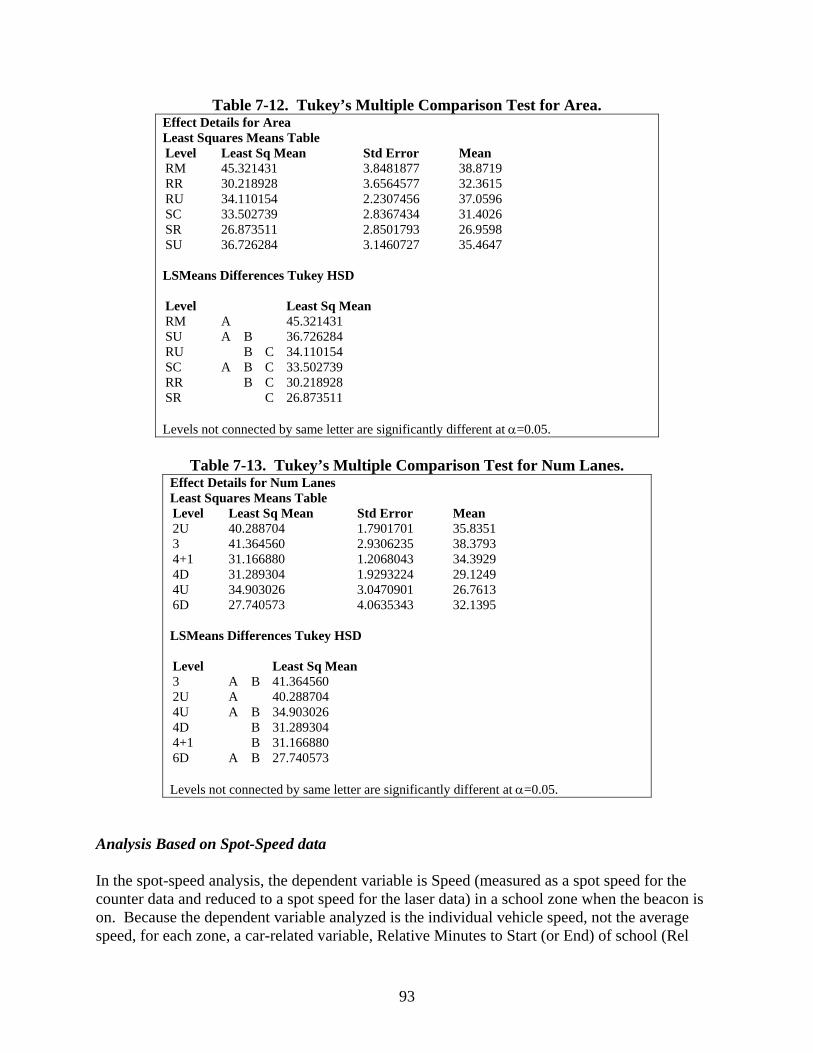
93
Table 7-12. Tukey’s Multiple Comparison Test for Area. Effect Details for Area Least Squares Means Table Level Least Sq Mean Std Error Mean RM 45.321431 3.8481877 38.8719 RR 30.218928 3.6564577 32.3615 RU 34.110154 2.2307456 37.0596 SC 33.502739 2.8367434 31.4026 SR 26.873511 2.8501793 26.9598 SU 36.726284 3.1460727 35.4647 LSMeans Differences Tukey HSD Level Least Sq Mean RM A 45.321431 SU A B 36.726284 RU B C 34.110154 SC A B C 33.502739 RR B C 30.218928 SR C 26.873511 Levels not connected by same letter are significantly different at α=0.05.
Table 7-13. Tukey’s Multiple Comparison Test for Num Lanes.
Effect Details for Num Lanes Least Squares Means Table Level Least Sq Mean Std Error Mean 2U 40.288704 1.7901701 35.8351 3 41.364560 2.9306235 38.3793 4+1 31.166880 1.2068043 34.3929 4D 31.289304 1.9293224 29.1249 4U 34.903026 3.0470901 26.7613 6D 27.740573 4.0635343 32.1395 LSMeans Differences Tukey HSD Level Least Sq Mean 3 A B 41.364560 2U A 40.288704 4U A B 34.903026 4D B 31.289304 4+1 B 31.166880 6D A B 27.740573 Levels not connected by same letter are significantly different at α=0.05.
Analysis Based on Spot-Speed data In the spot-speed analysis, the dependent variable is Speed (measured as a spot speed for the counter data and reduced to a spot speed for the laser data) in a school zone when the beacon is on. Because the dependent variable analyzed is the individual vehicle speed, not the average speed, for each zone, a car-related variable, Relative Minutes to Start (or End) of school (Rel

94
Min School), could also be included as an additional independent variable in the analysis. The other variables considered for this analysis were Area, Num Lanes, and School Size. Researchers were also interested in finding whether the effect of Rel Min School is different for the four time periods corresponding to the time just prior to the start of school (AM Before), the time just after school opens (AM During), the time just before school ends (PM During), and the time just after school is released (PM After). There are two experimental units in this dataset, Sites (denoted as Site Num) and Cars. Multiple speed measurements (one speed measurement from a vehicle) ranging from 3 measurements to 10,170 were obtained from the 30 datasets. It can be expected that the speed measurements from the same site will be more correlated (due to common site characteristics) than the speed measurements from other sites. To cope with this within-site correlation, researchers analyzed the data by employing a split-plot model, treating Site Num as a whole plot and each vehicle as a split plot. The school characteristic variables Area, Num Lanes, and School Size serve as whole-plot factors, and the variable Rel Min School serves as a split-plot factor. Sites were treated as a random effect (nested within Area, Num Lanes, and School Size) because researchers were interested in the characteristic variables describing the sites, such as Area, Num Lanes, and School Size, rather than the sites themselves. Table 7-14 summarizes the findings from the analyses. For each period, all four variables included in the model (Area, Num Lanes, School Size, and Rel Min School) are statistically significant at α=0.05. The effect of Rel Min School varies depending upon the time period. Prior to the start of school or the end of school, the effect is negative, meaning that speeds decrease for those times closer to the start or end of school. Following the start of school (or the end of school), the effect of Rel Min School is positive, meaning that speeds increase as time increases. The effects are more pronounced in the morning periods, as can be seen in the magnitude of the Rel Min School coefficients. Figure 7-12 illustrates the findings. A school speed limit of 35 mph was selected for the illustration. The time period selected was 45 minutes before the start of school and 15 minutes after the start of school (coded as 100 on the x-axis of the graph). The end of school shows 15 minutes before the ending bell and 45 minutes after the ending bell (coded as 200 on the x-axis of the graph). Drivers are traveling at slightly higher speeds 45 minutes before school as compared to 45 minutes after school.
Table 7-14. Results of Spot Speed Analysis. AM Before AM During PM During PM After
R Square Adj 0.4273 0.4563 0.2620 0.2350
Significant Variables
Area Num Lanes School Size
Rel Min School
Area Num Lanes School Size
Rel Min School
Area Num Lanes School Size
Rel Min School
Area Num Lanes School Size
Rel Min School Rel Min School Coefficient -0.0515 0.0448 -0.0189 0.0384 Time (min) away from start or end of school resulting in
1 mph speed difference 19 22 53 26
Time (min) away from start or end of school resulting in
2 mph speed difference 39 45 106 52

95
29
30
31
32
33
50 100 150 200 250 300
Time Relative to Start or End of School (100=start of school, 200=end of school)
Pre
dict
ed S
peed
(mph
)
AM Before AM During PM During PM After
Figure 7-12. Illustration of Predicted Speed by Time Relative to Start or End of School
(Example Uses 30 mph as Minimum Speed). While the Rel Min School variable is significant, is the finding of practical value? Table 7-14 also lists the number of minutes away from the start or end of school when the estimated speed would represent a practical difference of 1 mph. If 1 mph is set as the practical difference (1 mph represents the typical accuracy of a laser gun), then a 1-mph speed difference would be experienced 19 minutes before the start of school or 22 minutes after the start of school. Stated in another manner, a morning active period of 41 minutes (19 minutes + 22 minutes) would result in the speeds being within 1 mph of the lowest speed during the morning active school zone. The effects of time for the afternoon period were not as intense. Speeds within a 1-mph range would be experienced for 53 minutes before the end of school to 26 minutes after the end of school. These findings do not address the magnitude of speed during the active school zone period—only the change in speeds as time changes. A key finding from this evaluation is that speeds are higher for greater time increments from the start or end of school. Analysis Based on Speed-Distance Data Researchers were interested in the effect of the distance from the start of the school zone (Rel Dist SZ) on the speeds within a school zone when the beacon was on. Therefore, the original laser data were used so that Rel Dist SZ could be included in the analysis. Unlike the spot-speed data, there were multiple speed measurements for a single vehicle for the laser data because the speed was measured continuously over a range of distances. Those speed measurements corresponding to the same vehicle were, in general, highly correlated, and this within-vehicle correlation needed to be incorporated into the analysis in addition to the within-site correlation mentioned earlier in the analysis of the spot-speed data. A split-split-plot model treating Site Num as a whole plot, Vehicle Num as a split plot, and an individual speed measurement from a

96
vehicle as a split-split plot can be employed for analyzing the original 59,966 speed measurements. The school characteristic variables Area, Num Lanes, and School Size serve as whole-plot factors, and the variables Period and Rel Dist SZ serve as split-plot factor and a split-split-plot factor, respectively. Both Sites and Vehicles were treated as random effects (Sites are nested within Area, Num Lanes, and School Size and Vehicles are nested within sites) because neither Sites nor Vehicles themselves were of interest. Table 7-15 contains the analysis output for speeds under split-split-plot model obtained by the restricted maximum likelihood method implemented in JMP. It can be observed from the table (Fixed Effect Tests) that the effects of Area, Num Lanes, Rel Dist SZ, and Period are statistically significant at α=0.05. The effect of Rel Dist SZ on speed is positive (the regression coefficient = 0.0019), and AM Before leads to the lowest predicted speed compared to other periods (see Parameter Estimates). Table 7-16 also presents Tukey’s multiple comparison test results for the variables Area, Num Lanes, and Period. Table 7-15. JMP Output for Speeds within a School Zone When Beacon Is on Under Split-
Split-Plot Model Based on the Laser Only Data. Response Abs Speed Summary of Fit RSquare 0.935773 RSquare Adj 0.935756 Root Mean Square Error 2.214065 Mean of Response 33.18317 Observations (or Sum Wgts) 59966 Parameter Estimates Term Estimate Std Error DFDen t Ratio Prob>|t| Intercept 33.252003 0.788125 6.981 42.19 <.0001 Area[RM] 10.240713 3.011395 7.67 3.40 0.0100 Area[RR] -3.107887 2.010892 6.784 -1.55 0.1675 Area[RU] 1.0670173 1.487497 7.293 0.72 0.4955 Area[SC] -0.276662 2.209911 6.909 -0.13 0.9039 Area[SR] -9.031197 2.079765 7.237 -4.34 0.0031 Num Lanes[2U] 5.9510841 1.329783 7.051 4.48 0.0028 Num Lanes[3] 7.7047974 1.943221 6.776 3.96 0.0058 Num Lanes[4+1] -2.642938 1.349477 7.115 -1.96 0.0904 Num Lanes[4D] -3.472281 1.810946 6.855 -1.92 0.0976 Num Lanes[4U] -5.357786 1.955553 6.462 -2.74 0.0313 School Size[large] 0.6185145 1.86993 8.084 0.33 0.7492 School Size[medium] 2.4073414 1.228386 7.031 1.96 0.0907 Rel Dist SZ 0.0018583 3.038e-5 58396 61.17 0.0000 Period[AM Before] -1.476092 0.243909 1793 -6.05 <.0001 Period[AM During] 0.522669 0.295544 1779 1.77 0.0771 Period[PM After] -0.363417 0.215216 3114 -1.69 0.0914 Fixed Effect Tests Source Nparm DF DFDen F Ratio Prob > F Area 5 5 6.791 9.4032 0.0057 Num Lanes 5 5 6.685 6.2492 0.0179 School Size 2 2 7.509 1.9201 0.2121 Rel Dist SZ 1 1 58396 3742.376 0.0000 Period 3 3 2592 21.5536 <.0001
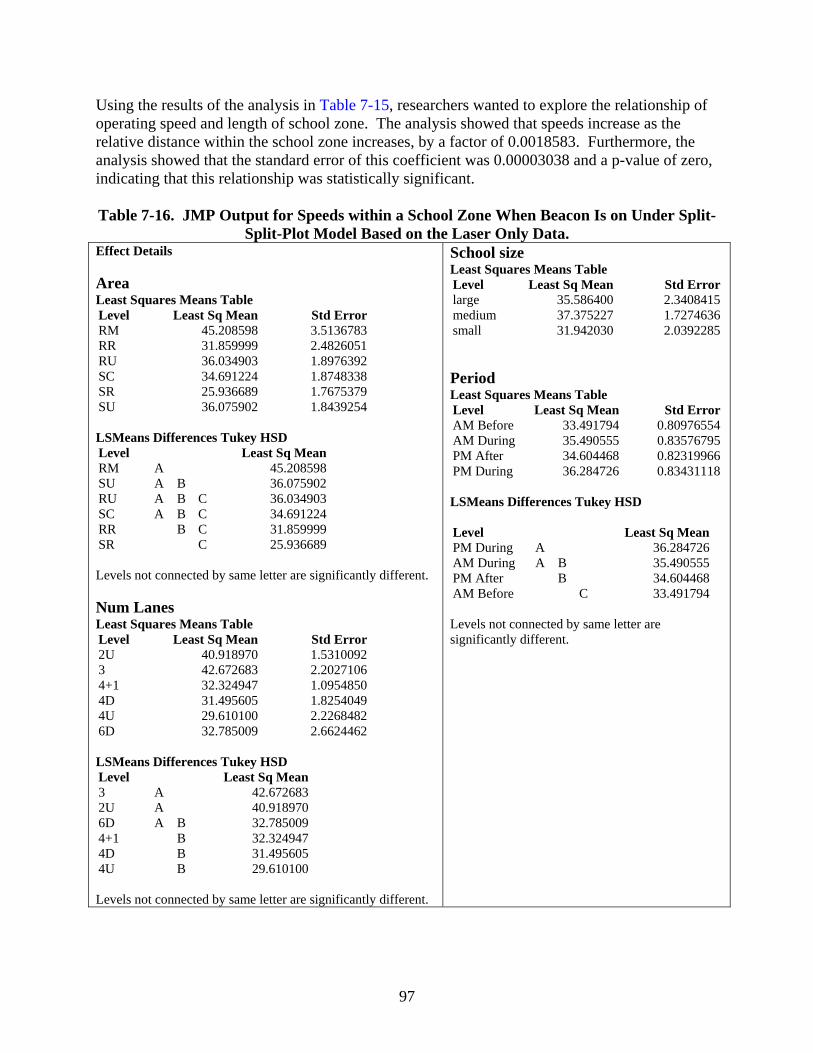
97
Using the results of the analysis in Table 7-15, researchers wanted to explore the relationship of operating speed and length of school zone. The analysis showed that speeds increase as the relative distance within the school zone increases, by a factor of 0.0018583. Furthermore, the analysis showed that the standard error of this coefficient was 0.00003038 and a p-value of zero, indicating that this relationship was statistically significant.
Table 7-16. JMP Output for Speeds within a School Zone When Beacon Is on Under Split-
Split-Plot Model Based on the Laser Only Data. Effect Details Area Least Squares Means Table Level Least Sq Mean Std ErrorRM 45.208598 3.5136783RR 31.859999 2.4826051RU 36.034903 1.8976392SC 34.691224 1.8748338SR 25.936689 1.7675379SU 36.075902 1.8439254 LSMeans Differences Tukey HSD Level Least Sq Mean RM A 45.208598 SU A B 36.075902 RU A B C 36.034903 SC A B C 34.691224 RR B C 31.859999 SR C 25.936689 Levels not connected by same letter are significantly different. Num Lanes Least Squares Means Table Level Least Sq Mean Std Error2U 40.918970 1.53100923 42.672683 2.20271064+1 32.324947 1.09548504D 31.495605 1.82540494U 29.610100 2.22684826D 32.785009 2.6624462 LSMeans Differences Tukey HSD Level Least Sq Mean 3 A 42.672683 2U A 40.918970 6D A B 32.785009 4+1 B 32.324947 4D B 31.495605 4U B 29.610100 Levels not connected by same letter are significantly different.
School size Least Squares Means Table Level Least Sq Mean Std Errorlarge 35.586400 2.3408415medium 37.375227 1.7274636small 31.942030 2.0392285 Period Least Squares Means Table Level Least Sq Mean Std ErrorAM Before 33.491794 0.80976554AM During 35.490555 0.83576795PM After 34.604468 0.82319966PM During 36.284726 0.83431118 LSMeans Differences Tukey HSD Level Least Sq MeanPM During A 36.284726AM During A B 35.490555PM After B 34.604468AM Before C 33.491794 Levels not connected by same letter are significantly different.
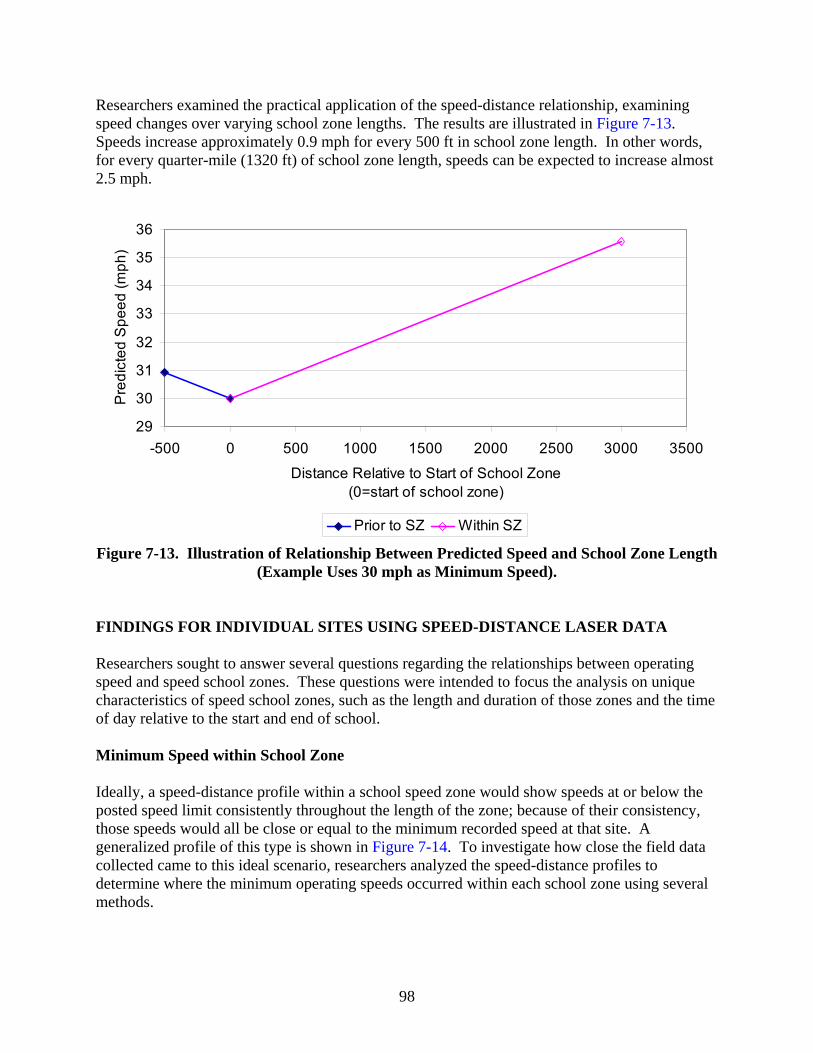
98
Researchers examined the practical application of the speed-distance relationship, examining speed changes over varying school zone lengths. The results are illustrated in Figure 7-13. Speeds increase approximately 0.9 mph for every 500 ft in school zone length. In other words, for every quarter-mile (1320 ft) of school zone length, speeds can be expected to increase almost 2.5 mph.
29
30
31
32
33
34
35
36
-500 0 500 1000 1500 2000 2500 3000 3500
Distance Relative to Start of School Zone(0=start of school zone)
Pre
dict
ed S
peed
(mph
)
Prior to SZ Within SZ
Figure 7-13. Illustration of Relationship Between Predicted Speed and School Zone Length (Example Uses 30 mph as Minimum Speed).
FINDINGS FOR INDIVIDUAL SITES USING SPEED-DISTANCE LASER DATA Researchers sought to answer several questions regarding the relationships between operating speed and speed school zones. These questions were intended to focus the analysis on unique characteristics of speed school zones, such as the length and duration of those zones and the time of day relative to the start and end of school. Minimum Speed within School Zone Ideally, a speed-distance profile within a school speed zone would show speeds at or below the posted speed limit consistently throughout the length of the zone; because of their consistency, those speeds would all be close or equal to the minimum recorded speed at that site. A generalized profile of this type is shown in Figure 7-14. To investigate how close the field data collected came to this ideal scenario, researchers analyzed the speed-distance profiles to determine where the minimum operating speeds occurred within each school zone using several methods.
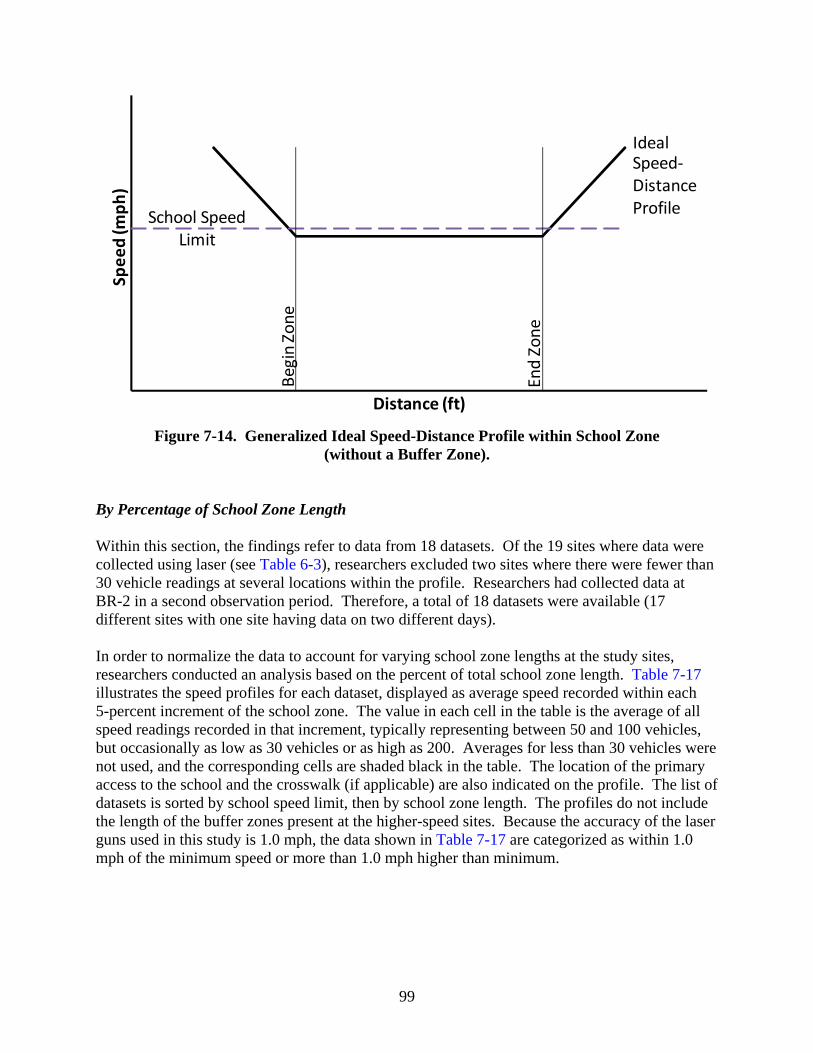
99
Ideal
School Speed Limit
Begin Zone
End Zone
Spee
d (m
ph)
Distance (ft)
Speed‐DistanceProfile
Figure 7-14. Generalized Ideal Speed-Distance Profile within School Zone
(without a Buffer Zone). By Percentage of School Zone Length Within this section, the findings refer to data from 18 datasets. Of the 19 sites where data were collected using laser (see Table 6-3), researchers excluded two sites where there were fewer than 30 vehicle readings at several locations within the profile. Researchers had collected data at BR-2 in a second observation period. Therefore, a total of 18 datasets were available (17 different sites with one site having data on two different days). In order to normalize the data to account for varying school zone lengths at the study sites, researchers conducted an analysis based on the percent of total school zone length. Table 7-17 illustrates the speed profiles for each dataset, displayed as average speed recorded within each 5-percent increment of the school zone. The value in each cell in the table is the average of all speed readings recorded in that increment, typically representing between 50 and 100 vehicles, but occasionally as low as 30 vehicles or as high as 200. Averages for less than 30 vehicles were not used, and the corresponding cells are shaded black in the table. The location of the primary access to the school and the crosswalk (if applicable) are also indicated on the profile. The list of datasets is sorted by school speed limit, then by school zone length. The profiles do not include the length of the buffer zones present at the higher-speed sites. Because the accuracy of the laser guns used in this study is 1.0 mph, the data shown in Table 7-17 are categorized as within 1.0 mph of the minimum speed or more than 1.0 mph higher than minimum.

100
Table 7-17. Average Speed Profiles by Percent of Distance through Reduced-Speed School Zone (Active School Zone).
Site Num
Percentage of Distance Through School Zone 0 5 10 15 20 25 30 35 40 45 50 55 60 65 70 75 80 85 90 95
SA-2 20.9 20.7 20.7 20.4 20.1 20.5 20.5 SA-3 22.2 22.4 22.2 22.3 22.0 22.3 22.4 22.5 22.7 22.8 22.3 22.4 22.7 23.2SA-1 21.7 20.8 19.8 20.0 19.6 19.0 18.9 18.6 18.6 18.8 18.9 19.5 EL-3 29.4 29.6 28.8 29.9 29.7 29.8 30.2 30.1 30.0 29.7 30.5 30.0 30.2 30.7 30.3 30.6 30.2 31.1 31.2 31.8EL-2 30.2 30.1 30.8 28.8 28.6 29.3 29.6 30.1 30.3 31.0 31.2 31.7 31.5 30.9 30.5 30.9 30.7 30.2EL-1 29.3 29.4 29.9 29.3 30.0 30.5 31.1 30.9 31.6 31.8 32.2 31.8 32.2 32.1 32.4 32.3 31.8 33.1 33.2SA-4 35.8 34.5 34.2 34.7 35.3 35.7 37.4 LE-1 37.6 37.3 37.4 36.7 36.7 36.7 36.6 37.2 36.4 36.7 37.3 37.3 38.8 38.2 41.6
BR-2a 33.9 33.3 33.4 33.3 33.4 33.3 33.3 33.6 34.1 34.2 34.5 35.2 35.1 35.3 36.3 36.7 36.3 36.9 37.0 38.0BR-2b 33.2 33.4 33.3 33.5 33.7 34.0 34.0 34.3 34.4 34.3 34.1 34.9 35.6 35.5 35.9 35.9 35.8 BR-1 41.2 40.5 40.4 39.1 38.9 38.4 38.2 39.8 39.2 38.8 SW-1 37.5 36.3 35.5 35.8 35.5 35.5 36.3 37.4 37.2 40.0 TE-1 35.9 35.2 34.7 WI-1 35.8 35.6 34.0 ST-1 42.1 40.4 39.9 40.1 41.1 41.9 42.8 CV-1 32.7 32.3 32.9 33.0 33.6 34.5 35.0 36.0 37.1 RO-2 37.1 36.8 36.8 37.3 38.7 39.6 40.6 42.3 48.6 JE-1 38.9 37.1 36.2 34.8
LEGEND: Location of data Location of school access Location of crosswalk Data within 1 mph of minimum speed Data collected, but not within 1 mph Insufficient data collected
ADDITIONAL INFORMATION ON SITES: Site Num School Speed Limit (mph) School Zone Length (ft) Min Speed (mph)
SA-2 20 590 20.1 SA-3 20 615 22.2 SA-1 20 977 18.6 EL-3 30 584 28.8 EL-2 30 1600 28.6 EL-1 35 1185 29.3 SA-4 35 1215 34.2 LE-1 35 1454 36.4
BR-2a 35 1456 33.3 BR-2b 35 1456 33.2 BR-1 35 1515 38.2 SW-1 35 2156 35.5 TE-1 35 2290 34.7 WI-1 35 2779 34.0 ST-1 35 3258 39.9 CV-1 35 3593 32.3 RO-2 35 3910 36.8 JE-1 35 4144 34.8
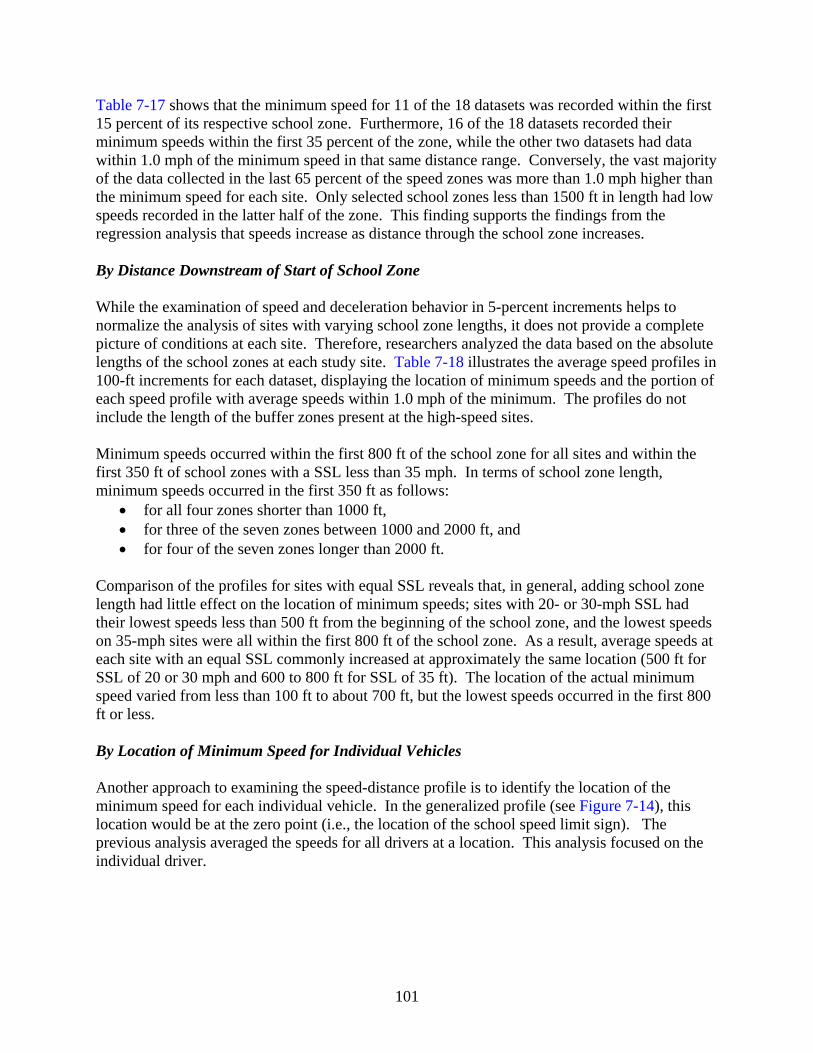
101
Table 7-17 shows that the minimum speed for 11 of the 18 datasets was recorded within the first 15 percent of its respective school zone. Furthermore, 16 of the 18 datasets recorded their minimum speeds within the first 35 percent of the zone, while the other two datasets had data within 1.0 mph of the minimum speed in that same distance range. Conversely, the vast majority of the data collected in the last 65 percent of the speed zones was more than 1.0 mph higher than the minimum speed for each site. Only selected school zones less than 1500 ft in length had low speeds recorded in the latter half of the zone. This finding supports the findings from the regression analysis that speeds increase as distance through the school zone increases. By Distance Downstream of Start of School Zone
While the examination of speed and deceleration behavior in 5-percent increments helps to normalize the analysis of sites with varying school zone lengths, it does not provide a complete picture of conditions at each site. Therefore, researchers analyzed the data based on the absolute lengths of the school zones at each study site. Table 7-18 illustrates the average speed profiles in 100-ft increments for each dataset, displaying the location of minimum speeds and the portion of each speed profile with average speeds within 1.0 mph of the minimum. The profiles do not include the length of the buffer zones present at the high-speed sites. Minimum speeds occurred within the first 800 ft of the school zone for all sites and within the first 350 ft of school zones with a SSL less than 35 mph. In terms of school zone length, minimum speeds occurred in the first 350 ft as follows:
• for all four zones shorter than 1000 ft, • for three of the seven zones between 1000 and 2000 ft, and • for four of the seven zones longer than 2000 ft.
Comparison of the profiles for sites with equal SSL reveals that, in general, adding school zone length had little effect on the location of minimum speeds; sites with 20- or 30-mph SSL had their lowest speeds less than 500 ft from the beginning of the school zone, and the lowest speeds on 35-mph sites were all within the first 800 ft of the school zone. As a result, average speeds at each site with an equal SSL commonly increased at approximately the same location (500 ft for SSL of 20 or 30 mph and 600 to 800 ft for SSL of 35 ft). The location of the actual minimum speed varied from less than 100 ft to about 700 ft, but the lowest speeds occurred in the first 800 ft or less.
By Location of Minimum Speed for Individual Vehicles Another approach to examining the speed-distance profile is to identify the location of the minimum speed for each individual vehicle. In the generalized profile (see Figure 7-14), this location would be at the zero point (i.e., the location of the school speed limit sign). The previous analysis averaged the speeds for all drivers at a location. This analysis focused on the individual driver.
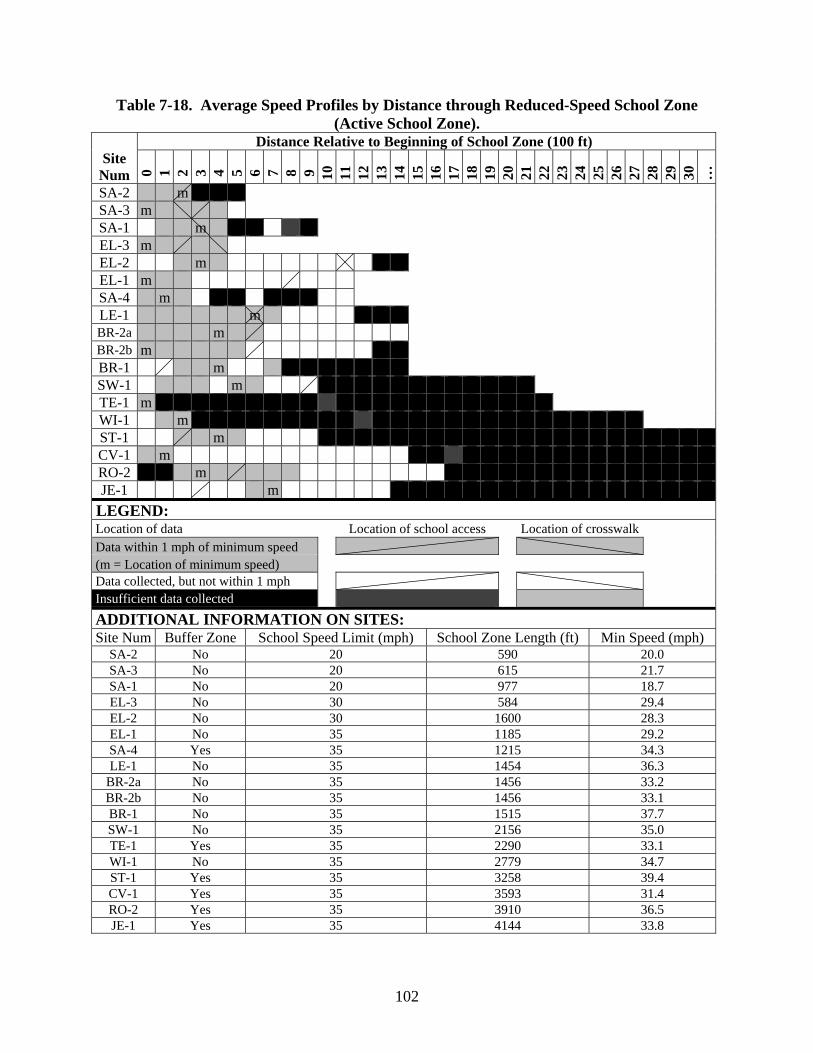
102
Table 7-18. Average Speed Profiles by Distance through Reduced-Speed School Zone (Active School Zone).
Site
Num
Distance Relative to Beginning of School Zone (100 ft) 0 1 2 3 4 5 6 7 8 9 10
11
12
13
14
15
16
17
18
19
20
21
22
23
24
25
26
27
28
29
30
…
SA-2 m SA-3 m SA-1 m EL-3 m EL-2 m EL-1 m SA-4 m LE-1 m BR-2a m BR-2b m BR-1 m SW-1 m TE-1 m WI-1 m ST-1 m CV-1 m RO-2 m JE-1 m
LEGEND: Location of data Location of school access Location of crosswalk Data within 1 mph of minimum speed (m = Location of minimum speed) Data collected, but not within 1 mph Insufficient data collected ADDITIONAL INFORMATION ON SITES: Site Num Buffer Zone School Speed Limit (mph) School Zone Length (ft) Min Speed (mph)
SA-2 No 20 590 20.0 SA-3 No 20 615 21.7 SA-1 No 20 977 18.7 EL-3 No 30 584 29.4 EL-2 No 30 1600 28.3 EL-1 No 35 1185 29.2 SA-4 Yes 35 1215 34.3 LE-1 No 35 1454 36.3
BR-2a No 35 1456 33.2 BR-2b No 35 1456 33.1 BR-1 No 35 1515 37.7 SW-1 No 35 2156 35.0 TE-1 Yes 35 2290 33.1 WI-1 No 35 2779 34.7 ST-1 Yes 35 3258 39.4 CV-1 Yes 35 3593 31.4 RO-2 Yes 35 3910 36.5 JE-1 Yes 35 4144 33.8
103
A subset of the sites was used for the evaluation. The initial set included sites where speeds were collected using laser (i.e., a speed-distance profile is available for individual vehicles) at non-buffer sites. Researchers eliminated vehicles from the dataset if the vehicle’s speed profile did not include sufficient distance beyond the lowest school speed limit sign because these speed-distance profiles may not have captured the minimum speed for the school zone. The initial location of the minimum speed for each vehicle within its speed-distance profile was identified. For example, if the vehicle decelerated to a speed of 30 mph approximately 100 ft beyond the school speed limit sign and remained at the 30 mph for another 400 ft, the procedure identified 100 ft as the location of the minimum speed. Vehicles were eliminated if the minimum speed was identified as being the final speed of the speed-distance profile because it may be an indication that the actual minimum speed for the driver was not yet captured. Cumulative distributions were generated for each site included in this analysis (see Figure 7-15). The minimum and maximum locations along with the 25th, 50th, and 75th percentile values were determined and are listed in Table 7-19. Observations from Figure 7-15 and Table 7-19 include the following:
• Minimum speeds occur over a large range of distances, at the extreme limits from approximately 500 ft upstream of the school speed limit sign to more than 2000 ft after the school speed limit sign.
• Most of the minimum speeds occurred between 150 and 500 ft after the school speed limit sign.
• In general, minimum speeds occurred closer to the school speed limit sign for the shorter school zones (see Figure 7-16).
Organizing the findings by school speed limit, the average location for the minimum speed is 171 ft for the 20-mph zone, 218 ft for the two 30-mph zones, and 384 ft for the 35-mph zones.
Table 7-19. Location of Minimum Speed Relative to Start of School Zone. Site School Speed
Zone Number
of Vehicles
Distance from School Speed Limit Sign (ft) Average Min 25th
%-ile 50th
%-ile 75th
%-ile Max
Len (ft)
Speed Limit (mph)
EL-3 584 30 149 84 -494 -21 53 193 877 SA-1 775 20 74 171 -389 39 121 282 818 BR-2 1456 35 58 217 -531 -58 300 451 1137 BR-1 1515 35 34 526 -117 208 487 679 1487 EL-2 1600 30 113 394 -327 29 144 471 2208 SW-1 2156 35 66 371 -519 121 361 567 1986

104
0%
10%
20%
30%
40%
50%
60%
70%
80%
90%
100%
-500 0 500 1000 1500 2000
Distance (ft)
Cum
ulat
ive
Per
cent
BR-1 (1515)BR-2 (1456)EL-2 (1600)EL-3 (584)SA-1 (775)SW-1 (2156)
Figure 7-15. Cumulative Distribution of Individual Vehicle Minimum Speed Location
within School Zone.
0
100
200
300
400
500
600
0 500 1000 1500 2000 2500
School Zone Length (ft)
Loca
tion
of M
inim
um S
peed
, A
vera
ge o
f Veh
icle
s at
the
Site
(ft)
Figure 7-16. Minimum Speed Location Compared to School Zone Length.
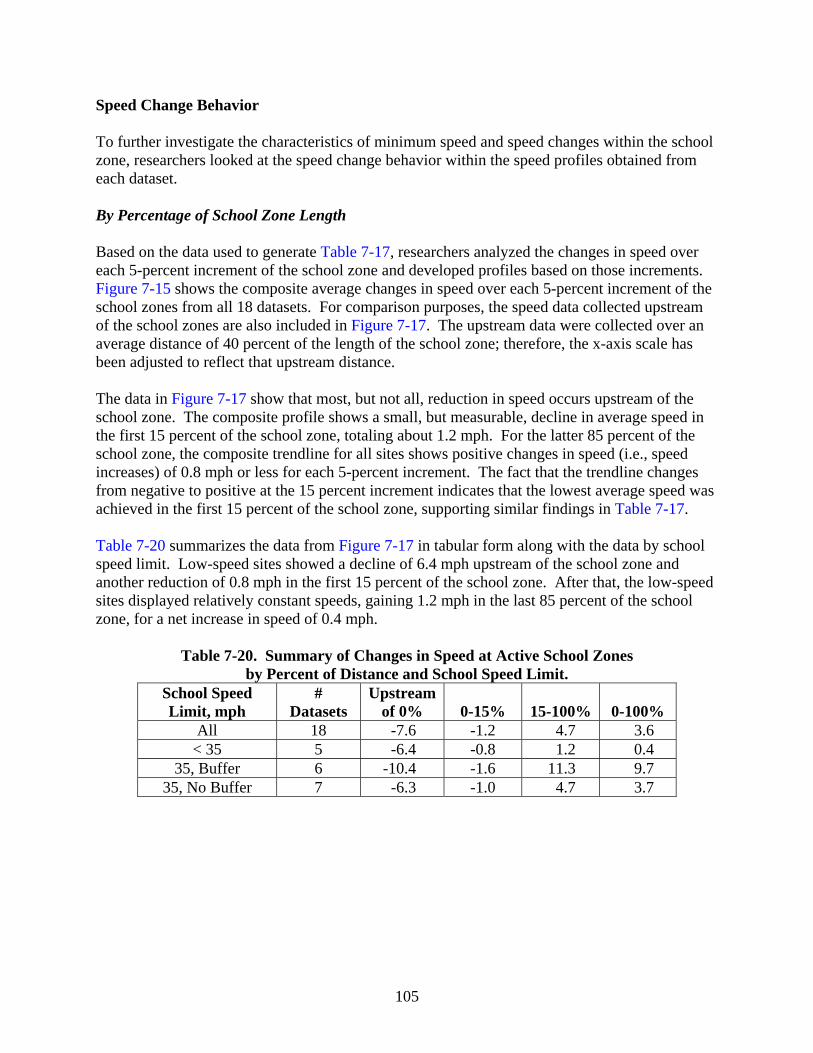
105
Speed Change Behavior
To further investigate the characteristics of minimum speed and speed changes within the school zone, researchers looked at the speed change behavior within the speed profiles obtained from each dataset. By Percentage of School Zone Length Based on the data used to generate Table 7-17, researchers analyzed the changes in speed over each 5-percent increment of the school zone and developed profiles based on those increments. Figure 7-15 shows the composite average changes in speed over each 5-percent increment of the school zones from all 18 datasets. For comparison purposes, the speed data collected upstream of the school zones are also included in Figure 7-17. The upstream data were collected over an average distance of 40 percent of the length of the school zone; therefore, the x-axis scale has been adjusted to reflect that upstream distance.
The data in Figure 7-17 show that most, but not all, reduction in speed occurs upstream of the school zone. The composite profile shows a small, but measurable, decline in average speed in the first 15 percent of the school zone, totaling about 1.2 mph. For the latter 85 percent of the school zone, the composite trendline for all sites shows positive changes in speed (i.e., speed increases) of 0.8 mph or less for each 5-percent increment. The fact that the trendline changes from negative to positive at the 15 percent increment indicates that the lowest average speed was achieved in the first 15 percent of the school zone, supporting similar findings in Table 7-17.
Table 7-20 summarizes the data from Figure 7-17 in tabular form along with the data by school speed limit. Low-speed sites showed a decline of 6.4 mph upstream of the school zone and another reduction of 0.8 mph in the first 15 percent of the school zone. After that, the low-speed sites displayed relatively constant speeds, gaining 1.2 mph in the last 85 percent of the school zone, for a net increase in speed of 0.4 mph.
Table 7-20. Summary of Changes in Speed at Active School Zones by Percent of Distance and School Speed Limit.
School Speed Limit, mph
# Datasets
Upstream of 0% 0-15% 15-100% 0-100%
All 18 -7.6 -1.2 4.7 3.6 < 35 5 -6.4 -0.8 1.2 0.4
35, Buffer 6 -10.4 -1.6 11.3 9.7 35, No Buffer 7 -6.3 -1.0 4.7 3.7

106
Figure 7-17. Average Change in Speed, Active School Zone, 5-Percent Increments.
Table 7-20 also shows that buffer zone sites have greater reductions in speed upstream of the beginning of the school zone (10.4 mph) than do 35-mph sites with no buffer zone (6.3 mph). However, 35-mph sites with and without buffer zones had net increases in speed of 9.7 and 3.7 mph, respectively, in the school zone as a result of large increases in the last 85 percent of the zone. The larger speed increase at buffer zone sites means that the average speed at the end of the school zone at those sites was approximately equal to the average speed at the beginning of data collection upstream of the school zone. It should be noted that the upstream data collection may not have captured all of the upstream speed changes at the study sites; vehicles may have begun their speed change prior to the range of the laser gun. For example, the buffer zone sites have buffer speed limits of 15 or 20 mph higher than the SSL, so the expected upstream speed change at those sites is equal to that difference. Though the data in Table 7-20 show an upstream decrease in speed of only 10.4 mph, there may have been an additional decrease before being targeted by the laser gun.
Table 7-21 categorizes the data from Figure 7-18 by school zone length. Short-length and medium-length sites (less than 2000 ft) showed similar characteristics upstream of the school zone and in the first 15 percent of the zone. However, in the last 85 percent of the zone, the speed increase at sites between 1000 and 2000 ft in length was greater by a factor of three compared to sites shorter than 1000 ft. Table 7-21 also shows that speed changes at longer zones (greater than 2000 ft) are about twice the magnitude of speed changes at medium-length zones throughout the entire profile.
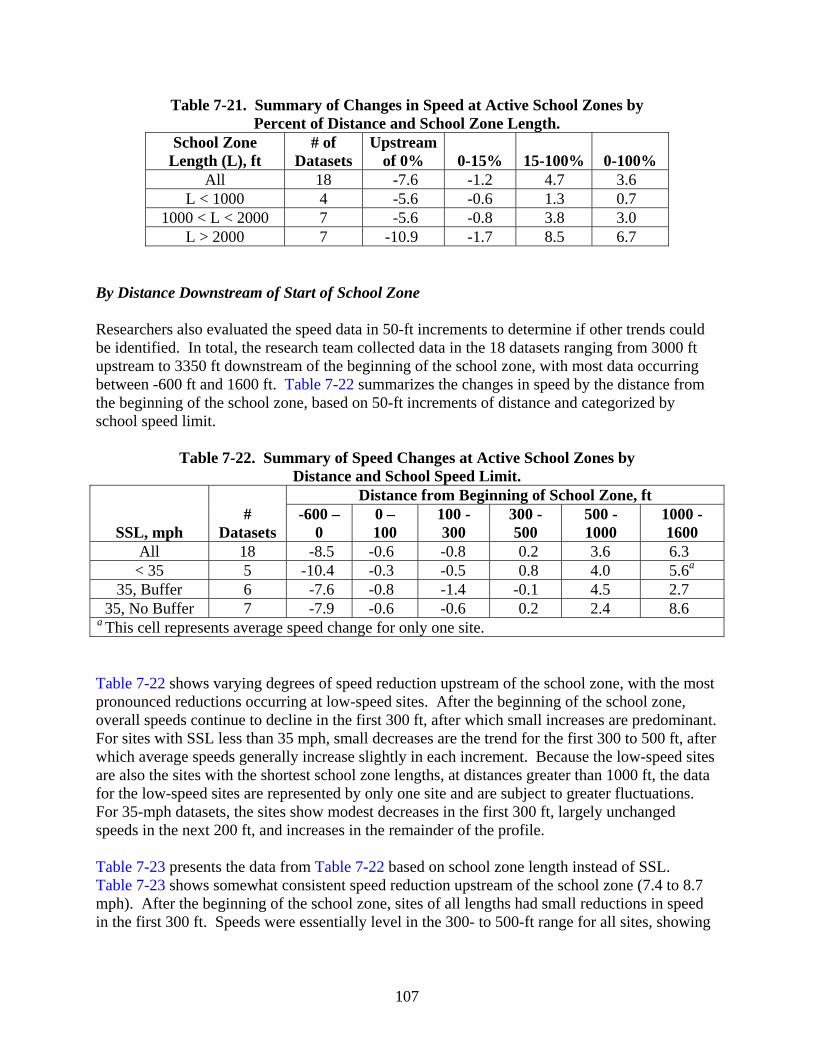
107
Table 7-21. Summary of Changes in Speed at Active School Zones by Percent of Distance and School Zone Length.
School Zone Length (L), ft
# of Datasets
Upstream of 0% 0-15% 15-100% 0-100%
All 18 -7.6 -1.2 4.7 3.6 L < 1000 4 -5.6 -0.6 1.3 0.7
1000 < L < 2000 7 -5.6 -0.8 3.8 3.0 L > 2000 7 -10.9 -1.7 8.5 6.7
By Distance Downstream of Start of School Zone Researchers also evaluated the speed data in 50-ft increments to determine if other trends could be identified. In total, the research team collected data in the 18 datasets ranging from 3000 ft upstream to 3350 ft downstream of the beginning of the school zone, with most data occurring between -600 ft and 1600 ft. Table 7-22 summarizes the changes in speed by the distance from the beginning of the school zone, based on 50-ft increments of distance and categorized by school speed limit.
Table 7-22. Summary of Speed Changes at Active School Zones by
Distance and School Speed Limit.
SSL, mph #
Datasets
Distance from Beginning of School Zone, ft -600 –
0 0 – 100
100 - 300
300 - 500
500 - 1000
1000 - 1600
All 18 -8.5 -0.6 -0.8 0.2 3.6 6.3 < 35 5 -10.4 -0.3 -0.5 0.8 4.0 5.6a
35, Buffer 6 -7.6 -0.8 -1.4 -0.1 4.5 2.7 35, No Buffer 7 -7.9 -0.6 -0.6 0.2 2.4 8.6
a This cell represents average speed change for only one site.
Table 7-22 shows varying degrees of speed reduction upstream of the school zone, with the most pronounced reductions occurring at low-speed sites. After the beginning of the school zone, overall speeds continue to decline in the first 300 ft, after which small increases are predominant. For sites with SSL less than 35 mph, small decreases are the trend for the first 300 to 500 ft, after which average speeds generally increase slightly in each increment. Because the low-speed sites are also the sites with the shortest school zone lengths, at distances greater than 1000 ft, the data for the low-speed sites are represented by only one site and are subject to greater fluctuations. For 35-mph datasets, the sites show modest decreases in the first 300 ft, largely unchanged speeds in the next 200 ft, and increases in the remainder of the profile. Table 7-23 presents the data from Table 7-22 based on school zone length instead of SSL. Table 7-23 shows somewhat consistent speed reduction upstream of the school zone (7.4 to 8.7 mph). After the beginning of the school zone, sites of all lengths had small reductions in speed in the first 300 ft. Speeds were essentially level in the 300- to 500-ft range for all sites, showing
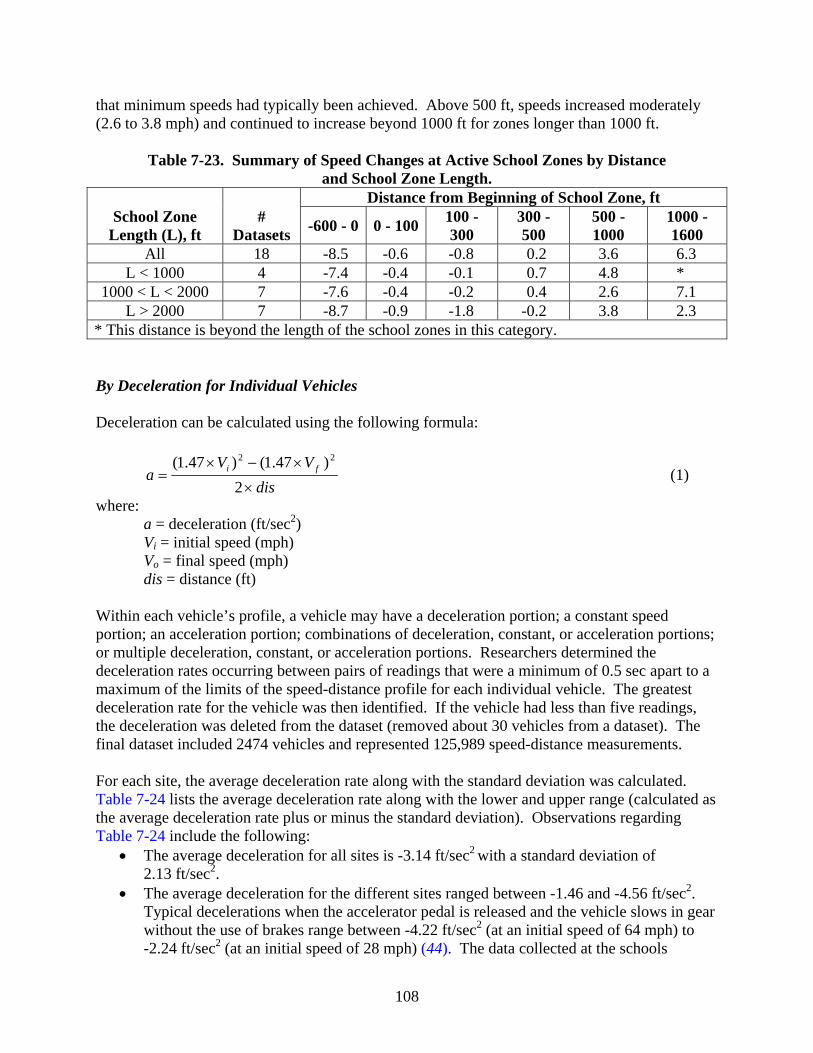
108
that minimum speeds had typically been achieved. Above 500 ft, speeds increased moderately (2.6 to 3.8 mph) and continued to increase beyond 1000 ft for zones longer than 1000 ft.
Table 7-23. Summary of Speed Changes at Active School Zones by Distance and School Zone Length.
School Zone Length (L), ft
# Datasets
Distance from Beginning of School Zone, ft
-600 - 0 0 - 100 100 - 300
300 - 500
500 - 1000
1000 - 1600
All 18 -8.5 -0.6 -0.8 0.2 3.6 6.3 L < 1000 4 -7.4 -0.4 -0.1 0.7 4.8 *
1000 < L < 2000 7 -7.6 -0.4 -0.2 0.4 2.6 7.1 L > 2000 7 -8.7 -0.9 -1.8 -0.2 3.8 2.3
* This distance is beyond the length of the school zones in this category. By Deceleration for Individual Vehicles Deceleration can be calculated using the following formula:
disVV
a fi
×
×−×=
2)47.1()47.1( 22
(1)
where: a = deceleration (ft/sec2) Vi = initial speed (mph) Vo = final speed (mph) dis = distance (ft)
Within each vehicle’s profile, a vehicle may have a deceleration portion; a constant speed portion; an acceleration portion; combinations of deceleration, constant, or acceleration portions; or multiple deceleration, constant, or acceleration portions. Researchers determined the deceleration rates occurring between pairs of readings that were a minimum of 0.5 sec apart to a maximum of the limits of the speed-distance profile for each individual vehicle. The greatest deceleration rate for the vehicle was then identified. If the vehicle had less than five readings, the deceleration was deleted from the dataset (removed about 30 vehicles from a dataset). The final dataset included 2474 vehicles and represented 125,989 speed-distance measurements. For each site, the average deceleration rate along with the standard deviation was calculated. Table 7-24 lists the average deceleration rate along with the lower and upper range (calculated as the average deceleration rate plus or minus the standard deviation). Observations regarding Table 7-24 include the following:
• The average deceleration for all sites is -3.14 ft/sec2 with a standard deviation of 2.13 ft/sec2.
• The average deceleration for the different sites ranged between -1.46 and -4.56 ft/sec2. Typical decelerations when the accelerator pedal is released and the vehicle slows in gear without the use of brakes range between -4.22 ft/sec2 (at an initial speed of 64 mph) to -2.24 ft/sec2 (at an initial speed of 28 mph) (44). The data collected at the schools

109
indicate that the typical driver is coasting (i.e., not using brakes) to obtain the speed reduction in response to a school speed limit sign.
Figure 7-18(a) shows the cumulative distribution for all deceleration measurements for the 19 sites. The 50th percentile deceleration was -2.57 ft/sec2. The 15th percentile deceleration rate (stated in another manner, 85 percent of the drivers selected higher decelerations) was only -1.28 ft/sec2, which is a value associated with coasting. Some drivers were applying their brakes, as indicated in Figure 7-18(a) by values greater than -4.22 ft/sec2. The maximum deceleration measured was -14.71 ft/sec2, which exceeds the value assumed for stopping sight distance (-11.2 ft/sec2). Note, however, that only 16 of the 2334 vehicles (less than 1 percent) had a deceleration that exceeded the assumed rate for stopping sight distance. The maximum deceleration rate to an unanticipated object identified in the stopping sight distance project was -24.5 ft/sec2 (45), and none of the decelerations measured in this school study was close to that value. The cumulative distribution plot shown in Figure 7-18(b) represents only those vehicles that actively used their brakes. The 50th percentile braking deceleration was -5.33 ft/sec2 with 85 percent of the drivers selecting a braking deceleration rate of -7.84 ft/sec2 or less and 15 percent of the drivers selecting a braking deceleration rate of -4.74 ft/sec2 or less. The distance used with those deceleration rates for given initial and final speeds are listed in Table 7-25.
Table 7-24. Deceleration Rates for Each Site.
Site Number of Vehicles
Deceleration (ft/sec2) Lower Range Average Upper Range
AL-1 125 -1.11 -3.02 -4.94 BR-1 35 -1.57 -3.66 -5.75 BR-2 63 -1.62 -3.29 -4.95 CV-1 36 -1.07 -2.67 -4.28 EL-2 169 -0.84 -2.62 -4.40 EL-3 96 -0.02 -1.58 -3.14 JE-1 145 -0.87 -3.19 -5.52 RO-2 182 -0.73 -2.61 -4.49 SA-1 170 -1.33 -3.09 -4.84 SA-4 73 -1.46 -3.32 -5.17 SW-1 226 -0.84 -2.80 -4.75 TE-1 77 -2.06 -4.56 -7.05 WI-1 213 -1.43 -3.74 -6.04 SA-2 86 -0.51 -1.46 -2.41 EL-1 251 -1.37 -3.91 -6.45 ST-1 178 -1.35 -3.20 -5.06 LE-1 170 -1.03 -3.05 -5.07 BR-3 51 -2.04 -3.66 -5.29 SA-3 128 -1.42 -3.91 -6.40
Total or Average 2474 -1.01 -3.14 -5.28
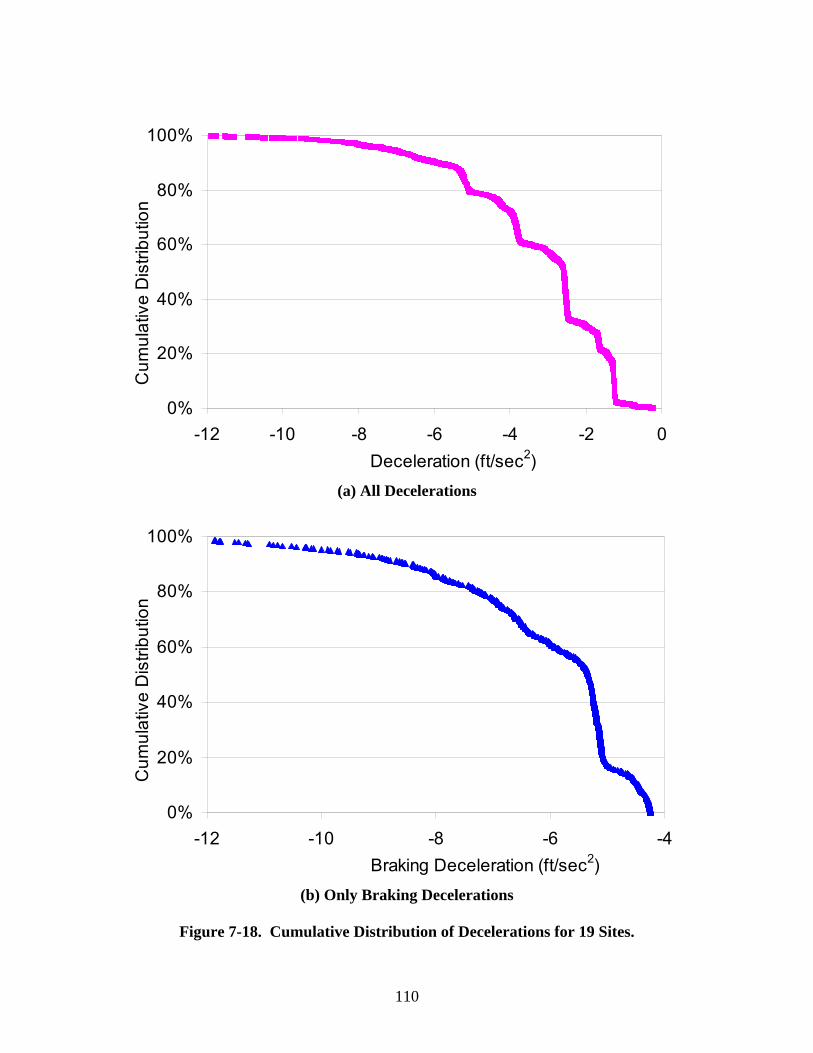
110
0%
20%
40%
60%
80%
100%
-12 -10 -8 -6 -4 -2 0Deceleration (ft/sec2)
Cum
ulat
ive
Dis
tribu
tion
.
(a) All Decelerations
0%
20%
40%
60%
80%
100%
-12 -10 -8 -6 -4Braking Deceleration (ft/sec2)
Cum
ulat
ive
Dis
tribu
tion
.
(b) Only Braking Decelerations
Figure 7-18. Cumulative Distribution of Decelerations for 19 Sites.
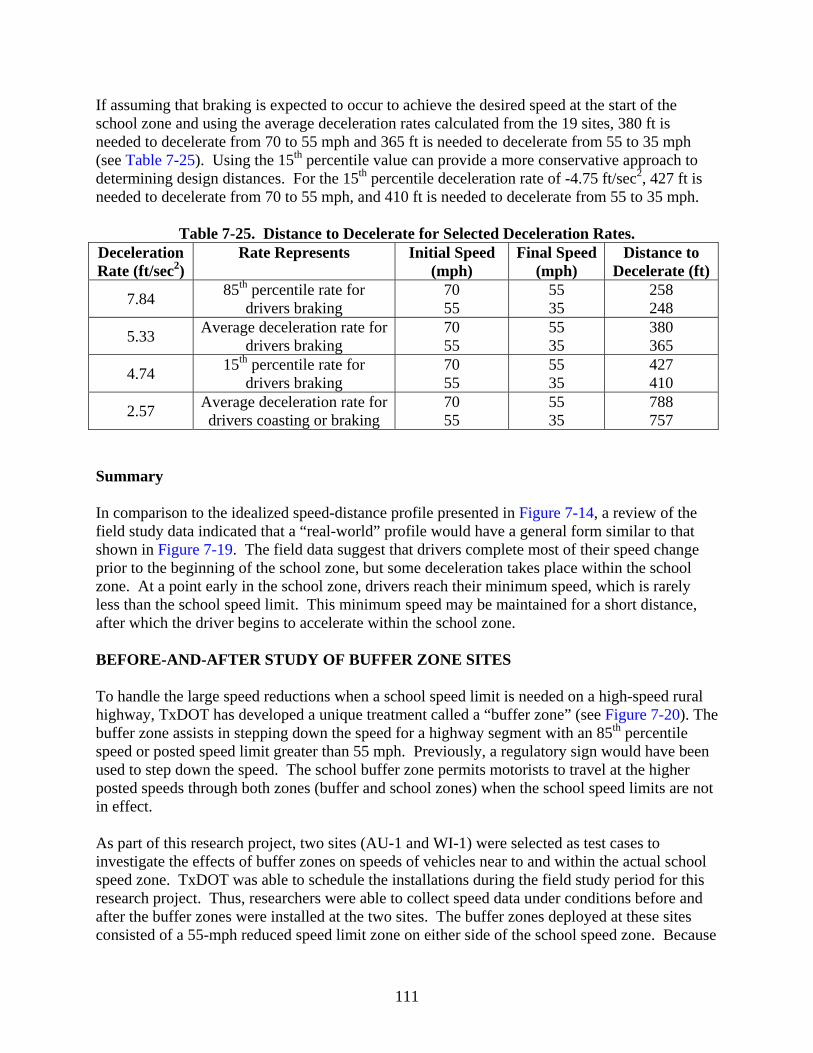
111
If assuming that braking is expected to occur to achieve the desired speed at the start of the school zone and using the average deceleration rates calculated from the 19 sites, 380 ft is needed to decelerate from 70 to 55 mph and 365 ft is needed to decelerate from 55 to 35 mph (see Table 7-25). Using the 15th percentile value can provide a more conservative approach to determining design distances. For the 15th percentile deceleration rate of -4.75 ft/sec2, 427 ft is needed to decelerate from 70 to 55 mph, and 410 ft is needed to decelerate from 55 to 35 mph.
Table 7-25. Distance to Decelerate for Selected Deceleration Rates.
Deceleration Rate (ft/sec2)
Rate Represents Initial Speed (mph)
Final Speed (mph)
Distance to Decelerate (ft)
7.84 85th percentile rate for drivers braking
70 55
55 35
258 248
5.33 Average deceleration rate for drivers braking
70 55
55 35
380 365
4.74 15th percentile rate for drivers braking
70 55
55 35
427 410
2.57 Average deceleration rate for drivers coasting or braking
70 55
55 35
788 757
Summary In comparison to the idealized speed-distance profile presented in Figure 7-14, a review of the field study data indicated that a “real-world” profile would have a general form similar to that shown in Figure 7-19. The field data suggest that drivers complete most of their speed change prior to the beginning of the school zone, but some deceleration takes place within the school zone. At a point early in the school zone, drivers reach their minimum speed, which is rarely less than the school speed limit. This minimum speed may be maintained for a short distance, after which the driver begins to accelerate within the school zone. BEFORE-AND-AFTER STUDY OF BUFFER ZONE SITES To handle the large speed reductions when a school speed limit is needed on a high-speed rural highway, TxDOT has developed a unique treatment called a “buffer zone” (see Figure 7-20). The buffer zone assists in stepping down the speed for a highway segment with an 85th percentile speed or posted speed limit greater than 55 mph. Previously, a regulatory sign would have been used to step down the speed. The school buffer zone permits motorists to travel at the higher posted speeds through both zones (buffer and school zones) when the school speed limits are not in effect. As part of this research project, two sites (AU-1 and WI-1) were selected as test cases to investigate the effects of buffer zones on speeds of vehicles near to and within the actual school speed zone. TxDOT was able to schedule the installations during the field study period for this research project. Thus, researchers were able to collect speed data under conditions before and after the buffer zones were installed at the two sites. The buffer zones deployed at these sites consisted of a 55-mph reduced speed limit zone on either side of the school speed zone. Because

112
of their ability to collect data automatically, traffic counters collected speed all day at each site, which allowed a comparison of peak and non-peak periods.
IdealField Data
School Speed Limit
Begin Zone
End Zone
Spee
d (m
ph) .
Distance (ft)
Figure 7-19. Generalized Ideal and Field Data Speed-Distance Profiles.
Figure 7-20. Typical Layout of School Speed Zone with Buffer Zone (1).
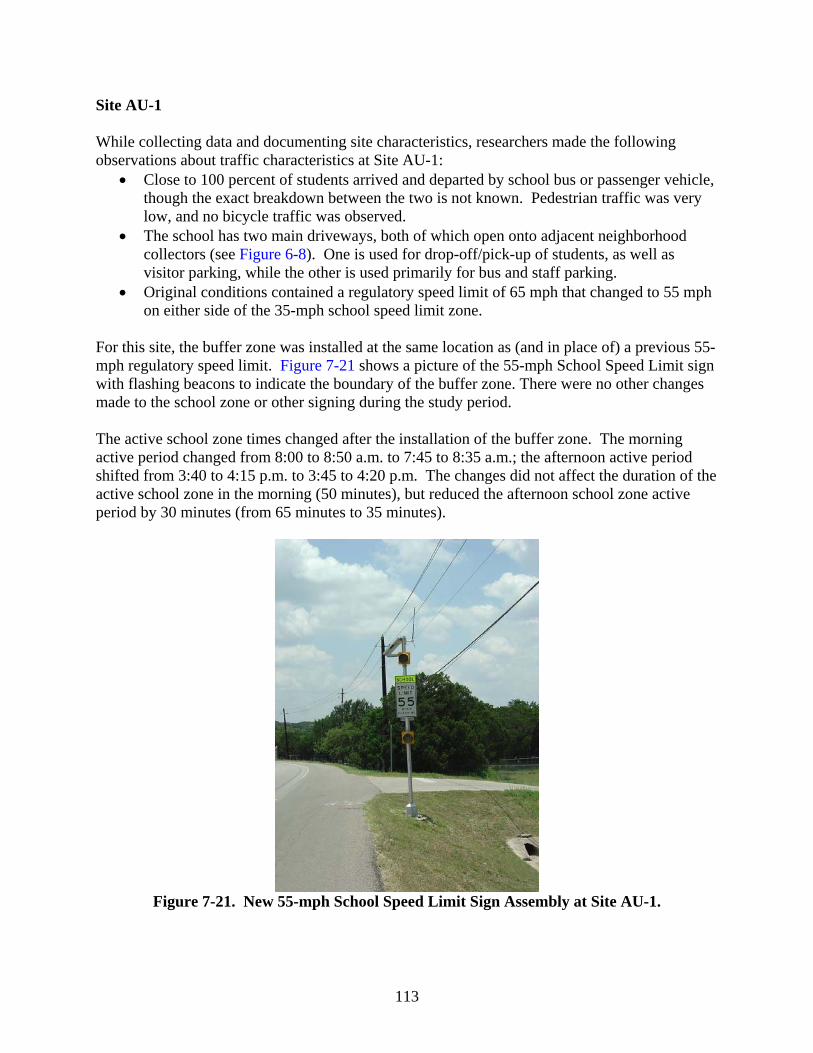
113
Site AU-1 While collecting data and documenting site characteristics, researchers made the following observations about traffic characteristics at Site AU-1:
• Close to 100 percent of students arrived and departed by school bus or passenger vehicle, though the exact breakdown between the two is not known. Pedestrian traffic was very low, and no bicycle traffic was observed.
• The school has two main driveways, both of which open onto adjacent neighborhood collectors (see Figure 6-8). One is used for drop-off/pick-up of students, as well as visitor parking, while the other is used primarily for bus and staff parking.
• Original conditions contained a regulatory speed limit of 65 mph that changed to 55 mph on either side of the 35-mph school speed limit zone.
For this site, the buffer zone was installed at the same location as (and in place of) a previous 55-mph regulatory speed limit. Figure 7-21 shows a picture of the 55-mph School Speed Limit sign with flashing beacons to indicate the boundary of the buffer zone. There were no other changes made to the school zone or other signing during the study period. The active school zone times changed after the installation of the buffer zone. The morning active period changed from 8:00 to 8:50 a.m. to 7:45 to 8:35 a.m.; the afternoon active period shifted from 3:40 to 4:15 p.m. to 3:45 to 4:20 p.m. The changes did not affect the duration of the active school zone in the morning (50 minutes), but reduced the afternoon school zone active period by 30 minutes (from 65 minutes to 35 minutes).
Figure 7-21. New 55-mph School Speed Limit Sign Assembly at Site AU-1.

114
Findings for AU-1 Table 7-26 provides summary statistics of mean speeds and associated standard deviations for Site AU-1. Figure 7-22 shows the 85th percentile speed measured, as well as the associated speed limits and access points. The figure and table show that in both active school zone periods (morning and afternoon), speeds were lower at the locations common to the data collection before and after installation (start of the school zone and near the school driveway) for both the southbound (by about 3 mph) and northbound (by about 8 mph) directions. Therefore, there was an increase in driver compliance after the installation of the buffer zone. Figure 7-22 also shows 85th percentile speeds during the period when the school zone was not active. In this period, southbound driver speeds after the installation of the school buffer zone were generally lower than the posted speed limit within the buffer zone and school zone limits. They were also much lower than the speeds measured before the installation of the buffer zone. Northbound speeds were lower at the start of the 35-mph school zone after the buffer zone was installed; however, speeds at other common locations were similar before and after installation.
Table 7-26. Summary Statistics for Before-and-After Study at Site AU-1.
Upstream of School Zone
Start of Buffer Zone
Start of School Zone
Near School Driveway
Mean Std. Dev Mean
Std. Dev Mean
Std. Dev Mean
Std. Dev
Northbound Before Buffer AM Active 56.6 12.4 N/A N/A 36.8 8.6 34.0 8.0 PM Active 56.7 10.4 N/A N/A 36.2 9.5 32.8 8.9
SZ Not Active 57.6 11.7 N/A N/A 58.6 8.3 55.6 7.9 Southbound Before Buffer
AM Active 45.3 8.9 N/A N/A 39.7 10.6 41.4 13.0 PM Active 45.2 12.9 N/A N/A 39.3 11.8 40.6 14.5
SZ Not Active 46.6 11.6 N/A N/A 57.6 14.9 55.9 19.6 Northbound After Buffer
AM Active 55.0 13.2 ND ND 28.7 7.8 32.0 8.0 PM Active 50.0 14.3 ND ND 29.4 8.6 29.0 10.0
SZ Not Active 56.0 14.0 ND ND 41.5 10.3 48.0 11.0 Southbound After Buffer
AM Active 58.8 7.7 ND ND 36.8 6.7 37.9 6.0 PM Active 58.0 7.2 ND ND 36.4 5.8 38.5 5.0
SZ Not Active 58.3 7.1 ND ND 52.0 6.1 52.5 6.3 N/A = This location is not applicable. ND = Data not available due to equipment malfunction.
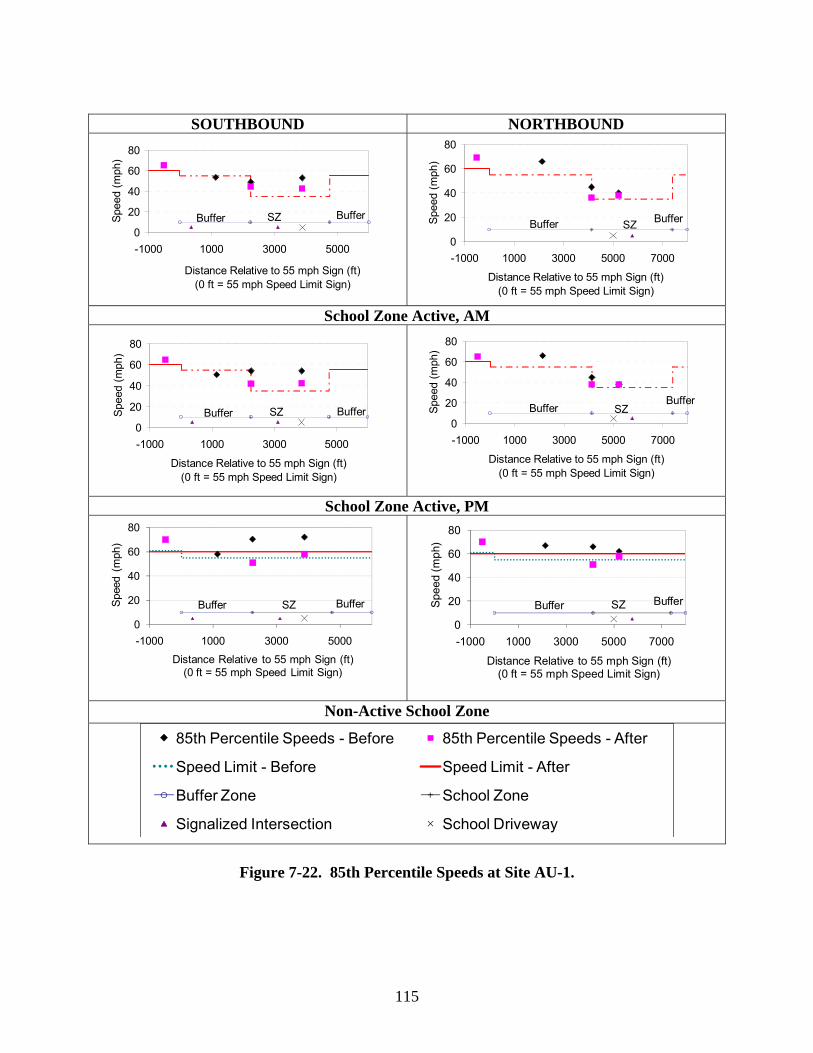
115
SOUTHBOUND NORTHBOUND
Buffer SZ Buffer0
20
40
60
80
-1000 1000 3000 5000
Distance Relative to 55 mph Sign (ft) (0 ft = 55 mph Speed Limit Sign)
Spee
d (m
ph)
Buffer SZ Buffer
0
20
40
60
80
-1000 1000 3000 5000 7000
Distance Relative to 55 mph Sign (ft) (0 ft = 55 mph Speed Limit Sign)
Spee
d (m
ph)
School Zone Active, AM
Buffer SZ Buffer 0
20
40
60
80
-1000 1000 3000 5000
Distance Relative to 55 mph Sign (ft) (0 ft = 55 mph Speed Limit Sign)
Spee
d (m
ph)
Buffer SZBuffer
0
20
40
60
80
-1000 1000 3000 5000 7000
Distance Relative to 55 mph Sign (ft) (0 ft = 55 mph Speed Limit Sign)
Spee
d (m
ph)
School Zone Active, PM
Buffer SZ Buffer
0
20
40
60
80
-1000 1000 3000 5000
Spee
d (m
ph)
Distance Relative to 55 mph Sign (ft) (0 ft = 55 mph Speed Limit Sign)
Buffer SZ Buffer
0
20
40
60
80
-1000 1000 3000 5000 7000
Spe
ed (m
ph)
Distance Relative to 55 mph Sign (ft) (0 ft = 55 mph Speed Limit Sign)
Non-Active School Zone
020406080Distance Relative to 55 mph Sign …
85th Percentile Speeds - Before 85th Percentile Speeds - After
Speed Limit - Before Speed Limit - After
Buffer Zone School Zone
Signalized Intersection School Driveway
Figure 7-22. 85th Percentile Speeds at Site AU-1.
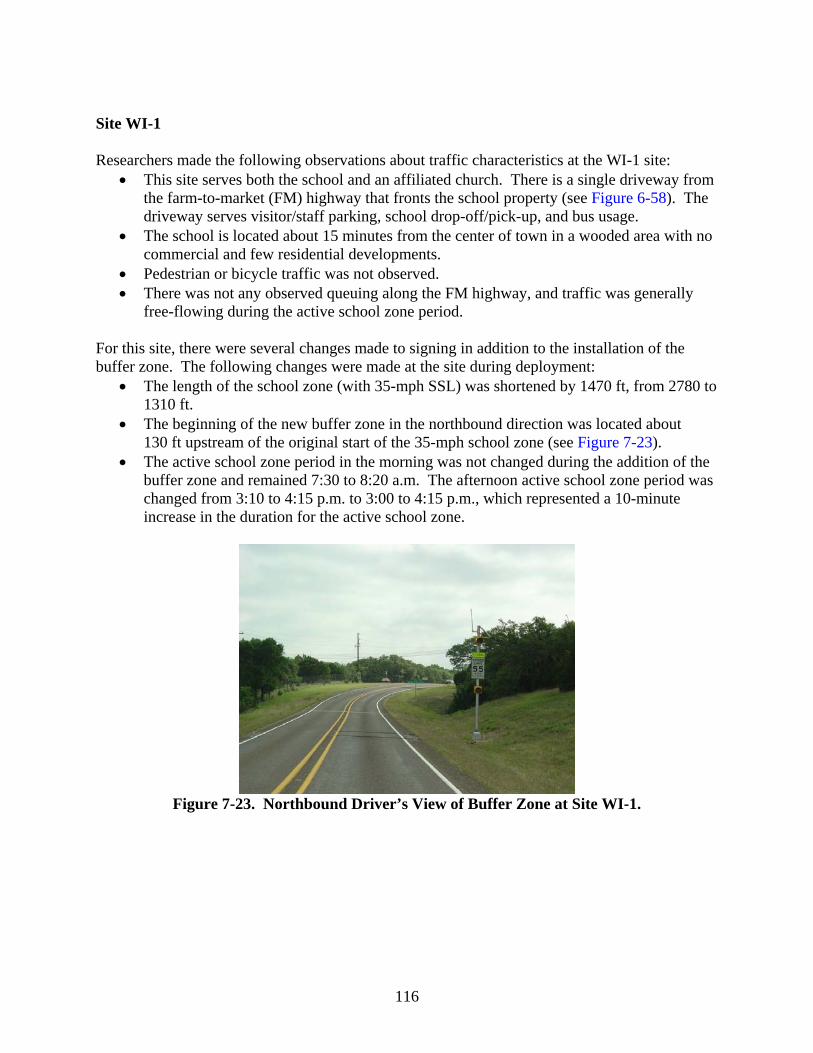
116
Site WI-1 Researchers made the following observations about traffic characteristics at the WI-1 site:
• This site serves both the school and an affiliated church. There is a single driveway from the farm-to-market (FM) highway that fronts the school property (see Figure 6-58). The driveway serves visitor/staff parking, school drop-off/pick-up, and bus usage.
• The school is located about 15 minutes from the center of town in a wooded area with no commercial and few residential developments.
• Pedestrian or bicycle traffic was not observed. • There was not any observed queuing along the FM highway, and traffic was generally
free-flowing during the active school zone period. For this site, there were several changes made to signing in addition to the installation of the buffer zone. The following changes were made at the site during deployment:
• The length of the school zone (with 35-mph SSL) was shortened by 1470 ft, from 2780 to 1310 ft.
• The beginning of the new buffer zone in the northbound direction was located about 130 ft upstream of the original start of the 35-mph school zone (see Figure 7-23).
• The active school zone period in the morning was not changed during the addition of the buffer zone and remained 7:30 to 8:20 a.m. The afternoon active school zone period was changed from 3:10 to 4:15 p.m. to 3:00 to 4:15 p.m., which represented a 10-minute increase in the duration for the active school zone.
Figure 7-23. Northbound Driver’s View of Buffer Zone at Site WI-1.
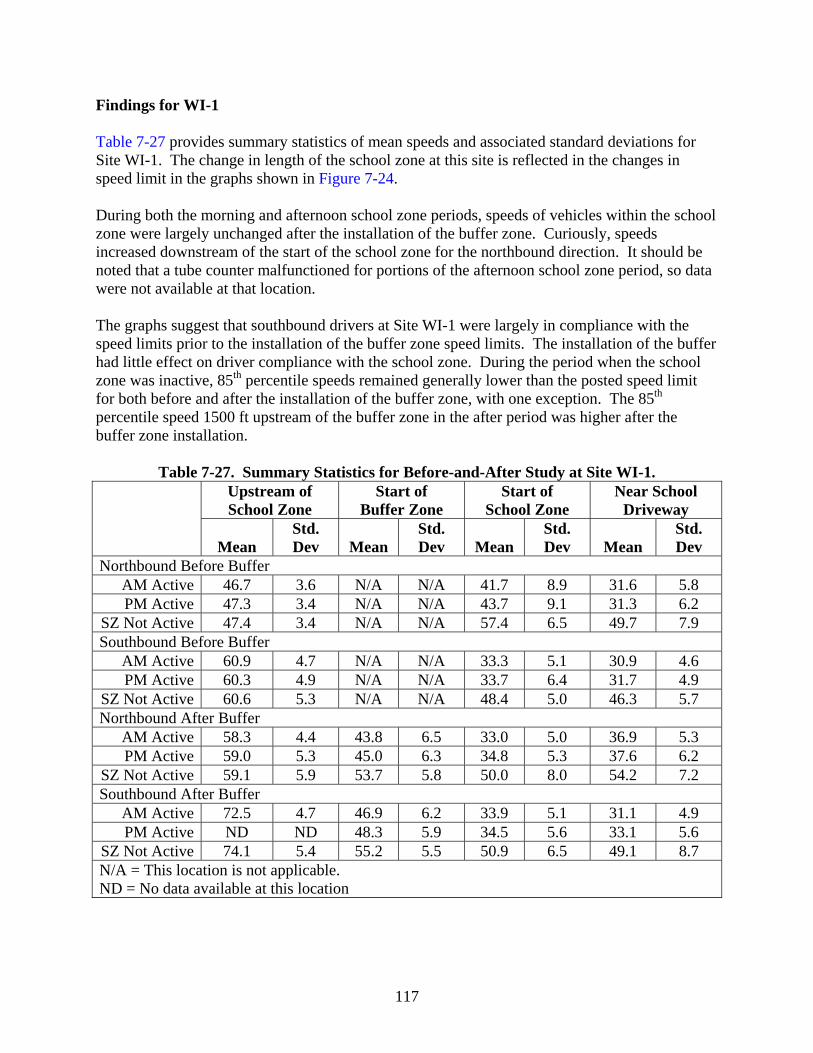
117
Findings for WI-1 Table 7-27 provides summary statistics of mean speeds and associated standard deviations for Site WI-1. The change in length of the school zone at this site is reflected in the changes in speed limit in the graphs shown in Figure 7-24. During both the morning and afternoon school zone periods, speeds of vehicles within the school zone were largely unchanged after the installation of the buffer zone. Curiously, speeds increased downstream of the start of the school zone for the northbound direction. It should be noted that a tube counter malfunctioned for portions of the afternoon school zone period, so data were not available at that location. The graphs suggest that southbound drivers at Site WI-1 were largely in compliance with the speed limits prior to the installation of the buffer zone speed limits. The installation of the buffer had little effect on driver compliance with the school zone. During the period when the school zone was inactive, 85th percentile speeds remained generally lower than the posted speed limit for both before and after the installation of the buffer zone, with one exception. The 85th percentile speed 1500 ft upstream of the buffer zone in the after period was higher after the buffer zone installation.
Table 7-27. Summary Statistics for Before-and-After Study at Site WI-1.
Upstream of School Zone
Start of Buffer Zone
Start of School Zone
Near School Driveway
Mean Std. Dev Mean
Std. Dev Mean
Std. Dev Mean
Std. Dev
Northbound Before Buffer AM Active 46.7 3.6 N/A N/A 41.7 8.9 31.6 5.8 PM Active 47.3 3.4 N/A N/A 43.7 9.1 31.3 6.2
SZ Not Active 47.4 3.4 N/A N/A 57.4 6.5 49.7 7.9 Southbound Before Buffer
AM Active 60.9 4.7 N/A N/A 33.3 5.1 30.9 4.6 PM Active 60.3 4.9 N/A N/A 33.7 6.4 31.7 4.9
SZ Not Active 60.6 5.3 N/A N/A 48.4 5.0 46.3 5.7 Northbound After Buffer
AM Active 58.3 4.4 43.8 6.5 33.0 5.0 36.9 5.3 PM Active 59.0 5.3 45.0 6.3 34.8 5.3 37.6 6.2
SZ Not Active 59.1 5.9 53.7 5.8 50.0 8.0 54.2 7.2 Southbound After Buffer
AM Active 72.5 4.7 46.9 6.2 33.9 5.1 31.1 4.9 PM Active ND ND 48.3 5.9 34.5 5.6 33.1 5.6
SZ Not Active 74.1 5.4 55.2 5.5 50.9 6.5 49.1 8.7 N/A = This location is not applicable. ND = No data available at this location
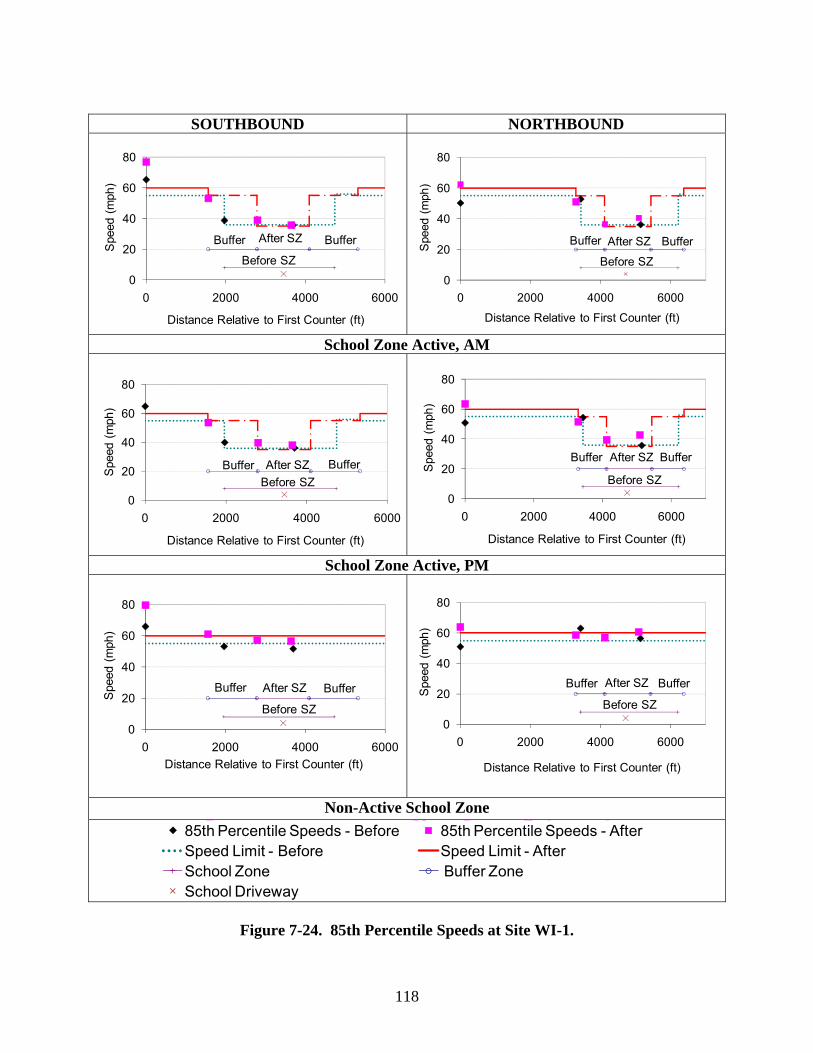
118
SOUTHBOUND NORTHBOUND
Buffer
Before SZ
After SZ Buffer
0
20
40
60
80
0 2000 4000 6000
Spe
ed (
mph
)
Distance Relative to First Counter (ft)
Buffer
Before SZ
After SZ Buffer
0
20
40
60
80
0 2000 4000 6000
Spe
ed (
mph
)
Distance Relative to First Counter (ft)
School Zone Active, AM
Buffer Before SZAfter SZ Buffer
0
20
40
60
80
0 2000 4000 6000
Spe
ed (
mph
)
Distance Relative to First Counter (ft)
Buffer
Before SZ
After SZ Buffer
0
20
40
60
80
0 2000 4000 6000
Spe
ed (
mph
)
Distance Relative to First Counter (ft)
School Zone Active, PM
Buffer
Before SZ
After SZ Buffer
0
20
40
60
80
0 2000 4000 6000
Spe
ed (
mph
)
Distance Relative to First Counter (ft)
Buffer
Before SZ
After SZ Buffer
0
20
40
60
80
0 2000 4000 6000
Spe
ed (
mph
)
Distance Relative to First Counter (ft)
Non-Active School Zone S c h o o l Z o n e , Af teB u f f e r Z o n B u f f e r Z on ec h o o l Z o n e , Be f or
02 04 06 08 0
0 1 0 0 0 2 0 0 0 3 0 0 0 4 0 0 0 5 0 0 0 6 0 0 0 7 0 0 0Sp
ee
d
(m
ph
s t a n c e R e la ti ve t o F ir st C o u n te r (f t)85th Percentile Speeds - Before 85th Percentile Speeds - AfterSpeed Limit - Before Speed Limit - AfterSchool Zone Buffer ZoneSchool Driveway
Figure 7-24. 85th Percentile Speeds at Site WI-1.
119
CHAPTER 8
DEVELOPMENT OF GUIDELINES FOR TRAFFIC CONTROL FOR SCHOOL AREAS
INTRODUCTION Guidelines were developed regarding traffic control for school areas, especially with respect to school speed zones. These guidelines, titled Guidelines for Traffic Control for School Areas, are included as Appendix A in this report. They can serve as a supplement to the TMUTCD (2) and the manual on Procedures for Establishing Speed Zones (1) or, as appropriate, parts of the Guidelines can be incorporated into the Procedures manual. This chapter of the report documents the background or sources of material included in the Guidelines. SCHOOL LOCATION This section introduces availability of previous material on school site design. It also emphasizes the need to maintain contact with school officials. DEFINITIONS This section provides definitions for several terms used in the Guidelines. SCHOOL AREA The Guidelines include discussion on the use of advance warning to advise road users that they are approaching a school that is adjacent to a highway, where additional care is needed, even though no school crossing is involved and the speed limit remains unchanged. The suggested distances between a School (S1-1) sign and a school driveway were developed based on Condition A and Condition B of the TMUTCD Table 2C-4 and range from 100 (assumed minimum) to 325 ft at 25 mph and 550 to 1250 ft at 70 mph. Currently, the TMUTCD shows 150 to 700 ft as the distance between School Advance Warning (S1-1) sign and the School Speed Limit (S5-1) sign and 200 ft between School Speed Limit (S5-1) sign and school driveway, for a total of 350 to 900 ft. Note that these TMUTCD values are not associated with a specific operating speed. The 2008 proposed revisions to the MUTCD do not include ANY dimensions for the distance between those signs. SCHOOL SPEED LIMIT ZONE Material regarding the decision to install a school speed limit zone was developed as a result of reviews of existing state and local guidelines (see Chapter 4), discussions with the project monitoring committee, and workshops held as part of professional society meetings. The dimensions provided for sign spacing were developed based upon TMUTCD Table 6C-1 on suggested advance warning sign spacing for work zones. The 2006 TMUTCD recommends
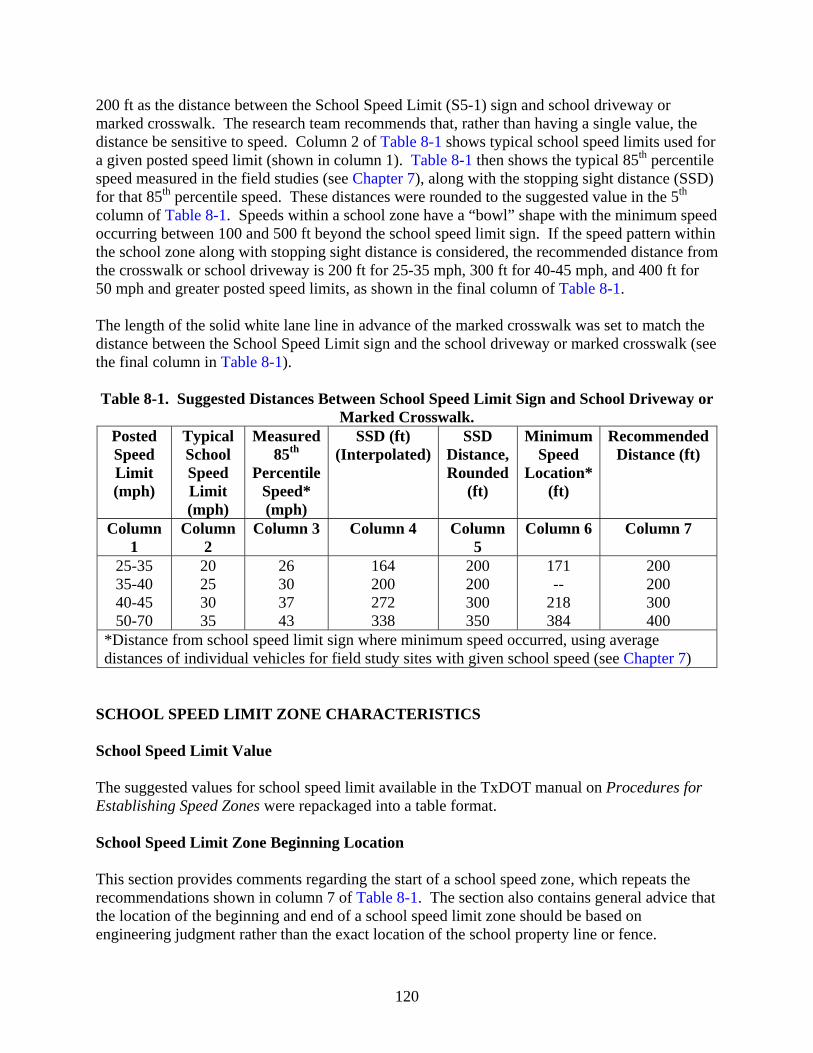
120
200 ft as the distance between the School Speed Limit (S5-1) sign and school driveway or marked crosswalk. The research team recommends that, rather than having a single value, the distance be sensitive to speed. Column 2 of Table 8-1 shows typical school speed limits used for a given posted speed limit (shown in column 1). Table 8-1 then shows the typical 85th percentile speed measured in the field studies (see Chapter 7), along with the stopping sight distance (SSD) for that 85th percentile speed. These distances were rounded to the suggested value in the 5th column of Table 8-1. Speeds within a school zone have a “bowl” shape with the minimum speed occurring between 100 and 500 ft beyond the school speed limit sign. If the speed pattern within the school zone along with stopping sight distance is considered, the recommended distance from the crosswalk or school driveway is 200 ft for 25-35 mph, 300 ft for 40-45 mph, and 400 ft for 50 mph and greater posted speed limits, as shown in the final column of Table 8-1. The length of the solid white lane line in advance of the marked crosswalk was set to match the distance between the School Speed Limit sign and the school driveway or marked crosswalk (see the final column in Table 8-1). Table 8-1. Suggested Distances Between School Speed Limit Sign and School Driveway or
Marked Crosswalk. Posted Speed Limit (mph)
Typical School Speed Limit (mph)
Measured 85th
Percentile Speed* (mph)
SSD (ft) (Interpolated)
SSD Distance, Rounded
(ft)
Minimum Speed
Location* (ft)
Recommended Distance (ft)
Column 1
Column 2
Column 3 Column 4 Column 5
Column 6 Column 7
25-35 35-40 40-45 50-70
20 25 30 35
26 30 37 43
164 200 272 338
200 200 300 350
171 --
218 384
200 200 300 400
*Distance from school speed limit sign where minimum speed occurred, using average distances of individual vehicles for field study sites with given school speed (see Chapter 7)
SCHOOL SPEED LIMIT ZONE CHARACTERISTICS School Speed Limit Value The suggested values for school speed limit available in the TxDOT manual on Procedures for Establishing Speed Zones were repackaged into a table format. School Speed Limit Zone Beginning Location This section provides comments regarding the start of a school speed zone, which repeats the recommendations shown in column 7 of Table 8-1. The section also contains general advice that the location of the beginning and end of a school speed limit zone should be based on engineering judgment rather than the exact location of the school property line or fence.
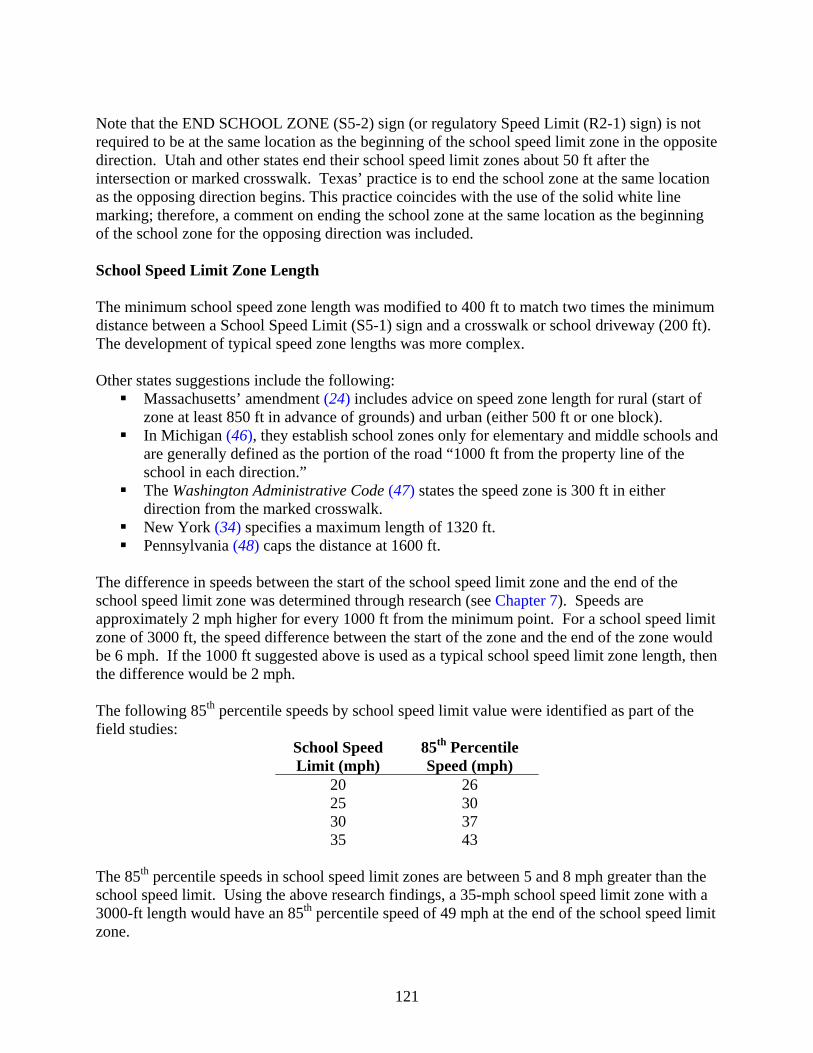
121
Note that the END SCHOOL ZONE (S5-2) sign (or regulatory Speed Limit (R2-1) sign) is not required to be at the same location as the beginning of the school speed limit zone in the opposite direction. Utah and other states end their school speed limit zones about 50 ft after the intersection or marked crosswalk. Texas’ practice is to end the school zone at the same location as the opposing direction begins. This practice coincides with the use of the solid white line marking; therefore, a comment on ending the school zone at the same location as the beginning of the school zone for the opposing direction was included. School Speed Limit Zone Length The minimum school speed zone length was modified to 400 ft to match two times the minimum distance between a School Speed Limit (S5-1) sign and a crosswalk or school driveway (200 ft). The development of typical speed zone lengths was more complex. Other states suggestions include the following:
Massachusetts’ amendment (24) includes advice on speed zone length for rural (start of zone at least 850 ft in advance of grounds) and urban (either 500 ft or one block).
In Michigan (46), they establish school zones only for elementary and middle schools and are generally defined as the portion of the road “1000 ft from the property line of the school in each direction.”
The Washington Administrative Code (47) states the speed zone is 300 ft in either direction from the marked crosswalk.
New York (34) specifies a maximum length of 1320 ft. Pennsylvania (48) caps the distance at 1600 ft.
The difference in speeds between the start of the school speed limit zone and the end of the school speed limit zone was determined through research (see Chapter 7). Speeds are approximately 2 mph higher for every 1000 ft from the minimum point. For a school speed limit zone of 3000 ft, the speed difference between the start of the zone and the end of the zone would be 6 mph. If the 1000 ft suggested above is used as a typical school speed limit zone length, then the difference would be 2 mph. The following 85th percentile speeds by school speed limit value were identified as part of the field studies:
School Speed Limit (mph)
85th Percentile Speed (mph)
20 25 30 35
26 30 37 43
The 85th percentile speeds in school speed limit zones are between 5 and 8 mph greater than the school speed limit. Using the above research findings, a 35-mph school speed limit zone with a 3000-ft length would have an 85th percentile speed of 49 mph at the end of the school speed limit zone.

122
Based on the above considerations, along with discussions with the project monitoring committee and during workshops and presentations on the subject, a typical school speed limit zone length for higher-speed roadways of 1000 ft or 0.2 mi (i.e., 500 ft or 0.1 mi either side of a driveway) is suggested. This zone length section also introduces the buffer zone concept and provides the recommendation that the length of the buffer zone be 500 ft. The 500-ft buffer zone length was selected with consideration of the deceleration rates observed in the field studies and found in the literature. Table 8-2 lists deceleration distances for different deceleration rates included in reference documents such as in A Policy On Geometric Design of Rural Highways (49) by American Association of State Highway Officials (AASHTO) or in a National Cooperative Highway Research Program (NCHRP) report. A comfortable deceleration of 10 ft/sec2 uses approximately 200 ft to decelerate from 70 to 55 or 55 to 35. For initial speeds above 55 mph, the deceleration rate for braking without brakes (i.e., removing the foot from the gas pedal) results in deceleration of 20 mph for approximately every 500 ft. Over 85 percent of the drivers braking to achieve their desired speed through the school zone used a deceleration rate of less than 4.74 ft/sec2 (see Chapter 7). The 4.74 ft/sec2 value is less than the comfortable deceleration rate identified by ITE of 10 ft/sec2. Even with using the more conservative deceleration value, drivers can decelerate from 70 to 55 mph or from 55 to 35 mph in under 500 ft (see final row in Table 8-2).
Table 8-2. Deceleration Distances. Initial Speed (mph): 70 65 60 55Final Speed (mph): 55 50 50 35Source ft/sec2 Deceleration Distances (ft)
AASHTO Blue Book (49), w/o brakes, 30 mph -2.24 904 832 531 868AASHTO Blue Book (49), w/o brakes, 70 mph -3.89 521 479 306 500
AASHTO Blue Book (49), with brakes, 30 mph -5.02 404 371 237 387
AASHTO Blue Book (49), with brakes, 70 mph -7.17 283 260 166 271
Deceleration w/o braking, pg 65 of 1999 ITE Traffic Engineering Handbook (50) -3.28 618 568 362 593
Comfortable deceleration, pg 68 of ITE Traffic Engineering Handbook (50) -10.00 203 186 119 194
Chang et al. (51) -11.60 175 161 102 168Design deceleration from NCHRP 400 (45) -11.15 182 167 107 174
Maximum deceleration to unanticipated object determined in SSD research, NCHRP 400 (45) -24.47 83 76 49 79
Average deceleration rate for drivers braking (from this study, see Chapter 7) -5.33 380 350 223 365
15th percentile rate for drivers braking (from this study, see Chapter 7) -4.74 427 393 251 410

123
School Buffer Zone The School Buffer Zone section provides general information on school buffer zones. The dimensions provided for use with the schematic diagram were developed based on the following:
• MUTCD Table 6C-1 was used for the spacing between Advance School Warning (S1-1) sign and Buffer School Speed Limit (S5-1) sign.
• The distance between School Speed Limit (S5-1) sign to school driveway was based on recommended distances as shown in Table 8-1.
• The suggested spacing between the School Buffer Speed Limit (S5-1) sign and the School Speed Limit (S5-1) sign was set to 500 ft based upon consideration of typical deceleration practices.
• The dimensions between the signs beyond the school driveway, for example, between school driveway and School Buffer Speed Limit (S5-1) sign, were matched to the related signs on the opposing direction.
Active Times The current Texas manual on Procedures for Establishing Speed Zones provides the following for active school times:
• 45 minutes before start of school and 0 minutes after start of school, and • 0 minutes before end of school and 30 minutes after end of school.
Table 8-3 summarizes the practices at the 24 sites included in the field studies by number of minutes before or after the bell. Each column is sorted by the number of minutes to provide a quicker review of the practices. About 3/4 of the field study sites activated their morning school zone for 45 minutes or less, as recommended in the Procedures manual. Only 4 of the 24 sites had the zone active for less than 5 minutes after the morning start of school (TxDOT current recommendation is 0 minutes). For the evening release time, only five schools had a 5-minute or less active period (as compared to TxDOT 0-minute recommendation) for the time period before the end of school. About half of the schools limited the active period after the end of school to 30 minutes or less. Some schools had an active period as long as 75 minutes. The data in Table 8-3 do not represent information regarding the need for longer active periods, perhaps as a result of after-school activities. The data are based upon the times the beacons were observed as active by the researchers and the start and end time reported by the schools. Therefore, more of the sites may be in agreement with the current advice. The field studies identified a trend of higher speeds as the time away from the start or end of school increased. Therefore, keeping shorter active periods can result in more uniform speeds. Based on the above considerations, along with discussions with the project monitoring committee and during workshops and presentations on the subject, the recommendation for active school times is:
• 30 minutes before start of school and 5 minutes after start of school, • from the beginning to the end of the lunch period, and • 5 minutes before end of school and 30 minutes after end of school.
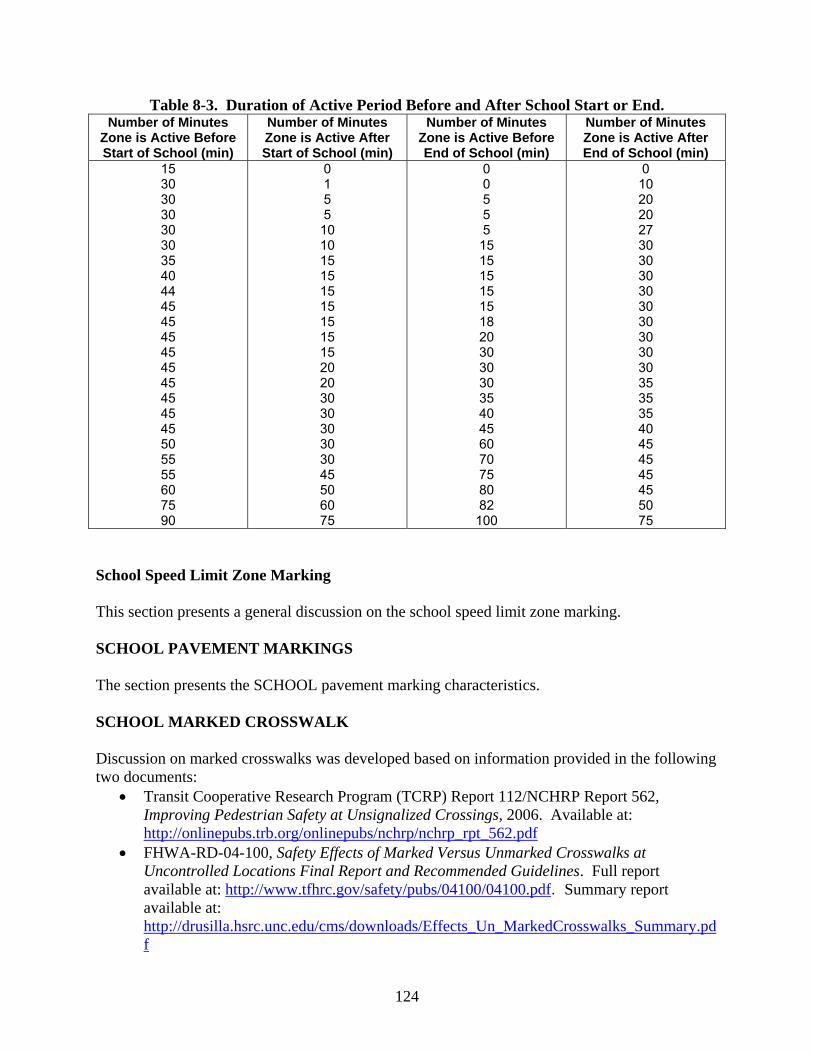
124
Table 8-3. Duration of Active Period Before and After School Start or End. Number of Minutes
Zone is Active Before Start of School (min)
Number of Minutes Zone is Active After Start of School (min)
Number of Minutes Zone is Active Before End of School (min)
Number of Minutes Zone is Active After End of School (min)
15 30 30 30 30 30 35 40 44 45 45 45 45 45 45 45 45 45 50 55 55 60 75 90
0 1 5 5 10 10 15 15 15 15 15 15 15 20 20 30 30 30 30 30 45 50 60 75
0 0 5 5 5 15 15 15 15 15 18 20 30 30 30 35 40 45 60 70 75 80 82
100
0 10 20 20 27 30 30 30 30 30 30 30 30 30 35 35 35 40 45 45 45 45 50 75
School Speed Limit Zone Marking This section presents a general discussion on the school speed limit zone marking. SCHOOL PAVEMENT MARKINGS The section presents the SCHOOL pavement marking characteristics. SCHOOL MARKED CROSSWALK Discussion on marked crosswalks was developed based on information provided in the following two documents:
• Transit Cooperative Research Program (TCRP) Report 112/NCHRP Report 562, Improving Pedestrian Safety at Unsignalized Crossings, 2006. Available at: http://onlinepubs.trb.org/onlinepubs/nchrp/nchrp_rpt_562.pdf
• FHWA-RD-04-100, Safety Effects of Marked Versus Unmarked Crosswalks at Uncontrolled Locations Final Report and Recommended Guidelines. Full report available at: http://www.tfhrc.gov/safety/pubs/04100/04100.pdf. Summary report available at: http://drusilla.hsrc.unc.edu/cms/downloads/Effects_Un_MarkedCrosswalks_Summary.pdf

125
Schematics were generated for typical school signing for marked crosswalks at two-way stop controlled intersections, all-way stop controlled intersections, and signalized intersections. Typical applications included in the Utah 2005 Traffic Control for School Zones (28) aided in the development of the figures. SCHOOL ENTRANCE WARNING ASSEMBLY This is a new section developed as a result of discussions at project monitoring committee meetings. The dimensions identified for the figure were based on Condition A of the TMUTCD Table 2C-4. CONDITIONS FOR REMOVING A SCHOOL SPEED ZONE Material for this section was based on the Dallas District policy on establishing and removing school speed zones.

126
127
CHAPTER 9
SUMMARY AND FINDINGS SUMMARY OF RESEARCH School speed zones are frequently requested traffic controls for school areas, based on the common belief that if the transportation agency would only install a reduced speed limit, then drivers would no longer speed through the area. This research project was tasked with reviewing existing practices and developing guidelines regarding the establishment of school zones. The current policy for setting school speed limits in Texas is primarily contained within two documents: Procedures for Establishing Speed Zones (1), and the Texas Manual on Uniform Traffic Control Devices (2). These documents state that speed zones should be confined to hours when children are going to and from school, and they should be based on pedestrian activity, though traffic may also be a consideration. The use of a school speed zone should be based on an engineering study. Researchers began by documenting existing knowledge on traffic control devices in school zones. This effort took several forms: a review of previous research studies examining effectiveness of devices, a survey of practitioners on signing and marking, a review of state and city school zone guidelines and warrants, and a telephone survey of law enforcement officers. Using this information, the research team identified several areas of emphasis, including characteristics of buffer zone sites and suggested guidelines for traffic control at higher-speed roadways. Researchers collected field data at school zones across Texas and analyzed the data for findings on speed-distance relationships, speed-time relationships, influences of various site characteristics on speeds, and special characteristics of school zones with buffer zones. The findings from the analyses were used in developing suggested guidelines for traffic control devices near schools, including school speed zones. Appendix A presents the guidelines. Literature Several studies noted that driver speed selection in a school zone is affected by more than just the school speed zone limit value. The posted speed value prior to the zone, along with roadway characteristics and the traffic control devices used, also influence drivers’ speed choices in school zones. Studies have indicated that using flashing beacons with the school speed limit assembly provides greater speed reductions than using the WHEN CHILDREN ARE PRESENT or specific time plaques. There is strong evidence that using a speed monitoring display also produces notable speed reductions.

128
Survey of Practice A 25-question survey was developed to gather information on the state-of-the-practice for school speed zones, signing and markings for schools, engineering judgment on when to install a school speed zone, and potential study sites. A total of 12 TxDOT engineers and two city engineers provided responses in December 2006. Key findings from the survey included:
• The majority of the respondents indicated engineering judgment as the criterion used to determine when to establish a school zone.
• The time that the reduced speed limit is active has been an issue for about half of the respondents.
• About half of the respondents have removed a school speed zone in the past five years. The reasons for the removal included a signal being added to the area, a review indicating it was no longer necessary, or the school closing.
• Almost all of the respondents indicated that the school speed zone should be used when school-age pedestrians are crossing the road. About half felt that the school speed zone should be installed (and stated in another manner, about half felt it should not be installed) when school-aged pedestrians are walking along but not crossing the road.
In Fall 2006, the Institute of Transportation Engineers Traffic Engineering Council Committee 106-01 conducted a Web-based survey on school-related traffic control devices. The Web-based survey built on the mail-out survey conducted for this Texas Department of Transportation study and on previous ITE surveys conducted in the mid-1990s and in Spring 1997. The 37-question Web-based survey gathered information on the state-of-the-practice for school speed zones, signing and markings for schools, and engineering judgment on when to install a school speed zone. A total of 168 participants provided responses. Following is an overview of selected findings. Key findings from the survey included:
• The majority (61 percent) indicated that they use engineering judgment and one-third selected guidelines and warrants as the criteria used to determine when to establish a school zone.
• The sign most typically used to indicate the end of a school speed limit zone is the END SCHOOL ZONE (S5-2) sign (56 percent). The regulatory Speed Limit (R2-1) sign also is used by nearly one-half (46 percent) of the respondents. The combination of END SCHOOL ZONE and regulatory Speed Limit (R2-1) sign is used by 18 percent of the respondents.
• Most of the respondents (87 percent, or 144 respondents) do not use a solid white line (12 to 18 inches wide) on the pavement to mark the beginning and ending of the school speed zone.
• In the engineering judgment section of the survey, the participants could indicate where they think a school zone should be used. Most of the participants selected “where school-age pedestrians are crossing the road.”
• For the participants, the operating speed on the roadway was clearly a variable that should affect the decision to install a school speed zone. While not as clear, there was a preference to consider pedestrian volume, roadway traffic volume, and number of lanes being crossed.
129
Review of State Guidelines A review of existing practices revealed guidance ranging from no material to detailed numerical warrants. Common among states’ descriptions of school zones are definitions of the time periods allowed, the appropriate distances from the school and/or associated crosswalk for the limits of the zone, and restrictions for use at high schools or near signalized or stop-controlled intersections. Following is a summary of guidance by topic of interest:
• Most states specify that school zones with reduced speeds have speed limits of 15 or 20 mph in urban and suburban areas, but few specifically mention school zones in rural areas.
• Several states provide cautions on where to use (or not use) a school speed zone, such as not using at high schools or in conjunction with STOP signs or traffic signals.
• Key criteria included in several manuals are: o presence of children walking along or crossing the roadway, o presence of fence around school property, o determination of appropriate gaps for school-age pedestrians to cross the street, o presence of crossing guards, o determination of average pedestrian demand per appropriate gap, o amount of student enrollment at the school, o location of school property (i.e., abutting the right-of-way of the street or highway
or visible from street or highway), and o presence of sidewalks.
• The national MUTCD states that the school speed zone begins either 200 ft from crosswalk or 100 ft from school property line, whichever is encountered first as traffic approaches the school. Several states define minimum or maximum distances to school property lines and/or crosswalks, ranging between 150 ft and 1000 ft from school property.
• Only two states specified maximum lengths (New York 1320 ft and Pennsylvania 1600 ft).
• Florida and Illinois provide general advice on school zone lengths. Florida’s manual states school speed zones “should be kept as short as practical and should not necessarily extend along the entire highway frontage of the school property.” Illinois’ supplement states: “The location of the beginning and end of a 20-mph school speed zone should be based on engineering judgment rather than the exact location of the school property line.”
• The following states have specific guidance on when to install a school speed zone: o Arizona’s guidelines have a point system for their School Crossing Warrants that
consider gaps, pedestrian volume, 85th percentile speed, and demand/gap. o Utah’s detailed procedure for determining if a Reduced-Speed School Zone is
warranted is similar to Arizona’s procedure. o Massachusetts’ amendment to the MUTCD has specifics for when a school zone
is warranted (e.g., children have direct access to street, marked crosswalk is present, school involves a grade below 9th grade, etc.) and not warranted (e.g., children are not required to cross the street, or property is fenced).
130
Law Enforcement Survey Researchers conducted a telephone survey of law enforcement officers to assess current opinions of vehicle compliance with speed reductions in school zones. Thirteen officers representing city police departments or ISD police departments across Texas participated in the survey. Following is a summary of responses to the questions in that survey:
• The majority of the officers contacted (77 percent) felt that drivers complied with reduced school speed limits most of the time.
• All of the officers interviewed implied law enforcement on site would be the most effective factor used to reduce drivers’ speeds in school zones. More than half of the officers indicated that posted speed limit and/or the area in which the school zone was located were major factors that affected drivers’ compliance.
• Almost all of the respondents (12 of 13) felt that the compliance level was 90 percent or better when law enforcement was obvious to the drivers. When enforcement was not obvious, only 33 percent felt that 80 to 90 percent of drivers were in compliance.
• Forty-six percent of the officers felt that a solid white pavement marking line across the lane increased the compliance level when used to indicate the end of the speed zone.
• Eight-five percent of the officers agreed that the END SCHOOL ZONE (S5-2) sign increased compliance when used to indicate the end of the speed zone.
• Nine of the 13 officers preferred a combination of a white pavement marking line and a sign (either the END SCHOOL ZONE (S5-2) sign or the posted Speed Limit (R2-1 sign) to indicate the end of a school speed zone.
• Responses were mixed on where school speed zones should be located, as 85 percent felt that school speed zones should be located at every school, while 62 percent felt that the decision on where and how much to reduce the speed should be based on each individual school’s characteristics.
• The majority of the officers contacted (62 percent) indicated that they used portable speed monitoring displays; however, there were some disagreements on their effectiveness.
• Almost half (46 percent) of the officers stated that they had officers assigned to different schools; most indicated that they were usually rotated.
• Officers provided a variety of other suggestions to improve compliance in school zones, including good signs and markings, speed monitoring displays, more law enforcement, shorter duration of school zones, more public service announcements, approach rumble strips, photo radar, and horizontal (on-pavement) signing.
Field Studies In order to gain a better understanding of traffic characteristics around schools, the research team conducted a number of observational studies at school facilities throughout the state. Researchers conducted studies at a total of 24 school sites. Ten of the schools were located in rural settings; of the 24 sites, eight were in undeveloped areas, and eight more were located in residential areas. Seven schools were located on high-speed (greater than 55 mph) roads and had buffer zones adjacent to their school zones.
131
Researchers collected data through a variety of techniques. Speed data were collected using laser guns, traffic counters, and on-pavement traffic analyzers. Site characteristics were documented through photographs and handwritten notes. After data collection, researchers analyzed the data in a number of different ways. Statistical analyses focused on interactions between speed and site characteristics (e.g., school zone length, presence of sidewalk, posted speed limit, etc.). Analyses of individual vehicles examined the relationships between operating speed and distance through the school zone, focusing on location of minimum speed and speed change behavior. An additional study looked at effects of installing a buffer zone on operating speeds in the school zone. Key findings from the field studies are presented in the following section. Guidelines Development Using the findings from the previous efforts of this study, along with discussions with the TxDOT project monitoring committee, guidelines were developed regarding traffic control for school areas, especially with respect to school speed zones. These guidelines, titled Guidelines for Traffic Control for School Areas, are included as Appendix A in this report. They are intended to serve as a supplement to the TMUTCD (2) and the manual on Procedures for Establishing Speed Zones (1) or, as appropriate, parts of the Guidelines can be incorporated into the Procedures manual. Appendix B presents potential revisions to key reference documents as a result of this research project. Chapter 9 of the report documents the background or sources of material included in the Guidelines. FIELD STUDY FINDINGS This section contains the findings from the analyses of data collected in the project’s field studies. Operating Speed Characteristics Several variables were collected for use in evaluating the potential effects on operating speed in an active school speed limit zone. Conclusions on unique variables include:
• The average speed for sites with a crosswalk includes speeds that are significantly lower than the average speed for the sites without a crosswalk.
• The average speed for sites without a sidewalk is significantly higher than the average speed for the sites with a sidewalk.
• The average speed is higher for sites in rural areas. The lowest speeds recorded were in suburban residential areas, while the highest were in rural mixed and undeveloped locations.
• The lowest speeds are associated with speed zones of the shortest lengths, which is correlated to the lowest school speed limits.
• Lower speeds are associated with a higher number of access points (for both access density and school driveway density).
132
Spot Speed Findings The spot-speed analyses utilized a number of statistical tests for significance. Conclusions from spot-speed analyses include:
• Looking at the data from all study sites, when the beacon is on (i.e., active school zone), the difference in the predicted mean speeds between morning and afternoon (1.27 mph) is statistically significant, but not practically significant.
• Examining study sites separately, only two sites of the 20 included in this analysis (AL-1 and SA-3) had statistically different speeds in the morning active school zone period as compared to the afternoon active school zone period.
• As expected, the speeds observed when the school zone is active are statistically lower when compared to the speeds observed when the school zone is not active; similarly, the mean speed in a buffer zone is significantly lower when the beacon is on than when the beacon is off.
• For most sites, drivers are in better compliance with the regulatory speed limit than with the school speed limit. When the regulatory speed limit was in effect, about half of the sites had a compliance rate of 60 percent or better. When the school speed limit was in force, about half of the sites had a compliance rate of less than 50 percent, with some being lower than 10 percent. Compliance does not appear to be a function of the school speed limit because each speed limit had a broad range of compliance values (9 to 75 percent for 20-mph speed limit and 12 to 94 percent for 35-mph speed limit).
• All of the buffer zone sites had a compliance rate of at least 80 percent when the buffer speed limit was active. When the buffer speed limit was not active (i.e., regulatory speed limit was in effect), the three sites had compliance rates from 70 to 95 percent.
• In the regression analysis that identified which variables affect operating speed in an active school zone, school speed limit dominated all other variables.
• The effects of area type, number of lanes, and school driveway density on average operating speed are statistically significant at α=0.05 level when school speed limit is not in the model. The effect of school driveway density on average speed is negative, which agrees with other research that has found operating speeds to be lower as the number of driveways increase.
• Speeds are higher for greater time increments from the start or end of school. The effects are more pronounced in the morning period than the afternoon; a 1-mph speed difference would be experienced 19 minutes before the start of school or 22 minutes after the start of school, but a similar change would occur over 53 minutes before the end of school and 26 minutes after the end of school.
• Speeds increase as the relative distance within the school zone increases, by a factor of 0.0019. The practical application is that speeds increase approximately 0.9 mph for every 500 ft in school zone length. In other words, for every quarter-mile (1320 ft) of school zone length, speeds can be expected to increase almost 2.5 mph. Thus, longer school zones do not result in lower speeds for a longer distance.
Individual Sites To further investigate the relationships between operating speed and reduced-speed school zones, researchers examined the datasets from individual sites. These analyses were focused on the

133
length and duration of those zones and the time of day relative to the start and end of school. Following are the major conclusions from those analyses:
• Operating speeds increase as the distance from the start of the school zone increases. Trends based on percent of school zone length and absolute distance in the school zone show steady increases in speed as vehicles travel further through the zone.
• The overall minimum speed in a school speed zone typically occurs between 15 and 30 percent of the school zone length. Regardless of the length of the school zone or the school speed limit, drivers tend to achieve their minimum speed some distance after the beginning of the school zone; in this study, that distance was within the first 350 ft for low-speed sites and within 800 ft for higher-speed sites.
• A site’s minimum speed always occurred in the first half of the school zone but is rarely maintained into the second half of the zone. All minimum speeds at the study sites occurred in the first 50 percent of the school zone, and only the shortest school zones had near-minimum speeds recorded downstream of the midpoint of the zone.
• For individual drivers, minimum speeds occurred over a large range of distances (from 500 ft upstream of the school speed limit sign to more than 2000 ft after the school speed limit sign), but most minimum speeds occurred between 150 and 500 ft after the school speed limit sign. In general, minimum speeds occurred closer to the school speed limit sign for the shorter school zones.
• The measured 85th percentile speed was 26 mph for the 20-mph school speed limit, 30 mph for the 25-mph SSL, 37 mph for 30-mph SSL, and 43 mph for the 35-mph SSL.
• The average deceleration for all sites is -3.14 ft/sec2 with a standard deviation of 2.13 ft/sec2. The average deceleration for the different sites ranged between -1.46 and -4.56 ft/sec2. In comparison, typical decelerations when the accelerator pedal is released and the vehicle slows without the use of brakes range between 4.22 ft/sec2 (at an initial speed of 64 mph) to 2.24 ft/sec2 (at an initial speed of 28 mph). The data collected at the schools indicate that the typical driver is coasting (i.e., not using brakes) to obtain the speed reduction in response to a school speed limit sign.
• The field data suggest that drivers complete most of their speed change prior to the beginning of the school zone, but some deceleration takes place within the school zone. At a point early in the school zone, drivers reach their minimum speed, which is rarely less than the school speed limit. This minimum speed may be maintained for a short distance, after which the driver begins to accelerate within the school zone.
CONCLUSIONS The findings from the field study analyses were used in developing suggested guidelines for traffic control devices, including school speed zones, near schools in Texas. Appendix A of this report contains a copy of the Guidelines. The Guidelines are designed to serve as a supplement to the TMUTCD and the manual on Procedures for Establishing Speed Zones. Major topics in the Guidelines include school location, school speed zone characteristics, pavement markings, crosswalks, school entrances, and conditions for removing a school speed zone.

134
135
REFERENCES
1 Texas Department of Transportation. Procedures for Establishing Speed Zones.
(November 2006) Accessed from: http://www.dot.state.tx.us/services/general_services/manuals.htm. Accessed on: May 8, 2007.
2 Texas Department of Transportation. Texas Manual on Uniform Traffic Control Devices. (2006) Accessed from: http://www.dot.state.tx.us/publications/traffic.htm. Accessed on: April 19, 2008.
3 McCoy, P. T., and J. E. Heimann. “School Speed Limits and Speeds in School Zones.” Transportation Research Record 1254. Transportation Research Board, Washington, D.C., 1990.
4 Burritt, B. E., R. C. Buchanan, and E. I. Kalivoda. “School Zone Flashers – Do They Really Slow Traffic?” ITE Journal. January 1990.
5 Aggarwal, G. C., and S. L. Mortensen. “Do Advance School Flashers Reduce Speed?” ITE Journal. October 1993.
6 Hawkins, N. R. “Modified Signs, Flashing Beacons, and School Zone Speeds.” ITE Journal. June 1993.
7 Saibel, C., P. Salzbert, R. Doane, and J. Moffat. “Vehicle Speeds in School Zones.” ITE Journal. November 1999.
8 Schrader, M. H. “Study of Effectiveness of Selected School Zone Traffic Control Devices.” Transportation Research Record 1692. Transportation Research Board, Washington, D.C., 1999.
9 Lazic, G. School Speed Zones: Before and After Study, City of Saskatoon. Presented at the Traffic Operations Research and Applications Session of the 2003 Annual Conference of the Transportation Association of Canada. St. John’s N.L.
10 Hawkins, H. G., and E. R. Rose. “Rear-Facing School Speed Limit Beacons.” Transportation Research Board 2006 Annual Meeting CD-ROM. 2006.
11 Thompson, B., D. Gayne, T. Ranks, and D. Peabody. Evaluation of a Radar Activated Speed Warning Sign. Maine Department of Transportation. Transportation Research Division. Report 313. Accessed from: http://www.maine.gov/mdot/transportation-research/pdf/report0313.pdf. January 2004. Accessed on: August 20, 2007.
12 Lee, C., S. Lee, B. Choi, and Y. Oh. “Effectiveness of Speed Monitoring Displays in Speed Reduction in School Zones.” In Transportation Research Record 1973. Transportation Research Board, Washington, D.C., 2006.
13 Saito, M. K., and G. Ash. Evaluation of Four Recent Traffic Safety Initiatives, Volume IV: Increasing Speed Limit Compliance in Reduced Speed School Zones. Utah Department of Transportation. UT-05.13. June 2005.
14 Ullman, G. L., and E. R. Rose. “Evaluation of Dynamic Speed Display Signs.” Transportation Research Record 1918. Transportation Research Board, Washington, D.C., 2005.
15 KLS Engineering. Evaluation of Driver Feedback Signs. Submitted through Howard University Transportation Research Center to the District Department of Transportation. April 28, 2006.
136
16 Survey of Practice for Signing and Markings Near Schools, An Informational Report. ITE
Transportation Engineering Council Committee TENC-106-01. K. Fitzpatrick, Chair. Institute of Transportation Engineers. 2008.
17 Survey of Traffic Circulation and Safety at School Sites, An Informational Report. ITE Transportation Safety Council Committee TSC-4S-08. Washington, D.C.: Institute of Transportation Engineers (ITE), 1998.
18 A Survey of Establishing Reduced Speed School Zones, An Informational Report. ITE Transportation Safety Council Committee TSC-4S-06. Washington, D.C.: ITE, 2000.
19 Federal Highway Administration. Adoption Status of National MUTCD by States and Federal Agencies, November 28, 2006. Accessible via mutcd.fhwa.dot.gov/knowledge/natl_adopt_2000_2003.htm. Accessed on: April 20, 2007.
20 Federal Highway Administration. Manual on Uniform Traffic Control Devices (MUTCD). August 11, 2008. Accessible via http://mutcd.fhwa.dot.gov/. Accessed on August 29, 2008.
21 Alaska Department of Transportation. Alaska Traffic Manual Supplement to the 2003 Edition MUTCD, Rev. 1. Part 7. Traffic Control for School Areas. (December 2005) Accessed from: http://www.dot.state.ak.us/stwddes/dcstraffic/atmintro.shtml. Accessed on: April 6, 2007.
22 Georgia Department of Transportation. Toolkit 3: Children and School Zones. (August 7, 2007) Accessed from: http://www.dot.state.ga.us/DOT/plan-prog/planning/projects/bicycle/ped_facilities_guide/3_children_and_school_zones.pdf. Accessed on: August 20, 2007.
23 Illinois Department of Transportation. Illinois Supplement to the National Manual on Uniform Traffic Control Devices. (2003) Accessed from: http://www.dot.il.gov/mutcd/mutcd2003ilsupplement.pdf. Accessed on: August 22, 2007.
24 Massachusetts Amendments to the MUTCD 2003 Edition and Standard Municipal Traffic Code. (October 2006) Accessed from: http://www.mhd.state.ma.us/downloads/trafficMgmt/MA-Amendments-MUTCD.pdf. Accessed on: August 22, 2007.
25 North Carolina Department of Transportation, Division of Bicycle and Pedestrian Transportation. “School Zone Laws of North Carolina.” (February 12, 2007) Accessed from: http://www.ncdot.org/transit/bicycle/laws/laws_schoolzone.html. Accessed on: August 24, 2007.
26 Ohio Department of Transportation, Office of Traffic Engineering. Ohio Manual of Uniform Traffic Control Devices. (2005). Accessed from: http://www.dot.state.oh.us/traffic/Publication%20Manuals/omutcd/2005OMUTCD/OMUTCD.htm. Accessed on: August 24, 2007.
27 Oregon Department of Transportation. A Guide to School Area Safety. (August 2006) Accessed from: http://www.oregon.gov/ODOT/HWY/TRAFFIC-ROADWAY/school_zone_speed_limit.shtml. Accessed on: April 19, 2007.
28 Utah Department of Transportation, Division of Traffic and Safety. Utah Traffic Controls for School Zones. (2005) Accessed from: http://www.udot.utah.gov/main/f?p=100:pg:6735775148423343691::::T,V:578. Accessed on: August 24, 2007.

137
29 Washington State Department of Transportation. Traffic Operations. (2005) Accessed
from: http://www.wsdot.wa.gov/biz/trafficoperations/mutcd.htm. Accessed on: August 24, 2007.
30 Arizona Department of Transportation. Traffic Safety for School Areas Guidelines 2006. (October 2006) Accessed from: http://www.azdot.gov/Highways/Traffic/Standards/School_Safety/SchoolSafety_120106.pdf. Accessed on: April 6, 2007.
31 Safe Routes to School National Partnership (SRTSNP). Safe Routes to School Website - California. (2007) Accessed from: http://www.saferoutespartnership.org/state/4373/california. Accessed on: April 21, 2008.
32 Florida Department of Transportation, Traffic Engineering and Operations. “Establishing School Zones and School Crossings.” (May 3, 2006) Accessed from: http://www2.dot.state.fl.us/proceduraldocuments/procedures/proceduresbytitle.asp?index=E. Accessed on: April 19, 2007.
33 Minnesota Department of Transportation. A Guide to Establishing Speed Limits in School Zones. Order No. 63700. With addendum referencing 2003 MUTCD. April 30, 1980.
34 New York State Department of Transportation. New York Supplement to the MUTCD. (2007) Accessed from: https://www.nysdot.gov/portal/page/portal/divisions/operating/oom/transportation-systems/traffic-operations-section/mutcd. Accessed on: September 26, 2007.
35 The Pennsylvania Bulletin. “Rules and Regulations Title 67-Transporportation.” (August 2004) Accessed from: http://www.pabulletin.com/secure/data/vol36/36-5/179.html. Accessed on: August 24, 2007.
36 West Virginia Department of Transportation, Traffic Engineering Directive 701-2. (August 14, 2003) Accessed from: http://www.wvdot.com/engineering/TEDs.htm. Accessed on: August 24, 2003.
37 California Department of Transportation. California MUTCD (FHWA’S MUTCD 2003 Revision 1, as amended for use in California) Accessed from: http://www.dot.ca.gov/hq/traffops/signtech/mutcdsupp/pdf/camutcd/CAMUTCD-SCHOOL.pdf. Accessed on: April 10, 2008.
38 Kentucky Transportation Cabinet. Traffic Operations Guidance Manual. “Regulatory Signs, Speed Regulations.” (March 2007). TO-402-5. Accessed from: http://transportation.ky.gov/traffic/operations.htm. Accessed on: August 20, 2007.
39 Michigan Legislature. “Michigan Vehicle Code (Excerpt), Act 300 of 1949. Section 257.627a. (July 20, 2005) Accessed from: http://www.legislature.mi.gov/(S(2k4k2y55d3tynv2ftubwgrbt))/mileg.aspx?page=GetMCLDocument&objectname=mcl-257-627a. Accessed on: August 22, 2007.
40 “Oklahoma Statutes, Title 47.” (November 1, 1999) Accessed from: http://www.lsb.state.ok.us/. Accessed on: August 24, 2007.
41 Federal Highway Administration. Manual on Uniform Traffic Control Devices, Federal Register. (January 2, 2008) Accessed from: http://mutcd.fhwa.dot.gov/res-notices.htm. Accessed on: April 19, 2008.
42 Missouri Department of Transportation Engineering Policy Guide. “902.4 Flashers and Signals for Schools and Other Special Applications.” (May 9, 2007) Accessed from:
138
http://epg.modot.org/index.php?title=902.4_Flashers_and_Signals_for_Schools_and_Other_Special_Applications. Accessed on: April 17, 2008.
43 Fitzpatrick, K., P. Carlson, M. Brewer, M. Wooldridge, and S. Miaou. Design Speed, Operating Speed, and Posted Speed Practices. NCHRP Report 504. Transportation Research Board, 2003.
44 Fitzpatrick, K., K. Zimmerman, R. Bligh, S. Chrysler, and B. Blaschke. Criteria for Very High Design Speed Facilities. Final Report. FHWA/TX-06/5544-1. March 2007.
45 Fambro, D. B., K. Fitzpatrick, and R. J. Koppa. Determination of Stopping Sight Distances. NCHRP 400. Transportation Research Board, Washington, D.C., 1997.
46 Road Commission for Oakland County, Michigan. “How Fast is Too Fast Or, How Speed Limits Are Set.” (August 1998) Accessed from: http://www.rcocweb.org/about/publications/Speed.pdf. Accessed on: August 22, 2007.
47 Washington State Legislature. Washington Administrative Code (2007) Accessed from http://search.leg.wa.gov/pub/textsearch/ViewRoot.asp?Action=Html&Item=7&X=925070135&p=1. Accessed on August 24, 2007.
48 The Pennsylvania Bulletin. “Rules and Regulations Title 67-Transporportation (continued from previous web page).”(August 2004) Accessed from: http://www.pabulletin.com/secure/data/vol36/36-5/179a.html. Accessed on: January 23, 2009.
49 A Policy On Geometric Design of Rural Highways. American Association of State Highway Officials, Washington, D.C., 1965.
50 Institute of Transportation Engineers. Traffic Engineering Handbook, Fifth Edition. J.L. Pline, Editor. Prentice-Hall, Inc. 1999.
51 Chang, M. S., C. J. Messer, and A. J. Santiago. “Timing Traffic Signal Change Intervals Based on Driver Behavior.” Transportation Research Record 1027. Transportation Research Board, Washington, D.C., 1985, pp 20-30.

Guidelines for Traffic Control for School Areas
February 2009
0-5470-1 (Appendix A)
http://tti.tamu.edu/documents/0-5470-1-AppendixA.pdf

APPENDIX A
GUIDELINES FOR TRAFFIC CONTROL FOR SCHOOL AREAS
of
TxDOT REPORT 0-5470-1: SPEEDS IN SCHOOL ZONES
Project 0-5470 Project Title: Comprehensive Guide to Traffic Control Near Schools
Performed in cooperation with the Texas Department of Transportation
and the Federal Highway Administration
September 2008
Published: February 2009
TEXAS TRANSPORTATION INSTITUTE The Texas A&M University System College Station, Texas 77843-3135

TABLE OF CONTENTS
Page
APPENDIX A GUIDELINES FOR TRAFFIC CONTROL FOR SCHOOL AREAS LIST OF FIGURES ........................................................................................................................................................................... A-iv LIST OF TABLES ............................................................................................................................................................................. A-iv INTRODUCTION .............................................................................................................................................................................. A-1 SCHOOL LOCATION ....................................................................................................................................................................... A-1 DEFINITIONS .................................................................................................................................................................................... A-1 SCHOOL AREA ................................................................................................................................................................................. A-3 SCHOOL SPEED LIMIT ZONE ....................................................................................................................................................... A-3 SCHOOL SPEED LIMIT ZONE CHARACTERISTICS .................................................................................................................. A-9
School Speed Limit Value .............................................................................................................................................................. A-9 School Speed Limit Zone Beginning Location ............................................................................................................................... A-9 School Speed Limit Zone Length ................................................................................................................................................. A-10 School Buffer Zone ....................................................................................................................................................................... A-10 Active Times ................................................................................................................................................................................. A-13 School Speed Limit Zone Marking ............................................................................................................................................... A-13
SCHOOL PAVEMENT MARKINGS ............................................................................................................................................. A-13 SCHOOL MARKED CROSSWALK .............................................................................................................................................. A-13 SCHOOL ENTRANCE WARNING ASSEMBLY ......................................................................................................................... A-20 CONDITIONS FOR REMOVING A SCHOOL SPEED ZONE ..................................................................................................... A-20
A-iii
A-iv
LIST OF FIGURES Page
Figure A-1. Typical School Area Signing (See Table A-1 for Suggested Dimensions for Distance d). ............................................... A-4 Figure A-2. Typical School Speed Limit Zone with Marked Crosswalk at a Two-Way Stop Controlled Intersection (See Table A-2 for Suggested Dimensions for Distance d1, d2, and d3). ................................................................................. A-7 Figure A-3. Typical School Speed Limit Zone with Marked Crosswalk at Midblock (See Table A-2 for Suggested Dimensions for Distance d1, d2, and d3). .............................................................................................................................................. A-8 Figure A-4. Typical School Speed Limit Zone with School Buffer Zones, Example Shown for Posted Speed of 70 mph (see Table A-4 for Suggested Dimensions for Distance d1, d2, d3, d4, and d5). ................................................................... A-12 Figure A-5. Typical School Signing for Marked Crosswalk at a Two-Way Stop Controlled Intersection (see Table A-5 for Suggested Dimensions for Distance d). ........................................................................................................................... A-17 Figure A-6. Typical School Signing for Marked Crosswalk at an All-Way Stop Controlled Intersection (see Table A-5 for Suggested Dimensions for Distance d). ........................................................................................................................... A-18 Figure A-7. Typical School Signing for Marked Crosswalk at a Signalized Intersection (see Table A-5 for Suggested Dimensions for Distance d). ............................................................................................................................................ A-19 Figure A-8. School Entrance Warning Assembly Example (see Table A-6 for Suggested Dimensions for Distance d). .................. A-21
LIST OF TABLES Page
Table A-1. Suggested Dimensions for Distance d in Figure A-1. ......................................................................................................... A-3 Table A-2. Suggested Dimensions for Distances in Figure A-2 and Figure A-3. ................................................................................. A-6 Table A-3. Suggested School Speed Limit Based on 85th Percentile Speed. ........................................................................................ A-9 Table A-4. Suggested Dimensions for Distances in Figure A-4. ......................................................................................................... A-11 Table A-5. Suggested Dimensions for Distances in Figure A-5, Figure A-6, and Figure A-7. ........................................................... A-16 Table A-6. Suggested Dimensions for Distances in Figure A-8. ......................................................................................................... A-20

INTRODUCTION To achieve uniformity of traffic control in school areas, comparable traffic situations need to be treated in a consistent manner. The Texas Manual on Uniform Traffic Control Devices (TMUTCD) Part 7 (available at: http://www.txdot.gov/txdot_library/publications/government/project_development/traffic_operations.htm) provides information on traffic control devices related to schools. The Texas Department of Transportation (TxDOT) manual on Procedures for Establishing Speed Zones provides information on school speed zones. A recent TxDOT project (0-5470) investigated school speed zones and developed the Guidelines for Traffic Control for School Areas contained in this appendix. The purpose of these Guidelines is to augment the TMUTCD by providing additional background and information to assist in the traffic control device applications. The Guidelines are not intended to establish policy or procedures; rather they are to give typical guidance. Although the text may contain the words “shall,” “should,” or “may,” it is not intended that these words or their usage have the same implications as in the TMUTCD. An engineering and traffic investigation should be conducted to determine the need for a school speed limit as well as all appropriate traffic control devices. SCHOOL LOCATION A previous TxDOT research project developed recommended guidelines regarding traffic operations and safety at schools (available at: http://tti.tamu.edu/documents/4286-2.pdf). An initial principle developed and emphasized in several discussions is the desire to have schools located with appropriate accessibility from the adjacent roadway network based on the type of school. One of the prominent site selection criteria was to avoid locations with direct access to high-speed roadways (e.g., trunk highways and frontage roads). Locations should be chosen on roadways with the lowest speed limit and/or lowest average daily traffic. Also suggested was to locate a school so that students approaching on foot would not have to cross main traffic routes and to consider locating schools adjacent to other community facilities where there is potential for shared-use parking (e.g., parks, churches, etc.). Maintaining contact with school officials can help TxDOT become aware of proposed school site designs at an early stage. When proposed building plans are known, suggestions on access points can be made that could minimize future problems. Also the installation of appropriate safety and traffic control devices can be scheduled to be in place when needed. An engineering and traffic investigation should be conducted to determine the need for traffic control devices. DEFINITIONS Following are definitions for use with these Guidelines.
A-1
School = location where children in grades from kindergarten through the 12th grade receive academic instruction. School Area = the portion of the roadway adjacent to school building(s) or grounds or where school-related activity is occurring. School Zone = a defined portion of a roadway associated with a school. School Speed Limit Zone = a defined portion of the roadway where a school speed limit is present. School Speed Limit = a speed limit posted in a school zone that is lower than the regulatory speed limit in that zone and is applicable during specific times of day on school days, when children are present, or when beacons are flashing. School Buffer Zone = a defined portion of the highway in advance of and/or following a school speed limit zone where a school buffer speed limit is present. School Buffer Speed Limit = a speed limit posted in a school zone that is lower than the regulatory speed limit in that zone but higher than the school speed limit, used to provide a transition between higher posted speed and school zone speed; it is applicable during the same time periods as the associated school speed limit. School Entrance Warning Assembly = combination of signs warning drivers of the presence of a school entrance. The combination may be accompanied by an advisory speed plaque. School Route Plan (also known as School Route Map) = a plan developed in a systematic manner by the school, law enforcement, and traffic officials responsible for school pedestrian safety. It consists of a map showing streets, the school, existing traffic controls, established school walk routes, and established school crossings. See the TMUTCD or Safe Routes to School website (http://www.saferoutesinfo.org/) for additional discussion. School speed limit zones shall only be located along child access routes as indicated on the school route plan. Traffic Control Devices = all signs, signals, markings, and other devices used to regulate, warn, or guide traffic, placed on, over, or adjacent to a street, highway, pedestrian facility, bikeway, public facility, or private property open to public travel by authority of a public agency or official having jurisdiction.
A-2
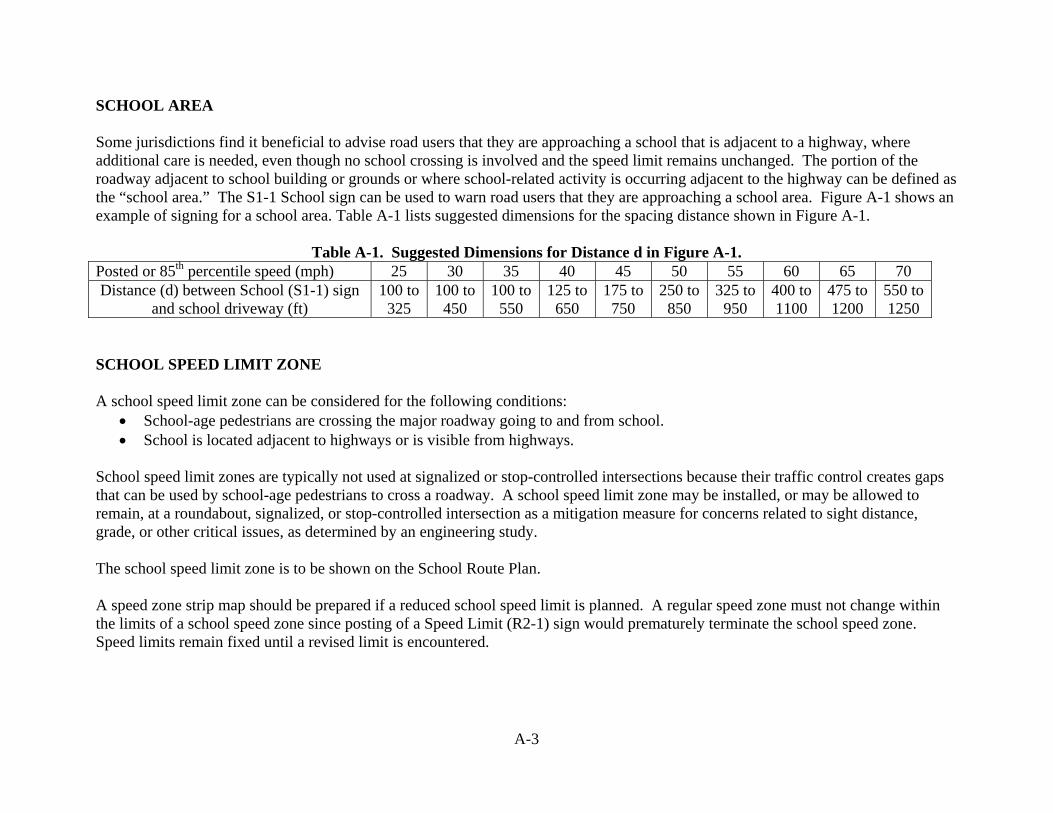
SCHOOL AREA Some jurisdictions find it beneficial to advise road users that they are approaching a school that is adjacent to a highway, where additional care is needed, even though no school crossing is involved and the speed limit remains unchanged. The portion of the roadway adjacent to school building or grounds or where school-related activity is occurring adjacent to the highway can be defined as the “school area.” The S1-1 School sign can be used to warn road users that they are approaching a school area. Figure A-1 shows an example of signing for a school area. Table A-1 lists suggested dimensions for the spacing distance shown in Figure A-1.
Table A-1. Suggested Dimensions for Distance d in Figure A-1. Posted or 85th percentile speed (mph) 25 30 35 40 45 50 55 60 65 70 Distance (d) between School (S1-1) sign
and school driveway (ft) 100 to
325 100 to
450 100 to
550 125 to
650 175 to
750 250 to
850 325 to
950 400 to 1100
475 to 1200
550 to 1250
SCHOOL SPEED LIMIT ZONE A school speed limit zone can be considered for the following conditions:
• School-age pedestrians are crossing the major roadway going to and from school. • School is located adjacent to highways or is visible from highways.
School speed limit zones are typically not used at signalized or stop-controlled intersections because their traffic control creates gaps that can be used by school-age pedestrians to cross a roadway. A school speed limit zone may be installed, or may be allowed to remain, at a roundabout, signalized, or stop-controlled intersection as a mitigation measure for concerns related to sight distance, grade, or other critical issues, as determined by an engineering study. The school speed limit zone is to be shown on the School Route Plan. A speed zone strip map should be prepared if a reduced school speed limit is planned. A regular speed zone must not change within the limits of a school speed zone since posting of a Speed Limit (R2-1) sign would prematurely terminate the school speed zone. Speed limits remain fixed until a revised limit is encountered.
A-3
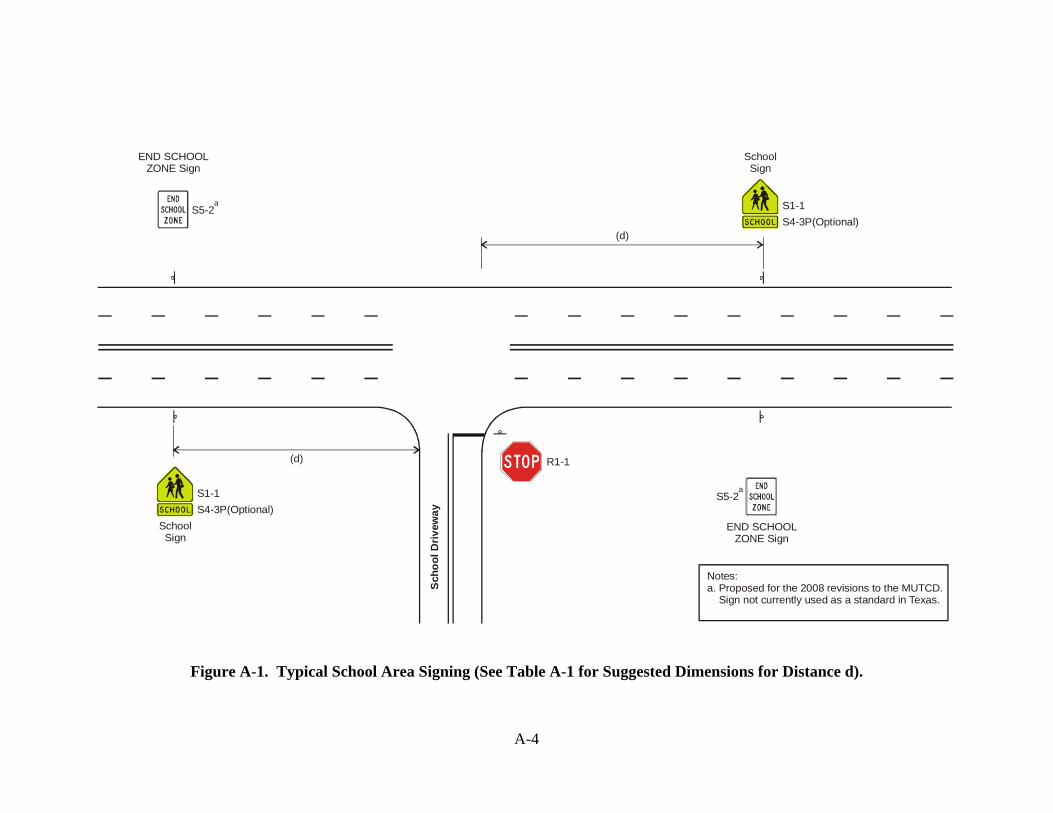
S1-1S4-3P(Optional)
(d)
(d)
SchoolSign
S1-1S4-3P(Optional)
SchoolSign
END SCHOOLZONE Sign
S5-2a
S5-2a
Notes:a. Proposed for the 2008 revisions to the MUTCD. Sign not currently used as a standard in Texas.
Sch
ool D
rivew
ay
R1-1
END SCHOOLZONE Sign
Figure A-1. Typical School Area Signing (See Table A-1 for Suggested Dimensions for Distance d).
A-4
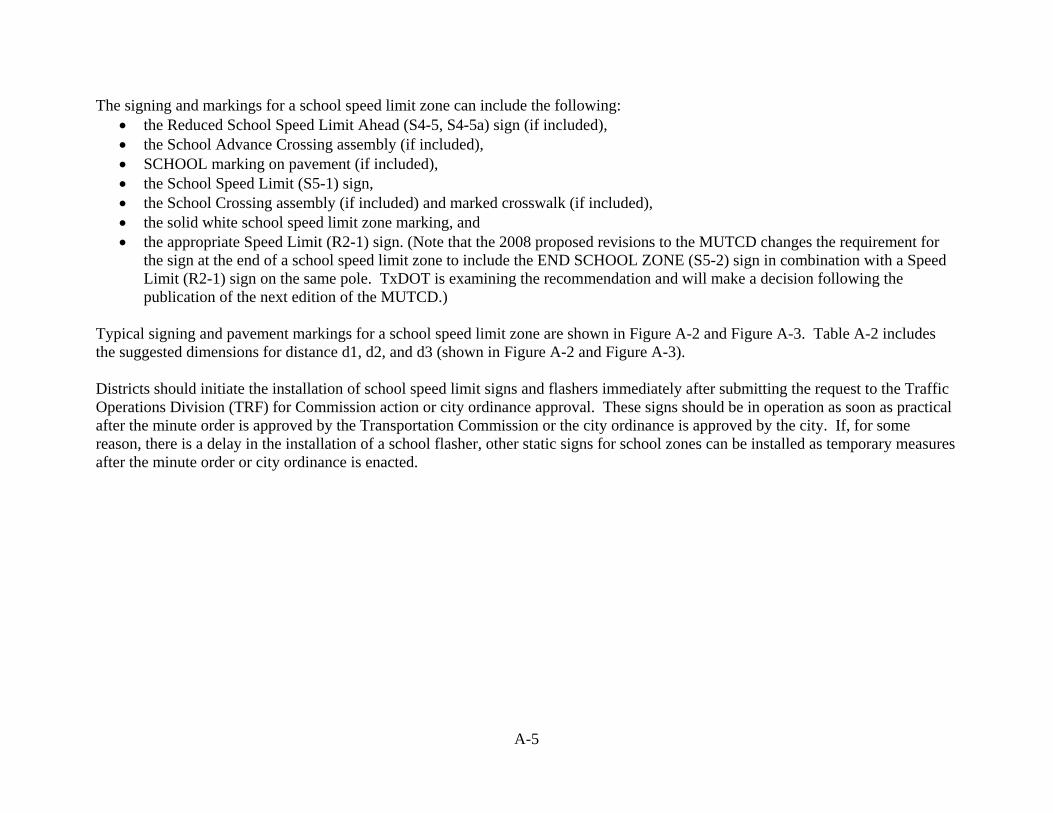
The signing and markings for a school speed limit zone can include the following: • the Reduced School Speed Limit Ahead (S4-5, S4-5a) sign (if included), • the School Advance Crossing assembly (if included), • SCHOOL marking on pavement (if included), • the School Speed Limit (S5-1) sign, • the School Crossing assembly (if included) and marked crosswalk (if included), • the solid white school speed limit zone marking, and • the appropriate Speed Limit (R2-1) sign. (Note that the 2008 proposed revisions to the MUTCD changes the requirement for
the sign at the end of a school speed limit zone to include the END SCHOOL ZONE (S5-2) sign in combination with a Speed Limit (R2-1) sign on the same pole. TxDOT is examining the recommendation and will make a decision following the publication of the next edition of the MUTCD.)
Typical signing and pavement markings for a school speed limit zone are shown in Figure A-2 and Figure A-3. Table A-2 includes the suggested dimensions for distance d1, d2, and d3 (shown in Figure A-2 and Figure A-3). Districts should initiate the installation of school speed limit signs and flashers immediately after submitting the request to the Traffic Operations Division (TRF) for Commission action or city ordinance approval. These signs should be in operation as soon as practical after the minute order is approved by the Transportation Commission or the city ordinance is approved by the city. If, for some reason, there is a delay in the installation of a school flasher, other static signs for school zones can be installed as temporary measures after the minute order or city ordinance is enacted.
A-5
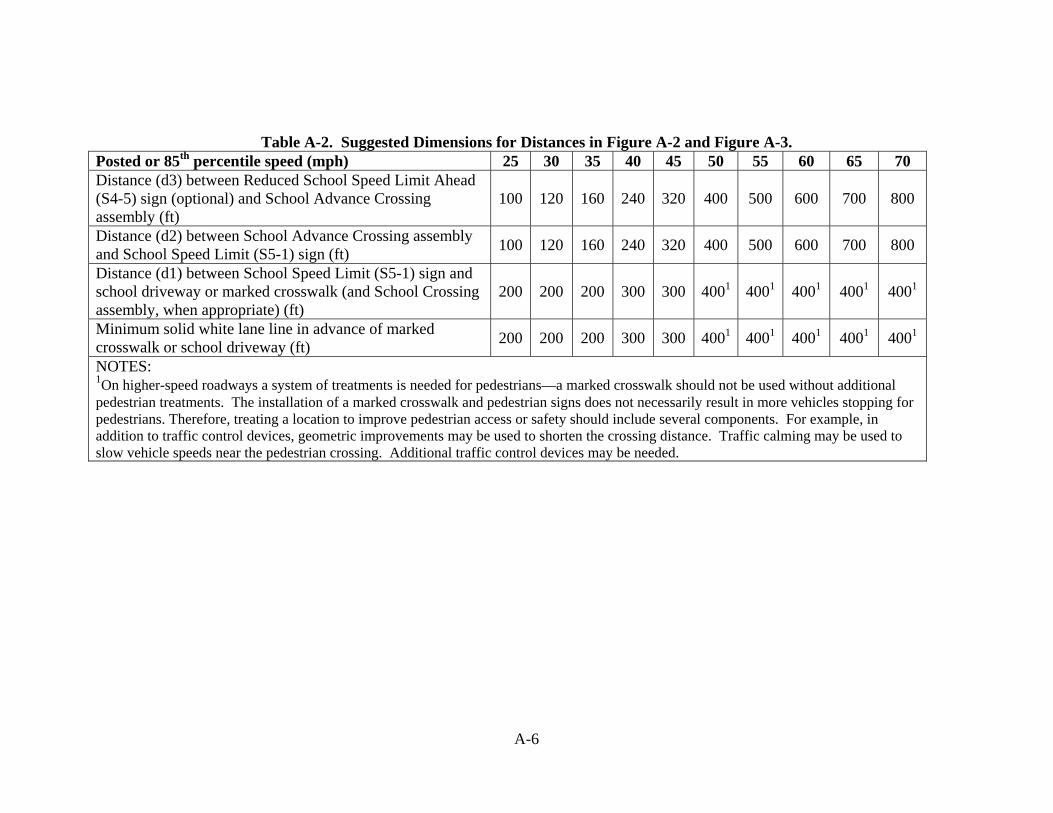
A-6
Table A-2. Suggested Dimensions for Distances in Figure A-2 and Figure A-3. Posted or 85th percentile speed (mph) 25 30 35 40 45 50 55 60 65 70 Distance (d3) between Reduced School Speed Limit Ahead (S4-5) sign (optional) and School Advance Crossing assembly (ft)
100 120 160 240 320 400 500 600 700 800
Distance (d2) between School Advance Crossing assembly and School Speed Limit (S5-1) sign (ft) 100 120 160 240 320 400 500 600 700 800
Distance (d1) between School Speed Limit (S5-1) sign and school driveway or marked crosswalk (and School Crossing assembly, when appropriate) (ft)
200 200 200 300 300 4001 4001 4001 4001 4001
Minimum solid white lane line in advance of marked crosswalk or school driveway (ft) 200 200 200 300 300 4001 4001 4001 4001 4001
NOTES: 1On higher-speed roadways a system of treatments is needed for pedestrians—a marked crosswalk should not be used without additional pedestrian treatments. The installation of a marked crosswalk and pedestrian signs does not necessarily result in more vehicles stopping for pedestrians. Therefore, treating a location to improve pedestrian access or safety should include several components. For example, in addition to traffic control devices, geometric improvements may be used to shorten the crossing distance. Traffic calming may be used to slow vehicle speeds near the pedestrian crossing. Additional traffic control devices may be needed.
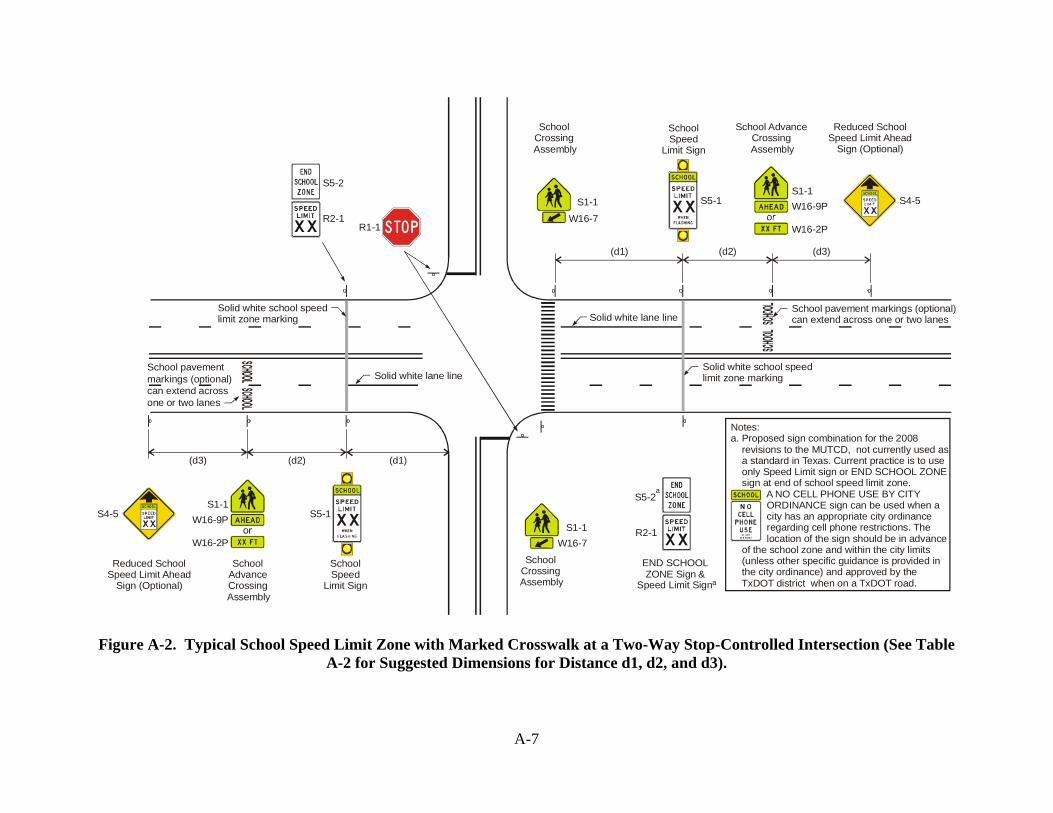
Solid white lane line
R1-1
SchoolCrossingAssembly
S1-1W16-7
(d3)
S4-5S1-1W16-9P
W16-2P
S5-1
(d1) (d2)
Solid white school speedlimit zone marking
Solid white lane lineSchool pavement markings (optional)can extend across one or two lanes
Reduced SchoolSpeed Limit Ahead
Sign (Optional)
School AdvanceCrossing
Assembly
SchoolSpeed
Limit Sign
S1-1
W16-7
R2-1
S5-2a
(d3) (d1)(d2)
S4-5S1-1
W16-9P
W16-2P
S5-1
Reduced SchoolSpeed Limit Ahead
Sign (Optional)
SchoolAdvanceCrossing
Assembly
SchoolSpeed
Limit Sign
Solid white school speedlimit zone marking
S5-2
R2-1
School pavementmarkings (optional)can extend across one or two lanes
SchoolCrossing
Assembly
END SCHOOLZONE Sign &
Speed Limit Sign
a
Notes:a. Proposed for the 2008 revisions to the MUTCD, not currently used as a standard in Texas. Current practice is to use only Speed Limit sign or END SCHOOL ZONE sign at end of school speed limit zone. A NO CELL PHONE USE BY CITY ORDINANCE sign can be used when a city has an appropriate city ordinance regarding cell phone restrictions. The location of the sign should be in advance of the school zone and within the city limits (unless other specific guidance is provided in the city ordinance) and approved by the TxDOT district when on a TxDOT road.
sign combination
Figure A-2. Typical School Speed Limit Zone with Marked Crosswalk at a Two-Way Stop-Controlled Intersection (See Table A-2 for Suggested Dimensions for Distance d1, d2, and d3).
A-7
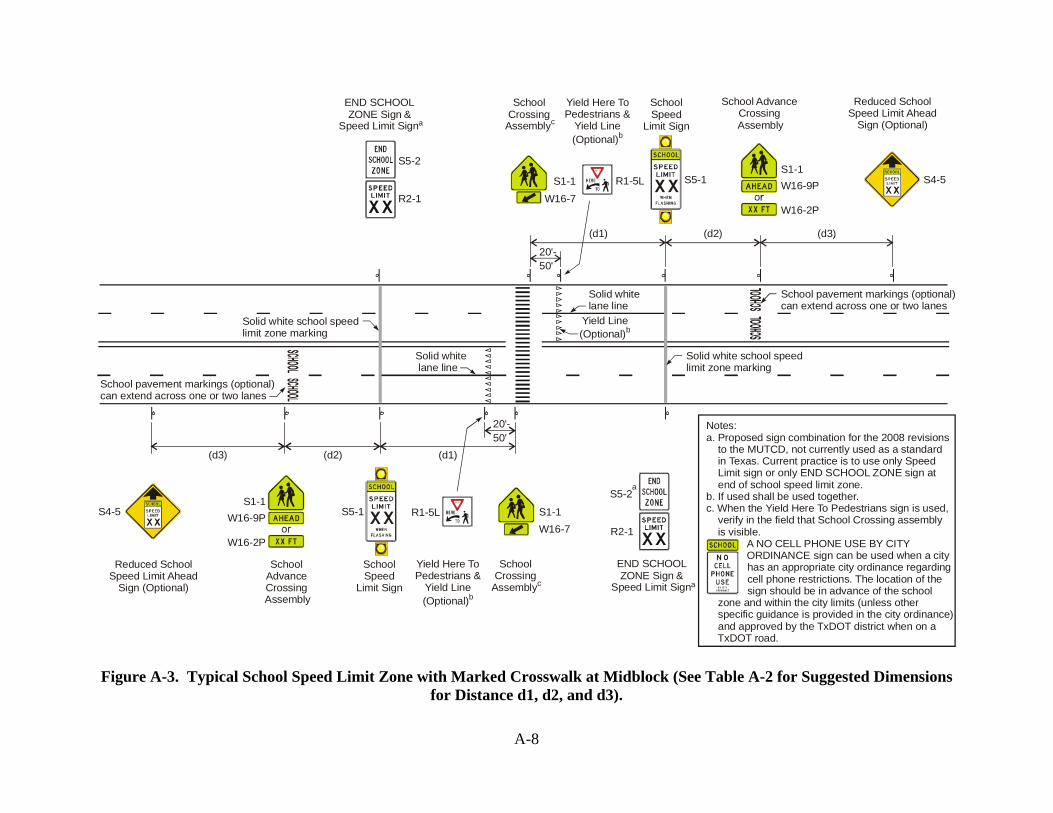
(d3)
S4-5
S4-5S1-1W16-9P
W16-2P
S5-1
S1-1W16-9P
W16-2P
S5-1
(d1) (d2)
(d3) (d1)(d2)
20'-50'
20'-50'
Solid white school speedlimit zone marking
Solid white school speedlimit zone marking
Solid white lane line
Solid whitelane line
School pavement markings (optional)can extend across one or two lanes
School pavement markings (optional)can extend across one or two lanes
Reduced SchoolSpeed Limit Ahead
Sign (Optional)
Reduced SchoolSpeed Limit Ahead
Sign (Optional)
SchoolAdvanceCrossing
Assembly
School AdvanceCrossing
Assembly
SchoolSpeed
Limit Sign
SchoolSpeed
Limit Sign
SchoolCrossing
Assemblyc
R1-5L
S1-1W16-7
S1-1
W16-7
R2-1
S5-2
R2-1
Notes:a. Proposed for the 2008 revisions to the MUTCD, not currently used as a standard in Texas. Current practice is to use only Speed Limit sign or only END SCHOOL ZONE sign at end of school speed limit zone. b. If used shall be used together.c. When the Yield Here To Pedestrians sign is used, verify in the field that School Crossing assembly is visible. A NO CELL PHONE USE BY CITY ORDINANCE sign can be used when a city has an appropriate city ordinance regarding cell phone restrictions. The location of the sign should be in advance of the school zone and within the city limits (unless other specific guidance is provided in the city ordinance) and approved by the TxDOT district when on a TxDOT road.
sign combination
S5-2a
Yield Here ToPedestrians &
Yield Line(Optional)b
SchoolCrossing
Assemblyc
Yield Here ToPedestrians &
Yield Line(Optional)b
R1-5L
END SCHOOLZONE Sign &
Speed Limit Sign
a
Yield Line(Optional)b
END SCHOOLZONE Sign &
Speed Limit Sign
a
Figure A-3. Typical School Speed Limit Zone with Marked Crosswalk at Midblock (See Table A-2 for Suggested Dimensions for Distance d1, d2, and d3).
A-8

SCHOOL SPEED LIMIT ZONE CHARACTERISTICS School Speed Limit Value The suggested value for the school speed limit is listed in Table A-3. Factual studies, reason, and sound engineering judgment, rather than emotion, should govern the final decision on the maximum deviation from the 85th percentile speed, which will provide a reasonable and prudent speed limit.
Table A-3. Suggested School Speed Limit Based on 85th Percentile Speed. 85th Percentile Speed Suggested School Speed Limit Below 55 mph Not more than 15 mph below 85th percentile speed or posted
speed. Not to exceed a 35 mph school speed limit. 55 mph 20 mph below the 85th percentile speed or posted speed Greater than 55 mph Use buffer zone to transition to a 35 mph school speed limit
School Speed Limit Zone Beginning Location The 2006 TMUTCD states that the School Speed Limit Zone should begin either at a point 200 ft from the crosswalk, or from the first driveway on school property, whichever is encountered first as traffic approaches the school. Researchers suggest having the beginning of the School Speed Limit Zone based upon the school speed limit as follows:
School Speed Limit (mph)
Distance to Crosswalk or First Driveway (ft)
20 25 30 35
200 200 300 400
The location of the beginning and end of a school speed limit zone should be based on engineering judgment rather than the exact location of the school property line or fence. A practice in Texas is to end the school speed limit zone at the same location as the opposing school speed limit zone begins and to use a transverse solid white line across all travel lanes to mark the beginning and ending of a school speed limit zone.
A-9
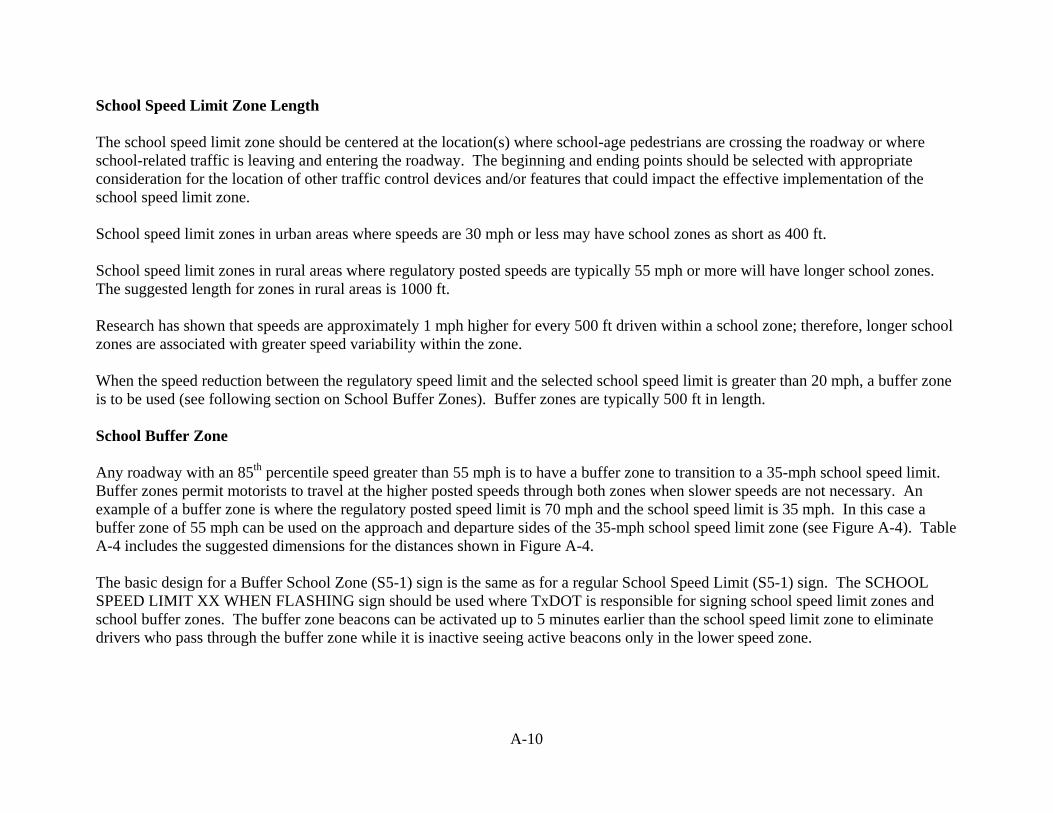
School Speed Limit Zone Length The school speed limit zone should be centered at the location(s) where school-age pedestrians are crossing the roadway or where school-related traffic is leaving and entering the roadway. The beginning and ending points should be selected with appropriate consideration for the location of other traffic control devices and/or features that could impact the effective implementation of the school speed limit zone. School speed limit zones in urban areas where speeds are 30 mph or less may have school zones as short as 400 ft. School speed limit zones in rural areas where regulatory posted speeds are typically 55 mph or more will have longer school zones. The suggested length for zones in rural areas is 1000 ft. Research has shown that speeds are approximately 1 mph higher for every 500 ft driven within a school zone; therefore, longer school zones are associated with greater speed variability within the zone. When the speed reduction between the regulatory speed limit and the selected school speed limit is greater than 20 mph, a buffer zone is to be used (see following section on School Buffer Zones). Buffer zones are typically 500 ft in length. School Buffer Zone Any roadway with an 85th percentile speed greater than 55 mph is to have a buffer zone to transition to a 35-mph school speed limit. Buffer zones permit motorists to travel at the higher posted speeds through both zones when slower speeds are not necessary. An example of a buffer zone is where the regulatory posted speed limit is 70 mph and the school speed limit is 35 mph. In this case a buffer zone of 55 mph can be used on the approach and departure sides of the 35-mph school speed limit zone (see Figure A-4). Table A-4 includes the suggested dimensions for the distances shown in Figure A-4. The basic design for a Buffer School Zone (S5-1) sign is the same as for a regular School Speed Limit (S5-1) sign. The SCHOOL SPEED LIMIT XX WHEN FLASHING sign should be used where TxDOT is responsible for signing school speed limit zones and school buffer zones. The buffer zone beacons can be activated up to 5 minutes earlier than the school speed limit zone to eliminate drivers who pass through the buffer zone while it is inactive seeing active beacons only in the lower speed zone.
A-10

Table A-4. Suggested Dimensions for Distances in Figure A-4. Posted or 85th Percentile Speed (mph) 70 65 60 School Speed Limit (mph) 35 35 35 Suggested Buffer Speed Limit (mph) 55 50 50 Distance (d1) Between School (S1-1) sign to School Buffer Speed Limit (S5-1) sign (ft) 800 700 600Distance (d2) Between School Buffer Speed Limit (S5-1) sign to School Speed Limit (S5-1) sign (ft) 500 Distance (d3) Between School Speed Limit (S5-1) sign to school driveway (ft) 400 Distance (d4) Between school driveway to School Buffer Speed Limit (S5-1) sign (ft) Same as d3 Distance (d5) Between School Buffer Speed Limit (S5-1) sign to Speed Limit (R2-1) sign (ft) Same as d2
A-11
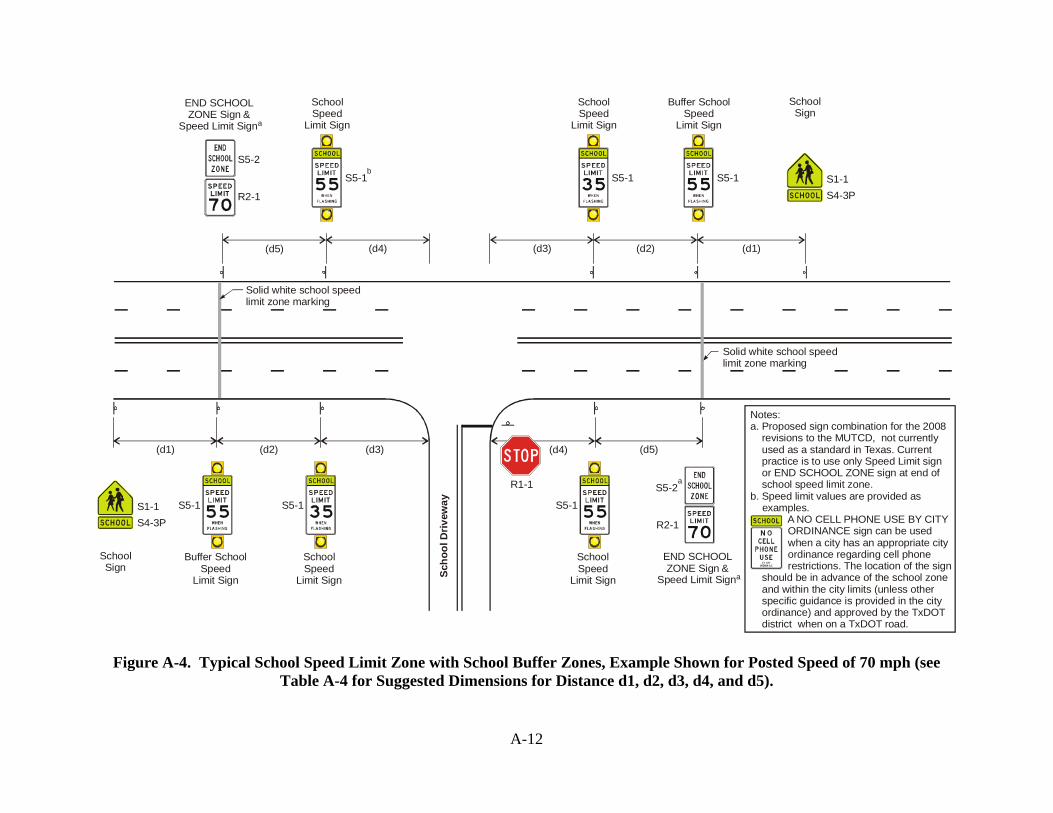
(d1) (d3)(d2)
(d3) (d1)(d2)(d5) (d4)
(d5)(d4)
R2-1
S5-2
R2-1
S5-2a
S5-1
S5-1
SchoolSpeed
Limit Sign
Buffer SchoolSpeed
Limit Sign
S5-1
SchoolSpeed
Limit Sign
S5-1b
SchoolSpeed
Limit Sign
S5-1
Buffer SchoolSpeed
Limit Sign
S5-1
SchoolSpeed
Limit Sign
S1-1S4-3P
SchoolSign
S1-1S4-3P
SchoolSign
R1-1
Scho
ol D
rivew
ay
Solid white school speedlimit zone marking
Solid white school speedlimit zone marking
Notes:a. Proposed for the 2008 revisions to the MUTCD, not currently used as a standard in Texas. Current practice is to use only Speed Limit sign or END SCHOOL ZONE sign at end of school speed limit zone. b. A NO CELL PHONE USE BY CITY ORDINANCE sign can be used when a city has an appropriate city ordinance regarding cell phone restrictions. The location of the sign should be in advance of the school zone and within the city limits (unless other specific guidance is provided in the city ordinance) and approved by the TxDOT district when on a TxDOT road.
sign combination
Speed limit values are provided as examples.
END SCHOOLZONE Sign &
Speed Limit Sign
a
END SCHOOLZONE Sign &
Speed Limit Sign
a
Figure A-4. Typical School Speed Limit Zone with School Buffer Zones, Example Shown for Posted Speed of 70 mph (see Table A-4 for Suggested Dimensions for Distance d1, d2, d3, d4, and d5).
A-12

Active Times Generally, the zones indicated on the signs should be in effect only during the following specified intervals:
• from approximately 30 minutes before and 5 minutes after classes begin, • from the beginning to the end of the lunch period for open campuses, and • from approximately 5 minutes before and 30 minutes after classes end.
The intervals of operation of the flashing beacons on the school speed limit assemblies may be extended or revised for school events as mutually agreed upon by the school district and the entity responsible for the operation of the flashing beacons. In this case, the flashing beacons should only be operated when there is an increase in vehicular activity and/or pedestrian traffic in and around the roadway associated with the school event. Research has shown that operating speeds in an active school speed zone are at their lowest close to the start time or end time of the school day. Approximately 20 minutes before or after the start of school, speeds are 1 mph higher and increase as time increases away from the start or end bells. School Speed Limit Zone Marking Where greater emphasis is needed to indicate the beginning and ending points of an established school speed limit zone, a 12- to 18-inch solid white transverse line may be used. The transverse line shall be located immediately adjacent to the School Speed Limit assembly or School Speed Limit sign. SCHOOL PAVEMENT MARKINGS The SCHOOL pavement marking is used to supplement signs and provide additional emphasis. The SCHOOL word marking width may either be the width of one lane or can extend to the width of two approach lanes. When extended to two approach lanes, the markings are 10 ft (3 m) or more in height. SCHOOL MARKED CROSSWALK Crosswalk markings provide guidance for pedestrians who are crossing roadways by defining and delineating paths on approaches to and within signalized intersections, and on approaches to other intersections where traffic stops. In conjunction with signs and other measures, crosswalk markings help to alert road users of a designated pedestrian crossing point across roadways at locations that are
A-13

not controlled by traffic control signals or STOP signs. At nonintersection locations, crosswalk markings legally establish the crosswalk. Because nonintersection marked crossings are generally unexpected by the road user, additional treatments should be installed for all marked school crosswalks at nonintersection locations. These treatments can include warning signs and high-visibility markings as a minimum. Other treatments can include school crossing guards or pedestrian-activated treatments. Adequate visibility of students by approaching motorists and of approaching motorists by students should be present. Parking prohibitions may be needed to provide the desired sight distance. Warrants have not been established for pedestrian crosswalks in the TMUTCD or the MUTCD; however, guidance material is available, including in the following reports:
• TCRP Report 112/NCHRP Report 562, Improving Pedestrian Safety at Unsignalized Crossings, 2006. Available at: http://onlinepubs.trb.org/onlinepubs/nchrp/nchrp_rpt_562.pdf
• FHWA-RD-04-100, Safety Effects of Marked Versus Unmarked Crosswalks at Uncontrolled Locations Final Report and Recommended Guidelines. Full report available at: http://www.tfhrc.gov/safety/pubs/04100/04100.pdf. Summary report available at: http://drusilla.hsrc.unc.edu/cms/downloads/Effects_Un_MarkedCrosswalks_Summary.pdf
The 2008 proposed update to the MUTCD includes the following guidance based on information presented in the above FHWA report:
“Crosswalk lines should not be used indiscriminately. An engineering study should be performed before a marked crosswalk is installed at a location away from a traffic control signal or an approach controlled by a STOP sign. The engineering study should consider:
• The number of lanes, • The presence of a median, • The distance from adjacent signalized intersections, • The pedestrian volumes and delays, • The average daily traffic (ADT), • The posted speed limit, • The geometry of the location, • The possible consolidation of multiple crossing points, • The availability of street lighting, and • Other appropriate factors.
A-14

Marked crosswalks alone, without other substantial measures designed to reduce traffic speeds, shorten crossing distances, enhance driver awareness of the crossing, and/or provide active warning of pedestrian presence, should not be installed across uncontrolled roadways where:
A. The speed limit exceeds 60 km/h (40 mph); B. The roadway has four or more lanes of travel without a raised median or pedestrian refuge island and an
ADT of 12,000 vehicles per day or greater; or C. The roadway has four or more lanes of travel with a raised median or pedestrian refuge island and an ADT of
15,000 vehicles per day or greater.” Research has shown that the installation of a pedestrian crossing treatment alone does not necessarily result in more vehicles stopping for pedestrians unless that device shows a red indication to the motorist. Therefore, treating a location to improve pedestrian access or safety should include several components. For example, in addition to traffic control devices such as signs or markings, geometric improvements (e.g., refuge island, roadway narrowing, and curb extensions) may be used to shorten the crossing distance (and hence the exposure time for the pedestrian). Traffic calming may be used to slow vehicle speeds near the pedestrian crossing. Following are general suggestions regarding the use of crosswalk markings and signs; in all cases, engineering judgment should be used in selecting a specific device for installation. Except as noted below, a school crosswalk should not be installed within 300 ft of another school crosswalk, or a marked pedestrian crosswalk, on the same roadway. The 300 ft spacing requirement shall not apply to another crosswalk at the same intersection, or to crosswalks on legs of intersecting roadways. A school crosswalk should not be installed at any location that has inadequate stopping sight distance, as indicated in the most recent edition of the Texas Roadway Design Manual. The School Crossing assembly shall not be installed on approaches controlled by a STOP sign. The School Crossing assembly shall not be used at crossings other than those adjacent to schools and those on an established School Route Plan. The signing for a school marked crosswalk not located on a stop-controlled approach includes:
• the School (S1-1) sign (if included), • the School Advance Crossing assembly (if included) (S1-1 with W16-9P or W16-2P or W16-2ap), and • the School Crossing assembly (S1-1, W16-7P).
A-15

Signing and pavement markings for a school crosswalk zone are shown in Figure A-5 for two-way stop control, Figure A-6 for all-way stop control, and Figure A-7 for signal control. Table A-5 lists suggested dimensions for use in those figures. Additional information on signing and marking crosswalks is contained in the TMUTCD.
Table A-5. Suggested Dimensions for Distances in Figure A-5, Figure A-6, and Figure A-7. Posted or 85th percentile speed (mph) 25 30 35 40 45 50 55 60 65 70 Distance (d) between School Advance Crossing assembly to marked crosswalk (and School Crossing assembly, when appropriate) (ft)
250 325 400 475 5501 NA1 NA1 NA1 NA1 NA1
Minimum length of solid white lane line in advance of marked crosswalk (ft) 150 150 200 250 2501 NA1 NA1 NA1 NA1 NA1
1On higher-speed roadways a system of treatments is needed for pedestrians—a marked crosswalk should not be used without additional pedestrian treatments. The installation of a marked crosswalk and pedestrian signs do not necessarily result in more vehicles stopping for pedestrians. Therefore, treating a location to improve pedestrian access or safety should include several components. For example, in addition to traffic control devices, geometric improvements may be used to shorten the crossing distance. Traffic calming may be used to slow vehicle speeds near the pedestrian crossing. Additional traffic control devices may be needed.
A-16
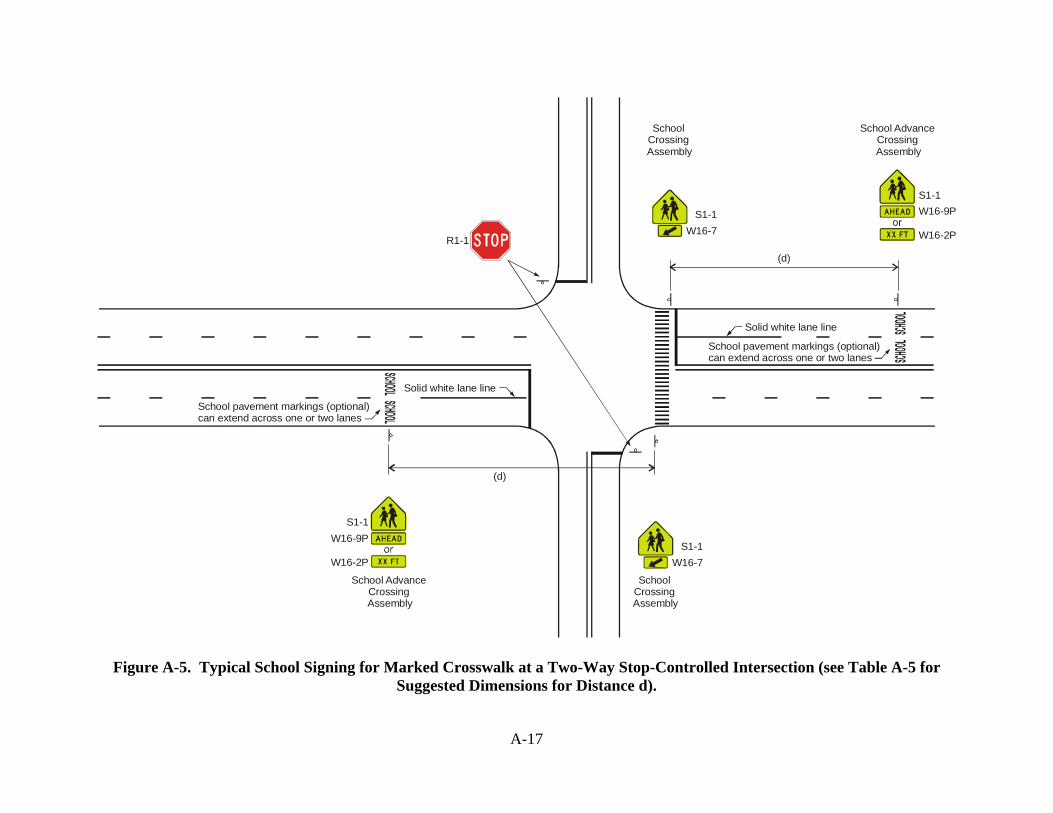
(d)
(d)
Solid white lane line
Solid white lane line
School pavement markings (optional)can extend across one or two lanes
School pavement markings (optional)can extend across one or two lanes
S1-1W16-9P
W16-2P
S1-1W16-9P
W16-2P
School AdvanceCrossing
Assembly
School AdvanceCrossing
Assembly
R1-1
SchoolCrossing
Assembly
S1-1W16-7
SchoolCrossing
Assembly
S1-1W16-7
Figure A-5. Typical School Signing for Marked Crosswalk at a Two-Way Stop-Controlled Intersection (see Table A-5 for Suggested Dimensions for Distance d).
A-17
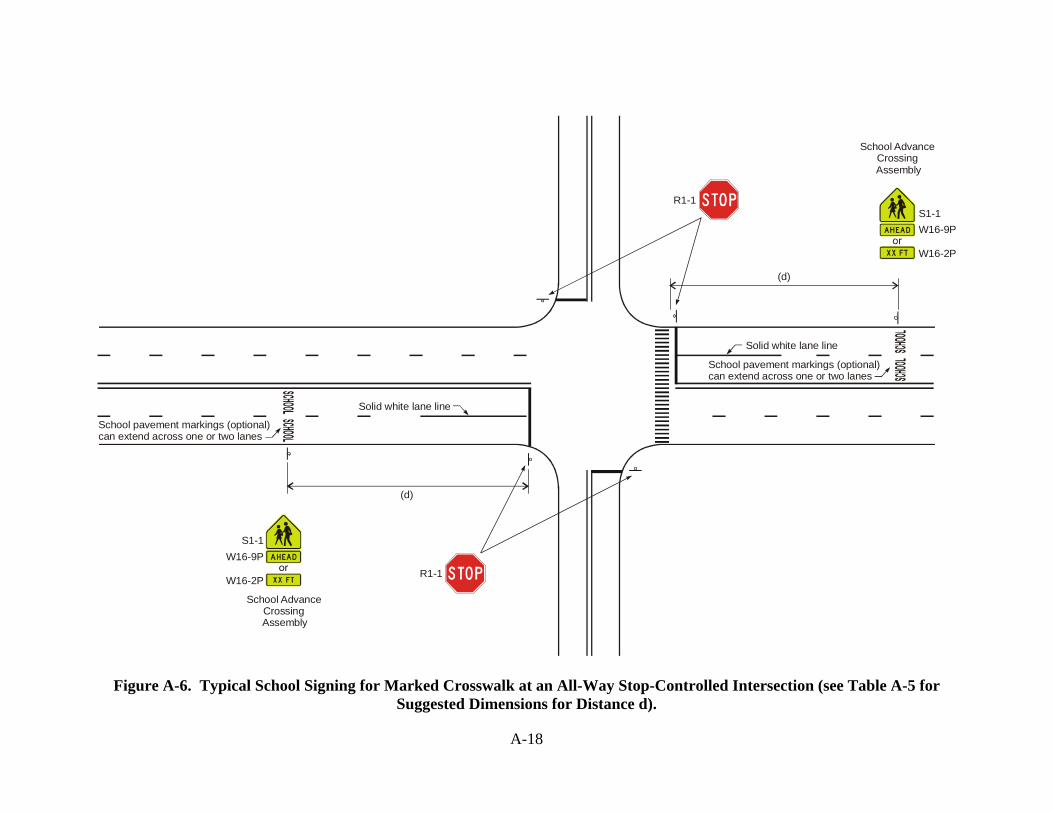
(d)
(d)
Solid white lane line
Solid white lane line
School pavement markings (optional)can extend across one or two lanes
School pavement markings (optional)can extend across one or two lanes
S1-1W16-9P
W16-2P
S1-1W16-9P
W16-2P
School AdvanceCrossing
Assembly
School AdvanceCrossing
Assembly
R1-1
R1-1
Figure A-6. Typical School Signing for Marked Crosswalk at an All-Way Stop-Controlled Intersection (see Table A-5 for Suggested Dimensions for Distance d).
A-18

(d)
(d)
Solid white lane line
Solid white lane line
School pavement markings (optional)can extend across one or two lanes
School pavement markings (optional)can extend across one or two lanes
S1-1W16-9P
W16-2P
S1-1W16-9P
W16-2P
School AdvanceCrossing
Assembly
School AdvanceCrossing
Assembly
SchoolCrossing
Assembly
S1-1W16-7
SchoolCrossing
Assembly
S1-1W16-7
SchoolCrossingAssembly
S1-1W16-7
(d)
SchoolCrossing
Assembly
S1-1W16-7
S1-1W16-9P
W16-2P
School AdvanceCrossing
Assembly
Scho
ol D
rivew
ay
Figure A-7. Typical School Signing for Marked Crosswalk at a Signalized Intersection (see Table A-5 for Suggested Dimensions for Distance d).
A-19
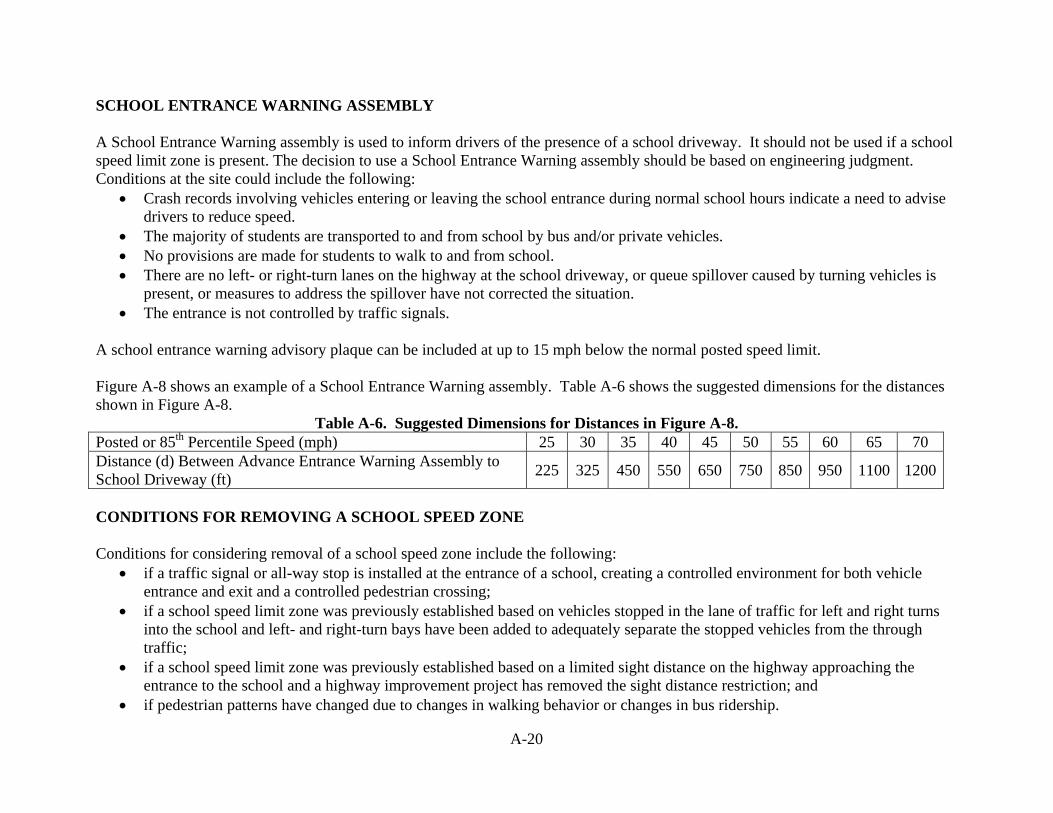
SCHOOL ENTRANCE WARNING ASSEMBLY A School Entrance Warning assembly is used to inform drivers of the presence of a school driveway. It should not be used if a school speed limit zone is present. The decision to use a School Entrance Warning assembly should be based on engineering judgment. Conditions at the site could include the following:
• Crash records involving vehicles entering or leaving the school entrance during normal school hours indicate a need to advise drivers to reduce speed.
• The majority of students are transported to and from school by bus and/or private vehicles. • No provisions are made for students to walk to and from school. • There are no left- or right-turn lanes on the highway at the school driveway, or queue spillover caused by turning vehicles is
present, or measures to address the spillover have not corrected the situation. • The entrance is not controlled by traffic signals.
A school entrance warning advisory plaque can be included at up to 15 mph below the normal posted speed limit. Figure A-8 shows an example of a School Entrance Warning assembly. Table A-6 shows the suggested dimensions for the distances shown in Figure A-8.
Table A-6. Suggested Dimensions for Distances in Figure A-8. Posted or 85th Percentile Speed (mph) 25 30 35 40 45 50 55 60 65 70 Distance (d) Between Advance Entrance Warning Assembly to School Driveway (ft) 225 325 450 550 650 750 850 950 1100 1200
CONDITIONS FOR REMOVING A SCHOOL SPEED ZONE Conditions for considering removal of a school speed zone include the following:
• if a traffic signal or all-way stop is installed at the entrance of a school, creating a controlled environment for both vehicle entrance and exit and a controlled pedestrian crossing;
• if a school speed limit zone was previously established based on vehicles stopped in the lane of traffic for left and right turns into the school and left- and right-turn bays have been added to adequately separate the stopped vehicles from the through traffic;
• if a school speed limit zone was previously established based on a limited sight distance on the highway approaching the entrance to the school and a highway improvement project has removed the sight distance restriction; and
• if pedestrian patterns have changed due to changes in walking behavior or changes in bus ridership.
A-20

A-21
W2-2L
S4-3P(Optional)
W13-1 (Optional)
W2-2R
S4-3P(Optional)
W13-1 (Optional)
(d)
(d)
Scho
ol D
rivew
ay
R1-1
SchoolEntranceWarning
Assembly
SchoolEntranceWarning
Assembly
Figure A-8. School Entrance Warning Assembly Example (see Table A-6 for Suggested Dimensions for Distance d).


APPENDIX B
SUGGESTED CHANGES TO TXDOT DOCUMENTS
of
TxDOT REPORT 0-5470-1: SPEEDS IN SCHOOL ZONES
Project 0-5470 Project Title: Comprehensive Guide to Traffic Control Near Schools
Performed in cooperation with the Texas Department of Transportation
and the Federal Highway Administration
September 2008 Published: February 2009
TEXAS TRANSPORTATION INSTITUTE The Texas A&M University System College Station, Texas 77843-3135

B-iii
TABLE OF CONTENTS
Page APPENDIX B SUGGESTED CHANGES TO TXDOT DOCUMENTS
LIST OF TABLES ............................................................................................................... B-iv INTRODUCTION .................................................................................................................B-1 TXDOT PROCEDURES FOR ESTABLISHING SPEED ZONES .....................................B-2 Schools .............................................................................................................................B-4 Zone Length .....................................................................................................................B-4 TEXAS MANUAL ON UNIFORM TRAFFIC CONTROL DEVICES ...............................B-6
B-iv
LIST OF TABLES Page
Table B-1. Reproduction of Material in Chapter 2 (Regulatory and Advisory Speeds),
Section 4 (School Speed Zones) of the TxDOT Procedures for Establishing Speed Zones, Part 1 of 2. ......................................................................................... B-2
Table B-2. Reproduction of Material in Chapter 2 (Regulatory and Advisory Speeds), Section 4 (School Speed Zones) of the TxDOT Procedures for Establishing Speed Zones, Part 2 of 2. ......................................................................................... B-3
Table B-3. Reproduction of Material in Chapter 3 (Speed Zone Studies), Section 3 Developing Strip Maps) of the TxDOT Procedures for Establishing Speed Zones. ............................................................................................................ B-5

B-1
INTRODUCTION Several existing TxDOT documents and materials developed as a result of TxDOT research projects discuss school-related issues, including:
• Texas Manual on Uniform Traffic Control Devices, Part 7 http://www.txdot.gov/txdot_library/publications/government/project_development/traffic_operations.htm
• TxDOT Procedures for Establishing Speed Zones http://onlinemanuals.txdot.gov/txdotmanuals/szn/index.htm
• TxDOT Signs and Markings Manual http://onlinemanuals.txdot.gov/txdotmanuals/smk/index.htm
• Research Report, Traffic Operations and Safety at Schools: Recommended Guidelines http://tti.tamu.edu/documents/4286-2.pdf
The Guidelines developed as part of this research project (see Appendix A) could fit within one or more of these documents, with the exception of the TMUTCD. Material within the Guidelines could result in a few changes to the TMUTCD; however, the Guidelines should not result in a major change to the TMUTCD. Rather, the Guidelines were developed to augment the TMUTCD by providing additional background and information to assist in the traffic control device applications. The Guidelines could become a stand-alone document; however, the document must be readily available if it is to be effectively integrated into practice. The material will be included as an appendix to a research report (as it is currently), which results in it being available to those who actively seek the material. Other methods to increase usage are to distribute the Guidelines and to ensure their availability to TxDOT engineers who are responsible for investigating school-related issues or present findings at appropriate meetings. The research team also recommends that TxDOT consider creating an online Guidance Material page that would be similar to their online Manual page. An online Guidance Material page would provide an opportunity for engineers seeking additional information or examples to have a single location to search. The research team suggests that the Guidelines presented in Appendix A, along with the Traffic Operations and Safety at Schools: Recommended Guidelines, be included on the online Guidance Material page. Another method to effectively integrate the findings is to include material in existing reference documents. The majority of the Guidelines could replace the material currently included in the Procedures for Establishing Speed Zones Chapter 2 (Regulatory and Advisory Speeds), Section 4 (School Speed Zones). The detailed examples of sign and marking locations are not common in the Procedures manual, but rather they may be more appropriate for other TxDOT publications, such as the TxDOT Signs and Markings Manual, or the Sign Crew Field Book. Because of the value to keep the information on speed zones together with the detail examples, preference is to not split the material between documents, but rather to include cross references between online documents. Anticipating that some changes to existing reference documents may be needed, following are suggestions on potential changes.

B-2
TXDOT PROCEDURES FOR ESTABLISHING SPEED ZONES Tables B-1 and B-2 reproduce the material currently in the Procedures for Establishing Speed Zones, Chapter 2, Section 4. The material in the following sections of Appendix A could completely replace the material reproduced in Tables B-1 and B-2:
• Introduction • School Location • Definitions • School Speed Limit Zone • School Speed Limit Zone Characteristics • Conditions for Removing a School Speed Zone
Table B-1. Reproduction of Material in Chapter 2 (Regulatory and Advisory Speeds), Section 4 (School Speed Zones) of the TxDOT Procedures for Establishing Speed Zones,
Part 1 of 2. Introduction Reduced speed limits should be used for school zones during the hours when children are going to and from school. Usually such school speed zones are only considered for schools located adjacent to highways or visible from highways. Pedestrian crossing activity should be the primary basis for reduced school speed zones. However, irregular traffic and pedestrian movements must also be considered when children are being dropped off and picked up from school. Planning TxDOT should make certain that all applicable traffic control devices are utilized to prevent problems in school areas. Maintaining contact with school officials can help TxDOT become aware of proposed building programs or other problems at an early stage so that solutions will be more promptly implemented. When proposed building plans are known, it may be possible to offer suggestions on access points that will prevent future problems. Also the installation of needed safety and traffic control devices can be scheduled to be in place when needed. An engineering and traffic investigation should be conducted to determine the need for a reduced school speed limit as well as all appropriate traffic control devices to provide maximum safety. Prompt Installation Important Districts should initiate the installation of school speed limit signs and flashers immediately after submitting the request to the Traffic Operations Division (TRF) for Commission action. Every effort should be made to have these signs in operation as soon as practical after the minute order is approved by the Transportation Commission. If, for some reason, there is a delay in the installation of a school flasher, other static signs for school zones should be installed as soon as possible after the minute order is enacted.

B-3
Table B-2. Reproduction of Material in Chapter 2 (Regulatory and Advisory Speeds), Section 4 (School Speed Zones) of the TxDOT Procedures for Establishing Speed Zones,
Part 2 of 2. Signs Where TxDOT is responsible for signing school speed zones, the zones shall be signed with a combination of the S4-3 SCHOOL and the R2-1 SPEED LIMIT sign assembly. Flashing beacons shall also be used with the S4-4 WHEN FLAHSING sign to identify the periods the school speed limit is in force. One sign, S5-1, could be used, which is a combination of these. The S5-1 SCHOOL SPEED LIMIT XX WHEN FLASHING may be used in place of the S4-3, R2-1, and S4-4. A Transportation Commission minute order, city ordinance, or county ordinance authorizing the reduced speed limit is required prior to use of these signs in school zones. Cities should be allowed to sign school speed zones in accordance with the other options set out in the TMUTCD. The S4-3, R2-1, and S4-4 sign assembly with flashers shall be mounted on a permanent type mounting and placed at each zone limit of the section of highway, road, or street through which the speed limit has been reduced. The sign assembly with flashing beacons may be placed off the shoulder of the road, in the median, or overhead to face traffic entering the school speed zone. An illustration of signing or school speed zones is shown in the TMUTCD. Other types of signs used by cities should be similarly located in conformance with the TMUTCD. Intervals of Operation Generally, the zones indicated on the signs should be in effect only during the following specified intervals:
• From approximately 45 minutes before school opens until classes begin • From the beginning to the end of the lunch period • For a 30 minute period beginning at the close of school.
The intervals of operation of the flashing beacons on the school zone speed limit assembly may be extended or revised for school events as mutually agreed upon by the school district and the entity responsible for the operation of the flashing beacons. In this case, the flashing beacons should only be operated when there is an increase in vehicular activity and pedestrian traffic in and around the roadway associated with the school event. More Information See the TMUTCD, Part VII, for more details on school areas. For more detail on the school speed zone, see Chapter 3, Section 3, “Developing Strip Maps,” under the heading: “Schools.”

B-4
Most of the material in Chapter 3, Section 3 (see Table B-3) in the Schools subsection would then be removed because it would be included in Chapter 2, Section 4. Following is the suggested material to retain for the subsection, along with an additional sentence (shown as underlined):
Schools If a reduced school speed limit is warranted, a speed zone strip map should be prepared as shown in Figure 3-7 and Figure 3-8. A regular speed zone must not change within the limits of a school speed zone, since posting a regular SPEED ZONE sign at the point of change would prematurely terminate the school speed zone. This is due to the fact that speed limits remain fixed until a revised limit is encountered. Additional information on school zones is included in Chapter 2, Section 4.
Material in Chapter 3, Section 4 should be modified as follows (additional material shown as underlined and deleted material shown with double strikeout):
Zone Length The length of any section of zone set for a particular speed should be as long as possible and still be consistent with the 85th percentile speeds. These zone lengths should be shown on the strip map in miles to three decimal places. When graduated zones on the approach to the city or town are at locations where speeds fluctuate, the speed zone should generally be 0.200 mile or more. School zones are the exception to this rule and may be as short as reasonable in urban areas, depending on approach speeds. School zones in urban areas where speeds are 30 miles per hour or less may have school zones as short as 200 to 300 feet. Additional information on school zone length is included in Chapter 2, Section 4.
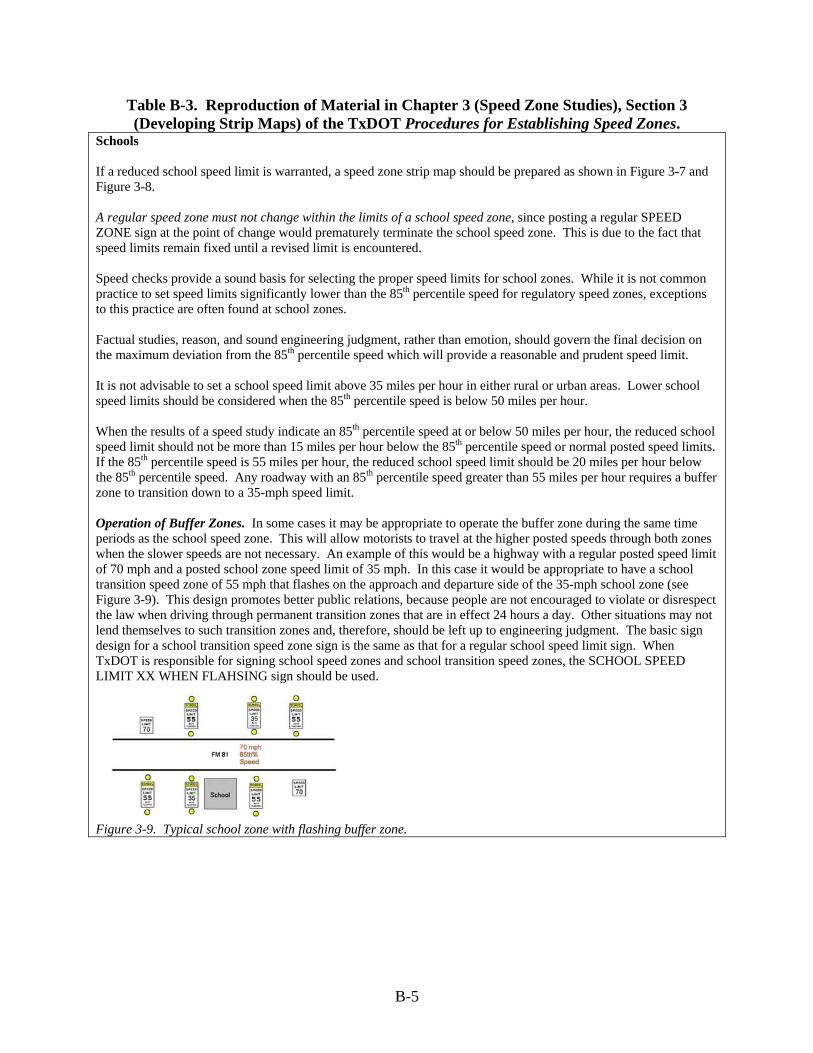
B-5
Table B-3. Reproduction of Material in Chapter 3 (Speed Zone Studies), Section 3 (Developing Strip Maps) of the TxDOT Procedures for Establishing Speed Zones.
Schools If a reduced school speed limit is warranted, a speed zone strip map should be prepared as shown in Figure 3-7 and Figure 3-8. A regular speed zone must not change within the limits of a school speed zone, since posting a regular SPEED ZONE sign at the point of change would prematurely terminate the school speed zone. This is due to the fact that speed limits remain fixed until a revised limit is encountered. Speed checks provide a sound basis for selecting the proper speed limits for school zones. While it is not common practice to set speed limits significantly lower than the 85th percentile speed for regulatory speed zones, exceptions to this practice are often found at school zones. Factual studies, reason, and sound engineering judgment, rather than emotion, should govern the final decision on the maximum deviation from the 85th percentile speed which will provide a reasonable and prudent speed limit. It is not advisable to set a school speed limit above 35 miles per hour in either rural or urban areas. Lower school speed limits should be considered when the 85th percentile speed is below 50 miles per hour. When the results of a speed study indicate an 85th percentile speed at or below 50 miles per hour, the reduced school speed limit should not be more than 15 miles per hour below the 85th percentile speed or normal posted speed limits. If the 85th percentile speed is 55 miles per hour, the reduced school speed limit should be 20 miles per hour below the 85th percentile speed. Any roadway with an 85th percentile speed greater than 55 miles per hour requires a buffer zone to transition down to a 35-mph speed limit. Operation of Buffer Zones. In some cases it may be appropriate to operate the buffer zone during the same time periods as the school speed zone. This will allow motorists to travel at the higher posted speeds through both zones when the slower speeds are not necessary. An example of this would be a highway with a regular posted speed limit of 70 mph and a posted school zone speed limit of 35 mph. In this case it would be appropriate to have a school transition speed zone of 55 mph that flashes on the approach and departure side of the 35-mph school zone (see Figure 3-9). This design promotes better public relations, because people are not encouraged to violate or disrespect the law when driving through permanent transition zones that are in effect 24 hours a day. Other situations may not lend themselves to such transition zones and, therefore, should be left up to engineering judgment. The basic sign design for a school transition speed zone sign is the same as that for a regular school speed limit sign. When TxDOT is responsible for signing school speed zones and school transition speed zones, the SCHOOL SPEED LIMIT XX WHEN FLAHSING sign should be used.
Figure 3-9. Typical school zone with flashing buffer zone.

B-6
TEXAS MANUAL ON UNIFORM TRAFFIC CONTROL DEVICES Suggested revisions to the TMUTCD are shown in the following sections using underline (added material) and double strikeout (material to be removed).
Section 7B.08 School Advance Warning Assembly (S1-1 with Supplemental Plaque) Guidance:
The School Advance Warning assembly (see Figure 7B-1) should be installed in advance of locations where school buildings or grounds are adjacent to the roadway, except where a physical barrier such as fencing separates school children from the roadway. Standard:
The School Advance Warning assembly shall be used in advance of any installation of the School Crosswalk Warning assembly (see Figure 7B-2), or in advance of the first installation of the School Speed Limit assembly (see Figure 7B-3).
If used, the School Advance Warning assembly shall be installed not less than 150 ft nor more than 700 ft in advance of the school grounds or school crossings.
If used, the School Advance Warning assembly shall consist of a School Advance Warning (S1-1) sign supplemented with a plaque with the legend AHEAD (W16-9p) or XX FEET (W16-2 or W16-2a) to provide advance notice to road users of crossing activity. Option:
A 12-inch reduced size in-street School Advance Warning (S1-1) sign (see Figure 7B-4), installed in compliance with the mounting height and breakaway requirements for In-Street Pedestrian Crossing (R1-6 or R1-6a) signs (see Section 2B.12), may be used in advance of a school crossing to supplement the ground-mounted school warning signs. A 12- x 6-inch reduced size AHEAD (W16-9p) plaque may be mounted below the reduced size in-street School Advance Warning (S1-1) sign.
Section 7B.09 School Crosswalk Warning Assembly (S1-1 with Diagonal Arrow) Standard:
If used, the School Crosswalk Warning assembly (see Figure 7B-1) shall be installed at the marked crosswalk, or as close to it as possible, and shall consist of a School Advance Warning (S1-1) sign supplemented with a diagonal downward pointing arrow (W16-7p) plaque to show the location of the crossing.
The School Crosswalk Warning assembly shall not be used at marked crosswalks other than those adjacent to schools and those on established school pedestrian routes.
The School Crosswalk Warning assembly shall not be installed on approaches controlled by a STOP sign. Guidance:
The School Crosswalk Warning assembly should be installed at marked crosswalk(s), including those at signalized locations, used by students going to and

B-7
from school (see Figure 7B-2) as determined by an engineering study. Additional examples are included in the Guidelines for Traffic Control for School Areas.
Figure 7B-2. Examples of
Signing for School Crosswalk Warning Assembly
Figure 7B-3. Examples of Signing for School Area Traffic
Control with School Speed Limits
NOTE: For both figures, remove the dimensions.
Option:
The in-street Pedestrian Crossing (R1-6 or R1-6a) sign (see Section 2B.12) may be used at unsignalized school crossings. When used at a school crossing, a 12- x 4-inch SCHOOL (S4-3) plaque (see Figure 7B-4) may be mounted above the sign.
A 12-inch reduced size School Advance Warning (S1-1) sign (see Figure 7B-4) may be used at an unsignalized school crossing instead of the in-street Pedestrian Crossing (R1-6 or R1-6a) sign. A 12- x 6-inch reduced size Diagonal Arrow (W16-7p) plaque may be mounted below the reduced size in-street School Advance Warning (S1-1) sign. Standard:
If an in-street Pedestrian Crossing sign or a reduced size in-street School Advance Warning (S1-1) sign is placed in the roadway, the sign support shall comply with the mounting height and breakaway requirements for in-street Pedestrian Crossing (R1-6 or R1-6a) signs (see Section 2B.12).

B-8
The in-street Pedestrian Crossing sign and the reduced size in-Street School Advance Warning (S1-1) sign shall not be used at signalized locations. Section 7B.11 School Speed Limit Assembly (S4-1, S4-2, S4-3, S4-4, S4-6, S5-1) Standard:
A School Speed Limit assembly (see Figure 7B-1) or a School Speed Limit (S5-1) sign (see Figure 7B-1) shall be used to indicate the speed limit where a reduced speed zone for a school area has been established (in accordance with law based upon an engineering study) or where a speed limit is specified for such areas by statute. The School Speed Limit assembly or School Speed Limit sign shall be placed at or as near as practical to the point where the reduced speed zone begins. Guidance:
The reduced speed zone should begin either at a point 200 ft from the crosswalk, or from the first driveway on school property, whichever is encountered first as traffic approaches the school based on the school speed limit as follows:
School Speed Limit (mph)
Distance to Crosswalk or
First Driveway (ft)
20 25 30 35
200 200 300 400
Standard: The School Speed Limit assembly shall be a fixed-message sign assembly. The fixed-message School Speed Limit assembly shall consist of a top plaque
(S4-3) with the legend SCHOOL, a Speed Limit (R2-1) sign, and a bottom plaque (S4-1, S4-2, S4-4, or S4-6) indicating the specific periods the special school speed limit is in effect (see Figure 7B-1).
The end of an authorized and posted school speed zone shall be marked with a standard Speed Limit sign showing the speed limit for the section of highway that follows. Option:
A Speed Limit Sign Beacon may be used, with a WHEN FLASHING legend, to identify the periods that the school speed limit is in effect. A speed limit beacon may be used with a S4-1 or S4-1a sign listing the periods that the school speed limit is in effect. The lenses of the Speed Limit Sign Beacon may be positioned within the face of the School Speed Limit (S5-1) sign (see Figure 7B-1).
A confirmation beacon or device to reinforce to the driver that the school speed limit is in operation may be considered for inclusion on the back of the School Speed Limit assembly. Standard: If a confirmation beacon or device is used on the back of the School Speed Limit Assembly, it shall be a speed limit sign beacon (see Section 4K.04).